sensitivity and accuracy in rebar diameter measurements from dual-polarized gpr data
TRANSCRIPT

Construction and Building Materials 48 (2013) 1293–1301
Contents lists available at SciVerse ScienceDirect
Construction and Building Materials
journal homepage: www.elsevier .com/locate /conbui ldmat
Sensitivity and accuracy in rebar diameter measurementsfrom dual-polarized GPR data
0950-0618/$ - see front matter � 2013 Elsevier Ltd. All rights reserved.http://dx.doi.org/10.1016/j.conbuildmat.2013.05.009
⇑ Corresponding author. Tel.: +39 02 23994271; fax: +39 02 23994220.E-mail addresses: [email protected] (L. Zanzi), [email protected]
(D. Arosio).
Luigi Zanzi ⇑, Diego ArosioDip. di Ingegneria Civile e Ambientale, Politecnico di Milano, Piazza Leonardo da Vinci 32, 20133 Milano, Italy
h i g h l i g h t s
� A procedure for measuring concrete rebar size with georadar is discussed and tested.� Identified and addressed the main issue that makes the procedure critical.� Sensitivity is discussed and optimal frequency selection is proposed versus rebar size.� Experimental data used to explore the potential accuracy of the methodology.� To preserve accuracy the problem must be addressed statistically.
a r t i c l e i n f o
Article history:Available online 10 June 2013
Keywords:Concrete reinforcementsRebar diameterNon-destructive testingGPR
a b s t r a c t
According to some authors, high-frequency GPR (Ground Penetrating Radar) can provide on-site non-destructive measurements of the diameter of concrete reinforcements. The procedure should be basedon the analysis of radar energy scattered by reinforcements when illuminated with parallel and perpen-dicular polarization. The theory of Radar Cross Section (RCS) supports this assumption. However, labora-tory test performed on concrete specimens indicate that many practical problems must be solved toobtain reliable and stable measurements from real data. Synthetic data were used to analyze the prob-lem. A data processing sequence was optimized to obtain the best fit between synthetic results and the-oretical expectations. Results on real data processed with the same sequence were less encouraging. Thecomparison with synthetic data was essential to understand that background subtraction is the most crit-ical issue. This problem is of larger importance than the fact that commercial GPR systems generate wideband radar pulses while RCS theory is frequency dependent. Once identified, the problem was directlyaddressed and results improved significantly. Although delicate, the methodology is potentially showinga high sensitivity which is proportional to wavelength. An optimal selection of antenna frequency versusrebar diameter range is proposed to preserve the highest sensitivity. Accuracy is related with sensitivitybut also with stability and repeatability of the measurements. On-site experiments performed to explorethis issue suggest that the problem must be addressed statistically. This makes the procedure more com-plex but the use of dual-polarized antennas might be the solution to save efficiency and cost-effectiveness.
� 2013 Elsevier Ltd. All rights reserved.
1. Introduction
High frequency GPR (Ground Penetrating Radar) systems arewidely used on concrete structures [1–3] and less frequently alsoon modern masonry buildings [4–6] to locate metal reinforce-ments. Both rebar position and cover depth can be estimated withgood accuracy by direct interpretation of 2D or 3D GPR sections,either before or after migration. Steel bar corrosion effects inconcrete can also be detected with high frequency antennas and
advanced processing techniques [7,8]. Rebars buried in concreterepresent such an easy target for GPR that detection and locationcan be assigned to fully automatic algorithms [9,10]. Nevertheless,rebar diameter cannot be estimated through a geometrical analysisof radar images since the wavelength at the frequencies normallyused for concrete inspections (1–2 GHz) is in the order of a5–10 cm, i.e. quite larger than the diameter of the rebars. As a re-sult, migrated images tend to show rebars with overestimateddiameters. Chang et al. [11] proposed a sort of empirical procedureto estimate rebar diameter by digital imaging on premigrated GPRdata; preliminary results are shown in the paper but on a limitedrange of diameters and geometrical configurations.

1294 L. Zanzi, D. Arosio / Construction and Building Materials 48 (2013) 1293–1301
A different approach based on the relation between rebar diam-eter and Radar Cross Section was explored by Hunik [12] and wasproposed again by Shaw et al. [13] and Utsi and Utsi [14]. Lualdiand Zanzi [15] explored the accuracy of this approach by testingthe methodology on laboratory specimens. Results were encourag-ing but not exciting showing that something still remains to beunderstood in order to explain the difficulties in obtaining a robustmethodology. This work contributes to this investigation by using afinite-difference code to model GPR data scattered by concrete rein-forcements. The first objective is to check whether theoreticalexpectations are validated by the analysis of synthetic data. Abyproduct of this step will be the definition of an optimal process-ing sequence to extract from GPR data the rebar diameter informa-tion. The second objective is to apply the same processing sequenceto real data and to compare the results in order to determine themain issues that make the whole procedure quite delicate. Later,we want to discuss which sensitivity and accuracy might beexpected and finally we want to move from laboratory data to realon-site applications in order to draw some preliminary conclusionson the feasibility and reliability of the proposed technique. In thefollowing, theoretical expectations and previous results fromlaboratory tests are shortly summarized before presenting themodeling test and the comparison with real data.
2. Laboratory test
Two concrete specimens were prepared by placing metal rein-forcements of different diameter at constant depth (6 cm). Thedesign of the specimens is shown in Fig. 1. Rebar diameters varyfrom 6 to 40 mm and rebar spacing is 20 cm. Specimen width is40 cm. The minimum requirement for specimen height was12 cm to prevent interference between rebar scattering and back-side reflection. Actual height of the final specimens are 15 cm forthe first one and 18 cm for the second one. The experiments wereperformed with 1 GHz and 2 GHz antennas produced by differentGPR suppliers (Mala and IDS respectively).
The energy coming to the receiving GPR antenna as a result of areinforcement scattering event is proportional to the target RadarCross Section (which for cylindrical objects has to be intended as
Fig. 1. Concrete
Radar Cross Section per unit length or Scattering Width) but is alsoinfluenced by the length of the wave trajectory that defines the en-ergy loss associated with divergence and absorption phenomena.The method used to make the experiments independent from thethickness of the concrete cover consists of measuring the energyratio between the radar wavefields observed with two orthogonalpolarizations.
According to theory, this ratio is expected to vary with rebardiameter as shown in Fig. 2 [15] where the RCS (Radar Cross Sec-tion) ratio between Cross-Polarization (H-polarization) and Co-Polarization (E-polarization) is shown as a function of k�a, with kthe wavenumber and a the cylinder radius. The theory is basedon analytical approximate formulas of the Radar Cross Sectionper unit length [16] valid for cylindrical conductors of infinitelength under the assumption of far-field conditions. Three differentregions can be distinguished by analyzing the behavior of the RCSratio. A low frequency region where the ratio presents a monotonicincrease, a resonance region where the ratio is oscillating as aresult of the contribution of the creeping wave (i.e., the wave thatis scattered around the shadowed surface of the cylinder), a highfrequency region where the ratio becomes independent from thecylinder radius and tends to unity. Fig. 2 indicates that the RCSratio can be used to determine the rebar diameter provided thatthe measurements are carried out in the low frequency region.Considering that the radar velocity observed in the concrete labo-ratory specimens is 12.25 cm/ns, we can easily check that the1 GHz data fall into the low frequency region for almost all the re-bar diameters of the specimens while the 2 GHz data belongs tothis region only for the smaller diameters (i.e., lower than 20 mm).
First, GPR data were collected by running profiles along thespecimens with orthogonal polarizations. Later, to reduce the ef-fect of small but not negligible fluctuations of the power emittedby the radar equipment, data were collected again by placing theantennas over each metal bar and by recording the scattered signalfor a while so that the scattered energy was calculated over themeasurement interval as an average value. The ratio between theresults obtained from the H and the E polarizations where finallycompared with the expected behavior estimated analytically atthe nominal frequency of the radar antenna. Results are shownfor the 1 GHz and the 2 GHz frequencies in Figs. 3 and 4
specimens.

Fig. 2. RCS ratio between Cross-Polarization and Co-Polarization. k is the wavenumber and a is the cylinder radius.
Fig. 3. RCS ratio from 1 GHz data compared to theoretical prediction.
Fig. 4. RCS ratio from 2 GHz data compared to theoretical prediction.
L. Zanzi, D. Arosio / Construction and Building Materials 48 (2013) 1293–1301 1295
respectively. The analysis is limited to the diameter intervals(<40 mm and <20 mm respectively) belonging to the low fre-quency region where a one-to-one relation exists between diame-ter and RCS ratio.
3. Discussion of laboratory results
The results show that the trend of experimental data is basicallyconsistent with the analytical expectations but for some unknownreason the RCS ratio observed on real data does not span over theentire expected range from 0 to 1. While for small diametersthe ratio correctly tends to zero, for larger diameters approachingthe resonance region both 1 GHz and 2 GHz data show a ratio thatdoes not exceed 0.6 rather than moving close to 1. A scaling factorof about 0.5–0.6 seems to describe the difference between analyt-ical expectations and experimental observations.
At least three different problems might be related to thisinconsistency.
First of all, analytical expressions are derived under theassumption of far-field conditions while real measurements arebasically performed in near-field conditions because of the smallthickness of the concrete cover. As a result, we might expect thatthe actual wavefield is not fully polarized when it illuminates therebar and that the back-scattered energy is different from theone predicted by the far-field theory.
A second difficulty in comparing experimental observationswith theoretical predictions is associated with the impulsive nat-ure of the GPR signal. A short pulse is needed to obtain the resolu-tion required to separate events reflected or scattered by differenttargets. To meet this requirement, GPR systems usually radiatewavelets with bandwidths of two octaves or more. Since the RadarCross Section is strongly frequency dependent a main issue arisesabout how to compare a theoretical ratio calculated at a specific

1296 L. Zanzi, D. Arosio / Construction and Building Materials 48 (2013) 1293–1301
frequency with a real value resulting from an energy ratio mea-sured over a large frequency range.
Finally, a third problem that was observed in processing the realdata is related to the poor separation between the background sig-nal and the wavelet scattered by the rebars. Real wavelets are se-verely contaminated by the background signal, especially for the1 GHz test. A good estimate of the background signal is neededto clean the scattered wavelet but the rebar spacing is normallyso small that rebar diffractions overlap. This is also the case forthe laboratory specimens where a 20 cm spacing was not enoughto prevent diffraction overlapping. As a result, there are no loca-tions where the GPR antenna can measure a background signalnot affected by echoes from neighboring reinforcements.
To assess the impact of these problems the laboratory experi-ment was modeled with a finite-difference code.
Fig. 5. RCS ratio from synthetic data at 1 GHz compared to theoretical prediction.
Fig. 6. RCS ratio from synthetic data at 2 GHz compared to theoretical prediction.
4. Modeling test
The modeling test was performed by using GPRMAX3D, a finite-difference time-domain numerical code from Giannopoulos [17]for 3D GPR experiment simulations. The software was used toreproduce the laboratory experiments over the two concrete spec-imens. Preliminary simulations were performed to optimize theinput parameters required by the software. The discretization stepwas selected by running the simulations over the most demandingtarget, i.e., the smallest rebar (6 mm), with progressively smallersteps till the output was stable enough, i.e., till results with smallergrids were not introducing significant differences anymore. It wasfound that a step of 2 mm was enough for the 1 GHz simulationswhile a step of 0.5 mm was needed for the 2 GHz simulations. Con-crete permittivity was derived from radar velocity measured onreal data. The source wavelet was extracted from real data gener-ated by the 1 GHz and 2 GHz equipment. Specifically, real datawere oversampled and then carefully analyzed to isolate the signalscattered by the largest rebar (40 mm). A proper Hanning windowwas used to prevent truncation artifacts. The final signal was ob-tained by averaging a large number of measurements to increasethe statistical significance of the extracted wavelet and by chang-ing the sign of the wavelet to remove the polarity inversionproduced by the metal target. To validate the source wavelets,the simulations on laboratory specimens were compared withthe raw data from real experiments. A satisfactory similarity wasobserved both in time and frequency domain. Finally, concreteconductivity and the distance between the antenna elements andthe concrete surface were empirically optimized in order to repro-duce the same amplitude ratio between the background signal andthe rebar diffraction that was measured on real data.
Synthetic data were processed by applying time calibration,band-pass filtering, background subtraction and by extracting theenergy associated with rebar diffractions as the square of thepeak-to-peak amplitudes of the scattered wavelets. Results areillustrated in Figs. 5 and 6.
Although minor discrepancies exist, likely due to the back-ground signal that interferes with the scattered wavelets, the gen-eral trend predicted by RCS theory is well fitted and the RCS ratio isdistributed over the expected 0 to 1 range.
5. Comparison with real data
In order to understand why real data do not span over the cor-rect range of the RCS ratio while this problem is not observed onsynthetic data, real data were processed again by applying thesame processing sequence used for simulations with only oneexception related to background subtraction. This exception will
be discussed later. However, the updated results did not differ sig-nificantly from those reported in Figs. 3 and 4.
Synthetic results seem to exclude that the problem observed onreal data might be caused by the near-field condition or by thelarge bandwidth of the GPR signal. As a matter of fact, both realand synthetic data do not fulfill the far-field requirement and illu-minate the rebars with wavelets characterized by similar spectra.
This supports the hypothesis that the problem might be associ-ated with the interference between the scattered wavelet and thebackground signal. Synthetic data and real data were similarly dis-turbed by the background signal but the advantage with syntheticdata is that this interference was removed more efficiently by sub-tracting a synthetic background signal modeled on a concrete slabwithout any reinforcement. To investigate further, synthetic datawere re-processed by subtracting a background signal modeledas the radar trace recorded when the antenna is placed in betweentwo neighboring rebars. This simulates the method that wasapplied to real data to extract a reference signal to remove thebackground. As a matter of fact, a significant decrease of the high-est values of the RCS ratio was observed compared to Figs. 5 and 6.
Since this test supports the hypothesis that the problem comesfrom a rough background subtraction, more attention was given to
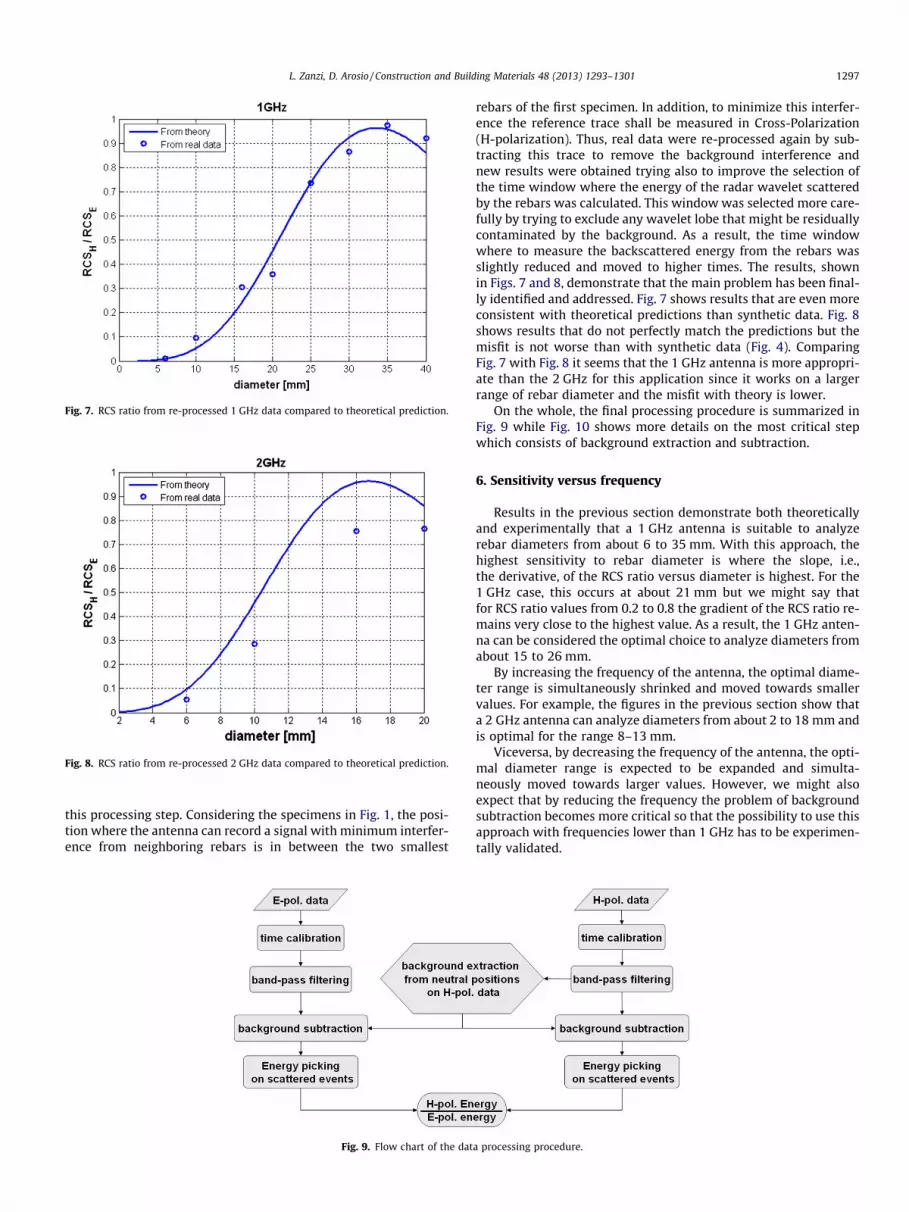
Fig. 7. RCS ratio from re-processed 1 GHz data compared to theoretical prediction.
Fig. 8. RCS ratio from re-processed 2 GHz data compared to theoretical prediction.
L. Zanzi, D. Arosio / Construction and Building Materials 48 (2013) 1293–1301 1297
this processing step. Considering the specimens in Fig. 1, the posi-tion where the antenna can record a signal with minimum interfer-ence from neighboring rebars is in between the two smallest
Fig. 9. Flow chart of the dat
rebars of the first specimen. In addition, to minimize this interfer-ence the reference trace shall be measured in Cross-Polarization(H-polarization). Thus, real data were re-processed again by sub-tracting this trace to remove the background interference andnew results were obtained trying also to improve the selection ofthe time window where the energy of the radar wavelet scatteredby the rebars was calculated. This window was selected more care-fully by trying to exclude any wavelet lobe that might be residuallycontaminated by the background. As a result, the time windowwhere to measure the backscattered energy from the rebars wasslightly reduced and moved to higher times. The results, shownin Figs. 7 and 8, demonstrate that the main problem has been final-ly identified and addressed. Fig. 7 shows results that are even moreconsistent with theoretical predictions than synthetic data. Fig. 8shows results that do not perfectly match the predictions but themisfit is not worse than with synthetic data (Fig. 4). ComparingFig. 7 with Fig. 8 it seems that the 1 GHz antenna is more appropri-ate than the 2 GHz for this application since it works on a largerrange of rebar diameter and the misfit with theory is lower.
On the whole, the final processing procedure is summarized inFig. 9 while Fig. 10 shows more details on the most critical stepwhich consists of background extraction and subtraction.
6. Sensitivity versus frequency
Results in the previous section demonstrate both theoreticallyand experimentally that a 1 GHz antenna is suitable to analyzerebar diameters from about 6 to 35 mm. With this approach, thehighest sensitivity to rebar diameter is where the slope, i.e.,the derivative, of the RCS ratio versus diameter is highest. For the1 GHz case, this occurs at about 21 mm but we might say thatfor RCS ratio values from 0.2 to 0.8 the gradient of the RCS ratio re-mains very close to the highest value. As a result, the 1 GHz anten-na can be considered the optimal choice to analyze diameters fromabout 15 to 26 mm.
By increasing the frequency of the antenna, the optimal diame-ter range is simultaneously shrinked and moved towards smallervalues. For example, the figures in the previous section show thata 2 GHz antenna can analyze diameters from about 2 to 18 mm andis optimal for the range 8–13 mm.
Viceversa, by decreasing the frequency of the antenna, the opti-mal diameter range is expected to be expanded and simulta-neously moved towards larger values. However, we might alsoexpect that by reducing the frequency the problem of backgroundsubtraction becomes more critical so that the possibility to use thisapproach with frequencies lower than 1 GHz has to be experimen-tally validated.
a processing procedure.

Fig. 10. Example of background subtraction on 1 GHz data. Background signal is estimated on H-pol. data in the most favorable position which is a neutral position far fromscattering targets. On the left the selected position for the laboratory data. On the right the comparison between E-pol. data from specimen 2 before and after subtraction.
1298 L. Zanzi, D. Arosio / Construction and Building Materials 48 (2013) 1293–1301
Fig. 11 illustrates the result that was obtained by testing a lowerfrequency antenna which generates a spectrum approximatelycentered at 750 MHz. Background subtraction is very critical be-cause at this frequency the direct wave strongly interferes withthe signal scattered by the reinforcements. Anyway, the result isnot bad showing that under favorable conditions, e.g., laboratoryspecimens, the methodology is still applicable at such a low fre-quency. As a result, we can extend the optimal range to diametersfrom about 20 to 35 mm.
Fig. 12 summarizes the discussion above by proposing a theo-retical optimal set of three different antennas from 600 MHz to
Fig. 11. RCS ratio from 750 MHz data compared to theoretical prediction.
2 GHz selected in order to cover the diameter range from 7 mmto 40 mm. The nominal frequencies have been selected to preservethe highest sensitivity of the measurements for the whole diame-ter range.
7. Sensitivity and accuracy
In principle accuracy is related to sensitivity, i.e., to what is theminimum diameter variation that can generate a detectable differ-ence in the RCS ratio. Dividing the extension of the RCS ratio inter-val where the sensitivity is higher (0.6 according to the discussion
Fig. 12. RCS ratio for three different antennas in the range from 600 MHz to 2 GHz.This combination of antennas ensures the highest sensitivity for the diameter rangefrom 7 mm to 40 mm.

Table 1Theoretical sensitivity. D is the discrete derivative of the RCS ratio in the highestsensitivity region. S is the sensitivity calculated assuming that we can measurevariations of the RCS ratio as small as 0.05.
750 MHz 1 GHz 2 GHz
D (mm�1) 0.04 0.055 0.12S (mm) 1.3 0.9 0.41/frequency (GHz�1) 1.3 1 0.5
L. Zanzi, D. Arosio / Construction and Building Materials 48 (2013) 1293–1301 1299
in the previous section) by the corresponding diameter range Dd(e.g., Dd = 15 mm for the 750 MHz frequency), we obtain a roughapproximation of the RCS ratio derivative D in the maximum sen-sitivity range:
D ¼ 0:6Dd
This number (first row in Table 1) indicates how large is the var-iation of RCS ratio per millimeter and is inversely proportional tothe theoretical maximum sensitivity at the selected frequency.For example, if we assume that we can experimentally measurevariations of the RCS ratio as small as 0.05, the expected sensitivityS of the different antennas will be
S ¼ 0:05D
as listed in the second row of Table 1. As one could expect, compar-ing these numbers with the third row of the table, it is easy toobserve that sensitivity is basically inversely proportional to the an-tenna frequency, i.e., directly proportional to the radar wavelength.
If this is sensitivity, what can be said about accuracy? Can wealso conclude that we have an accuracy of about one millimeterat 1 GHz and half a millimeter at 2 GHz? Actually, the discussionon accuracy cannot be separated by a discussion on stability andrepeatability of the measurements. In other words, we have to dis-cuss how the measurements are insensitive to other factors thatmight affect the stability of the RCS ratio values, e.g., rebar depth,rebar density, noise, etc. This is essential to understand whetherthe methodology that in principle can be successful as shown in
Fig. 13. Example of real data (E-polarization) submitted to the reb
Sections 5 and 6, can be applied to real on-site situations ensuringsufficient accuracy.
In order to explore the stability of RCS ratio measurements withrespect to these factors, the archive of GPR data collected by ourlaboratory on reinforced concrete structures was revisited to ex-tract data that might be submitted to the diameter analysis proce-dure. The archive contains recent GPR investigations on concretewalls or floors that were performed by using the 2 GHz antennafrom IDS. This antenna has the advantage of dual polarization,i.e., it consists of two pairs of bow-tie elements with orthogonalpolarization. As a result, these data are suitable to be analyzedfor estimating the RCS ratio. Actually, a requirement needed tointerpret the measured energy ratio between Cross-Polarizationand Co-Polarization in terms of RCS ratio is that the same antennais used for both the Cross- and the Co-polarized measurements.This is fundamental to ensure that the energy ratio is not affectedby possible differences in the properties of the antennas used forthe measurements. This difficulty might be overcome by perform-ing a laboratory calibration of the dual polarized antenna fromwhich an experimental curve showing the RCS ratio versus rebardiameter will be derived for subsequent use. This curve mightdiffer from the theoretical predictions because of some unbalancebetween the two antenna pairs and thus it will be valid only for thespecific antenna. However, to the aim of this test the above calibra-tion is not essential. Since the archive does not report informationabout the rebar diameter, the GPR estimate cannot be validated.Thus, we can use the theoretical curve with the objective of check-ing for each case study the stability of the response assuming thatall the reinforcements intercepted along parallel profiles executedon the same building element have the same diameter.
Fig. 13 shows some data extracted from two case studies thatwere selected for this stability test. Case (a) consists of a concretewall where vertical reinforcements have an average spacing of25 cm with small spacing irregularities (from 24 to 26 cm). Con-crete cover varies from 4 to 6 cm. Large and regular spacing of rein-forcements and small depth variations makes this case study anexample of an easy situation. Case (b) consists of a concrete floorwhere horizontal reinforcements have an average spacing of about20 cm with large spacing irregularities (from 15 to 26 cm).
ar diameter analysis. (a) concrete wall, and (b) concrete floor.

1300 L. Zanzi, D. Arosio / Construction and Building Materials 48 (2013) 1293–1301
Concrete cover varies from 9 to 13 cm. Compared to case (a), thiscase study represents an example of a more challenging situation.
Results are illustrated in Fig. 14. RCS ratios shown in (a) wereinterpreted in terms of rebar diameters in (b) by using the theoret-ical curve plotted in Fig. 8. As discussed above this might introducea bias in the results but the objective was not estimating a correctdiameter; rather, the objective was the analysis of the result stabil-ity. As expected, results are more stable on case (a) compared tocase (b). If we analyze the whole data, the diameter estimate variesfrom 7 to 9 mm in case (a) and from 11 to 17 mm in case (b) with anon symmetrical distribution for the last case where the average is13 mm. If we repeat the analysis after excluding a 5% of outliers thediameter estimate varies from 7 to 8 mm in case (a) and from 11 to13 mm in case (b).
The main conclusion that can be drawn from these experimentsis that the methodology cannot be applied as a single measure-ment. Without excluding the outliers, the range of the results ex-ceeds the accuracy that is required by the possible end-users. Tokeep the results within an acceptable range, the methodology mustbe applied statistically and a 5% of outliers must be excluded. Thisseems to be enough to preserve an accuracy of about 1 mm whichmight be of great interest for the possible end-users.
8. Conclusions
Preliminary results on rebar sizing from real GPR data measuredon laboratory specimens were showing a misfit with theoreticalpredictions that was not well understood. With the help of a 3D fi-nite-difference code, synthetic data were generated and analyzed
Fig. 14. Rebar diameter analysis on real data from case A and case B. Results afteroutlier removal (5% of data) are also shown. (a) RCS ratio, and (b) rebar diameter.Circles indicate the average values. Vertical lines indicate the range of the results.
to extract the ratio of the Radar Cross Section per unit length mea-sured with orthogonal polarizations. The comparison between realand synthetic data indicated that the problem to be addressed isthe interference of background signal with wavelets scattered bythe rebars. A non optimal subtraction of the background signalseverely deteriorates the results.
This analysis also indicates that other problems that might gen-erate a misfit between theory and real measurements (near-fieldconditions, large bandwidth) seem to be of lower importance, atleast on data measured in controlled and favorable situations ason these laboratory specimens.
According to laboratory results, the methodology can be verysensitive to rebar diameter. Sensitivity is proportional to antennafrequency but frequency cannot be increased indefinitely becauselow frequencies are needed to preserve sensitivity to larger diam-eters. A set of three antennas with nominal frequencies distributedin the frequency range from about 600 MHz to 2 GHz seems to beenough to have good sensitivity for any rebar diameter up to about40 mm.
Although encouraging, laboratory results are not sufficient toconclude that the methodology can be applied on-site where fur-ther problems might arise.
Important issues to be investigated experimentally are theinfluence of concrete cover and the influence of concrete qualityon the reliability of the reinforcement diameter estimation. Appar-ently, the RCS ratio should be independent from these parametersbecause they equally affect the H and E polarization measure-ments. However, concrete cover and concrete quality are expectedto affect the spectral properties of the radar diffractions. As thetraveling distance increases or the concrete quality deteriorates,the spectrum is expected to be shifted towards lower frequenciesbecause of higher absorption. Since the calibration curve used toestimate the rebar diameter is frequency dependent, the algorithmmight show some sensitivity to reinforcement depth or concretequality. In addition, other complexities might arise from data col-lected on real building elements. For examples, rebars might beirregularly spaced creating situations where radar diffractionsfrom neighboring rebars strongly interfere. Variations in rebar ori-entation resulting from poorly executed works can also affect thereliability of the RCS estimate. Finally, diffractions from targetsother than reinforcements, e.g., column or beam edges or externalmetal elements connected to the beams, can disturb themeasurements.
To explore how these problems might influence the accuracy ofthe methodology, we applied the technique to some data collectedon-site with a dual-polarized high frequency antenna. An impor-tant conclusion was drawn from these experiments: a statisticalanalysis of the results is essential. A single measurement is not reli-able enough. A profile that intercepts a number of reinforcements(e.g., 10) that we expect to have the same diameter is needed in or-der to generate a statistical distribution and to exclude the outliers.It seems that excluding a 5% of outliers is enough to preserve anaccuracy of about 1 mm which is of great interest for possibleend-users of the building sector.
The necessity to assume that the rebar diameter does notchange along the radar profile does not seem to be a big limitationbecause concrete structures are designed with periodical distribu-tion of reinforcements that share the same function and the samesize. The necessity of collecting a radar profile with both E and Hpolarization intersecting several rebars rather than just one makesthe on-site application a little bit more complex. However, this dif-ficulty is strongly reduced by using a dual-polarized antenna [18].A dual-polarized antenna automatically collects all the data thatare needed with a single profile and ensures that E and H dataare collected exactly in the same position and with orthogonal ori-ented antennas. To obtain the same measurement accuracy with a

L. Zanzi, D. Arosio / Construction and Building Materials 48 (2013) 1293–1301 1301
single polarized antenna would be much more difficult and time-consuming. Of course, the use of a dual-polarized antenna requiresthat the antenna is preliminarily calibrated in laboratory in orderto generate an experimental RCS ratio versus rebar diameter curveto compensate for possible asymmetrical performances of the Eand H dipoles.
On the whole, from laboratory and on-site experimentsdescribed in this work, it seems that a preliminary positive conclu-sion can be drawn: the proposed methodology is promising pro-vided that it is applied statistically and that dual-polarizedantennas are used to make the data collection sustainable. Thenext step consists of applying the methodology extensively tomany real situations with different constraints, different reinforce-ment design, different concrete quality and to validate the accu-racy of the results with local destructive tests.
Acknowledgements
The authors thank Francesca Gagliardi and Chiara Cocorullowho contributed to this work by performing laboratory test andsynthetic simulations respectively.
The authors are also grateful to IDS S.p.A. that supported theresearch by supplying the 2 GHz frequency equipment and toAntonis Giannopoulos who made his modeling code available tothe scientific community.
References
[1] Hugenschmidt J, Kalogeropoulos A, Soldovieri F, Prisco G. Processing strategiesfor high-resolution GPR concrete inspections. NDT&E Int 2010;43:334–42.
[2] Lualdi M, Zanzi L. 3D GPR investigations on building elements using the PSG.In: Proceedings SAGEEP 2003, April 6–10, San Antonio (TX). p. 803–12.
[3] Lualdi M, Zanzi L, Binda L. Acquisition and processing requirements for highquality 3D reconstructions from GPR investigations. In: Proceedings of theinternational symposium non destructive testing in civil engineering NDT-CE2003, September 16–19, Berlin.
[4] Zanzi L, Arosio D, Munda S, da Porto F, Mosele F. Quality assessment ofreinforced masonry walls by means of non destructive tests. In: Proceedings of2nd Canadian conference on effective design of structures 2008, May 20–23,Hamilton, Canada.
[5] Arosio D, da Porto F, Mosele F, Munda S, Zanzi L. Calibration and on-siteapplication of radar and sonic methods for quality control of reinforcedmasonry. In: Proceedings of NDTCE 2009, June 30–July 3, Nantes, France.
[6] Arosio D, Munda S, Zanzi L, da Porto F, Mosele F. Non-destructive qualitycontrol of reinforced masonry buildings. ASCE J Infrastruct Syst2012;18:34–46.
[7] Gucunski N, Rascoe C, Parrillo R, Roberts R. Comparative study of bridge deckcondition assessment by high frequency GPR. In: Proceedings of symp. NDE/NDT for highways and bridges (SMT) 2008, September 8–12, Oakland (CA).
[8] Lai WL, Kind T, Wiggenhauser H. Using ground penetrating radar and time-frequency analysis to characterize construction materials. NDT&E Int2011;44:111–20.
[9] Dell’Acqua A, Sarti A, Tubaro S, Zanzi L. Detection of linear objects in GPR data.Signal Process 2004;84:785–99.
[10] Shaw MR, Millard SG, Molineaux TCK, Taylor MJ, Bungey JH. Location of steelreinforcement in concrete using ground penetrating radar and neuralnetworks. NDT&E Int 2005;38:203–12.
[11] Chang CW, Lin CH, Lien HS. Measurement radius of reinforcing steel bar inconcrete using digital image GPR. Constr Build Mater 2009;23:1057–63.
[12] Hunik R. Detection and sizing of cables and leads with sub-surface radar. In:Proceedings of the 12th world conference on non-destructive testing 1989,23–28 April, Amsterdam.
[13] Shaw MR, Molineaux TCK, Millard SG, Taylor MJ, Bungey JH. Assessing bar sizeof steel reinforcement in concrete using ground penetrating radar andneuronal networks. Insight 2003;45:813–6.
[14] Utsi V, Utsi E. Measurements of reinforcement bar depths and diameters inconcrete. In: Proceedings of the tenth international conference on groundpenetrating radar 2004, 21–24 June, Delft.
[15] Lualdi M, Zanzi L. Analytical and experimental evaluation of the Radar CrossSection of concrete reinforcements. In: Proceedings of the NDE conference oncivil engineering 2006, 14–18 August, St. Louis (MO).
[16] Ruck GT, Barrick DE, Stuart WD. Radar cross section handbook, vol. 1. NewYork: Plenum Press; 1970.
[17] Giannopoulos A. Modelling of ground penetrating radar using GprMax. ConstrBuild Mater 2005;19:755–62.
[18] Lualdi M, Zanzi L, Ciano M. Experimenting Dual-Polarized antennas for three-dimensional surveys. In: Proceedings of the 11th international conference onGPR 2006, June 19–22, Columbus Ohio.