selection of plant physiological parameters to detect stress
TRANSCRIPT
Vol.:(0123456789)1 3
Acta Physiologiae Plantarum (2019) 41:56 https://doi.org/10.1007/s11738-019-2842-9
ORIGINAL ARTICLE
Selection of plant physiological parameters to detect stress effects in pot experiments using principal component analysis
Anna Füzy1 · Ramóna Kovács1 · Imre Cseresnyés1 · István Parádi1,2 · Tibor Szili‑Kovács1 · Bettina Kelemen1 · Kálmán Rajkai1 · Tünde Takács1
Received: 31 May 2018 / Revised: 31 May 2018 / Accepted: 14 March 2019 © The Author(s) 2019
AbstractAppropriate selection and well-timed measurement of plant developmental, morphological and physiological parameters are essential to maximize efficacy and minimize time consumption of experiments. To select for the most sensitive indicators of drought or salt stress, three independent pot experiments with diverse setups were analysed with 20–20 measured param-eters. Parameters of plant growth, phenology and symbiotic interactions, visual stress symptoms, photosynthetic activity, nutrient composition and vitality were studied and the result matrices were evaluated with principal component analysis (PCA). Stress effects manifested in PC1 of two experiments and in PC2 of the third one. Traits assumed to be adequate for stress indication were characterized by high PC1 or PC2 loading values. Beside parameters of biomass production, growth and visible stress symptoms, less evident traits e.g. root electrical capacitance, membrane stability index in roots and leaves, relative water content of leaves and SPAD units were identified.
Keywords Plant trials · Stress indication · Drought · Salinity
Introduction
Stress is an altered physiological response of living organ-isms caused by physical, chemical or biotic environmental factors that tend to shift their equilibrium away from its opti-mal thermodynamic state (Gaspar et al. 2002; Strasser 1988). Soil or water pollution, climate change or other anthropo-genic effects can cause severe abiotic or biotic stress for both cultivated plants and natural vegetation. Understanding the effective plant resilience and adaptation to heterogeneous and changing environmental conditions is, therefore, in the forefront of agricultural, ecological or conservation research.
An appropriate experimental design with a selection of the most sensitive parameters to be measured is a prereq-uisite for an effective and time efficient study, although the right choice of these parameters is not always obvi-ous. Regarding their relevance, applicability and the ade-quate number of parameters to be used, there are numer-ous examples of experimental approaches. Several groups of quantitative or qualitative parameters exist which have been applied to characterize plant development and growth, physiological status, symbiotic interactions, stress symptoms, photosysnthesis, etc. during or at the end of an experimental growth period (Berger and Ludwig 2014; Grümberg et al. 2015; He and Dijkstra 2014; Kalaji et al. 2016; Latef and Chaoxing 2014; Munns 2002; Roger 2001; Salvatori et al. 2014; Talaat et al. 2015; Wehner et al. 2015; Zhang et al. 2015): (1) the simplest and most obvi-ous parameters are: fresh and dry weight, root and shoot biomass production, root to shoot ratio, leaf area, grain yield, reproductive index. Most of them can be measured in a non-destructive manner, such as using optical imaging techniques, e.g., plant height, shoot diameter, leaf number, number of nodes, colour of leaves, the state of flowering, podding or grain filling, as well as observations of growth morphological dynamics, visible impacts of stress-based
Communicated by S. Srivastava.
* Anna Füzy [email protected]
1 Hungarian Academy of Sciences, Centre for Agricultural Research, Institute for Soil Sciences and Agricultural Chemistry, Herman Ottó Út 15, Budapest 1022, Hungary
2 Deptartment of Plant Physiology and Molecular Plant Biology, Eötvös Loránd University, Pázmány Péter sétány 1/c, Budapest 1117, Hungary
Acta Physiologiae Plantarum (2019) 41:56
1 3
56 Page 2 of 10
wilting symptoms, senescence, leaf necrosis, and pheno-typical variations (Berger et al. 2010; Li et al. 2014; Vol-lenweider and Günthardt-Georg 2005). (2) Plant responses characterized by the nutritional status of plant shoots, roots or yield. (3) Water relations of the plant: leaf water poten-tial, relative water content in leaves, absolute and relative transpiration rates (Verslues et al. 2006). (4) Parameters related to photosynthesis (Chaves et al. 2009) have been previously measured by destructive methods, such as chlo-rophyll concentration or intracellular CO2 concentration in leaves, whereas they are already determined mostly non-destructively and can be measured several times during an experiment, e.g., chlorophyll fluorescence measurements (Krause and Weis 1984), SPAD (Soil Plant Analysis Devel-opment) units, stomatal conductance or photosynthetic water use efficiency. (5) Protein, free amino acid, proline, glycin-betaine, soluble sugar and endogenous abscisic acid content of plant tissues or metabolic fingerprinting values (Schauer and Fernie 2006; Shulaev et al. 2008) describe plant biochemical processes, and they are potential stress indicators. (6) Measurement of enzyme activities, e.g., ATPase, superoxide dismutase, catalase, ascorbate peroxi-dase, glutathione reductase, or characterization of oxidative damage or lipid peroxidation are also sensitive tools on the biochemical level. (7) Electrolyte leakage and membrane stability indices may provide valuable information about the condition and the potential resilience of plant cells. (8) The presence or absence and the developmental state of symbiotic relationships may indicate plant physiological status and sign stress effects indirectly (Füzy et al. 2008a). (9) Measurement of electrical capacitance in root–soil sys-tems is a promising non-destructive method for assessing root growth and activity (Cseresnyés et al. 2013). (10) The study of the dynamics of plant metabolism and regulatory mechanisms under stress often requires a combination of the traditional physiological approaches with functional genomic characterization using transcriptomic, proteomic, metabolomic or ionomic analysis (Chaves et al. 2009).
A joint multivariate statistical analysis on many of these plant growth or physiological parameters used in three independent experiments with different test plants and environmental conditions is presented. Our analysis aimed to assess the adaptability of these parameters to indicate stress responses.
Materials and methods
Pot experiments
Three independent pot experiments (I–III) were accom-plished. In experiment (I) salt tolerance of two wheat
(Triticum aestivum L.) cultivars were tested, in experiment (II) two soybean (Glycine max L.) varieties were grown under drought stress conditions, while in experiment (III) sea aster (Tripolium pannonicum L.), a common halophyte was grown under drought, salt and combined stress condi-tions (Tables 1, 2).
Measured parameters
The following parameters were measured during the growth period of plants or at the end of the experiments—some of them were measured only in 1 or 2 experiments (Table 2).
Plant growth parameters: the oven dried (70 °C, 72 h) plant root and shoot biomass (SDM, RDM), root:shoot ratio (R/S) and leaf area (LA) were measured and calculated at harvest, while, plant height (PH), leaf number (LN), num-ber of nodes (NN), length of the longest leaf (LL) and the presence of flowers (FLW) were monitored during the total plant growth period.
Visual assessment of plant condition: colour of leaves (COL), wilting symptoms (WS) after drought stress were surveyed and categorized in a four grade scale: 0: no vis-ible symptoms, 1: 1–2 affected leaves, 2: serious wilting on some leaves, 3: wilting symptoms on whole plant, some leaves die away, 4: plant death. Number of dry leaves (DL) was counted regularly, while relative water content of leaves (RWC) was measured more times during the experiments (Barrs and Weatherley 1962; Gonzalaz and; González-Vilar 2007).
Functional parameters of the photosynthetic apparatus: chlorophyll content (CHL) was determined according to Porra et al. (1989). Stomatal conductance (SC) was meas-ured by a leaf porometer (Decagon Devices Inc., Pullman, WA, USA; Model Sc-1). Photochemical activity of pho-tosystem II characterised by Fv/Fm and Fv/F0 values were measured by a Chlorophyll a fluorometer (Opti-Sciences OS-30p + Fluorometer, Hudson, New Hampshire, USA, Tsimilli-Michael and Strasser 2008). SPAD values were monitored by a SPAD-502 meter (Konica Minolta Inc., Osaka, Japan).
Electrical capacitance (EC) and phase angle of the impedance (F) were measured in the root–soil system. EC is determined by the extension and the uptake activity of the root system (Cseresnyés et al. 2016), while F primar-ily depends on the physicochemical properties of root tis-sues (Cseresnyés et al. 2013). Capacitance response of the root–substrate system was detected using a GW-8101G pre-cision LCR meter (GW Instek Co. Ltd., Taiwan) at 1 kHz and 1 V AC. EC and F values for parallel resistor–capacitor (RC) circuit were displayed. The ground electrode (a stain-less steel rod, 15 cm long and 6 mm i.d.) was inserted into 10 cm depth in the substrate at 5 cm distance from the stem base, while the plant electrode was attached to the stem at
Acta Physiologiae Plantarum (2019) 41:56
1 3
Page 3 of 10 56
equal height (1 cm) above substrate level through a 5-mm-wide aluminium strip. 2 h before electrical measurements, pots were watered to field capacity.
Macro- and micronutrient concentrations in plant tis-sues were also investigated. P, K, Zn and Fe concentrations were assessed after wet digestion of the air-dried plant samples with cc. HNO3 + cc. H2O2. Shoot nutrient contents were measured by an ICP-AES instrument (Jobin–Yvon, ULTIMA2). Nitrogen content of the leaves was determined by the Kjeldahl method (1883) after digestion of the samples in sulfuric acid (cc. H2SO4).
Root nodulation rate (NOD) of soybean plants were scored from 0 to 8. 0: no nodules, 1: 1–10 nodules, 2: several nodules, but low density, 3: nodules are in medium density, 4: very dense nodulation. The assessments were made for the main root and the lateral roots separately, then the scores were summarized. Arbuscular mycorrhizal fungal (AMF) colonization of roots were determined after clearing and staining (Phillips and Hayman 1970). Fungal colonization intensity (M) and arbuscule richness of roots (A) were cal-culated according to Trouvelot et al. (1989).
Vitality and biochemical parameters were measured as well: the membrane stability index in roots (MSIR) and/or shoots (MSIS) (Sairam et al. 1997), root vitality test by the
triphenyl-tetrazolium chloride (TTC) method (Clemensson-Lindell and Persson 1995) and the root ethylene production (ET) by GC (Bassi and Spencer 1989; Cristescu et al. 2012).
Statistical analyses
Principal component analyses (PCA) were made by 20 selected variables from each experiment to designate the main factors that indicate stress situations effectively. The statistical analyses were carried out by the Statistica soft-ware package (Dell Inc. 2015. version 13).
Results
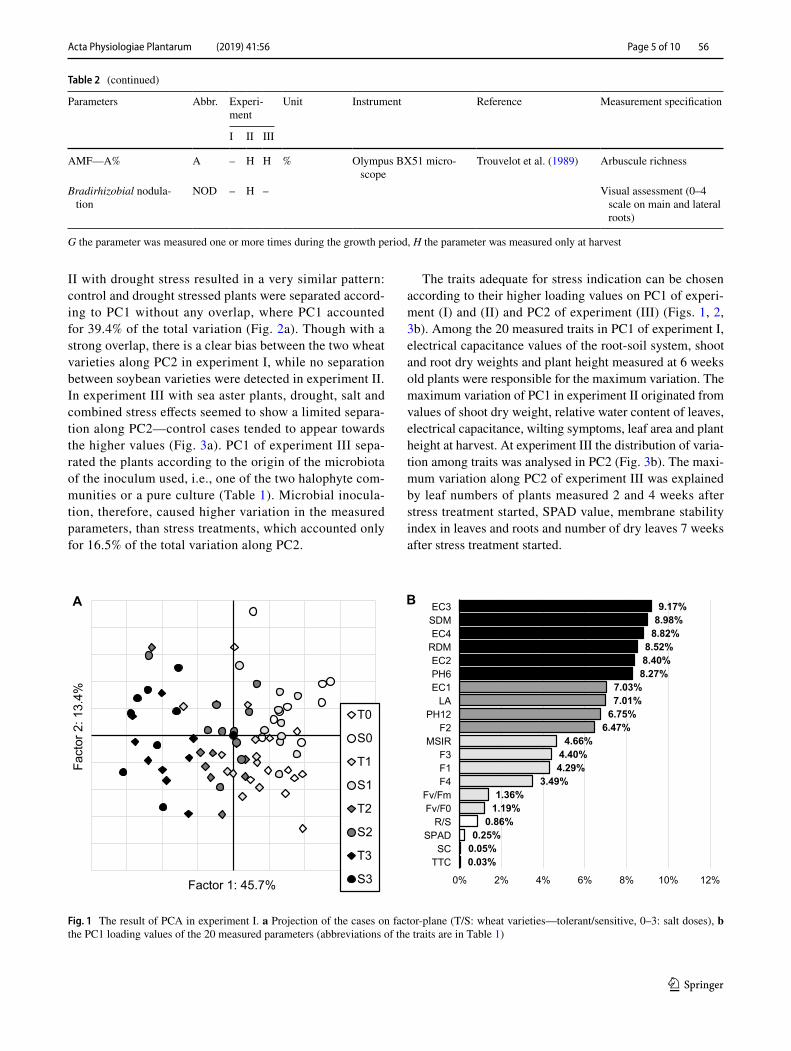
As a result of the PCA, the projections of the cases on a factor-plane with the two principal components (PC) were imaged (Figs. 1, 2, 3a), and the efficiency of separation in case of the main factors were checked. A very clear separation of salt treatments was shown by PC1 in experi-ment I, which accounted for 45.7% of the total variation. Control and salt treatments were separated with minimal overlapping (Fig. 1a). Statistical analysis of experiment
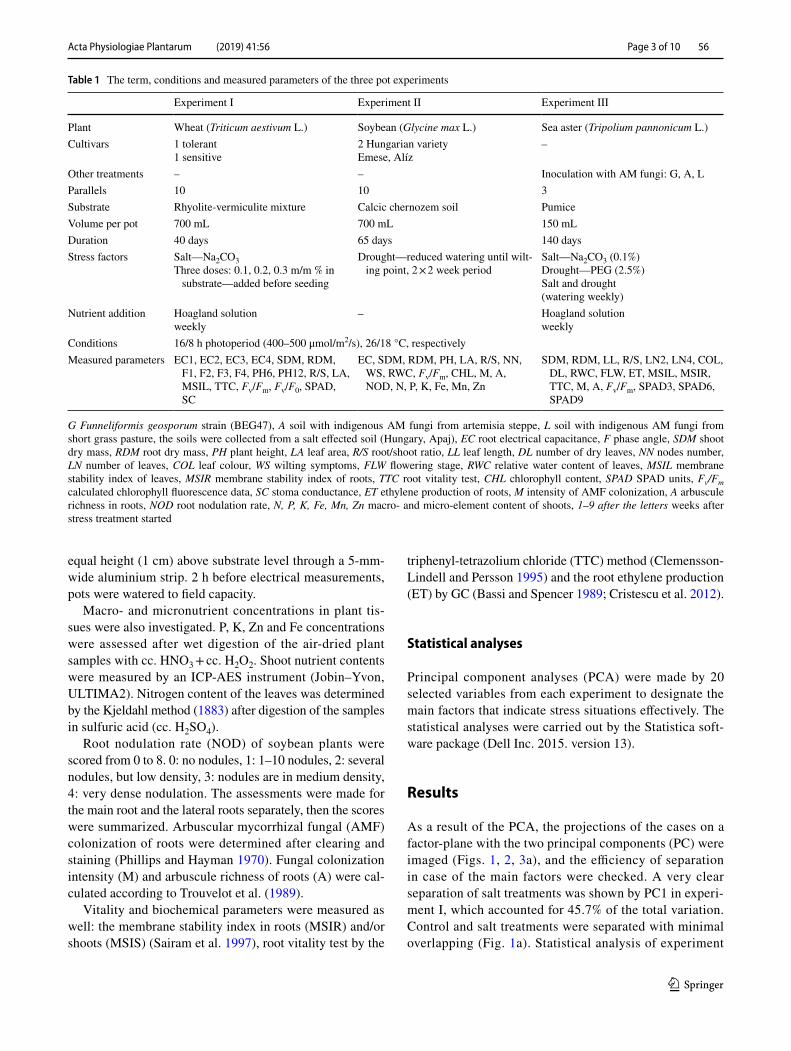
Table 1 The term, conditions and measured parameters of the three pot experiments
G Funneliformis geosporum strain (BEG47), A soil with indigenous AM fungi from artemisia steppe, L soil with indigenous AM fungi from short grass pasture, the soils were collected from a salt effected soil (Hungary, Apaj), EC root electrical capacitance, F phase angle, SDM shoot dry mass, RDM root dry mass, PH plant height, LA leaf area, R/S root/shoot ratio, LL leaf length, DL number of dry leaves, NN nodes number, LN number of leaves, COL leaf colour, WS wilting symptoms, FLW flowering stage, RWC relative water content of leaves, MSIL membrane stability index of leaves, MSIR membrane stability index of roots, TTC root vitality test, CHL chlorophyll content, SPAD SPAD units, Fv/Fm calculated chlorophyll fluorescence data, SC stoma conductance, ET ethylene production of roots, M intensity of AMF colonization, A arbuscule richness in roots, NOD root nodulation rate, N, P, K, Fe, Mn, Zn macro- and micro-element content of shoots, 1–9 after the letters weeks after stress treatment started
Experiment I Experiment II Experiment III
Plant Wheat (Triticum aestivum L.) Soybean (Glycine max L.) Sea aster (Tripolium pannonicum L.)Cultivars 1 tolerant
1 sensitive2 Hungarian varietyEmese, Alíz
–
Other treatments – – Inoculation with AM fungi: G, A, LParallels 10 10 3Substrate Rhyolite-vermiculite mixture Calcic chernozem soil PumiceVolume per pot 700 mL 700 mL 150 mLDuration 40 days 65 days 140 daysStress factors Salt—Na2CO3
Three doses: 0.1, 0.2, 0.3 m/m % in substrate—added before seeding
Drought—reduced watering until wilt-ing point, 2 × 2 week period
Salt—Na2CO3 (0.1%)Drought—PEG (2.5%)Salt and drought(watering weekly)
Nutrient addition Hoagland solutionweekly
– Hoagland solutionweekly
Conditions 16/8 h photoperiod (400–500 μmol/m2/s), 26/18 °C, respectivelyMeasured parameters EC1, EC2, EC3, EC4, SDM, RDM,
F1, F2, F3, F4, PH6, PH12, R/S, LA, MSIL, TTC, Fv/Fm, Fv/F0, SPAD, SC
EC, SDM, RDM, PH, LA, R/S, NN, WS, RWC, Fv/Fm, CHL, M, A, NOD, N, P, K, Fe, Mn, Zn
SDM, RDM, LL, R/S, LN2, LN4, COL, DL, RWC, FLW, ET, MSIL, MSIR, TTC, M, A, Fv/Fm, SPAD3, SPAD6, SPAD9
Acta Physiologiae Plantarum (2019) 41:56
1 3
56 Page 4 of 10
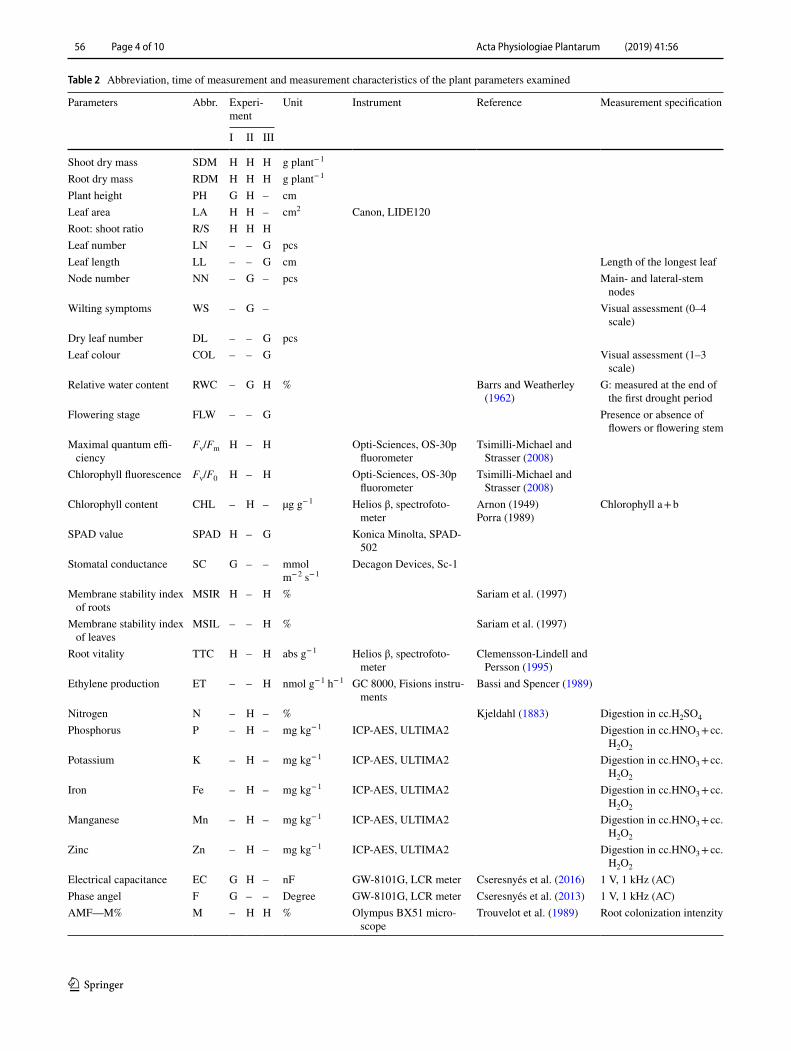
Table 2 Abbreviation, time of measurement and measurement characteristics of the plant parameters examined
Parameters Abbr. Experi-ment
Unit Instrument Reference Measurement specification
I II III
Shoot dry mass SDM H H H g plant− 1
Root dry mass RDM H H H g plant− 1
Plant height PH G H – cmLeaf area LA H H – cm2 Canon, LIDE120Root: shoot ratio R/S H H HLeaf number LN – – G pcsLeaf length LL – – G cm Length of the longest leafNode number NN – G – pcs Main- and lateral-stem
nodesWilting symptoms WS – G – Visual assessment (0–4
scale)Dry leaf number DL – – G pcsLeaf colour COL – – G Visual assessment (1–3
scale)Relative water content RWC – G H % Barrs and Weatherley
(1962)G: measured at the end of
the first drought periodFlowering stage FLW – – G Presence or absence of
flowers or flowering stemMaximal quantum effi-
ciencyFv/Fm H – H Opti-Sciences, OS-30p
fluorometerTsimilli-Michael and
Strasser (2008)Chlorophyll fluorescence Fv/F0 H – H Opti-Sciences, OS-30p
fluorometerTsimilli-Michael and
Strasser (2008)Chlorophyll content CHL – H – µg g− 1 Helios β, spectrofoto-
meterArnon (1949)Porra (1989)
Chlorophyll a + b
SPAD value SPAD H – G Konica Minolta, SPAD-502
Stomatal conductance SC G – – mmolm− 2 s− 1
Decagon Devices, Sc-1
Membrane stability index of roots
MSIR H – H % Sariam et al. (1997)
Membrane stability index of leaves
MSIL – – H % Sariam et al. (1997)
Root vitality TTC H – H abs g− 1 Helios β, spectrofoto-meter
Clemensson-Lindell and Persson (1995)
Ethylene production ET – – H nmol g− 1 h− 1 GC 8000, Fisions instru-ments
Bassi and Spencer (1989)
Nitrogen N – H – % Kjeldahl (1883) Digestion in cc.H2SO4
Phosphorus P – H – mg kg− 1 ICP-AES, ULTIMA2 Digestion in cc.HNO3 + cc.H2O2
Potassium K – H – mg kg− 1 ICP-AES, ULTIMA2 Digestion in cc.HNO3 + cc.H2O2
Iron Fe – H – mg kg− 1 ICP-AES, ULTIMA2 Digestion in cc.HNO3 + cc.H2O2
Manganese Mn – H – mg kg− 1 ICP-AES, ULTIMA2 Digestion in cc.HNO3 + cc.H2O2
Zinc Zn – H – mg kg− 1 ICP-AES, ULTIMA2 Digestion in cc.HNO3 + cc.H2O2
Electrical capacitance EC G H – nF GW-8101G, LCR meter Cseresnyés et al. (2016) 1 V, 1 kHz (AC)Phase angel F G – – Degree GW-8101G, LCR meter Cseresnyés et al. (2013) 1 V, 1 kHz (AC)AMF—M% M – H H % Olympus BX51 micro-
scopeTrouvelot et al. (1989) Root colonization intenzity
Acta Physiologiae Plantarum (2019) 41:56
1 3
Page 5 of 10 56
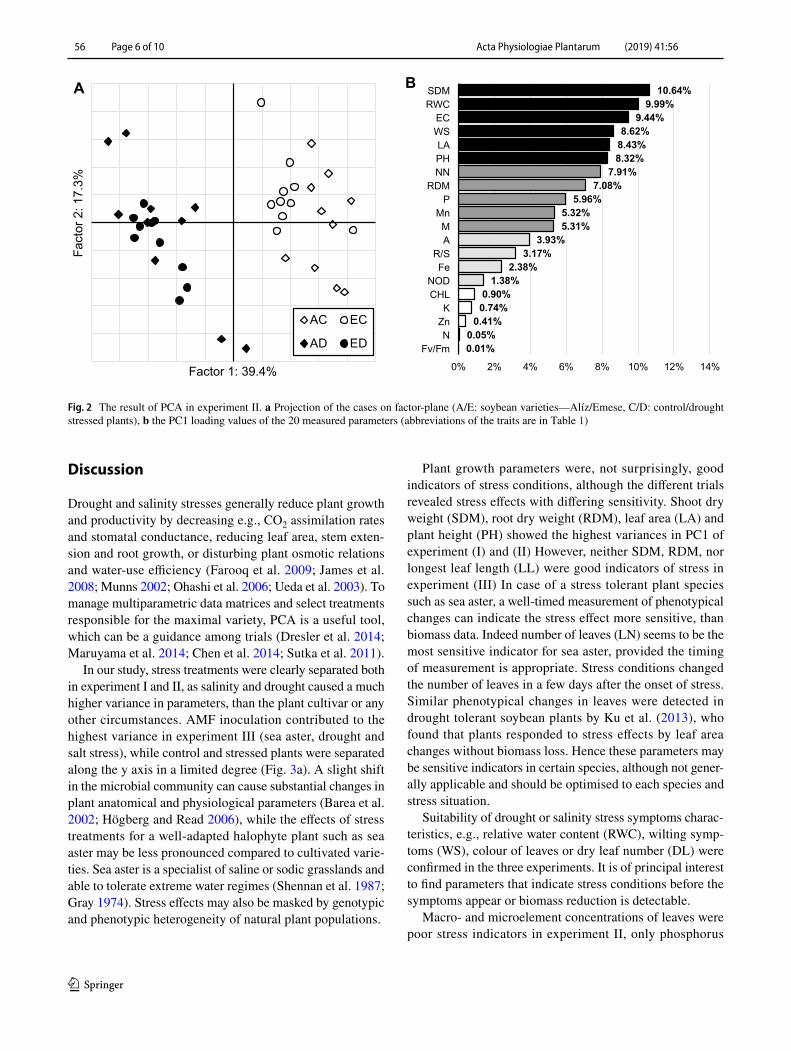
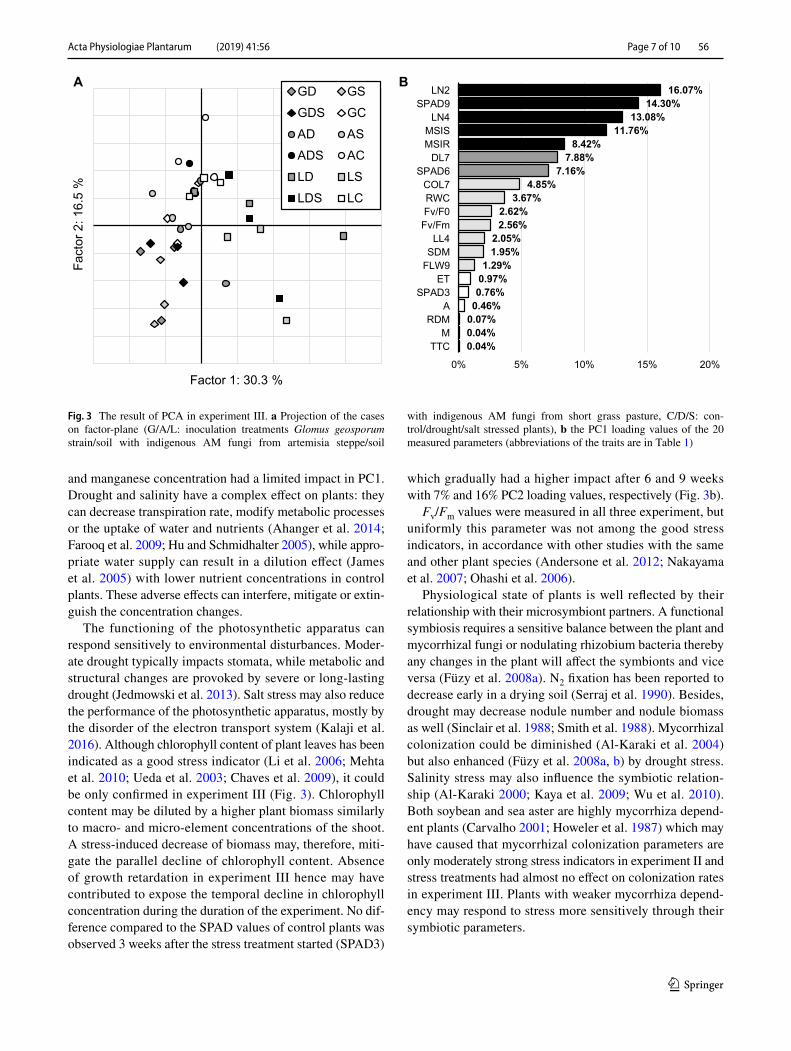
II with drought stress resulted in a very similar pattern: control and drought stressed plants were separated accord-ing to PC1 without any overlap, where PC1 accounted for 39.4% of the total variation (Fig. 2a). Though with a strong overlap, there is a clear bias between the two wheat varieties along PC2 in experiment I, while no separation between soybean varieties were detected in experiment II. In experiment III with sea aster plants, drought, salt and combined stress effects seemed to show a limited separa-tion along PC2—control cases tended to appear towards the higher values (Fig. 3a). PC1 of experiment III sepa-rated the plants according to the origin of the microbiota of the inoculum used, i.e., one of the two halophyte com-munities or a pure culture (Table 1). Microbial inocula-tion, therefore, caused higher variation in the measured parameters, than stress treatments, which accounted only for 16.5% of the total variation along PC2.
The traits adequate for stress indication can be chosen according to their higher loading values on PC1 of experi-ment (I) and (II) and PC2 of experiment (III) (Figs. 1, 2, 3b). Among the 20 measured traits in PC1 of experiment I, electrical capacitance values of the root-soil system, shoot and root dry weights and plant height measured at 6 weeks old plants were responsible for the maximum variation. The maximum variation of PC1 in experiment II originated from values of shoot dry weight, relative water content of leaves, electrical capacitance, wilting symptoms, leaf area and plant height at harvest. At experiment III the distribution of varia-tion among traits was analysed in PC2 (Fig. 3b). The maxi-mum variation along PC2 of experiment III was explained by leaf numbers of plants measured 2 and 4 weeks after stress treatment started, SPAD value, membrane stability index in leaves and roots and number of dry leaves 7 weeks after stress treatment started.
G the parameter was measured one or more times during the growth period, H the parameter was measured only at harvest
Table 2 (continued)
Parameters Abbr. Experi-ment
Unit Instrument Reference Measurement specification
I II III
AMF—A% A – H H % Olympus BX51 micro-scope
Trouvelot et al. (1989) Arbuscule richness
Bradirhizobial nodula-tion
NOD – H – Visual assessment (0–4 scale on main and lateral roots)
Fact
or 2
: 13.
4%
Factor 1: 45.7%
T0
S0
T1
S1
T2
S2
T3
S3
A
0.03%0.05%0.25%
0.86%1.19%1.36%
3.49%4.29%4.40%4.66%
6.47%6.75%7.01%7.03%
8.27%8.40%8.52%8.82%8.98%9.17%
0% 2% 4% 6% 8% 10% 12%
TTCSC
SPADR/S
Fv/F0Fv/Fm
F4F1F3
MSIRF2
PH12LA
EC1PH6EC2
RDMEC4SDMEC3B
Fig. 1 The result of PCA in experiment I. a Projection of the cases on factor-plane (T/S: wheat varieties—tolerant/sensitive, 0–3: salt doses), b the PC1 loading values of the 20 measured parameters (abbreviations of the traits are in Table 1)
Acta Physiologiae Plantarum (2019) 41:56
1 3
56 Page 6 of 10
Discussion
Drought and salinity stresses generally reduce plant growth and productivity by decreasing e.g., CO2 assimilation rates and stomatal conductance, reducing leaf area, stem exten-sion and root growth, or disturbing plant osmotic relations and water-use efficiency (Farooq et al. 2009; James et al. 2008; Munns 2002; Ohashi et al. 2006; Ueda et al. 2003). To manage multiparametric data matrices and select treatments responsible for the maximal variety, PCA is a useful tool, which can be a guidance among trials (Dresler et al. 2014; Maruyama et al. 2014; Chen et al. 2014; Sutka et al. 2011).
In our study, stress treatments were clearly separated both in experiment I and II, as salinity and drought caused a much higher variance in parameters, than the plant cultivar or any other circumstances. AMF inoculation contributed to the highest variance in experiment III (sea aster, drought and salt stress), while control and stressed plants were separated along the y axis in a limited degree (Fig. 3a). A slight shift in the microbial community can cause substantial changes in plant anatomical and physiological parameters (Barea et al. 2002; Högberg and Read 2006), while the effects of stress treatments for a well-adapted halophyte plant such as sea aster may be less pronounced compared to cultivated varie-ties. Sea aster is a specialist of saline or sodic grasslands and able to tolerate extreme water regimes (Shennan et al. 1987; Gray 1974). Stress effects may also be masked by genotypic and phenotypic heterogeneity of natural plant populations.
Plant growth parameters were, not surprisingly, good indicators of stress conditions, although the different trials revealed stress effects with differing sensitivity. Shoot dry weight (SDM), root dry weight (RDM), leaf area (LA) and plant height (PH) showed the highest variances in PC1 of experiment (I) and (II) However, neither SDM, RDM, nor longest leaf length (LL) were good indicators of stress in experiment (III) In case of a stress tolerant plant species such as sea aster, a well-timed measurement of phenotypical changes can indicate the stress effect more sensitive, than biomass data. Indeed number of leaves (LN) seems to be the most sensitive indicator for sea aster, provided the timing of measurement is appropriate. Stress conditions changed the number of leaves in a few days after the onset of stress. Similar phenotypical changes in leaves were detected in drought tolerant soybean plants by Ku et al. (2013), who found that plants responded to stress effects by leaf area changes without biomass loss. Hence these parameters may be sensitive indicators in certain species, although not gener-ally applicable and should be optimised to each species and stress situation.
Suitability of drought or salinity stress symptoms charac-teristics, e.g., relative water content (RWC), wilting symp-toms (WS), colour of leaves or dry leaf number (DL) were confirmed in the three experiments. It is of principal interest to find parameters that indicate stress conditions before the symptoms appear or biomass reduction is detectable.
Macro- and microelement concentrations of leaves were poor stress indicators in experiment II, only phosphorus
Fact
or 2
: 17.
3%
Factor 1: 39.4%
AC EC
AD ED
A
0.01%0.05%0.41%0.74%0.90%1.38%
2.38%3.17%
3.93%5.31%5.32%
5.96%7.08%
7.91%8.32%8.43%8.62%
9.44%9.99%
10.64%
0% 2% 4% 6% 8% 10% 12% 14%
Fv/FmN
ZnK
CHLNOD
FeR/S
AM
MnP
RDMNNPHLA
WSEC
RWCSDMB
Fig. 2 The result of PCA in experiment II. a Projection of the cases on factor-plane (A/E: soybean varieties—Alíz/Emese, C/D: control/drought stressed plants), b the PC1 loading values of the 20 measured parameters (abbreviations of the traits are in Table 1)
Acta Physiologiae Plantarum (2019) 41:56
1 3
Page 7 of 10 56
and manganese concentration had a limited impact in PC1. Drought and salinity have a complex effect on plants: they can decrease transpiration rate, modify metabolic processes or the uptake of water and nutrients (Ahanger et al. 2014; Farooq et al. 2009; Hu and Schmidhalter 2005), while appro-priate water supply can result in a dilution effect (James et al. 2005) with lower nutrient concentrations in control plants. These adverse effects can interfere, mitigate or extin-guish the concentration changes.
The functioning of the photosynthetic apparatus can respond sensitively to environmental disturbances. Moder-ate drought typically impacts stomata, while metabolic and structural changes are provoked by severe or long-lasting drought (Jedmowski et al. 2013). Salt stress may also reduce the performance of the photosynthetic apparatus, mostly by the disorder of the electron transport system (Kalaji et al. 2016). Although chlorophyll content of plant leaves has been indicated as a good stress indicator (Li et al. 2006; Mehta et al. 2010; Ueda et al. 2003; Chaves et al. 2009), it could be only confirmed in experiment III (Fig. 3). Chlorophyll content may be diluted by a higher plant biomass similarly to macro- and micro-element concentrations of the shoot. A stress-induced decrease of biomass may, therefore, miti-gate the parallel decline of chlorophyll content. Absence of growth retardation in experiment III hence may have contributed to expose the temporal decline in chlorophyll concentration during the duration of the experiment. No dif-ference compared to the SPAD values of control plants was observed 3 weeks after the stress treatment started (SPAD3)
which gradually had a higher impact after 6 and 9 weeks with 7% and 16% PC2 loading values, respectively (Fig. 3b).
Fv/Fm values were measured in all three experiment, but uniformly this parameter was not among the good stress indicators, in accordance with other studies with the same and other plant species (Andersone et al. 2012; Nakayama et al. 2007; Ohashi et al. 2006).
Physiological state of plants is well reflected by their relationship with their microsymbiont partners. A functional symbiosis requires a sensitive balance between the plant and mycorrhizal fungi or nodulating rhizobium bacteria thereby any changes in the plant will affect the symbionts and vice versa (Füzy et al. 2008a). N2 fixation has been reported to decrease early in a drying soil (Serraj et al. 1990). Besides, drought may decrease nodule number and nodule biomass as well (Sinclair et al. 1988; Smith et al. 1988). Mycorrhizal colonization could be diminished (Al-Karaki et al. 2004) but also enhanced (Füzy et al. 2008a, b) by drought stress. Salinity stress may also influence the symbiotic relation-ship (Al-Karaki 2000; Kaya et al. 2009; Wu et al. 2010). Both soybean and sea aster are highly mycorrhiza depend-ent plants (Carvalho 2001; Howeler et al. 1987) which may have caused that mycorrhizal colonization parameters are only moderately strong stress indicators in experiment II and stress treatments had almost no effect on colonization rates in experiment III. Plants with weaker mycorrhiza depend-ency may respond to stress more sensitively through their symbiotic parameters.
Fact
or 2
: 16.
5 %
Factor 1: 30.3 %
GD GS
GDS GC
AD AS
ADS AC
LD LS
LDS LC
A
0.04%0.04%0.07%0.46%0.76%0.97%1.29%1.95%2.05%2.56%2.62%
3.67%4.85%
7.16%7.88%8.42%
11.76%13.08%
14.30%16.07%
0% 5% 10% 15% 20%
TTCM
RDMA
SPAD3ET
FLW9SDMLL4
Fv/FmFv/F0RWCCOL7
SPAD6DL7
MSIRMSISLN4
SPAD9LN2
B
Fig. 3 The result of PCA in experiment III. a Projection of the cases on factor-plane (G/A/L: inoculation treatments Glomus geosporum strain/soil with indigenous AM fungi from artemisia steppe/soil
with indigenous AM fungi from short grass pasture, C/D/S: con-trol/drought/salt stressed plants), b the PC1 loading values of the 20 measured parameters (abbreviations of the traits are in Table 1)
Acta Physiologiae Plantarum (2019) 41:56
1 3
56 Page 8 of 10
Root capacitance measurement (EC) is a promising method in plant stress research, which is adequate for assess-ing root growth, length and surface area, as well as activity (Cseresnyés et al. 2013). Although an excellent monitor-ing tool, it is hardly adaptable for species with basal rosette leaves. The simple and non-intrusive record of both struc-tural and functional characteristics makes EC measurement an excellent method for stress indication as it was shown in experiment (I) and (II) Likewise, membrane stability index (MSI) seemed to be a relevant stress indicator (Figs. 1a, 3a), which proved to be one of the key factors of variations especially when other obvious parameters did not show dif-ferences or could not be measured, as in experiment (III) Although not the most sensitive parameter, MSI is widely used to indicate stress conditions for several species and circumstances (Blum and Ebercon 1981; Bajji et al. 2002; Tripathy et al. 2000; Bouslama 1984). In contrast with numerous literature (Brini et al. 2009; Rahnama et al. 2010) the stomatal conductance measured in experiment I was not the most sensitive physological parameter either.
Time, cost of materials and especially the allocation of human resources are fundamental factors in the feasibility of experiments. It is, therefore, crucial to investigate plant parameters which are sensitive enough to minimize costs and labour with the highest benefits in meaningful data. Nonetheless, it is equally important not to underestimate the number of parameters which will properly characterize the often very slight or even highly complex phenological or functional changes a stress situation may cause. Stress responses may often lead to biomass differences and dilution of certain metabolites or nutrients in non-stressed individu-als which can disturb the assessment of their parallel stress-related decrease in treated plants.
Consequently, it seems that chlorophyll content or func-tional parameters of the photosynthetic system are useful stress indicators preferably when plant biomass is constant among treatments. MSI and EC proved to be the most highly sensitive parameters that reliably detected even minute dif-ferences in plants as a consequence of stress conditions.
Author contribution statement AF designed drought stress experiment with soybean, determined root colonization parameters, read the relevant literature, carried out statis-tical analysis and wrote the paper. RK designed sea aster experiment with salt and drought stress, carried out root vitality test and membrane stability index measurements. IC and KR designed the salt stress experiment with wheat cultivars and carried out electrical measurements. IP meas-ured photosynthetic parameters of plants and contributed to writing and language revision of the paper. TSK carried out ethylene production measurements. BK completed plant cultivation, plant growth monitoring, biomass measure-ments and observed stress symptoms. TT designed the plant
experiments, carried out plant physiological investigations, read the relevant literature and participated in writing the paper. All authors read the manuscript and approved the submission.
Acknowledgements Open access funding provided by MTA Centre for Agricultural Research (MTA ATK). The project has been imple-mented with the support provided from the National Research, Devel-opment and Innovation Fund of Hungary (project nos. 108572 and 115714, financed under the K-16 funding scheme), Research Institute of Organic Agriculture (05-Gv/80-1/2013) and János Bolyai Research Scholarship of the Hungarian Academy of Sciences.
Open Access This article is distributed under the terms of the Crea-tive Commons Attribution 4.0 International License (http://creat iveco mmons .org/licen ses/by/4.0/), which permits unrestricted use, distribu-tion, and reproduction in any medium, provided you give appropriate credit to the original author(s) and the source, provide a link to the Creative Commons license, and indicate if changes were made.
References
Ahanger MA, Tyagi SR, Wani MR, Ahmad P (2014) Drought toler-ance: role of organic osmolytes, growth regulators, and mineral nutrients. In: Ahmed P, Wani MR (eds) Physiological mechanisms and adaptation strategies in plants under changing environment. Springer, New York, pp 25–55
Al-Karaki GN (2000) Growth of mycorrhizal tomato and mineral acquisition under salt stress. Mycorrhiza 10:51–54
Al-Karaki G, McMichael B, Zak J (2004) Field response of wheat to arbuscular mycorrhizal fungi and drought stress. Mycorrhiza 14:263–269
Andersone U, Samsone I, Ievinsh G (2012) Protection of photosynthe-sis in coastal salt marsh plants Aster tripolium and Hydrocotyle vulgaris in conditions of increased soil salinity. Environ Exp Biol 10: 89–97
Bajji M, Kinet JM, Lutts S (2002) The use of the electrolyte leakage method for assessing cell membrane stability as a water stress tolerance test in durum wheat. Plant Growth Reg 36:61–70
Barea JM, Azcón R, Azcón-Aguilar C (2002) Mycorrhizosphere inter-actions to improve plant fitness and soil quality. A van Leeuw J Microb 81:343–351
Barrs HD, Weatherley PE (1962) A re-examination of the relative tur-gidity technique for estimating water deficits in leaves. Aust J Biol Sci 15:413–428
Bassi PK, Spencer MS (1989) Methods for the quantification of ethyl-ene produced by plants. In: Linskens HF, Jacksons JF (eds) Gases in plant and microbial cells. Modern methods of plant analysis. Springer, Berlin, pp 309–321
Berger JD, Ludwig C (2014) Contrasting adaptive strategies to terminal drought-stress gradients in Mediterranean legumes: phenology, productivity, and water relations in wild and domesticated Lupinus luteus L. J Exp Bot 65:6219–6229
Berger B, Parent B, Tester M (2010) High-throughput shoot imaging to study drought responses. J Exp Bot 61:3519–3528
Blum A, Ebercon A (1981) Cell membrane stability as a measure of drought and heat tolerance in wheat 1. Crop Sci 21:43–47
Bouslama M, Schapaugh WT (1984) Stress tolerance in soybeans. I. Evaluation of three screening techniques for heat and drought tol-erance 1. Crop Sci 24:933–937
Acta Physiologiae Plantarum (2019) 41:56
1 3
Page 9 of 10 56
Brini F, Amara I, Feki K, Hanin M, Khoudi H, Masmoudi K (2009) Physiological and molecular analyses of seedlings of two Tuni-sian durum wheat (Triticum turgidum L. subsp. Durum [Desf.]) varieties showing contrasting tolerance to salt stress. Acta Physiol Plant 31:145–154
Carvalho LM, Cacador I, Martins-Loucao MA (2001) Temporal and spatial variation of arbuscular mycorrhizas in salt marsh plants of the Tagus estuary (Portugal). Mycorrhiza 11:303–309
Chaves MM, Flexas J, Pinheiro C (2009) Photosynthesis under drought and salt stress: regulation mechanisms from whole plant to cell. Ann Bot 103:551–560
Chen D, Neumann K, Friedel S, Kilian B, Chen M, Altmann T, Klukas C (2014) Dissecting the phenotypic components of crop plant growth and drought responses based on high-throughput image analysis. Plant Cell 26:4636–4655
Clemensson-Lindell A, Persson H (1995) Fine-root vitality in a Nor-way spruce stand subjected to various nutrient supplies. Plant Soil 168:167–172
Cristescu SM, Mandon J, Arslanov D, De Pessemier J, Hermans C, Harren FJ (2012) Current methods for detecting ethylene in plants. Ann Bot 111:347–360
Cseresnyés I, Rajkai K, Vozáry E (2013) Role of phase angle meas-urement in electrical impedance spectroscopy. Int Agrophys 27:377–383
Cseresnyés I, Rajkai K, Takács T (2016) Indirect monitoring of root activity in soybean cultivars under contrasting moisture regimes by measuring electrical capacitance. Acta Physiol Plant 38:121
Dresler S, Hanaka A, Bednarek W, Maksymiec W (2014) Accumula-tion of low-molecular-weight organic acids in roots and leaf seg-ments of Zea mays plants treated with cadmium and copper. Acta Physiol Plant 36:1565–1575
Farooq M, Wahid A, Kobayashi N, Fujita D, Basra SMA (2009) Plant drought stress: effects, mechanisms and management. Agron Sus-tain Dev 29:185–212
Füzy A, Tóth T, Biró B (2008a) Mycorrhizal colonisation can be altered by the direct and indirect effect of drought and salt in a split root experiment. Cereal Res Commun 35:401–404
Füzy A, Biró B, Tóth T, Hildebrandt U, Bothe H (2008b) Drought, but not salinity determines the apparent effectiveness of halo-phytes colonized by arbuscular mycorrhizal fungi. J Plant Phsyol 165:1181–1192
Gaspar T, Franck T, Bisbis B, Kevers C, Jouve L, Hausman JF, Dommes J (2002) Concepts in plant stress physiology. Applica-tion to plant tissue cultures. Plant Growth Regul 37:263–285
González L, González-Vilar M (2007) Determination of relative water content. In: Reigosa MJR (ed) Handbook of plant ecophysiology techniques. Kluwer Academic Publishers, Dordrecht, pp 207–212
Gray AJ (1974) The genecology of salt marsh plants. Aquat Ecol 8:152–165
Grümberg BC, Urcelay C, Shroeder MA, Vargas-Gil S, Luna CM (2015) The role of inoculum identity in drought stress mitiga-tion by arbuscular mycorrhizal fungi in soybean. Biol Fertil Soils 51:1–10
He M, Dijkstra FA (2014) Drought effect on plant nitrogen and phos-phorus: a meta-analysis. New Phytol 204:924–931
Högberg P, Read DJ (2006) Towards a more plant physiological per-spective on soil ecology. Trends Ecol Evol 2:548–554
Howeler RH, Sieverding E, Saif S (1987) Practical aspects of mycor-rhizal technology in some tropical crops and pastures. Plant Soil 100:249–283
Hu Y, Schmidhalter U (2005) Drought and salinity: a comparison of their effects on mineral nutrition of plants. J Plant Nutr Soil Sc 168:541–549
James JJ, Tiller RL, Richards JH (2005) Multiple resources limit plant growth and function in a saline-alkaline desert community. J Ecol 93:113–126
James RA, von Caemmerer S, Condon AT, Zwart AB, Munns R (2008) Genetic variation in tolerance to the osmotic stress component of salinity stress in durum wheat. Funct Plant Biol 35:111–123
Jedmowski C, Ashoub A, Brüggemann W (2013) Reactions of Egyptian landraces of Hordeum vulgare and Sorghum bicolor to drought stress, evaluated by the OJIP fluorescence transient analysis. Acta Physiol Plant 35:345–354
Kalaji HM, Jajoo A, Oukarroum A, Brestic M, Zivcak M, Samborska IA, Cetner MD, Łukasik I, Goltsev V, Ladle RJ (2016) Chloro-phyll a fluorescence as a tool to monitor physiological status of plants under abiotic stress conditions. Acta Physiol Plant 38:102
Kaya C, Ashraf M, Sonmez O, Aydemir S, Tuna AL, Cullu MA (2009) The influence of arbuscular mycorrhizal colonisation on key growth parameters and fruit yield of pepper plants grown at high salinity. Sci Hortic 121:1–6
Kjeldahl JZ (1883) A new method for the determination of nitrogen in organic bodies. Z Anal Chem 22:366–383
Krause GH, Weis E (1984) Chlorophyll fluorescence as a tool in plant physiology. Photosynth Res 5:139–157
Ku YS, Au-Yeung WK, Yung YL, Li MW, Wen CQ, Liu X, Lam HM (2013) Drought stress and tolerance in soybean. In A comprehen-sive survey of international soybean research-genetics, physiol-ogy, agronomy and nitrogen relationships. InTech New York
Latef AAHA, Chaoxing H (2014) Does inoculation with Glomus mosseae improve salt tolerance in pepper plants? J Plant Growth Regul 33:644–653
Li RH, Guo PG, Michael B, Stefania G, Salvatore C (2006) Evaluation of chlorophyll content and fluorescence parameters as indicators of drought tolerance in barley. Agric Sci China 5:751–757
Li L, Zhang Q, Huang D (2014) A review of imaging techniques for plant phenotyping. Sensors 14:20078–20111
Maruyama K, Urano K, Yoshiwara K, Morishita Y, Sakurai N, Suzuki H, Kojima M, Sakakibara H, Shibata D, Saito K, Shinozaki K (2014) Integrated analysis of the effects of cold and dehydration on rice metabolites, phytohormones, and gene transcripts. Plant Physiol 164:1759–1771
Mehta P, Jajoo A, Mathur S, Bharti S (2010) Chlorophyll a fluores-cence study revealing effects of high salt stress on photosystem II in wheat leaves. Plant Physiol Bioch 48:16–20
Munns R (2002) Comparative physiology of salt and water stress. Plant Cell Environ 25:239–250
Nakayama N, Saneoka H, Moghaieb RE, Premachandra GS, Fujita K (2007) Response of growth, photosynthetic gas exchange, translo-cation of 13C-labelled photosynthate and N accumulation in two soybean (Glycine max L. Merrill) cultivars to drought stress. Int J Agr Biol 9:669–674
Ohashi Y, Nakayama N, Saneoka H, Fujita K (2006) Effects of drought stress on photosynthetic gas exchange, chlorophyll fluorescence and stem diameter of soybean plants. Biol Plant 50:138–141
Phillips JM, Hayman DS (1970) Improved procedures for clearing roots and staining parasitic and VAM fungi for rapid assessment of infection. Trans Br Mycol Soc 55:158–161
Porra RJ, Thompson WA, Kreidemann PE (1989) Determination of accurate extinction coefficients and simultaneous equations for assaying chlorophylls a and b extracted with four different sol-vents: verification of the concentration of chlorophyll standards by atomic absorption spectroscopy. BBA Bioenerg 975:384–394
Rahnama A, James RA, Poustini K, Munns R (2010) Stomatal con-ductance as a screen for osmotic stress tolerance in durum wheat growing in saline soil. Funct Plant Biol 37:255–263
Roger MJR (2001) Handbook of plant ecophysiology techniques. Klu-wer Academic Publishers, Dordrecht
Sairam RK, Deshmukh PS, Shukla DS (1997) Tolerance to drought and temperature stress in relation to increased antioxidant enzyme activity in wheat. J Agron Crop Sci 178:171–177
Acta Physiologiae Plantarum (2019) 41:56
1 3
56 Page 10 of 10
Salvatori E, Fusaro L, Gottardini E, Pollastrini M, Goltsev V, Strasser RJ, Bussotti F (2014) Plant stress analysis: application of prompt, delayed chlorophyll fluorescence and 820 nm modulated reflec-tance. Insights from independent experiments. Plant Physiol Bioch 85:105–113
Schauer N, Fernie AR (2006) Plant metabolomics: towards biological function and mechanism. Trends Plant Sci 11:508–516
Serraj R, Sinclair TR, Purcell LC (1990) Symbiotic N2 fixation response to drought. J Exp Bot 50:143–155
Shennan C, Hunt R, Macrobbie EAC (1987) Salt tolerance in Aster tripolium L. I. The effect of salinity on growth. Plant Cell Environ 10:59–65
Shulaev V, Cortes D, Miller G, Mittler R (2008) Metabolomics for plant stress response. Physiol Plant 132:199–208
Sinclair TR, Zimet AR, Muchow RC (1988) Changes in soybean nod-ule number and dry weight in response to drought. Field Crop Res 18:197–202
Smith DL, Dijak M, Hume DJ (1988) The effect of water deficit on N2 (C2H2) fixation by white bean and soybean. Can J Plant Sci 68:957–967
Strasser RJ (1988) A concept for stress and its application in remote sensing. Applications of chlorophyll fluorescene. In: Photosynthe-sis research, stress physiology, hydrobiology and remote sensing. Springer, Dordrecht, pp 333–337
Sutka M, Li G, Boudet J, Boursiac Y, Doumas P, Maurel (2011) Natu-ral variation of root hydraulics in Arabidopsis grown in normal and salt-stressed conditions. Plant Physiol 155:1264–1276
Talaat NB, Shawky BT, Ibrahim AS (2015) Alleviation of drought-induced oxidative stress in maize (Zea mays L.) plants by dual application of 24-epibrassinolide and spermine. Environ Exp Bot 113:47–58
Tripathy JN, Zhang J, Robin S, Nguyen TT, Nguyen HT (2000) QTLs for cell-membrane stability mapped in rice (Oryza sativa L.) under drought stress. Theoretical Appl Gen 100:1197–1202
Trouvelot A, Kough JL, Gianinazzi-Pearson V (1989) Mesure du taux de mycorhization VA d’un systeme radiculaire. Recherche de
methodes d’estimation ayant une significantion fonctionnelle. In: Gianinazzi-Pearson V, Gianinazzi S (eds) Physiological and genetic aspects of mycorrhizae. INRA, Paris, pp 217–221
Tsimilli-Michael M, Strasser RJ (2008) In vivo assessment of stress impact on plant’s vitality: applications in detecting and evaluating the beneficial role of mycorrhization on host plants. In Mycorrhiza (ed). pp 679–703. Springer Berlin Heidelberg
Ueda A, Kanechi M, Uno Y, Inagaki N (2003) Photosynthetic limita-tions of a halophyte sea aster (Aster tripolium L) under water stress and NaCl stress. J Plant Res 116:63–68
Verslues PE, Agarwal M, Katiyar-Agarwal S, Zhu J, Zhu JK (2006) Methods and concepts in quantifying resistance to drought, salt and freezing, abiotic stresses that affect plant water status. Plant J 45:523–539
Vollenweider P, Günthardt-Goerg MS (2005) Diagnosis of abiotic and biotic stress factors using the visible symptoms in foliage. Environ Pollut 137:455–465
Wehner G, Balko C, Enders M, Humbeck K, Ordon F (2015) Identifica-tion of genomic regions involved in tolerance to drought stress and drought stress induced leaf senescence in juvenile barley. BMC Plant Biol 15:125
Wu QS, Zou YN, He XH (2010) Contributions of arbuscular mycor-rhizal fungi to growth, photosynthesis, root morphology and ionic balance of citrus seedlings under salt stress. Acta Physiol Plant 32:297–304
Zhang M, Jin ZQ, Zhao J, Zhang G, Wu F (2015) Physiological and biochemical responses to drought stress in cultivated and Tibetan wild barley. Plant Growth Regul 75:567–574
Publisher’s Note Springer Nature remains neutral with regard to jurisdictional claims in published maps and institutional affiliations.