pcp - physiological chemistry and physics
TRANSCRIPT
W. Drost-HansenLaboratorium DrostWilliamsburg, Virginia 23188-9415
Ludwig EdelmannAnatomie und ZellbiologieUniversitdt des SaarlandesD-66421 Homburg (Saar), Germany
Carlton F. HazlewoodResearch Consultants InternationalP.O. Box 130282The Woodlands, Texas 77393
Ferdinand HeinmetsTechnology IncorporatedP.O. Box 790644San Antonio, Texas 78279-0644
S.R. KasturiTata Institute of Fundamental ResearchMumbai 400 005, India
Miklós KellermayerDepartment of Clinical ChemistryUniversity Medical SchoolPécs, 7624 Hungary
Janos LadikInstitute of Physics and Theoretical ChemistryUniversity of Erlangen-NurnbergD-8520 ErlangenGermany
George M. MrevlishviliDepartment of PhysicsTbilisi State University380028 TbilisiRepublic of Georgia
Physiological Chemistry and Physicsand Medical NMRVolume 40, 2008
Addresses of Chief Editor and Editorial College
Chief Editor
Gilbert N. LingP.O Box 1452Melville, New York 11747
Editorial College
O. D. BonnerDepartment of ChemistryUniversity of South CarolinaColumbia, South Carolina 29208
Harris BuschDepartment of PharmacologyBaylor College of MedicineHouston, Texas 77030
Ivan L. CameronDepartment of AnatomyUniversity of Texas Health Science CenterSan Antonio, Texas 78284
Doriano CavalliniInstitute of Biological ChemistryUniversity of Rome00185 Rome, Italy
James S. CleggBodega Marine LaboratoryUniversity of CaliforniaBodega Bay, California 94923
George H. CzerlinskiLeibnitz Foundation InstituteP.O. Box 20091Sedona, Arizona 86341-0091

Denys WheatleyBioMedESLeggat House, KeithallInverurieAberdeen AB51 OLXUnited Kingdom
Toshihiko UbukaDepartment of Clinical NutritionKawasaki University of Medical WelfareKurashiki, Okayama, 701-0193, Japan
EDITORIAL AND BUSINESS OFFICE
Physiological Chemistry and Physicsand Medical NMRP.O. Box 1452
Melville, New York 11747
Editor In Chief, Dr. Gilbert N. LingManaging Editor, Margaret M. Ochsenfeld
SCOPE: PCP provides a forum for the review and publication of reports of original re-search in a broad range of subjects in biophysics, biochemistry and cellular physiology.Reports of direct applications of basic knowledge to human studies are invited; exampleswould include the measurements of relaxation times as part of NMR imaging. Singleexperiments, conclusions based on inadequate statistics, purely speculative papers, andclinical case reports are not accepted.
POLICY: The pages of PCP are accessible to competing viewpoints, interpretations,theories and opinions. Debate is invited via Editorial Comments and Letters to the Editor.Criteria for evaluating submissions include soundness of the study and clarity of presen-tation, and papers are not rejected on the basis of interpretation or theory, however con-troversial. PCP believes that scientific issues should be settled by investigation and opendebate, not by an appeal to anonymous authority.PCP attempts to achieve a balance between freedom of expression and constructive peer
review. All papers are refereed by reviewers who may remain anonymous, but the ChiefEditors make all final decisions, and will handle appeals from authors who feel their papersare unfairly reviewed.The Editors endeavor to make decisions regarding acceptance or rejection of manu-
scripts quickly, and have set self-imposed deadlines for doing so. Referees also are givendeadlines.
TYPES OF PAPERS: Regular papers may be experimental or theoretical. Short notes,Priority notes and Letters in response to published papers are invited. Reviews are desired,but authors are urged to contact an Editor before sending a finished review manuscript.Symposia may be published as regular or supplemental issues.
SUBSCRIPTIONS: Price is US$160.00 per volume in the United States and US$170.00outside the United States. Physiological Chemistry and Physics and Medical NMR is pub-lished annually, the volume numbered yearly. New subscriptions will start with the firstissue of the volume in progress, unless the subscriber directs otherwise. Most back issuesare available
Contributions appearing herein do not necessarily reflect views of the publisher, staff orEditorial College.
Instructions to Authors
SUBMISSIONS: An original and two copies of all material are requested. The original must betypewritten on one side only. Papers should be sent to Dr. Gilbert N. Ling, Editor, P.O. Box 1452,Melville, New York 11747 U.S.A. Manuscripts should be submitted only to this journal and nothave been published in part or whole in another publication, except as short preliminary notes, ab-stracts, or as unpublished work in reviews or symposia. Be sure to keep a copy of your manuscript.
NOTE: Referees will be instructed to destroy their copies of the manuscript after reviewing them.We will return only the original manuscript to you for revision or if rejected.
MANUSCRIPTS: All material should be typed double-spaced with margins at least one inch wideand pages numbered consecutively beginning with the title page. In addition to a paper copy, sendan IBM- or Macintosh-compatible file on a CD, in Word or Wordperfect. Title Page should includetitle (of at most 100 characters and spaces), full names of authors as you wish them to be published,names and cities of institutional affiliation(s) of authors and of institution(s) where the studies wereperformed, and name, full address, telephone number, fax number and e-mail address of the personto whom correspondence, proofs, and reprint requests are to be sent. Four to six key words shouldbe listed on the title page. These words will assist indexers. Also, at bottom of title page include ashort running title of 40 characters or less.Abstract should be concise and no longer than 225 words. Body may or may not be divided into In-troduction, Materials and Methods, Results and Discussion, depending on the length and nature ofthe paper. Introductory remarks should indicate clearly the significance of the work presented.References may be indicated in the text and listed in the reference list in whatever style the authorprefers, but we prefer that titles of articles be omitted.
TABLES: Tables should be typewritten on separate sheets and identified by roman numerals(eg. Table III) and titles. Table notes should be keyed by superscript italic lower-case letters(eg. aControl). The approximate locations of tables and figures should be indicated in the marginsof the manuscript.
ILLUSTRATIONS: Original artwork or glossy photostatic prints, together with two photocopies(like Xerox copies) should be provided. Each illustration should be numbered on the back in pencil,along with the authors’ names. It is preferred that line drawings be made on paper that is not largerthan 81/2 by 13 inches, and that the drawing be its intended size in the printed paper. Most figureswill occupy 1/2 to full column, that is 5 inches wide. Lines and lettering should be thick enough toallow reduction. A drawing of overall dimension of 8 by 10 inches that will be reduced to 1/4 of itsoriginal size should be lettered with 18-point (capitals 6 mm high, lower-case 4 mm high) or largerlettering. Glossy photostatic prints are acceptable, and should be attached firmly to a sheet of paperthe same size as the manuscript. Postacceptance: If possible send figures as an image file using TIFFor JPEG formatting scanned at a resolution of 600 dpi.
PHOTOGRAPHS: High-quality black and white glossy prints should be provided in triplicate,and may be provided as one print plus two photocopies if the photocopies are sufficiently clear toportray the original to referees. Photographs should be attached firmly to a sheet of paper the samesize as the manuscript. Photographs that have been scanned and stored as a TIFF file with a reso-lution of 300 dpi may also be submitted.
REFEREES: Two anonymous referees will be sought for each paper. Authors are encouraged tosuggest names and addresses of suitable referees. Referees will be given deadlines for mailingmanuscripts back or phoning reviews in, and will be invited to provide editorial statements orLetters that deal with issues raised by submitted papers.
REPRINTS: An order form is enclosed with proofs sent to authors.
PAGE CHARGES: Page charge is $20.00 per published page. It may be waived in the case ofsevere international exchange difficulties. An additional charge of $15.00 will be levied for photo-graphs that require screening (eg., E.M’s, chromatograms, scans).
Physiol. Chem. Phys. & Med. NMR (2008) 40: 1–42
Water Proton Relaxation Times ofPathological Tissues
Syed Farooq Akber
Department of Radiation OncologyCase Western Reserve University
Cleveland, Ohio 44106Email: [email protected]
Abstract: The spin-lattice relaxation time (T1) and spin-spin relaxation time (T2) of pathologicalhuman and animal tissues are archived to update those already published. The mechanisms for waterproton relaxation times of pathological tissues and the dissimilarities in relaxation times betweennormal and pathological tissues are also briefly reviewed.
KEY WORDS: spin-lattice relaxation time, spin-spin relaxation time, magnetic resonanceimaging, water, tissue characterization, paramagnetic ions.
HAZLEWOOD in 1979 (83) compiled very comprehensive data on relaxation times ofwater protons followed by reports by Bottomley et al (37, 38) and Akber (12). In thispaper, relaxation data of pathological human and animal tissues are compiled from1987–2007.Damadian and his group (54–56) showed that the relaxation times of normal and tu-
morous tissues are different. Several models, theories and hypotheses were put forth to ac-count for the dissimilarities in relaxation times between normal and malignant tissues.The cause of dissimilarities in normal and pathological tissue relaxation times are notclear but nevertheless, have been attributed to water content, paramagnetic ions, proteincontent and oxygen content.Bottomley et al (37, 38) have discussed in detail the relaxation rate dependence on fre-
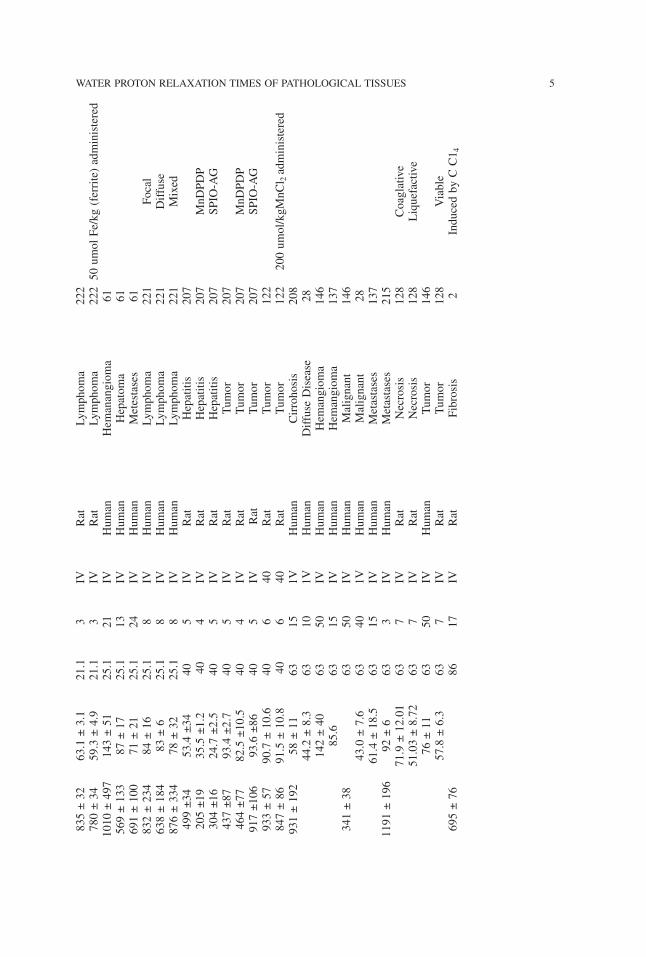
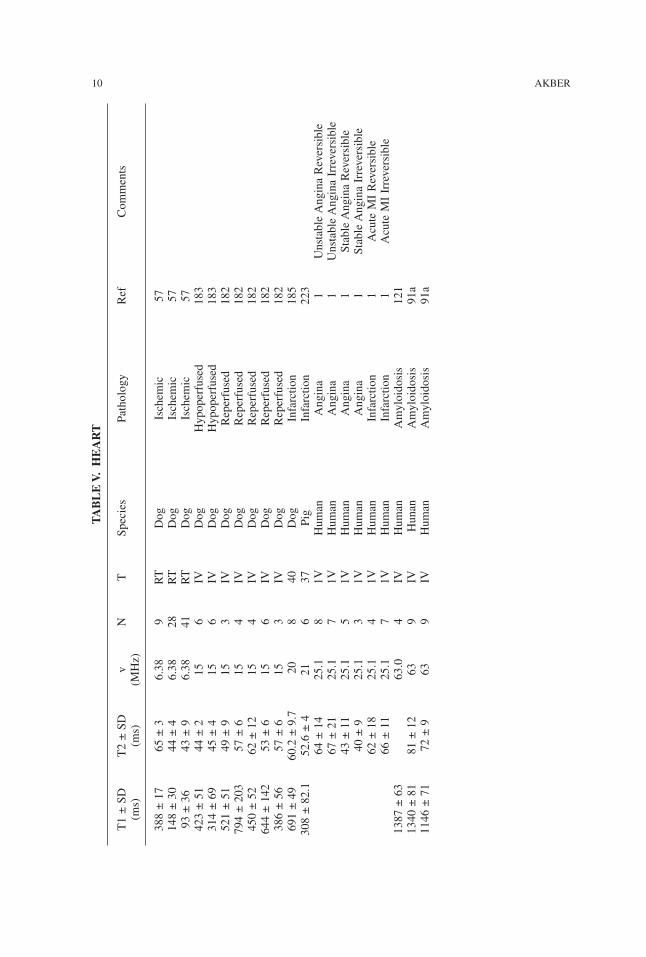
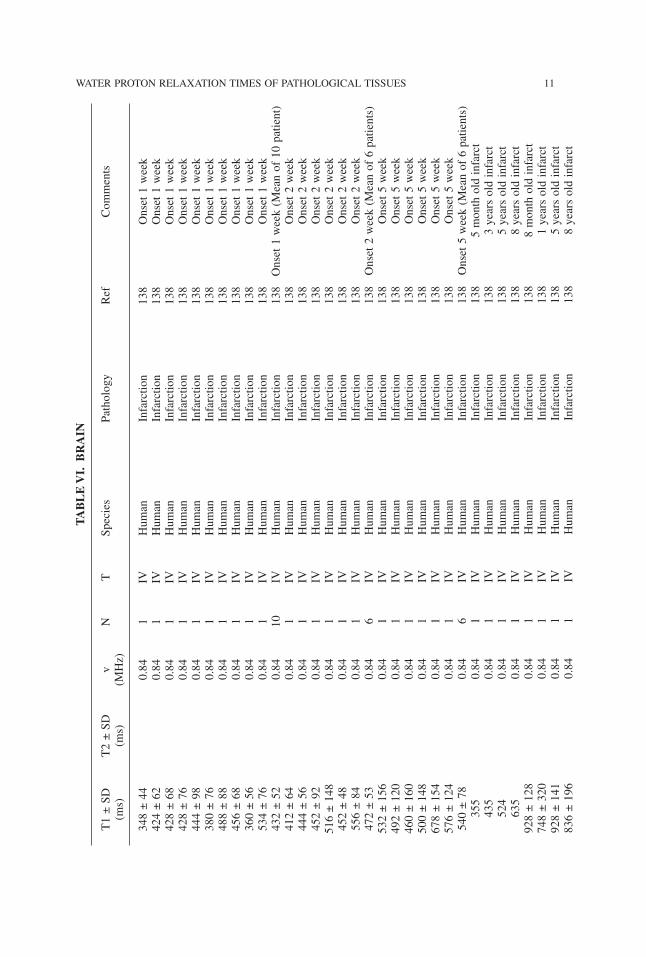
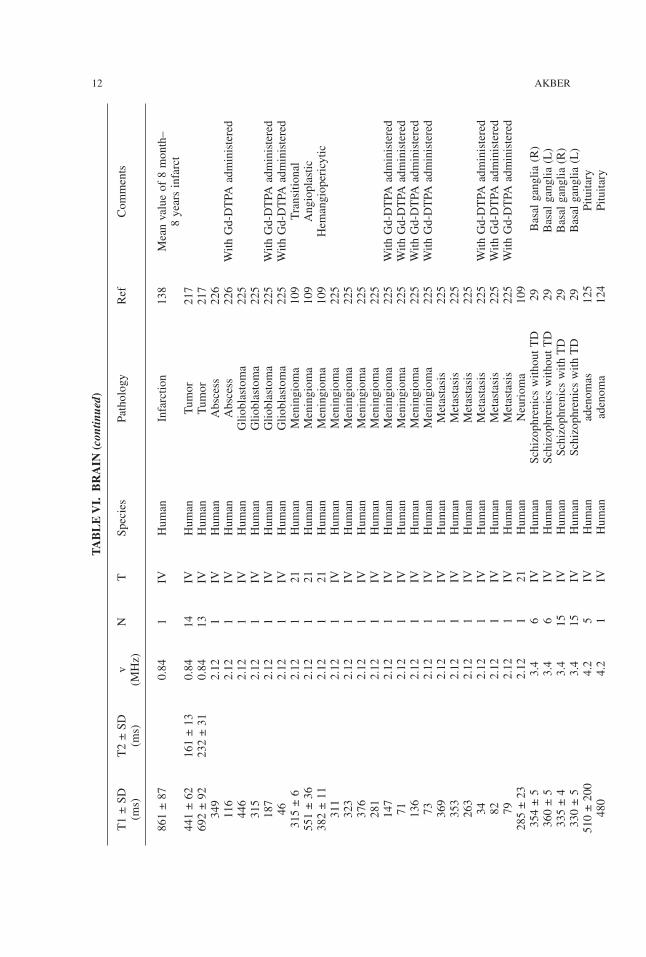
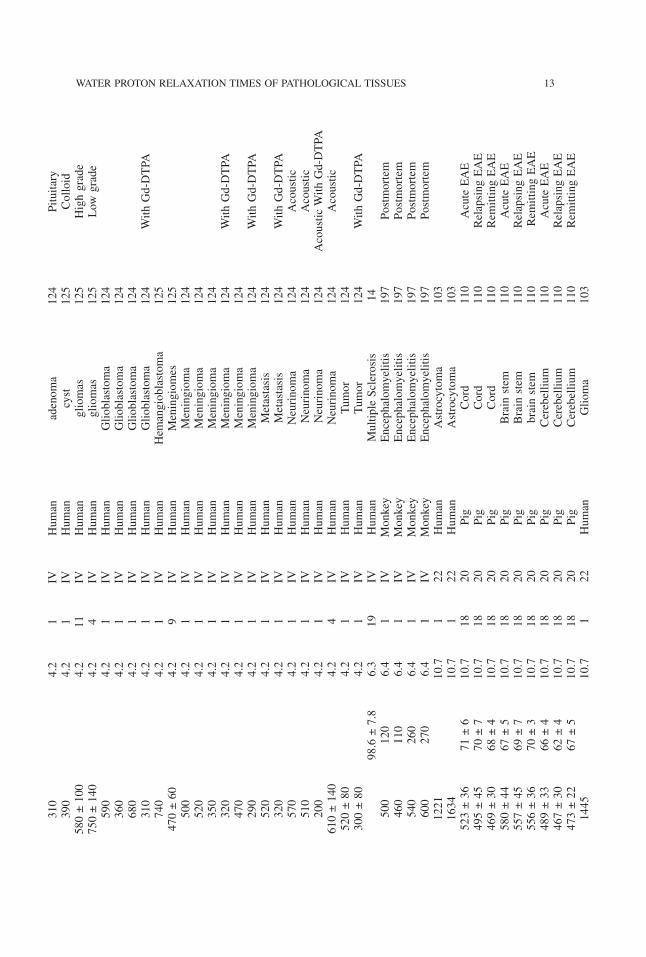
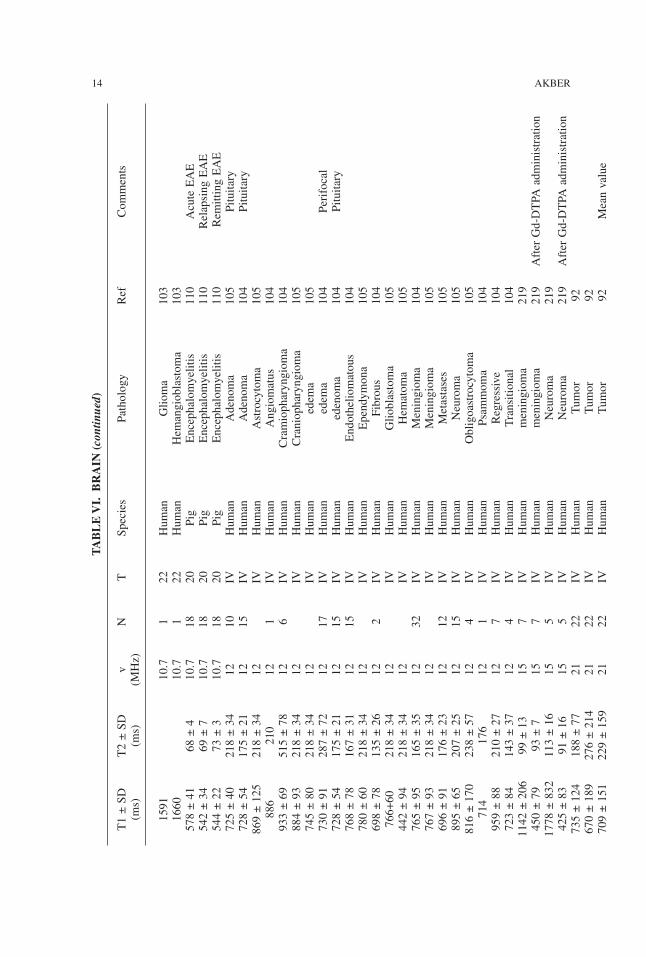
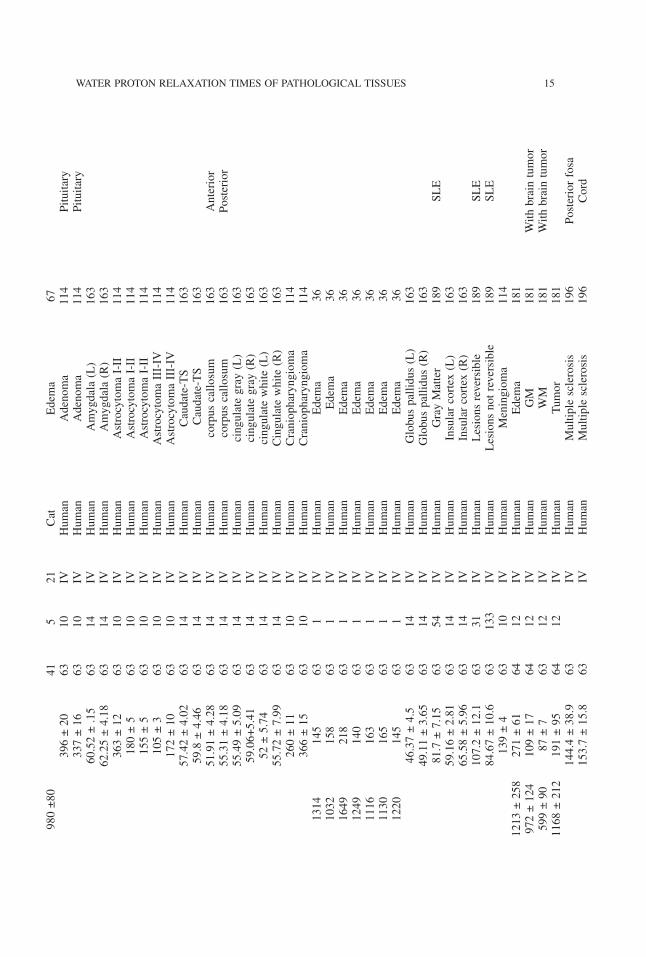
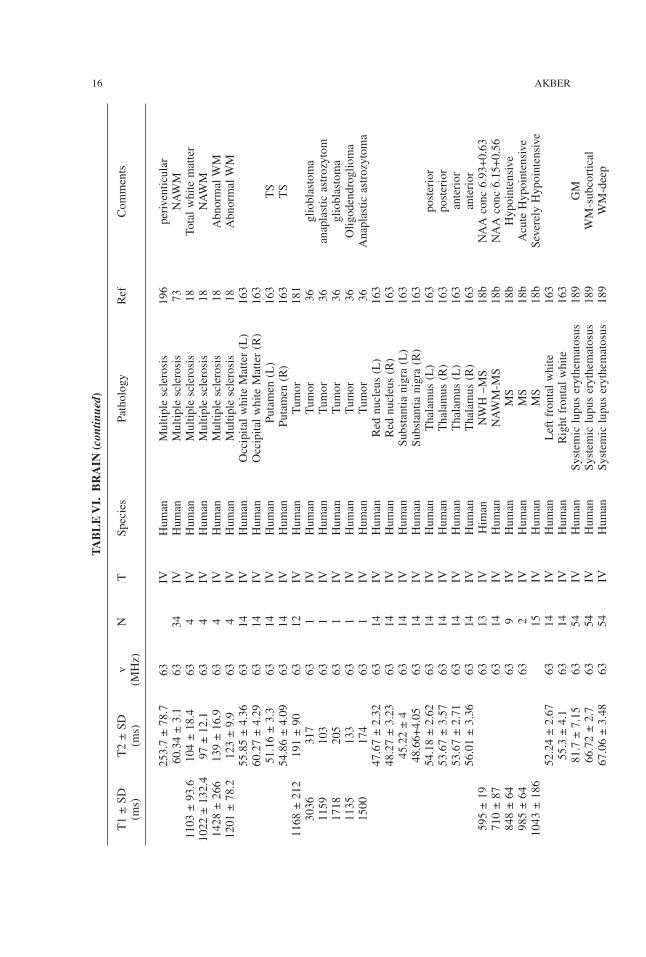
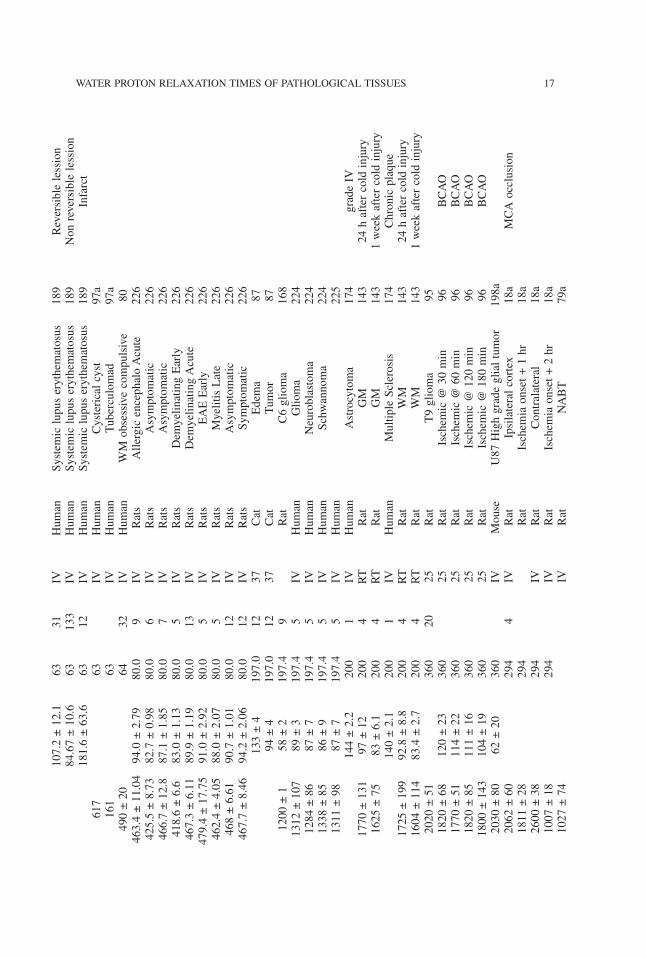
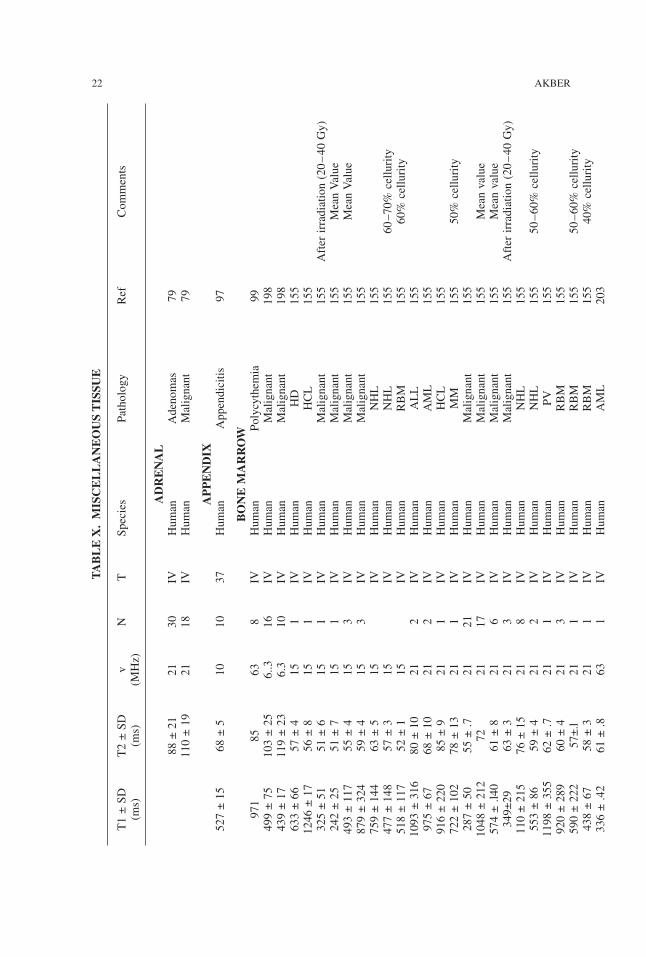
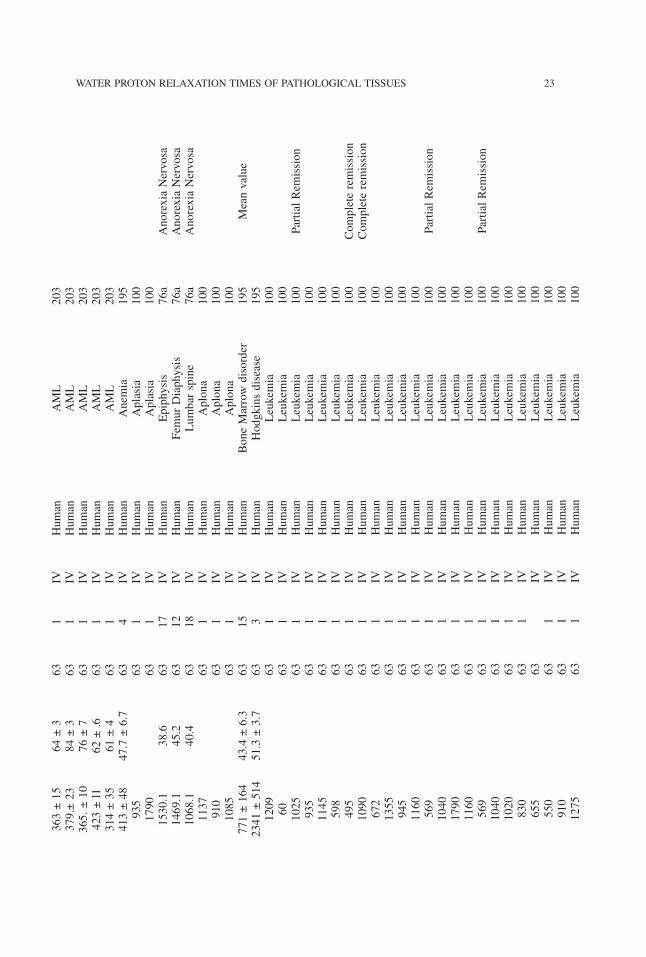
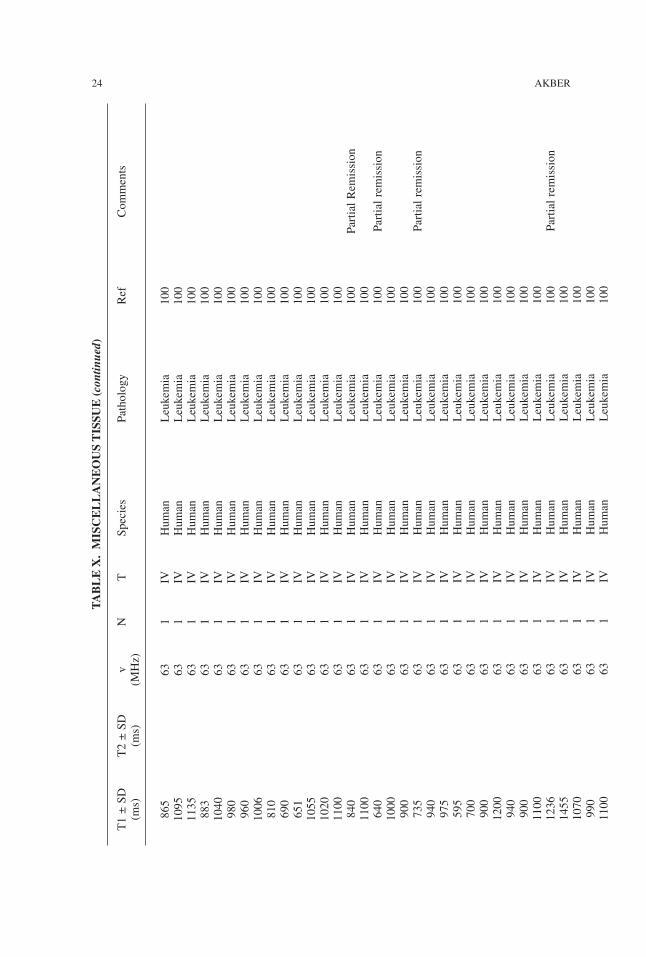
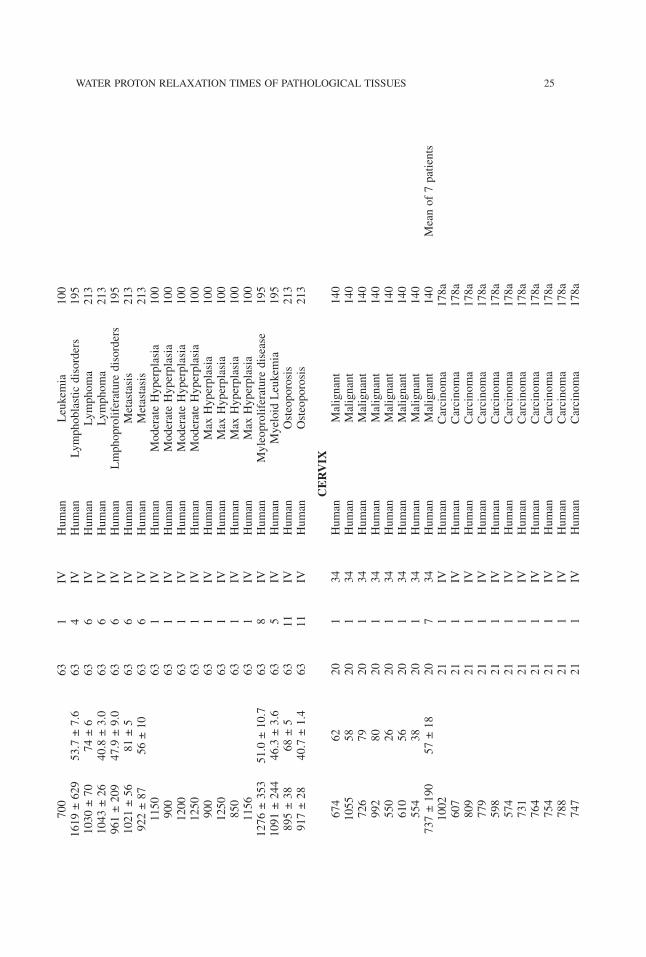
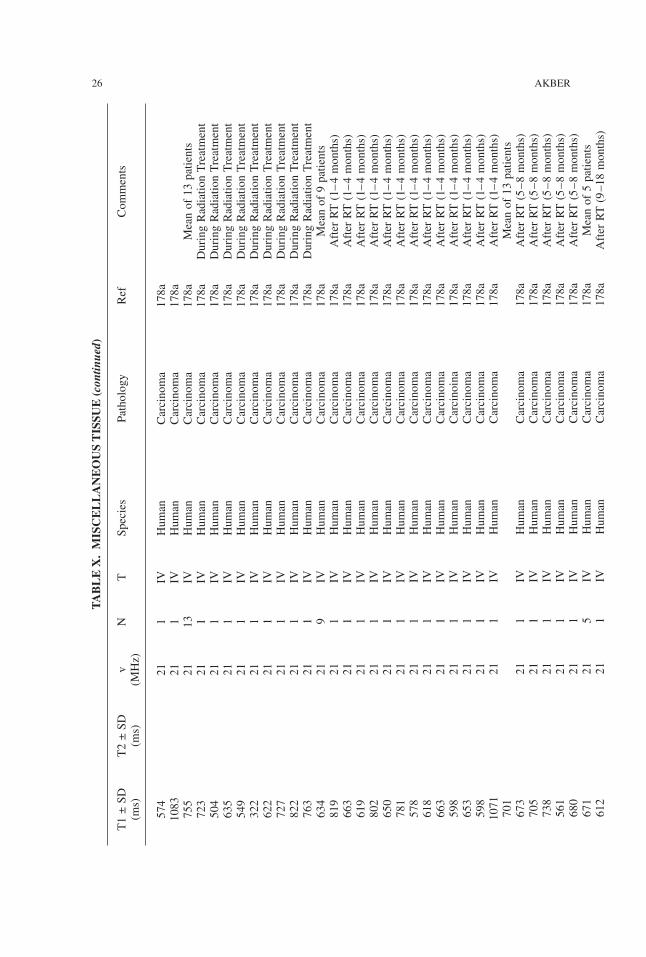
quency, temperature, and excision time, in vitro and in vivo measurements; therefore,these parameters will not be discussed in this report. Hazlewood (83) has discussed ingreat detail the relaxation time models to account for the dissimilarities in relaxation timebetween normal and pathological tissues. Water proton relaxation data of pathological tis-sues of liver, breast, muscle, heart, brain, kidney, lung, spleen, and miscellaneous tissuesare given in Tables II–X. Table I, lists the abbreviations used in tables and text.
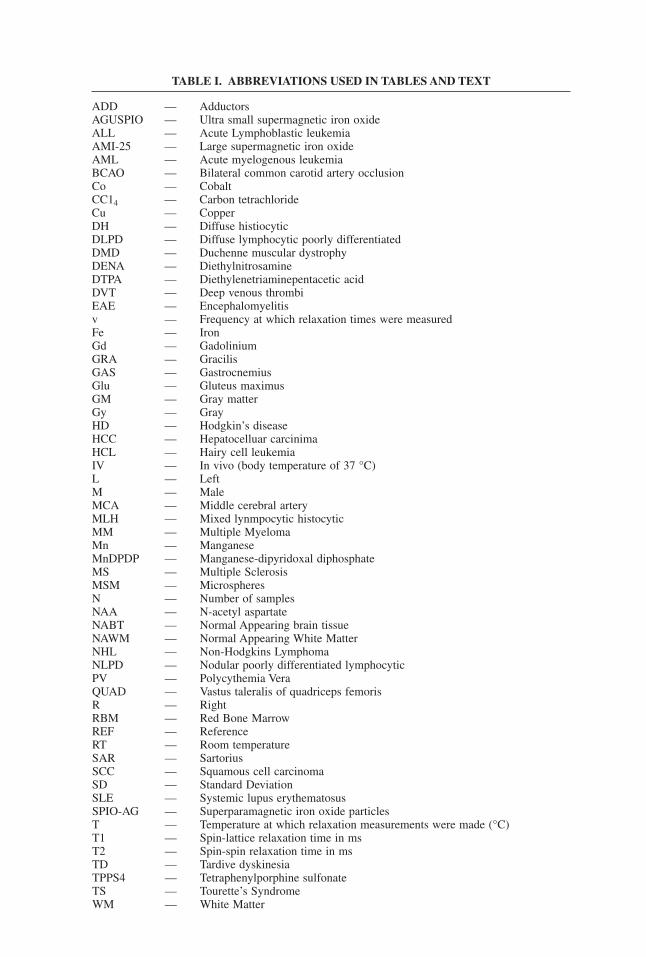
TABLE I. ABBREVIATIONS USED IN TABLES AND TEXT
ADD — AdductorsAGUSPIO — Ultra small supermagnetic iron oxideALL — Acute Lymphoblastic leukemiaAMI-25 — Large supermagnetic iron oxideAML — Acute myelogenous leukemiaBCAO — Bilateral common carotid artery occlusionCo — CobaltCC14 — Carbon tetrachlorideCu — CopperDH — Diffuse histiocyticDLPD — Diffuse lymphocytic poorly differentiatedDMD — Duchenne muscular dystrophyDENA — DiethylnitrosamineDTPA — Diethylenetriaminepentacetic acidDVT — Deep venous thrombiEAE — Encephalomyelitisv — Frequency at which relaxation times were measuredFe — IronGd — GadoliniumGRA — GracilisGAS — GastrocnemiusGlu — Gluteus maximusGM — Gray matterGy — GrayHD — Hodgkin’s diseaseHCC — Hepatocelluar carcinimaHCL — Hairy cell leukemiaIV — In vivo (body temperature of 37 °C)L — LeftM — MaleMCA — Middle cerebral arteryMLH — Mixed lynmpocytic histocyticMM — Multiple MyelomaMn — ManganeseMnDPDP — Manganese-dipyridoxal diphosphateMS — Multiple SclerosisMSM — MicrospheresN — Number of samplesNAA — N-acetyl aspartateNABT — Normal Appearing brain tissueNAWM — Normal Appearing White MatterNHL — Non-Hodgkins LymphomaNLPD — Nodular poorly differentiated lymphocyticPV — Polycythemia VeraQUAD — Vastus taleralis of quadriceps femorisR — RightRBM — Red Bone MarrowREF — ReferenceRT — Room temperatureSAR — SartoriusSCC — Squamous cell carcinomaSD — Standard DeviationSLE — Systemic lupus erythematosusSPIO-AG — Superparamagnetic iron oxide particlesT — Temperature at which relaxation measurements were made (°C)T1 — Spin-lattice relaxation time in msT2 — Spin-spin relaxation time in msTD — Tardive dyskinesiaTPPS4 — Tetraphenylporphine sulfonateTS — Tourette’s SyndromeWM — White Matter
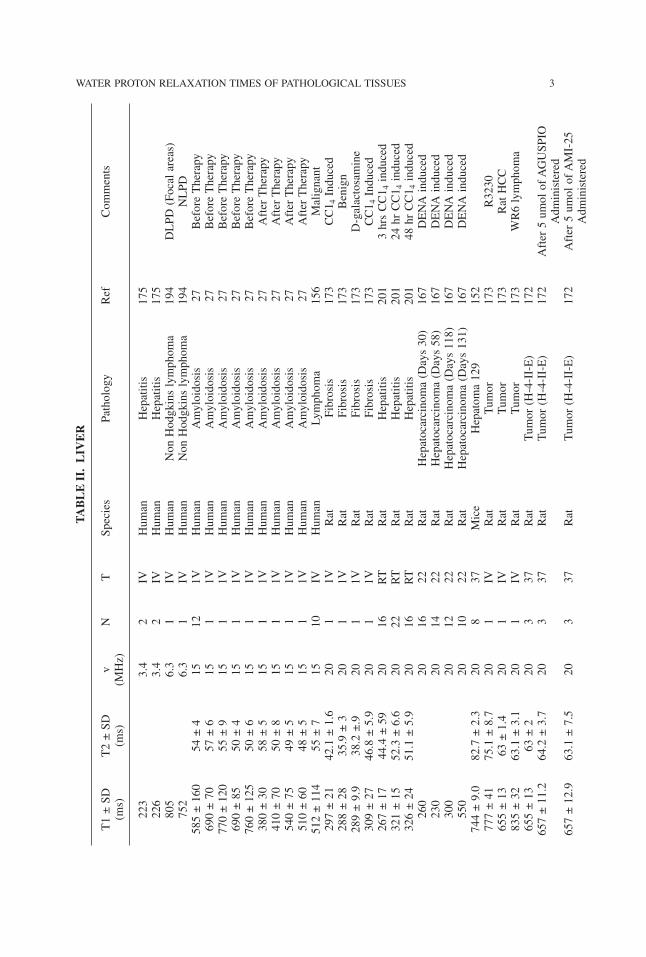
WATER PROTON RELAXATION TIMES OF PATHOLOGICAL TISSUES 3TABLE
II.LIV
ER
T1±SD
T2±SD
vN
TSpecies
Pathology
Ref
Comments
(ms)
(ms)
(MHz)
223
3.4
2IV
Human
Hepatitis
175
226
3.4
2IV
Human
Hepatitis
175
805
6.3
1IV
Human
NonHodgkinslymphoma
194
DLPD
(Focalareas)
752
6.3
1IV
Human
NonHodgkinslymphoma
194
NLPD
585±160
54±4
1512
1VHuman
Amyloidosis
27BeforeTherapy
690±70
57±6
151
1VHuman
Amyloidosis
27BeforeTherapy
770±120
55±9
151
1VHuman
Amyloidosis
27BeforeTherapy
690±85
50±4
151
1VHuman
Amyloidosis
27BeforeTherapy
760±125
50±6
151
1VHuman
Amyloidosis
27BeforeTherapy
380±30
58±5
151
1VHuman
Amyloidosis
27AfterTherapy
410±70
50±8
151
1VHuman
Amyloidosis
27AfterTherapy
540±75
49±5
151
1VHuman
Amyloidosis
27AfterTherapy
510±60
48±5
151
1VHuman
Amyloidosis
27AfterTherapy
512±114
55±7
1510
IVHuman
Lymphoma
156
Malignant
297±21
42.1±1.6
201
1VRat
Fibrosis
173
CC1 4Induced
288±28
35.9±3
201
1VRat
Fibrosis
173
Benign
289±9.9
38.2±.9
201
1VRat
Fibrosis
173
D-galactosamine
309±27
46.8±5.9
201
1VRat
Fibrosis
173
CC1 4Induced
267±17
44.4±59
2016
RT
Rat
Hepatitis
201
3hrsCC1 4induced
321±15
52.3±6.6
2022
RT
Rat
Hepatitis
201
24hrCC1 4induced
326±24
51.1±5.9
2016
RT
Rat
Hepatitis
201
48hrCC1 4induced
260
2016
22Rat
Hepatocarcinoma(Days30)
167
DENAinduced
230
2014
22Rat
Hepatocarcinoma(Days58)
167
DENAinduced
300
2012
22Rat
Hepatocarcinoma(Days118)
167
DENAinduced
550
2010
22Rat
Hepatocarcinoma(Days131)
167
DENAinduced
744±9.0
82.7±2.3
208
37Mice
Hepatoma129
152
777±41
75.1±8.7
201
IVRat
Tumor
173
R3230
655±13
63±1.4
201
IVRat
Tumor
173
RatHCC
835±32
63.1±3.1
201
IVRat
Tumor
173
WR6lymphoma
655±13
63±2
203
37Rat
Tumor(H-4-II-E)
172
657±11.2
64.2±3.7
203
37Rat
Tumor(H-4-II-E)
172
After5umolofAGUSPIO
Administered
657±12.9
63.1±7.5
203
37Rat
Tumor(H-4-II-E)
172
After5umolofAMI-25
Administered
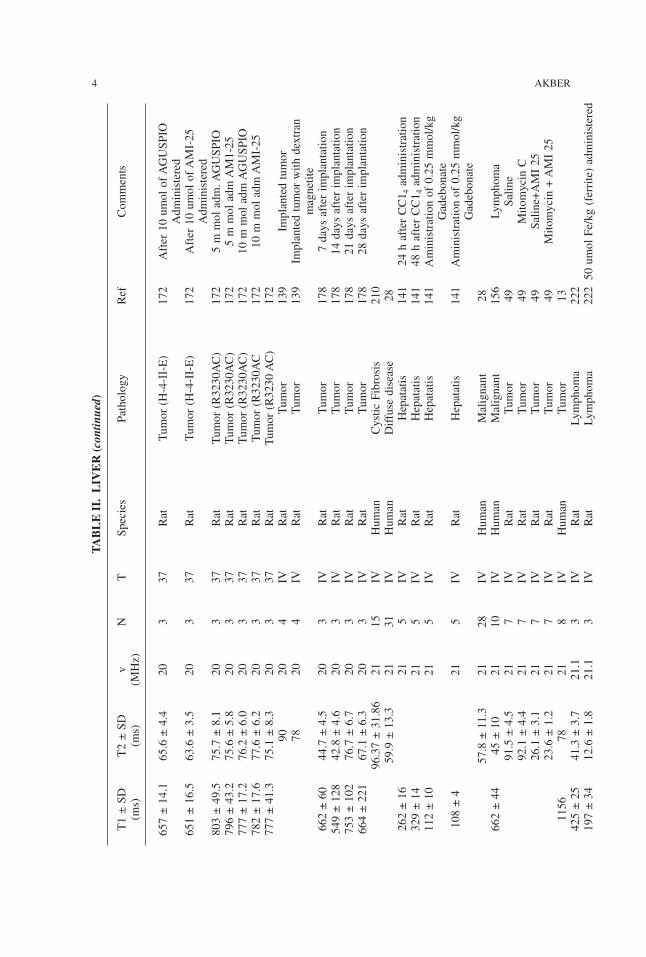
TABLE
II.LIV
ER
(con
tinue
d)
T1±SD
T2±SD
vN
TSpecies
Pathology
Ref
Comments
(ms)
(ms)
(MHz)
657±14.1
65.6±4.4
203
37Rat
Tumor(H-4-II-E)
172
After10umolofAGUSPIO
Administered
651±16.5
63.6±3.5
203
37Rat
Tumor(H-4-II-E)
172
After10umolofAMI-25
Administered
803±49.5
75.7±8.1
203
37Rat
Tumor(R3230AC)
172
5mmoladm.AGUSPIO
796±43.2
75.6±5.8
203
37Rat
Tumor(R3230AC)
172
5mmoladmAM1-25
777±17.2
76.2±6.0
203
37Rat
Tumor(R3230AC)
172
10mmoladmAGUSPIO
782±17.6
77.6±6.2
203
37Rat
Tumor(R3230AC
172
10mmoladmAMI-25
777±41.3
75.1±8.3
203
37Rat
Tumor(R3230AC)
172
9020
4IV
Rat
Tumor
139
Implantedtumor
7820
4IV
Rat
Tumor
139
Implantedtumorwithdextran
magnetite
662±60
44.7±4.5
203
IVRat
Tumor
178
7daysafterimplantation
549±128
42.8±4.6
203
IVRat
Tumor
178
14daysafterimplantation
753±102
76.7±6.7
203
IVRat
Tumor
178
21daysafterimplantation
664±221
67.1±6.3
203
IVRat
Tumor
178
28daysafterimplantation
96.37±31.86
2115
IVHuman
CysticFibrosis
210
59.9±13.3
2131
IVHuman
Diffusedisease
28262±16
215
IVRat
Hepatatis
141
24hafterCC1 4administration
329±14
215
IVRat
Hepatatis
141
48hafterCC1 4administration
112±10
215
IVRat
Hepatatis
141
Aministrationof0.25mmol/kg
Gadebonate
108±4
215
IVRat
Hepatatis
141
Aministrationof0.25mmol/kg
Gadebonate
57.8±11.3
2128
IVHuman
Malignant
28662±44
45±10
2110
IVHuman
Malignant
156
Lymphoma
91.5±4.5
217
IVRat
Tumor
49Saline
92.1±4.4
217
IVRat
Tumor
49MitomycinC
26.1±3.1
217
IVRat
Tumor
49Saline+AMI25
23.6±1.2
217
IVRat
Tumor
49Mitomycin+AMI25
1156
7821
8IV
Human
Tumor
13425±25
41.3±3.7
21.1
3IV
Rat
Lymphoma
222
197±34
12.6±1.8
21.1
3IV
Rat
Lymphoma
22250umolFe/kg(ferrite)administered
4 AKBER
835±32
63.1±3.1
21.1
3IV
Rat
Lymphoma
222
780±34
59.3±4.9
21.1
3IV
Rat
Lymphoma
22250umolFe/kg(ferrite)administered
1010±497
143±51
25.1
21IV
Human
Hemanangioma
61569±133
87±17
25.1
13IV
Human
Hepatoma
61691±100
71±21
25.1
24IV
Human
Metestases
61832±234
84±16
25.1
8IV
Human
Lymphoma
221
Focal
638±184
83±6
25.1
8IV
Human
Lymphoma
221
Diffuse
876±334
78±32
25.1
8IV
Human
Lymphoma
221
Mixed
499±34
53.4±34
405
IVRat
Hepatitis
207
205±19
35.5±1.2
404
IVRat
Hepatitis
207
MnDPDP
304±16
24.7±2.5
405
IVRat
Hepatitis
207
SPIO-AG
437±87
93.4±2.7
405
IVRat
Tumor
207
464±77
82.5±10.5
404
IVRat
Tumor
207
MnDPDP
917±106
93.6±86
405
IVRat
Tumor
207
SPIO-AG
933±57
90.7±10.6
406
40Rat
Tumor
122
847±86
91.5±10.8
406
40Rat
Tumor
122
200umol/kgMnCl 2administered
931±192
58±11
6315
1VHuman
Cirrohosis
208
44.2±8.3
6310
1VHuman
DiffuseDisease
28142±40
6350
IVHuman
Hemangioma
146
85.6
6315
IVHuman
Hemangioma
137
341±38
6350
IVHuman
Malignant
146
43.0±7.6
6340
1VHuman
Malignant
2861.4±18.5
6315
IVHuman
Metastases
137
1191±196
92±6
633
IVHuman
Metastases
215
71.9±12.01
637
IVRat
Necrosis
128
Coaglative
51.03±8.72
637
IVRat
Necrosis
128
Liquefactive
76±11
6350
IVHuman
Tumor
146
57.8±6.3
637
IVRat
Tumor
128
Viable
695±76
8617
IVRat
Fibrosis
2InducedbyCC1 4
WATER PROTON RELAXATION TIMES OF PATHOLOGICAL TISSUES 5
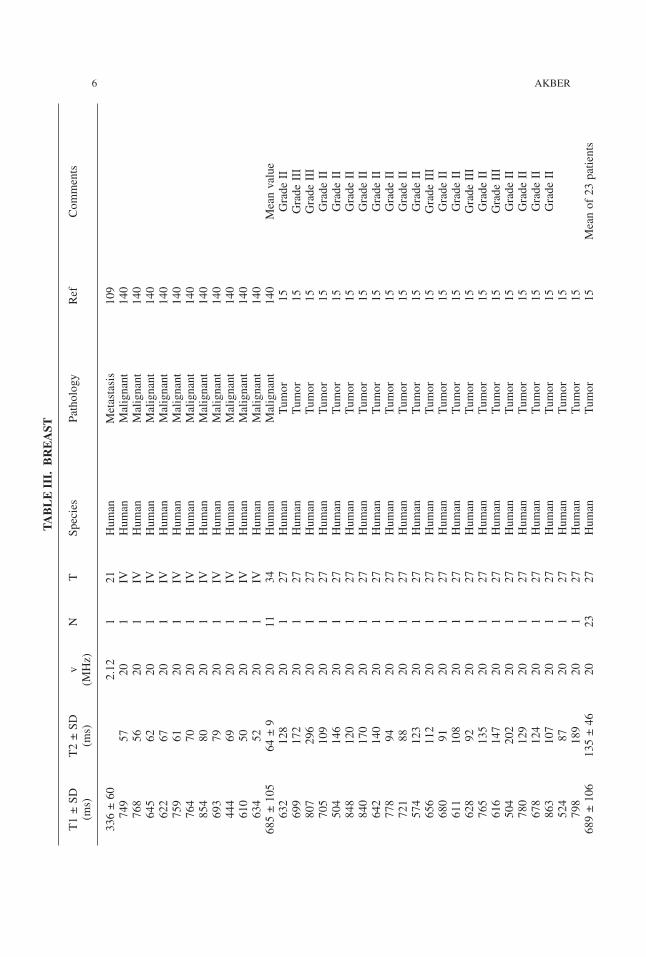
6 AKBER
TABLE
III.
BREAST
T1±SD
T2±SD
vN
TSpecies
Pathology
Ref
Comments
(ms)
(ms)
(MHz)
336±60
2.12
121
Human
Metastasis
109
749
5720
1IV
Human
Malignant
140
768
5620
1IV
Human
Malignant
140
645
6220
1IV
Human
Malignant
140
622
6720
1IV
Human
Malignant
140
759
6120
1IV
Human
Malignant
140
764
7020
1IV
Human
Malignant
140
854
8020
1IV
Human
Malignant
140
693
7920
1IV
Human
Malignant
140
444
6920
1IV
Human
Malignant
140
610
5020
1IV
Human
Malignant
140
634
5220
1IV
Human
Malignant
140
685±105
64±9
2011
34Human
Malignant
140
Meanvalue
632
128
201
27Human
Tumor
15GradeII
699
172
201
27Human
Tumor
15GradeIII
807
296
201
27Human
Tumor
15GradeIII
705
109
201
27Human
Tumor
15GradeII
504
146
201
27Human
Tumor
15GradeII
848
120
201
27Human
Tumor
15GradeII
840
170
201
27Human
Tumor
15GradeII
642
140
201
27Human
Tumor
15GradeII
778
9420
127
Human
Tumor
15GradeII
721
8820
127
Human
Tumor
15GradeII
574
123
201
27Human
Tumor
15GradeII
656
112
201
27Human
Tumor
15GradeIII
680
9120
127
Human
Tumor
15GradeII
611
108
201
27Human
Tumor
15GradeII
628
9220
127
Human
Tumor
15GradeIII
765
135
201
27Human
Tumor
15GradeII
616
147
201
27Human
Tumor
15GradeIII
504
202
201
27Human
Tumor
15GradeII
780
129
201
27Human
Tumor
15GradeII
678
124
201
27Human
Tumor
15GradeII
863
107
201
27Human
Tumor
15GradeII
524
8720
127
Human
Tumor
15798
189
201
27Human
Tumor
15689±106
135±46
2023
27Human
Tumor
15Meanof23patients
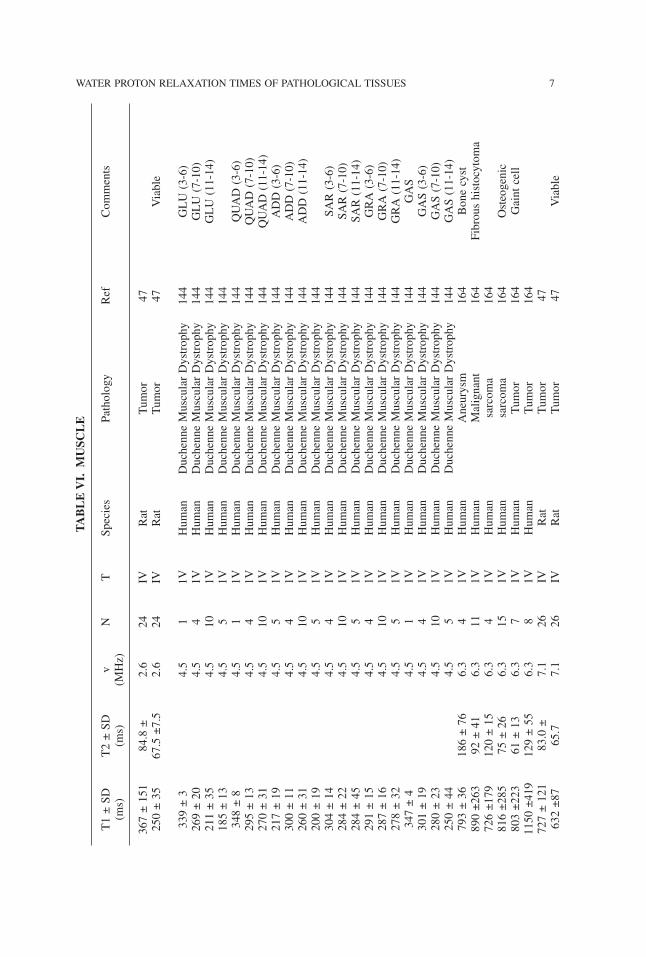
WATER PROTON RELAXATION TIMES OF PATHOLOGICAL TISSUES 7TABLE
VI.
MUSC
LE
T1±SD
T2±SD
vN
TSpecies
Pathology
Ref
Comments
(ms)
(ms)
(MHz)
367±151
84.8±
2.6
24IV
Rat
Tumor
47250±35
67.5±7.5
2.6
24IV
Rat
Tumor
47Viable
339±3
4.5
11V
Human
DuchenneMuscularDystrophy
144
GLU(3-6)
269±20
4.5
41V
Human
DuchenneMuscularDystrophy
144
GLU(7-10)
211±35
4.5
101V
Human
DuchenneMuscularDystrophy
144
GLU(11-14)
185±13
4.5
51V
Human
DuchenneMuscularDystrophy
144
348±8
4.5
11V
Human
DuchenneMuscularDystrophy
144
QUAD(3-6)
295±13
4.5
41V
Human
DuchenneMuscularDystrophy
144
QUAD(7-10)
270±31
4.5
101V
Human
DuchenneMuscularDystrophy
144
QUAD(11-14)
217±19
4.5
51V
Human
DuchenneMuscularDystrophy
144
ADD(3-6)
300±11
4.5
41V
Human
DuchenneMuscularDystrophy
144
ADD(7-10)
260±31
4.5
101V
Human
DuchenneMuscularDystrophy
144
ADD(11-14)
200±19
4.5
51V
Human
DuchenneMuscularDystrophy
144
304±14
4.5
41V
Human
DuchenneMuscularDystrophy
144
SAR(3-6)
284±22
4.5
101V
Human
DuchenneMuscularDystrophy
144
SAR(7-10)
284±45
4.5
51V
Human
DuchenneMuscularDystrophy
144
SAR(11-14)
291±15
4.5
41V
Human
DuchenneMuscularDystrophy
144
GRA(3-6)
287±16
4.5
101V
Human
DuchenneMuscularDystrophy
144
GRA(7-10)
278±32
4.5
51V
Human
DuchenneMuscularDystrophy
144
GRA(11-14)
347±4
4.5
11V
Human
DuchenneMuscularDystrophy
144
GAS
301±19
4.5
41V
Human
DuchenneMuscularDystrophy
144
GAS(3-6)
280±23
4.5
101V
Human
DuchenneMuscularDystrophy
144
GAS(7-10)
250±44
4.5
51V
Human
DuchenneMuscularDystrophy
144
GAS(11-14)
793±36
186±76
6.3
41V
Human
Aneurysm
164
Bonecyst
890±263
92±41
6.3
111V
Human
Malignant
164
Fibroushistocytoma
726±179
120±15
6.3
41V
Human
sarcoma
164
816±285
75±26
6.3
151V
Human
sarcoma
164
Osteogenic
803±223
61±13
6.3
71V
Human
Tumor
164
Gaintcell
1150±419
129±55
6.3
81V
Human
Tumor
164
727±121
83.0±
7.1
26IV
Rat
Tumor
47632±87
65.7
7.1
26IV
Rat
Tumor
47Viable
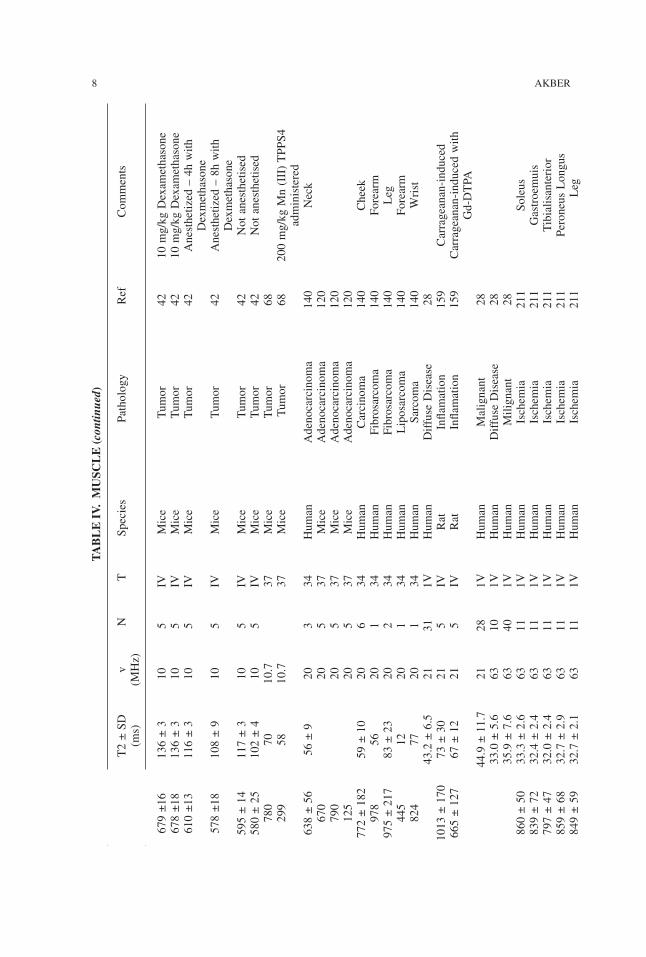
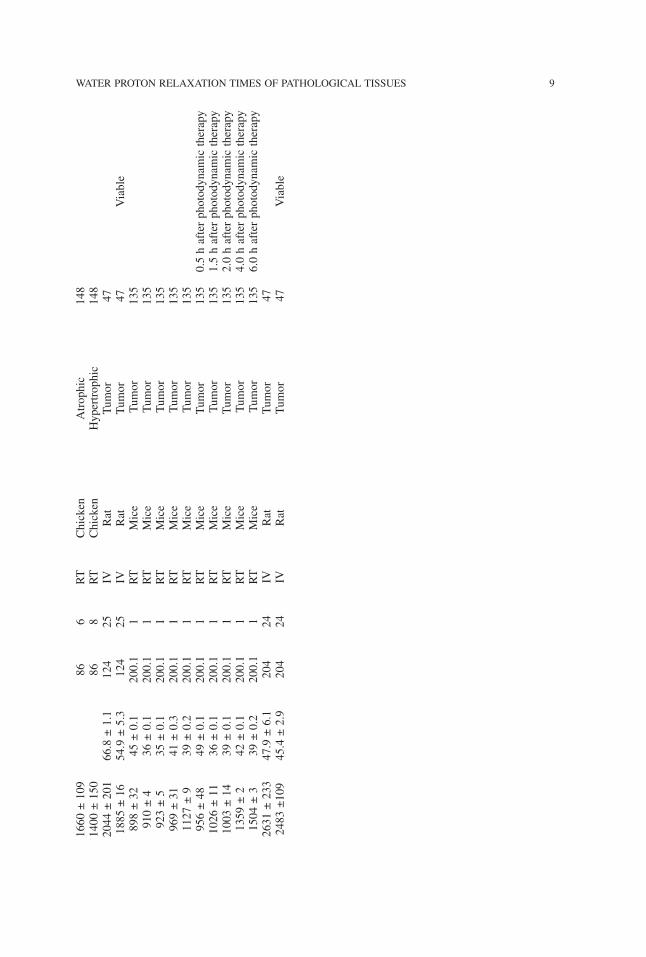
TABLE
IV.M
USC
LE
(con
tinue
d)
T1±SD
T2±SD
vN
TSpecies
Pathology
Ref
Comments
(ms)
(ms)
(MHz)
8 AKBER
679±16
136±3
105
IVMice
Tumor
4210mg/kgDexamethasone
678±18
136±3
105
IVMice
Tumor
4210mg/kgDexamethasone
610±13
116±3
105
IVMice
Tumor
42Anesthetized–4hwith
Dexmethasone
578±18
108±9
105
IVMice
Tumor
42Anesthetized–8hwith
Dexmethasone
595±14
117±3
105
IVMice
Tumor
42Notanesthetised
580±25
102±4
105
IVMice
Tumor
42Notanesthetised
780
7010.7
37Mice
Tumor
68299
5810.7
37Mice
Tumor
68200mg/kgMn(III)TPPS4
administered
638±56
56±9
203
34Human
Adenocarcinoma
140
Neck
670
205
37Mice
Adenocarcinoma
120
790
205
37Mice
Adenocarcinoma
120
125
205
37Mice
Adenocarcinoma
120
772±182
59±10
206
34Human
Carcinoma
140
Cheek
978
5620
134
Human
Fibrosarcoma
140
Forearm
975±217
83±23
202
34Human
Fibrosarcoma
140
Leg
445
1220
134
Human
Liposarcoma
140
Forearm
824
7720
134
Human
Sarcoma
140
Wrist
43.2±6.5
2131
1VHuman
DiffuseDisease
281013±170
73±30
215
IVRat
Inflamation
159
Carrageanan-induced
665±127
67±12
215
IVRat
Inflamation
159
Carrageanan-inducedwith
Gd-DTPA
44.9±11.7
2128
1VHuman
Malignant
2833.0±5.6
6310
1VHuman
DiffuseDisease
2835.9±7.6
6340
1VHuman
Milignant
28860±50
33.3±2.6
6311
1VHuman
Ischemia
211
Soleus
839±72
32.4±2.4
6311
1VHuman
Ischemia
211
Gastroemuis
797±47
32.0±2.4
6311
1VHuman
Ischemia
211
Tibialisanterior
859±68
32.7±2.9
6311
1VHuman
Ischemia
211
PeroneusLongus
849±59
32.7±2.1
6311
1VHuman
Ischemia
211
Leg
1660±109
866
RT
Chicken
Atrophic
148
1400±150
868
RT
Chicken
Hypertrophic
148
2044±201
66.8±1.1
124
25IV
Rat
Tumor
471885±16
54.9±5.3
124
25IV
Rat
Tumor
47Viable
898±32
45±0.1
200.1
1RT
Mice
Tumor
135
910±4
36±0.1
200.1
1RT
Mice
Tumor
135
923±5
35±0.1
200.1
1RT
Mice
Tumor
135
969±31
41±0.3
200.1
1RT
Mice
Tumor
135
1127±9
39±0.2
200.1
1RT
Mice
Tumor
135
956±48
49±0.1
200.1
1RT
Mice
Tumor
135
0.5hafterphotodynamictherapy
1026±11
36±0.1
200.1
1RT
Mice
Tumor
135
1.5hafterphotodynamictherapy
1003±14
39±0.1
200.1
1RT
Mice
Tumor
135
2.0hafterphotodynamictherapy
1359±2
42±0.1
200.1
1RT
Mice
Tumor
135
4.0hafterphotodynamictherapy
1504±3
39±0.2
200.1
1RT
Mice
Tumor
135
6.0hafterphotodynamictherapy
2631±233
47.9±6.1
204
24IV
Rat
Tumor
472483±109
45.4±2.9
204
24IV
Rat
Tumor
47Viable
WATER PROTON RELAXATION TIMES OF PATHOLOGICAL TISSUES 9
TABLE
V.H
EART
T1±SD
T2±SD
vN
TSpecies
Pathology
Ref
Comments
(ms)
(ms)
(MHz)
388±17
65±3
6.38
9RT
Dog
Ischemic
57148±30
44±4
6.38
28RT
Dog
Ischemic
5793±36
43±9
6.38
41RT
Dog
Ischemic
57423±51
44±2
156
IVDog
Hypoperfused
183
314±69
45±4
156
IVDog
Hypoperfused
183
521±51
49±9
153
IVDog
Reperfused
182
794±203
57±6
154
IVDog
Reperfused
182
450±52
62±12
154
IVDog
Reperfused
182
644±142
53±6
156
IVDog
Reperfused
182
386±56
57±6
153
IVDog
Reperfused
182
691±49
60.2±9.7
208
40Dog
Infarction
185
308±82.1
52.6±4
216
37Pig
Infarction
223
64±14
25.1
81V
Human
Angina
1UnstableAnginaReversible
67±21
25.1
71V
Human
Angina
1UnstableAnginaIrreversible
43±11
25.1
51V
Human
Angina
1StableAnginaReversible
40±9
25.1
31V
Human
Angina
1StableAnginaIrreversible
62±18
25.1
41V
Human
Infarction
1AcuteMIReversible
66±11
25.1
71V
Human
Infarction
1AcuteMIIrreversible
1387±63
63.0
4IV
Human
Amyloidosis
121
1340±81
81±12
639
IVHunan
Amyloidosis
91a
1146±71
72±9
639
IVHuman
Amyloidosis
91a
10 AKBER
TABLE
VI.
BRAIN
T1±SD
T2±SD
vN
TSpecies
Pathology
Ref
Comments
(ms)
(ms)
(MHz)
348±44
0.84
1IV
Human
Infarction
138
Onset1week
424±62
0.84
1IV
Human
Infarction
138
Onset1week
428±68
0.84
1IV
Human
Infarction
138
Onset1week
428±76
0.84
1IV
Human
Infarction
138
Onset1week
444±98
0.84
1IV
Human
Infarction
138
Onset1week
380±76
0.84
1IV
Human
Infarction
138
Onset1week
488±88
0.84
1IV
Human
Infarction
138
Onset1week
456±68
0.84
1IV
Human
Infarction
138
Onset1week
360±56
0.84
1IV
Human
Infarction
138
Onset1week
534±76
0.84
1IV
Human
Infarction
138
Onset1week
432±52
0.84
10IV
Human
Infarction
138Onset1week(Meanof10patient)
412±64
0.84
1IV
Human
Infarction
138
Onset2week
444±56
0.84
1IV
Human
Infarction
138
Onset2week
452±92
0.84
1IV
Human
Infarction
138
Onset2week
516±148
0.84
1IV
Human
Infarction
138
Onset2week
452±48
0.84
1IV
Human
Infarction
138
Onset2week
556±84
0.84
1IV
Human
Infarction
138
Onset2week
472±53
0.84
6IV
Human
Infarction
138Onset2week(Meanof6patients)
532±156
0.84
1IV
Human
Infarction
138
Onset5week
492±120
0.84
1IV
Human
Infarction
138
Onset5week
460±160
0.84
1IV
Human
Infarction
138
Onset5week
500±148
0.84
1IV
Human
Infarction
138
Onset5week
678±154
0.84
1IV
Human
Infarction
138
Onset5week
576±124
0.84
1IV
Human
Infarction
138
Onset5week
540±78
0.84
6IV
Human
Infarction
138Onset5week(Meanof6patients)
355
0.84
1IV
Human
Infarction
138
5montholdinfarct
435
0.84
1IV
Human
Infarction
138
3yearsoldinfarct
524
0.84
1IV
Human
Infarction
138
5yearsoldinfarct
635
0.84
1IV
Human
Infarction
138
8yearsoldinfarct
928±128
0.84
1IV
Human
Infarction
138
8montholdinfarct
748±320
0.84
1IV
Human
Infarction
138
1yearsoldinfarct
928±141
0.84
1IV
Human
Infarction
138
5yearsoldinfarct
836±196
0.84
1IV
Human
Infarction
138
8yearsoldinfarct
WATER PROTON RELAXATION TIMES OF PATHOLOGICAL TISSUES 11
TABLE
VI.
BRAIN
(con
tinue
d)
T1±SD
T2±SD
vN
TSpecies
Pathology
Ref
Comments
(ms)
(ms)
(MHz)
861±87
0.84
1IV
Human
Infarction
138
Meanvalueof8month–
8yearsinfarct
441±62
161±13
0.84
14IV
Human
Tumor
217
692±92
232±31
0.84
13IV
Human
Tumor
217
349
2.12
1IV
Human
Abscess
226
116
2.12
1IV
Human
Abscess
226
WithGd-DTPA
administered
446
2.12
1IV
Human
Glioblastoma
225
315
2.12
1IV
Human
Glioblastoma
225
187
2.12
1IV
Human
Glioblastoma
225
WithGd-DTPA
administered
462.12
1IV
Human
Glioblastoma
225
WithGd-DTPA
administered
315±6
2.12
121
Human
Meningioma
109
Transitional
551±36
2.12
121
Human
Meningioma
109
Angioplastic
382±11
2.12
121
Human
Meningioma
109
Hemangiopericytic
311
2.12
1IV
Human
Meningioma
225
323
2.12
1IV
Human
Meningioma
225
376
2.12
1IV
Human
Meningioma
225
281
2.12
1IV
Human
Meningioma
225
147
2.12
1IV
Human
Meningioma
225
WithGd-DTPA
administered
712.12
1IV
Human
Meningioma
225
WithGd-DTPA
administered
136
2.12
1IV
Human
Meningioma
225
WithGd-DTPA
administered
732.12
1IV
Human
Meningioma
225
WithGd-DTPA
administered
369
2.12
1IV
Human
Metastasis
225
353
2.12
1IV
Human
Metastasis
225
263
2.12
1IV
Human
Metastasis
225
342.12
1IV
Human
Metastasis
225
WithGd-DTPA
administered
822.12
1IV
Human
Metastasis
225
WithGd-DTPA
administered
792.12
1IV
Human
Metastasis
225
WithGd-DTPA
administered
285±23
2.12
121
Human
Neurioma
109
354±5
3.4
6IV
Human
SchizophrenicswithoutTD
29Basalganglia(R)
360±5
3.4
6IV
Human
SchizophrenicswithoutTD
29Basalganglia(L)
335±4
3.4
15IV
Human
SchizophrenicswithTD
29Basalganglia(R)
330±5
3.4
15IV
Human
SchizophrenicswithTD
29Basalganglia(L)
510±200
4.2
5IV
Human
adenomas
125
Pituitary
480
4.2
1IV
Human
adenoma
124
Pituitary
12 AKBER
310
4.2
1IV
Human
adenoma
124
Pituitary
390
4.2
1IV
Human
cyst
125
Colloid
580±100
4.2
11IV
Human
gliomas
125
Highgrade
750±140
4.2
4IV
Human
gliomas
125
Low
grade
590
4.2
1IV
Human
Glioblastoma
124
360
4.2
1IV
Human
Glioblastoma
124
680
4.2
1IV
Human
Glioblastoma
124
310
4.2
1IV
Human
Glioblastoma
124
WithGd-DTPA
740
4.2
1IV
Human
Hemangioblastoma
125
470±60
4.2
9IV
Human
Meningiomes
125
500
4.2
1IV
Human
Meningioma
124
520
4.2
1IV
Human
Meningioma
124
350
4.2
1IV
Human
Meningioma
124
320
4.2
1IV
Human
Meningioma
124
WithGd-DTPA
470
4.2
1IV
Human
Meningioma
124
290
4.2
1IV
Human
Meningioma
124
WithGd-DTPA
520
4.2
1IV
Human
Metastasis
124
320
4.2
1IV
Human
Metastasis
124
WithGd-DTPA
570
4.2
1IV
Human
Neurinoma
124
Acoustic
510
4.2
1IV
Human
Neurinoma
124
Acoustic
200
4.2
1IV
Human
Neurinoma
124
AcousticWithGd-DTPA
610±140
4.2
4IV
Human
Neurinoma
124
Acoustic
520±80
4.2
1IV
Human
Tumor
124
300±80
4.2
1IV
Human
Tumor
124
WithGd-DTPA
98.6±7.8
6.3
19IV
Human
MultipleSclerosis
14500
120
6.4
1IV
Monkey
Encephalomyelitis
197
Postmortem
460
110
6.4
1IV
Monkey
Encephalomyelitis
197
Postmortem
540
260
6.4
1IV
Monkey
Encephalomyelitis
197
Postmortem
600
270
6.4
1IV
Monkey
Encephalomyelitis
197
Postmortem
1221
10.7
122
Human
Astrocytoma
103
1634
10.7
122
Human
Astrocytoma
103
523±36
71±6
10.7
1820
Pig
Cord
110
AcuteEAE
495±45
70±7
10.7
1820
Pig
Cord
110
RelapsingEAE
469±30
68±4
10.7
1820
Pig
Cord
110
RemittingEAE
580±44
67±5
10.7
1820
Pig
Brainstem
110
AcuteEAE
557±45
69±7
10.7
1820
Pig
Brainstem
110
RelapsingEAE
556±36
70±3
10.7
1820
Pig
brainstem
110
RemittingEAE
489±33
66±4
10.7
1820
Pig
Cerebellium
110
AcuteEAE
467±30
62±4
10.7
1820
Pig
Cerebellium
110
RelapsingEAE
473±22
67±5
10.7
1820
Pig
Cerebellium
110
RemittingEAE
1445
10.7
122
Human
Glioma
103
WATER PROTON RELAXATION TIMES OF PATHOLOGICAL TISSUES 13
TABLE
VI.
BRAIN
(con
tinue
d)
T1±SD
T2±SD
vN
TSpecies
Pathology
Ref
Comments
(ms)
(ms)
(MHz)
1591
10.7
122
Human
Glioma
103
1660
10.7
122
Human
Hemangioblastoma
103
578±41
68±4
10.7
1820
Pig
Encephalomyelitis
110
AcuteEAE
542±34
69±7
10.7
1820
Pig
Encephalomyelitis
110
RelapsingEAE
544±22
73±3
10.7
1820
Pig
Encephalomyelitis
110
RemittingEAE
725±40
218±34
1210
IVHuman
Adenoma
105
Pituitary
728±54
175±21
1215
IVHuman
Adenoma
104
Pituitary
869±125
218±34
12IV
Human
Astrocytoma
105
886
210
121
IVHuman
Angiomatus
104
933±69
515±78
126
IVHuman
Cramiopharyngioma
104
884±93
218±34
12IV
Human
Craniopharyngioma
105
745±80
218±34
12IV
Human
edema
105
730±91
287±72
1217
IVHuman
edema
104
Perifocal
728±54
175±21
1215
IVHuman
edenoma
104
Pituitary
768±78
167±31
1215
IVHuman
Endotheliomatous
104
780±60
218±34
12IV
Human
Ependymona
105
698±78
135±26
122
IVHuman
Fibrous
104
766+60
218±34
12IV
Human
Glioblastoma
105
442±94
218±34
12IV
Human
Hematoma
105
765±95
165±35
1232
IVHuman
Meningioma
104
767±93
218±34
12IV
Human
Meningioma
105
696±91
176±23
1212
IVHuman
Metastases
105
895±65
207±25
1215
IVHuman
Neuroma
105
816±170
238±57
124
IVHuman
Obligoastrocytoma
105
714
176
121
IVHuman
Psammoma
104
959±88
210±27
127
IVHuman
Regressive
104
723±84
143±37
124
IVHuman
Transitional
104
1142±206
99±13
157
IVHuman
meningioma
219
450±79
93±7
157
IVHuman
meningioma
219
AfterGd-DTPA
administration
1778±832
113±16
155
IVHuman
Neuroma
219
425±83
91±16
155
IVHuman
Neuroma
219
AfterGd-DTPA
administration
735±124
188±77
2122
IVHuman
Tumor
92670±189
276±214
2122
IVHuman
Tumor
92709±151
229±159
2122
IVHuman
Tumor
92Meanvalue
14 AKBER
980±80
415
21Cat
Edema
67396±20
6310
IVHuman
Adenoma
114
Pituitary
337±16
6310
IVHuman
Adenoma
114
Pituitary
60.52±.15
6314
IVHuman
Amygdala(L)
163
62.25±4.18
6314
IVHuman
Amygdala(R)
163
363±12
6310
IVHuman
AstrocytomaI-II
114
180±5
6310
IVHuman
AstrocytomaI-II
114
155±5
6310
IVHuman
AstrocytomaI-II
114
105±3
6310
IVHuman
AstrocytomaIII-IV
114
172±10
6310
IVHuman
AstrocytomaIII-IV
114
57.42±4.02
6314
IVHuman
Caudate-TS
163
59.8±4.46
6314
IVHuman
Caudate-TS
163
51.91±4.28
6314
IVHuman
corpuscallosum
163
Anterior
55.31±4.18
6314
IVHuman
corpuscallosum
163
Posterior
55.49±5.09
6314
IVHuman
cingulategray(L)
163
59.06+5.41
6314
IVHuman
cingulategray(R)
163
52±5.74
6314
IVHuman
cingulatewhite(L)
163
55.72±7.99
6314
IVHuman
Cingulatewhite(R)
163
260±11
6310
IVHuman
Craniopharyngioma
114
366±15
6310
IVHuman
Craniopharyngioma
114
1314
145
631
IVHuman
Edema
361032
158
631
IVHuman
Edema
361649
218
631
IVHuman
Edema
361249
140
631
IVHuman
Edema
361116
163
631
IVHuman
Edema
361130
165
631
IVHuman
Edema
361220
145
631
IVHuman
Edema
3646.37±4.5
6314
IVHuman
Globuspallidus(L)
163
49.11±3.65
6314
IVHuman
Globuspallidus(R)
163
81.7±7.15
6354
IVHuman
GrayMatter
189
SLE
59.16±2.81
6314
IVHuman
Insularcortex(L)
163
65.58±5.96
6314
IVHuman
Insularcortex(R)
163
107.2±12.1
6331
IVHuman
Lesionsreversible
189
SLE
84.67±10.6
63133
IVHuman
Lesionsnotreversible
189
SLE
139±4
6310
IVHuman
Meningioma
114
1213±258
271±61
6412
IVHuman
Edema
181
972±124
109±17
6412
IVHuman
GM
181
Withbraintumor
599±90
87±7
6312
IVHuman
WM
181
Withbraintumor
1168±212
191±95
6412
IVHuman
Tumor
181
144.4±38.9
63IV
Human
Multiplesclerosis
196
Posteriorfosa
153.7±15.8
63IV
Human
Multiplesclerosis
196
Cord
WATER PROTON RELAXATION TIMES OF PATHOLOGICAL TISSUES 15
253.7±78.7
63IV
Human
Multiplesclerosis
196
periventicular
60.34±3.1
6334
IVHuman
Multiplesclerosis
73NAWM
1103±93.6
104±18.4
634
IVHuman
Multiplesclerosis
18Totalwhitematter
1022±132.4
97±12.1
634
IVHuman
Multiplesclerosis
18NAWM
1428±266
139±16.9
634
IVHuman
Multiplesclerosis
18AbnormalWM
1201±78.2
123±9.9
634
IVHuman
Multiplesclerosis
18AbnormalWM
55.85±4.36
6314
IVHuman
OccipitalwhiteMatter(L)
163
60.27±4.29
6314
IVHuman
OccipitalwhiteMatter(R)
163
51.16±3.3
6314
IVHuman
Putamen(L)
163
TS
54.86±4.09
6314
IVHuman
Putamen(R)
163
TS
1168±212
191±90
6312
IVHuman
Tumor
181
3036
317
631
IVHuman
Tumor
36glioblastoma
1159
103
631
IVHuman
Tumor
36anaplasticastrozytom
1718
205
631
IVHuman
Tumor
36glioblastoma
1135
133
631
IVHuman
Tumor
36Oligodendroglioma
1500
174
631
IVHuman
Tumor
36Anaplasticastrozytoma
47.67±2.32
6314
IVHuman
Rednucleus(L)
163
48.27±3.23
6314
IVHuman
Rednucleus(R)
163
45.22±4
6314
IVHuman
Substantianigra(L)
163
48.66+4.05
6314
IVHuman
Substantianigra(R)
163
54.18±2.62
6314
IVHuman
Thalamus(L)
163
posterior
53.67±3.57
6314
IVHuman
Thalamus(R)
163
posterior
53.67±2.71
6314
IVHuman
Thalamus(L)
163
anterior
56.01±3.36
6314
IVHuman
Thalamus(R)
163
anterior
595±19
6313
IVHiman
NWH–MS
18b
NAAconc6.93+0.63
710±87
6314
IVHuman
NAWM-MS
18b
NAAconc6.15+0.56
848±64
639
IVHuman
MS
18b
Hypointensive
985±64
632
IVHuman
MS
18b
AcuteHypointensive
1043±186
15IV
Human
MS
18b
SeverelyHypointensive
52.24±2.67
6314
IVHuman
Leftfrontalwhite
163
55.3±4.1
6314
IVHuman
Rightfrontalwhite
163
81.7±7.15
6354
IVHuman
Systemiclupuserythematosus
189
GM
66.72±2.7
6354
IVHuman
Systemiclupuserythematosus
189
WM-subcortical
67.06±3.48
6354
IVHuman
Systemiclupuserythematosus
189
WM-deep
16 AKBERTABLE
VI.
BRAIN
(con
tinue
d)
T1±SD
T2±SD
vN
TSpecies
Pathology
Ref
Comments
(ms)
(ms)
(MHz)
107.2±12.1
6331
IVHuman
Systemiclupuserythematosus
189
Reversiblelession
84.67±10.6
63133
IVHuman
Systemiclupuserythematosus
189
Nonreversiblelession
181.6±63.6
6312
IVHuman
Systemiclupuserythematosus
189
Infarct
617
63IV
Human
Cystericalcyst
97a
161
63IV
Human
Tuberculomad
97a
490±20
6432
IVHuman
WMobsessivecompulsive
80463.4±11.04
94.0±2.79
80.0
9IV
Rats
AllergicencephaloAcute
226
425.5±8.73
82.7±0.98
80.0
6IV
Rats
Asymptomatic
226
466.7±12.8
87.1±1.85
80.0
7IV
Rats
Asymptomatic
226
418.6±6.6
83.0±1.13
80.0
5IV
Rats
DemyelinatingEarly
226
467.3±6.11
89.9±1.19
80.0
13IV
Rats
DemyelinatingAcute
226
479.4±17.75
91.0±2.92
80.0
5IV
Rats
EAEEarly
226
462.4±4.05
88.0±2.07
80.0
5IV
Rats
MyelitisLate
226
468±6.61
90.7±1.01
80.0
12IV
Rats
Asymptomatic
226
467.7±8.46
94.2±2.06
80.0
12IV
Rats
Symptomatic
226
133±4
197.0
1237
Cat
Edema
8794±4
197.0
1237
Cat
Tumor
871200±1
58±2
197.4
9Rat
C6glioma
168
1312±107
89±3
197.4
5IV
Human
Glioma
224
1284±86
87±7
197.4
5IV
Human
Neuroblastoma
224
1338±85
86±9
197.4
5IV
Human
Schwannoma
224
1311±98
87±7
197.4
5IV
Human
225
144±2.2
200
1IV
Human
Astrocytoma
174
gradeIV
1770±131
97±12
200
4RT
Rat
GM
143
24haftercoldinjury
1625±75
83±6.1
200
4RT
Rat
GM
143
1weekaftercoldinjury
140±2.1
200
1IV
Human
MultipleSclerosis
174
Chronicplaque
1725±199
92.8±8.8
200
4RT
Rat
WM
143
24haftercoldinjury
1604±114
83.4±2.7
200
4RT
Rat
WM
143
1weekaftercoldinjury
2020±51
360
2025
Rat
T9glioma
951820±68
120±23
360
25Rat
Ischemic@30min
96BCAO
1770±51
114±22
360
25Rat
Ischemic@60min
96BCAO
1820±85
111±16
360
25Rat
Ischemic@120min
96BCAO
1800±143
104±19
360
25Rat
Ischemic@180min
96BCAO
2030±80
62±20
360
IVMouse
U87Highgradeglialtumor
198a
2062±60
294
4IV
Rat
Ipsilateralcortex
18a
MCAocclusion
1811±28
294
Rat
Ischemiaonset+1hr
18a
2600±38
294
IVRat
Contralateral
18a
1007±18
294
IVRat
Ischemiaonset+2hr
18a
1027±74
IVRat
NABT
79a
WATER PROTON RELAXATION TIMES OF PATHOLOGICAL TISSUES 17
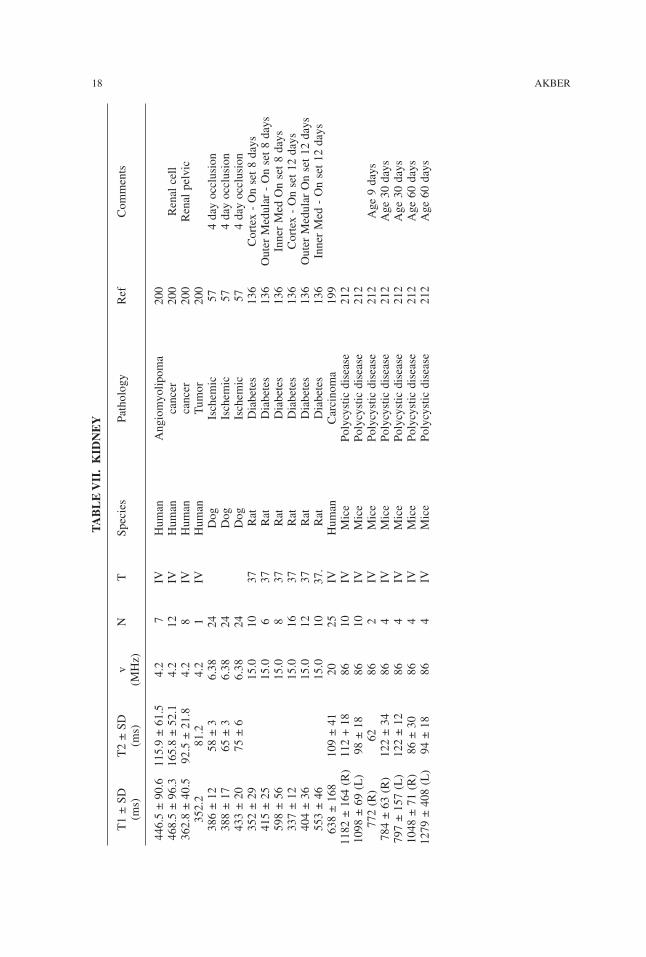
TABLE
VII
.K
IDNEY
T1±SD
T2±SD
vN
TSpecies
Pathology
Ref
Comments
(ms)
(ms)
(MHz)
446.5±90.6
115.9±61.5
4.2
7IV
Human
Angiomyolipoma
200
468.5±96.3
165.8±52.1
4.2
12IV
Human
cancer
200
Renalcell
362.8±40.5
92.5±21.8
4.2
8IV
Human
cancer
200
Renalpelvic
352.2
81.2
4.2
1IV
Human
Tumor
200
386±12
58±3
6.38
24Dog
Ischemic
574dayocclusion
388±17
65±3
6.38
24Dog
Ischemic
574dayocclusion
433±20
75±6
6.38
24Dog
Ischemic
574dayocclusion
352±29
15.0
1037
Rat
Diabetes
136
Cortex-Onset8days
415±25
15.0
637
Rat
Diabetes
136
OuterMedular-Onset8days
598±56
15.0
837
Rat
Diabetes
136
InnerMedOnset8days
337±12
15.0
1637
Rat
Diabetes
136
Cortex-Onset12days
404±36
15.0
1237
Rat
Diabetes
136
OuterMedularOnset12days
553±46
15.0
1037.
Rat
Diabetes
136
InnerMed-Onset12days
638±168
109±41
2025
IVHuman
Carcinoma
199
1182±164(R)112+18
8610
IVMice
Polycysticdisease
212
1098±69(L)
98±18
8610
IVMice
Polycysticdisease
212
772(R)
6286
2IV
Mice
Polycysticdisease
212
Age9days
784±63(R)
122±34
864
IVMice
Polycysticdisease
212
Age30days
797±157(L)
122±12
864
IVMice
Polycysticdisease
212
Age30days
1048±71(R)
86±30
864
IVMice
Polycysticdisease
212
Age60days
1279±408(L)
94±18
864
IVMice
Polycysticdisease
212
Age60days
18 AKBER
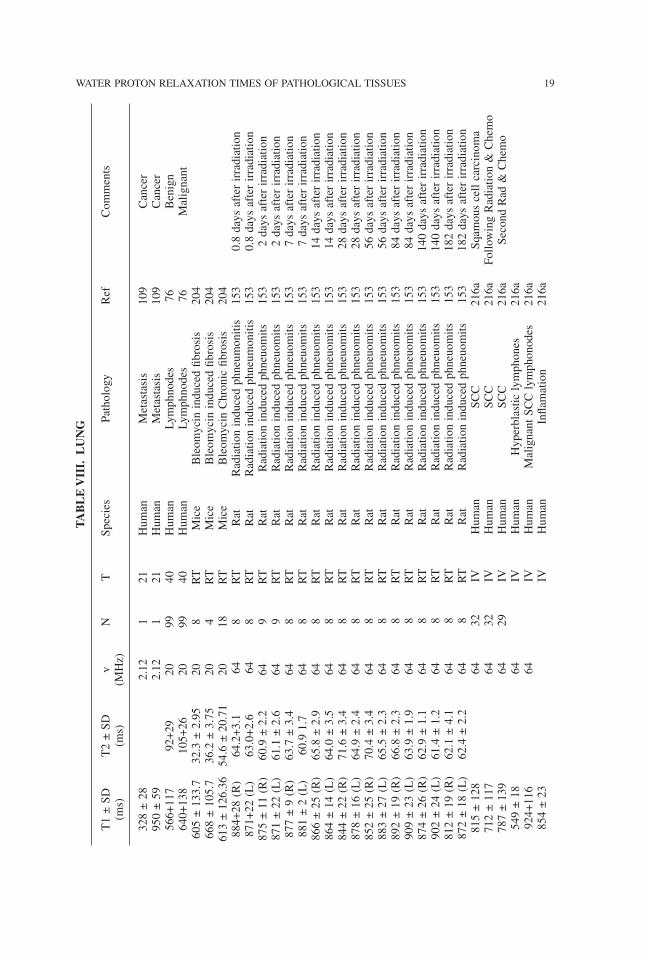
TABLE
VII
I.LUNG
T1±SD
T2±SD
vN
TSpecies
Pathology
Ref
Comments
(ms)
(ms)
(MHz)
328±28
2.12
121
Human
Metastasis
109
Cancer
950±59
2.12
121
Human
Metastasis
109
Cancer
566+117
92+29
2099
40Human
Lymphnodes
76Benign
640+138
105+26
2099
40Human
Lymphnodes
76Malignant
605±133.7
32.3±2.95
208
RT
Mice
Bleomycininducedfibrosis
204
668±105.7
36.2±3.75
204
RT
Mice
Bleomycininducedfibrosis
204
613±126.36
54.6±20.71
2018
RT
Mice
BleomycinChronicfibrosis
204
884+28(R)
64.2+3.1
648
RT
Rat
Radiationinducedphneumonitis
153
0.8daysafterirradiation
871+22(L)
63.0+2.6
648
RT
Rat
Radiationinducedphneumonitis
153
0.8daysafterirradiation
875±11(R)
60.9±2.2
649
RT
Rat
Radiationinducedphneuomits
153
2daysafterirradiation
871±22(L)
61.1±2.6
649
RT
Rat
Radiationinducedphneuomits
153
2daysafterirradiation
877±9(R)
63.7±3.4
648
RT
Rat
Radiationinducedphneuomits
153
7daysafterirradiation
881±2(L)
60.91.7
648
RT
Rat
Radiationinducedphneuomits
153
7daysafterirradiation
866±25(R)
65.8±2.9
648
RT
Rat
Radiationinducedphneuomits
153
14daysafterirradiation
864±14(L)
64.0±3.5
648
RT
Rat
Radiationinducedphneuomits
153
14daysafterirradiation
844±22(R)
71.6±3.4
648
RT
Rat
Radiationinducedphneuomits
153
28daysafterirradiation
878±16(L)
64.9±2.4
648
RT
Rat
Radiationinducedphneuomits
153
28daysafterirradiation
852±25(R)
70.4±3.4
648
RT
Rat
Radiationinducedphneuomits
153
56daysafterirradiation
883±27(L)
65.5±2.3
648
RT
Rat
Radiationinducedphneuomits
153
56daysafterirradiation
892±19(R)
66.8±2.3
648
RT
Rat
Radiationinducedphneuomits
153
84daysafterirradiation
909±23(L)
63.9±1.9
648
RT
Rat
Radiationinducedphneuomits
153
84daysafterirradiation
874±26(R)
62.9±1.1
648
RT
Rat
Radiationinducedphneuomits
153
140daysafterirradiation
902±24(L)
61.4±1.2
648
RT
Rat
Radiationinducedphneuomits
153
140daysafterirradiation
812±19(R)
62.1±4.1
648
RT
Rat
Radiationinducedphneuomits
153
182daysafterirradiation
872±18(L)
62.4±2.2
648
RT
Rat
Radiationinducedphneuomits
153
182daysafterirradiation
815±128
6432
IVHuman
SCC
216a
Sqamouscellcarcinoma
712±117
6432
IVHuman
SCC
216a
FollowingRadiation&Chemo
787±139
6429
IVHuman
SCC
216a
SecondRad&Chemo
549±18
64IV
Human
Hyperblasticlymphones
216a
924+116
64IV
Human
MalignantSCClymphonodes
216a
854±23
IVHuman
Inflamation
216a
WATER PROTON RELAXATION TIMES OF PATHOLOGICAL TISSUES 19
785±116
64IV
Human
ResidualLymphonodes
216a
FollowingFirstRad&ChemTx
731±71
64IV
Human
ResidualLymphonodes
216a
FollowingSecondRad&ChemTx
66.3±2.3
64IV
Rat
3daysafterTx
192
Co-60(20Gy)
155±11
64IV
Rat
1dayafterTx
192
Co-60(20Gy)
1430±21
109.9±4.1
100
325
Human
Adenocarinoma
190
Poorlydifferentiated
973±36
83.8±18.5
100
525
Human
Adenocarinoma
190
Welldifferentiated
1389
95.0
100
125
Human
Carcinoid
190
1273±33
112.6±39.8
100
325
Human
Smallcellcarcinoma
190
1280±79
104.7±28.9
100
1225
Human
Squamouscellcarcinoma
190
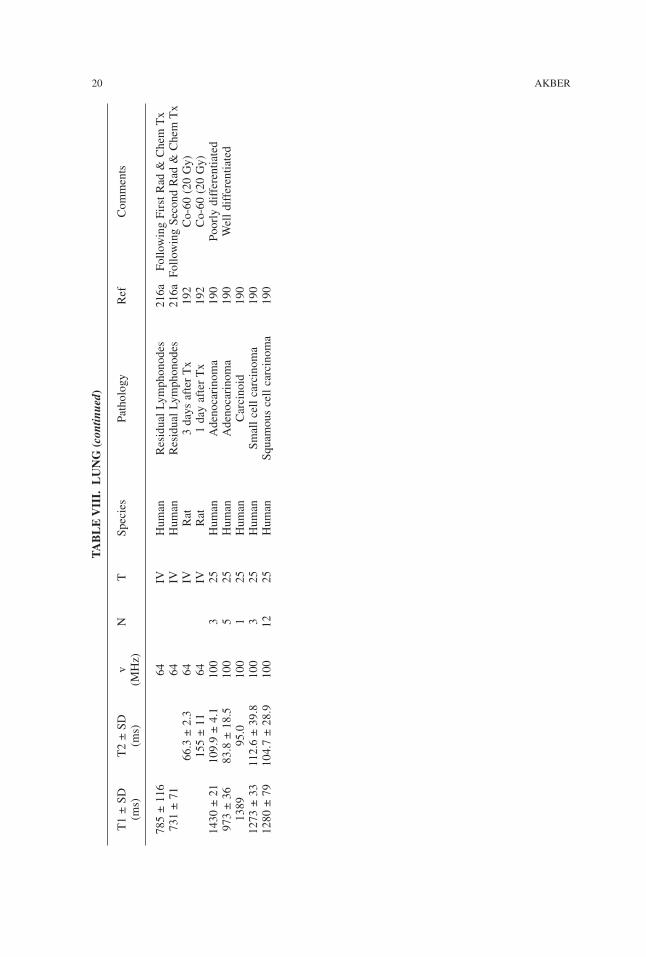
20 AKBERTABLE
VII
I.LUNG
(con
tinue
d)
T1±SD
T2±SD
vN
TSpecies
Pathology
Ref
Comments
(ms)
(ms)
(MHz)
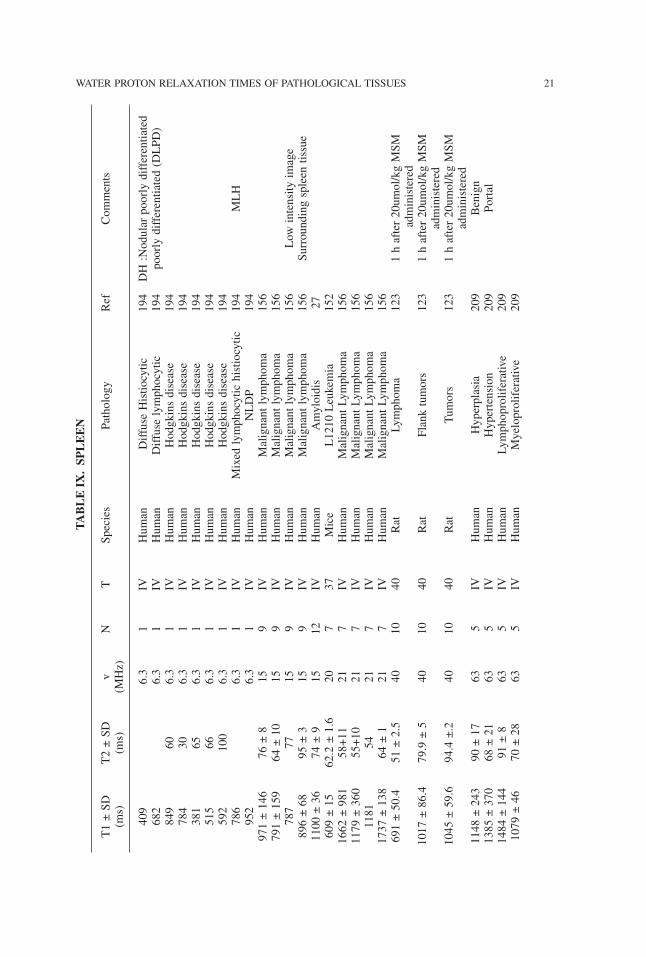
TABLE
IX.SP
LEEN
T1±SD
T2±SD
vN
TSpecies
Pathology
Ref
Comments
(ms)
(ms)
(MHz)
409
6.3
1IV
Human
DiffuseHistiocytic
194
DH:Nodularpoorlydifferentiated
682
6.3
1IV
Human
Diffuselymphocytic
194
poorlydifferentiated(DLPD)
849
606.3
1IV
Human
Hodgkinsdisease
194
784
306.3
1IV
Human
Hodgkinsdisease
194
381
656.3
1IV
Human
Hodgkinsdisease
194
515
666.3
1IV
Human
Hodgkinsdisease
194
592
100
6.3
1IV
Human
Hodgkinsdisease
194
786
6.3
1IV
Human
Mixedlymphocytichistiocytic
194
MLH
952
6.3
1IV
Human
NLDP
194
971±146
76±8
159
IVHuman
Malignantlymphoma
156
791±159
64±10
159
IVHuman
Malignantlymphoma
156
787
7715
9IV
Human
Malignantlymphoma
156
Low
intensityimage
896±68
95±3
159
IVHuman
Malignantlymphoma
156
Surroundingspleentissue
1100±36
74±9
1512
IVHuman
Amyloidis
27609±15
62.2±1.6
207
37Mice
L1210Leukemia
152
1662±981
58+11
217
IVHuman
MalignantLymphoma
156
1179±360
55+10
217
IVHuman
MalignantLymphoma
156
1181
5421
7IV
Human
MalignantLymphoma
156
1737±138
64±1
217
IVHuman
MalignantLymphoma
156
691±50.4
51±2.5
4010
40Rat
Lymphoma
123
1hafter20umol/kgMSM
administered
1017±86.4
79.9±5
4010
40Rat
Flanktumors
123
1hafter20umol/kgMSM
administered
1045±59.6
94.4±.2
4010
40Rat
Tumors
123
1hafter20umol/kgMSM
administered
1148±243
90±17
635
IVHuman
Hyperplasia
209
Benign
1385±370
68±21
635
IVHuman
Hypertension
209
Portal
1484±144
91±8
635
IVHuman
Lymphoproliferative
209
1079±46
70±28
635
IVHuman
Myeloproliferative
209
WATER PROTON RELAXATION TIMES OF PATHOLOGICAL TISSUES 21
TABLE
X.M
ISCELLANEO
USTIS
SUE
T1±SD
T2±SD
vN
TSpecies
Pathology
Ref
Comments
(ms)
(ms)
(MHz)
ADRENAL
88±21
2130
IVHuman
Adenomas
79110±19
2118
IVHuman
Malignant
79
APPENDIX
527±15
68±5
1010
37Human
Appendicitis
97
BO
NE
MARROW
971
8563
8IV
Human
Polycythemia
99499±75
103±25
6..3
16IV
Human
Malignant
198
439±17
119±23
6.3
10IV
Human
Malignant
198
633±66
57±4
151
IVHuman
HD
155
1246±17
56±8
151
IVHuman
HCL
155
325±51
51±6
151
IVHuman
Malignant
155
Afterirradiation(20–40Gy)
242±25
51±7
151
IVHuman
Malignant
155
MeanValue
493±117
55±4
153
IVHuman
Malignant
155
MeanValue
879±324
59±4
153
IVHuman
Malignant
155
759±144
63±5
15IV
Human
NHL
155
477±148
57±3
15IV
Human
NHL
155
60–70%
cellurity
518±117
52±1
15IV
Human
RBM
155
60%cellurity
1093±316
80±10
212
IVHuman
ALL
155
975±67
68±10
212
IVHuman
AML
155
916±220
85±9
211
IVHuman
HCL
155
722±102
78±13
211
IVHuman
MM
155
50%cellurity
287±50
55±.7
2121
IVHuman
Malignant
155
1048±212
7221
17IV
Human
Malignant
155
Meanvalue
574±.l40
61±8
216
IVHuman
Malignant
155
Meanvalue
349±29
63±3
213
IVHuman
Malignant
155
Afterirradiation(20–40Gy)
110±215
76±15
218
IVHuman
NHL
155
553±86
59±4
212
IVHuman
NHL
155
50–60%
cellurity
1198±355
62±.7
211
IVHuman
PV155
920±289
60±4
213
IVHuman
RBM
155
590±222
57±.l
211
IVHuman
RBM
155
50–60%
cellurity
438±67
58±3
211
IVHuman
RBM
155
40%cellurity
336±.42
61±.8
631
IVHuman
AML
203
22 AKBER
363±15
64±3
631
IVHuman
AML
203
379.±23
84±3
631
IVHuman
AML
203
365.±10
76±7
631
IVHuman
AML
203
423±l1
62±.6
631
IVHuman
AML
203
314±35
61±4
631
IVHuman
AML
203
413±48
47.7±6.7
634
IVHuman
Anemia
195
935
631
IVHuman
Aplasia
100
1790
631
IVHuman
Aplasia
100
1530.1
38.6
6317
IVHuman
Epiphysis
76a
AnorexiaNervosa
1469.1
45.2
6312
IVHuman
FemurDiaphysis
76a
AnorexiaNervosa
1068.1
40.4
6318
IVHuman
Lumbarspine
76a
AnorexiaNervosa
1137
631
IVHuman
Aplona
100
910
631
IVHuman
Aplona
100
1085
631
IVHuman
Aplona
100
771±164
43.4±6.3
6315
IVHuman
BoneMarrowdisorder
195
Meanvalue
2341±514
51.3±3.7
633
IVHuman
Hodgkinsdisease
195
1209
631
IVHuman
Leukemia
100
6063
1IV
Human
Leukemia
100
1025
631
IVHuman
Leukemia
100
PartialRemission
935
631
IVHuman
Leukemia
100
1145
631
IVHuman
Leukemia
100
598
631
IVHuman
Leukemia
100
495
631
IVHuman
Leukemia
100
Completeremission
1090
631
IVHuman
Leukemia
100
Completeremission
672
631
IVHuman
Leukemia
100
1355
631
IVHuman
Leukemia
100
945
631
IVHuman
Leukemia
100
1160
631
IVHuman
Leukemia
100
569
631
IVHuman
Leukemia
100
PartialRemission
1040
631
IVHuman
Leukemia
100
1790
631
IVHuman
Leukemia
100
1160
631
IVHuman
Leukemia
100
569
631
IVHuman
Leukemia
100
PartialRemission
1040
631
IVHuman
Leukemia
100
1020
631
IVHuman
Leukemia
100
830
631
IVHuman
Leukemia
100
655
63IV
Human
Leukemia
100
550
631
IVHuman
Leukemia
100
910
631
IVHuman
Leukemia
100
1275
631
IVHuman
Leukemia
100
WATER PROTON RELAXATION TIMES OF PATHOLOGICAL TISSUES 23
TABLE
X.M
ISCELLANEO
USTIS
SUE
(con
tinue
d)
T1±SD
T2±SD
vN
TSpecies
Pathology
Ref
Comments
(ms)
(ms)
(MHz)
865
631
IVHuman
Leukemia
100
1095
631
IVHuman
Leukemia
100
1135
631
IVHuman
Leukemia
100
883
631
IVHuman
Leukemia
100
1040
631
IVHuman
Leukemia
100
980
631
IVHuman
Leukemia
100
960
631
IVHuman
Leukemia
100
1006
631
IVHuman
Leukemia
100
810
631
IVHuman
Leukemia
100
690
631
IVHuman
Leukemia
100
651
631
IVHuman
Leukemia
100
1055
631
IVHuman
Leukemia
100
1020
631
IVHuman
Leukemia
100
1100
631
IVHuman
Leukemia
100
840
631
IVHuman
Leukemia
100
PartialRemission
1100
631
IVHuman
Leukemia
100
640
631
IVHuman
Leukemia
100
Partialremission
1000
631
IVHuman
Leukemia
100
900
631
IVHuman
Leukemia
100
735
631
IVHuman
Leukemia
100
Partialremission
940
631
IVHuman
Leukemia
100
975
631
IVHuman
Leukemia
100
595
631
IVHuman
Leukemia
100
700
631
IVHuman
Leukemia
100
900
631
IVHuman
Leukemia
100
1200
631
IVHuman
Leukemia
100
940
631
IVHuman
Leukemia
100
900
631
IVHuman
Leukemia
100
1100
631
IVHuman
Leukemia
100
1236
631
IVHuman
Leukemia
100
Partialremission
1455
631
IVHuman
Leukemia
100
1070
631
IVHuman
Leukemia
100
990
631
IVHuman
Leukemia
100
1100
631
IVHuman
Leukemia
100
24 AKBER
700
631
IVHuman
Leukemia
100
1619±629
53.7±7.6
634
IVHuman
Lymphoblasticdisorders
195
1030±70
74±6
636
IVHuman
Lymphoma
213
1043±26
40.8±3.0
636
IVHuman
Lymphoma
213
961±209
47.9±9.0
636
IVHuman
Lmphoproliferaturedisorders
195
1021±56
81±5
636
IVHuman
Metastasis
213
922±87
56±10
636
IVHuman
Metastasis
213
1150
631
IVHuman
ModerateHyperplasia
100
900
631
IVHuman
ModerateHyperplasia
100
1200
631
IVHuman
ModerateHyperplasia
100
1250
631
IVHuman
ModerateHyperplasia
100
900
631
IVHuman
MaxHyperplasia
100
1250
631
IVHuman
MaxHyperplasia
100
850
631
IVHuman
MaxHyperplasia
100
1156
631
IVHuman
MaxHyperplasia
100
1276±353
51.0±10.7
638
IVHuman
Myleoproliferaturedisease
195
1091±244
46.3±3.6
635
IVHuman
MyeloidLeukemia
195
895±38
68±5
6311
IVHuman
Osteoporosis
213
917±28
40.7±1.4
6311
IVHuman
Osteoporosis
213
CERVIX
674
6220
134
Human
Malignant
140
1055
5820
134
Human
Malignant
140
726
7920
134
Human
Malignant
140
992
8020
134
Human
Malignant
140
550
2620
134
Human
Malignant
140
610
5620
134
Human
Malignant
140
554
3820
134
Human
Malignant
140
737±190
57±18
207
34Human
Malignant
140
Meanof7patients
1002
211
IVHuman
Carcinoma
178a
607
211
IVHuman
Carcinoma
178a
809
211
IVHuman
Carcinoma
178a
779
211
IVHuman
Carcinoma
178a
598
211
IVHuman
Carcinoma
178a
574
211
IVHuman
Carcinoma
178a
731
211
IVHuman
Carcinoma
178a
764
211
IVHuman
Carcinoma
178a
754
211
IVHuman
Carcinoma
178a
788
211
IVHuman
Carcinoma
178a
747
211
IVHuman
Carcinoma
178a
WATER PROTON RELAXATION TIMES OF PATHOLOGICAL TISSUES 25
TABLE
X.M
ISCELLANEO
USTIS
SUE
(con
tinue
d)
T1±SD
T2±SD
vN
TSpecies
Pathology
Ref
Comments
(ms)
(ms)
(MHz)
574
211
IVHuman
Carcinoma
178a
1083
211
IVHuman
Carcinoma
178a
755
2113
IVHuman
Carcinoma
178a
Meanof13patients
723
211
IVHuman
Carcinoma
178a
DuringRadiationTreatment
504
211
IVHuman
Carcinoma
178a
DuringRadiationTreatment
635
211
IVHuman
Carcinoma
178a
DuringRadiationTreatment
549
211
IVHuman
Carcinoma
178a
DuringRadiationTreatment
322
211
IVHuman
Carcinoma
178a
DuringRadiationTreatment
622
211
IVHuman
Carcinoma
178a
DuringRadiationTreatment
727
211
IVHuman
Carcinoma
178a
DuringRadiationTreatment
822
211
IVHuman
Carcinoma
178a
DuringRadiationTreatment
763
211
IVHuman
Carcinoma
178a
DuringRadiationTreatment
634
219
IVHuman
Carcinoma
178a
Meanof9patients
819
211
IVHuman
Carcinoma
178a
AfterRT(1–4months)
663
211
IVHuman
Carcinoma
178a
AfterRT(1–4months)
619
211
IVHuman
Carcinoma
178a
AfterRT(1–4months)
802
211
IVHuman
Carcinoma
178a
AfterRT(1–4months)
650
211
IVHuman
Carcinoma
178a
AfterRT(1–4months)
781
211
IVHuman
Carcinoma
178a
AfterRT(1–4months)
578
211
IVHuman
Carcinoma
178a
AfterRT(1–4months)
618
211
IVHuman
Carcinoma
178a
AfterRT(1–4months)
663
211
IVHuman
Carcinoma
178a
AfterRT(1–4months)
598
211
IVHuman
Carcinoina
178a
AfterRT(1–4months)
653
211
IVHuman
Carcinoma
178a
AfterRT(1–4months)
598
211
IVHuman
Carcinoma
178a
AfterRT(1–4months)
1071
211
IVHuman
Carcinoma
178a
AfterRT(1–4months)
701
Meanof13patients
673
211
IVHuman
Carcinoma
178a
AfterRT(5–8months)
705
211
IVHuman
Carcinoma
178a
AfterRT(5–8months)
738
211
IVHuman
Carcinoma
178a
AfterRT(5–8months)
561
211
IVHuman
Carcinoma
178a
AfterRT(5–8months)
680
211
IVHuman
Carcinoma
178a
AfterRT(5–8months)
671
215
IVHuman
Carcinoma
178a
Meanof5patients
612
211
IVHuman
Carcinoma
178a
AfterRT(9–18months)
26 AKBER
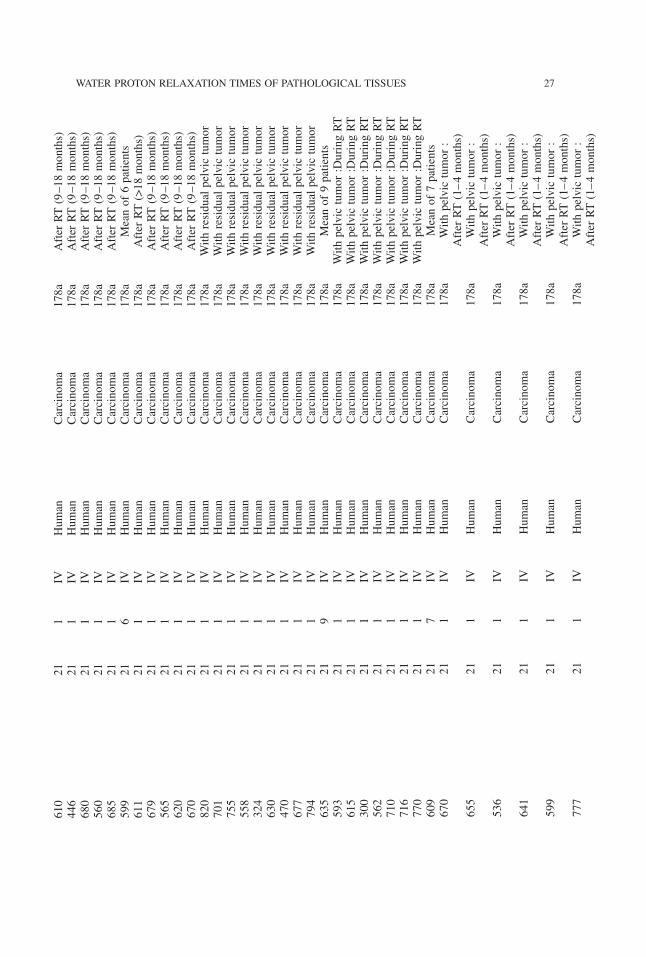
610
211
IVHuman
Carcinoma
178a
AfterRT(9–18months)
446
211
IVHuman
Carcinoma
178a
AfterRT(9–18months)
680
211
IVHuman
Carcinoma
178a
AfterRT(9–18months)
560
211
IVHuman
Carcinoma
178a
AfterRT(9–18months)
685
211
IVHuman
Carcinoma
178a
AfterRT(9–18months)
599
216
IVHuman
Carcinoma
178a
Meanof6patients
611
211
IVHuman
Carcinoma
178a
AfterRT(>18months)
679
211
IVHuman
Carcinoma
178a
AfterRT(9–18months)
565
211
IVHuman
Carcinoma
178a
AfterRT(9–18months)
620
211
IVHuman
Carcinoma
178a
AfterRT(9–18months)
670
211
IVHuman
Carcinoma
178a
AfterRT(9–18months)
820
211
IVHuman
Carcinoma
178a
Withresidualpelvictumor
701
211
IVHuman
Carcinoma
178a
Withresidualpelvictumor
755
211
IVHuman
Carcinoma
178a
Withresidualpelvictumor
558
211
IVHuman
Carcinoma
178a
Withresidualpelvictumor
324
211
IVHuman
Carcinoma
178a
Withresidualpelvictumor
630
211
IVHuman
Carcinoma
178a
Withresidualpelvictumor
470
211
IVHuman
Carcinoma
178a
Withresidualpelvictumor
677
211
IVHuman
Carcinoma
178a
Withresidualpelvictumor
794
211
IVHuman
Carcinoma
178a
Withresidualpelvictumor
635
219
IVHuman
Carcinoma
178a
Meanof9patients
593
211
IVHuman
Carcinoma
178a
Withpelvictumor:DuringRT
615
211
IVHuman
Carcinoma
178a
Withpelvictumor:DuringRT
300
211
IVHuman
Carcinoma
178a
Withpelvictumor:DuringRT
562
211
IVHuman
Carcinoma
178a
Withpelvictumor:DuringRT
710
211
IVHuman
Carcinoma
178a
Withpelvictumor:DuringRT
716
211
IVHuman
Carcinoma
178a
Withpelvictumor:DuringRT
770
211
IVHuman
Carcinoma
178a
Withpelvictumor:DuringRT
609
217
IVHuman
Carcinoma
178a
Meanof7patients
670
211
IVHuman
Carcinoma
178a
Withpelvictumor:
AfterRT(1–4months)
655
211
IVHuman
Carcinoma
178a
Withpelvictumor:
AfterRT(1–4months)
536
211
IVHuman
Carcinoma
178a
Withpelvictumor:
AfterRT(1–4months)
641
211
IVHuman
Carcinoma
178a
Withpelvictumor:
AfterRT(1–4months)
599
211
IVHuman
Carcinoma
178a
Withpelvictumor:
AfterRT(1–4months)
777
211
IVHuman
Carcinoma
178a
Withpelvictumor:
AfterRT(1–4months)
WATER PROTON RELAXATION TIMES OF PATHOLOGICAL TISSUES 27
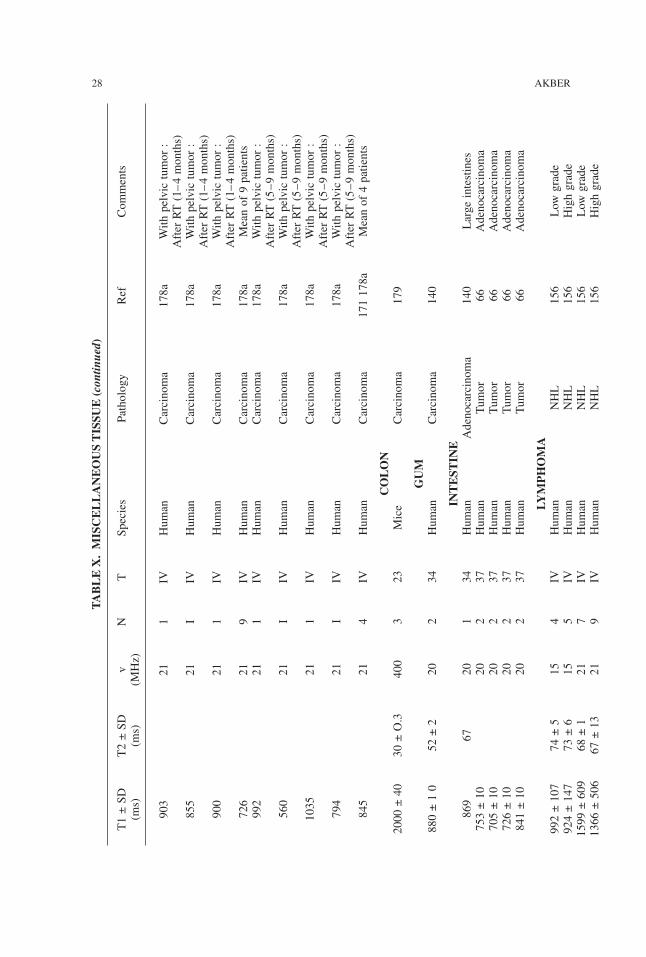
TABLE
X.M
ISCELLANEO
USTIS
SUE
(con
tinue
d)
T1±SD
T2±SD
vN
TSpecies
Pathology
Ref
Comments
(ms)
(ms)
(MHz)
903
211
IVHuman
Carcinoma
178a
Withpelvictumor:
AfterRT(1–4months)
855
21I
IVHuman
Carcinoma
178a
Withpelvictumor:
AfterRT(1–4months)
900
211
IVHuman
Carcinoma
178a
Withpelvictumor:
AfterRT(1–4months)
726
219
IVHuman
Carcinoma
178a
Meanof9patients
992
211
IVHuman
Carcinoma
178a
Withpelvictumor:
AfterRT(5–9months)
560
21I
IVHuman
Carcinoma
178a
Withpelvictumor:
AfterRT(5–9months)
1035
211
IVHuman
Carcinoma
178a
Withpelvictumor:
AfterRT(5–9months)
794
21I
IVHuman
Carcinoma
178a
Withpelvictumor:
AfterRT(5–9months)
845
214
IVHuman
Carcinoma
171178a
Meanof4patients
CO
LO
N2000±40
30±O.3
400
323
Mice
Carcinoma
179
GUM
880±10
52±2
202
34Human
Carcinoma
140
INTEST
INE
869
6720
134
Human
Adenocarcinoma
140
Largeintestines
753±10
202
37Human
Tumor
66Adenocarcinoma
705±10
202
37Human
Tumor
66Adenocarcinoma
726±10
202
37Human
Tumor
66Adenocarcinoma
841±10
202
37Human
Tumor
66Adenocarcinoma
LYM
PH
OM
A992±107
74±5
154
IVHuman
NHL
156
Low
grade
924±147
73±6
155
IVHuman
NHL
156
Highgrade
1599±609
68±1
217
IVHuman
NHL
156
Low
grade
1366±506
67±13
219
IVHuman
NHL
156
Highgrade
28 AKBER
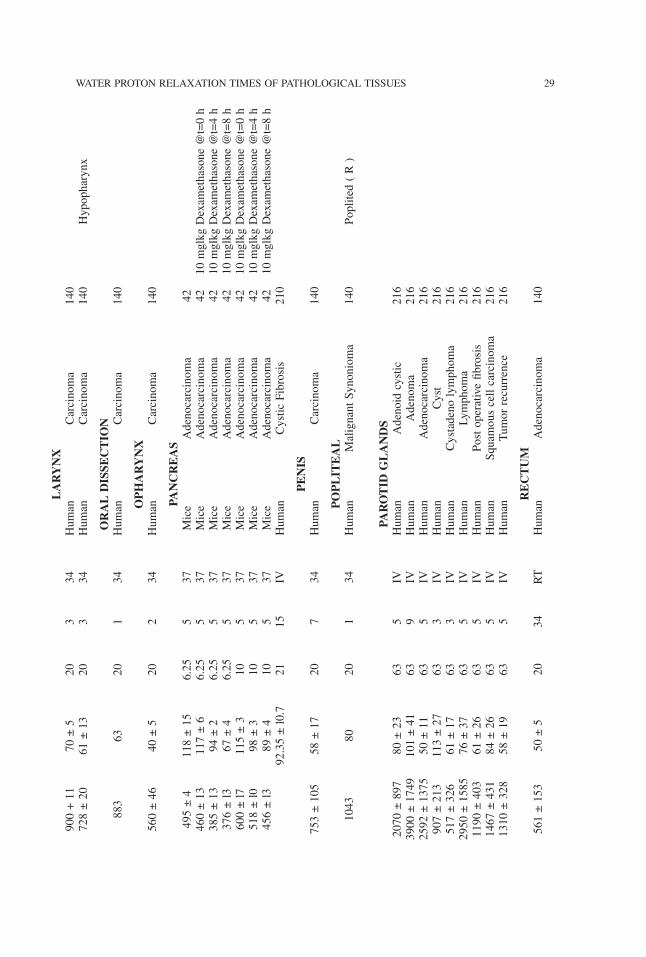
LARYNX
900+11
70±5
203
34Human
Carcinoma
140
728±20
61±13
203
34Human
Carcinoma
140
Hypopharynx
ORAL
DIS
SECTIO
N883
6320
134
Human
Carcinoma
140
OPH
ARYNX
560±46
40±5
202
34Human
Carcinoma
140
PANCREAS
495±4
118±15
6.25
537
Mice
Adenocarcinoma
42460±13
117±6
6.25
537
Mice
Adenocarcinoma
4210mglkgDexamethasone@t=0h
385±13
94±2
6.25
537
Mice
Adenocarcinoma
4210mglkgDexamethasone@t=4h
376±l3
67±4
6.25
537
Mice
Adenocarcinoma
4210mglkgDexamethasone@t=8h
600±l7
115±3
105
37Mice
Adenocarcinoma
4210mglkgDexamethasone@t=0h
518±l0
98±3
105
37Mice
Adenocarcinoma
4210mglkgDexamethasone@t=4h
456±l3
89±4
105
37Mice
Adenocarcinoma
4210mglkgDexamethasone@t=8h
92.35±l0.7
2115
IVHuman
CysticFibrosis
210
PENIS
753±105
58±17
207
34Human
Carcinoma
140
PO
PLIT
EAL
1043
8020
134
Human
MalignantSynonioma
140
Poplited(R)
PAROTID
GLANDS
2070±897
80±23
635
IVHuman
Adenoidcystic
216
3900±1749
101±41
639
IVHuman
Adenoma
216
2592±1375
50±11
635
IVHuman
Adenocarcinoma
216
907±213
113±27
633
IVHuman
Cyst
216
517±326
61±17
633
IVHuman
Cystadenolymphoma
216
2950±1585
76±37
635
IVHuman
Lymphoma
216
1190±403
61±26
635
IVHuman
Postoperativefibrosis
216
1467±431
84±26
635
IVHuman
Squamouscellcarcinoma
216
1310±328
58±19
635
IVHuman
Tumorrecurrence
216
RECTUM
561±153
50±5
2034
RT
Human
Adenocarcinoma
140
WATER PROTON RELAXATION TIMES OF PATHOLOGICAL TISSUES 29
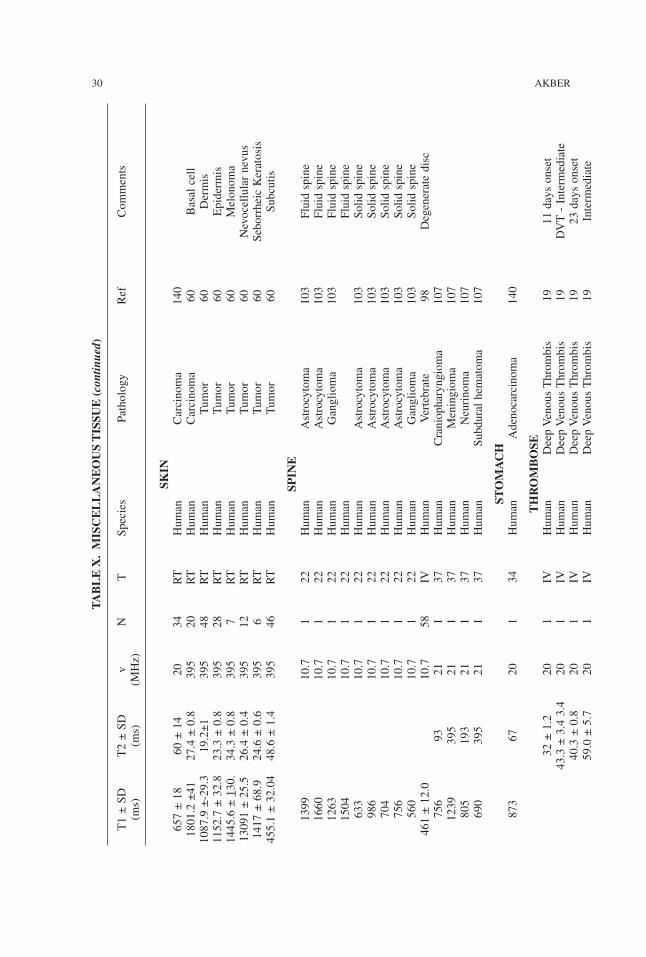
TABLE
X.M
ISCELLANEO
USTIS
SUE
(con
tinue
d)
T1±SD
T2±SD
vN
TSpecies
Pathology
Ref
Comments
(ms)
(ms)
(MHz)
SKIN
657±18
60±14
2034
RT
Human
Carcinoma
140
1801.2±41
27.4±0.8
395
20RT
Human
Carcinoma
60Basalcell
1087.9±-29.3
19.2±1
395
48RT
Human
Tumor
60Dermis
1152.7±32.8
23.3±0.8
395
28RT
Human
Tumor
60Epidermis
1445.6±1 30.
34.3±0.8
395
7RT
Human
Tumor
60Melonoma
13091±25.5
26.4±0.4
395
12RT
Human
Tumor
60Nevocellularnevus
1417±68.9
24.6±0.6
395
6RT
Human
Tumor
60SeborrheicKeratosis
455.1±32.04
48.6±1.4
395
46RT
Human
Tumor
60Subcutis
SPIN
E1399
10.7
122
Human
Astrocytoma
103
Fluidspine
1660
10.7
122
Human
Astrocytoma
103
Fluidspine
1263
10.7
122
Human
Ganglioma
103
Fluidspine
1504
10.7
122
Human
Fluidspine
633
10.7
122
Human
Astrocytoma
103
Solidspine
986
10.7
122
Human
Astrocytoma
103
Solidspine
704
10.7
122
Human
Astrocytoma
103
Solidspine
756
10.7
122
Human
Astrocytoma
103
Solidspine
560
10.7
122
Human
Ganglioma
103
Solidspine
461±12.0
10.7
58IV
Human
Vertebrate
98Degeneratedisc
756
9321
137
Human
Craniopharyngioma
107
1239
395
211
37Human
Meningioma
107
805
193
211
37Human
Neurinoma
107
690
395
211
37Human
Subduralhematoma
107
STO
MACH
873
6720
134
Human
Adenocarcinoma
140
TH
RO
MBO
SE32±1.2
201
IVHuman
DeepVenousThrombis
1911daysonset
43.3±3.43.4
201
IVHuman
DeepVenousThrombis
19DVT-Intermediate
40.3±0.8
201
IVHuman
DeepVenousThrombis
1923daysonset
59.0±5.7
201
IVHuman
DeepVenousThrombis
19Intermediate
30 AKBER
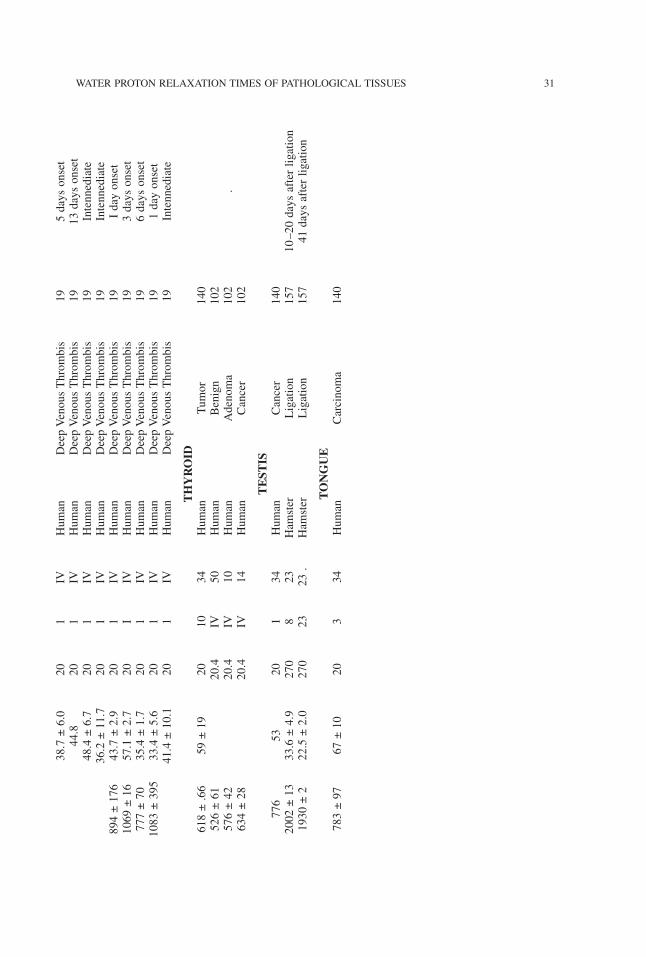
38.7±6.0
201
IVHuman
DeepVenousThrombis
195daysonset
44.8
201
IVHuman
DeepVenousThrombis
1913daysonset
48.4±6.7
201
IVHuman
DeepVenousThrombis
19Intennediate
36.2±11.7
201
IVHuman
DeepVenousThrombis
19Intennediate
894±176
43.7±2.9
201
IVHuman
DeepVenousThrombis
19Idayonset
1069±16
57.1±2.7
20I
IVHuman
DeepVenousThrombis
193daysonset
777±70
35.4±1.7
201
IVHuman
DeepVenousThrombis
196daysonset
1083±395
33.4±5.6
201
IVHuman
DeepVenousThrombis
191dayonset
41.4±10.1
201
IVHuman
DeepVenousThrombis
19Intennediate
TH
YRO
ID618±.66
59±19
2010
34Human
Tumor
140
526±61
20.4
IV50
Human
Benign
102
576±42
20.4
IV10
Human
Adenoma
102
.634±28
20.4
IV14
Human
Cancer
102
TEST
IS776
5320
134
Human
Cancer
140
2002±13
33.6±4.9
270
823
Hamster
Ligation
157
10–20daysafterligation
1930±2
22.5±2.0
270
2323.
Hamster
Ligation
157
41daysafterligation
TO
NG
UE
783±97
67±10
203
34Human
Carcinoma
140
WATER PROTON RELAXATION TIMES OF PATHOLOGICAL TISSUES 31
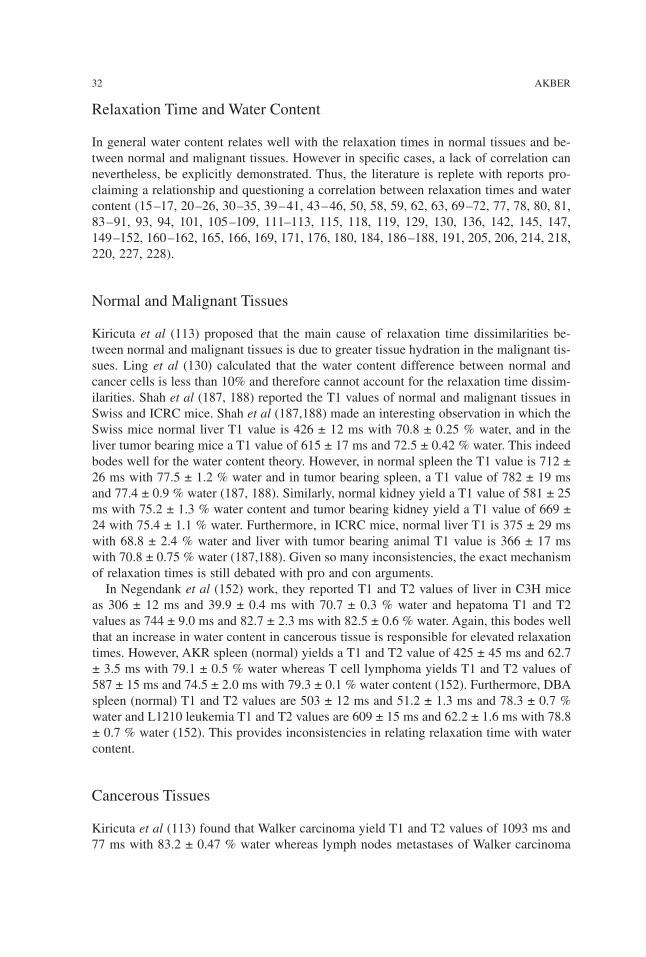
Relaxation Time and Water Content
In general water content relates well with the relaxation times in normal tissues and be-tween normal and malignant tissues. However in specific cases, a lack of correlation cannevertheless, be explicitly demonstrated. Thus, the literature is replete with reports pro-claiming a relationship and questioning a correlation between relaxation times and watercontent (15–17, 20–26, 30–35, 39–41, 43–46, 50, 58, 59, 62, 63, 69–72, 77, 78, 80, 81,83–91, 93, 94, 101, 105–109, 111–113, 115, 118, 119, 129, 130, 136, 142, 145, 147,149–152, 160–162, 165, 166, 169, 171, 176, 180, 184, 186–188, 191, 205, 206, 214, 218,220, 227, 228).
Normal and Malignant Tissues
Kiricuta et al (113) proposed that the main cause of relaxation time dissimilarities be-tween normal and malignant tissues is due to greater tissue hydration in the malignant tis-sues. Ling et al (130) calculated that the water content difference between normal andcancer cells is less than 10% and therefore cannot account for the relaxation time dissim-ilarities. Shah et al (187, 188) reported the T1 values of normal and malignant tissues inSwiss and ICRC mice. Shah et al (187,188) made an interesting observation in which theSwiss mice normal liver T1 value is 426 ± 12 ms with 70.8 ± 0.25 % water, and in theliver tumor bearing mice a T1 value of 615 ± 17 ms and 72.5 ± 0.42 % water. This indeedbodes well for the water content theory. However, in normal spleen the T1 value is 712 ±26 ms with 77.5 ± 1.2 % water and in tumor bearing spleen, a T1 value of 782 ± 19 msand 77.4 ± 0.9 % water (187, 188). Similarly, normal kidney yield a T1 value of 581 ± 25ms with 75.2 ± 1.3 % water content and tumor bearing kidney yield a T1 value of 669 ±24 with 75.4 ± 1.1 % water. Furthermore, in ICRC mice, normal liver T1 is 375 ± 29 mswith 68.8 ± 2.4 % water and liver with tumor bearing animal T1 value is 366 ± 17 mswith 70.8 ± 0.75 % water (187,188). Given so many inconsistencies, the exact mechanismof relaxation times is still debated with pro and con arguments.In Negendank et al (152) work, they reported T1 and T2 values of liver in C3H mice
as 306 ± 12 ms and 39.9 ± 0.4 ms with 70.7 ± 0.3 % water and hepatoma T1 and T2values as 744 ± 9.0 ms and 82.7 ± 2.3 ms with 82.5 ± 0.6 % water. Again, this bodes wellthat an increase in water content in cancerous tissue is responsible for elevated relaxationtimes. However, AKR spleen (normal) yields a T1 and T2 value of 425 ± 45 ms and 62.7± 3.5 ms with 79.1 ± 0.5 % water whereas T cell lymphoma yields T1 and T2 values of587 ± 15 ms and 74.5 ± 2.0 ms with 79.3 ± 0.1 % water content (152). Furthermore, DBAspleen (normal) T1 and T2 values are 503 ± 12 ms and 51.2 ± 1.3 ms and 78.3 ± 0.7 %water and L1210 leukemia T1 and T2 values are 609 ± 15 ms and 62.2 ± 1.6 ms with 78.8± 0.7 % water (152). This provides inconsistencies in relating relaxation time with watercontent.
Cancerous Tissues
Kiricuta et al (113) found that Walker carcinoma yield T1 and T2 values of 1093 ms and77 ms with 83.2 ± 0.47 % water whereas lymph nodes metastases of Walker carcinoma
32 AKBER
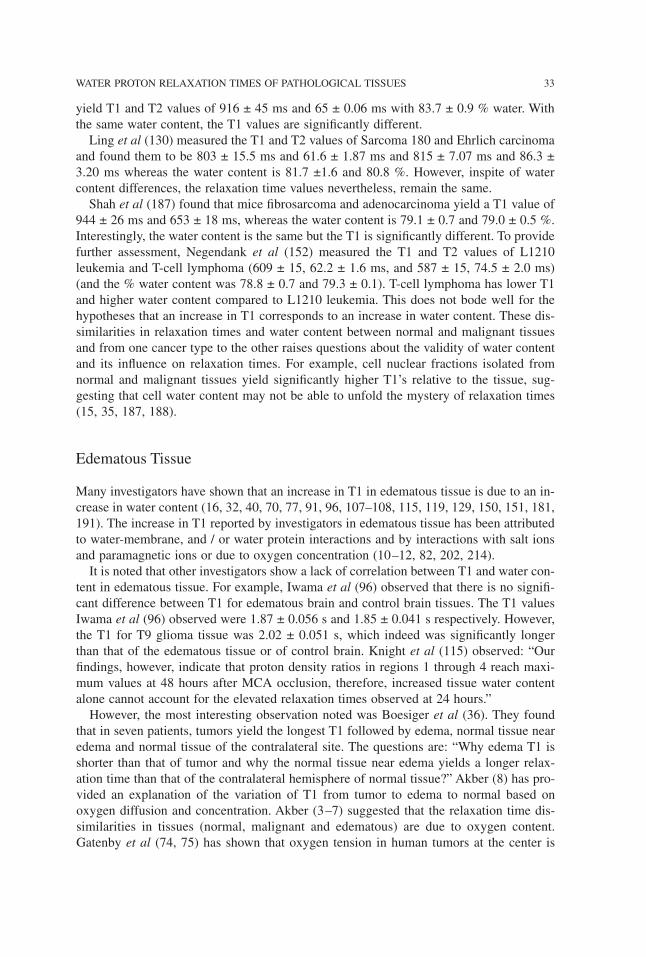
yield T1 and T2 values of 916 ± 45 ms and 65 ± 0.06 ms with 83.7 ± 0.9 % water. Withthe same water content, the T1 values are significantly different.Ling et al (130) measured the T1 and T2 values of Sarcoma 180 and Ehrlich carcinoma
and found them to be 803 ± 15.5 ms and 61.6 ± 1.87 ms and 815 ± 7.07 ms and 86.3 ±3.20 ms whereas the water content is 81.7 ±1.6 and 80.8 %. However, inspite of watercontent differences, the relaxation time values nevertheless, remain the same.Shah et al (187) found that mice fibrosarcoma and adenocarcinoma yield a T1 value of
944 ± 26 ms and 653 ± 18 ms, whereas the water content is 79.1 ± 0.7 and 79.0 ± 0.5 %.Interestingly, the water content is the same but the T1 is significantly different. To providefurther assessment, Negendank et al (152) measured the T1 and T2 values of L1210leukemia and T-cell lymphoma (609 ± 15, 62.2 ± 1.6 ms, and 587 ± 15, 74.5 ± 2.0 ms)(and the % water content was 78.8 ± 0.7 and 79.3 ± 0.1). T-cell lymphoma has lower T1and higher water content compared to L1210 leukemia. This does not bode well for thehypotheses that an increase in T1 corresponds to an increase in water content. These dis-similarities in relaxation times and water content between normal and malignant tissuesand from one cancer type to the other raises questions about the validity of water contentand its influence on relaxation times. For example, cell nuclear fractions isolated fromnormal and malignant tissues yield significantly higher T1’s relative to the tissue, sug-gesting that cell water content may not be able to unfold the mystery of relaxation times(15, 35, 187, 188).
Edematous Tissue
Many investigators have shown that an increase in T1 in edematous tissue is due to an in-crease in water content (16, 32, 40, 70, 77, 91, 96, 107–108, 115, 119, 129, 150, 151, 181,191). The increase in T1 reported by investigators in edematous tissue has been attributedto water-membrane, and / or water protein interactions and by interactions with salt ionsand paramagnetic ions or due to oxygen concentration (10–12, 82, 202, 214).It is noted that other investigators show a lack of correlation between T1 and water con-
tent in edematous tissue. For example, Iwama et al (96) observed that there is no signifi-cant difference between T1 for edematous brain and control brain tissues. The T1 valuesIwama et al (96) observed were 1.87 ± 0.056 s and 1.85 ± 0.041 s respectively. However,the T1 for T9 glioma tissue was 2.02 ± 0.051 s, which indeed was significantly longerthan that of the edematous tissue or of control brain. Knight et al (115) observed: “Ourfindings, however, indicate that proton density ratios in regions 1 through 4 reach maxi-mum values at 48 hours after MCA occlusion, therefore, increased tissue water contentalone cannot account for the elevated relaxation times observed at 24 hours.”However, the most interesting observation noted was Boesiger et al (36). They found
that in seven patients, tumors yield the longest T1 followed by edema, normal tissue nearedema and normal tissue of the contralateral site. The questions are: “Why edema T1 isshorter than that of tumor and why the normal tissue near edema yields a longer relax-ation time than that of the contralateral hemisphere of normal tissue?” Akber (8) has pro-vided an explanation of the variation of T1 from tumor to edema to normal based onoxygen diffusion and concentration. Akber (3–7) suggested that the relaxation time dis-similarities in tissues (normal, malignant and edematous) are due to oxygen content.Gatenby et al (74, 75) has shown that oxygen tension in human tumors at the center is
WATER PROTON RELAXATION TIMES OF PATHOLOGICAL TISSUES 33
low and there exists a gradient of oxygen tension from tumor to normal tissue. It is alsowell known that normal tissue close to tumors exhibit longer T1 than normal tissue with-out tumor (23).
Relaxation Time and Paramagnetic Ions
The possibility that the paramagnetic ions in the biological systems might unfold the mys-tery of relaxation times mechanisms have been argued with pro and con arguments (8, 11,31, 34, 44, 48, 51, 52, 53, 64, 65, 83, 88, 126, 131–134, 127, 152, 154, 170, 184, 187,188).
Normal and Cancerous Tissues
Regarding paramagnetic ions and the dissimilarities in T1 values between normal and ma-lignant tissues; an interesting paradox can be assessed from the work of Shah et al (187).In Swiss mice normal tissues (non-tumor bearing (NTB)) and mouse fibrosarcoma tumorbearing (TB) tissues, non-tumor bearing (NTB) spleen has higher paramagnetic ions(Fe=965 ± 64; Cu = 20 ± 1; Mn = 8.7 ± 1.8 ug/g) than tumor bearing spleen (Fe = 454;Cu 14.3 ± 3.1; Mn = 4.1 ± 0.9 ug/g) and the T1 values in non-TB spleen (712 ± 19 ms)is not much different than TB spleen (782 ± 19 ms). In non-TB spleen, Fe and Mn ionsare twice the amount compared to TB spleen. This defies all the arguments put forth byinvestigators that such large amount of Fe and Mn in non-TB spleen fails to lowerT1 value. Furthermore, in Shah’s work, the T1 values of ICRC mice liver in non-tumorbearing mice is 375 ± 29 ms while the paramagnetic ions are (Fe = 715 ± 78, Cu + 11.6± 2.0, and Mn = 2.3 ± 0.23 ug/g) while the T1 value in tumor bearing liver is 366 ± 17ms while the paramagnetic ion contents are (Fe = 809, Cu = 24.5 ± 1.21, and Mn = 5.0 ±1.1 ug/g). Inspite of the higher paramagnetic ion content in tumor bearing liver, the T1 isalmost the same.Negendank et al (152) observed that in DBA spleen (normal) the T1 value is 511 ± 67
ms, T2 value is 61.3 + 3.0 ms and spleen leukemia (L1210) is 542 ± 12 ms T2 is 61.7 ±1.3 ms whereas the paramagnetic ion contents are (Mn = 10.7 ± 0.2, Cu = 45.7 ± 1.3, Fe= 13.3 ± 3.40 umol / kg) and (Mn = 10.2 ± 2.6, Cu = 44.5 ± 3.5, Fe = 7.6 ± 0.18 umol/kg).Inspite of lower paramagnetic ion content in spleenic leukemia, the T1 values are not sig-nificantly different.
Cancerous Tissues
Ling et al (131, 132, 134) measured the T1 values of Sarcoma 180 and Ehrlich carcinomaand found them to be 803 ± 15.5 ms and 815 ± 7.07 ms whereas the paramagnetic ioncontent in Sarcoma 180 is (Fe 124 ± 4.32; Cu = 29.1, Mn = 0.0 umol/kg) and Ehrlich car-cinoma is (Fe = 29.5 ± 12.6, Cu = 23.5 ± 2.4, Mn ± 0.8 umol/kg). Inspite of several foldincrease in Fe ion content of Sarcoma 180, the T1 values of the two cancerous tissuesremain the same. Furthermore, Ling et al (131, 132, 134) also observed that AS 30 D
34 AKBER
hepatoma yield a T1 value of 843.6 ± 16.4 ms and paramagnetic ion content of (Mn =0.03 ± 0.03, Cu = 40.0 ± m8.7, Fe = 126 ± 11.7 umol / kg). Comparing with either theEhrlich carcinoma or Sarcoma 180, the AS-30 D hepatoma has much higher Fe and Cucontent than either of the other two cancer tissues but AS-30 D hepatoma yields a longerT1 than the other two cancer tissues.Negendank et al (152) on the other hand, observed the T1 values in AKR spleen lym-
phoma and DBA spleen L1210 leukemia and the T1 values are 587 ± 15 ms and 609 ±15 ms respectively. The paramagnetic ions are (Mn = 8.6 ± 1.1, Cu = 20.2 ± 2.4, Fe = 6.6± 14 umol / kg) and (Mn = 7.7 ± 3, Cu = 32.8 ± 12, Fe = 10.7 ± 6.8 umol / kg). It is in-teresting to observe that leukemia has higher Cu, and Fe content and still yields a longerT1 than lymphoma.
Relaxation Time and Protein Content
It is often conjectured that since a fraction of the cell water is bound to the protein sur-face, the mere presence or absence of protein in a cell may dictate the relaxation time ofwater protons (41, 43, 44, 48, 62, 78, 83, 85, 93, 116, 117, 158, 171, 177).Ranade (171) determined the protein content of the involved and uninvolved human tis-
sues with different types of cancer. According to Ranade: “Estimated levels of the proteincontent of normal and malignant tissues by themselves did not correlate with elevation ofT1 values.”In spite of claim and counter claim of relaxation time correlation with protein content,
protein content has not been proven to elucidate the relaxation mechanism.
Conclusion
It appears from the published data that generally malignant tissues yield a longer relax-ation time compared to normal tissues. The exact mechanism to elucidate the relaxationtime dissimilarities between normal and malignant tissue still remains elusive. As dis-cussed in this paper, explanations have ranged — increase in water content, influence ofparamagnetic ions, presence of protein in a cell and oxygen content. The assessment thatcan be drawn from the preceding discussion, is that as of yet, we do not have an under-standing / mechanisms to account for the relaxation time dissimilarities in normal tissues,normal and malignant tissues or among malignant tissues.
References
1. Ahmad, M., Johnson, R.F., Fawcett, H.D., Screiber, M.H. (1988) MRI 6:527.2. Aisen, P.M., Doi, K., Swanson, S.D. (1994) Magn Reson Med 31:551.3. Akber, S.F. (1987) Med Phys 14:1090.4. Akber, S.F. (1988) Med Hypotheses 26:187.5. Akber, S.F. (1989) Europ J Radiol 9:56.6. Akber, S.F. (1989) Europ J Radiol 9:198.7. Akber, S.F. (1990) Acta Radiologica 31:541.
WATER PROTON RELAXATION TIMES OF PATHOLOGICAL TISSUES 35
8. Akber, S.F. (1992) Physiol Chem Phys & Med NMR 24:71.9. Akber, S.F. (1992) Physiol Chem Phys & Med NMR 24:329.10. Akber, S.F. (1992) Med Hypotheses 37:24.11. Akber, S.F. (1993) Nuklearmedizin 32:52.12. Akber, S.F. (1996) Physiol Chem Phys & Med NMR 28:205.13. Anderson, T., Ericksson, A., Eriksson, B., Hernmingsson, A., Lindh, E., Nyman, R., Oberg,
K. (1989) Br J Radiol 62:433.14. Armspach, J.P., Gounot, D., Rurmbach, L., Charnbron, J. (1991) MRI 9:107.15. Arulmozhi, V., Narayanan, S., Krishnan, B., Rao, A.S., Veliath, A.J., Ratnakur, C. (1988)
Physiol Chem Phys & Med NMR 20:337.16. Bakay, L., Kurland, R.J., Parrish, R.G., Lee, J.C., Peng, R.J., Bartkowski, H.M. (1975) Exp
Brain Research 23:241.17. Bakker, C.J., Vriend, J. (1984) Phys Med Biol 29:509.18. Barbosa, S., Blumhardt, L.D., Roberts, N., Lock, T., Edwards, R.H.T. (1994) MRI 12:33.18a. Barbier, E.L., Liu, L., Grillone, E., Payen, J.F., Lebas, J.F., Segebarth, C., Remy, C. (2005)
NMR in Biomedicine 18:499.18b. Barkhof, F., Van Walderveen, M. (1999) Phil Trans R Soc London B354:1675.19. Bass, J.C., Hedlund, L.W., Sostman, H.D. (1990) MRI 8:631.20. Beall, P.T., Hazlewood, C.F., Rao, P.N. (1974) Science 192:904.21. Beall, P.T., Asch, B.B., Chang, D.C., Medina, D., Hazlewood, C.F. (1980) J Natl Cancer
Inst 64:335.22. Beall, P.T., Brinkley, B.R., Chang, D.C., Hazlewood, C.F. (1982) Cancer Res 42:4124.23. Beall, P.T., Hazlewood, C.F. (1983) Distinction of the normal, preneoplastic, and neoplastic
states by water proton NMR relaxation times. In: Nuclear Magnetic Resonance (NMR) Imag-ing. (C. L. Partain, E. James and F.D. Rollo, eds), W.B. Saunders, Philadelphia, p. 312.
24. Bederson, J.E., Bartkowski, R.B., Moon, K., Halks-Miller, M., Nishimura, M.C., Brant-Zawadski, M., Pitts, L.H. (1986) J Neurosurg 64:795.
25. Belton, P.S., Jackson, R.R., Packer, K.J. (1972) Biochim Biophys Acta 286: 16.26. Belton, P., Packer, K. (1974) Biochim Biophys Acta 354: 305.27. Benson, L., Hemmingsson, A., Ericsson, A., Jung, B., Sperber, G., Thuomas, K.A., Wester-
mark, P. (1987) Acta Radiol 28 :13.28. Bernardino, M.E., Chaloup, J.C., Malko, J.A., Chezmar, J.L., Nelson, R.C. (1989) MRI
7:363.29. Besson, J.A.O., Corrigan, F.M., Cherryman, G.R., Smith, F.W. (1987) Br J Psychiatry
150:161.30. Besson, J.A.O., Greentree, S.G., Foster, M.A., Remmington, J.E. (1989) MRI 7:141.31. Blicharska, B., Florkowski, Z., Hennel, J.W., Held, G., Noak, F. (1970) Biochem Biophys
Acta. 207:381.32. Biosvert, D.P., Handa, Y., Allen, P.D. (1990) Proton relaxation in acute and subacute is-
chemic brain edema. In: Brain Edema Pathogenesis, Imaging and Therapy (D.M. Long, ed.),Raven Press, New York.
33. Block, R.E. (1973) FEBS Lett 34:109.34. Block, R.E., Maxwell, G.P. (1974) J Magn Reson 14:329.35. Block, R.E., Maxwell, G.P., Branam, D.L. (1971) J Natl Cancer Inst 59:1731.36. Boesiger, P., Greiner, R., Schoepflin, R.E., Kann, R., Kuenzi, U. (1990) MRI 8:491.37. Bottomley, P.A., Foster, T.I., Argesinger, R.E., Pfeirfer, L.M. (1984) Med Phys 11: 425.38. Bottomley, P.A., Foster, T.I., Argesinger, R.E., Pfeirfer, L.M. (1987) Med Phys 14:1.39. Bovee, W., Huisman, P., Smidt, J. (1974) J Natl Cancer Inst 52:595.40. Boxt, L.M., Hsu, D., Katz, J., Detweiler, P., McLaughlin, S., Kolb, T.J., Spotnitz, H.M. (1993)
MRI 11:375.41. Bratton, C.B., Hopkins, A.L., Weinberg, J.W. (1965) Science 147:738.42. Braunschweiger, P.C., Reynolds, K., Nelson, T.R., Maring, E. (1987) MRI 5:483.43. Brown, M.F., Ellena, J.F., Trindle, C., Williams, G.D. (1986) J Chem Phys 84:1.
36 AKBER
44. Cameron, I.L., Virgina, A., Ord, B.A., Fullerton, G.D. (1984) MRI 2:97.45. Cerdan, S., Lotscher, H.R., Kunnecke, B., Seelig, J. (1989) Magn Reson Med 12:151.46. Chang, D.C., Rorschach, H.E., Hazlewood, C.F., Nichols, B.L. (1973) Ann NY Acad Sci
704:434.47. Chen, J.H., Avram, H.E., Crooks, L.E., Arakawa, M., Kaufman, L., Brito, A.C. (1992) Ra-
diology 184:427.48. Civan, M.M., Shporer, M. (1975) Biophys J 15:299.49. Clement, O., Frija, G., Charnbon, C., Schouman-Clayes, E. (1992) Invest Radiol 27:230.50. Clifford, J. (1968) In: Membrane Models and the Function of Biological Membranes. (Bolis
L, Pethica BA, eds.), Amsterdam: Proc Int Conf Bio Membr, NATOAdvanced Study Institute,North Holland Publishing Co., p. 19.
51. Cooke, R., Wein, R. (1973) Ann NY Acad Sci 204:197.52. Cope, F.W. (1969) Biophys J 9:303.53. Cottom, G.L., Vasek, A., Lusted, D. (1972) Res Comm Chem Pathol Pharmacol 4: 495.54. Damadian, R. (1971) Science 171:1151.55. Damadian, R., Zaner, K., Hor, D. (1973) Physiol Chem Phys & Med NMR 5:381.56. Damadain, R., Zaner, K., Hor, D., DiMaio, T. (1974) Proc Natl Acad Sci 71:1471.57. Diesbourg, L.D., Prato, F.S., Wisenberg, G., Drost, D.J., Marshall, T.P., Carroll, S.E., O’Neill,
B. (1992) Magn Reson Med 23:239.58. Ebara, M., Josephsen, P., Karle, H., Juhl, E., Soresen, P.G., Henrickson, O. (1986) Radiol-
ogy 159:371.59. Eggleston, C., Saryan, L.A., Hollis, D.P. (1975) Cancer Research 35:1326.60. el Gammal, S., Hartwig, R., Aygen, S., Bauermann, T., el Gammal, C., Altmeyer, P. (1996)
J Invest Dermatol 106:1287.61. Egglin, T.K., Rummeny, E., Stark, D.D., Wittenberg, J., Saini, S.F., Ferrucci, J.T. (1990) Ra-
diology 176:107.62. Escanye, J.M., Canet, D., Robert, J. (1982) Biochim Biophys Acta 721:305.63. Escanye, J.M., Canet, D., Robert, J. (1984) J Magn Reson 58:118.64. Fahlvik, A.E., Holtz, E., Klaveness, J.O. (1990) MRI 8:363.65. Fahlvik, A.E., Holtz, E., Leander, P., Schroder, U., Klaveness, J. (1990) Invest Radiol 25:
113.66. Fantazzini, P., Sarra, A. (1996) Magma 4:157.67. Fatorous, P.P., Marmarou, A., Kreft, K.A., Schwaz, P.P. (1991) Magn Reson Med 17:402.68. Fiel, R.J., Button, T.M., Gilani, S., Mark, E.H., Musser, D.A., Henkelman, R.M., Bronskill,
M.J., Van-Heteren, J.G. (1987) MRI 5: 149.69. Fowler, P.A., Casey, C.E., Cameron, G.G., Foster, M.A., Knight, C.R. (1990) Br J Obst Gy-
naecol 97:595.70. Fu, Y., Tanaka, K., Nishimura, S. (1990) Evaluation of brain edema using magnetic reso-
nance proton relaxation times. In: Brain Edema Pathogenesis. Imaging and Therapy (D.M.Long, ed.), Raven Press, New York.
71. Fung, B.M. (1977) Biochim Biophys Acta 497:317.72. Fung, B.M, Wassil, D., Durham, D.L., Chestnut, R.W., Durham, N.N., Berlin, K.D. (1975)
Biochim Biophys Acta 385:180.73. Gasperini, C., Horsfield, M.A., Thorpe, J.W., Kidd, D., Barker, G.J., Tofts, P.S., MacManus,
D.G., Thompson, A.J., Miller, D.H., McDonald, W.I. (1996) J Magn Reson Imaging 6:580.74. Gatenby, R.A., Coia, L.R., Katz, H., Moldofsky, P.J., Engstrom, P., Brown, D.Q., Brookland,
R., Broder, G.J. (1985) Radiology 156:211.75. Gatenby, R.A., Kessler, A.H.B., Rosenblum, J.S., Coia, L.R., Moldofsky, P.J., Hartz, W.H.,
Broder, G.J. (1988) Intl J Rad Oncol Biol Phys 14:831.76. Glazer, G.M., Orringer, M.B., Chenevert, T.L., Borrello, J.A., Penner, M.W., Quint, L.E., Li,
K.C., Aisen, A.M. (1988) Radiology 168:429.76a. Geiser, F., Murtz, P., Lutterberg, G., Traber, F., Block, W., Imbierowicz, K., Schilling, G.,
Schild, H., Liedtke, R. (2001) Psychosomatic Med 63:631.
WATER PROTON RELAXATION TIMES OF PATHOLOGICAL TISSUES 37
77. Go, K.G., Edzes, H.T. (1975) Arch Neurol 17:462-465.78. Gore, J.C. (1983) Pathophysiological significance of relaxation. In: Nuclear Magnetic Res-
onance (NMR) Imaging. (C. L. Partain, E. James and F.D. Rollo, eds.). W.B. Saunders,Philadelphia.
79. Gruss, L.P., Newhouse, J.H. (1996) JCAT 20:792.79a. Griffin, C.M., Dehmehski, J., Chard, D.T., Parker, C.J., Barker, G.J., Thompson, A.J., Miller,
D.H. (2002) Mult Scler 8:211.80. Haacke, E.M., Mitchell, J., Lee, D. (1990) MRI 8:79.81. Hansen, J.R. (1971) Biochim Biophys Acta 230:482.82. Hausser, R., Noack, F.Z. (1965) Naturforschg 20a:1668.83. Hazlewood, C. (1979) In: Cell Assocaited Water. (W. Drost-Hansen, and J.S. Clegg, eds.).
Academic Press, NY pp. 165–259.84. Hazlewood, C., Chang, D.C., Nichols, B.L., Woessner, D.E. (1974) Biophys J 14:583.85. Hazlewood, C.F., Nichols, B.L., Chamberlain, N.F. (1969) Nature 222: 747.86. Hazlewood, C.F., Nichols, B.L., Chang, D.C., Brown, B. (1971) Johns Hopkins Med J
128:117.87. Hoehn-Berlage, M., Tolxdorff, T., Bockhorst, K., Okada, Y., Ernestus, R.I. (1992) MRI
10:935.88. Hollis, D.P., Economou, J.S., Parks, L.C., Eggleston, J.C., Saryan, L.A., Czeisler, J.L. (1973)
Cancer Res 33:2156.89. Hollis, D.P., Saryan, L.A., Economou, J.S., Eggleston, J.C., Czeisler, J.L., Morris, H.P. (1974)
J Natl Cancer Inst 53:807.90. Hollis, D.P., Saryan, L.A., Eggleston, J.C., Morris, H.P. (1975) J Natl Cancer Inst 54: 1469.91. Horikawa, Y., Naruse, S., Tanaka, C., Harikawa, K., Nishikawa, H. (1975) Stroke 17:1149.91a. Hosch, W., Block, M., Libicher, M., Ley, S., Hegenbart, U., Dengler, T.J., Kahus, H., Kauc-
zor, H.U., Kauffmann, G.W., Kristen, A.V. (2007) Invest Radiol 42:636.92. Houdek, P.V., Landy, H.J., Quencer, R.M., Sattin, W., Polle, C.A., Harmon, C.A., Pisciotta, V.,
Schwade, J.G. (1988) Intl J Rad Oncol Biol Phys 15:213.93. Huggert A, Odeblad E. (1958) Acta Radiol 51:385.94. Inch, W.R., McCredie, J.A., Knispel, R.R., Thompson, R.T., Pintar, M.M. (1974) J Natl
Cancer Inst 52:353.95. Iwama, T., Yamada, H., Era, S., Sogami, M., Andoh, T., Sakai, N., Kato, K., Kuwata, K.,
Watari, H. (1992) Magn Reson Med 24:53.96. Iwama, T., Yamada, H., Andoh, T., Sakai, N., Era, S., Sogami, M., Kuwata, K., Watari, H.
(1992) Magn Reson Med 25:78.97. Jacobs, D.O., Settle, R.G., Clarke, J.R., Trerotola, S.O., Sachdeva, A.K., Wolf, G.L.,
Rombeau, J.L. (1990) J Surg Res 48:107.97a. Jayakumar, P.N., Srikanth, S.G., Chandrashekar, H.S., Subbakrishna, D.K. (2007) Clinical
Radiology 62:370.98. Jenkins, J.P.R., Stehling, M., Sivewright, G., Hickey, D.S., Isherwood, I. (1989) MRI 7:17.99. Jensen, K.E., Grube, T., Thomson, C., Sorrenson, P.G., Christoffersen, P., Karle, H., Henrik-
sen, O. (1988) MRI 6:291.100. Jensen, K.E., Sorensen, P.G., Thomsen, C., Christofferson, P., Henricksen, O., Karle, H.
(1990) Acta Radiologica 31:361 & 31:445.101. Jezernik, M., Sentjurc, M., Schara, M. (1983) Acta Neurochir-Wien 67:1.102. Johnson, M., Selinsky, B., Davis, M., Lawrence, T.L., Cleveland, G., Perry, J.R., Thomas,
C.G. (1989) Invest Radiol 24: 666.103. Jungreis, C.A., Chandra, R., Kricheff, I., Chuba, J.V. (1988) Invest Radiol 23:12.104. Just, M., Higer, H.P., Schwarz, M., Bohl, J., Fries, G., Pfannenstiel, P., Thelen, M. (1988)
MRI 6:463.105. Just, M., Thelen, M. (1988) Radiology 169:779.106. Kallman, R.F., DeNardo, G.L., Stasch, M.J. (1972) Cancer Res 32:483.107. Kamman, R.L., Go, K.G., Brouwer, W., Berendson, H.J.C. (1988) Magn Reson Med 6:265.
38 AKBER
108. Kamman, R.L., Go, K.G., Berendsen. (1990) Proton magnetic resonance relaxation times inbrain edema. In: Brian Edema Pathogenesis. Imaging and Therapy (D.M. Long, ed.), RavenPress, New York.
109. Kaneoke, Y., Furuse, M., Inao, S., Saso, K., Yoshida, K., Motegi, Y., Mizuno, M., Izawa, A.(1987) MRI 5:415.
110. Karlik, S.J., Wong, C., Gilbert, J.J., Noseworthy, J.R. (1989) MRI 7:463.111. Kasturi, S.R. (1985) Physiol Chem Phys & Med NMR 17:387.112. Kato, H., Kogure, K., Ohtomo, H., Izumiyama, M., Tobita, M., Matsui, S. (1986) J Cereb
Blood Flow Metab 6:212.113. Kiricuta, I.C., Simplaceanu, V. (1975) Cancer Res 35:1164.114. Kjaer, L., Thomsen, C., Gjerris, F., Mosdal, B., Henricksen, O. (1991) Acta Radiologica 32:498.115. Knight, R.A., Dereski, Mo, Halpern, J.A., Ordidge, R.J., Chopp, M. (1994) Stroke 25:1252.116. Koenig, S.H., Brown, R.D., Adams, D., Emerson, D., Harrison, C.G. (1984) Biol Chem
244:3283.117. Koenig, S.H., Brown, R.D. III (1985) Invest Radiol 20:297.118. Komu, M., Baba, Y., Tanimoto, A., Finn, J.P., Stark, D.D. (1992) MRI 10: 35.119. Kotwica, Z., Thuomas, K.A., Persson, L. Radiol Diagn (1989) 30:307.120. Kovalikda, Z., Hoehn-Berlage, M.H., Gersonde, K., Porschen, R., Mitter, C., Franke, R.P.
(1987) Radiology 164:543.121. Krombach, G.A., Hahn, C., Tomars, M., Buecker, A., Grawe, A., Gunther, R.W., Kuhl, H.P.
(2007) J Magn Reson Imaging 25:1283.122. Kreft, B.P., Baba, Y., Tanimoto, A., Finn, J.P., Stark, D.D. (1993) Radiology 186:543.123. Kreft, B.P., Tanimoto, A., Leffler, S., Finn, J.P., Oksendal, A.N., Stark, D.D. (1994) J Magn
Reson Imaging 4:373.124. Kurki, T., Komu, M. (1995) MRI 13:379.125. Kurki, T., Lundbom, N., Kormano, M. (1996) J Magn Reson Imaging 6:573.126. Lewa, C.J., Zbytniewski, Z. (1977) Bull Cancer 64:37.127. Li, D., Haacke, E.M., Tarr, R.W., Venkatesan, R., Lin, W., Wielopolski, P. (1996) J Magn
Reson Imaging 6:415.128. Li, K.C.P., Jefferey, R.B., Ning, Sc, Kandil, A., Hahn, G.M., Pike, B., Glover, G., Kosek, J.
(1993) Invest Radiol 28:896.129. Lin, W., Paczynsyski, R.P., Venkatesan, R., He, Y.Y., Powers, W.J., Hsu, Cy, Haacke, E.M.
(1997) Magn Reson Med 38:303.130. Ling, G.N., Tucker, M. (1980) J Natl Cancer Inst 64:1199.131. Ling, G.N. (1983) Physiol Chem Phys & Med NMR 15:511.132. Ling, G.N. (1989) Physiol Chem Phys & Med NMR 21:15.133. Ling, G.N. (1983) Physiol Chem Phys & Med NMR 15:505,134. Ling, G.N. (1990) Kolebic T, Damadian R. Physiol Chem Phys & Med NMR 22:1.135. Liu, Y.H., Hawk, R.M., Ramaprasad, S. (1995) MRI 13:251.136. Lohr, J., Mazurchuk, R.J., Acara, M.A., Nickerson, P.A., Fiel, R.J. (1991) MRI 9:93.137. Lombardo, D.M., Baker, M.E., Spritzer, C.E., Blinder, R., Meyers, W., Herfkens, R.J. (1990)
AJR 155:55.138. Lundbom, N., Katevuo, K., Komu, M., Kurki, T., Kormano, M. (1992) Invest Radiology
27:673.139. Magin, R.L., Bacic, G., Niesman, M.R. (1991) Magn Reson Med 20: 1.140. Mariappan, S.V.S., Subramanian, S., Chandrakumar, N., Rajalakshmi, K.R., Sukumaran, S.S.
(1988) Magn Reson Med 8:119.141. Marzola, P., Maggionit, F., Vicinanza, E., Dapra, M., Cavagna, F.M. (1996) J Magn Reson
7:147.142. Mathur-DeVre, R. (1984) Br J Radiol 57:955.143. Matsumura, M. (1987) Child’s Nerv Syst 3:2.144. Matsumura, K., Nakano, I., Fukuda, N., Ikehira, H., Tateno, Y., Aoki, Y. (1988) Muscle and
Nerve 11:97.
WATER PROTON RELAXATION TIMES OF PATHOLOGICAL TISSUES 39
145. McDouall, J.E.L., Evelhoch, J.L. (1990) Cancer Res 50:363.146. McFarland, E.G., Mayo-Smith, W.W., Saini, S., Hahn, P.F., Goldberg, M.A., Lee, M.J. (1994)
Radiology 193:43.147. Miller, D.H., Johnson, G., Tofts, P.S., MacMamus, D., McDonald, W.I. (1989) Magn Reson
Med 11: 331.148. Misra, L.K., Narayana, P.A. (1989) MRI 7: 277.149. Moser, E., Orr, J.S., Podo, F., Lendinara, L., Canese, R. (1993) MRI 11:865.150. Naruse, S., Horikawa, Y., Tanaka, C., Hirakawa, K., Nishikawa, H., Yoshizaki, K. (1982)
J Neurosurg 56:747.151. Naruse, S., Horikawa, Y., Tanaka, C., Hirakawa, K., Nishikawa, H., Yoshizaki, K. (1986)
MRI 4:293.152. Negandank, W., Corbett, T., Crowley, M., Kellog, C. (1991) Magn Reson Med 18: 280.153. Newcomb, C.H., Van Dyk, J., Hill, R.P. (1994) Intl J Radiat Oncol and Phys 30:125.154. Niemi, P.T., Komu, M.K.E.S., Koskinen, S.K. (1992) J Magn Reson Imaging 2: 197.155. Nyman, R., Rhen, S., Glimelius, B. (1987) Acta Radiologica 28:199.156. Nyman, R., Rhen, S., Ericsson, A., Glimeliud, B., Hagberg, H., Hemmingsson, A., Sundstrom,
C. (1987) Acta Radiologica 28:527.157. Ogawa, E., Ninomiya, H., Yamazaki, K. (1993) J Vet Med Sci 55:683.158. Odeblad, E., Lindstrom, G. Acta Radiologica (1955) 43:469.159. Paajanen, H., Brasch, R.C., Schmiedel, U., Ogan, M. (1987) Acta Radiologica 28:79.160. Paanjanen, H., Grodd, W., Revel, S., Engelstad, B., Brasu, R.C. (1987) MRI 5: 109.161. Parish, R.G., Kurland, R.J., Janese, W.W., Bakay, L. (1974) Science 83:438.162. Pearson, R.T., Duff, I.D., Derbyshire, W., Blanshard, J.M.V. (1974) Biochim Biophys Acta
362:188.163. Peterson, B.S., Gore, J.C., Riddle, M.A., Cohen, D.J., Leckman, J.F. Psychiatry Research
55:205, 1994)164. Petterson, H., Slone, R.M., Spanier, S., Gillespy, T. III, Fitzsimmons, J.R., Scott, K.N. (1988)
Radiology 167:783.165. Pocsik, I., Furo, I., Tompa, K., Neumark, T., Takacs, J. (1986) Biochim Biophys Acta 880:1.166. Polak, J.F., Jolesz, F.A., Adams, D.F. (1988) Invest Radiol 23: 107.167. Pouliquen, D., Rivet, P., Gallier, J., LeJeune, J.J., deCertaines, J.D. (1993) Anti Cancer Res
13:49.168. Quesson, B., Bouzier, A.K., Thiaudiere, E., Delalande, C., Merle, M., Canioni, P. (1997)
J Magn Reson Imaging 7:1076.169. Rajanaygan, V., Febry, M.E., Gore, J.C. (1991) MRI 9:621.170. Rannade, S.S., Shingatgeri, V.M. (1992) Physiol Chem Phys & Med NMR 24:165.171. Rannade, S.S. (1988) Histopathological correlation. In: Nuclear Magnetic Resonance
(NMR) Imaging. Vol. II, (C. L. Partain, E, James and F.D. Rollo, eds.) W.B. Saunders,Philadelphia, p.1101.
172. Reimer, P., Weissleder, R., Lee, A.S., Wittenberg, J., Brady, T.J. (1990) Radiology 177: 729.173. Reimer, P., Weissledar, R., Nickeleit, V., Brady, T.J. (1992) Invest Radiol 27:390.174. Rinck, P.A., Fisher, H.W., Elst, L.V., Haverbeke, Y.V., Muller, R.N. (1988) Radiology
168:843.175. Richards, M.A., Webb, J.A.W., Reznek, R.H., Davis, S.F., Jewell, S.E., Gregory, W.M, (1988)
Br J Radiol 61: 34.176. Rofstad, E.K., Howell, L.R., DeMuth, P., Ceckler, T.L., Sutherland, R.M. (1988) Intl J Rad
Biol 54:635.177. Rorschach, H.E., Hazlewood, C. (1986) J Mag Reson 70:79.178. Saini, S., Stark, D.D., Wittenberg, J., Vici, L.G., Brown, A.S., Ferruci, J.T. (1987) Invest Ra-
diol 22:149.178a. Santoni, R., Bucciolini, M., Chriostrinic, C., Cionini, L., Renzi, R. (1991) Br J Radiol
64:498.179. Sarkar, S.K., Clark, R.K., Rycyna, R.E., Mattingly, M.A., Greig, R. (1989) Magn Reson
Med 12: 268.
40 AKBER
180. Saryan, L.A., Hollis, D.P., Economou, J.S., Eggelston, J.C. (1974) J Natl Cancer Inst52:599.
181. Schad, L.R., Brix, G., Harele, W., Lorenz, W.J., Semmler, W. (1989) J Compt Assist Toma-gra 13:577.
182. Schaefer, S., Malloy, C.R., Katz, J., Parkey, R.W., Buja, M., Willerson, J.T., Peshock, R.M.(1988) J Am Coll Cardiol 12:1064.
183. Schaefer, S., Lange, R.A., Gutekunst, D.P., Parkey, R.W., Willerson, J.T., Peshock, R.M.(1991) Invest Radiol 26: 551.
184. Schmumacher, J.H., Matys, E.R., Clorius, J.H., Hauser, H., Wesch, H., Maier-Borst, W.(1985) Invest Radiol 20:601.
185. Scholz, T.D., Vandenberg, B.F., Fleagle, S.R., Collins, S.M., Kerber, R.E., Skorton, D.J.(1990) Invest Radiol 25:1120.
186. Sergeev, A.I., Murza, L.I., Vexler, V.S. (1988) Studia Biophysica 125:77.187. Shah, S., Ranade, S.S., Phadke, R.S., Kasturi, S.R. (1982) MRI 1:9.188. Shah, S., Ranade, S.S., Phadke, R.S., Kasturi, S.R. (1982) MRI 1: 155.189. Sibbitt, W..L., Brooks, W.M., Haseler, L.J., Griffey, R.H., Frank, L.M., Hart, B.L., Sibbitt,
R.R. (1995) Arthritis & Rheumatism 38:810.190. Shioya, S., Haida, M., Yosiaki, O., Fukuzaki, M., Yamabayashi, H. (1988) Radiology 167:105.191. Shioya, S., Haida, M., Fukuzaki, M., Ono, Y., Tsuda, M., Ohta, Y., Yamabashi, H. (1990)
Magn Reson Med 14:358.192. Shioya, S., Tsuji, C., Kurita, D., Katoh, H., Tsuda, M., Haida, M., Kawana, A., Ohta,Y. (1997)
Radiat Res 148:359.193. Shuter, B., Tofts, P.S., Pope, J.M. (1995) MRI 13:563.194. Skillings, J.R., Bramwell, V., Nicholson, R.L., Prato, F.S., Wells, G. (1991) Cancer 67:1838.195. Smith, S.R., Williams, C.E., Davies, J.M., Edwards, R.H.T. (1989) Radiology 172:805.196. Stevenson, V.L., Gawne-Cain, M.L., Barker, G.J., Thompson, A.J., Miller, D.H. (1997)
J Neurol 244:119.197. Stewart, W.A., Alvord, E.C., Hruby, S., Hall, L.D., Paty, D.W. (1991) Brain 114: 1096.198. Sugimura, K., Yamasaki, K., Kitagaki, H., Tanako, Y., Kono, M. (1987) Radiology 165:541.198a. Sun, Y., Mulkern, R.V., Schmidt, K., Doshi, S., Albert, M.S., Schmidt, N.O., Ziu, M., Black,
P., Carrol, R., Kieran, M.W. (2004) NMR in Biomedicine 17:399.199. Suzuki, M., Kishi, H., Aso, Y., Yashiro, N., Iio, M. (1988) Rad Med 6:263.200. Takeda, M., Katayama, Y., Tsutsui, T., Komeyama, T., Mizusawa, T., Kazuhide, S., Takahashi,
H., Sato, S. (1993) NMR in Biomedicine 6:329.201. Tanimoto, A., Stark, D.D. (1991) Invest Radiol 26:S139.202. Tannock, I. (1976) Oxygen distribution in tumors: Influence on cell proliferation and impli-
cations for tumor therapy. In: Oxygen Transport to Tissues (Gorte J,Reneau D, and Thews G.,eds.) Plenum Press, New York. pp. 599.
203. Tanner, S.F., Clarke, J., Leach, Mo, Mesbahi, M., Nicolson, V., Powles, R., Husband, J.E.,Tait, D. (1996) Br J Radiol 69:1145.
204. Taylor, C.R., Sostman, H.D., Gore, J.C., Smith, G.W. (1987) Invest Radiol 22:621.205. Terrier, F., Revel, D., Alpers, C.E., Reinhold, C.E., Levine, J., Genant, H.K. (1985) Invest Ra-
diol 20:813.206. Terrier, F., Revel, D., Hricack, H., Alpers, C.E., Reinhold, C.E., Levine, J., Higgins, C.B.
(1986) Invest Radiol 21: 221.207. Tanimoto, A., Kuribayashi, S. (2005) Magn Reson Med Sciences 4:53.208. Thomsen, C., Josephsen, P., Karle, H., Juhl, E., Sorrensen, P.G., Hericksen, O. (1990) MRI
8:39.209. Thomsen, C., Josephsen, P., Karle, H., Juhl, E., Sorrensen, P.G., Henricksen, O. (1990) MRI
8:39.210. Tham, R.T., Heyerman, H.G., Falke, T.H., Zwinderman, A.H., Bloem, J.L., Bakker, W.,
Lamers, C.B.H.W. (1991) Radiology 179:183.211. Tousaint, J.F., Kwong, K.K., Mkprau, F., Weisskoff, R.M., Laraia, P.J., Kantor, H.L. (1996)
Magn Reson Med 32:62.
WATER PROTON RELAXATION TIMES OF PATHOLOGICAL TISSUES 41
212. Towner, R.A., Yamaguchi, T., Philbrick, D.J., Holub, B.J., Janzen, E.G., Takahashi, H. (1991)MRI 9:429.
213. Traber, F., Block, W., Layer, G., Braucker, G., Gieseke, J., Kretzer, S., Hasan, I., Schild, H.H.(1996) J Magn Reson Imaging 6:541.
214. Twentyman, P.R., Brown, J.M., Gray, J.W., Franko, A.J., Scoles, M.A., Kallman, R.F. (1980)J Natl Cancer Inst 64:595.
215. Van lom, K.J., Brown, J.J., Perman, W.H., Sandstrom, J.C., Lee, K.H.T. (1991) MRI 9:165.216. Vogl, T.J.., Dresel, S.H.J., Spath, M., Grevers, G., Wilimzig, C., Schedel, Hk, Lissner, J.
(1990) Radiology 177:667.216a.Wagner-Manslan, C., Lukas, P., Herzog, M., Kau, R., Beckers, K. (1994) European Radiol-
ogy 4:314.217. Wahlund, La, Boethius, J., Kindstrand, E., Marions, O., Saaf, J., Wetterberg, L. (1989) MRI
7: 599.218. Walker, P.M., Marie, P.Y., Merzeray, C., Bessieres, M., Escanye, J.M., Karcher, G., Danchin,
N., Mattei, S., Villemet, J.P., Bertrand, A. (1993) Magn Reson Med 29:637.219. Watabe, T., Azuma, T. (1989) AJNR 10:463.220. Weisman, I.D., Bennett, L.H., Maxwell, L.R., Woods, M.W., Burk, D. (1972) Science
178:1288.221. Weissleder, R., Stark, D.D., Elizondo, G., Hahn, P.F., Compton, C., Saini, S., Wittenberg, J.,
Ferrucci, J.T. (1988) MRI 6:675.222. Weissleder, R., Stark, D.D., Compton, C.C., Wittenberg, J., Ferrucci, J.T. (1987) AJR
149:1161.223. Wikstrom, M., Martinussen, H.J., Wikstrom, S., Ericsson, A., Nyman, R., Waldenstrom, A.,
Hemmingsson, A. (1990) Acta Radiologica 31:619.224. Wilmes, L.J., Hoehn-Berlage, M., Els, T., Bockhorst, K., Eis, M., Bonnekoh, P., Hossmann,
K.A. (1993) J Magn Reson Imaging 3:5.225. Yoshida, K., Furuse, M., Kaneoke, Y., Saso, K., Inao, S., Mategi, Y., Ichihara, K., Izawa, A.
(1989) MRI 7:9.226. Zamaroczy, D., Schluesener, Hj, Jlesz, F.A., Sobd, R.A., Colucci, V.H., Weiner, H.L. (1991)
Invest Radiol 26:317.227. Zimmerman, J.R., Brittin, W.E. (1957) J Phys Chem 61: 1328.228. Zipp, A., James, T.L., Kuntz, I.D., Shohet, S.B. (1976) Biochim Biophys Acta 428:291.
Received July 25, 2008;accepted October 1, 2008.
42 AKBER
Physiol. Chem. Phys. & Med. NMR (2008) 40: 43–54
Variation of Substituents on Pirarubicin forEnhancing Response to Hepatocellular
Carcinoma and Pattern Recognition Analysisto Determine Analogy to Parent Drug
Ronald L. Bartzatt
University of NebraskaCollege of Arts & Sciences
Chemistry DepartmentOmaha, Nebraska 68182 USA
E-mail: [email protected]
Abstract: Hepatocellular carcinoma arises from hepatocytes, it is the most common primary ma-lignant tumor of the liver and accounts for the majority of liver cancers. Pirarubicin is a compoundanalog to the antineoplastic anthracycline antibiotic doxorubicin. Thereby as an intercalator ofDNA, pirarubicin has shown efficacy in reducing tumor activity of hepatocellular carcinoma. Uti-lizing in silico optimized similarity of structure search of data base and replacement by isosteres, atotal of nine analogs to pirarubicin were generated. The molecular size of ring substituents (ap-proximately a base pair) were preserved and isosteres chosen to preserve the weak electrostaticproperties permitting DNA intercalation. Only a small range in molecular weight and volume waspermitted in order to preserve intercalation activity. Standard deviations for polar surface area, num-ber of heavy atoms, molecular weight, molecular volume, and number of oxygens and nitrogens,were only 3.98%, 1.76%, 16.5%, 2.51%, and 0 %, respectively, of the overall average for theseproperties. Variation of the target substituent resulted in insignificant changes in many properties;there was a striking variation in the lipophilic property Log P. Values of Log P ranged from 0.142to 2.078 inclusive of pirarubicin and plays an important role in bioavailability. Hierarchical clusteranalysis indicated that all analogs, except analog 6, were substantially similar to pirarubicin. A sim-ilar outcome was obtained from non-metric multidimensional scaling of descriptors. However de-trended correspondence analysis distinguished both analogs 6 and 5 from the remaining analogs andpirarubicin. Nonhierarchical K-means clustering analysis determined greater differentiation amongthe analogs and pirarubicin. Analysis of similarity (ANOSIM) affirmed all compounds to be highlysimilar which shows structural optimization was achieved.
KEY WORDS: hepatocellular carcinoma, DNA intercalation, pirarubicin, intercalators
THE LIVER is the largest gland and organ in the human body with considerable abilityto regenerate (1). Hepatocytes, which comprise 70% to 80% of the liver mass, are in-volved in protein synthesis, detoxification, transformation of carbohydrates, and excretionof exogenous substances (1). Hepatocellular carcinoma (hepatoma) is the most commonprimary malignant tumor of the liver (2) and one of the most common tumors worldwideaccounting for up to 90% of all liver cancers. The majority of hepatocellular carcinomaare secondary to viral liver infections (hepatitis B and C) or cirrhosis (2). While surgery(including transplantation) is effective for small tumors, large or metastasized tumors re-ceive radiation, chemotherapy, and ligation which are not considered curative.Pirarubicin is an analog of the antineoplastic anthracycline antibiotic doxorubicin. The
mode of action is intercalation of DNA (3) and is thought to interact with topoisomeraseII to inhibit RNA and protein synthesis and DNA repair. Drugs acting as intercalators in-sert perpendicularly within DNA without the necessity of covalent bonds (4). Stability ofthe DNA-intercalation is maintained through hydrogen bonding, van der Waals, hy-drophobic, and/or charge transfer forces (4). The large majority of these types of com-pounds have little or no biological activity and those that do have encountered problemswith multidrug resistance (4). These factors motivate the continued search for additionalcompounds of this sort.Pirarubicin has been shown to provide significant benefit in combinatorial treatment of
salivary gland carcinoma (5), operable primary breast cancer (6), resectable oral and max-illary carcinoma (7), acute myeloid leukemia (8), and non-Hodgkin’s lymphoma (9) anduseful when unaccompanied in the clinical treatment of malignant pleural effusion (10).Previous studies have found that pirarubicin injection for cancer treatment produces dox-orubicin as a major plasma metabolite, but with pirarubicinol and doxorubicinol also pre-sent (11). Extensive injections of pirarubicin results in accumulation of metabolitesdoxorubicin and doxorubicinol (11). Pirarubicin entry into blood cells has been deter-mined to be a carrier-mediated process (12). Studies have shown that an increase of pi-rarubicin uptake results in improved antitumor activity that is superior to doxorubicin (13,14). To effectuate the uptake of pirarubicin into the target cell clinicians have shown thata lipiodol-pirarubicin emulsion can increase cytotoxicity on hepatoma cancer cells (15).Hepatic arterial infusion of pirarubicin accompanying systemic chemotherapy was foundto prevent extra-hepatic spread of tumor and prolong survival time (16). A substantiallysuccessful approach to increase pirarubicin uptake into target cancer cells incorporates pi-rarubicin into liposomes which stabilizes and greatly improves accumulation in the liver(17, 18), with reduced adverse effects (17), and increases in antitumor response (17, 18).Problems for clinicians occur due to multidrug resistance to antitumor intercalators in
general (4) and cross-resistance between pirarubicin (also other anthracyclines) and vari-ous other antitumor drugs (albeit pirarubicin shows lower cross-resistance than doxoru-bicin and epirubicin) (19). Therefore problems of multidrug resistance and apparentsuccess of modifying the structure of pirarubicin such as the 3’-deamino- 3’-morpholinoderivative that increased effectiveness (20) clearly supports the contention that exploringvariations of the pirarubicin scaffold may yield designs that improve antitumor activityand length of survival. This work presents nine such variations of pirarubicin and com-prehensive analysis of important pharmaceutical properties.
44 BARTZATT
Methods
Molecular Modeling and Assembly of Constructs
Database search for molecular similarity was accomplished utilizing in silico databasetechnology of Molsoft (Molsoft L.L.C., 3366 North Torrey Pines Court, La Jolla CA92037). The numerical values of molecular properties/descriptors and 2-D molecularmodeling was accomplished through ACD/ChemSketch Molecular Modeling v. 10.00(Advanced Chemistry Development, 110 Yonge Street, Toronto Ontario, M5C 1T4Canada). Other physicochemical properties: polar surface area, violations of Rule of 5,molecular volume, number of oxygens/nitrogens/amines/hydroxyls, were determinedusing Molinspiration (Molinspiration Chemiformatics, Nova ulica 61, SK-900 26 Sloven-sky Grob, Slovak Republic). Visualization of 3-dimensional form was accomplished uti-lizing SPARTAN (Wavefunction, 18401 Von Darman Avenue, Irvine CA 92612 USA).
Pattern Recognition and Elucidation
To identify underlying associations/patterns within the data matrix of numerical values formolecular properties (descriptors) various pattern recognition techniques were applied.Included in application were hierarchical cluster analysis, non-metric multidimensionalscaling analysis, analysis of similarity (ANOSIM), and non-hierarchical K-means clusteranalysis were performed by PAST v. 1.80 (copyright Oyvind Hammer, D.A.T. Harper1999–2008).
Numerical Analysis of Multivariate Matrices
Statistical analysis of all numerical data was performed by Microsoft EXCEL (EXCEL2003). Multiple regression using molecular property numerical values was accomplishedby Smith’s Statistical Package v. 2.75 (copyright G. Smith, Pomona College, ClaremontCA). Correlation analysis for Pearson r was done for all descriptors and was accom-plished by EXCEL (2003).
Results and Discussion
Ligands can interact with DNA through covalent bonding, electrostatic binding, and in-tercalation (21). Intercalating compounds are generally aromatic or heteroaromatic instructure and bind to DNA through insertion and stacking between the base pairs (22).The insertion causes the DNA helix to partially unwind itself at the site of intercalation,the degree of unwinding depends on the intercalating compounds (21, 23). The unwind-ing induces structural changes and inhibits transcription and blocks replication processeswithin the cell (21). The ligand displaces a magnesium and/or sodium ion that surroundthe DNA helix and forms a weak electrostatic bond with the outer surface of the DNA(21). Consequently the flat aromatic/heteroaromatic portion of the intercalator can slideinto the hydrophobic area between the base pairs (whereas the outer environment of theDNA is considered hydrophilic) (21). These interactions can occur within the minor andmajor grooves of the DNA (23). Once in position the intercalate is held by hydrogen
SUBSTITUENTS ON DRUG ACTION 45
bonds, van der Waals’ forces, and charge-transfer bonds (23). It is believed that the inter-calation process is actually energetically favorable because of the readiness of execution(22). The unwinding of the DNA to accommodate the intercalator also interferes with theaction of DNA topoisomerases (22, 23). These effects leading to problems in replicationand eventual cell death (22, 23).Retention of hydrogen bonding sites then is necessary in any analog of pirarubicin to
retain the electrostatic characteristics needed to dislodge magnesium or sodium ions andimplement forces that retain the flat heteroaromatic portion between DNA bases. Hydro-gen bonding being the summation of hydrogen bond donors (amine and hydroxyl groups)and hydrogen bond acceptors (oxygen and nitrogen atoms). The molecular structures ofpirarubicin and nine analogs are presented in Figure 1 with the substituent which is var-ied indicated. Pirarubicin has within the indicated substituents two hydroxyl groups(–OH) and one oxygen (as carbonyl group), giving a total of two hydrogen bond donors,one acceptor (=O) with a total of three donor/acceptor sites. Note that in analogs 2through 10 the varied substituents (enclosed in rectangle) have at least one hydrogen bondacceptor (oxygen of carbonyl group) and at least one hydrogen bond donor (whether asamine –NH or hydroxyl –OH). For all analogs there are at least three hydrogen bonddonor/acceptors within the varied substituent as there are with the parent pirarubicin. Re-membering that the flat heteroaromatic portion inserting between DNA bases remains un-changed, the overall electrostatic characteristic of the analogs remains the same as theparent pirarubicin. Clearly the variation of a substituent of pirarubicin can be accom-plished in a manner that retains important physicochemical properties.Presented in Table I are molecular properties (descriptors) determined for pirarubicin
and nine analogs, that represent vital pharmaceutical traits as well as the physicochemi-cal parameters for electrostatic forces necessary for assimilation between DNA bases.Note that the total number of oxygens and nitrogens (crucial for hydrogen donor/acceptor)remain constant at 13, with the number of amines and hydroxyls changing only 13% fromthe average number for all drugs. Standard deviations for polar surface area, number ofheavy atoms, molecular weight, molecular volume, and number of oxygens and nitrogens,were only 3.98%, 1.76%, 16.5%, 2.51%, and 0 %, respectively, of the average for theseproperties. Variation of the target substituent resulted in insignificant changes in manyproperties. Number of rotatable bonds for this group of drugs has only a small range from6 to 8. While the range of the polar surface area varies only from 187.328 A2 (analog 5)to 215.908 A2 (analogs 4 and 8), these values are sufficiently large to adversely affectbioavailability. These values of polar surface area have been shown to permit less than10% of drug amount in the intestinal system to be absorbed (24). Problems in bioavail-ability are also indicated by the number of violations of the Rule of 5. All analogs (exceptanalog 5 with 2 violations) and pirarubicin have three violations. The Rule of 5 was cre-ated to enhance the selection of potential drug candidates from high throughout screeningand in silico elucidation, both mechanisms producing thousands of candidates. The Ruleof 5 consists of the following parameters, which are important for a drug’s pharmacoki-netics, of which two or more violations suggests the drug will have problems in mem-brane permeation (25): 1) The drug should not have more than 5 hydrogen bond donors;2) The drug should not have more than 10 hydrogen bond acceptors; 3) The formulaweight should not be more than 500; and 4) The drug should not have a Log P of greaterthan 5. Problems with membrane permeation can influence the avenue of drug delivery.All compounds, including pirarubicin, are expected to have difficulties in absorption and
46 BARTZATT
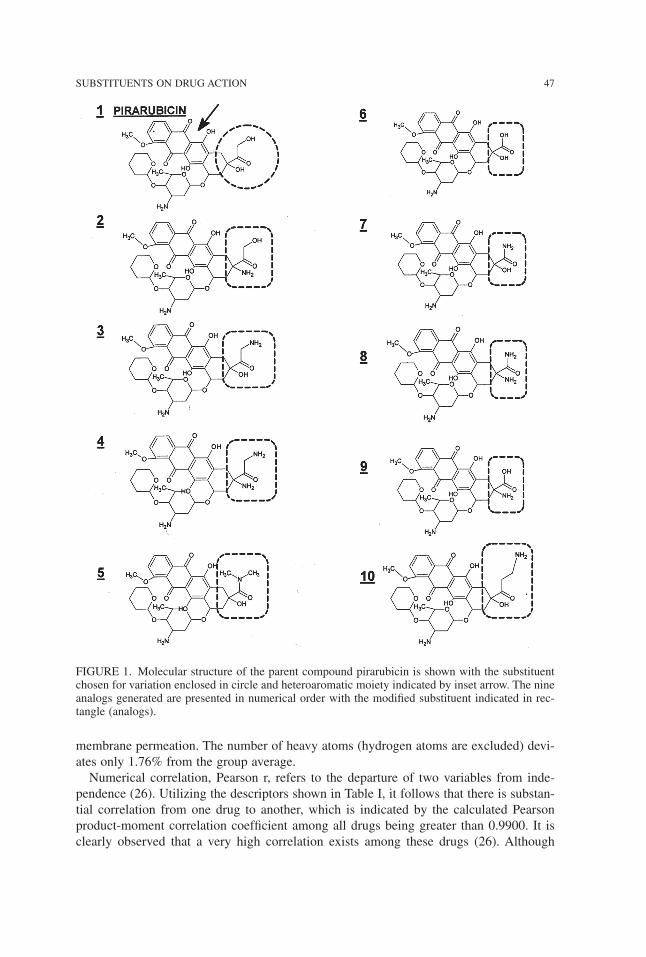
membrane permeation. The number of heavy atoms (hydrogen atoms are excluded) devi-ates only 1.76% from the group average.Numerical correlation, Pearson r, refers to the departure of two variables from inde-
pendence (26). Utilizing the descriptors shown in Table I, it follows that there is substan-tial correlation from one drug to another, which is indicated by the calculated Pearsonproduct-moment correlation coefficient among all drugs being greater than 0.9900. It isclearly observed that a very high correlation exists among these drugs (26). Although
SUBSTITUENTS ON DRUG ACTION 47
FIGURE 1. Molecular structure of the parent compound pirarubicin is shown with the substituentchosen for variation enclosed in circle and heteroaromatic moiety indicated by inset arrow. The nineanalogs generated are presented in numerical order with the modified substituent indicated in rec-tangle (analogs).
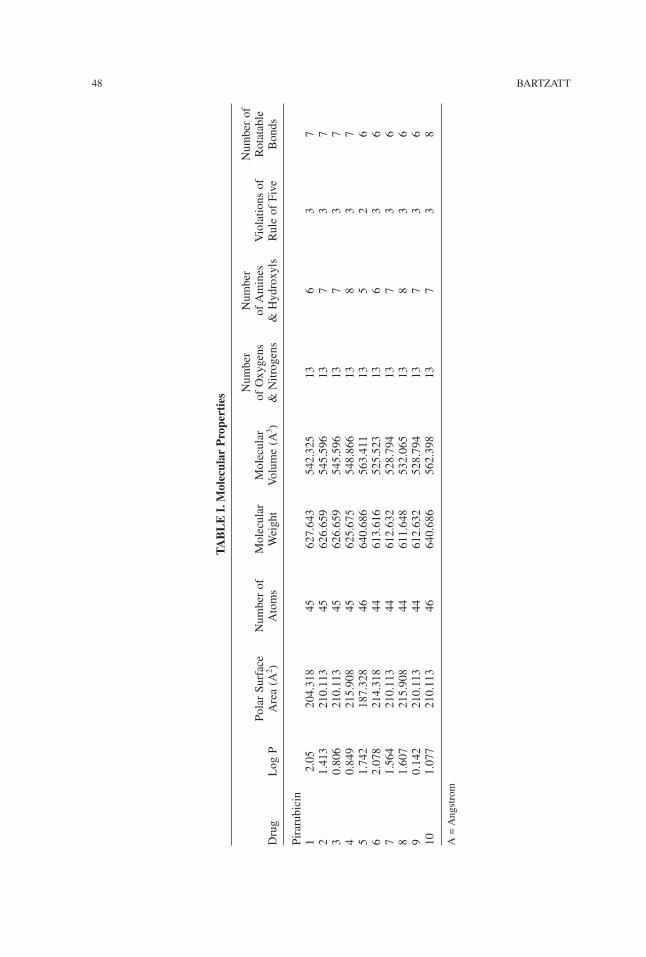
48 BARTZATT
TABLE
I.M
olec
ular
Pro
perties Number
Number
Numberof
PolarSurface
Numberof
Molecular
Molecular
ofOxygens
ofAmines
Violationsof
Rotatable
Drug
LogP
Area(A
2 )Atoms
Weight
Volume(A
3 )&Nitrogens
&Hydroxyls
RuleofFive
Bonds
Pirarubicin
12.05
204.318
45627.643
542.325
136
37
21.413
210.113
45626.659
545.596
137
37
30.806
210.113
45626.659
545.596
137
37
40.849
215.908
45625.675
548.866
138
37
51.742
187.328
46640.686
563.411
135
26
62.078
214.318
44613.616
525.523
136
36
71.564
210.113
44612.632
528.794
137
36
81.607
215.908
44611.648
532.065
138
36
90.142
210.113
44612.632
528.794
137
36
101.077
210.113
46640.686
562.398
137
38
A=Angstrom
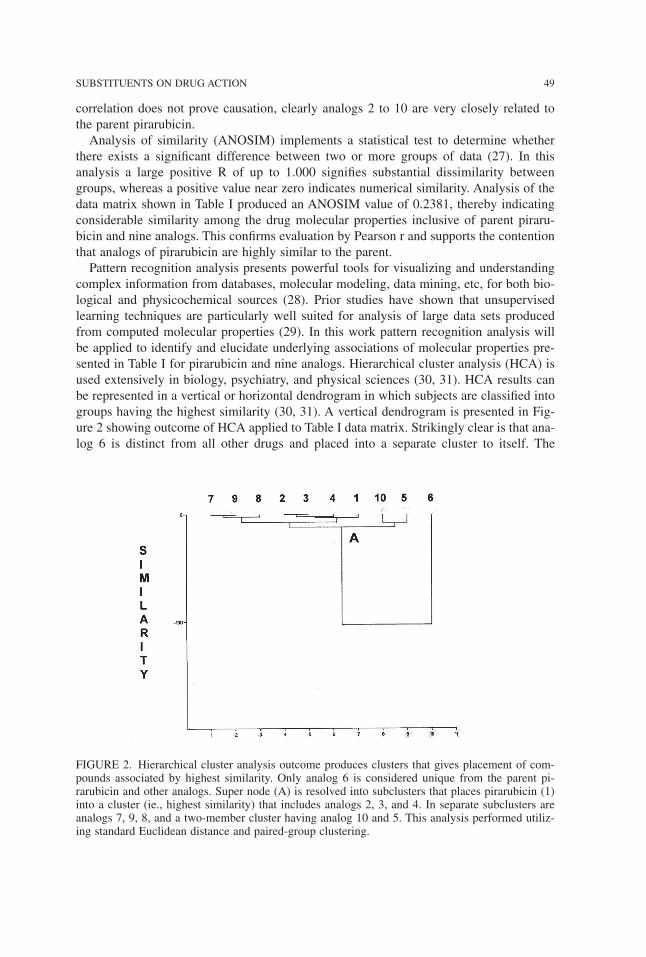
correlation does not prove causation, clearly analogs 2 to 10 are very closely related tothe parent pirarubicin.Analysis of similarity (ANOSIM) implements a statistical test to determine whether
there exists a significant difference between two or more groups of data (27). In thisanalysis a large positive R of up to 1.000 signifies substantial dissimilarity betweengroups, whereas a positive value near zero indicates numerical similarity. Analysis of thedata matrix shown in Table I produced an ANOSIM value of 0.2381, thereby indicatingconsiderable similarity among the drug molecular properties inclusive of parent piraru-bicin and nine analogs. This confirms evaluation by Pearson r and supports the contentionthat analogs of pirarubicin are highly similar to the parent.Pattern recognition analysis presents powerful tools for visualizing and understanding
complex information from databases, molecular modeling, data mining, etc, for both bio-logical and physicochemical sources (28). Prior studies have shown that unsupervisedlearning techniques are particularly well suited for analysis of large data sets producedfrom computed molecular properties (29). In this work pattern recognition analysis willbe applied to identify and elucidate underlying associations of molecular properties pre-sented in Table I for pirarubicin and nine analogs. Hierarchical cluster analysis (HCA) isused extensively in biology, psychiatry, and physical sciences (30, 31). HCA results canbe represented in a vertical or horizontal dendrogram in which subjects are classified intogroups having the highest similarity (30, 31). A vertical dendrogram is presented in Fig-ure 2 showing outcome of HCA applied to Table I data matrix. Strikingly clear is that ana-log 6 is distinct from all other drugs and placed into a separate cluster to itself. The
SUBSTITUENTS ON DRUG ACTION 49
FIGURE 2. Hierarchical cluster analysis outcome produces clusters that gives placement of com-pounds associated by highest similarity. Only analog 6 is considered unique from the parent pi-rarubicin and other analogs. Super node (A) is resolved into subclusters that places pirarubicin (1)into a cluster (ie., highest similarity) that includes analogs 2, 3, and 4. In separate subclusters areanalogs 7, 9, 8, and a two-member cluster having analog 10 and 5. This analysis performed utiliz-ing standard Euclidean distance and paired-group clustering.
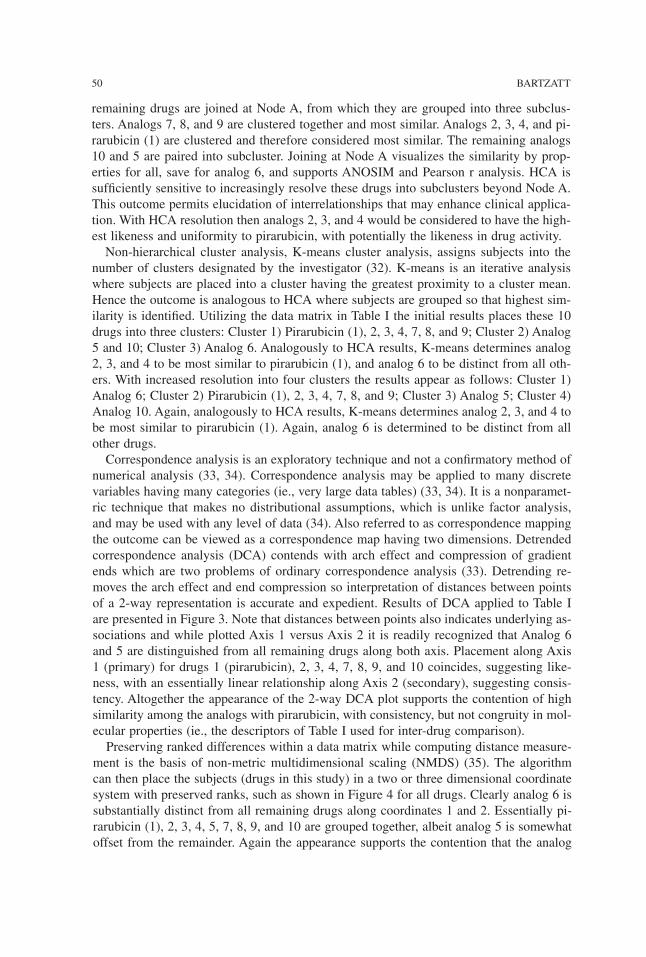
remaining drugs are joined at Node A, from which they are grouped into three subclus-ters. Analogs 7, 8, and 9 are clustered together and most similar. Analogs 2, 3, 4, and pi-rarubicin (1) are clustered and therefore considered most similar. The remaining analogs10 and 5 are paired into subcluster. Joining at Node A visualizes the similarity by prop-erties for all, save for analog 6, and supports ANOSIM and Pearson r analysis. HCA issufficiently sensitive to increasingly resolve these drugs into subclusters beyond Node A.This outcome permits elucidation of interrelationships that may enhance clinical applica-tion. With HCA resolution then analogs 2, 3, and 4 would be considered to have the high-est likeness and uniformity to pirarubicin, with potentially the likeness in drug activity.Non-hierarchical cluster analysis, K-means cluster analysis, assigns subjects into the
number of clusters designated by the investigator (32). K-means is an iterative analysiswhere subjects are placed into a cluster having the greatest proximity to a cluster mean.Hence the outcome is analogous to HCA where subjects are grouped so that highest sim-ilarity is identified. Utilizing the data matrix in Table I the initial results places these 10drugs into three clusters: Cluster 1) Pirarubicin (1), 2, 3, 4, 7, 8, and 9; Cluster 2) Analog5 and 10; Cluster 3) Analog 6. Analogously to HCA results, K-means determines analog2, 3, and 4 to be most similar to pirarubicin (1), and analog 6 to be distinct from all oth-ers. With increased resolution into four clusters the results appear as follows: Cluster 1)Analog 6; Cluster 2) Pirarubicin (1), 2, 3, 4, 7, 8, and 9; Cluster 3) Analog 5; Cluster 4)Analog 10. Again, analogously to HCA results, K-means determines analog 2, 3, and 4 tobe most similar to pirarubicin (1). Again, analog 6 is determined to be distinct from allother drugs.Correspondence analysis is an exploratory technique and not a confirmatory method of
numerical analysis (33, 34). Correspondence analysis may be applied to many discretevariables having many categories (ie., very large data tables) (33, 34). It is a nonparamet-ric technique that makes no distributional assumptions, which is unlike factor analysis,and may be used with any level of data (34). Also referred to as correspondence mappingthe outcome can be viewed as a correspondence map having two dimensions. Detrendedcorrespondence analysis (DCA) contends with arch effect and compression of gradientends which are two problems of ordinary correspondence analysis (33). Detrending re-moves the arch effect and end compression so interpretation of distances between pointsof a 2-way representation is accurate and expedient. Results of DCA applied to Table Iare presented in Figure 3. Note that distances between points also indicates underlying as-sociations and while plotted Axis 1 versus Axis 2 it is readily recognized that Analog 6and 5 are distinguished from all remaining drugs along both axis. Placement along Axis1 (primary) for drugs 1 (pirarubicin), 2, 3, 4, 7, 8, 9, and 10 coincides, suggesting like-ness, with an essentially linear relationship along Axis 2 (secondary), suggesting consis-tency. Altogether the appearance of the 2-way DCA plot supports the contention of highsimilarity among the analogs with pirarubicin, with consistency, but not congruity in mol-ecular properties (ie., the descriptors of Table I used for inter-drug comparison).Preserving ranked differences within a data matrix while computing distance measure-
ment is the basis of non-metric multidimensional scaling (NMDS) (35). The algorithmcan then place the subjects (drugs in this study) in a two or three dimensional coordinatesystem with preserved ranks, such as shown in Figure 4 for all drugs. Clearly analog 6 issubstantially distinct from all remaining drugs along coordinates 1 and 2. Essentially pi-rarubicin (1), 2, 3, 4, 5, 7, 8, 9, and 10 are grouped together, albeit analog 5 is somewhatoffset from the remainder. Again the appearance supports the contention that the analog
50 BARTZATT
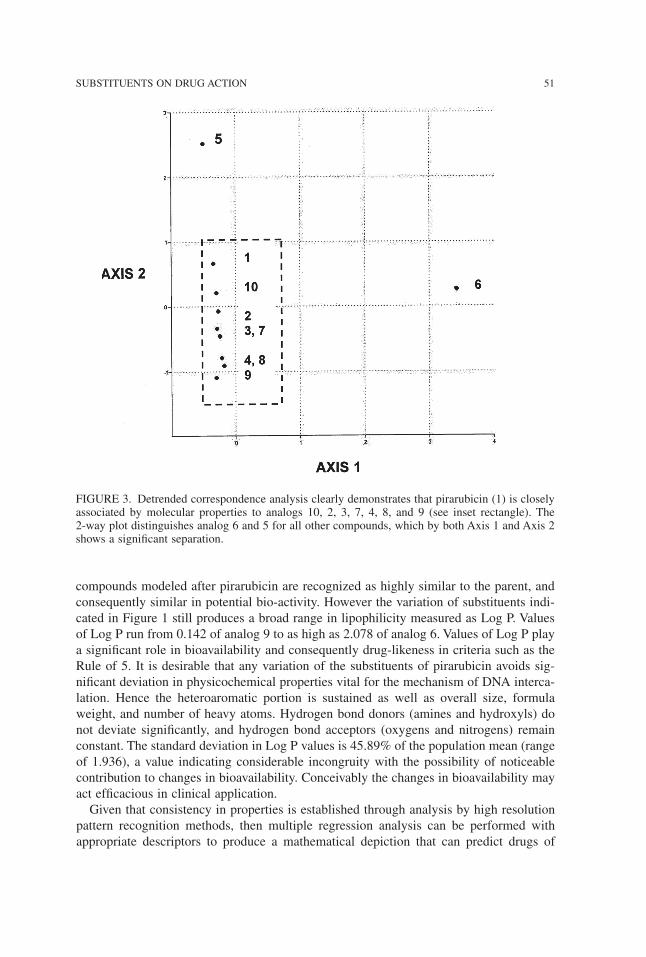
compounds modeled after pirarubicin are recognized as highly similar to the parent, andconsequently similar in potential bio-activity. However the variation of substituents indi-cated in Figure 1 still produces a broad range in lipophilicity measured as Log P. Valuesof Log P run from 0.142 of analog 9 to as high as 2.078 of analog 6. Values of Log P playa significant role in bioavailability and consequently drug-likeness in criteria such as theRule of 5. It is desirable that any variation of the substituents of pirarubicin avoids sig-nificant deviation in physicochemical properties vital for the mechanism of DNA interca-lation. Hence the heteroaromatic portion is sustained as well as overall size, formulaweight, and number of heavy atoms. Hydrogen bond donors (amines and hydroxyls) donot deviate significantly, and hydrogen bond acceptors (oxygens and nitrogens) remainconstant. The standard deviation in Log P values is 45.89% of the population mean (rangeof 1.936), a value indicating considerable incongruity with the possibility of noticeablecontribution to changes in bioavailability. Conceivably the changes in bioavailability mayact efficacious in clinical application.Given that consistency in properties is established through analysis by high resolution
pattern recognition methods, then multiple regression analysis can be performed withappropriate descriptors to produce a mathematical depiction that can predict drugs of
SUBSTITUENTS ON DRUG ACTION 51
FIGURE 3. Detrended correspondence analysis clearly demonstrates that pirarubicin (1) is closelyassociated by molecular properties to analogs 10, 2, 3, 7, 4, 8, and 9 (see inset rectangle). The2-way plot distinguishes analog 6 and 5 for all other compounds, which by both Axis 1 and Axis 2shows a significant separation.
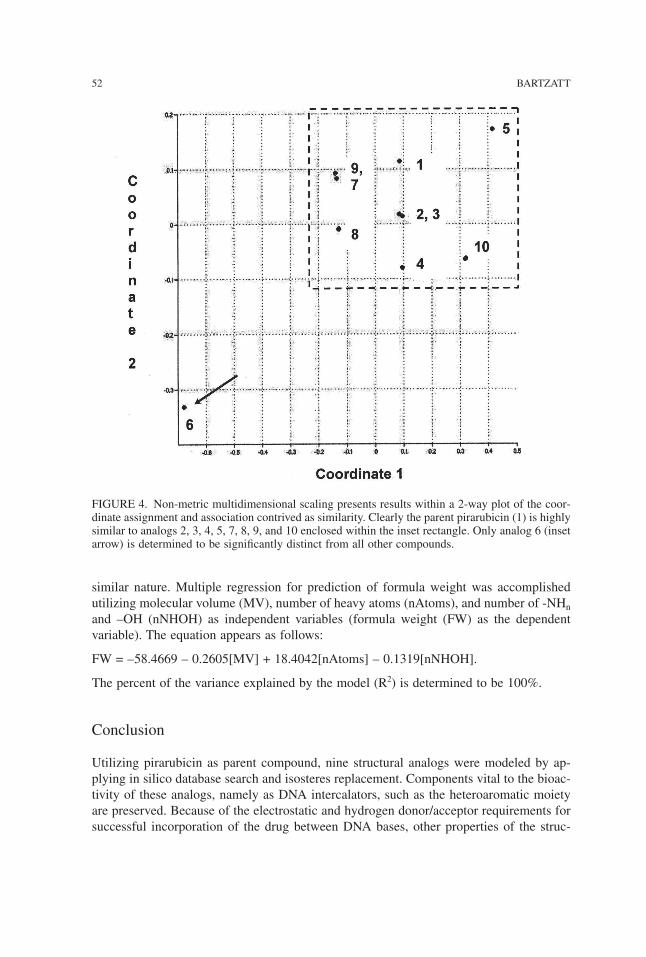
similar nature. Multiple regression for prediction of formula weight was accomplishedutilizing molecular volume (MV), number of heavy atoms (nAtoms), and number of -NHnand –OH (nNHOH) as independent variables (formula weight (FW) as the dependentvariable). The equation appears as follows:
FW = –58.4669 – 0.2605[MV] + 18.4042[nAtoms] – 0.1319[nNHOH].
The percent of the variance explained by the model (R2) is determined to be 100%.
Conclusion
Utilizing pirarubicin as parent compound, nine structural analogs were modeled by ap-plying in silico database search and isosteres replacement. Components vital to the bioac-tivity of these analogs, namely as DNA intercalators, such as the heteroaromatic moietyare preserved. Because of the electrostatic and hydrogen donor/acceptor requirements forsuccessful incorporation of the drug between DNA bases, other properties of the struc-
52 BARTZATT
FIGURE 4. Non-metric multidimensional scaling presents results within a 2-way plot of the coor-dinate assignment and association contrived as similarity. Clearly the parent pirarubicin (1) is highlysimilar to analogs 2, 3, 4, 5, 7, 8, 9, and 10 enclosed within the inset rectangle. Only analog 6 (insetarrow) is determined to be significantly distinct from all other compounds.
tures must be consistent. Variation of target substituents is accomplished, however theoverall hydrogen bond donor and acceptor summation remains consistent. Replacement ofthe hydroxyl (–OH) groups of pirarubicin is accomplished by insertion of –NHn groups,movement of the –OH groups, and maintaining the carbonyl group (C=O). The total num-ber of hydrogen bond acceptors/donors within the varied substituents remains consistent.Powerful and sensitive pattern recognition techniques were utilized to establish the sim-
ilarity of the nine analogs to the parent pirarubicin. These included hierarchical clusteranalysis, K-means cluster analysis, detrended correspondence analysis, and non-metricmultidimensional scaling. Analog 6 consistently appeared to be distinct from all otherdrugs (by HCA, NMDS, and DCA). Analog 5 appeared distinct from all other drugs whenexamined by detrended correspondence analysis. However, pirarubicin is strikingly simi-lar to analogs 2, 3, 4, 7, 8, 9, and 10, through these identical pattern recognition algo-rithms. In addition, Pearson r correlation determination showed high interdrug associationof greater than 0.9900 and ANOSIM outcome showed high similarity at 0.2381. Multipleregression analysis utilized molecular volume, number of heavy atoms, and quantity of–NHn and –OH, to determine an equation for predicting formula weight of similarconstructs.This work demonstrates the efficacy of applying pattern recognition methods to discern
underlying associations among classes of drugs and provide an approach of ascertainingthe effectiveness of analog derivation of parent structure. Pattern recognition permitted theevaluation of the extent of similarity of analogs to the parent compound. Alteration of sub-stituents on pirarubicin did produce additional anticancer drugs with intercalation poten-tial yet retaining vital properties of polar surface area, molecular volume, and hydrogenbond donor/acceptors. Only a wide variance in the lipophilicity Log P descriptor wasobserved, however this feature provides the clinician the potential of applying thesenovel drug analogs beneficially according advantages in permeation and bioavailability.Clearly pattern recognition analysis and substituent derivatization have substantial effi-cacy in the design of novel anticancer drugs for the treatment of challenging hepatocellu-lar carcinoma.
Computer and software support was provided by the Department of Chemistry, College of Arts &Sciences, University of Nebraska, NE 68182 USA.
References
1. Maton, A., Hopkins, J., McLaughlin, C., Johnson, S., Quon, M., Warner, D., Warner, M., La-hart, D., Wright, J. (1993) Human Biology and Health, Englewood Cliffs: Prentice Hall.
2. Dumar, V., Fausto, N., Abbas, A. (2003) Pathologic Basis of Disease, 7th edn. New York:Saunders.
3. Yang, P., Xi, X., Yang, M. (2007) Ziran Kexueban 30(2): 220–223.4. Martinez, R., Chacon-Garcia, L. (2005) Current Med. Chem. 12: 127–151.5. Hideaki, K., Mamoru, T. (2006) Acta Oto-Laryngologica 126(12): 1309–1314.6. Li, J., Ben-Yao, L., Ou, Y., Wang, T. (2004) Chinese Cancer Res. 16(3): 197–202.7. Iguchi, H., Kusuki, M., Nakamura, A., Nishiura, H., Kanazawa, A., Takayama, M., Sunami,
K., Yamane, H. (2004) Acta Oto-Laryngologica 554: 55–61.8. Kudo, K., Kojima, S., Tabuchi, K., Yabe, H., Tawa, A., Imaizumi, M., et al. (2007) J. Clin.
Oncol. 25(34): 5442–5447.
SUBSTITUENTS ON DRUG ACTION 53
9. Jiitsu, N., Umeda, M. (1998) Leukemia 12(9): 1457–1460.10. Gotoh, T., Tanaka, Y., Fujita, Y., Hiramori, N., Fuji, T., Arimoto, T., Iwasaki, Y., Fukabori, T.,
Nakamura, T., Ono, N., Nakagawa, M. (1996) Japanese J. Clin. Oncol. 26: 328–334.11. Robert, J., David, M., Huet, S., Chauvergne, J. (1988) Eur. J. Cancer Clin. Oncol. 24(8):
1289–1294.12. Nagasawa, K., Kitada, N., Tsuji, C., Ogawa, M., Yokoyama, T., Ohnishi, N., Iwakawa, S.,
Okumura, K. (1992) Chem & Pharmaceu. Bull. 40(10): 2866–2869.13. Sugiyama, T., Sadzuka, Y., Miyagishima, A., Nozawa, Y. (1998) Drug Delivery System
13(1): 35–40.14. Sugiyama, T., Sadzuka, Y., Nagasawa, K., Ohnishi, N., Yokoyama, T., Sonabe, T. (1999)
Japanese J. Cancer Res. 90(7): 775–780.15. Favoulet, P., Cercueil, J., Faura, P., Osmsk, L., Isambert, N., Beltramo, J., Cagnet, F., Krause,
D., Bedenne, L., Chauffert, B. (2001) Anticancer Drugs 12(10): 801–806.16. Fallik, D., Ychou, M., Jacob, J., Colin, P., Seitz, J., Baulieux, J., et al. (2003) Ann. Oncol.
14(6): 856–863.17. Kawano, K. (2003) Hoshi Yakka Daigaku Kiyo 45: 23–29.18. Kawano, K., Takayama, K., Nagai, T., Maitani, Y. (2003) Interna J. Pharmaceut. 252(1–2):
73–79.19. Dudov, A., Ilarionova, M., Horvath, L., Todorov, D. (2002) Biotechnology & Biotechnolog-
ical Equipment 16(2): 164–167.20. Keiichi, A., Daishiro, I., Nosaka, C., Komuro, K., Kondo, S., Takeuchi, T. (1990) J. Antibi-
otics 43(11): 1464–1470.21. Richards, A., Rodgers, A. (2007) Chem. Soc. Rev. 36: 471–483.22. Silverman, R. (1992) The Organic Chemistry of Drug Design and Drug Action, New York:
Academic Press.23. Thomas, G. (2000) Medicinal Chemistry, New York: John Wiley & Sons.24. Ertl, P., Rohde, B., Selzer, P. (2000) J. Med. Chem. 43; 3714–3717.25. Lipinski, C., Lombardo, F., Dominy, B., Feeney, P. (2001) Adv. Drug Del. Rev. 46: 3–26.26. Cohen, J. (1988) Statistical Power Analysis for the Behavioral Sciences, 2nd edn. Hillsdale:
Lawrence Erlbaum Associates.27. Clarke, K. (1993) Australian J. Ecol. 18: 117–143.28. Livingston, D. (1991) Methods Enzymol. 203: 613–638.29. Hudson, B., Livingston, D., Rahr, E. (1989) J. Comput. Aided Mol. Des. 3(1):55–65.30. Anderberg, R. (1973) Cluster Analysis for Applications, San Diego: Academic Press.31. Romesburg, C. (1984) Cluster Analysis for Researchers, New York: Life Time Learning.32. Bow, S. (1984) Pattern Recognition, New York: Marcel Dekker.33. Greenacre, M. (1984) Theory and Applications of Correspondence Analysis, New York:
Academic Press.34. Weller, S. Romney, A. (1990) Metric Scaling: Correspondence Analysis. Thousand Oaks:
Sage Publications.35. Davis, J. (1986) Statistics and Data Analysis in Geology, New York: John Wiley & Sons.
Received September 8, 2008;accepted January 12, 2009.
54 BARTZATT
Physiol. Chem. Phys. & Med. NMR (2008) 40: 55–65
Four Hydrazide Compounds that Inhibit theGrowth of Mycobacterium Tuberculosis
Ronald Bartzatt1, Suat L.G. Cirillo2, Jeffrey D. Cirillo2
1University of Nebraska, College of Arts & Sciences, Chemistry Department,Omaha, Nebraska 68182 U.S.A., E-mail: [email protected]
2Texas A & M Health Science Center, Dept. of Microbial and Molecular Pathogenesis,College Station, Texas 77843 U.S.A.
Abstract: Over one-third of the world’s population has been exposed to Mycobacterium tubercu-losis (TB). New drug designs are necessitated by the appearance of multi-drug resistant tuberculo-sis (MDR-TB) and extensively drug-resistant tuberculosis (XDR-TB). This work presents fourhydrazide compounds that inhibit Mycobacterium tuberculosis growth at potency comparable toisoniazid. The hydrazide drugs A, B, C, and D were synthesized utilizing microwave excitationmethodologies. Hydrazide agents are produced from parent carboxyl compounds. All reactions wereaccomplished in dry conditions. Using suitable molecular scaffolds the final hydrazides possessedthe desired properties in Log P, polar surface area, molecular weight, etc. All four hydrazide com-pounds induced at least 60% inhibition of TB at concentrations at less than 31.5 microgram/mL.Measured as relative survival, all four hydrazide compounds induced greater than 95% death of TBbacteria at concentrations less than 31.5 microgram/mL. Drugs A, B, C, D exhibited zero violationsof the Rule of 5, indicating favorable bioavailability. Although isoniazid, A, B, C, and D were de-termined to have a polar surface area less than 70 Angstroms2, the values of Log P (a measurementof lipophilicity) showed a broad range of –1.463 (drug C) to 4.46 (drug A). The numerical valuesof polar surface area suggests that all drugs would have greater than 50% intestinal absorption. Forall drugs the number of amine (-NH) and hydroxyl (-OH) groups remains constant at three, withnumber of oxygens and nitrogens varying only three to four. ANOSIM (analysis of similarity) in-dicated that isoniazid, A, B, C, and D are highly similar. Correlation of molecular properties for allfive drugs is greater than r = 0.9500. Drugs A, B, C, and D are members of two homologous seriesof anti-tuberculosis agents. All hydrazides effectively inhibited TB at 31.5 micrograms/mL andlower concentrations.
KEY WORDS: Mycobacterium tuberculosis, hydrazides, isoniazid, TB, bacteria
THE PRIMARY cause of Mycobacterium tuberculosis (TB) is an aerobic bacteriumwhich divides at an extremely slow rate every 16 to 20 hours (1). While latent TB infec-tion is most common, over one-third of the world’s population has been exposed to TB
bacterium (with death and new cases occurring primarily in developing nations) (2). Theemergence of multi-drug resistant TB (MDR-TB) resistant to isoniazid and rifampicin(of first line drugs ethambutol, isoniazid, pyrazinamide, rifampicin, streptomycin) andextensively drug resistant TB (XDR-TB) resistant to second line drugs (aminoglyco-sides, polypeptides, fluoroquinolones, thioamides, cycloserine, p-aminosalicylic acid)have contributed to the spread of the disease (3). TB replicate within the alveolarmacrophages of the lung forming a primary site referred to as the Ghon focus (4), how-ever all parts of the body can be affected by the disease. A latent infection of TB is usu-ally treated with a single antibiotic, while an active infection is treated withcombinations of several antibiotics (5).The mycobacterial cell wall is extraordinarily thick and consists mainly of long-chain
fatty acids and polysaccharide arabinogalactan (6,7). The cell wall is responsible for thehydrophobicity of TB and helps the bacteria to resist oxidative damage within themacrophages. The thick wall of high lipid content contributes to the difficulty for drugpenetration, but these bacteria are sensitive to heat and ultraviolight light.Isoniazid itself is a prodrug that must be activated by catalase-peroxidase enzyme KatG
to form an isonicotinic acyl anion (or radical). These forms then react with NADH anion(or radical) to an isonicotinic acyl-NADH complex (8). The complex binds tightly to ke-toenoylreductase (InhA) and will prevent access to the natural enoyl-AcpM substrate (8).This process inhibits the synthesis of mycolic acid in the mycobacterial cell wall (8). Pre-vious studies have shown that isoniazid transport to TB proceeds by passive diffusionmechanism and KatG is not involved in the transport (9).To contend with the appearance of MDR-TB and XDR-TB investigators have pursued
novel carrier moieties for isonicotinic acid, such as trans-cinnamic acid derivatives (10)and activating peroxidases (11). Novel drug designs are pursued due to worldwide reportsof MDR-TB resistance to isoniazid and rifampicin, as well as XDR-TB resistance to flu-oroquinolones and aminoglycosides (12). Treatment for TB infections within health facil-ities of Turkey often encounter the MDR-TB form that requires an extensively monitoredand administered combination regimen of three drugs based on susceptibility tests (13).Other studies conducted in Turkey revealed that diabetes mellitus and sexual-intercoursewere risk factors for the development of drug resistance(14). A large number of MDR-TBand XDR-TB cases have been recently reported (2007) in Europe (15), with MDR-TBemerging in Nigeria (16). Within the United States reports from an area hospital indicatethat MDR-TB type infections are not successfully responding to available treatment, withonly half of the patients ultimately having the disease subdued after carefully selected reg-imens (17).These alarming trends clearly indicate the continued exploration of treatment methods
and new/modified drug designs. Presented are four hydrazide agents exhibiting TB inhi-bition at a level that is comparable to isoniazid. In addition, these agents constitute mem-bers of two homologous series of anti-tuberculosis drugs.
Materials and Methods
Reagents and Instrumentation
All solvents and reagents were analytical grade and obtained from Aldrich Company(Milwaukee, WI, USA). Fourier transform infrared spectroscopy was accomplished using
56 BARTZATT et al.
a Mattson Galaxy FTIR, with analytes dissolved in dimethyl sulfoxide (DMSO) that waspreviously dried over molecular sieves. Tissue culture 7H9 broth and 7H9 (M-ADC) agarwere utilized (Difco, Detroit, MI, USA).
Molecular Modeling and Numerical Analysis
Modeling and property determinations were accomplished by ChemSketch v. 5 (ACD, 90Adelaide Street West, Toronto, Ontario Canada). Some properties were determined byEPISUITE v 1.40 (US Environmental Protection Agency, Washington D.C., USA).ANOSIM (analysis of similarity) and multivariate analysis were performed by PAST v.1.28 (Oyvind Hammer, D.A.T. Harper copyright 1999–2004). Correlation analysis wasperformed by Microsoft Excel 2003 (copyright 1985 to 2003).
Culture of Mycobacteria
Mycobacterium tuberculosis strain Erdman (ATCC35801) cultures were grown in Difco7H9 media supplemented with 0.5% glycerol, 10% albumin-dextrose complex (ADC),and 0.25% Tween 80 (M-ADC-TW) for 10 days at 37° C prior to use in experiments.Colony forming units were determined for all cultures and after treatment with anti-microbials by plating dilutions on Difco 7H9 agar and growth until colonies formed at37° C. All drugs were tested within the same length of time period.
Synthesis of Compounds
Prior to use the hydrazine (NH2NH2) must be distilled out from the stock mixture overCaO and NaOH. The anhydrous hydrazine (NH2NH2 ) is collected at 113° C. MicrowaveIrradiation Synthesis of Compounds A, B, C, and D: Place 150 mg of compound intopyrex test tube with 50 µL of SOCl2. Microwave 3 to 5 minutes, then cool. Add about 20mg of Na2CO3 to the mixture and mix. Add 50 µL of anhydrous NH2NH2 and microwaveup to 1 minute. The NaCl formed can be removed by dissolving the preparation in mini-mal water and extracting with ethyl acetate or acetonitrile, which is pooled, dried over an-hydrous magnesium sulfate then evaporated to obtain the final product residue. Thepresence of the hydrazine group was confirmed on 1 through 5 by FTIR, showing peaksat 944 cm–1 for hydrazine and 1000 cm–1 to 1200 cm–1 for C-N stretch (3000 cm–1 to 3500cm–1 N-H stretch).
Results and Discussion
The leading causes of death from a single infectious agent are comprised of TB, malaria,and HIV (18). However, TB remains the important infectious disease causing morbidityand death (18). The most common form is pulmonary TB that is highly contagious andlife threatening (18). The development of new drugs for the clinical treatment of TB is aslow and expensive process which is inhibited by the lack of suitable animal models anddifficulties implementing clinical studies (18). Drugs A, B, C, and D are hydrazide com-pounds that are members of two homologous series of agents and inhibit TB comparablyto isoniazid-a first line TB treatment drug.Previous studies have shown the efficacy of microwave excitation to synthesize hydrazide
agents that inhibit the growth of Mycobacterium tuberculosis (19,20). A homologous
TUBERCULOSIS INHIBITING HYDRAZIDES 57
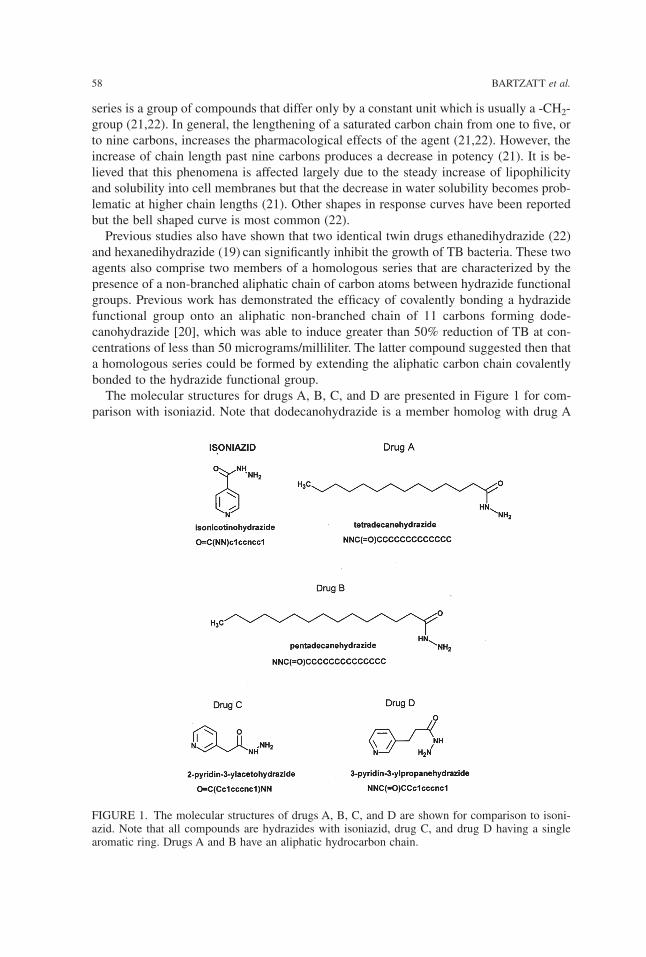
series is a group of compounds that differ only by a constant unit which is usually a -CH2-group (21,22). In general, the lengthening of a saturated carbon chain from one to five, orto nine carbons, increases the pharmacological effects of the agent (21,22). However, theincrease of chain length past nine carbons produces a decrease in potency (21). It is be-lieved that this phenomena is affected largely due to the steady increase of lipophilicityand solubility into cell membranes but that the decrease in water solubility becomes prob-lematic at higher chain lengths (21). Other shapes in response curves have been reportedbut the bell shaped curve is most common (22).Previous studies also have shown that two identical twin drugs ethanedihydrazide (22)
and hexanedihydrazide (19) can significantly inhibit the growth of TB bacteria. These twoagents also comprise two members of a homologous series that are characterized by thepresence of a non-branched aliphatic chain of carbon atoms between hydrazide functionalgroups. Previous work has demonstrated the efficacy of covalently bonding a hydrazidefunctional group onto an aliphatic non-branched chain of 11 carbons forming dode-canohydrazide [20], which was able to induce greater than 50% reduction of TB at con-centrations of less than 50 micrograms/milliliter. The latter compound suggested then thata homologous series could be formed by extending the aliphatic carbon chain covalentlybonded to the hydrazide functional group.The molecular structures for drugs A, B, C, and D are presented in Figure 1 for com-
parison with isoniazid. Note that dodecanohydrazide is a member homolog with drug A
58 BARTZATT et al.
FIGURE 1. The molecular structures of drugs A, B, C, and D are shown for comparison to isoni-azid. Note that all compounds are hydrazides with isoniazid, drug C, and drug D having a singlearomatic ring. Drugs A and B have an aliphatic hydrocarbon chain.
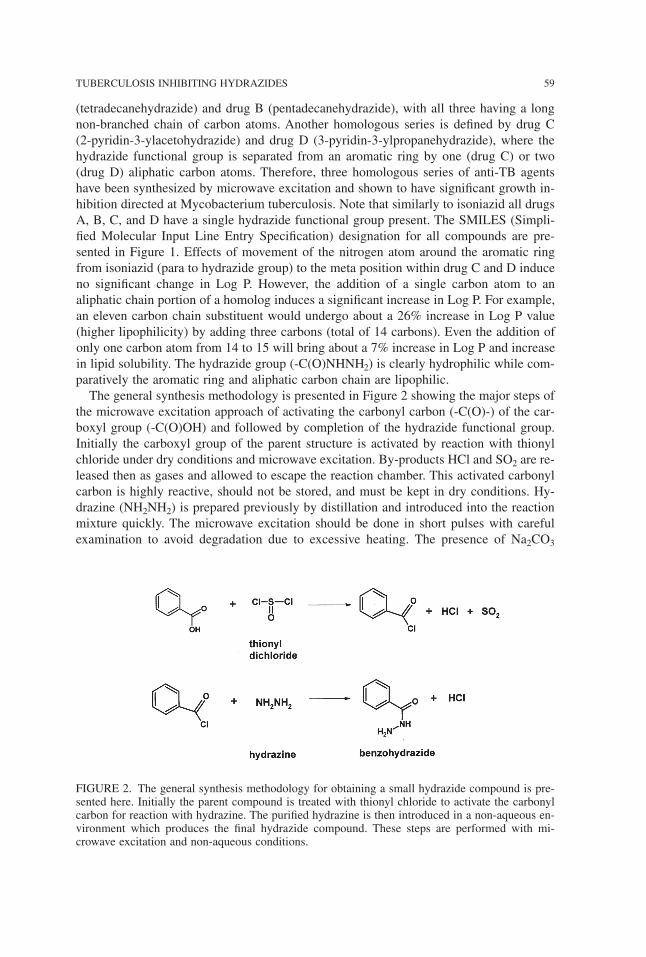
(tetradecanehydrazide) and drug B (pentadecanehydrazide), with all three having a longnon-branched chain of carbon atoms. Another homologous series is defined by drug C(2-pyridin-3-ylacetohydrazide) and drug D (3-pyridin-3-ylpropanehydrazide), where thehydrazide functional group is separated from an aromatic ring by one (drug C) or two(drug D) aliphatic carbon atoms. Therefore, three homologous series of anti-TB agentshave been synthesized by microwave excitation and shown to have significant growth in-hibition directed at Mycobacterium tuberculosis. Note that similarly to isoniazid all drugsA, B, C, and D have a single hydrazide functional group present. The SMILES (Simpli-fied Molecular Input Line Entry Specification) designation for all compounds are pre-sented in Figure 1. Effects of movement of the nitrogen atom around the aromatic ringfrom isoniazid (para to hydrazide group) to the meta position within drug C and D induceno significant change in Log P. However, the addition of a single carbon atom to analiphatic chain portion of a homolog induces a significant increase in Log P. For example,an eleven carbon chain substituent would undergo about a 26% increase in Log P value(higher lipophilicity) by adding three carbons (total of 14 carbons). Even the addition ofonly one carbon atom from 14 to 15 will bring about a 7% increase in Log P and increasein lipid solubility. The hydrazide group (-C(O)NHNH2) is clearly hydrophilic while com-paratively the aromatic ring and aliphatic carbon chain are lipophilic.The general synthesis methodology is presented in Figure 2 showing the major steps of
the microwave excitation approach of activating the carbonyl carbon (-C(O)-) of the car-boxyl group (-C(O)OH) and followed by completion of the hydrazide functional group.Initially the carboxyl group of the parent structure is activated by reaction with thionylchloride under dry conditions and microwave excitation. By-products HCl and SO2 are re-leased then as gases and allowed to escape the reaction chamber. This activated carbonylcarbon is highly reactive, should not be stored, and must be kept in dry conditions. Hy-drazine (NH2NH2) is prepared previously by distillation and introduced into the reactionmixture quickly. The microwave excitation should be done in short pulses with carefulexamination to avoid degradation due to excessive heating. The presence of Na2CO3
TUBERCULOSIS INHIBITING HYDRAZIDES 59
FIGURE 2. The general synthesis methodology for obtaining a small hydrazide compound is pre-sented here. Initially the parent compound is treated with thionyl chloride to activate the carbonylcarbon for reaction with hydrazine. The purified hydrazine is then introduced in a non-aqueous en-vironment which produces the final hydrazide compound. These steps are performed with mi-crowave excitation and non-aqueous conditions.
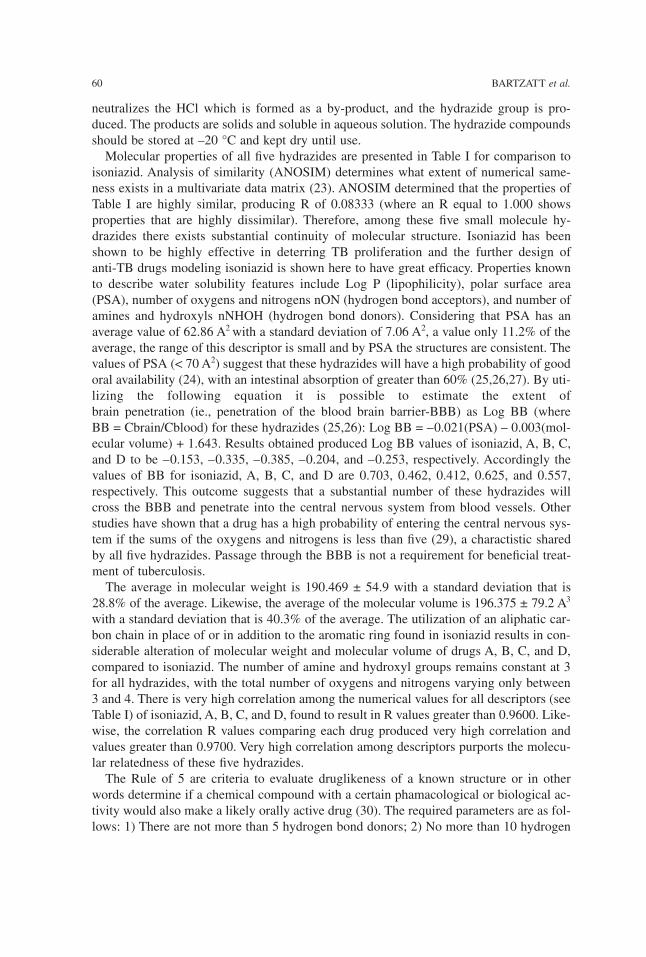
neutralizes the HCl which is formed as a by-product, and the hydrazide group is pro-duced. The products are solids and soluble in aqueous solution. The hydrazide compoundsshould be stored at –20 °C and kept dry until use.Molecular properties of all five hydrazides are presented in Table I for comparison to
isoniazid. Analysis of similarity (ANOSIM) determines what extent of numerical same-ness exists in a multivariate data matrix (23). ANOSIM determined that the properties ofTable I are highly similar, producing R of 0.08333 (where an R equal to 1.000 showsproperties that are highly dissimilar). Therefore, among these five small molecule hy-drazides there exists substantial continuity of molecular structure. Isoniazid has beenshown to be highly effective in deterring TB proliferation and the further design ofanti-TB drugs modeling isoniazid is shown here to have great efficacy. Properties knownto describe water solubility features include Log P (lipophilicity), polar surface area(PSA), number of oxygens and nitrogens nON (hydrogen bond acceptors), and number ofamines and hydroxyls nNHOH (hydrogen bond donors). Considering that PSA has anaverage value of 62.86 A2 with a standard deviation of 7.06 A2, a value only 11.2% of theaverage, the range of this descriptor is small and by PSA the structures are consistent. Thevalues of PSA (< 70 A2) suggest that these hydrazides will have a high probability of goodoral availability (24), with an intestinal absorption of greater than 60% (25,26,27). By uti-lizing the following equation it is possible to estimate the extent ofbrain penetration (ie., penetration of the blood brain barrier-BBB) as Log BB (whereBB = Cbrain/Cblood) for these hydrazides (25,26): Log BB = –0.021(PSA) – 0.003(mol-ecular volume) + 1.643. Results obtained produced Log BB values of isoniazid, A, B, C,and D to be –0.153, –0.335, –0.385, –0.204, and –0.253, respectively. Accordingly thevalues of BB for isoniazid, A, B, C, and D are 0.703, 0.462, 0.412, 0.625, and 0.557,respectively. This outcome suggests that a substantial number of these hydrazides willcross the BBB and penetrate into the central nervous system from blood vessels. Otherstudies have shown that a drug has a high probability of entering the central nervous sys-tem if the sums of the oxygens and nitrogens is less than five (29), a charactistic sharedby all five hydrazides. Passage through the BBB is not a requirement for beneficial treat-ment of tuberculosis.The average in molecular weight is 190.469 ± 54.9 with a standard deviation that is
28.8% of the average. Likewise, the average of the molecular volume is 196.375 ± 79.2 A3
with a standard deviation that is 40.3% of the average. The utilization of an aliphatic car-bon chain in place of or in addition to the aromatic ring found in isoniazid results in con-siderable alteration of molecular weight and molecular volume of drugs A, B, C, and D,compared to isoniazid. The number of amine and hydroxyl groups remains constant at 3for all hydrazides, with the total number of oxygens and nitrogens varying only between3 and 4. There is very high correlation among the numerical values for all descriptors (seeTable I) of isoniazid, A, B, C, and D, found to result in R values greater than 0.9600. Like-wise, the correlation R values comparing each drug produced very high correlation andvalues greater than 0.9700. Very high correlation among descriptors purports the molecu-lar relatedness of these five hydrazides.The Rule of 5 are criteria to evaluate druglikeness of a known structure or in other
words determine if a chemical compound with a certain phamacological or biological ac-tivity would also make a likely orally active drug (30). The required parameters are as fol-lows: 1) There are not more than 5 hydrogen bond donors; 2) No more than 10 hydrogen
60 BARTZATT et al.
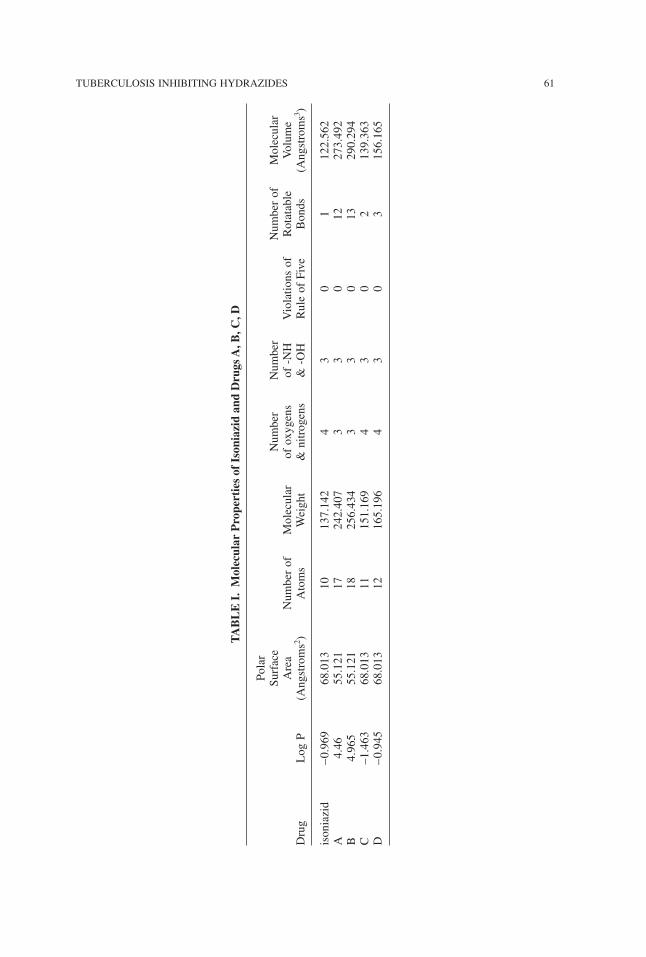
TUBERCULOSIS INHIBITING HYDRAZIDES 61
TABLE
I.M
olec
ular
Pro
pertiesof
Ison
iazid
and
Dru
gsA,B
,C,D
Polar
Surface
Number
Number
Numberof
Molecular
Area
Numberof
Molecular
ofoxygens
of-NH
Violationsof
Rotatable
Volume
Drug
LogP
(Angstroms2)
Atoms
Weight
&nitrogens
&-OH
RuleofFive
Bonds
(Angstroms3)
isoniazid
–0.969
68.013
10137.142
43
01
122.562
A4.46
55.121
17242.407
33
012
273.492
B4.965
55.121
18256.434
33
013
290.294
C–1.463
68.013
11151.169
43
02
139.363
D–0.945
68.013
12165.196
43
03
156.165
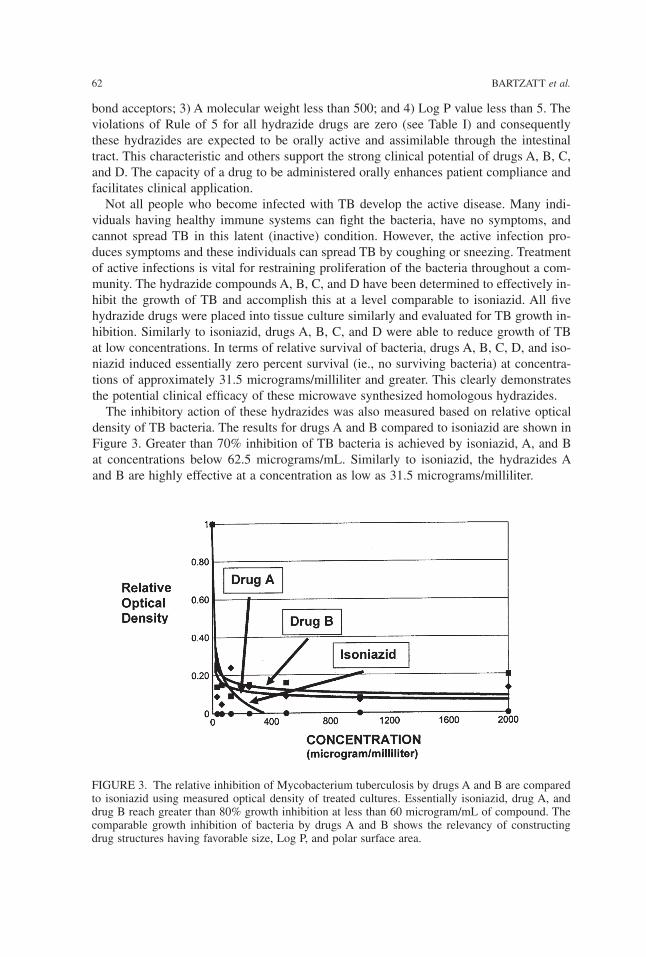
bond acceptors; 3) A molecular weight less than 500; and 4) Log P value less than 5. Theviolations of Rule of 5 for all hydrazide drugs are zero (see Table I) and consequentlythese hydrazides are expected to be orally active and assimilable through the intestinaltract. This characteristic and others support the strong clinical potential of drugs A, B, C,and D. The capacity of a drug to be administered orally enhances patient compliance andfacilitates clinical application.Not all people who become infected with TB develop the active disease. Many indi-
viduals having healthy immune systems can fight the bacteria, have no symptoms, andcannot spread TB in this latent (inactive) condition. However, the active infection pro-duces symptoms and these individuals can spread TB by coughing or sneezing. Treatmentof active infections is vital for restraining proliferation of the bacteria throughout a com-munity. The hydrazide compounds A, B, C, and D have been determined to effectively in-hibit the growth of TB and accomplish this at a level comparable to isoniazid. All fivehydrazide drugs were placed into tissue culture similarly and evaluated for TB growth in-hibition. Similarly to isoniazid, drugs A, B, C, and D were able to reduce growth of TBat low concentrations. In terms of relative survival of bacteria, drugs A, B, C, D, and iso-niazid induced essentially zero percent survival (ie., no surviving bacteria) at concentra-tions of approximately 31.5 micrograms/milliliter and greater. This clearly demonstratesthe potential clinical efficacy of these microwave synthesized homologous hydrazides.The inhibitory action of these hydrazides was also measured based on relative optical
density of TB bacteria. The results for drugs A and B compared to isoniazid are shown inFigure 3. Greater than 70% inhibition of TB bacteria is achieved by isoniazid, A, and Bat concentrations below 62.5 micrograms/mL. Similarly to isoniazid, the hydrazides Aand B are highly effective at a concentration as low as 31.5 micrograms/milliliter.
62 BARTZATT et al.
FIGURE 3. The relative inhibition of Mycobacterium tuberculosis by drugs A and B are comparedto isoniazid using measured optical density of treated cultures. Essentially isoniazid, drug A, anddrug B reach greater than 80% growth inhibition at less than 60 microgram/mL of compound. Thecomparable growth inhibition of bacteria by drugs A and B shows the relevancy of constructingdrug structures having favorable size, Log P, and polar surface area.
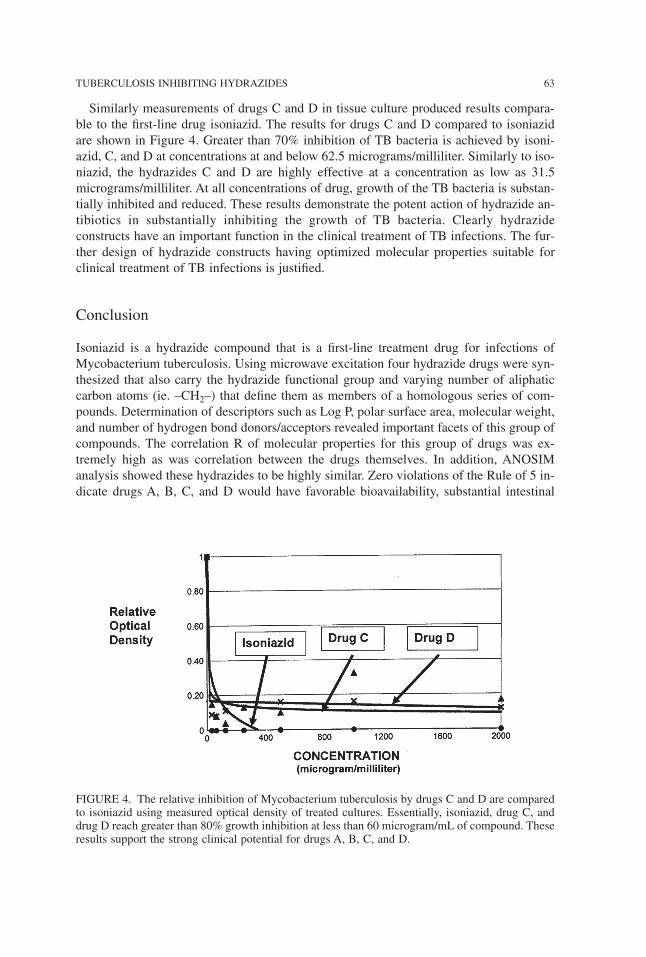
Similarly measurements of drugs C and D in tissue culture produced results compara-ble to the first-line drug isoniazid. The results for drugs C and D compared to isoniazidare shown in Figure 4. Greater than 70% inhibition of TB bacteria is achieved by isoni-azid, C, and D at concentrations at and below 62.5 micrograms/milliliter. Similarly to iso-niazid, the hydrazides C and D are highly effective at a concentration as low as 31.5micrograms/milliliter. At all concentrations of drug, growth of the TB bacteria is substan-tially inhibited and reduced. These results demonstrate the potent action of hydrazide an-tibiotics in substantially inhibiting the growth of TB bacteria. Clearly hydrazideconstructs have an important function in the clinical treatment of TB infections. The fur-ther design of hydrazide constructs having optimized molecular properties suitable forclinical treatment of TB infections is justified.
Conclusion
Isoniazid is a hydrazide compound that is a first-line treatment drug for infections ofMycobacterium tuberculosis. Using microwave excitation four hydrazide drugs were syn-thesized that also carry the hydrazide functional group and varying number of aliphaticcarbon atoms (ie. –CH2–) that define them as members of a homologous series of com-pounds. Determination of descriptors such as Log P, polar surface area, molecular weight,and number of hydrogen bond donors/acceptors revealed important facets of this group ofcompounds. The correlation R of molecular properties for this group of drugs was ex-tremely high as was correlation between the drugs themselves. In addition, ANOSIManalysis showed these hydrazides to be highly similar. Zero violations of the Rule of 5 in-dicate drugs A, B, C, and D would have favorable bioavailability, substantial intestinal
TUBERCULOSIS INHIBITING HYDRAZIDES 63
FIGURE 4. The relative inhibition of Mycobacterium tuberculosis by drugs C and D are comparedto isoniazid using measured optical density of treated cultures. Essentially, isoniazid, drug C, anddrug D reach greater than 80% growth inhibition at less than 60 microgram/mL of compound. Theseresults support the strong clinical potential for drugs A, B, C, and D.
absorbance, and conformity to parameters suggesting active orally administered pharma-ceuticals. Calculation of Log BB indicated that a substantial fraction of these hydrazidesthat are in the bloodstream would cross through the BBB and enter the central nervoussystem. A wide range in Log P values reflects the diversity in molecular scaffolding thatis useful for hydrazide type pharmaceuticals. Relative survival of TB bacteria is essen-tially zero for isoniazid, A, B, C, and D at concentrations as low as 31.5 micrograms/mL.Measurements of relative optical density likewise showed isoniazid, A, B, C, and D to behighly effective in inhibiting the growth of TB bacteria at very low concentrations. DrugsA, B, C, and D achieved greater than 70% inhibition at concentrations as low as 31.5micrograms/mL based on relative optical density. The efficacy of utilizing microwave ex-citation for hydrazide synthesis is shown.
This work was funded by the College of Arts & Sciences, University of Nebraska, Chemistry De-partment, Durham Science Center, 6001 Dodge Street, Omaha NE 68182.
References
1. Cox, R. (2004) Quantitative relationships for specific growth rates and macromolecularcompositions of Mycobacterium tuberculosis, Streptomyces coelicolor A3(2) and Escherichiacoli B/r: an integrative theoretical approach. Microbiology 150(pt 5): 1413–1426.
2. Raviglione, M.C. and O’Brien, R.J. (2004) Tuberculosis, Harrison’s Principles of InternalMedicine, McGraw-Hill Professional, New York,.
3. Centers for Disease Control and Prevention. (2006) Emergence of Mycobacterium tubercu-losis with extensive resistance to second-line drugs—worldwide, 2000–2004. MMWR Morb.Mortal. Wkly. Rep. 55(11):301–305.
4. Houben, E., Nguyen, L. and Peters, J. (2006) Interaction of pathogenic mycobacteria withthe host immune system. Curr. Opin. Microbiol. 9(1):76–85.
5. O’Brien, R. (1994) Drug-resistant tuberculosis: etiology, management and prevention.Semin. Respir. Infect. 9(2):104–112.
6. Hong, X. and Hopfinger, A.J. (2004) Construction, molecular modeling, and simulation ofMycobacterium tuberculosis cell walls. Biomacromolecules 5(3):1052–1065.
7. Davis, B., Dulbecco, R., Eisen, H. and Ginsberg, H. (1990) Microbiology, JB Lippincott,London,.
8. Timmins, G.S. and Deretic., V. (2006) Mechanisms of action of isoniazid. Mol. Microbiol.62(5):1220–1227.
9. Bardou, F., Raynaud, C., Ramos, C., Laneelle, M.A., and Laneelle, G. (1998) Mechanismof isoniazid uptake in Mycobacterium tuberculosis. Microbiology 144:2539–2544.
10. Carvalho, S.A., da Silva, E.F., de Souza, M.V., Lourenco, M.C. and Vicente, F. (2008) Syn-thesis and antimycobacterial evaluation of new trans-cinnamic acid hydrazide derivatives.Biorg. Med. Chem. Lett. 18(2):538–541.
11. Metcalfe, C.L., Macdonald, I.K., Murphy, E.J., Brown, K.A., Raven, E.L. and Moody, P.C.(2008) The tuberculosis prodrug isoniazid bound to activating peroxidases. J. Biol. Chem.283(10):6193–6200.
12. Greinert, U., Hillemann, D., Lange, C. and Richter, E. (2007) Antibiotic drug-resistant tu-berculosis. Med. Klin. (Munich). 102(12):957–966.
13. Tahaogiu, K., Torun, T., Sevim, T., Atac, G., Kir, A., Karasulu, L., Ozmen, I. and Kapakii, N.(2001) The treatment of multidrug-resistant tuberculosis in Turkey. N. Engl. J. Med.345(3):170–174.
14. Gonlugur, T.E., Goniugur, U. and Hasbek, M. (2007) Antitubeculosis drug resistance in aTurkish state hospital with national data. Acta Microbiol. Immunol. Hung. 54(9):421–451.
64 BARTZATT et al.
15. Macedo, R., Perdigao, J., Brum, I. and Portugal, I. (2007) Multidrug resistant tuberculosisin Lisbon. Rev. Port. Pneumol. 13(6):20–21.
16. Kehinde, A.O., Obaseki, F.A., Ishoia, O.C. and Ibrahim, K.D. (2007) Multidrug resistanceto Mycobacterium tuberculosis in a tertiary hospital. J. Natl. Med. Assoc. 99(10):1185–1189.
17. Gobie, M., Iseman, M.D., Madsen, L.A., Waite, D., Ackerson, L. and Horsburgh, C.R. Jr.(1993) Treatment of 171 patients with pulmonary tuberculosis resistant to isoniazid and ri-fampin. N. Engl. J. Med. 328(8):527–532.
18. Tomioka, H. and Namba, K. (2006) Development of antituberculosis drugs: current statesand future prospects. Kekkaku 12:753–754.
19. Bartzatt, R., Cirillo, S.L.G. and Cirillo, J.D. (2007) Design and in vitro evaluation of five in-hibitors of Mycobacterium Tuberculosis. Letters in Drug Design & Discovery 4(2):137–143.
20. Bartzatt, R., Cirillo, S.L.G. and Cirillo, J.D. (2008) Determination of molecular propertieseffectuating the growth inhibition of Mycobacterium tuberculosis by various small moleculehydrazides. Letters in Drug Design & Discovery 5(3):162–168.
21. Silverman, R.B. (1992) The Organic Chemistry of Drug Design and Drug Action, AcademicPress, San Diego,.
22. Wermuth, C.G. (1996) The Practice of Medicinal Chemistry, Academic Press, San Diego,.23. Clarke, K.R. (1993) Non-parametric multivariate analysis of changes in community struc-
ture. Australian J. Ecology 18:117–143.24. Veber, D.F., Johnson, S., Cheng, H.Y., Smith, B., Ward, K. and Kopple, K. (2002) Molecu-
lar properties that influence the oral bioavailability of drug candidates. J. Med. Chem.45(12):2615–2623.
25. Clark, D.E. (1999) Rapid calculation of polar molecular surface area and its application tothe prediction of transport phenomena. 1. Prediction of blood-brain penetration. J. Pharm. Sci.88:815–821.
26. Palm, K., Stenberg, P., Luthman, K. and Artursson, P. (1997) Polar molecular surface prop-erties predict the intestinal absorption of drugs in humans. Pharm. Res. 14: 568–571.
27. Clark, D.E. (1999) Rapid calculation of polar molecular surface area and its application tothe prediction of transport phenomena. 1. Prediction of intestinal absorption. J. Pharm. Sci.88:807–814.
28. Kelder, J., Grootenhuis, P., Bayada, D., Delbressine, L., Ploemen, J. (1999) Polar molecularsurface as a dominating determinant for oral absorption and brain penetration of drugs.Pharm. Res. 16:1514–1519.
29. Osterberg, T., Norinder, U. (2000) Prediction of polar surface area and drug transportprocesses using simple parameters and PLS statistics. J. Chem. Inf. Comput. Sci.40:1408–1411.
30. Linpinski, C.A., Lombardo, F., Dominy, B., Feeney, P. (2001) Experimental and computa-tional approaches to estimate solubility and permeability in drug discovery and developmentsettings. Adv. Drug Del. Rev. 46:3–26.
Received December 23, 2008;accepted July 13, 2009.
TUBERCULOSIS INHIBITING HYDRAZIDES 65

Physiol. Chem. Phys. & Med. NMR (2008) 40: 67–88
Proton HR-MAS NMR SpectroscopicCharacterization of Metabolites in Various
Human Organ Tissues: Pancreas, Brain andLiver from Trauma Cases
Divya Misra1, Vivek Gupta2, Abhinav A. Sonkar2*
Usha Bajpai1 and Raja Roy3*
1 Department of Physics, University of Lucknow, Lucknow — 226001, India;2Department of General Surgery, Chhatrapati Shahuji Maharaj Medical University, Lucknow-226001, India;3Centre of Biomedical Magnetic Resonance, Sanjay Gandhi Post Graduate Institute of Medical Sciences,
Rae Bareli Road, Lucknow-226014, India*Corresponding Authors: E-mail: [email protected], E-mail: [email protected]
Abstract: High-Resolution Magic Angle Spinning (HR-MAS) NMR has been employed to char-acterize various metabolites of human pancreas, liver and brain tissues from trauma cases. The po-tential usefulness of NMR in identifying the metabolites in human tissues has been explored usinga combination of one- and two-dimensional experiments. The complete resonance assignments ofpancreas tissue have been carried out for the first time. Two new metabolites, α-hydroxyisovalarateand α-hydroxybutarate were identified in all the tissue specimens. The metabolites information ofthese human tissues can further be utilized in correlating several diseases associated with patholog-ical manifestations as well in distinguishing traumatic tissues along with control tissues of pancreas,liver and brain.
KEY WORDS: trauma; HR-MAS NMR; lipids; pancreas; liver; brain; tissue specimen;α-hydroxyisovalarate; α-hydroxybutarate
HIGH-RESOLUTION 1H nuclear magnetic resonance (NMR) spectroscopy has provedto be one of the most powerful technologies for biofluids and essentially the only onecapable of studying the biochemical profile of intact tissues (1–4) without the need forpre-selection of measurement-parameters or selection of separation- and/or derivatizationprocedures. Besides various laboratory methods available for identification of metabolites,their characterization has been a topic of interest. In addition to the current procedures,the utility of other bio-analytical technique such as mass spectrometry in understanding
the biochemistry of metabolites in human tissues has been explored in recent times (5).NMR spectral analysis of tissues has largely relied upon tissue extraction methods (6).However, different invasive extraction processes are required for characterisation of smallmetabolites and lipids, which may be time consuming. During the last few years, the de-velopment of high-resolution 1H magic angle spinning (HR-MAS) NMR spectroscopy hasallowed the ability to analyze intact tissues as small as 8–10 mg. Rapid spinning of thesample (typically around 4–6 kHz) at an angle of 54.7º relative to the applied magneticfield serves to reduce severe line-broadening effects seen in such heterogeneous samplesunder HR-MAS (7–11). The angular factor (3cos2θ − 1) is averaged out to zero and it ispossible to obtain very high-quality NMR spectra of whole tissue samples with no sam-ple pre-treatment. Such experiments have also indicated that diseased- or toxin-affectedtissues may have substantially different metabolic profiles compared to those taken fromhealthy organs.Several reports exist in literature regarding the metabolic identification of human tissue
specimens (12–15), and more recently, metabolic profiling has also been applied to studytissue samples affected with breast cancer (16). The HR-MAS NMR spectra show reso-lution comparable to that of extracts (solution-state NMR), and application of two-dimensional techniques have further led to identification of a majority of the structuralconstituents. While 1H and 13C NMR spectroscopic techniques have become methods-of-choice to obtain full-length structural information regarding the metabolites present in tis-sues, these can be mapped and quantitated from a single experiment (17). Using thistechnology, it is also possible to bridge the gap between tissue NMR analyses andhistopathology, and both could be performed for the same tissue specimen in order to gainreal insights into the mechanisms of pathology at molecular level.This work presents the application of HR-MAS 1H NMR spectroscopy to characterize
the metabolites of human traumatic tissue samples. The potential usefulness of 2D NMRexperiments such as COSY (Correlated Spectroscopy) and 1H-13C HSQC (HeteronuclearSingle Quantum Coherence) has been explored to full extent to identify the metabolites.An attempt has been made to identify new metabolites in these tissue systems, if any,which may be useful in understanding possible disease states in such tissues and its analy-sis may also aid to distinguish diseased tissues from traumatic ones.
Materials and Methods
Human brain tissues (n = 6), liver (n = 6) and pancreas (n = 6) were obtained from acci-dent-associated trauma patients in the age group of 22–28 years (all males free from anydisease state) undergoing emergency surgical procedures. Devitalized tissues and theirmargins, removed as part of the surgical procedure, were also taken for NMR analysis.Only non-decomposed tissues that were macroscopically free from disease were chosen.Prior approval was taken from the ethics committee of the trauma center at King George’sMedical University, (now Chattrapati Shahuji Maharaj Medical University) Lucknow. Theselected tissues were stored in high-quality plastic vials and were snap-frozen in liquid ni-trogen until the time of spectroscopic analysis. HR-MAS NMR of the intact tissue fromeach specimen were taken (30–35 mg wet weight). Each sample was introduced in a 4mm ZrO2 rotor fitted with 50 µl cylindrical insert. The rotor was transferred into the NMRprobe. All NMR measurements were carried out at 25.0 °C.
68 MISRA et al.
The HR-MAS spectra were recorded on a Bruker Avance 400 spectrometer operatingat a frequency of 400.3 MHz, equipped with a 4 mm 1H/13C dual HR-MAS probe withmagic angle gradient. For all NMR experiments, the samples were spun at 4.0 kHz inorder to keep the rotation side bands out of the acquisition window. One-dimensional pro-ton NMR spectra with water presaturation were acquired using one-dimensional NOESYpulse sequence with a mixing time τm of 100 ms. Total relaxation delays of 3.99 s wereused with 8250.8 Hz spectral width, 128 transients with a total recording time of 9 min-utes. The one-dimensional CPMG pulse sequence with water presaturation using echotime of 200 ms was used in order to remove short T2 components arising from large mol-ecules like lipids. The one-dimensional spin echo experiment with water presaturationwas also recorded using an echo time of 160 ms, which simultaneously suppresses theshort T2 components along with multiplicity information obtained for small molecules.Two-dimensional COSY using water presaturation was carried out on each set of tissue
samples. A spectral width of 4807.69 Hz and 2.2 s relaxation delay was used and 128transients were averaged for each of the 256 t1 increments corresponding to a total acqui-sition time of 7 hrs. The data were zero filled to 512 w and weighted with sine-bell win-dow function, prior to double Fourier transformation. Two-dimensional, 1H/13C gradientHSQC with adiabatic pulses was performed on each set of the tissue specimens usingwater pre-saturation; 1.6 s of total relaxation delay was used and 128 transients wereaveraged for each 128 t1 increments corresponding to a total acquisition time of 8.0 hours.The data were zero filled to a 1024 w matrix and weighted with 90° shifted square sine-bell function prior to double Fourier transformation.
Results and Discussion
The complete assignments of the various metabolites were carried out by a combinationof one dimensional NOESY (Nuclear Overhauser Effect Spectroscopy), CPMG (Carr-Purcell, Meiboom Gill) and two-dimensional COSY and HSQC spectra. Prior to reso-nance assignments all the spectra were referenced with respect to the methyl group (CH3)of lactate at 1.33 ppm in the 1H NMR and its corresponding 13C chemical shift at 22.6ppm in the HSQC spectra. Resonances due to lipid moieties were effectively filtered bythe use of CPMG experiments in all the three set of tissue samples. The one-dimensionalproton NMR spectrum of all the three tissue specimens show a large number of signalsand a high degree of overlap especially in the range of 3.0 ppm to 4.0 ppm and were sig-nificant with their own distinctive pattern as shown in Figure 1a–c respectively. Whereasthe CPMG spectra provided detailed resonances of the small metabolites showing fingerprints of pancreas, liver and brain tissue’s metabolic profile (Figure 2a–c and their ex-pansions). The assignments are based on the comparison of chemical shifts and spin mul-tiplicities with data reported in literature (18–19).Proton resonances between 0.68 ppm and 6.0 ppm in the spectra of all three tissue sam-
ples can be divided into three broad regions. From 0.65–2.9 ppm the presence of (CH2)n-protons of lipid chain, sterol methyl and methylene proton resonances; phospholipid headgroup and glycerol back-bone proton and glucose resonances between 3.05 ppm and 5.25ppm; vinyl proton signals between 5.30 ppm and 5.95 ppm. The two-dimensional COSYspectrum allowed us to assign signals to particular metabolites through the examinationof the existing cross peak correlations. The detailed spectral assignments of each tissuespecimens are as follows:
PROTON NMR OF METABOLITES IN ORGANS 69
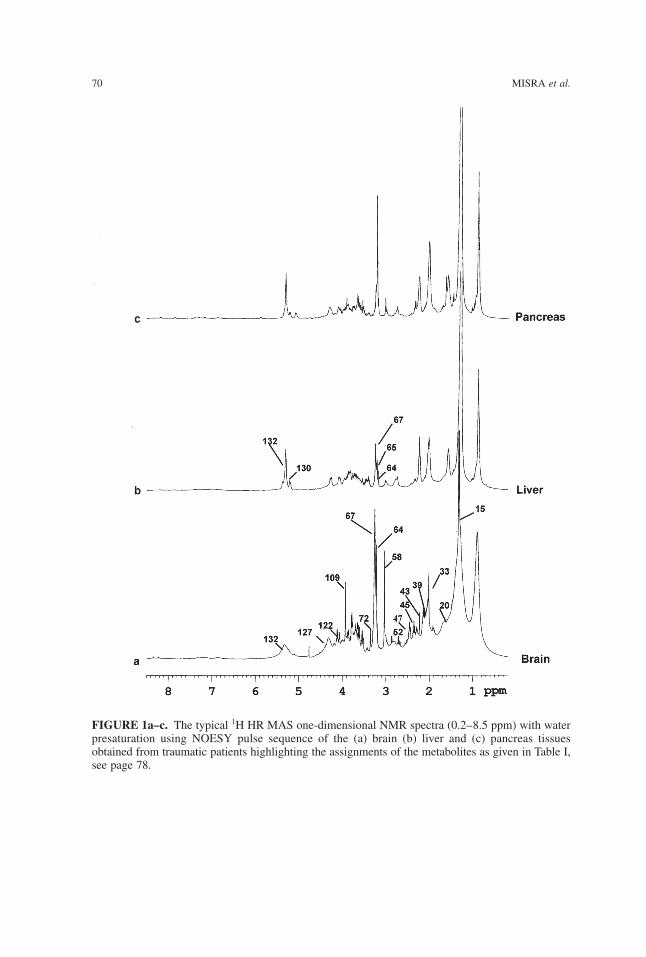
70 MISRA et al.
FIGURE 1a–c. The typical 1H HR MAS one-dimensional NMR spectra (0.2–8.5 ppm) with waterpresaturation using NOESY pulse sequence of the (a) brain (b) liver and (c) pancreas tissuesobtained from traumatic patients highlighting the assignments of the metabolites as given in Table I,see page 78.
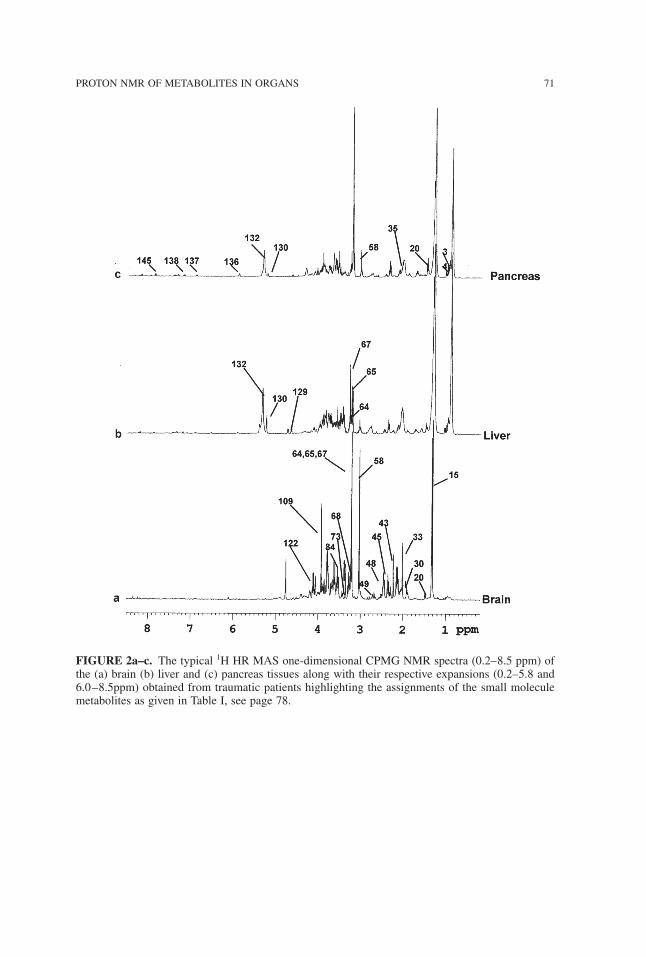
PROTON NMR OF METABOLITES IN ORGANS 71
FIGURE 2a–c. The typical 1H HR MAS one-dimensional CPMG NMR spectra (0.2–8.5 ppm) ofthe (a) brain (b) liver and (c) pancreas tissues along with their respective expansions (0.2–5.8 and6.0–8.5ppm) obtained from traumatic patients highlighting the assignments of the small moleculemetabolites as given in Table I, see page 78.
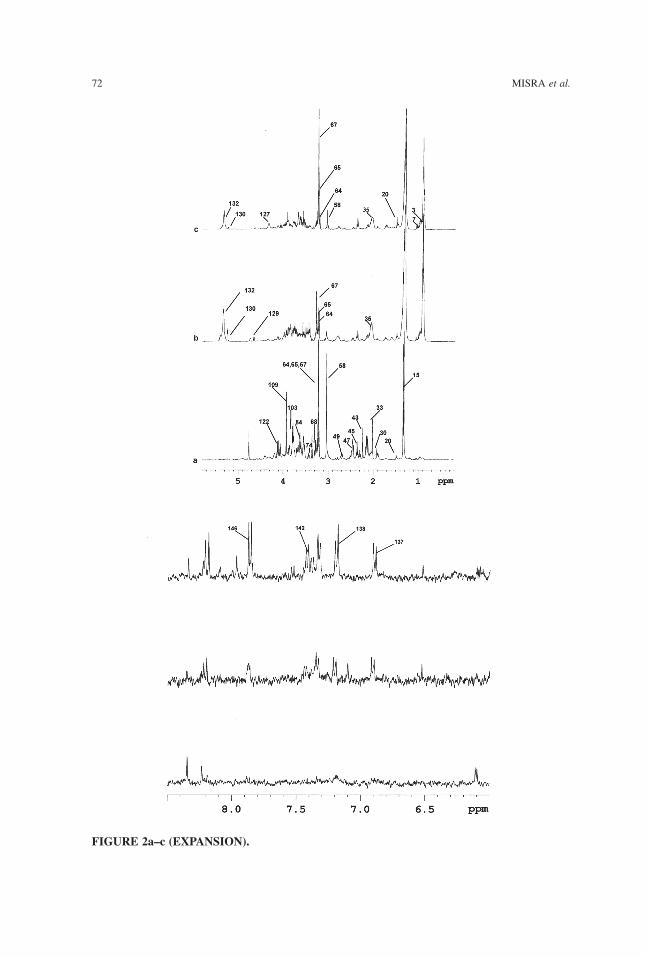
72 MISRA et al.
FIGURE 2a–c (EXPANSION).
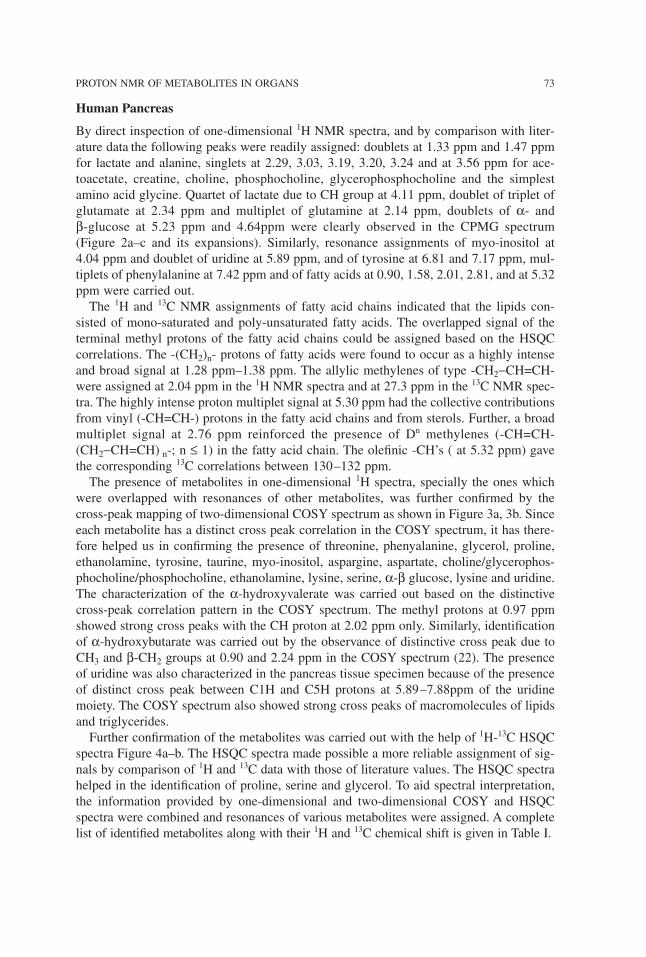
Human Pancreas
By direct inspection of one-dimensional 1H NMR spectra, and by comparison with liter-ature data the following peaks were readily assigned: doublets at 1.33 ppm and 1.47 ppmfor lactate and alanine, singlets at 2.29, 3.03, 3.19, 3.20, 3.24 and at 3.56 ppm for ace-toacetate, creatine, choline, phosphocholine, glycerophosphocholine and the simplestamino acid glycine. Quartet of lactate due to CH group at 4.11 ppm, doublet of triplet ofglutamate at 2.34 ppm and multiplet of glutamine at 2.14 ppm, doublets of α- andβ-glucose at 5.23 ppm and 4.64ppm were clearly observed in the CPMG spectrum(Figure 2a–c and its expansions). Similarly, resonance assignments of myo-inositol at4.04 ppm and doublet of uridine at 5.89 ppm, and of tyrosine at 6.81 and 7.17 ppm, mul-tiplets of phenylalanine at 7.42 ppm and of fatty acids at 0.90, 1.58, 2.01, 2.81, and at 5.32ppm were carried out.The 1H and 13C NMR assignments of fatty acid chains indicated that the lipids con-
sisted of mono-saturated and poly-unsaturated fatty acids. The overlapped signal of theterminal methyl protons of the fatty acid chains could be assigned based on the HSQCcorrelations. The -(CH2)n- protons of fatty acids were found to occur as a highly intenseand broad signal at 1.28 ppm–1.38 ppm. The allylic methylenes of type -CH2−CH=CH-were assigned at 2.04 ppm in the 1H NMR spectra and at 27.3 ppm in the 13C NMR spec-tra. The highly intense proton multiplet signal at 5.30 ppm had the collective contributionsfrom vinyl (-CH=CH-) protons in the fatty acid chains and from sterols. Further, a broadmultiplet signal at 2.76 ppm reinforced the presence of Dn methylenes (-CH=CH-(CH2−CH=CH) n-; n ≤ 1) in the fatty acid chain. The olefinic -CH’s ( at 5.32 ppm) gavethe corresponding 13C correlations between 130–132 ppm.The presence of metabolites in one-dimensional 1H spectra, specially the ones which
were overlapped with resonances of other metabolites, was further confirmed by thecross-peak mapping of two-dimensional COSY spectrum as shown in Figure 3a, 3b. Sinceeach metabolite has a distinct cross peak correlation in the COSY spectrum, it has there-fore helped us in confirming the presence of threonine, phenyalanine, glycerol, proline,ethanolamine, tyrosine, taurine, myo-inositol, aspargine, aspartate, choline/glycerophos-phocholine/phosphocholine, ethanolamine, lysine, serine, α-β glucose, lysine and uridine.The characterization of the α-hydroxyvalerate was carried out based on the distinctivecross-peak correlation pattern in the COSY spectrum. The methyl protons at 0.97 ppmshowed strong cross peaks with the CH proton at 2.02 ppm only. Similarly, identificationof α-hydroxybutarate was carried out by the observance of distinctive cross peak due toCH3 and β-CH2 groups at 0.90 and 2.24 ppm in the COSY spectrum (22). The presenceof uridine was also characterized in the pancreas tissue specimen because of the presenceof distinct cross peak between C1H and C5H protons at 5.89–7.88ppm of the uridinemoiety. The COSY spectrum also showed strong cross peaks of macromolecules of lipidsand triglycerides.Further confirmation of the metabolites was carried out with the help of 1H-13C HSQC
spectra Figure 4a–b. The HSQC spectra made possible a more reliable assignment of sig-nals by comparison of 1H and 13C data with those of literature values. The HSQC spectrahelped in the identification of proline, serine and glycerol. To aid spectral interpretation,the information provided by one-dimensional and two-dimensional COSY and HSQCspectra were combined and resonances of various metabolites were assigned. A completelist of identified metabolites along with their 1H and 13C chemical shift is given in Table I.
PROTON NMR OF METABOLITES IN ORGANS 73
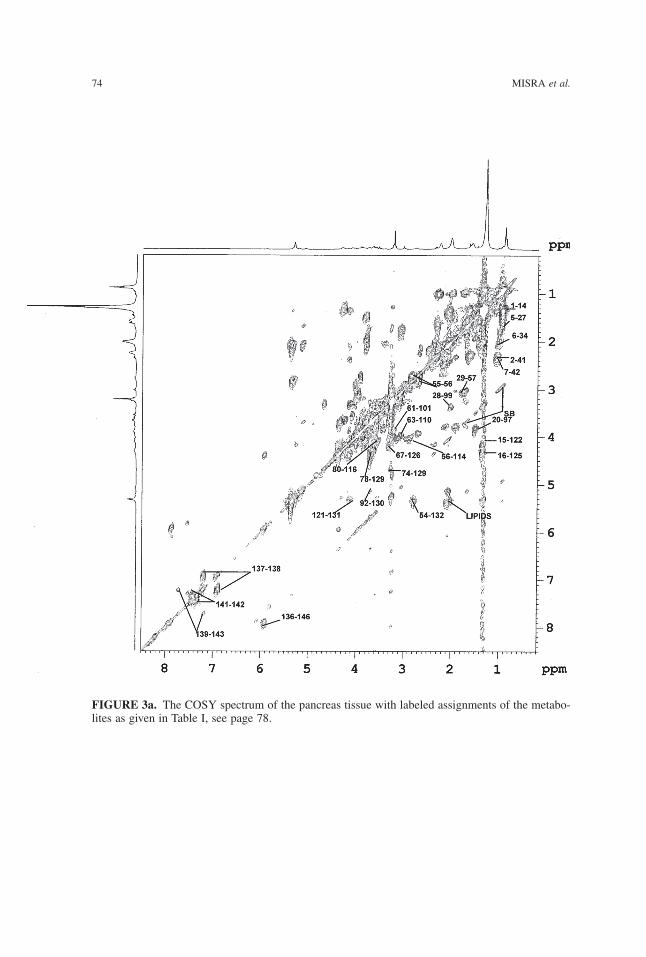
74 MISRA et al.
FIGURE 3a. The COSY spectrum of the pancreas tissue with labeled assignments of the metabo-lites as given in Table I, see page 78.
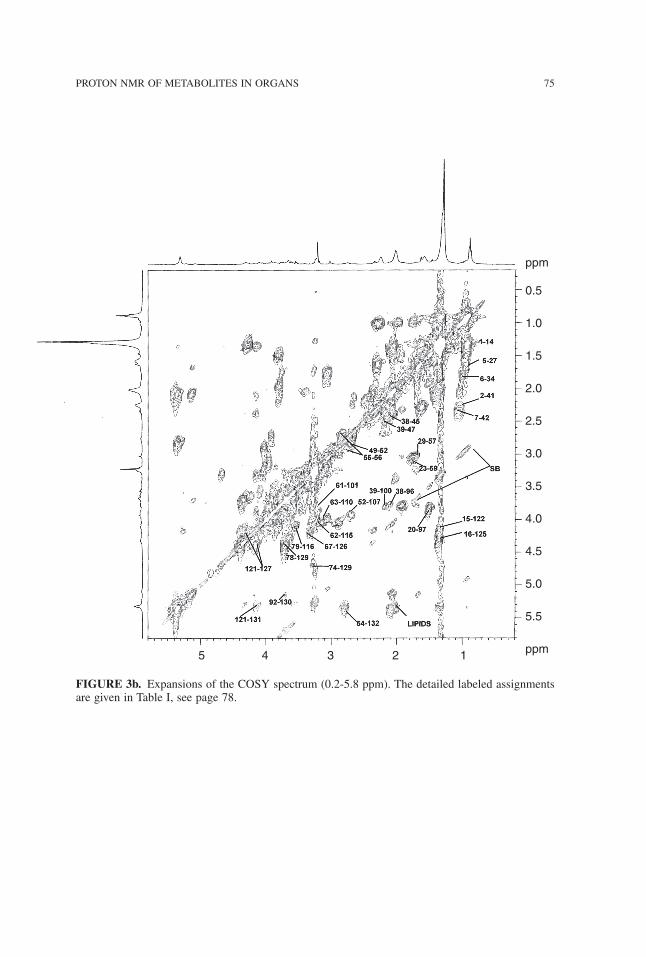
PROTON NMR OF METABOLITES IN ORGANS 75
FIGURE 3b. Expansions of the COSY spectrum (0.2-5.8 ppm). The detailed labeled assignmentsare given in Table I, see page 78.
5 4 3 2 1
ppm
0.5
1.0
1.5
2.0
2.5
3.0
3.5
4.0
4.5
5.0
5.5
ppm
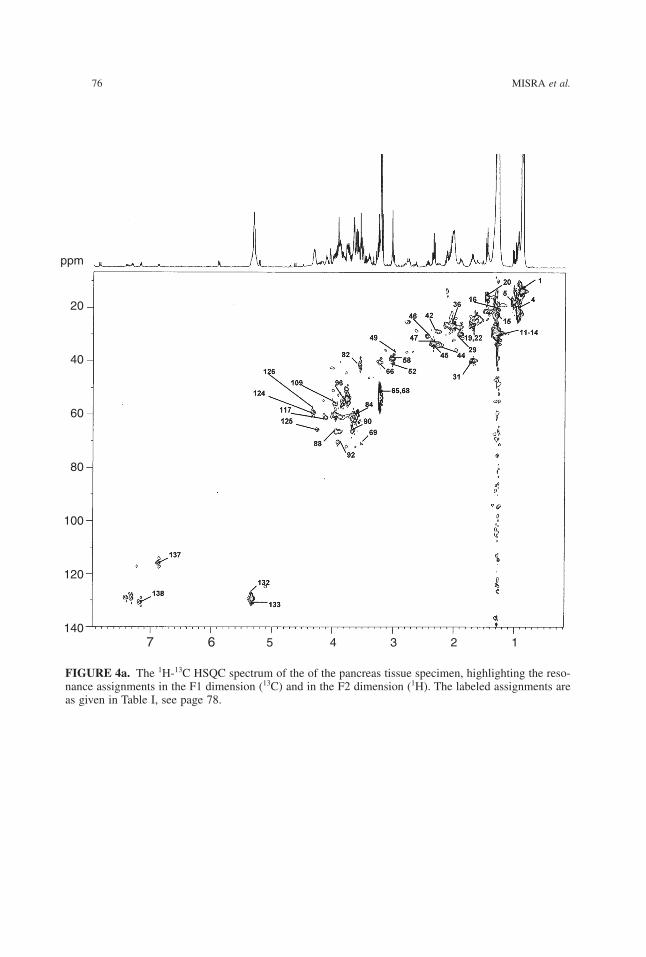
76 MISRA et al.
FIGURE 4a. The 1H-13C HSQC spectrum of the of the pancreas tissue specimen, highlighting the reso-nance assignments in the F1 dimension (13C) and in the F2 dimension (1H). The labeled assignments areas given in Table I, see page 78.
7 6 5 4 3 2 1
ppm
20
40
60
80
100
120
140
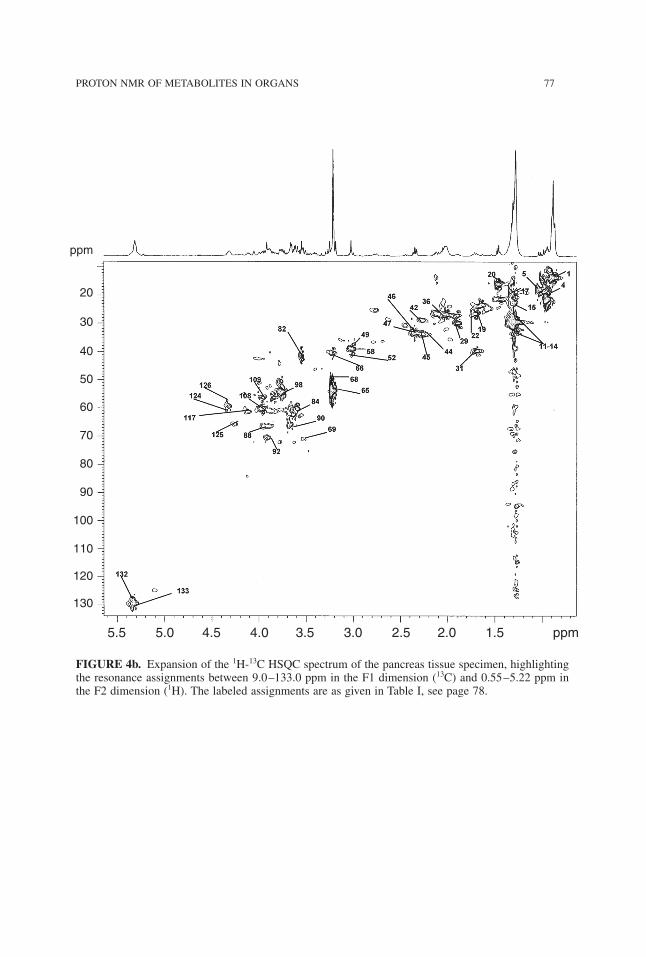
PROTON NMR OF METABOLITES IN ORGANS 77
FIGURE 4b. Expansion of the 1H-13C HSQC spectrum of the pancreas tissue specimen, highlightingthe resonance assignments between 9.0–133.0 ppm in the F1 dimension (13C) and 0.55–5.22 ppm inthe F2 dimension (1H). The labeled assignments are as given in Table I, see page 78.
5.5 5.0 4.5 4.0 3.5 3.0 2.5 2.0 1.5 ppm
ppm
20
30
40
50
60
70
80
90
100
110
120
130
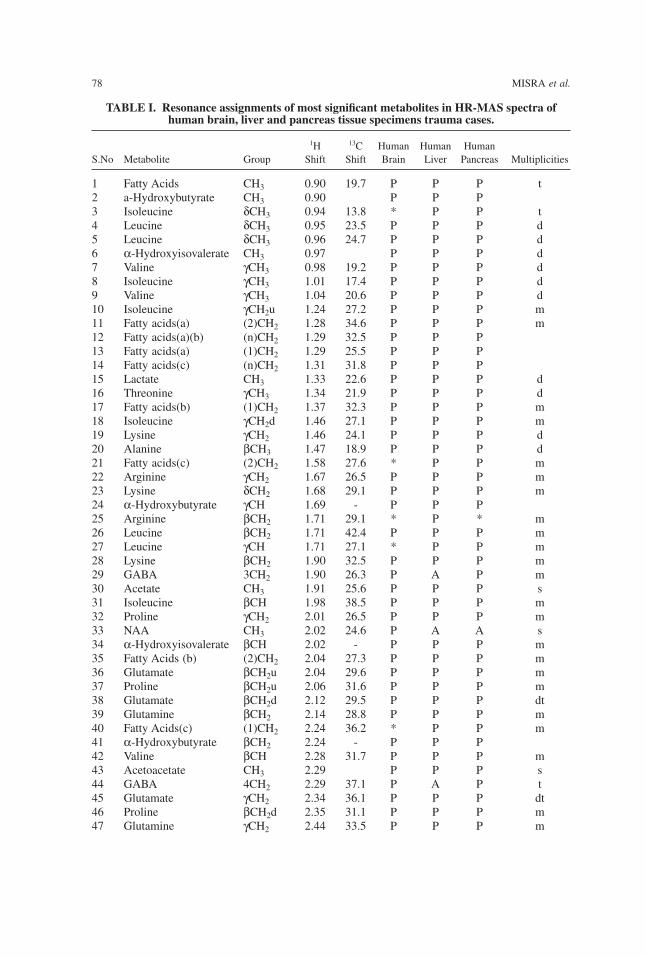
78 MISRA et al.
TABLE I. Resonance assignments of most significant metabolites in HR-MAS spectra ofhuman brain, liver and pancreas tissue specimens trauma cases.
1H 13C Human Human HumanS.No Metabolite Group Shift Shift Brain Liver Pancreas Multiplicities
1 Fatty Acids CH3 0.90 19.7 P P P t2 a-Hydroxybutyrate CH3 0.90 P P P3 Isoleucine δCH3 0.94 13.8 * P P t4 Leucine δCH3 0.95 23.5 P P P d5 Leucine δCH3 0.96 24.7 P P P d6 α-Hydroxyisovalerate CH3 0.97 P P P d7 Valine γCH3 0.98 19.2 P P P d8 Isoleucine γCH3 1.01 17.4 P P P d9 Valine γCH3 1.04 20.6 P P P d10 Isoleucine γCH2u 1.24 27.2 P P P m11 Fatty acids(a) (2)CH2 1.28 34.6 P P P m12 Fatty acids(a)(b) (n)CH2 1.29 32.5 P P P13 Fatty acids(a) (1)CH2 1.29 25.5 P P P14 Fatty acids(c) (n)CH2 1.31 31.8 P P P15 Lactate CH3 1.33 22.6 P P P d16 Threonine γCH3 1.34 21.9 P P P d17 Fatty acids(b) (1)CH2 1.37 32.3 P P P m18 Isoleucine γCH2d 1.46 27.1 P P P m19 Lysine γCH2 1.46 24.1 P P P d20 Alanine βCH3 1.47 18.9 P P P d21 Fatty acids(c) (2)CH2 1.58 27.6 * P P m22 Arginine γCH2 1.67 26.5 P P P m23 Lysine δCH2 1.68 29.1 P P P m24 α-Hydroxybutyrate γCH 1.69 - P P P25 Arginine βCH2 1.71 29.1 * P * m26 Leucine βCH2 1.71 42.4 P P P m27 Leucine γCH 1.71 27.1 * P P m28 Lysine βCH2 1.90 32.5 P P P m29 GABA 3CH2 1.90 26.3 P A P m30 Acetate CH3 1.91 25.6 P P P s31 Isoleucine βCH 1.98 38.5 P P P m32 Proline γCH2 2.01 26.5 P P P m33 NAA CH3 2.02 24.6 P A A s34 α-Hydroxyisovalerate βCH 2.02 - P P P m35 Fatty Acids (b) (2)CH2 2.04 27.3 P P P m36 Glutamate βCH2u 2.04 29.6 P P P m37 Proline βCH2u 2.06 31.6 P P P m38 Glutamate βCH2d 2.12 29.5 P P P dt39 Glutamine βCH2 2.14 28.8 P P P m40 Fatty Acids(c) (1)CH2 2.24 36.2 * P P m41 α-Hydroxybutyrate βCH2 2.24 - P P P42 Valine βCH 2.28 31.7 P P P m43 Acetoacetate CH3 2.29 P P P s44 GABA 4CH2 2.29 37.1 P A P t45 Glutamate γCH2 2.34 36.1 P P P dt46 Proline βCH2d 2.35 31.1 P P P m47 Glutamine γCH2 2.44 33.5 P P P m
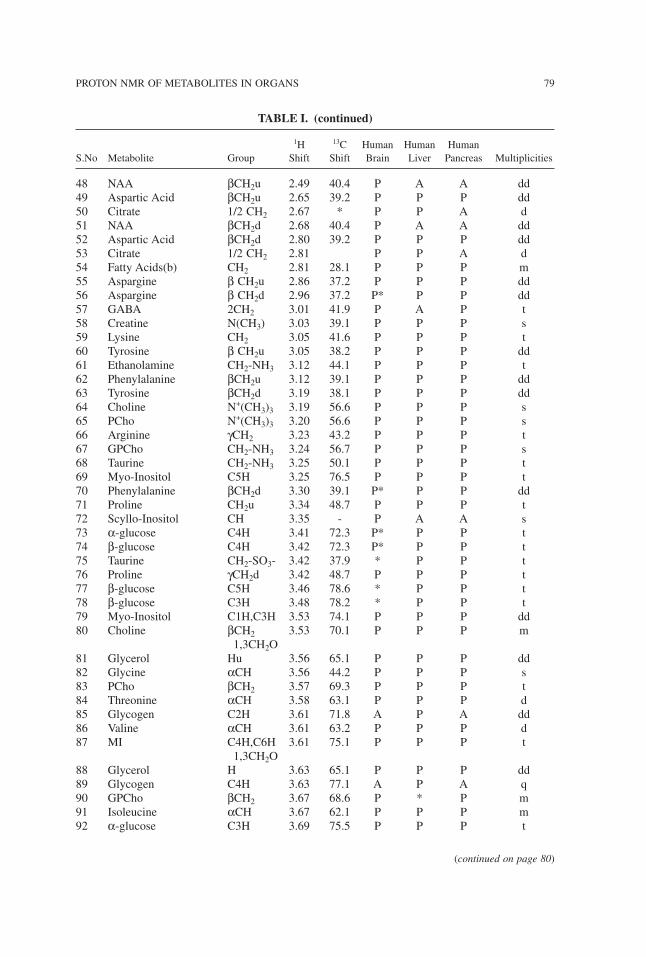
48 NAA βCH2u 2.49 40.4 P A A dd49 Aspartic Acid βCH2u 2.65 39.2 P P P dd50 Citrate 1/2 CH2 2.67 * P P A d51 NAA βCH2d 2.68 40.4 P A A dd52 Aspartic Acid βCH2d 2.80 39.2 P P P dd53 Citrate 1/2 CH2 2.81 P P A d54 Fatty Acids(b) CH2 2.81 28.1 P P P m55 Aspargine β CH2u 2.86 37.2 P P P dd56 Aspargine β CH2d 2.96 37.2 P* P P dd57 GABA 2CH2 3.01 41.9 P A P t58 Creatine N(CH3) 3.03 39.1 P P P s59 Lysine CH2 3.05 41.6 P P P t60 Tyrosine β CH2u 3.05 38.2 P P P dd61 Ethanolamine CH2-NH3 3.12 44.1 P P P t62 Phenylalanine βCH2u 3.12 39.1 P P P dd63 Tyrosine βCH2d 3.19 38.1 P P P dd64 Choline N+(CH3)3 3.19 56.6 P P P s65 PCho N+(CH3)3 3.20 56.6 P P P s66 Arginine γCH2 3.23 43.2 P P P t67 GPCho CH2-NH3 3.24 56.7 P P P s68 Taurine CH2-NH3 3.25 50.1 P P P t69 Myo-Inositol C5H 3.25 76.5 P P P t70 Phenylalanine βCH2d 3.30 39.1 P* P P dd71 Proline CH2u 3.34 48.7 P P P t72 Scyllo-Inositol CH 3.35 - P A A s73 α-glucose C4H 3.41 72.3 P* P P t74 β-glucose C4H 3.42 72.3 P* P P t75 Taurine CH2-SO3- 3.42 37.9 * P P t76 Proline γCH2d 3.42 48.7 P P P t77 β-glucose C5H 3.46 78.6 * P P t78 β-glucose C3H 3.48 78.2 * P P t79 Myo-Inositol C1H,C3H 3.53 74.1 P P P dd80 Choline βCH2 3.53 70.1 P P P m
1,3CH2O81 Glycerol Hu 3.56 65.1 P P P dd82 Glycine αCH 3.56 44.2 P P P s83 PCho βCH2 3.57 69.3 P P P t84 Threonine αCH 3.58 63.1 P P P d85 Glycogen C2H 3.61 71.8 A P A dd86 Valine αCH 3.61 63.2 P P P d87 MI C4H,C6H 3.61 75.1 P P P t
1,3CH2O88 Glycerol H 3.63 65.1 P P P dd89 Glycogen C4H 3.63 77.1 A P A q90 GPCho βCH2 3.67 68.6 P * P m91 Isoleucine αCH 3.67 62.1 P P P m92 α-glucose C3H 3.69 75.5 P P P t
PROTON NMR OF METABOLITES IN ORGANS 79
TABLE I. (continued)
1H 13C Human Human HumanS.No Metabolite Group Shift Shift Brain Liver Pancreas Multiplicities
(continued on page 80)
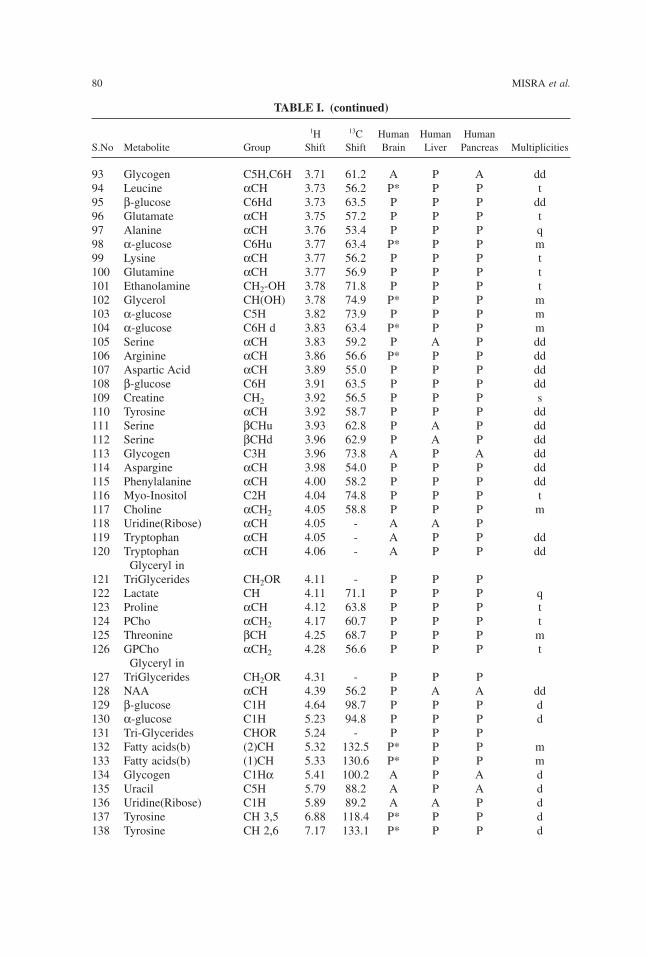
93 Glycogen C5H,C6H 3.71 61.2 A P A dd94 Leucine αCH 3.73 56.2 P* P P t95 β-glucose C6Hd 3.73 63.5 P P P dd96 Glutamate αCH 3.75 57.2 P P P t97 Alanine αCH 3.76 53.4 P P P q98 α-glucose C6Hu 3.77 63.4 P* P P m99 Lysine αCH 3.77 56.2 P P P t100 Glutamine αCH 3.77 56.9 P P P t101 Ethanolamine CH2-OH 3.78 71.8 P P P t102 Glycerol CH(OH) 3.78 74.9 P* P P m103 α-glucose C5H 3.82 73.9 P P P m104 α-glucose C6H d 3.83 63.4 P* P P m105 Serine αCH 3.83 59.2 P A P dd106 Arginine αCH 3.86 56.6 P* P P dd107 Aspartic Acid αCH 3.89 55.0 P P P dd108 β-glucose C6H 3.91 63.5 P P P dd109 Creatine CH2 3.92 56.5 P P P s110 Tyrosine αCH 3.92 58.7 P P P dd111 Serine βCHu 3.93 62.8 P A P dd112 Serine βCHd 3.96 62.9 P A P dd113 Glycogen C3H 3.96 73.8 A P A dd114 Aspargine αCH 3.98 54.0 P P P dd115 Phenylalanine αCH 4.00 58.2 P P P dd116 Myo-Inositol C2H 4.04 74.8 P P P t117 Choline αCH2 4.05 58.8 P P P m118 Uridine(Ribose) αCH 4.05 - A A P119 Tryptophan αCH 4.05 - A P P dd120 Tryptophan αCH 4.06 - A P P dd
Glyceryl in121 TriGlycerides CH2OR 4.11 - P P P122 Lactate CH 4.11 71.1 P P P q123 Proline αCH 4.12 63.8 P P P t124 PCho αCH2 4.17 60.7 P P P t125 Threonine βCH 4.25 68.7 P P P m126 GPCho αCH2 4.28 56.6 P P P t
Glyceryl in127 TriGlycerides CH2OR 4.31 - P P P128 NAA αCH 4.39 56.2 P A A dd129 β-glucose C1H 4.64 98.7 P P P d130 α-glucose C1H 5.23 94.8 P P P d131 Tri-Glycerides CHOR 5.24 - P P P132 Fatty acids(b) (2)CH 5.32 132.5 P* P P m133 Fatty acids(b) (1)CH 5.33 130.6 P* P P m134 Glycogen C1Hα 5.41 100.2 A P A d135 Uracil C5H 5.79 88.2 A P A d136 Uridine(Ribose) C1H 5.89 89.2 A A P d137 Tyrosine CH 3,5 6.88 118.4 P* P P d138 Tyrosine CH 2,6 7.17 133.1 P* P P d
80 MISRA et al.
TABLE I. (continued)
1H 13C Human Human HumanS.No Metabolite Group Shift Shift Brain Liver Pancreas Multiplicities
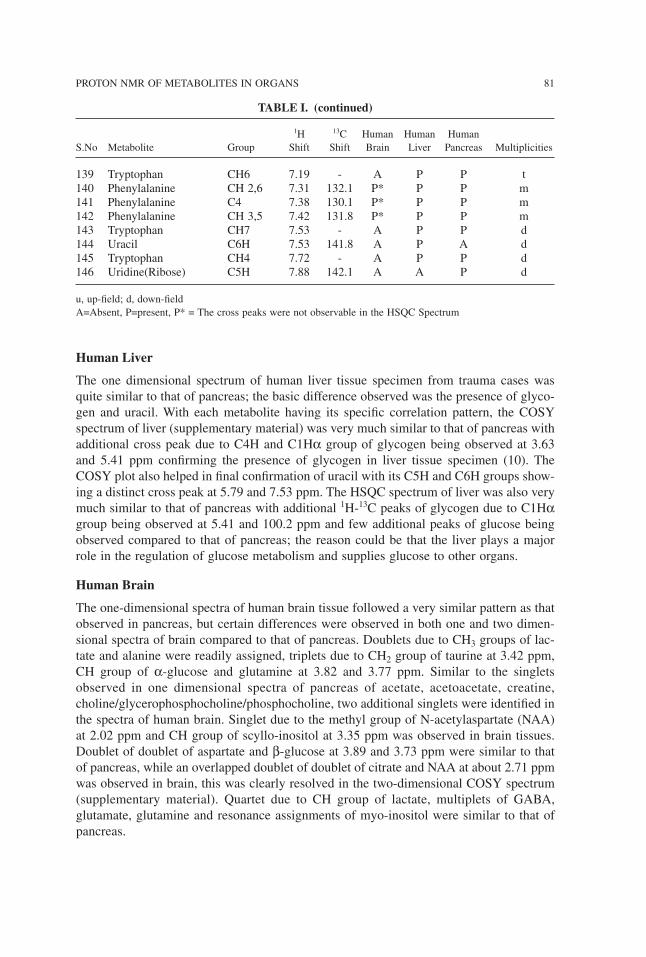
Human Liver
The one dimensional spectrum of human liver tissue specimen from trauma cases wasquite similar to that of pancreas; the basic difference observed was the presence of glyco-gen and uracil. With each metabolite having its specific correlation pattern, the COSYspectrum of liver (supplementary material) was very much similar to that of pancreas withadditional cross peak due to C4H and C1Hα group of glycogen being observed at 3.63and 5.41 ppm confirming the presence of glycogen in liver tissue specimen (10). TheCOSY plot also helped in final confirmation of uracil with its C5H and C6H groups show-ing a distinct cross peak at 5.79 and 7.53 ppm. The HSQC spectrum of liver was also verymuch similar to that of pancreas with additional 1H-13C peaks of glycogen due to C1Hαgroup being observed at 5.41 and 100.2 ppm and few additional peaks of glucose beingobserved compared to that of pancreas; the reason could be that the liver plays a majorrole in the regulation of glucose metabolism and supplies glucose to other organs.
Human Brain
The one-dimensional spectra of human brain tissue followed a very similar pattern as thatobserved in pancreas, but certain differences were observed in both one and two dimen-sional spectra of brain compared to that of pancreas. Doublets due to CH3 groups of lac-tate and alanine were readily assigned, triplets due to CH2 group of taurine at 3.42 ppm,CH group of α-glucose and glutamine at 3.82 and 3.77 ppm. Similar to the singletsobserved in one dimensional spectra of pancreas of acetate, acetoacetate, creatine,choline/glycerophosphocholine/phosphocholine, two additional singlets were identified inthe spectra of human brain. Singlet due to the methyl group of N-acetylaspartate (NAA)at 2.02 ppm and CH group of scyllo-inositol at 3.35 ppm was observed in brain tissues.Doublet of doublet of aspartate and β-glucose at 3.89 and 3.73 ppm were similar to thatof pancreas, while an overlapped doublet of doublet of citrate and NAA at about 2.71 ppmwas observed in brain, this was clearly resolved in the two-dimensional COSY spectrum(supplementary material). Quartet due to CH group of lactate, multiplets of GABA,glutamate, glutamine and resonance assignments of myo-inositol were similar to that ofpancreas.
PROTON NMR OF METABOLITES IN ORGANS 81
139 Tryptophan CH6 7.19 - A P P t140 Phenylalanine CH 2,6 7.31 132.1 P* P P m141 Phenylalanine C4 7.38 130.1 P* P P m142 Phenylalanine CH 3,5 7.42 131.8 P* P P m143 Tryptophan CH7 7.53 - A P P d144 Uracil C6H 7.53 141.8 A P A d145 Tryptophan CH4 7.72 - A P P d146 Uridine(Ribose) C5H 7.88 142.1 A A P d
u, up-field; d, down-fieldA=Absent, P=present, P* = The cross peaks were not observable in the HSQC Spectrum
TABLE I. (continued)
1H 13C Human Human HumanS.No Metabolite Group Shift Shift Brain Liver Pancreas Multiplicities
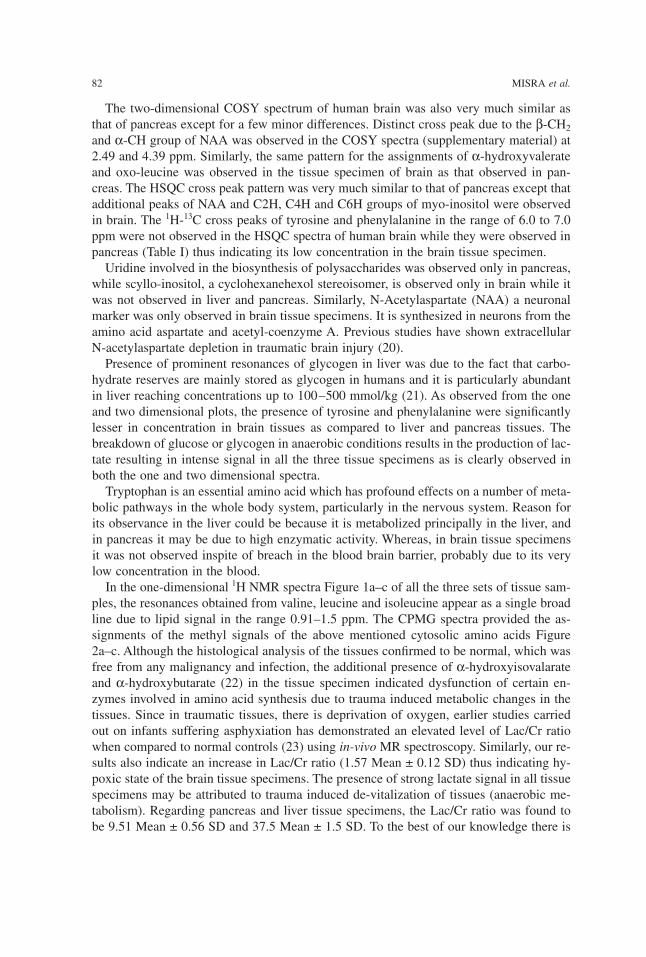
The two-dimensional COSY spectrum of human brain was also very much similar asthat of pancreas except for a few minor differences. Distinct cross peak due to the β-CH2and α-CH group of NAA was observed in the COSY spectra (supplementary material) at2.49 and 4.39 ppm. Similarly, the same pattern for the assignments of α-hydroxyvalerateand oxo-leucine was observed in the tissue specimen of brain as that observed in pan-creas. The HSQC cross peak pattern was very much similar to that of pancreas except thatadditional peaks of NAA and C2H, C4H and C6H groups of myo-inositol were observedin brain. The 1H-13C cross peaks of tyrosine and phenylalanine in the range of 6.0 to 7.0ppm were not observed in the HSQC spectra of human brain while they were observed inpancreas (Table I) thus indicating its low concentration in the brain tissue specimen.Uridine involved in the biosynthesis of polysaccharides was observed only in pancreas,
while scyllo-inositol, a cyclohexanehexol stereoisomer, is observed only in brain while itwas not observed in liver and pancreas. Similarly, N-Acetylaspartate (NAA) a neuronalmarker was only observed in brain tissue specimens. It is synthesized in neurons from theamino acid aspartate and acetyl-coenzyme A. Previous studies have shown extracellularN-acetylaspartate depletion in traumatic brain injury (20).Presence of prominent resonances of glycogen in liver was due to the fact that carbo-
hydrate reserves are mainly stored as glycogen in humans and it is particularly abundantin liver reaching concentrations up to 100–500 mmol/kg (21). As observed from the oneand two dimensional plots, the presence of tyrosine and phenylalanine were significantlylesser in concentration in brain tissues as compared to liver and pancreas tissues. Thebreakdown of glucose or glycogen in anaerobic conditions results in the production of lac-tate resulting in intense signal in all the three tissue specimens as is clearly observed inboth the one and two dimensional spectra.Tryptophan is an essential amino acid which has profound effects on a number of meta-
bolic pathways in the whole body system, particularly in the nervous system. Reason forits observance in the liver could be because it is metabolized principally in the liver, andin pancreas it may be due to high enzymatic activity. Whereas, in brain tissue specimensit was not observed inspite of breach in the blood brain barrier, probably due to its verylow concentration in the blood.In the one-dimensional 1H NMR spectra Figure 1a–c of all the three sets of tissue sam-
ples, the resonances obtained from valine, leucine and isoleucine appear as a single broadline due to lipid signal in the range 0.91–1.5 ppm. The CPMG spectra provided the as-signments of the methyl signals of the above mentioned cytosolic amino acids Figure2a–c. Although the histological analysis of the tissues confirmed to be normal, which wasfree from any malignancy and infection, the additional presence of α-hydroxyisovalarateand α-hydroxybutarate (22) in the tissue specimen indicated dysfunction of certain en-zymes involved in amino acid synthesis due to trauma induced metabolic changes in thetissues. Since in traumatic tissues, there is deprivation of oxygen, earlier studies carriedout on infants suffering asphyxiation has demonstrated an elevated level of Lac/Cr ratiowhen compared to normal controls (23) using in-vivoMR spectroscopy. Similarly, our re-sults also indicate an increase in Lac/Cr ratio (1.57 Mean ± 0.12 SD) thus indicating hy-poxic state of the brain tissue specimens. The presence of strong lactate signal in all tissuespecimens may be attributed to trauma induced de-vitalization of tissues (anaerobic me-tabolism). Regarding pancreas and liver tissue specimens, the Lac/Cr ratio was found tobe 9.51 Mean ± 0.56 SD and 37.5 Mean ± 1.5 SD. To the best of our knowledge there is
82 MISRA et al.
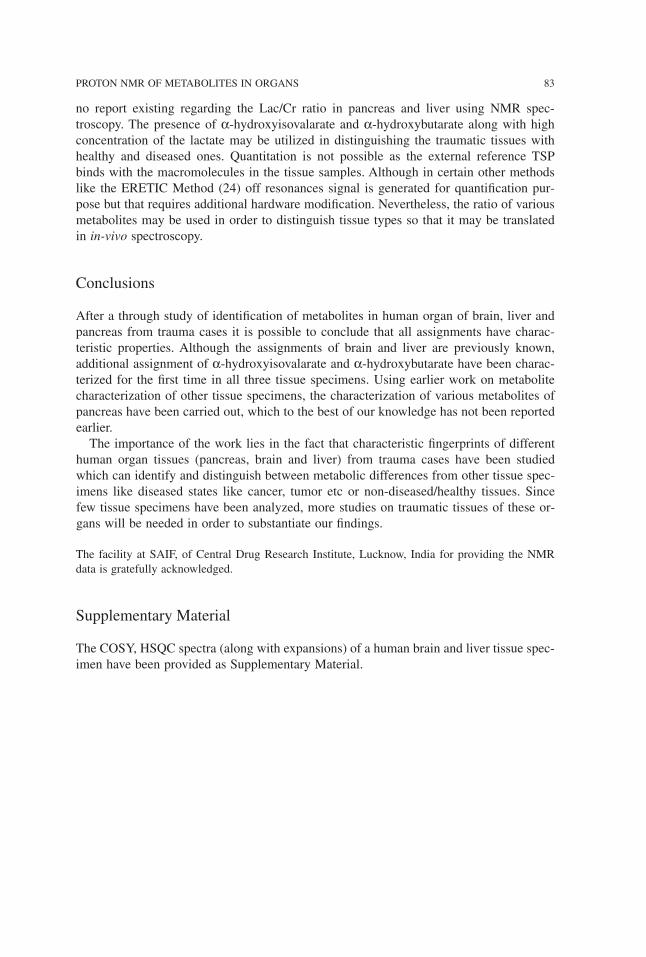
no report existing regarding the Lac/Cr ratio in pancreas and liver using NMR spec-troscopy. The presence of α-hydroxyisovalarate and α-hydroxybutarate along with highconcentration of the lactate may be utilized in distinguishing the traumatic tissues withhealthy and diseased ones. Quantitation is not possible as the external reference TSPbinds with the macromolecules in the tissue samples. Although in certain other methodslike the ERETIC Method (24) off resonances signal is generated for quantification pur-pose but that requires additional hardware modification. Nevertheless, the ratio of variousmetabolites may be used in order to distinguish tissue types so that it may be translatedin in-vivo spectroscopy.
Conclusions
After a through study of identification of metabolites in human organ of brain, liver andpancreas from trauma cases it is possible to conclude that all assignments have charac-teristic properties. Although the assignments of brain and liver are previously known,additional assignment of α-hydroxyisovalarate and α-hydroxybutarate have been charac-terized for the first time in all three tissue specimens. Using earlier work on metabolitecharacterization of other tissue specimens, the characterization of various metabolites ofpancreas have been carried out, which to the best of our knowledge has not been reportedearlier.The importance of the work lies in the fact that characteristic fingerprints of different
human organ tissues (pancreas, brain and liver) from trauma cases have been studiedwhich can identify and distinguish between metabolic differences from other tissue spec-imens like diseased states like cancer, tumor etc or non-diseased/healthy tissues. Sincefew tissue specimens have been analyzed, more studies on traumatic tissues of these or-gans will be needed in order to substantiate our findings.
The facility at SAIF, of Central Drug Research Institute, Lucknow, India for providing the NMRdata is gratefully acknowledged.
Supplementary Material
The COSY, HSQC spectra (along with expansions) of a human brain and liver tissue spec-imen have been provided as Supplementary Material.
PROTON NMR OF METABOLITES IN ORGANS 83
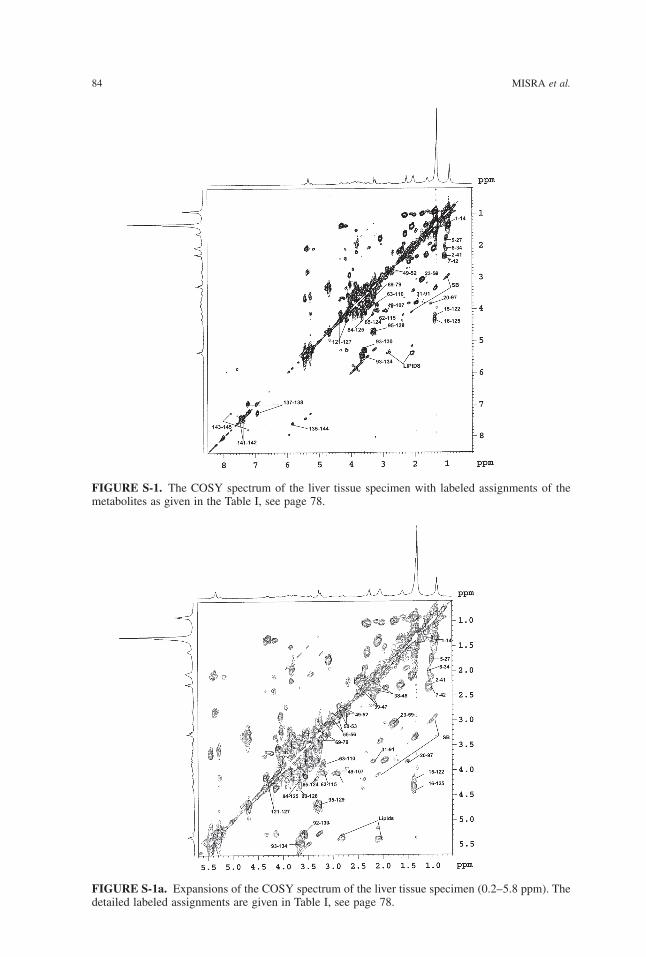
84 MISRA et al.
FIGURE S-1a. Expansions of the COSY spectrum of the liver tissue specimen (0.2–5.8 ppm). Thedetailed labeled assignments are given in Table I, see page 78.
FIGURE S-1. The COSY spectrum of the liver tissue specimen with labeled assignments of themetabolites as given in the Table I, see page 78.
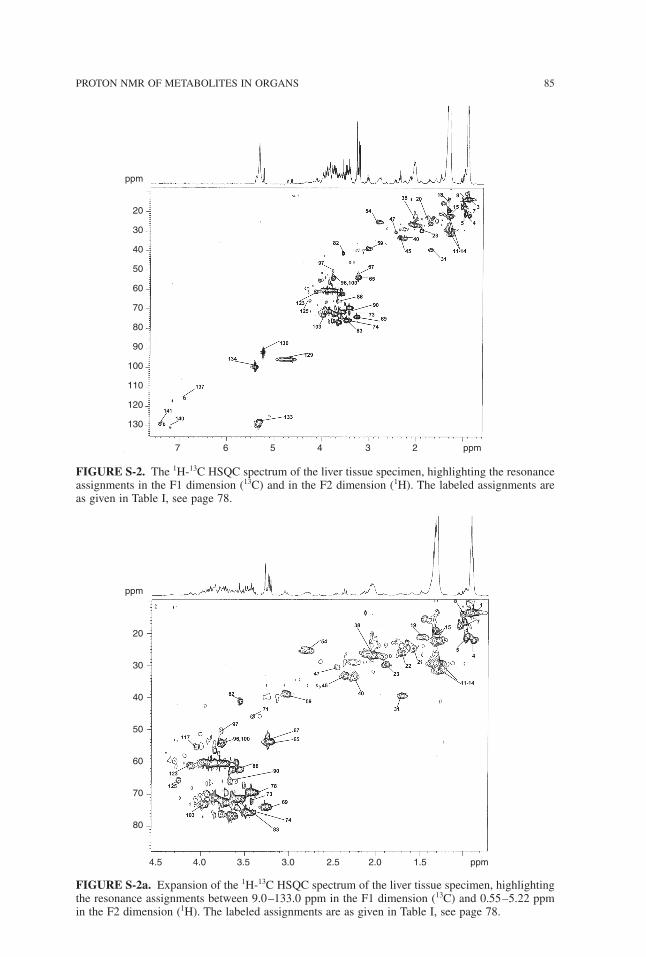
PROTON NMR OF METABOLITES IN ORGANS 85
FIGURE S-2. The 1H-13C HSQC spectrum of the liver tissue specimen, highlighting the resonanceassignments in the F1 dimension (13C) and in the F2 dimension (1H). The labeled assignments areas given in Table I, see page 78.
FIGURE S-2a. Expansion of the 1H-13C HSQC spectrum of the liver tissue specimen, highlightingthe resonance assignments between 9.0–133.0 ppm in the F1 dimension (13C) and 0.55–5.22 ppmin the F2 dimension (1H). The labeled assignments are as given in Table I, see page 78.
ppm
20
30
40
50
60
70
80
90
100
110
120
130
7 6 5 4 3 2 ppm
ppm
20
30
40
50
60
70
80
4.5 4.0 3.5 3.0 2.5 2.0 1.5 ppm
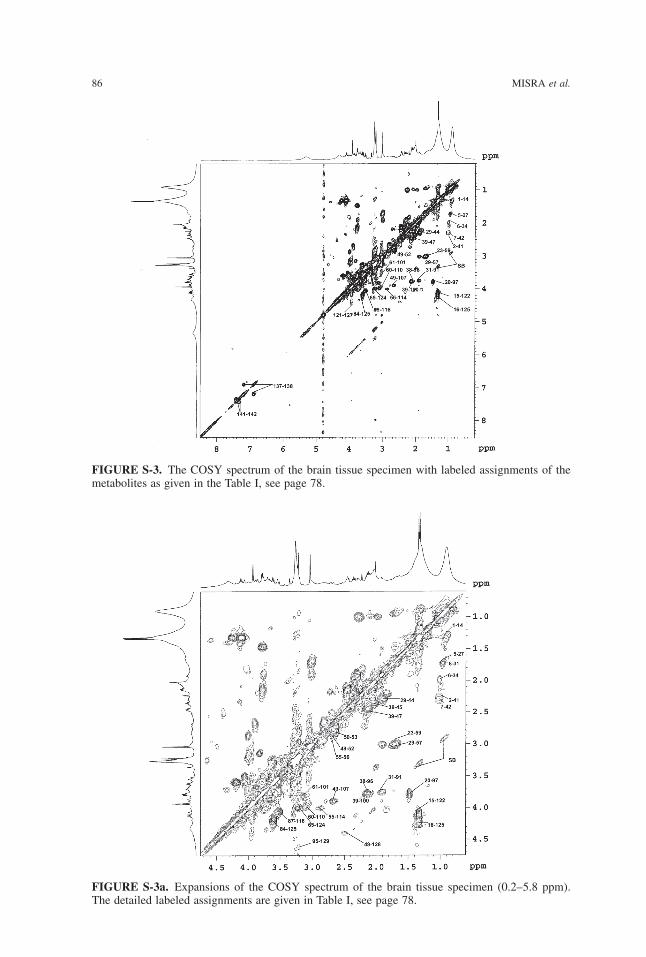
86 MISRA et al.
FIGURE S-3. The COSY spectrum of the brain tissue specimen with labeled assignments of themetabolites as given in the Table I, see page 78.
FIGURE S-3a. Expansions of the COSY spectrum of the brain tissue specimen (0.2–5.8 ppm).The detailed labeled assignments are given in Table I, see page 78.
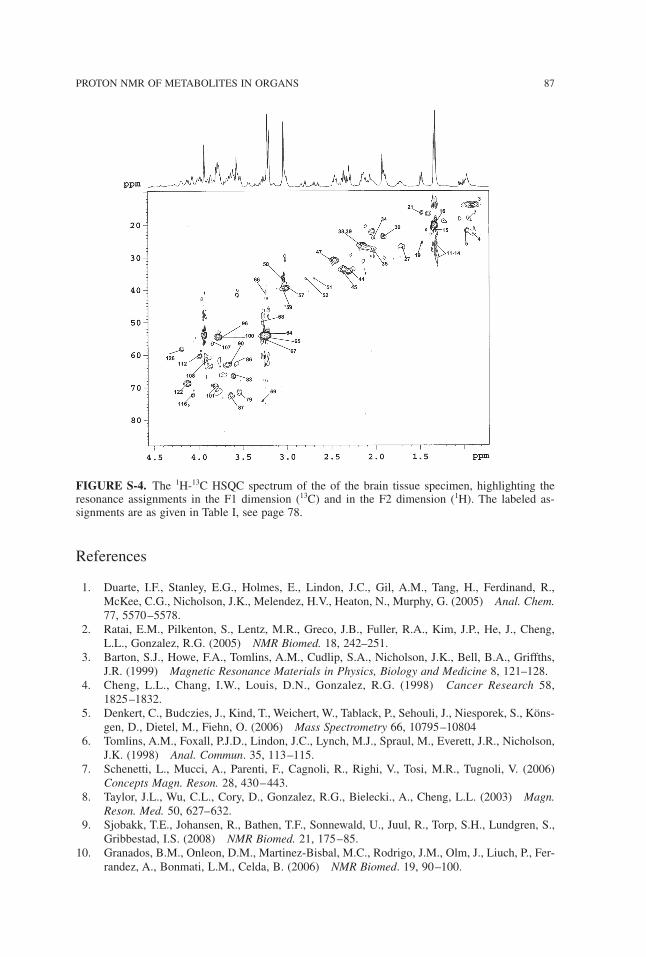
References
1. Duarte, I.F., Stanley, E.G., Holmes, E., Lindon, J.C., Gil, A.M., Tang, H., Ferdinand, R.,McKee, C.G., Nicholson, J.K., Melendez, H.V., Heaton, N., Murphy, G. (2005) Anal. Chem.77, 5570–5578.
2. Ratai, E.M., Pilkenton, S., Lentz, M.R., Greco, J.B., Fuller, R.A., Kim, J.P., He, J., Cheng,L.L., Gonzalez, R.G. (2005) NMR Biomed. 18, 242–251.
3. Barton, S.J., Howe, F.A., Tomlins, A.M., Cudlip, S.A., Nicholson, J.K., Bell, B.A., Griffths,J.R. (1999) Magnetic Resonance Materials in Physics, Biology and Medicine 8, 121–128.
4. Cheng, L.L., Chang, I.W., Louis, D.N., Gonzalez, R.G. (1998) Cancer Research 58,1825–1832.
5. Denkert, C., Budczies, J., Kind, T., Weichert, W., Tablack, P., Sehouli, J., Niesporek, S., Köns-gen, D., Dietel, M., Fiehn, O. (2006) Mass Spectrometry 66, 10795–10804
6. Tomlins, A.M., Foxall, P.J.D., Lindon, J.C., Lynch, M.J., Spraul, M., Everett, J.R., Nicholson,J.K. (1998) Anal. Commun. 35, 113–115.
7. Schenetti, L., Mucci, A., Parenti, F., Cagnoli, R., Righi, V., Tosi, M.R., Tugnoli, V. (2006)Concepts Magn. Reson. 28, 430–443.
8. Taylor, J.L., Wu, C.L., Cory, D., Gonzalez, R.G., Bielecki., A., Cheng, L.L. (2003) Magn.Reson. Med. 50, 627–632.
9. Sjobakk, T.E., Johansen, R., Bathen, T.F., Sonnewald, U., Juul, R., Torp, S.H., Lundgren, S.,Gribbestad, I.S. (2008) NMR Biomed. 21, 175–85.
10. Granados, B.M., Onleon, D.M., Martinez-Bisbal, M.C., Rodrigo, J.M., Olm, J., Liuch, P., Fer-randez, A., Bonmati, L.M., Celda, B. (2006) NMR Biomed. 19, 90–100.
PROTON NMR OF METABOLITES IN ORGANS 87
FIGURE S-4. The 1H-13C HSQC spectrum of the of the brain tissue specimen, highlighting theresonance assignments in the F1 dimension (13C) and in the F2 dimension (1H). The labeled as-signments are as given in Table I, see page 78.
11. Swanson, M.G., Zektzer, A.S., Tabatabai, Z.L, Simko, J., Jarso, S., Keshari, K.R., Schmitt, L.,Carroll, P.R., Shinohara, K., Vigneron, D.B. and Kurhanewicz, J. (2006) Magn. Reson. Med.55, 1257–1264.
12. Lyng, H., Sitter, B., Bathen, T.F., Jensen, L.R., Sundfor, K., Kristensen, G.B. and Gribbestad,I.S. (2007) BMC Cancer 7, 1–12.
13. Cheng, L.L., Anthony, D.C., Comite, A.R., Black, P.M., Tzika, A.A. and Gonzalez, R. (2000)Neuro-Oncology 2, 87–95.
14. Viant, M.R., Lyeth, B.G., Miller, M.G., Berman, R.F. (2005) NMR Biomed. 18, 07–516.15. Govindaraju, V., Young, K., Maudsley, A.A. (2000) NMR Biomed. 13, 129–153.16. Sitter, B., Sonnewald, U., Spraul, M., Fjosne, H.E. and Gribbestad, I.S. (2002) NMR Bio-
med. 15, 327–337.17. Martinez-Bisbal, M.C., Marti-Bonmati, L., Piquer, J., Revert, A., Ferrer, P., Llacer, J.L., Pi-
otto, M., Assemat, O. and Celda, B. (2004) NMR Biomed. 17, 191–205.18. Bell, J.D., Sadler, P.J. (1999) Encyclopedia of Magnetic Resonance. John Wiley and Sons:
New York. 2, 989–1001.19. Cheng, L.L., Newell, K., Mallory, A.E., Hyman, B.T., Gonzalez, R.G. (2002) Magn. Reson.
Imaging 20, 527–533.20. Shulman, R.G., Rothman, D.L. (2005) Metabolomics by in vivo NMR. John Wiley and Sons:
New York, pp 2421. Antonio, B., Jon, S., Axel, P., Salvatore, R., Neil, K., Martin, S., Barbara, T., Vagnozzi,
Roberto, V., Stefano, S., Angela Maria, A., Francesco, B., Giuseppe, G. (2006) J. Neu-rochem. 96, 861–869.
22. Lindon, J.C., Nicholson, J.K., Everette, J.R. (1999) Ann. Rep. NMR Spectros. 38, 1–88.23. Hanrahan, J.D., Sargentoni, J., Azzopardi, D., Manji, K., Cowan, F.M., Rutherford, M.A.,
Cox, I.J., Bell, J.D., Bryant, D.J., Edwards, A.D. (1996) Pediatric Res. 39, 584–590.24. Silvestre, V., Goupry, S., Trierweiler, M., Robins, R., Akoka, S. (2001) Anal. Chem. 73,
1862–1868.
Received January 29, 2009;accepted April 13, 2009.
88 MISRA et al.
Physiol. Chem. Phys. & Med. NMR (2008) 40: 89–113
A Historically Significant Study that atOnce Disproves the Membrane (Pump)
Theory and Confirms that Nano-protoplasmIs the Ultimate Physical Basis of Life —Yet so Simple and Low-cost that it CouldEasily Be Repeated in Many High School
Biology Classrooms Worldwide
Gilbert N. Ling and Margaret M. Ochsenfeld
Damadian Foundation for Basic and Cancer ResearchTim and Kim Ling Foundation for Basic and Cancer Research
110 Marcus Drive, Melville, NY 11747Email: [email protected]
In 1889 Abderhalden reported his discovery that there is no (or as shown later, little) sodiumion (Na+) in human red blood cells even though these cells live in a medium rich in Na+. His-tory shows that all major theories of the living cell are built around this basic phenomenonseen in all the living cells that have been carefully examined. One of these theories has beensteadily evolving but is yet-to-be widely known. Named the association-induction hypothesis(AIH), it has been presented thus far in four books dated 1962, 1984, 1992 and 2001 respec-tively. In this theory, the low Na+ in living cells originates from (i) an above-normal molecule-to-molecule interaction among the bulk-phase cell water molecules, in consequence of (ii) their(self-propagating) polarization-orientation by the backbone NHCO groups of (fully-extended)cell protein(s), when (iii) the protein(s) involved is under the control of the electron-withdraw-ing cardinal adsorbent (EWC), ATP. A mature human red blood cell (rbc) has no nucleus, norother organelle. 64% of the rbc is water; 35% belongs to a single protein, hemoglobin (Hb).This twofold simplicity allows the concoction of an ultra-simple model (USM) of the red bloodcell’s cytoplasmic protoplasm, which comprises almost entirely of hemoglobin, water, K+ andATP. Only in the USM, the ATP has been replaced by an artificial but theoretically authenticEWC, H+ (given as HCl). To test the theory with the aid of the USM, we filled dialysis sacswith a 40% solution of pure (ferri-) hemoglobin followed by incubating the sacs till equilib-rium in solutions containing different amounts of HCl (including zero) but a constant (low)
concentration of NaCl. We then determined the equilibrium ratio of the Na+ concentration in-side the sac over that in the solution outside and refer to this ratio as qNaCl. When no H+ wasadded, the qNaCl stayed at unity as predicted by the theory. More important (and also pre-dicted by the theory,) when the right amount of H+ had been added, qNaCl fell to the 0.1- 0.3range found in living red blood (and other) cells. These and other findings presented confirmthe AIH’s theory of life at the most basic level: in the resting living state, microscopic, or nano-protoplasm, is the ultimate physical basis of life. (See Post Script on page 111.)
IN 1834 Felix Dujardin introduced what was eventually known as protoplasm1. Fiveyears later, Theodor Schwann (and Mathias Schleiden) announced the Cell Theory2,3. Lesswell known is the fact that Schwann also introduced the essence of the membrane pumptheory as a part of his Cell Theory. That is, cells are membrane-enclosed cavities filledwith clear liquid water2a, and that the cell membrane has metabolische Kraft (metabolicpower) that controls the chemical makeup of the fluids inside and outside the cell2b.In contrast, Max Schultze pronounced in 1861 that a living cell is “a membrane-less
lump of protoplasm containing a nucleus”4. Continuing this line of thinking, ThomasHuxley came to the conclusion that protoplasm is the physical basis of life5 and commu-nicated this idea to a lay audience in an Edinburgh church. Huxley’s speech was breath-taking from start to finish; notwithstanding, it had a disconcerting flaw. Since protoplasmwas then characterized as a semi-fluid, sticky and transparent substance, it did not matchthe more rigid and darker nucleus. If the nucleus is not a part of the physical basis of life,what is it? Then again, not all living cells possess a nucleus.The mature mammalian red blood cell, for example, has no nucleus; nor could the best
microscope available then reveal the presence of an enclosing cell membrane. Therefore,the very existence of mature mammalian red blood cells suggested that, at their simplest,living cells are lumps of protoplasm without a nucleus or cell membrane.In 1889, Emil Abderhalden discovered something crucial that challenged the view of
membrane-less red blood cells6. Abderlalden found no sodium ion (Na+) inside the redblood cells even though the blood plasma, in which the red blood cells spend their lives,contain a great deal of Na+. The question arose, if the red blood cell has no enclosingmembrane, what would prevent Na+ from becoming equally distributed inside and outsidethe cell? In years to come, further investigations revealed that there is some Na+ in redblood cells. Nevertheless, a strongly asymmetrical distribution of Na+ exists not only inred blood cells but in virtually all types of living cells carefully examined as exemplifiedby the human red blood cell, the frog muscle and the squid axons (Table I.)
90 LING and OCHSENFELD
TABLE I. The water and Na+ concentrations in three of the most extensively studied types ofliving cells and the Na+ concentrations in their respective blood plasma.
H2O [Na]in [Na]ex qNaCl ref.(%) (mM) (mM)
nerve axon (squid) 86.5 50 440 0.114 7
muscle cell (frog) 77.4 16.9 104 0.163 8, 9
mature red blood cells (human) 65 18 135 0.133 10
Doubt about the existence of a cell membrane was laid to rest not long after the inven-tion in 1931 of the electron microscope by Knoll and Ruska11. Its much higher magnify-ing power enabled biologists to establish that the red blood cell12 — like other cell typesstudied13 — does indeed possess a (vanishingly thin) cell membrane. In the decades fol-lowing, the membrane pump theory rose to the peak of its popularity. Meanwhile, inter-est in the protoplasm concept steadily declined.In an article entitled Meaninglessness of the Word Protoplasm14, microbiologist Hardin
showed that between 1926 and 1951 citation in the Biological Abstract of the word,protoplasm, had plummeted 77% (p.118.) In recent years, Encyclopedia BritannicaOnline has repeated Hardin’s message. “As the cell has become fractionated into its com-ponent parts, protoplasm, as a term no longer has meaning.”15 In the US at least, biologytextbooks at both the high school and college level teach the membrane pump theory ex-clusively; they rarely if at all mention the word protoplasm9, 9a, 16. However, a scatteringof cell physiologists worldwide believe that the rejection of protoplasm may be a painfulbut passing episode in history.Ling, for example, suggested that the real cause of the dwindling popularity of the pro-
toplasm concept could be that the relevant parts of physics, chemistry and biology neededto give a more cogent definition of protoplasm and move the concept forward were stillthings of the future16. With time the relevant branches of knowledge attained the neededmaturity one by one.Arriving on the scene at just the right time, Ling was able to put together in 1962 an
elementary unifying theory of the living phenomena in a volume entitled “A PhysicalTheory of the Living State: the Association-Induction Hypothesis”17–22.The association-induction (AI) hypothesis grew up in the light of critical knowledge
denied earlier investigators. That includes the knowledge on protein structure and the newbranch of physics called statistical mechanics. From a historic perspective, however, theAI hypothesis is without question the heir to what Dujardin, von Mohl, Schultze, Huxleyand others introduced in mid-19th century. Another 45 years were to elapse before a newname, nano-protoplasm, was coined23 to replace what was once referred to as a biologi-cal fixed charge system18a or an elementary living machine17a.
Protoplasm re-defined
The long-range goal of the AI Hypothesis is to interpret all macroscopic cell physiologi-cal manifestations in terms of the properties and activities of microscopic molecules,atoms, ions, and electrons. Thus, in the latest version of the AI Hypothesis, what ThomasHuxley called the physical basis of life is a specific but highly prominent example ofmacroscopic protoplasm23. Other varieties of macroscopic protoplasm make up respec-tively the cell nuclei, the cell membrane and other sub-cellular structures. Despite theirgreat diversity in form and function, all macroscopic protoplasms have one thing incommon. They all comprise a vast number of similar microscopic units called nano-protoplasm23. Accordingly, nano-protoplasm — rather than a specific kind of prominentmacroscopic protoplasm — is the smallest unit of life and hence its ultimate physicalbasis23.
CONFIRMING NANO-PROTOPLASM 91
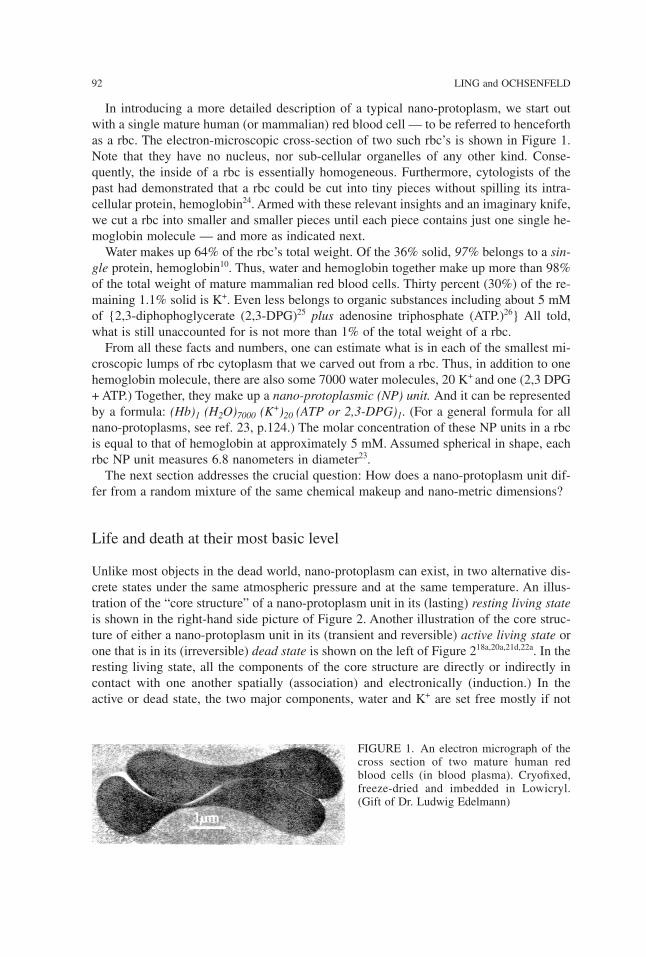
In introducing a more detailed description of a typical nano-protoplasm, we start outwith a single mature human (or mammalian) red blood cell — to be referred to henceforthas a rbc. The electron-microscopic cross-section of two such rbc’s is shown in Figure 1.Note that they have no nucleus, nor sub-cellular organelles of any other kind. Conse-quently, the inside of a rbc is essentially homogeneous. Furthermore, cytologists of thepast had demonstrated that a rbc could be cut into tiny pieces without spilling its intra-cellular protein, hemoglobin24. Armed with these relevant insights and an imaginary knife,we cut a rbc into smaller and smaller pieces until each piece contains just one single he-moglobin molecule — and more as indicated next.Water makes up 64% of the rbc’s total weight. Of the 36% solid, 97% belongs to a sin-
gle protein, hemoglobin10. Thus, water and hemoglobin together make up more than 98%of the total weight of mature mammalian red blood cells. Thirty percent (30%) of the re-maining 1.1% solid is K+. Even less belongs to organic substances including about 5 mMof {2,3-diphophoglycerate (2,3-DPG)25 plus adenosine triphosphate (ATP.)26} All told,what is still unaccounted for is not more than 1% of the total weight of a rbc.From all these facts and numbers, one can estimate what is in each of the smallest mi-
croscopic lumps of rbc cytoplasm that we carved out from a rbc. Thus, in addition to onehemoglobin molecule, there are also some 7000 water molecules, 20 K+ and one (2,3 DPG+ ATP.) Together, they make up a nano-protoplasmic (NP) unit. And it can be representedby a formula: (Hb)1 (H2O)7000 (K+)20 (ATP or 2,3-DPG)1. (For a general formula for allnano-protoplasms, see ref. 23, p.124.) The molar concentration of these NP units in a rbcis equal to that of hemoglobin at approximately 5 mM. Assumed spherical in shape, eachrbc NP unit measures 6.8 nanometers in diameter23.The next section addresses the crucial question: How does a nano-protoplasm unit dif-
fer from a random mixture of the same chemical makeup and nano-metric dimensions?
Life and death at their most basic level
Unlike most objects in the dead world, nano-protoplasm can exist, in two alternative dis-crete states under the same atmospheric pressure and at the same temperature. An illus-tration of the “core structure” of a nano-protoplasm unit in its (lasting) resting living stateis shown in the right-hand side picture of Figure 2. Another illustration of the core struc-ture of either a nano-protoplasm unit in its (transient and reversible) active living state orone that is in its (irreversible) dead state is shown on the left of Figure 218a,20a,21d,22a. In theresting living state, all the components of the core structure are directly or indirectly incontact with one another spatially (association) and electronically (induction.) In theactive or dead state, the two major components, water and K+ are set free mostly if not
92 LING and OCHSENFELD
FIGURE 1. An electron micrograph of thecross section of two mature human redblood cells (in blood plasma). Cryofixed,freeze-dried and imbedded in Lowicryl.(Gift of Dr. Ludwig Edelmann)
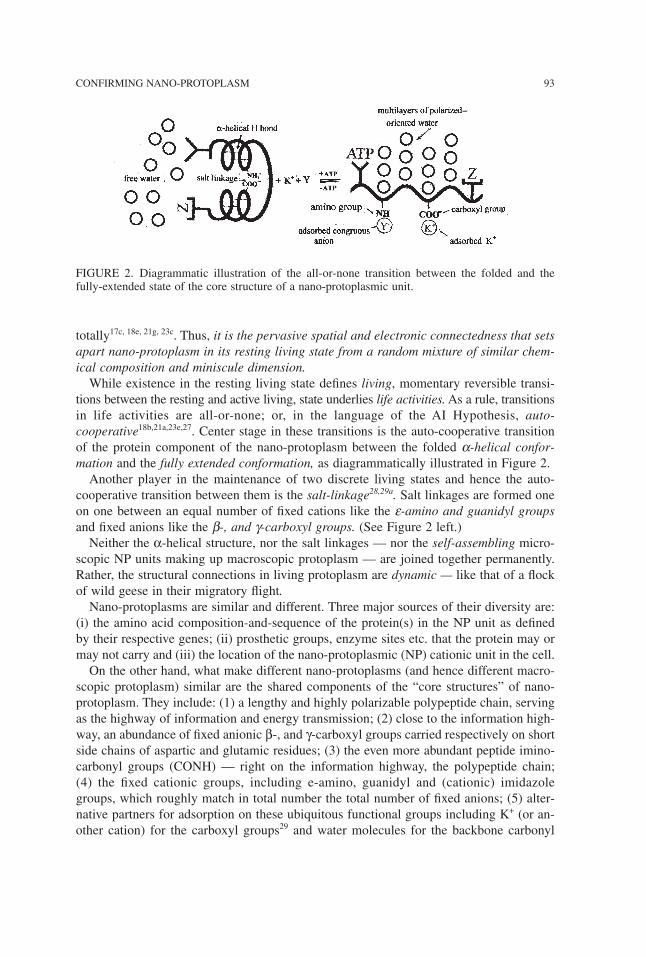
totally17c, 18e, 21g, 23c. Thus, it is the pervasive spatial and electronic connectedness that setsapart nano-protoplasm in its resting living state from a random mixture of similar chem-ical composition and miniscule dimension.While existence in the resting living state defines living, momentary reversible transi-
tions between the resting and active living, state underlies life activities.As a rule, transitionsin life activities are all-or-none; or, in the language of the AI Hypothesis, auto-cooperative18b,21a,23e,27. Center stage in these transitions is the auto-cooperative transitionof the protein component of the nano-protoplasm between the folded α-helical confor-mation and the fully extended conformation, as diagrammatically illustrated in Figure 2.Another player in the maintenance of two discrete living states and hence the auto-
cooperative transition between them is the salt-linkage28,29a. Salt linkages are formed oneon one between an equal number of fixed cations like the ε-amino and guanidyl groupsand fixed anions like the β-, and γ-carboxyl groups. (See Figure 2 left.)Neither the α-helical structure, nor the salt linkages — nor the self-assembling micro-
scopic NP units making up macroscopic protoplasm — are joined together permanently.Rather, the structural connections in living protoplasm are dynamic — like that of a flockof wild geese in their migratory flight.Nano-protoplasms are similar and different. Three major sources of their diversity are:
(i) the amino acid composition-and-sequence of the protein(s) in the NP unit as definedby their respective genes; (ii) prosthetic groups, enzyme sites etc. that the protein may ormay not carry and (iii) the location of the nano-protoplasmic (NP) cationic unit in the cell.On the other hand, what make different nano-protoplasms (and hence different macro-
scopic protoplasm) similar are the shared components of the “core structures” of nano-protoplasm. They include: (1) a lengthy and highly polarizable polypeptide chain, servingas the highway of information and energy transmission; (2) close to the information high-way, an abundance of fixed anionic β-, and γ-carboxyl groups carried respectively on shortside chains of aspartic and glutamic residues; (3) the even more abundant peptide imino-carbonyl groups (CONH) — right on the information highway, the polypeptide chain;(4) the fixed cationic groups, including e-amino, guanidyl and (cationic) imidazolegroups, which roughly match in total number the total number of fixed anions; (5) alter-native partners for adsorption on these ubiquitous functional groups including K+ (or an-other cation) for the carboxyl groups29 and water molecules for the backbone carbonyl
CONFIRMING NANO-PROTOPLASM 93
FIGURE 2. Diagrammatic illustration of the all-or-none transition between the folded and thefully-extended state of the core structure of a nano-protoplasmic unit.
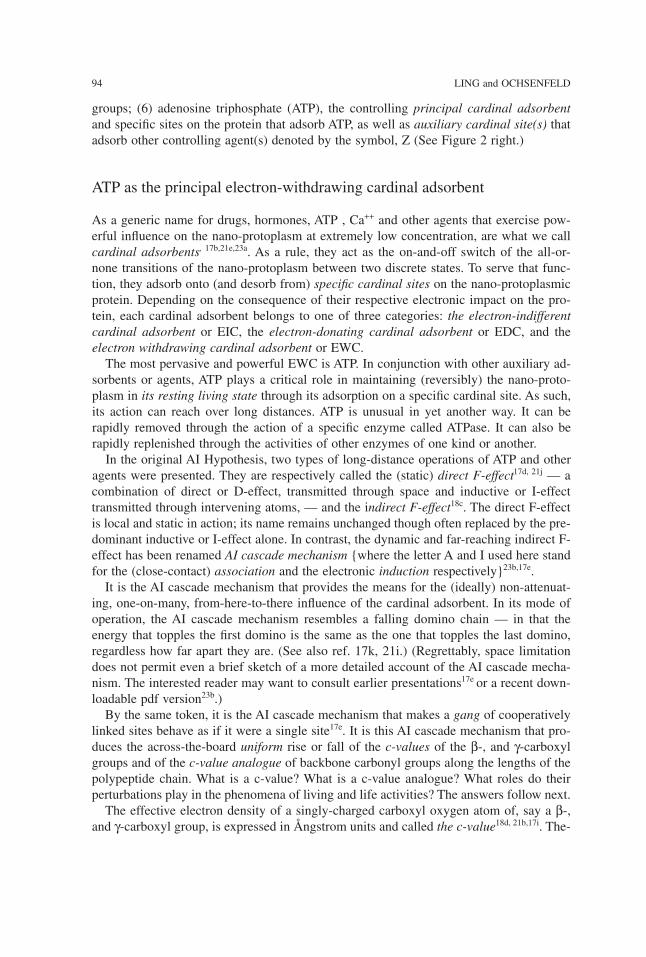
groups; (6) adenosine triphosphate (ATP), the controlling principal cardinal adsorbentand specific sites on the protein that adsorb ATP, as well as auxiliary cardinal site(s) thatadsorb other controlling agent(s) denoted by the symbol, Z (See Figure 2 right.)
ATP as the principal electron-withdrawing cardinal adsorbent
As a generic name for drugs, hormones, ATP , Ca++ and other agents that exercise pow-erful influence on the nano-protoplasm at extremely low concentration, are what we callcardinal adsorbents, 17b,21e,23a. As a rule, they act as the on-and-off switch of the all-or-none transitions of the nano-protoplasm between two discrete states. To serve that func-tion, they adsorb onto (and desorb from) specific cardinal sites on the nano-protoplasmicprotein. Depending on the consequence of their respective electronic impact on the pro-tein, each cardinal adsorbent belongs to one of three categories: the electron-indifferentcardinal adsorbent or EIC, the electron-donating cardinal adsorbent or EDC, and theelectron withdrawing cardinal adsorbent or EWC.The most pervasive and powerful EWC is ATP. In conjunction with other auxiliary ad-
sorbents or agents, ATP plays a critical role in maintaining (reversibly) the nano-proto-plasm in its resting living state through its adsorption on a specific cardinal site. As such,its action can reach over long distances. ATP is unusual in yet another way. It can berapidly removed through the action of a specific enzyme called ATPase. It can also berapidly replenished through the activities of other enzymes of one kind or another.In the original AI Hypothesis, two types of long-distance operations of ATP and other
agents were presented. They are respectively called the (static) direct F-effect17d, 21j — acombination of direct or D-effect, transmitted through space and inductive or I-effecttransmitted through intervening atoms, — and the indirect F-effect18c. The direct F-effectis local and static in action; its name remains unchanged though often replaced by the pre-dominant inductive or I-effect alone. In contrast, the dynamic and far-reaching indirect F-effect has been renamed AI cascade mechanism {where the letter A and I used here standfor the (close-contact) association and the electronic induction respectively}23b,17e.It is the AI cascade mechanism that provides the means for the (ideally) non-attenuat-
ing, one-on-many, from-here-to-there influence of the cardinal adsorbent. In its mode ofoperation, the AI cascade mechanism resembles a falling domino chain — in that theenergy that topples the first domino is the same as the one that topples the last domino,regardless how far apart they are. (See also ref. 17k, 21i.) (Regrettably, space limitationdoes not permit even a brief sketch of a more detailed account of the AI cascade mecha-nism. The interested reader may want to consult earlier presentations17e or a recent down-loadable pdf version23b.)By the same token, it is the AI cascade mechanism that makes a gang of cooperatively
linked sites behave as if it were a single site17e. It is this AI cascade mechanism that pro-duces the across-the-board uniform rise or fall of the c-values of the β-, and γ-carboxylgroups and of the c-value analogue of backbone carbonyl groups along the lengths of thepolypeptide chain. What is a c-value? What is a c-value analogue? What roles do theirperturbations play in the phenomena of living and life activities? The answers follow next.The effective electron density of a singly-charged carboxyl oxygen atom of, say a β-,
and γ-carboxyl group, is expressed in Ångstrom units and called the c-value18d, 21b,17i. The-
94 LING and OCHSENFELD
oretical computations made in the late 1950’s showed that variation of the c-value coulddecide adsorption preferences on these negatively charged functional groups17g,18f. Thus,according to what we now call the c-scheme, at low c-value, K+ is preferred over Na+; athigh c-value, the reverse is the case. As a pervasive EWC, ATP adsorption on its specialcardinal site — in conjunction with auxiliary agents of various kinds — keeps all thenano-protoplasmic β-, and γ-carboxyl groups at a low c-value. That is why K+, and notNa+, is adsorbed on these anionic sites and accumulates in the nano-protoplasm main-tained at its resting living state as shown in Figure 2 right29.However, at both low and high c-value, H+ is preferred over most other mono-valent
cations often by a high margin17g,18f. Keep this in mind, as it will appear again in new ex-perimental studies to be presented on later pages.Similarly, the c-value analogue of the backbone peptide carbonyl group represents the
effective electron density of the dipolar carbonyl group (CO)18d, 21c, and as such it has aparallel capacity like that of the c-value. Based on the comprehensive and mutually con-sistent work of three groups of scientists on the “α-helical potential” of amino acidresidues in proteins (Chou & Fasman, Tanaka & Scheraga and Garniere et al), Ling in-troduced in 1980 the theoretical concept later named the c-analogue scheme30,17j,21k. Ac-cording to this scheme, at high c-value analogue, the peptide carbonyl group prefers toengage in α-helical H-bonds. On the other hand, at low c-value analogue, the peptidegroup prefers to assume the fully extended conformation. As such, they adsorb, polarizeand orient multilayers of water molecules according to the polarized-oriented multilayeror POM theory of cell water31,32.The POM theory, short for the “polarized-oriented multilayer theory” of cell water and
model systems — for some time also called the PM theory — was added to the AI Hy-pothesis proper in 1965 to explain the exclusion from the living cells31(Table I) of (hy-drated) Na+ — i.e., Na+ plus its more or less permanently attached coat of watermolecules in an aqueous environment. As illustrated in the right hand side picture of Fig-ure 2, all the water molecules in the nano-protoplasm in its resting living state adopt thedynamic structure of polarized-oriented multilayers. In this polarized-oriented water, theaverage water-to-water interaction energy is stronger than in normal liquid water—withimportant consequences33,34,35. Thus, it would take more energy to excavate a hole in thepolarized-oriented water to accommodate a large hydrated Na+ than the energy recoveredin filling up the hole left behind in the normal liquid water from where this Na+ came.Accordingly, to move such a Na+ (and its companion Cl-) from the normal water out-
side a living cell into the polarized-oriented water inside a living cell entails extra energyexpenditure. The Boltzmann distribution law then dictates that, at equilibrium, less Na+
(and its companion anion, Cl-) would be found inside the cell water than in the external-bathing medium36. This then constitutes the important volume component of the solute ex-clusion mechanism against large solutes like hydrated Na+ (and Cl-) but with less or noexpulsive impact on smaller solutes like urea, for example, according to what has becomeknown as the size rule33,34,37,17f.As mentioned above, ATP adsorption on the nano-protoplasmic protein exerts a perva-
sive and far-reaching electron-withdrawing effect. At the lowered c-value thus achieved,the β-, and γ-carboxyl groups favor K+ over Na+ adsorption via what is known as the c-scheme. Similarly, the lowered c-value analogue of backbone carbonyl groups keeps thepolypeptide chain in the fully extended state via the c-analogue scheme. Take away the
CONFIRMING NANO-PROTOPLASM 95
ATP and the system reverts in an all-or-none manner to the doubly folded state as shownin Figure 2 on the left, and in the process, liberates all or virtually all its adsorbed water andK+ 17c, 21g, 23c, 38. With that, the nano-protoplasm’s ability to exclude Na+ also disappears.
An ultra-simple model of the core structure of nano-protoplasm
The utter simplicity of the chemical makeup of the rbc’s cytoplasmic NP unit offers anunusual opportunity. It makes it feasible to construct an ultra-simple model (USM) of thecore structure of a NP unit from pure chemicals exclusively. On the vast collection ofthese models in say 0.4-ml of the mix in a dialysis sac, we can test the theory how its real-life counterpart works. If the ultra-simple model (USM) can indeed reproduce what thetheory has predicted, we know that it is the pure chemicals we put together and nothingbeyond them that did the job.Philosophically, this new USM approach could offer the cell physiologist a way out of
the inherent trouble of there being too many inseparable participants within the living cellbeing studied. Remember Occam’s Razor, One should not increase, beyond what is nec-essary, the number of entities required to explain anything. For only when dealing withall the essential entities — and when they are only a few of them — can we keep our eyeson the total picture all the time and avoid being sidetracked into pursuing more and more(on less and less — ultimately to nowhere.)However, given the advantage of reducing the number of entities involved, the full poten-
tial of a test with an ultra-simple model could be reached only when the physiological traitchosen for study is critically important and it is shared by all or virtually all living cells.To reach that goal, we believe that no other physiological manifestation could come
close to the (reversible) maintenance of Na+ (as chloride) in the cell water at a level muchlower than that in the surrounding medium (Table I.)The entire history of cell physiology39 testifies to the veracity of this belief. To the best
of our knowledge, all the major theories of the living cell were built around the criticalphenomenon of Na+ exclusion. They include Boyle and Conway’s sieve version of themembrane theory40, the pump version of the membrane theory once wrongly attributed toR.Dean41, but truly due to Theodor Schwann as pointed out earlier, Troshin’s sorption the-ory42 and Ling’s association-induction hypothesis18.With our strategy outlined, we proceed to test our theoretical concept of pervasively
connected nano-protoplasm as the ultimate physical basis of life. First, we outline how wecarried out the studies under Materials and Methods and attach it at the end of the Resultsand Discussion sections, which are presented in two parts labeled respectively R and Dpart 1 and R and D part 2. However, make sure to read the Materials and Methodssection first.
Results and Discussion
R and D part 1
As described under Material and Methods, we incubated dialysis sacs (filled with initiallya 40% hemoglobin solution) in solutions containing the same low concentration of NaCl
96 LING and OCHSENFELD
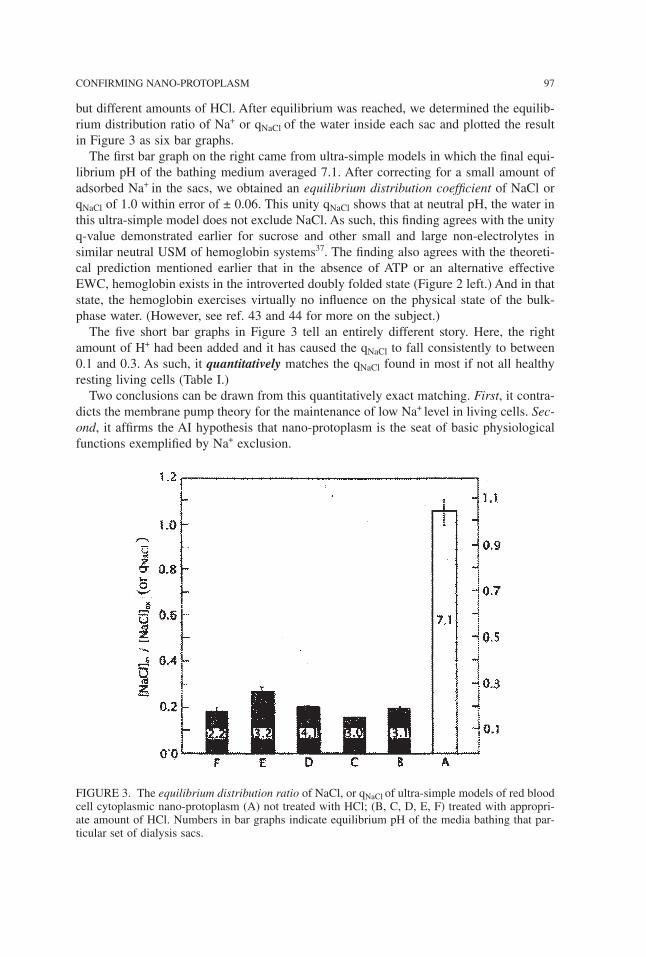
but different amounts of HCl. After equilibrium was reached, we determined the equilib-rium distribution ratio of Na+ or qNaCl of the water inside each sac and plotted the resultin Figure 3 as six bar graphs.The first bar graph on the right came from ultra-simple models in which the final equi-
librium pH of the bathing medium averaged 7.1. After correcting for a small amount ofadsorbed Na+ in the sacs, we obtained an equilibrium distribution coefficient of NaCl orqNaCl of 1.0 within error of ± 0.06. This unity qNaCl shows that at neutral pH, the water inthis ultra-simple model does not exclude NaCl. As such, this finding agrees with the unityq-value demonstrated earlier for sucrose and other small and large non-electrolytes insimilar neutral USM of hemoglobin systems37. The finding also agrees with the theoreti-cal prediction mentioned earlier that in the absence of ATP or an alternative effectiveEWC, hemoglobin exists in the introverted doubly folded state (Figure 2 left.) And in thatstate, the hemoglobin exercises virtually no influence on the physical state of the bulk-phase water. (However, see ref. 43 and 44 for more on the subject.)The five short bar graphs in Figure 3 tell an entirely different story. Here, the right
amount of H+ had been added and it has caused the qNaCl to fall consistently to between0.1 and 0.3. As such, it quantitatively matches the qNaCl found in most if not all healthyresting living cells (Table I.)Two conclusions can be drawn from this quantitatively exact matching. First, it contra-
dicts the membrane pump theory for the maintenance of low Na+ level in living cells. Sec-ond, it affirms the AI hypothesis that nano-protoplasm is the seat of basic physiologicalfunctions exemplified by Na+ exclusion.
CONFIRMING NANO-PROTOPLASM 97
FIGURE 3. The equilibrium distribution ratio of NaCl, or qNaCl of ultra-simple models of red bloodcell cytoplasmic nano-protoplasm (A) not treated with HCl; (B, C, D, E, F) treated with appropri-ate amount of HCl. Numbers in bar graphs indicate equilibrium pH of the media bathing that par-ticular set of dialysis sacs.
Thus, the data summarized in Figure 3 provides yet a fourth set of evidence against themembrane pump theory of Na+ exclusion, — in addition to three other sets published ear-lier, which are: i) energy insufficiency18e, 45, 16; ii) intact membrane without cytoplasm doesnot work46,47,48; iii) cytoplasm without functional membrane (and pump) does work49,17m.The new data presented here suggests once more that the low Na+ level in living cells
does not come from an impermeable cell membrane barrier, nor from the ceaseless activ-ity of (postulated) sodium pumps in the cell membrane. Indeed, the new evidence is soplain, that one doubts that any one with an open mind could miss what the data tell. Nota trace of the cell membrane nor postulated pumps exists in the USM preparation that hasquantitatively reproduced the 0.1–0.3 qNaCl seen in most living cells.Of far greater significance, this concordance between the experimental and real life
qNaCl fulfills what we set out to do. Namely, proving that a mix of four pure chemicals —hemoglobin, water, NaCl and HCl — can indeed reproduce not only qualitatively butquantitatively one of the most fundamental physiological attributes shared by living cells.What is more, it can be turned on or off by the introduction or removal of the agent, HCl.Having completed part 1 of our Result and Discussion, we begin R and D part 2 with
a brief introduction.
R and D part 2
The addition of HCl to a mix of three pure chemicals and the conversion of normal liquidwater in that mix into one that exhibits a 0.1 to 0.3 qNaCl are by themselves totally un-connected events. The only logical connection between them comes from the AI Hypoth-esis. From a broad perspective, the quantitative confirmation of a predicted result impliesthat all the interweaving steps giving rise to the predicted results have already been con-firmed. However, in dealing with a science as complex as cell physiology, a deeper lookinto the validity of each of the intervening (three) step sequence is a must. Indeed, to dothat is the purpose of the second part of our study that has yielded R and D part 2.In the first step of the three-step sequence, the right amount of the premiere EWC, H+
given in the form of HCl binds onto appropriate sites on the hemoglobin in the ultra-sim-ple model.In the second step, this binding of the EWC, H+, lowers the c-value analogue of local
backbone carbonyl groups of the hemoglobin molecules — via the direct F-effect. Thelocal c-analogue fall then sets in motion the complex third step.In the third step, an auto-cooperative transition takes place producing in an all-or-none
manner the following trio of interlocking changes: (a) converting contiguous NHCOgroups from their original high c-analogue to low c-analogue — via the AI cascade mech-anism; (b) converting sections of the hemoglobin chains from their original a-helicalfolded conformation to the fully extended conformation with the backbone NHCO groupsexposed — via the c-analogue scheme; (c) converting a large number of free water mol-ecules to the state of multi-layer polarization and orientation — on the exposed NHCOgroups of the fully-extended hemoglobin chains — to assume the dynamic structure dis-tinguished by a 0.1-0.3 qNaCl.Before going into our next section, we point out that there are already repeatedly con-
firmed evidence in support of step 2 and step 3c. Thus in regard to step 2, there are mu-tually supportive evidence that the step 2 inductive effect can be launched by theformation of new ionic or H-bonds as in the more familiar formation of new covalent
98 LING and OCHSENFELD
bonds21m. In addition, four sets of independent evidence exist demonstrating that the di-rect F-effect can effectively transmit through a length of the polypeptide chain plus seg-ments of saturated hydrocarbon chains17d, 21j. In reference to step 3c, one may mention thefollowing: Proteins which may for structural reasons as in gelatin (i.e., high contents ofnon-helical forming proline and hydroxyproline residues)50 or in response to denaturants(e.g., NaOH, guanidine HCl, urea) exist in the fully-extended conformation51. In that case,they have been shown to adsorb at the physiological relative vapor pressure (0.9969)enough water molecules that match the living cells in amount52 and in the extents of ex-clusion of sucrose, free amino acids and Na2SO4 — with the exception of NaCl53.Accordingly, the subject matter that most urgently calls for confirmation include: (i)
identifying H+ (of the HCl added) as the true causal agent that brings about the qNaCl fallfrom unity to 0.1-0.3; (ii) determining the nature and number of the binding sites for H+;(iii) establishing the role of the AI cascade mechanism in creating the low qNaCl observed;and (iv) verifying the way an effective EWC actually transforms a protein like hemoglo-bin from its α-helical folded conformation to the fully extended conformation (that pro-duces the low qNaCl in the bulk-phase water the extended protein chain adsorbs, polarizesand orients.)We end this introduction with a question, How did we find “just the right amount of
HCl” — as pointed out earlier — to produce the five short bar graphs of Figure 3?
Just right amount of HCl
Once more, we repeat. We incubated dialysis sacs (containing initially a 40% hemoglo-bin solution) in solutions containing the same concentration of NaCl but differentamounts of HCl. After equilibrium was reached, we determined the qNaCl of the water in-side each sac and plotted their averages against the final pH’s of their respective bathingsolutions in Figure 4.The data demonstrate that as the amount of HCl added increased step by step, both the
pH and the qNaCl fell steadily to lower and lower values — until the pH reached a valueof 2.2. From this point on, further addition of HCl continued to lower the pH but not theqNaCl. Instead, the qNaCl started to rise with further HCl addition. Seen as a whole, thecurve has the shape of an asymmetrical U. As such, it comprises three distinct segmentsdesignated 1, 2 and 3 respectively, counting from the high pH end. A minimum of qNaCloccurs at pH 2.2. The amount(s) of HCl needed to create this minimum in this, and inother companion sets of studies, are referred to as the “right amount of HCl” used to pro-duce the five short bar graphs in Figure 3.The specific set of data shown in Figure 4 was obtained with the Na-electrode after in-
cubation of the sacs at around 9° C. Two additional full sets of data were obtained afterincubation of sacs at 25° C with the radioactive tracer method and they produced similarasymmetrical U-shaped curves. However, the minimums occurred at pH closer to 3 than2. Notwithstanding, the values of the qNaCl measured at or near these pH’s also fall be-tween 0.1 and 0.3 and are among those shown as short bar graphs in Figure 3.In what follows, we will pursue further what underlies the data presented in Figure 4
in two sections. We begin with a section on the “falling limb” (Segment 1 and 2) on theright of the asymmetrical U-shaped curve. After that, we will continue with a section onthe minimum and the rising limb of the curve to the left of the minimum at pH 2.2(Segment 3.)
CONFIRMING NANO-PROTOPLASM 99
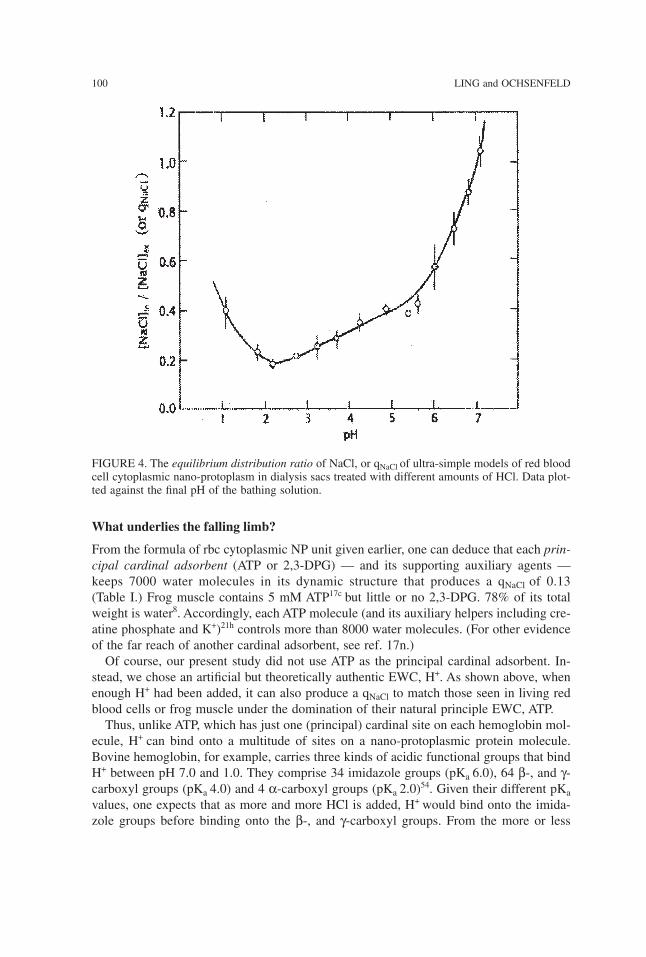
What underlies the falling limb?
From the formula of rbc cytoplasmic NP unit given earlier, one can deduce that each prin-cipal cardinal adsorbent (ATP or 2,3-DPG) — and its supporting auxiliary agents —keeps 7000 water molecules in its dynamic structure that produces a qNaCl of 0.13(Table I.) Frog muscle contains 5 mM ATP17c but little or no 2,3-DPG. 78% of its totalweight is water8. Accordingly, each ATP molecule (and its auxiliary helpers including cre-atine phosphate and K+)21h controls more than 8000 water molecules. (For other evidenceof the far reach of another cardinal adsorbent, see ref. 17n.)Of course, our present study did not use ATP as the principal cardinal adsorbent. In-
stead, we chose an artificial but theoretically authentic EWC, H+. As shown above, whenenough H+ had been added, it can also produce a qNaCl to match those seen in living redblood cells or frog muscle under the domination of their natural principle EWC, ATP.Thus, unlike ATP, which has just one (principal) cardinal site on each hemoglobin mol-
ecule, H+ can bind onto a multitude of sites on a nano-protoplasmic protein molecule.Bovine hemoglobin, for example, carries three kinds of acidic functional groups that bindH+ between pH 7.0 and 1.0. They comprise 34 imidazole groups (pKa 6.0), 64 β-, and γ-carboxyl groups (pKa 4.0) and 4 α-carboxyl groups (pKa 2.0)54. Given their different pKavalues, one expects that as more and more HCl is added, H+ would bind onto the imida-zole groups before binding onto the β-, and γ-carboxyl groups. From the more or less
100 LING and OCHSENFELD
FIGURE 4. The equilibrium distribution ratio of NaCl, or qNaCl of ultra-simple models of red bloodcell cytoplasmic nano-protoplasm in dialysis sacs treated with different amounts of HCl. Data plot-ted against the final pH of the bathing solution.
steady fall of qNaCl between pH 7 and 2.2, one draws the tentative conclusion that the qNaClof the bulk phase water falls in a more or less unchanging direction each time another H+
binds onto one of these three types of acidic groups. Put simply, the impacts produced onthe qNaCl by different (bound) H
+ add up via what is known as the additivity principle tobe described below.Experimentally, one can also roughly estimate how many water molecules each bound
H+ controls with the help of another parameter, (1 – qNaCl ). For a qNaCl equal to, say 0.2,(1 – qNaCl ) would be 0.8. As a working hypothesis — but not so literally in the latest ver-sion of the definitive theory, so far published only in parts 33, 34, 35, 43 — a (1– qNaCl) equalto 0.8 could be seen as indicating that 80% of the bulk-phase water has completely lostits natural solvency for Na(Cl), leaving completely unchanged the remaining 20% in itsnormal solvency for Na(Cl).By taking also into account the equilibrium water content (not shown) and the (1 –
qNaCl ) calculated, one can estimate the minimum number of water molecules made “non-NaCl-solvent” at different points along the qNaCl vs. pH curve of Figure 4, counting theright-hand most point as point 1. Thus, at point 5, the number of water molecules made“non-NaCl-solvent” by each H+ bound is 500. In contrast, the additional number of watermolecules made “non-NaCl-solvent” by each additional H+ bound between point 5 andpoint 11 averages only 66.The large difference between these two numbers (500 and 66) suggests that each of
these two averages cover a wide spread of numbers. Thus at pH above 6.5, the number ofwater molecules made “non-NaCl-solvent” by each H+ bound could exceed substantially500. And, at pH below 4.0, the number could fall substantially below 66. It is the lowestbelow 66-number that would set the limit of water molecules made non-NaCl solvent byeach H+ adsorption via the direct F-effect alone. Anything above that lowest number couldonly have come about via the AI cascade mechanism. All told, it is clear that most of thewater polarized and oriented got there by way of the AI cascade mechanism.In summary, one may say that the falling limb of the qNaCl vs. pH plot in Figure 4 is a
profile of the all-or-none transition from the active living (or dead) state back to the rest-ing living state in “slow motion.” Only in this slow motion version with the binding of alarge number of H+ to the same protein are details of the progress of the transition of theprotein revealed that would be hard to detect when there is only a single cardinal site ad-sorbing a single cardinal adsorbent (ATP) — as is the case in the real-life nano-protoplasm.This is just another example of the bonuses from studying an ultra-simple model.
What lies behind the qNaCl minimum and its secondary rise?
If H+ alone determines c-value analogue of all the backbone carbonyl groups and the dy-namic water structure, one would expect the qNaCl to continue its decline with further HCladdition until a constant qNaCl value is reached and then stays unchanged from there onwith still more HCl addition. That the qNaCl in fact exhibits a minimum followed by a risesuggests that some other player(s) might have entered the arena. What could that player be?A moment of reflection provides an answer. That new player could only be the chloride
ion (Cl-) that was added systematically with H+ in the form of HCl since nothing else wasadded.As mentioned earlier, H+ is very strongly bound to fixed anions17g, 18f, 23f. Accordingly,
H+ would have no trouble displacing and thus liberating the fixed (and some free) cation
CONFIRMING NANO-PROTOPLASM 101
originally bound to a fixed anion in the salt linkages they formed together (as illustratedin Figure 2 left.) In contrast, the Cl- is by itself too weakly bound55 to compete againstand displace a fixed anion in a salt linkage. However, given the opening provided by thespearhead effect of H+, it will now seize the opportunity to bind itself onto the liberatedfixed cation. Put differently, Cl- introduced as NaCl, for example, will not be able todisplace the fixed anion of a salt linkage and becomes adsorbed on the liberated fixedcation as the study of Carr has shown55. Only the Cl- introduced as HCl can bind onto thefixed cations.(The experimentally established Cl- binding further affirms the theoretical conclusion
that for statistical mechanical reasons given, fixation of ionic sites on protein chains pro-pels counter-ions to engage in close-contact association with fixed ions56, 29. This pointknown as the principle of enhanced counter-ion association with site fixation is made herein anticipation of the traditional aversion to the concept of ionic association among someinfluential protein chemists.)Furthermore, there is another principle introduced in the AI Hypothesis that comes into
play here. It is the additivity principle18c mentioned a few paragraphs above. As an ex-ample, we can say that the effective electron density of each backbone peptide carbonylgroup expressed as its c-value analogue is determined not only by the intrinsic value ofthat group alone. Rather, it is that, plus the algebraic sum of the inductive effects of allother near and far linked groups and their respective adsorbents — according to the dis-tance of separation between the inducing group and the target group and the target group’spolarizability. Armed with this additivity principle, we examine next how adsorbed Cl-
could affect the qNaCl.Like its counterpart H+, a Cl- is also an uncomplicated single atom. However, unlike H+,
which carries a positive electric charge and acts as a bona fide EWC, a Cl- carries a neg-ative electric charge and acts as a bona fide electron-donating agent, or EDC. The ad-sorption of a Cl- would therefore in theory produce a direct F-effect on the hemoglobinmolecule opposite to that produced by H+.Now is the time to put this train of theoretical speculations and deductions to a test. To
that end, we studied the (equilibrium) binding of both H+ and Cl- (added together as HCl)on a bovine hemoglobin solution, at a concentration of 19.2%. The results are shown inFigure 5. Note that before the H+ binding curve (labeled A) reaches its maximum at pH2.0, it too comprises two distinct segments — like the qNaCl curve shown in Figure 4.However, there is also a difference. In Figure 4, Segment 1 has a higher slope than Seg-ment 2; the opposite is the case of curve A in Figure 5. We will return to this subjectshortly.Since the midpoint of Segment 1 in Figure 5 is close to the pKa of the imidazole groups
(6.0), it confirms our earlier speculation that Segment 1 of Figure 4 originates from thebinding of H+ (alone) on the imidazole groups of the hemoglobin molecule. From the ex-isting points in Figure 5, one can draw a curve. And from that curve, we then roughly ex-trapolate to a maximum of between 10 and 20 (averaging 15) moles of H+-bindingimidazole groups per mole of hemoglobin (or rbc NP unit) as the pH approaches zero.Subtracting this estimated 15 moles/ mole from the maximum of 92 moles/mole of theH+-binding curve at a pH of about 2, we obtain a figure of 77 which is not too far fromthe total number of β-, and γ-carboxyl groups at 69 moles/ mole of hemoglobin54. Thisand a midpoint close to the pKa of the β-, and γ-carboxyl groups (4.0) confirms our second
102 LING and OCHSENFELD
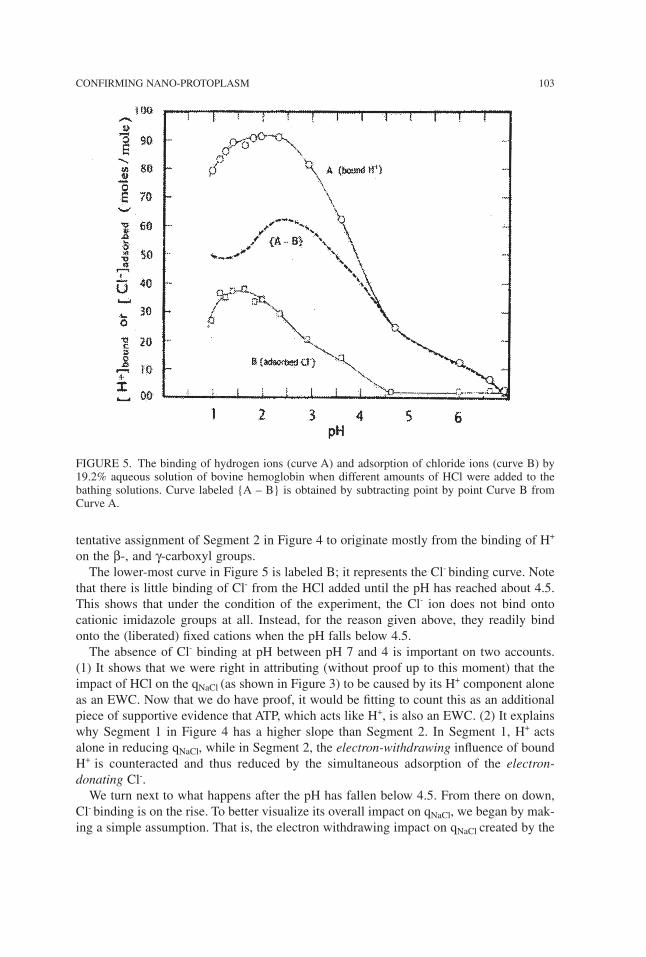
tentative assignment of Segment 2 in Figure 4 to originate mostly from the binding of H+
on the β-, and γ-carboxyl groups.The lower-most curve in Figure 5 is labeled B; it represents the Cl- binding curve. Note
that there is little binding of Cl- from the HCl added until the pH has reached about 4.5.This shows that under the condition of the experiment, the Cl- ion does not bind ontocationic imidazole groups at all. Instead, for the reason given above, they readily bindonto the (liberated) fixed cations when the pH falls below 4.5.The absence of Cl- binding at pH between pH 7 and 4 is important on two accounts.
(1) It shows that we were right in attributing (without proof up to this moment) that theimpact of HCl on the qNaCl (as shown in Figure 3) to be caused by its H
+ component aloneas an EWC. Now that we do have proof, it would be fitting to count this as an additionalpiece of supportive evidence that ATP, which acts like H+, is also an EWC. (2) It explainswhy Segment 1 in Figure 4 has a higher slope than Segment 2. In Segment 1, H+ actsalone in reducing qNaCl, while in Segment 2, the electron-withdrawing influence of boundH+ is counteracted and thus reduced by the simultaneous adsorption of the electron-donating Cl-.We turn next to what happens after the pH has fallen below 4.5. From there on down,
Cl- binding is on the rise. To better visualize its overall impact on qNaCl, we began by mak-ing a simple assumption. That is, the electron withdrawing impact on qNaCl created by the
CONFIRMING NANO-PROTOPLASM 103
FIGURE 5. The binding of hydrogen ions (curve A) and adsorption of chloride ions (curve B) by19.2% aqueous solution of bovine hemoglobin when different amounts of HCl were added to thebathing solutions. Curve labeled {A – B} is obtained by subtracting point by point Curve B fromCurve A.
binding of each H+ is equal to, but opposite in direction to that produced by the bindingof each Cl-. (Space limitation forbids telling more about the detailed reasoning that led usto make this assumption.)Based on this assumption, we subtracted point by point curve B from curve A and plot-
ted the difference as the dashed line labeled {A – B.} Since we know in theory at leastthat H+ binding lowers the qNaCl , while Cl
- binding raises it, the theoretical prediction ofthe overall effect of H+ and Cl- binding together is revealed as the curve {A – B} turnedupside down. And this upside down {A – B} curve also has the shape of an asymmetricalU with a minimum at pH between 2 and 3. In other words, the upside-down {A – B} curvein form replicates the observed qNaCl vs. pH curve in Figure 4. A positive causal relationbetween the binding of both H+ and Cl- and qNaCl is thus substantiated experimentally.Additionally, we also begin to understand a little more about the fine structure of the
asymmetric U-shaped curve of Figure 4. Thus, a minimum occurs at pH 2.2 because justbefore the pH has fallen to this value, the H+ binding has already attained its full maxi-mum while the Cl- binding curve still has a way to go before reaching its maximum. SinceH+ binding lowers qNaCl while Cl
- binding raises it, it is at this pH that qNaCl sinks to itsminimum.As the pH falls still further below 2.2, qNaCl begins to rise again (Segment 3), because
the Cl- binding continues to increase while the H+ binding had ceased to increase and isbeginning to decrease.The parallelism between the inverted {A – B} curve in Figure 5 and the qNaCl curve in
Figure 4 affirms the 3 step scheme presented at the outset of R and D part 2. Regrettably,however, it does not tell us explicitly about the intermediate step 3b, i.e., the transforma-tion of the protein from the folded α-helical conformation to the fully extended confor-mation. Indeed, step 3b tells us that in theory the percentage of the protein that stays inthe α-helical conformation at each final pH value should also follow the inverted {A – B}curve and it too should show a minimum near pH 2 — just like that of the qNaCl vs. pHcurve shown in Figure 4. It was thus with great joy that we came upon belatedly a 19-yearold paper telling us something about just that.
Predicted unfolding of α-helical fold and reversal retroactively affirmed
In 1990 Goto, Takahashi and Fink reported their study on the folding and unfolding ofβ-lactamase, cytochrome c and apomyoglobin in response to HCl57. They showed that in-creasing HCl caused all three proteins to undergo progressive loss of their α-helical con-tent, reaching a maximum of unfolding at pH 2, or put differently, reaching a minimum offolding at pH 2. From there on, further pH decrease brought on by the addition of stillmore HCl caused the proteins to refold again. They then showed that the rise of α-helicalcontent below pH 2 was caused by the binding of Cl- to (each of) the protein under study.In short, Goto and his coworkers had retroactively confirmed what the c- analogue
scheme described as step 3b has predicted. And, we repeat that pari passu with the changeof qNaCl with the addition of HCl, the α-helical content follows a similar asymmetrical Upattern with a minimum at the pH close to 2. Thus, just as the data shown in Figure 4 pro-vides a direct link between H+ and Cl- binding and the lowering of qNaCl, Goto et al’s workestablishes a direct link between H+ and Cl- binding and the unfolding of the α-helicalconformation of the proteins that precedes and is instrumental in the lowering of qNaCl,
104 LING and OCHSENFELD
Materials and Methods
In our ultra-simple model (USM), we chose the hydrogen ion or H+ as the principal car-dinal adsorbent. It is the smallest atom minus its electron or a proton carrying a singlepositive electric charge. As such, H+ is, in theory, our premiere authentic EWC (and willbe used from now on as a standard EWC.) We chose H+ as the principal cardinal adsor-bent in our ultra-simple model over say, ATP, because our evidence that ATP is an EWCare entirely empirical — strong and consistently so as they are 17h, 21f, 58. Since K+ is notincluded in the makeup of the USM, H+ would also substitute for K+ in its role as the part-ners of fixed anions as shown in Figure 2 right (See below.)Experimentally, we began by preparing a 40% solution of (exhaustively dialyzed) pure
bovine methemoglobin (ferri-hemoglobin) (Sigma Chemical Co, St Louis, Mo., Cata-logue No. H-2625, H-2500.) 0.4 gram portions of the 40% hemoglobin solution weresteadily but forcefully injected through a catheter into bubble-free dialysis sacs madefrom quarter-inch Spectra Por 2 dialysis tubing (cut off point: 12,000-14,000 Daltons.)The bathing solutions of a fixed volume in which the filled sacs were incubated containeda constant concentration of 20 mM (or 10 mM) NaCl but varying initial concentration ofHCl, ranging from 0 to 200 mM.Hermetically sealed in paraffin film (Parafilm), each screw-capped glass tube contain-
ing the bathing solution and one or more dialysis sacs was then shaken for 5 or 7 days ina constant temperature water bath maintained at 25°C or in a refrigerator kept at about9°C. This is 15 to 21 times longer than that required for the NaCl to reach diffusion equi-librium (i.e., 8 hours, from time course study.) Inclusion of the antiseptic thymol in trialruns, showed that in its absence, the systems studied were not adversely affected by mi-crobial or fungal contamination.During the incubation, the sacs, especially those exposed to a higher concentration of
HCl, gained varying amount of water — reaching equilibrium in 4 days. Meanwhile, thecontents of these sacs exposed to the higher concentrations of HCl, turned into a stiff gel,which could keep their shape after the dialysis sac membrane has been peeled off.We used two methods of assaying the Na+ concentrations. In the experiments to be
described in detail, we employed a Na+-selective combination glass electrode purchasedfrom Thomas Scientific Co., of Philadelphia (Cat. #4230819.) In supportive experi-ments using radioactive Na-22 labels, we followed the detailed procedure given by Lingand Hu in 198837. For pH and chloride ion measurements, we used respectively a Fisherglass membrane electrode (Catalog. # 315-75) and an Orion chloride ion electrode,Model 94-17A.In the H+ and Cl- binding studies, the hemoglobin solution was not kept inside dialysis
sacs, its hemoglobin concentration therefore stayed unchanged at 19.2%. This particularconcentration of hemoglobin was chosen to approximate the hemoglobin concentration inthe swollen dialysis sacs with final pH substantially below neutrality for reason that wouldbecome self-evident later. In this H+ and Cl- binding studies, we deliberated upon but de-cided against adding NaCl to the 19.2% hemoglobin solution. See ref.59.Our main findings were expressed quantitatively in terms of the ratio of the equilibrium
NaCl concentration in the bulk-phase water in the sac over that in the bathing medium.This ratio is, of course, the (true) equilibrium distribution coefficient or q-value of Na+
(as chloride) and will be represented by the symbol qNaCl. This symbol rather than the
CONFIRMING NANO-PROTOPLASM 105
original designation will be cited frequently in Results and Discussion without furtherexplanation.As mentioned above, we will present results of our experimental studies in two parts.
The first part shows the result of our attempt to use an ultra-simple model to test the the-ory that nano-protoplasm is the physical basis of life. The second part describes what wefound out in our efforts to understand how and why we got what we got in the first part.And then there is also something else we did not count upon at first but is just as exciting.
We thank Dr, Raymond Damadian and his Fonar Corporation for continued support. For their tire-less assistance and inexhaustible patience, we thank our librarian, Anthony Colella and our Direc-tor of Internet Service, Michael Guarino. We thank Dr. Ludwig Edelmann for his invaluable gift ofEM picture of two human red blood cells shown here as Figure 1 and Dr.Wei-hsiao Hu for a largeamount of the work he did in the 1980’s while a post-doctorate scholar in our laboratory in Philadel-phia. Much of his work will be published later; it encompasses another new and enticing subject,diversity of dynamic water structure.
References
1. Dujardin, F. Annales des science naturelles: partie zoologique, 2nd Sér. 4, 343–377 (1835).2. Schwann, T. Mikroscopische Untersuchungen ηber die übereinstimmung in der Struktur und
dem Wachstum der Thiere und Pfanzens (Engelmann, Leipzig, 1839).2a. Ibid p. 175. (p. 177 in ref. 3)2b Ibid p. 197. (p. 197 in ref. 3)3. Smith, H. Microscopical Researches into the Accordance in the Structure and Growth of
Animals and Plants, (Siedenheim Society, 1847). (Reprinted by Kraus Reprint Co., NewYork,1969).
4. Schultz, M. Das Protoplasma der Rhizopoden und der Pflanzenzellen: ein Beitrag zur Theo-rie der Zellen (Engelmann, Leipzig, 1863).
5. Huxley, T.H. On the physical basis of life. Fortnightly Review 5, 129–145 (1869).6. Abderhalden, E. Zur quantitative Vergleich. Analyse des Blutes. Zs. Physiol. Chem. 25,
65–115 (1898).7. Hodgkin, A.L. The Conduction of the Nervous Impulse (Liverpool Univ. Press, 1971). p. 28,
Table 2.8. Ling, G.N. What determines the normal water content of a living cell? Physiol. Chem. Phys.
& Med. NMR 36, 1–19 (2004). Also available at <http://www.physiologicalchemistryandphysics.com/pdf/PCP36-1_ling.pdf>. Or, go to www.gilbertling.com, choose volume and ar-ticle from drop-down list and click.
9. Ling, G.N. In response to an open invitation for comments on AAAS Project 2061’s Bench-mark Books on Science. Part 1. Documentation of serious errors in cell biology. Physiol.Chem. Phys. & Med. NMR 38, 55–76 (2006). Also available at www.physiologicalchemistryandphysics.com/pdf/PCP38-55_ling.pdf Or, go to <www.gilbertling.com>, choose volumeand article from drop-down list and click.
9a. Ibid p. 75, Endnote 1.10. Ponder, E. Hemolysis and Related Phenomena, (Grune and Stratton, New York, 1948, 1971)
pp.119–121.11. Molecular Expression: Science, Optics and You. Timeline-Ernst Ruska. <http:micro.magnet.
fsu.edu/optics/timeline/people/ruska/html>12. Marchesi, V.T. and Palade, G. E. J. Cell. Biol. 35, 385–404 (1967).13. Jain, M. K. The Bimolecular Lipid Membrane (van Nostrand, 1972). p. 11, Figure 1–4.14. Hardin, G. Meaninglessness of the word protoplasm. Scientific Monthly 82, 112–120 (1956).
106 LING and OCHSENFELD
15. “Cell” Encyclopedia Britanica, 2009 Encyclopedia Online. 10 March, (2009)http://search.eb.com/eb/article 37477
16. Ling, G.N. History of the membrane (pump) theory of the living cell from its beginning inmid-19th century to its disproof 45 years ago — though still taught worldwide today as estab-lished truth. Physiol. Chem. Phys. & Med. NMR 39, 1–67 (2007). Also available at<www.physiologicalchemistryandphysics.com/pdf/PCP39-1_ling.pdf>, Or, go to<www.gilbertling.com>, choose volume and article from drop-down list and click.
17. Ling, G. N. Life at the Cell and Below-Cell Level: The Hidden History of a Fundamental Rev-olution in Biology (Pacific Press, New York, 2001).
17a. Ibid pp. 152–153.17b. Ibid p. 167.17c. Ibid p. 184.17d. Ibid p.161, Figure 46.17e. Ibid pp.171–175.17f. Ibid p. 93.17g. Ibid p. 141.17h. Ibid pp. 169–170.17i. Ibid p. 140.17j. Ibid pp. 143–148.17k. Ibid p. 157.17m. Ibid pp. 52–54 Figure 8.18. Ling, G. N. A Physical Theory of the Living State: the Association-Induction Hypothesis
(Blaisdell Publishing Co., Waltham, MA., 1962).18a. Ibid p. 53, 163.18b. Ibid p. 103.18c. Ibid pp. 95–97, pp.111–120.18d. Ibid. p. 57 Figure 4.2.18e. Ibid p.189.18f. Ibid p.77.19. Ling, G.N. In Search of the Physical Basis of Life (Plenum Publ., New York, 1984)
http://www.gilbertling.org/lp6c.htm.20a. Ibid p. 324.21. Ling, G. N. A Revolution in the Physiology of the Living Cell (Krieger Publishing Co., Mal-
abar, FL, (1992).21a. Ibid p. 138.21b. Ibid p. 126–127, Figure 6–7.21c. Ibid p. 147.21d. Ibid p.184.21e. Ibid p.144.21f. Ibid pp.180–182.21g. Ibid p. 189.21h. Ibid p.196.21i. Ibid p.146.21j. Ibid pp. 132, Figure 6–11.21k. Ibid pp. 118–121. Table 6.2.21m. Ibid pp. 112–126.22. Ling, G.N. A new model of the living cell: a summary of the theory and recent experimental
evidence in its support. Intern. Rev. Cytology 24, 1–61 (1969).22a. Ibid p.47.23. Ling, G.N. Nano-protoplasm: the ultimate unit of life. Physiol. Chem. Phys. & Med. NMR 39,
111–234 (2007). Also available at <www.physiologicalchemistryandphysics.com/ pdf/PCP39-111_ling.pdf> Or, go to <www.gilbertling.com>, choose volume and article from drop-downlist and click.
CONFIRMING NANO-PROTOPLASM 107
23a. Ibid p.136.23b. Ibid p.137.23c. Ibid p.172.23d. Ibid pp. 147–152.23e. Ibid p.142.23f. Ibid p.176.24. Best, C.H. and Taylor, N.B. The Physiological Basis of Medical Practice, 4th ed. (William &
Wilkins, Baltimore, 1945). p. 7, col. 2.25. Benesch, R.E. and Benesch, R. The mechanism of interaction of red cell organic phosphates
with hemoglobin. Adv. Prot. Chem. 28, 211–237 (1974).26. Nakao, M., Nakao, T. Yamazoe, S and Yoshikawa, H. Adenosine triphosphate and shape of
erythrocytes. J. Biochem. 49, 487–492 (1961).27. Ling, G.N. The theory of allosteric control of cooperative adsorption and conformation
change: a molecular model of physiological activities according to the association-inductionhypothesis. In Cooperative Phenomena in Biology (ed. George Karremann, Pergamon Press,New York, 1980).
28. Speakman, J.B. and Hirst, M.C. Nature 128, 1073–1074 (1931).29. Ling, G.N. An updated and further developed theory and evidence for the close-contact one-
on-one association of nearly all cell K+ with β-, and γ-carboxyl groups of intracellularproteins. Physiol. Chem. Phys. & Med. NMR 37, 1–88 (2005). Also available athttp://www.physiologicalchemistryandphysics.com/pdf/PCP37-ling.pdf Or, go to <www.gilbertling.com>, choose volume and article from drop-down list and click.
29a. Ibid p.46, Endnote 2.30. Ling, G.N. The role of induction effect in the determination of protein structure. Physiol.
Chem. Phys. & Med. NMR 18, 3–16 (1986). Also available at <http://www. physiological-chemistryandphysics.com/pdf/PCP18-3__ling.pdf>. Or, go to <www.gilbertling.com>,choose volume and article from drop-down list and click.
31. Ling, G.N. The physical state of water in living cells and model systems. Ann. N.Y. Acad. Sci.125, 401–417 (1965).
32. Ling, G.N. A convergence of experimental and theoretical breakthroughs affirms the PM The-ory of dynamically structured cell water on the theory’s 40th birthday. In Water and the Cell(eds. Gerald H. Pollack, Ivan L. Cameron and Denys Wheatley, Springer, Dordrecht, theNetherlands, 2006).
33. Ling, G N. A quantitative theory of solute distribution in cell water according to molecularsize. Physiol. Chem. Phys. & Med. NMR 25, 145–175 (1993). Also available at<http://www.physiologicalchemistryand physics.com/pdf/PCP25-45_ling.pdf> Or, go to<www.gilbertling.com>, choose volume and article from drop-down list and click.
34. Ling, G N. Predictions of polarized multilayer theory of solute distribution confirmed from astudy of the equilibrium distribution in frog muscle of twenty-one nonelectrolytes includingfive cryoprotectants. Physiol. Chem. Phys. & Med. NMR 25, 177-208 (1993). Also availableat <http://www.physiologicalchemistryand physics.com/pdf/PCP25-177_ling.pdf>, Or, go to<www.gilbertling.com>, choose volume and article from drop- down list and click.
35. Ling, G. N. A new theoretical foundation for the polarized-oriented multilayer theory of cellwater and for inanimate systems demonstrating long-range dynamic structuring of water mol-ecules. Physiol. Chem. Phys. & Med. NMR 35: 91–130 (2003). Also available at<http://www.physiologicalchemistryandphysics.com/pdf/PCP35-91_ling.pdf>. Or, go to<www.gilbertling.com>, choose volume and article from drop-down list and click.
36. http://www.faqs.org/theories/Bo-Bu/Boltzmann-s-Distribution-Law.html37. Ling, G.N. and Hu, W. Studies on the physical state of water in living cells and model sys-
tems. X. The dependence of the equilibrium distribution coefficient of a solute in polarizedwater on the molecular weights of the solute: experimental confirmation of the “size rule” inmodel systems. Physiol. Chem. Phys. & Med. NMR 29, 293–307(1988). Also available at<http://www.physiologicalchemistryandphysics.com/pdf/PCP29-293_ling_hu.pdf>. Or, go to<www.gilbertling.com>, choose volume and article from drop-down list and click.
108 LING and OCHSENFELD
38. Ling, G.N. and Walton, C.L. What retains water in living cells? Science 191: 293–295 (1976).39. Ling, G. N. History of the membrane (pump) theory of the living cell from its beginning in
mid-19th Century to its disproof 45 years ago — though still taught worldwide as establishedtruth. Physiol. Chem. Phys. & Med. NMR 39: 1–67 (2003). Also available at<http://www.physiologicalchemistryandphysics.com/pdf/PCP39-1_ling.pdf>. Or, go to<www.gilbertling.com>, choose volume and article from drop-down list and click.
40. Boyle, F.J. and Conway, E.J. Potassium accumulation in muscle and associated changes. J.Physiol. (London) 100, 1–63 (1941).
41. Dean, R.B. Theories of electrolyte equilibrium in muscle. Biol. Symp. 3, 331–348 (1941).42. Troshin, A.S. Problems of Cell Permeability. (transl. M.G. Hell and W.F. Widdas, Pergamon,
1966).43. Ling, G.N. How much water is made “non-free” by 36% native hemoglobin? Physiol. Chem.
Phys & Med. NMR 36, 143–158 (2004). http://www.physiologicalchemistryandphysics.com/pdf/PCP36-143_ling.pdf Or go to <www.gilbertling.com>, choose volume and article fromdrop-down list and click.
44. Ling, G.N. What befalls the protein and water in a living cell when the cell dies? Physiol.Chem. Phys & Med. NMR 37, 141–158 (2004).http://www.physiologicalchemistryandphysics.com/pdf/PCP37-141_ling.pdf . Or go to<www.gilbertling.com>, choose volume and article from drop-down list and click.
45. Ling, G. N. Debunking the alleged resurrection of the sodium pump hypothesis. Physiol.Chem. Phys & Med. NMR 29, 123–198 (1997). Also available at http://www.physiologicalchemistryandphysics.com/pdf/PCP29-ling.pdf. Or go to <www.gilbertling.com>, choose vol-ume and article from drop-down list and click.
46. Ling, G.N. and Negendank, W. Do isolated membranes and purified vesicles pump sodium?A critical review and reinterpretation. Persp. Biol. Med. 23: 215–239 (1980).
47. Brinley, F.J. and Mullin, L. J. Sodium extrusion by internally dialyzed squid axons. J. Gen.Physiol. 52, 181–211 (1968).
48. http://www.gilbertling.org/lp6a.htm.49. Ling, G.N. Maintenance of low sodium and high potassium levels in resting muscle cells.
J. Physiol (London) 280, 105–123 (1978).50. Ling, G.N., Ochsenfeld, M.M., Walton, C. and Bersinger, T. J. Mechanism of solute exclusion
from cells: the role of protein-water interaction. Physiol. Chem. Phys.12, 3–10 (1980).Also available at <http://www.physiologicalchemistryandphysics.com/pdf/PCP12-3_ling_ochsenfeld_walton_bersinger.pdf>. Or go to <www.gilbertling.com>, choose volumeand article from drop-down list and click.
51. Ling, G.N. and Ochsenfeld, M.M. The physical state of water in living cells and model sys-tems. XII. The influence of the conformation of a protein on the solubility of Na+ (sulfate), su-crose, glycine and urea in the water in which the protein is also dissolved. Physiol. Chem.Phys. & Med NMR 21, 19–44 (1989). Also available at <http://www.physiologicalchem-istryandphysics.com/pdf/PCP21-19_ling_ochsenfeld.pdf>. Or, go to <www.gilbertling.com>,choose volume and article from drop-down list and click.
52. Ling, G.N. and Hu, W.X. Studies on the physical state of water in living cells and modelsystems. VIII. Water vapor sorption on proteins and oxygen-containing polymers at physi-ological vapor pressure: presenting a new method for the study of vapor pressure at closeto and including saturation. Physiol. Chem. Phys. & Med. NMR 19, 251–269 (1987). Alsoavailable at <http://www.physiologicalchemistryandphysics.com/pdf/PCP19-251_ling_hu.pdf>. Or, go to <www.gilbertling.com>, choose volume and article from drop-down listand click.
53. Ling, G.N., Walton, C. and Bersinger, T. J.. Reduced solubility of polymer-oriented water forsodium sulfate, amino acids, and other solutes normally maintained at low levels in livingcells. Physiol.Chem.Phys. 12, 111–138 (1980). Also available at <http://www.physiologicalchemistryandphysics.com/pdf/PCP12-111_ling_walton_bersinger.pdf>. Or, go to<www.gilbertling.com>, choose volume and article from drop-down list and click.
CONFIRMING NANO-PROTOPLASM 109
54. Dayhoff, M.O. Atlas of Protein Sequence and Structure (National Biomedical Research Foun-dation, Washington, D.C., 1972).
55. Carr, C.W. Studies on the binding of small ions on protein solutions with the use of membraneelectrodes II. The binding of chloride ions in solution of various Proteins. Arch. Biochem. Bio-phys. 46, 417–423 (1953).
56. Ling, G.N. The role of phosphate in the maintenance of the resting potential and selectiveionic accumulation in frog muscle cells. Phosphorus Metabolism Vol. II, 748–795 (W.D.McElroy and B. Glass, eds., Johns Hopkins University Press, Baltimore, Md., 1952).
57. Goto, Y. Takahashi, N. and Fink, A.L. Mechanism of acid-induced folding of proteins.Biochem. 29, 3480–3488 (1990).
58. Ling, G.N. Oxidative phosphorylation and mitochondrial physiology: a critical review ofchemiosmotic hypothesis and reinterpretation by the association-induction hypothesis. Phys-iol. Chem. Phys. & Med. NMR 33, 29–96 (1981). pp. 86–87. Also available at<http://www.physiologicalchemistryand physics.com/pdf/PCP33-29_ling..pdf>. Or, go to<www.gilbertling.com>, choose volume and article from drop-down list and click.
59. We decided not to add NaCl to the 19.2% hemoglobin solution for the H+ and Cl- bindingstudies for several reasons. Two will be cited here. First, the contents of the dialysis sacs,which produced the data of Figure 4, are highly variable and often much lower than the ini-tial concentrations due to the low qNaCl— known only after the experimental data are in. Thishas made it hard to decide before the experiment what and which concentration of NaCl toduplicate. Second, as shown by Carr55, in the form of NaCl, Cl- does not bind onto hemoglo-bin significantly Thus, whatever concentration of NaCl we may choose to add, it could notconceivably give us any tangible benefit.
Received September 11, 2009;accepted September 25, 2009.
110 LING and OCHSENFELD
Post Script
In order to reach a larger numbers of scientists, teachers and others directly or indirectlyinvolved with biomedical science, we submitted this manuscript on August 6, 2009 to theNature magazine of Great Britain — though it bore at that time a different title: A Test ofthe Theory of Microscopic- or Nano-protoplasm as the Physical Basis of Life.Our article was promptly rejected without an explanation. Since we believe that this
paper is of major historic importance, its offhand rejection represents an event that manywould have believed impossible in the 21st century. To help them to understand the truesituation, we decided that it would be worthwhile to reproduce below both our introduc-tory letter to Nature’s Editor-in-Chief, Dr. Philip Campbell and Nature’s unsigned sum-mary response.We also decided to keep the manuscript in the format Nature requires. We made this
decision to add another reminder of the major efforts long past due to improve our sci-ence education worldwide — of not only the practicing scientists themselves but all theothers entrusted with the awesome responsibility of making critical decisions in science.Over time their decisions may have profound influence on the future of not only pure sci-ence itself but the future of humanity which needs trustworthy basic science more thanever (See also references 9 and 48.)
CONFIRMING NANO-PROTOPLASM 111
August 4, 2009
Dr. Philip Campbell,Editor-in-ChiefNature MagazineMacmillan Building4 Crinan StreetLondon N1 9XW
Dear Dr. Campbell:
I (and co-author) submit the enclosed article for consideration of publication in Nature. Imade this choice for three reasons.First, the results of the critical test conducted clearly and unequivocally show that
Thomas Huxley was correct in advocating that life has a physical basis — despite the factthat most bio-medical scientists and teachers have rejected the concept in recent times forwhat I believe to be wrong reasons. In addition, the publication of our article in Naturewould be a triumphant sequel to what the journal’s founder, Sir Joseph Lockyer printedin the very first issue of your journal, his article, Protoplasm at the Antipodes. Since SirLockyer was also the first Editor-in-Chief and apparently wrote the overall objective ofthe journal still being printed on current issues, I can cite his words in persuading you toaccept our article for publication in Nature.Second, the work described is highly unusual in combining unprecedented incisiveness
and utter simplicity. In one stroke, it has once again disproved the membrane pump the-ory (of the living cell) and establishes the alternative theory called the association-induction hypothesis — in a manner so plain that an average high school student wouldhave no problem understanding its essence (if not all the details) in one reading.Third, given the wide circulation your journal enjoys, the publication of our article in
Nature could be, from a historical point of view, the first step in giving all the young peo-ple of the world a uniting, shared purpose. That is, to seek the one and only truth by wayof the one and only scientific method and relying on the one and only honesty to makecertain that the theory thoroughly refuted by objective evidence be promptly abandonedby all involved. In its place, the alternative theory that has been confirmed by over-whelming evidence be promptly and universally adopted and taught — until new evidencepoints to a still better theory. Failing that, we should continue to develop this establishedtheory to serve as part of the established knowledge on which to build an ever better placefor all humanity and other living creatures that share our planet to live and prosper in.For your convenience, I am enclosing a copy of my fourth book, “Life at the Cell and
Below-Cell Level.” Skimming through the Preface of the book alone will give you anoverall perspective far beyond what I can write here. I may also mention that very recentlytwo Russian scientists at the Pavlov Institute of Physiology and the Leningrad Institute ofCytology have combined their resources in translating this book into Russian. The initialresponse has been very encouraging. Next I return to our submission and your standardprocedure for deciding which paper to publish and which to reject: the peer review system.
112 LING and OCHSENFELD
In my opinion, the conventional peer review system is fundamentally not a good thingbut perhaps tolerable for a science like astronomy, which has seen its revolutionary strug-gles centuries ago. For a science like cell physiology whose major progress still lies in thefuture, peer review is as tolerable as cyanide pills. However, if you are not allowed, or donot want to review our paper personally and if you have trouble finding truly qualifiedpeers — for cause, see p.8 of www.gilbertling.org, on the front page of which are titles of(downloadable) relevant recent publications — I enclose the names and addresses of threeworld-class scientists who are men of high integrity and qualified to review our article.Finally, I want to explain why I submit the article directly to you. It is too serious an eventto be trusted to anyone else I know. True, you are an astronomer and not a cell physiolo-gist. That is a distinct advantage I count upon. You have no peers to fear. The scientific is-sues involved are simple enough for any intelligent and fair-minded person to handle.After all, Sir Joseph Lockyer was also an astronomer. That did not prevent him from ju-diciously evaluating and supporting Thomas Huxley’ work on protoplasm.
Sincerely yours,Gilbert Ling, Ph.D.
CONFIRMING NANO-PROTOPLASM 113

Physiol. Chem. Phys. & Med. NMR (2008) 40: 115–118
A Preliminary Report on the Survival ofFully-hydrated Living (Cancer) Cells
to Liquid Helium Exposure
Gilbert N. Ling and Margaret M. Ochsenfeld
Damadian Foundation for Basic and Cancer Research, Fonar Corporation,110 Marcus Drive, Melville, NY 11747
Email: [email protected]
Abstract: Fully-hydrated Ehrlich carcinoma ascites cells under the protective action of DMSOfully survived exposure to near-absolute zero temperature provided by liquid helium.
KEY WORDS: association-induction hypothesis, AI hypothesis, Bradley isotherm, cell water,DMSO, fully-hydrated cells, idealized NP system, liquid helium temperature, NaCl exclusion, non-freezing water, polarized-oriented multilayer theory, PM theory, POM theory, 0°K.
THEYEAR 1965 saw the addition to the theory of the living cell called the association-induction hypothesis (Ling 1962; 1997; 2001), the polarized-oriented multilayer (POM,or PM) theory of cell water. The POM theory was introduced to explain the low level ofsodium ion (Na+) as chloride (and other solutes like sucrose) in cell water (Ling 1965.)To achieve that end, the theory contends that all or virtually all cell water in living cellsis polarized and oriented by the cell proteins. For many years afterwards, Bradley’s mul-tilayer adsorption isotherm has offered important support for the POM theory (Bradley1936.) Notwithstanding, this and other then-existing theories had limitations. Thus, theycould not provide key quantitative insights needed, including the depth of multilayers thatcan be so polarized (and oriented) by the polar surfaces (Ling 2003.)By taking a short cut, Ling derived a new theoretical foundation for his POM theory of
cell water and inanimate systems demonstrating long range dynamic structure. The the-ory began by defining and calling a checkerboard of positively- and negatively chargedsites of a rigorously defined geometry and dimension as an idealized NP system. The the-ory then shows that under idealized conditions — including 0°K temperature, freedomfrom any kind of disturbance etc. — the propagated polarization-orientation of bulk-phasewater molecules produced by such an idealized NP system could proceed ad infinitum.
In addition, the theory predicts that water so polarized and oriented would not freeze atany attainable low temperature. This prediction was confirmed retroactively some fiftyyears before when Canadian chemists, Giguère and Harvey discovered unintentionallythat thin films of water held between polished silver chloride lenses — which possesscrystal structure nearly ideal as defined in the new theory — would not freeze at liquidnitrogen temperature (–196°C or 77° K.) (Giguère and Harvey 1956)Following the introduction of the POM theory in 1965, unusual properties of water in
the living cell and model systems beyond the low solvency for NaCl were examined oneby one in the light of the new theory. (For a full list of these attributes, see Ling 1992, Table5.5 on pp. 208–209.) One of these additional attributes is the demonstrated ability of liv-ing cells to survive freezing and thawing in liquid nitrogen when a cryoprotective agentlike glycerol or dimethyl sulfoxide (DMSO) was added to the freezing medium (for review,see Smith 1961.) And in time, the predictions of the POM theory was confirmed not onlyfor these two physiological manifestations — Na(Cl) exclusion and survival in freezingtemperature — but for six other manifestations listed in the table quoted above as well.Ling and Zhang studied the freezing and thawing behaviors of two categories of model
systems referred to as the extrovert and introvert respectively (Ling and Zhang 1983.)Extrovert models include proteins that for structural reason, like gelatin, or in response todenaturants, like urea, exist in the fully-extended state and various linear oxygen carryingpolymers including polyethylene oxide, polyvinylpyrrolidone. Introvert models includemostly what are often (erroneously) called “native” proteins. In most of our studies witha Perkin Elmer differential scanning calorimeter, the low temperature was provided by amixture of dry ice and ethanol. In a smaller number of runs, we used liquid nitrogen. Thelowest temperature reached in our runs was around 123° K.From these model studies, Ling and Zhang confirmed most if not all of what was the-
oretically predicted. Thus, in solutions up to as high as 50% concentration, the six in-trorvert “native” proteins investigated demonstrated no detectable influence on either thefreezing temperature of the bulk phase water or the width of its freezing peak — in a plotof heat absorption or release against increasing (or decreasing) temperature. In contrast,all the extrovert models uniformly demonstrate strong influence on the freezing (andthawing) pattern of the bulk-phase water. Thus with increasing polymer concentration, thefreezing temperatures became steadily lower and the freezing peak became progressivelywider — so that at the highest polymer concentration, the freezing peak disappeared al-together. The vanishing freezing peak shows that a state of non-freezing had been broughtabout by the extrovert models.That extrovert models can lower the freezing temperature of the bulk phase water and
make it unfreezable is important. It demonstrates that closer juxtaposition of water-polarizing and orienting sites enhances the stability of the dynamic polarized-orientedwater. As such, it offers an explanation why glycerol, dimethyl sulfoxide (DMSO) andother cryoprotectants help to preserve living cells from fatal injury from freezing andthawing: Because these cryoprotectants as a rule form strong H-bonds with water mole-cules and by so doing further enhance the water-to-water interaction energy of the bulkphase water in the resting cell by the fully extended protein chains and make the cellwater unfreezable. (See also Ling, Niu and Ochsenfeld 1993, pp. 193–195; Ling 2006)That increasing the concentration of the extrovert models could cause non-freezing also
offers an explanation why only after severely lowering of the water content (to 8%) could
LING and OCHSENFELD116
the larvae of the West African beetle, Polypedilum vanderplanki survive exposure to liquidhelium (Hinton 1960.)The purpose of this preliminary study is to find out if living cells in their normal fully
hydrated state could also survive exposure to liquid helium when the cells are under theprotection of the cyoprotectant, DMSO (Lovelock and Bishop 1959.) If this proves suc-cessful, it would go one step further confirming the theory of non-freezability at any at-tainable low temperature when the bulk phase water is polarized and oriented like that inthe idealized NP system.
Materials and Methods
Ehrlich carcinoma ascites cells were carried in ICR mice and routinely harvested 14 daysafter abdominal injection. The ascites fluid was mixed with Sigma RPMI 1640 mediumbefore low speed (900 rpm) centrifugation and resuspension of the cells in similarmedium and centrifugation a second time. 0.5 to 0.7 gram of the cell pellet was then sus-pended in 5 ml of a freezing medium (76% RPMI medium, 16% newborn calf serum and8% DMSO.) The suspension was then further diluted with similar freezing medium bymixing 0.85 ml of the suspension in 20 ml of the freezing medium and 2 ml aliquots ofthe suspension placed in 2 ml sterile cryo-tubes. After 2 hours of gentle shaking in a re-frigerator kept at about 9° C, the cryotubes containing the ascites cells were suspendedover-night inside a standard 10 liter liquid nitrogen tank at about 13 inches below the topof the tank and about 6–7 inches from the surface of the liquid nitrogen beneath. The cellsin the cyrotubes were then lowered into the liquid nitrogen.To expose the ascites cells to near absolute zero temperature, we allowed liquid helium
to flow over the cryotubes — containing the liquid-nitrogen frozen ascites cells — in aDewar jar for a total duration of 5–10 minutes.
Results and Discussion
The viability of the ascites cells were examined after staining with erythrosin B. Samplecells taken before freezing in liquid nitoroten was 97.7% ; it fell to 81% after freezing inliquid nitrogen. Following the exposure to liquid helium, the viability stayed essentiallyunchanged at 86% survival.Before exposing to the liquid helium, the ascites cells had been in liquid nitrogen four
days at the temperature of –196° C or 77.2° K. Liquid heliium could provide a tempera-ture of 1.9° K as it was maintained at the Large Hadron Colllider at CERN in Switzer-land. The usually given value is 3 to 4° K. The temperature our samples sank to wasunknown but it is certainly much lower than 77° K. The fact that the viability remainedentirely undiminished by further lowering of temperature gives us the assurance that thetheoretical prediction that living cells in the presence of cryoprotectant DMSO could in-deed survive temperature close to the temperature of liquid helium and hence absolutezero.
We thank Dr. Raymond Damadian and the Fonar Corporation for their continued support.
NON-FREEZING CELLS AT 0°K 117
References
Bradley, R.S. (1936) Polymolecular Adsorbed Films. Part II. The General Theory of the Condensa-tion of vapors on finely divided solids. J. Chem. Soc. 1936: 1799–1804.
Giguère, P.A. and Harvey, K.B. (1956) On the infrared absorption of water and heavy water in con-densed states. Canad. J. Chem. 34: 798–808.
Henniker, J.C. (1949) The depth of the surface zone of a liquid. Reviews of Modern Physics 21:322–341.
Hinton, H.E. (1960) A fly larva that tolerates dehydration and temperture of –270 C to +102 C. Na-ture 188: 333–337.
Ling, G.N. (1962) A Physical Theory of the Living State: the Association-Induction Hypothesis,Blaisdell Publ. Co., Waltham, MA.
Ling, G.N. (1965) The physical state of water in living cells and in model systems. Ann. N.Y. Acad.Sci. 125: 401–417.
Ling, G.N. (1992) A Revolution in the Physiology of the Living Cell, R. Krieger Publ.Co., Malabar.FL
Ling, G.M\N. (1997) http://www.gilbertling.orgLing, G.N. (2001) Life at the Cell and Below-Cell Level: the Hidden History of a Fundamental Rev-
olution in Biology, Pacific Press, NY.Ling, G.N. (2003) A new theoretical foundation for the polarized-oriented multilayer theory of cell
water and for inanimate systems demonstrating long-range dynamic structuring of water mol-ecules. Physiol. Chem. Phys. & Med. NMR 35: 93–130. Also available at: http://www.physiologicalchemistryandphysics.com/pdf/PCP35-91_ling.pdf Or go to www.gilbertling.orgchoose volume and article from drop-down list and click.
Ling, G.N. (2006) Chapter 1. A convergence of experimental and theoretical breakthrough affirmsthe PM theory of dynamically structured cell water at the theory’s 40th birthday in: Water andthe Cell (Pollack, G.H., Cameron, I.L. and Wheatley, D.N., eds.) Springer Verlag, Berlin, NewYork. Can also be reached by going to www.gilbertling.org and click the title on the front pageof the website.
Ling, G.N. and Zhang, Z. (1983) Studies on the physical state of water in living cells and modelsystems. IV. freezing and thawing point depression of water by gelatin, oxygen-containingpolymers and urea-denatured proteins. Physiol. Chem. Phys. & Med. NMR 15: 391–406. Alsoavailable at: h t tp : / /www.phys io log ica lchemis t ryandphys ics .com/pdf /PCP15-3911_ling_zhang.pdf Or go to www.gilbertling.org choose volume and article from drop-down list and click
Ling, G.N., Niu, Z. and Ochsenfeld, M. (1993) Predictions of polarized multilayer theory of solutedistribution confirmed from a study of the equilibrium distribution in frog muscle of twenty-one nonelectrolytes including five cryoprotectants. Physiol. Chem. Phys. & Med. NMR 25:177–208. Also available at: http://www.physiologicalchemistryandphysics.com/pdf/PCP25-177_ling_niu_cohsenfeld.pdf Or go to www.gilbertling.org choose volume and article fromdrop-down list and click.
Lovelock, J.E. and Bishop, M.W.H. (1959) Prevention of freezing damage of living cells by di-methyl sulfoxide. Nature 183: 1394–1395.
Smith, A. U. (1961) Biological Effects of Freezing and Supercooling, Williams and Wilkins,Baltimore.
Received August 5, 2009;accepted September 10, 2009
LING and OCHSENFELD118
Physiological Chemistry and Physics
and Medical NMR
INDEX
Volume 40, 2008
Additivity principle, 89α-helical potential, 89AI cascade mechanism, 89AKBER, S.F., 1Association-induction hypothesis, 89, 115ATPas cardinal adsorbent, 89as EWC, 89
ATP-ase, 89
BAJPAI, U., 67BARTZATT, R.L., 43, 55Bradley adsorption isotherm, 115
Cancer cells, exposure to liquid helium, 115Carboxyl groups (β and γ), 89Cell waterSee Water, cell
CIRILLO, J.D., 55CIRILLO, S.L.G., 55Cl- as an EDC, 89Cl- binding, 89c-analog scheme, 89c-scheme, 89c-value, c´-value, 89c-value analog, c´-value analog, 89
DMSO (dimethyl sulfoxide)as a cryoprotectant, 115DNA intercalationpirurbicin in, 43
EDC (electron-donating cardinal adsorbent)Cl- as an, 55
EWC (electron-withdrawing cardinaladsorbent)
ATP as an, 89H+ as an, 89
GUPTA, V., 67
Hemoglobin, 89Heptocellular carcinomapirarubicin and analogs effect on, 43
High resolution magic-angle spinning NMRSee HR-MAS NMR
HR-MAS NMRin identification of metabolites in traumatissue, 67
Hydrazide compoundscomparison to isoniazid as TB growthinhibitors, 55
α-Hydroxybutarateidentification by HR-MAS NMR, 67
α-Hydroxyisovalarateidentification by HR-MAS NMR, 67
Imidazole groups, 89Intercalators, pirarubicin as an, 43Ioniazid as TB growth inhibitor, 55
LING, G.N., 89, 115Liquid helium exposure, 115
Metabolites in trauma tissueidentification by HR-MAS NMR, 67
MISRA, D., 67Mycobacterium tuberculosisgrowth inhibition by hydrazides, 67
Na+ in human red blood cells, 89Na(Cl) exclusion in cell water, 115Nano-protoplasmdefinition of, 89ultra-simple model of, 89
Nano-protoplasm unit, formula of, 89Non-freezing cell water, 115
OCHSENFELD, M.M., 89, 115
Paramagnetic ionsand relaxation times, 1
Pathological tissues, T1, T2 of, 1Peptide imino-carboxyl groups, 89Pirarubicinanalogs of, 43as an intercalator of DNA, 43in reduction of tumor activity, 43variation of substituants on, 43
PM theory of cell water, 115Polarized-oriented multilayer theory (POM) of
cell water, 89, 115Protoplasm, 89
Red blood cells, human, 89ROY, R., 67
Salt linkage, 89
Size rule, 89SANKAR, A.A., 67Spin-lattice relaxation timeSee T1
Spin-spin relaxation timeSee T2
T1 of pathological tissues, 1T2 of pathological tissues, 1TB growth inhibition by hydrazides, 55Trauma tissue, metabolite identification in,by HR-MAS NMR, 67
Water, cell, 89, 115non-freezing, 115polarized-oriented multilayer theory of, 115Na(Cl) exclusion in, 115
Water proton relaxation timesof pathological tissues, 1
120 INDEX