seismic source dynamics at vesuvius volcano, italy
TRANSCRIPT
Seismic source dynamics at Vesuvius volcano, Italy
Edoardo Del Pezzo �, Francesca Bianco, Gilberto SaccorottiI.N.G.V. Osservatorio Vesuviano, Via Diocleziano 328, 80124 Naples, Italy
Received 18 January 2002; accepted 20 October 2002
Abstract
On October 9, 1999 an earthquake of ML = 3.6 occurred about 3 km beneath the central cone of Mt. Vesuvius,near Naples, Italy. The event had the highest magnitude recorded for at least 25 years, and possibly since the lasteruption of this volcano (1944), and was not accompanied by other geophysical or geochemical changes. The presentpaper essentially deals with the seismological data collected at Mt. Vesuvius for 29 years before the October 9earthquake till the end of 2001, and describes the time pattern distribution of seismic slip release and the b-parameterof the Gutenberg^Richter distribution. The self-similarity of the source process is investigated through the scaling lawof the seismic spectrum. Results indicate a two-fold pattern of stress release, with high values (up to 100 bar) forearthquakes occurring close to the top of the carbonate basement that underlies the volcano at 2^3 km of depth, andlow values (down to 0.1 bar) for the shallow events occurring within the volcanic edifice. The scaling law of theseismic spectrum is non-self-similar, indicating that the source dimensions do not scale with the seismic moment. Forthis reason the low-magnitude events substantially contribute to the overall cumulative seismic slip release. The b-parameter of the Gutenberg^Richter distribution shows a variation around 1980, and a substantial constancy in theother time periods. The presence of extended aquifers, with their tops at about 1 km beneath the crater, favors thehypothesis of the triggering of the shallowest events by water-level changes. This hypothesis is in agreement with thelow values of the stress drop measured for the shallowest seismic events. The existence of a carbonate basement withits top at about 2.5 km beneath the crater and the higher stress drops for the deeper events make reasonable thehypothesis that the pre-fractured carbonate basement may be the site of tectonic stress release.; 2003 Elsevier B.V. All rights reserved.
Keywords: Vesuvius; seismicity; seismic source
1. Introduction
On October 9, 1999 at 7.41 a.m. an ML 3.6earthquake occurred about 3 km beneath Mt. Ve-suvius crater. Due to the shallowness of thesource depth and to the high population density
in the area (Vesuvius is practically inside the ur-ban area of Naples city) the shock was felt bymore than two million people. The shock wasthe ¢rst of a small sequence of low-magnitudeevents, some of them distinctly felt by people liv-ing close to the Vesuvius area. The duration mag-nitude of the ¢rst shock was the highest for al-most 25 years (the maximum duration magnitudeof the local shocks before October 9 was 3.4). Thelevel of volcanic hazard for this area is one of the
0377-0273 / 03 / $ ^ see front matter ; 2003 Elsevier B.V. All rights reserved.doi:10.1016/S0377-0273(03)00389-5
* Corresponding author. Fax: +39-081-6108351.E-mail address: [email protected] (E. Del Pezzo).
VOLGEO 3017 6-4-04
Journal of Volcanology and Geothermal Research 133 (2004) 23^39
R
Available online at www.sciencedirect.com
www.elsevier.com/locate/jvolgeores
highest in the world due to closeness of the vol-cano to a densely inhabited zone. Soon after theM=3.6 event, Vesuvius Observatory, the Institu-tion devoted to the geophysical, geochemical andvolcanological monitoring of Mt. Vesuvius, im-proved the seismic network sensitivity, addingeight portable stations to the permanent network,and set up a small short-period seismic antennaon the volcano’s southwestern £ank, approxi-mately 1.5 km away from the crater. Further con-trols were almost immediately carried out, reveal-ing no changes of ground deformation, gravityand geochemical composition of the fumaroles.
On the basis of the scienti¢c reports from theVesuvius Observatory the permanent Committeefor Hazards ‘Comitato Grandi Rischi’ of the Ital-ian Government decided not to increase the alertlevel.
The time pattern of seismic activity was exten-sively studied after the occurrence of the October9, 1999 earthquake. A Scienti¢c Commission wasformally nominated by the Italian Magistracy toinquire if the decision to not increase the alertlevel, taken by the Civil Protection, was legiti-mate. This Commission worked with the data col-lected by the Vesuvius Observatory. Results (for-mally not yet published at present, but in practicealready di¡used among the specialized research-ers) show that the Gutenberg^Richter b-parame-ter decreases, starting from 1982, from a b-valueof around 2 to a value closer to 1 (Zollo et al.,2002). This negative trend is interpreted by theabove-cited authors as due to an increase in theseismic energy release, generated by a change inthe pore pressure of the £uids permeating theaquifers, driven by the progressive cooling of thesystem. Nostro et al. (1998), on the other hand,show that Mt. Vesuvius activity may be dynam-ically linked to the stress release from the South-ern Apennines’ great earthquakes. Interestingly,the highest b-parameter occurs in coincidencewith the occurrence of the strongest earthquakesof the last 100 years in the Southern Apennines(November 23, 1980).
The October 9, 1999 seismic event renewed ahard debate on the real possibility of forecastingfuture eruptions on the basis of geophysical ob-servations. The present paper tries to contribute
to this debate by adding new observations andinterpretations. We describe the main seismologi-cal aspects of the October 9, 1999 earthquake, inthe framework of the seismic activity of Mt. Ve-suvius since 1972, and add new information onthe depth distribution of the stress drop and seis-mic moment. Our interpretation enlightens therole of pore-£uid pressure and of the aquifers inthe generation of the shallow seismicity, whereastectonic stress release seems to be the most favor-able hypothesis for the deepest (and strongest)earthquakes.
We also examine the earthquake catalog of Mt.Vesuvius since 1972, showing the possibility of aninterpretation of the b-parameter changes withtime in agreement with the other seismologicalobservations and alternative to that of Zollo etal. (2002).
2. Volcanological setting of the area
Vesuvius is a strato-volcano located in theCampania plain (Southern Italy) (Fig. 1) at theintersection of two main faults oriented NNW^SSE and NNE^SSW (Hyppolite et al., 1994). Itis formed by an ancient caldera (Mt. Somma) andby a younger cone (Mt. Vesuvius). Volcanic activ-ity dates back to 300^500 ka (Santacroce, 1983)and is characterized both by e¡usive and explo-sive regimes. Scandone et al. (1993) distinguishthree regimes of volcanic activity: large-scale ex-plosive Plinian eruptions, intermediate sub-Plinianeruptions, and small-scale e¡usive eruptions. Thelast eruption was e¡usive, in March 1944. It couldhave started a new ‘obstructed conduit’ phase andhence a quiescent stage.
Zollo et al. (1996) and more recently Auger etal. (2001) suggest the presence of a melting zoneat a depth of about 8 km. Small and shallowmagma chambers, suggested by some geochemicalconsiderations (Rosi et al., 1987), are undetectedby travel-time seismic tomography carried out re-cently (see Auger et al., 2001 and references there-in) in the area. On the contrary, seismic tomog-raphy shows a high P-wave velocity zone, with arough cylindrical symmetry with respect to thecrater axis, extending from the surface down to
VOLGEO 3017 6-4-04
E. Del Pezzo et al. / Journal of Volcanology and Geothermal Research 133 (2004) 23^3924
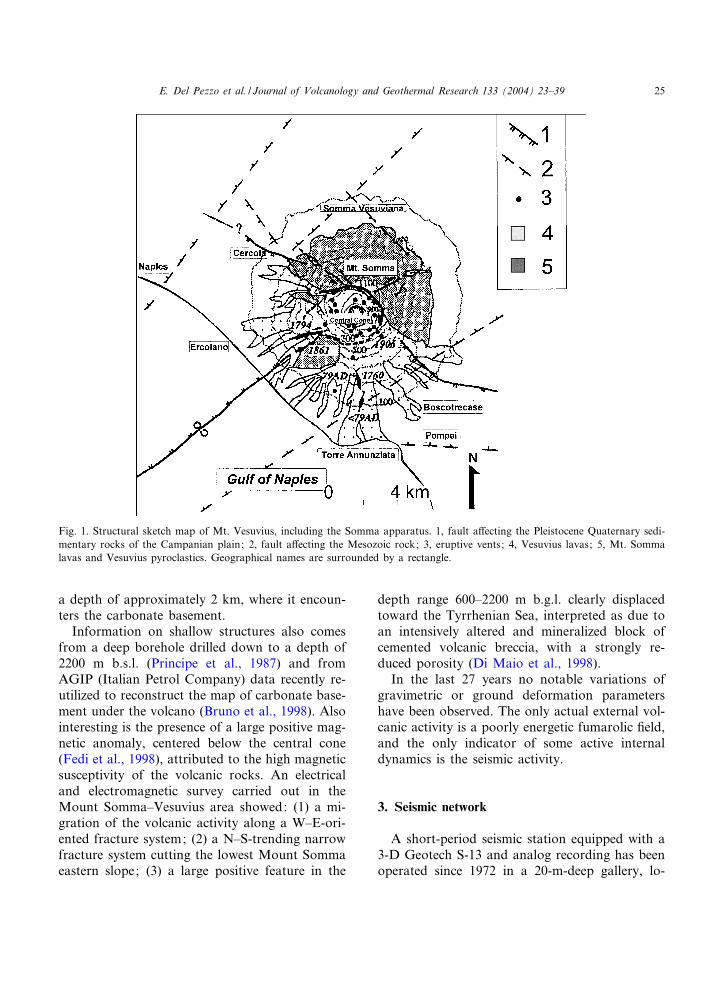
a depth of approximately 2 km, where it encoun-ters the carbonate basement.
Information on shallow structures also comesfrom a deep borehole drilled down to a depth of2200 m b.s.l. (Principe et al., 1987) and fromAGIP (Italian Petrol Company) data recently re-utilized to reconstruct the map of carbonate base-ment under the volcano (Bruno et al., 1998). Alsointeresting is the presence of a large positive mag-netic anomaly, centered below the central cone(Fedi et al., 1998), attributed to the high magneticsusceptivity of the volcanic rocks. An electricaland electromagnetic survey carried out in theMount Somma^Vesuvius area showed: (1) a mi-gration of the volcanic activity along a W^E-ori-ented fracture system; (2) a N^S-trending narrowfracture system cutting the lowest Mount Sommaeastern slope; (3) a large positive feature in the
depth range 600^2200 m b.g.l. clearly displacedtoward the Tyrrhenian Sea, interpreted as due toan intensively altered and mineralized block ofcemented volcanic breccia, with a strongly re-duced porosity (Di Maio et al., 1998).
In the last 27 years no notable variations ofgravimetric or ground deformation parametershave been observed. The only actual external vol-canic activity is a poorly energetic fumarolic ¢eld,and the only indicator of some active internaldynamics is the seismic activity.
3. Seismic network
A short-period seismic station equipped with a3-D Geotech S-13 and analog recording has beenoperated since 1972 in a 20-m-deep gallery, lo-
Fig. 1. Structural sketch map of Mt. Vesuvius, including the Somma apparatus. 1, fault a¡ecting the Pleistocene Quaternary sedi-mentary rocks of the Campanian plain; 2, fault a¡ecting the Mesozoic rock; 3, eruptive vents; 4, Vesuvius lavas; 5, Mt. Sommalavas and Vesuvius pyroclastics. Geographical names are surrounded by a rectangle.
VOLGEO 3017 6-4-04
E. Del Pezzo et al. / Journal of Volcanology and Geothermal Research 133 (2004) 23^39 25
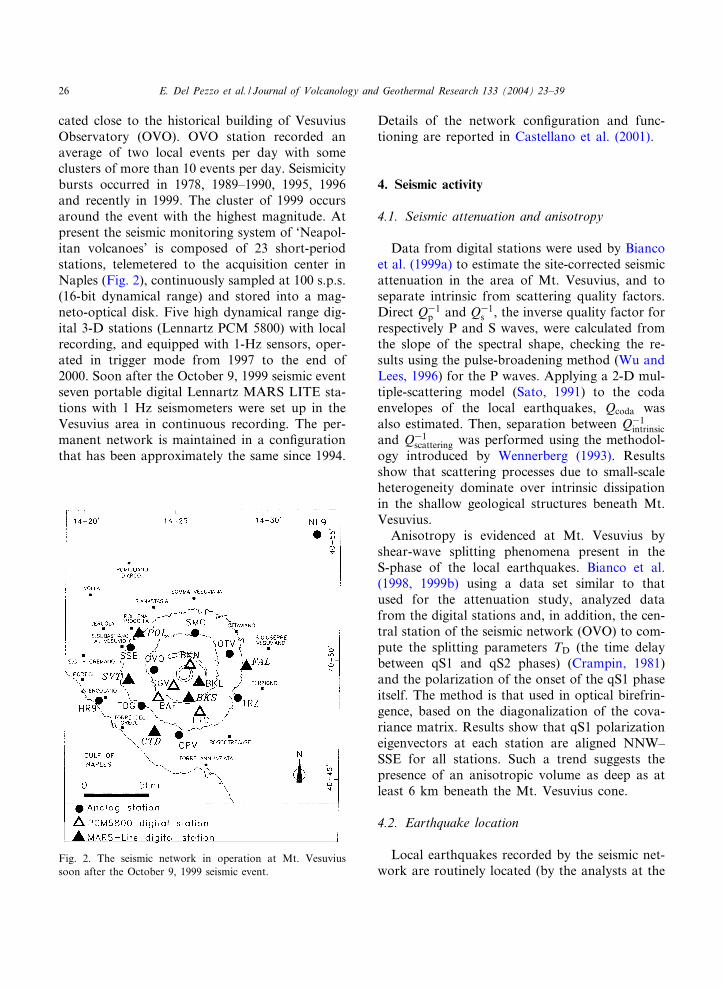
cated close to the historical building of VesuviusObservatory (OVO). OVO station recorded anaverage of two local events per day with someclusters of more than 10 events per day. Seismicitybursts occurred in 1978, 1989^1990, 1995, 1996and recently in 1999. The cluster of 1999 occursaround the event with the highest magnitude. Atpresent the seismic monitoring system of ‘Neapol-itan volcanoes’ is composed of 23 short-periodstations, telemetered to the acquisition center inNaples (Fig. 2), continuously sampled at 100 s.p.s.(16-bit dynamical range) and stored into a mag-neto-optical disk. Five high dynamical range dig-ital 3-D stations (Lennartz PCM 5800) with localrecording, and equipped with 1-Hz sensors, oper-ated in trigger mode from 1997 to the end of2000. Soon after the October 9, 1999 seismic eventseven portable digital Lennartz MARS LITE sta-tions with 1 Hz seismometers were set up in theVesuvius area in continuous recording. The per-manent network is maintained in a con¢gurationthat has been approximately the same since 1994.
Details of the network con¢guration and func-tioning are reported in Castellano et al. (2001).
4. Seismic activity
4.1. Seismic attenuation and anisotropy
Data from digital stations were used by Biancoet al. (1999a) to estimate the site-corrected seismicattenuation in the area of Mt. Vesuvius, and toseparate intrinsic from scattering quality factors.Direct Q31
p and Q31s , the inverse quality factor for
respectively P and S waves, were calculated fromthe slope of the spectral shape, checking the re-sults using the pulse-broadening method (Wu andLees, 1996) for the P waves. Applying a 2-D mul-tiple-scattering model (Sato, 1991) to the codaenvelopes of the local earthquakes, Qcoda wasalso estimated. Then, separation between Q31
intrinsicand Q31
scattering was performed using the methodol-ogy introduced by Wennerberg (1993). Resultsshow that scattering processes due to small-scaleheterogeneity dominate over intrinsic dissipationin the shallow geological structures beneath Mt.Vesuvius.
Anisotropy is evidenced at Mt. Vesuvius byshear-wave splitting phenomena present in theS-phase of the local earthquakes. Bianco et al.(1998, 1999b) using a data set similar to thatused for the attenuation study, analyzed datafrom the digital stations and, in addition, the cen-tral station of the seismic network (OVO) to com-pute the splitting parameters TD (the time delaybetween qS1 and qS2 phases) (Crampin, 1981)and the polarization of the onset of the qS1 phaseitself. The method is that used in optical birefrin-gence, based on the diagonalization of the cova-riance matrix. Results show that qS1 polarizationeigenvectors at each station are aligned NNW^SSE for all stations. Such a trend suggests thepresence of an anisotropic volume as deep as atleast 6 km beneath the Mt. Vesuvius cone.
4.2. Earthquake location
Local earthquakes recorded by the seismic net-work are routinely located (by the analysts at the
Fig. 2. The seismic network in operation at Mt. Vesuviussoon after the October 9, 1999 seismic event.
VOLGEO 3017 6-4-04
E. Del Pezzo et al. / Journal of Volcanology and Geothermal Research 133 (2004) 23^3926
V.O. laboratories in almost real-time) using thewidely utilized Hypoellipse program. Recently, aplane-layered model obtained by simplifying theseismic tomography results, as discussed in Lo-max et al. (2001), is in routine use in the SeismicLaboratory of Vesuvius Observatory. Before 2001a di¡erent model, obtained by the results of Vi-lardo et al. (1996) was utilized. Lomax et al.(2001) show that, using their simpli¢ed velocitymodel, locations are close to but shallower thanthose obtained using a more complete approachbased on 3-D ray-tracing and probabilistic opti-mization.
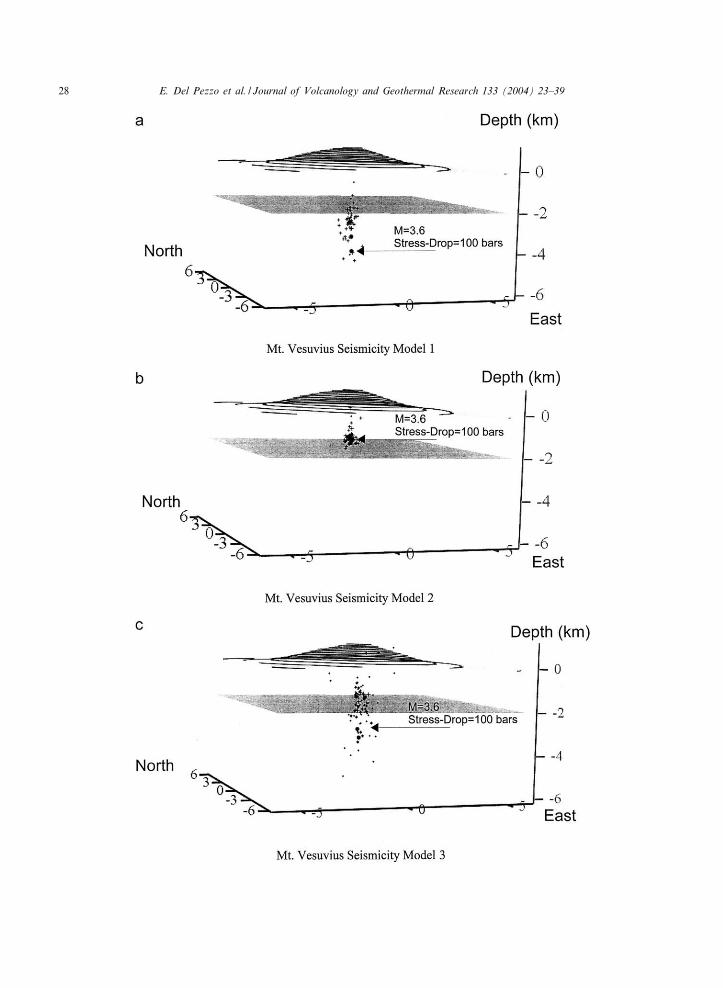
In the present paper we relocated the eventsrecorded by the seismic network, adding all theportable station data available, using three di¡er-ent models: the ¢rst (Model 1) is the 2-D £at-layered model routinely used till the end of 2000by the analysts at V.O. This model is the 2-Dapproximation of the 3-D model used by Vilardoet al. (1996). The second (Model 2) is a 2-D ap-proximation of the tomography-deduced 3-Dmodel (Lomax et al., 2001). The third (Model 3)is the tomography-deduced 3-D model. We usedthe HYPO71 routine with both Model 1 andModel 2, and NonLinLoc program, available athttp://orfeus.knmi.nl (Lomax et al., 2001) withModel 3. NonLinLoc adopts a probabilistic opti-mization approach and ¢nite-di¡erence ray-trac-ing in 3-D heterogeneous velocity structures. Thethree plots of the highest-quality solutions (Aquality of HYPO, and data with root meansquare (RMS)6 0.05 for the probabilistic ap-proach) are reported in Fig. 3a^c, where it is ob-servable that the depths obtained using Model 2are the shallowest. The plots also report a £atsurface at a depth of 2 km, representing the topof the carbonate basement, as deduced by Lomaxet al. (2001). Locations obtained using Model 1reveal an hypocentral zone elongated down to adepth of 6 km below sea level, with an apparentlyminor dispersion of the epicentral coordinates.Considering the 3-D tomography-deduced modelas the best approximation of the reality (Model3), we observe that Model 2 causes an underesti-mation of the real depths, whereas Model 1slightly overestimates the hypocentral depths.The underestimate produced by Model 2 is possi-
bly due to the artifact caused by extending the2 km interface below the crater zone. It is infact highly probable that the small scale heteroge-neity present beneath the central cone down to adepth of at least 3 km, as revealed by the study onseismic attenuation and anisotropy discussed inthe above section, may cause e¡ects of multipath-ing for the frequencies which are sensitive to theheterogeneity scale. This may produce a decreaseof the e¡ective seismic velocity for the frequenciescharacteristic of the seismic signals. We feel thatfor these reasons the hypocentral depths obtainedwith Model 3 may also be slightly underestimated.On the other hand, the validation of the 3-Dmodel carried out in the paper by Lomax et al.(2001) is made using data from shots recorded atthe seismic stations located on a pro¢le spanning25 km, with an interspacing of 500 m, and thismay cause small scale heterogeneities presentunderneath the central cone to be invisible. Insummary, we should indicate that Model 1 isthe best model to locate seismicity beneath Mt.Vesuvius. A ¢nal answer should be conclusivelyreached with a high-precision passive tomographystudy of the shallowest geological structures be-neath the crater. This study will be described in afuture paper.
4.3. Magnitude, fault plane solutions, earthquakeclassi¢cation and nature of the seismic events
The method currently used at V.O. to measurelocal magnitude is to use a duration-based scale.This was calibrated in the past using as referencea Wood^Anderson equivalent station located inRome that was able to record earthquakes witha location close to Mt. Vesuvius. The OVO sta-tion, the central station of the network, was usedas the reference because it was the only one work-ing at the time when the calibration of the scalewas carried out. Obviously, this scale is a pureextrapolation at low magnitude, as the city ofRome is 200 km distant from Naples. The dura-tion magnitude for the OVO station is :
MD ¼ 2:8logðtÞ32:4 ð1Þ
where t is the duration in seconds.To improve the quality of the local-magnitude
VOLGEO 3017 6-4-04
E. Del Pezzo et al. / Journal of Volcanology and Geothermal Research 133 (2004) 23^39 27
VOLGEO 3017 6-4-04
E. Del Pezzo et al. / Journal of Volcanology and Geothermal Research 133 (2004) 23^3928
estimate at Mt. Vesuvius, Del Pezzo and Petrosi-no (2001) calculated the Wood^Anderson equiv-alent magnitude scale for a set of seismic eventswell recorded at the digital seismic station of thenetwork. Del Pezzo and Petrosino (2001) used theseismic attenuation parameters measured for the
Mt. Vesuvius area by Bianco et al. (1999a)(QL =60, QK =30, where L and K stand respec-tively for shear and compressional waves), to ob-tain synthetically the empirical amplitude^dis-tance attenuation curve. Then, transforming theseismograms recorded at the digital stations into
Fig. 3. 3-D spatial distribution of high-quality hypocentral solutions. Crosses indicate events with magnitude 9 3, and dots showevents with magnitude s 3. (a) Solutions obtained using Model 1. (b) Model 2. (c) Model 3. M=3.6 events are indicated withan arrow.
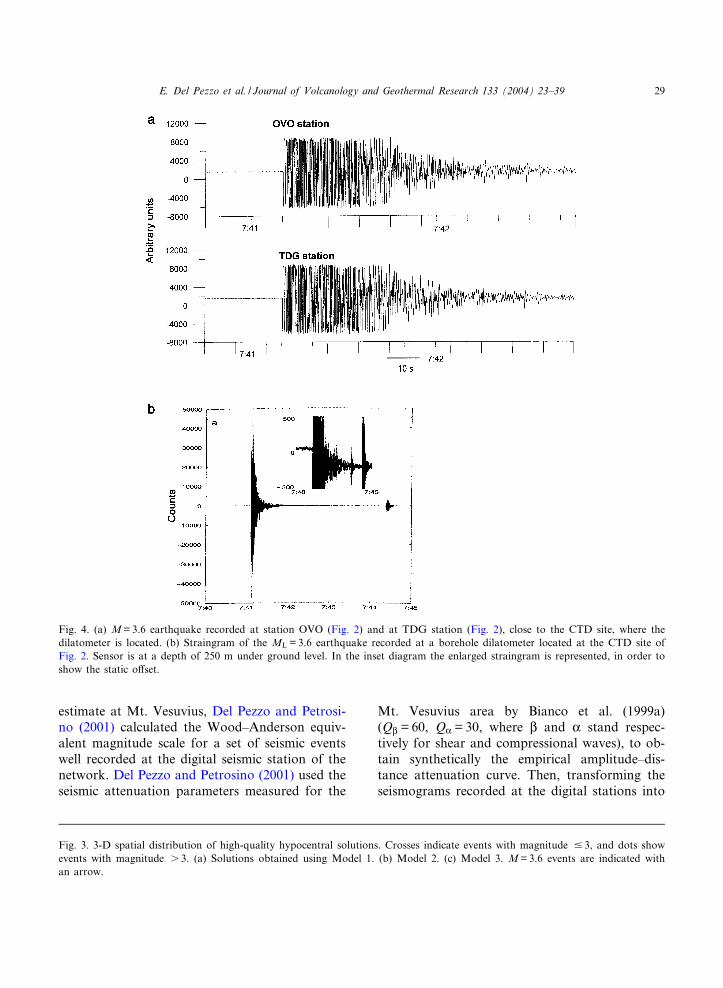
Fig. 4. (a) M=3.6 earthquake recorded at station OVO (Fig. 2) and at TDG station (Fig. 2), close to the CTD site, where thedilatometer is located. (b) Straingram of the ML = 3.6 earthquake recorded at a borehole dilatometer located at the CTD site ofFig. 2. Sensor is at a depth of 250 m under ground level. In the inset diagram the enlarged straingram is represented, in order toshow the static o¡set.
VOLGEO 3017 6-4-04
E. Del Pezzo et al. / Journal of Volcanology and Geothermal Research 133 (2004) 23^39 29
Wood^Anderson equivalent seismograms, theseauthors calculated the Wood^Anderson magni-tude for a set of local events, showing that theold scale overestimates the true values (V+0.2for Mx2.5). Notwithstanding this evidence, theold scale is currently maintained for the sake ofuniformity with the data obtained in the past.Using the scale of Eq. 1, the seismic event ofOctober 9, 1999 has a magnitude of 3.6. In Fig.4 we show the records of this event at the analogstations of the seismic network reported in Fig. 2,together with the data recorded by a boreholedilatometer (Sacks Evertston type) located onthe southern £ank of Mt. Vesuvius at about 4.5km from the crater (close to the CPV station)redrawn by Scarpa et al. (2000).
The spectral features of the seismic events atMt. Vesuvius are characteristic of VT-type events(volcano-tectonic). These sources, as is wellknown (Chouet, 1996), are the brittle responseto the various kinds of stresses acting on the vol-cano edi¢ce. A careful examination of the digi-tally recorded data allows us to exclude the pres-ence of the so-called ‘LP’ (long-period) events.These are supposed to be associated with shallowhydrothermal or volcanic activity and are consid-ered as the ‘Green’s Functions’ of the volcanictremor (Chouet, 1996), in the sense that tremorcan be thought of as the random superposition ofmany interfering LP events. Any attempt to esti-mate the moment tensor components for smallevents reveals the hard-to-solve problem of thelow signal-to-noise ratio present in the seismo-grams. The high level of noise is generated bythe high human activity present in the Mt. Vesu-vius area, practically enclosed in the huge urbanarea of the city of Naples. Moreover, the highamount of heterogeneity in the ¢rst few km ofthe Earth’s crust beneath Mt. Vesuvius producesincoherent signals up to distances of a few metersfor the peak frequency of the velocity spectrum(around 10^12 Hz), as demonstrated by an arraystudy carried out in the period 1997^98 by DelPezzo et al. (1999). This e¡ect makes the pulsesignal incoming from the source severely dis-torted, leading to the practical di⁄culty of ob-taining good estimates of the moment tensor com-ponents, and hence of checking the presence of
focal mechanisms di¡erent from the double cou-ple.
The absence of sustained volcanic tremor ofmagmatic origin at Mt. Vesuvius has been exper-imentally checked by Saccorotti et al. (2001), whoinvestigated the properties of the seismic noisewave ¢eld at Mt. Vesuvius using the same densearray of seismometers cited above. This evidenceagrees with the observation of the lack of LPevents in the seismic records of Mt. Vesuvius,and indirectly reinforces the hypothesis of shearfailure as the origin of the seismicity at Mt. Ve-suvius.
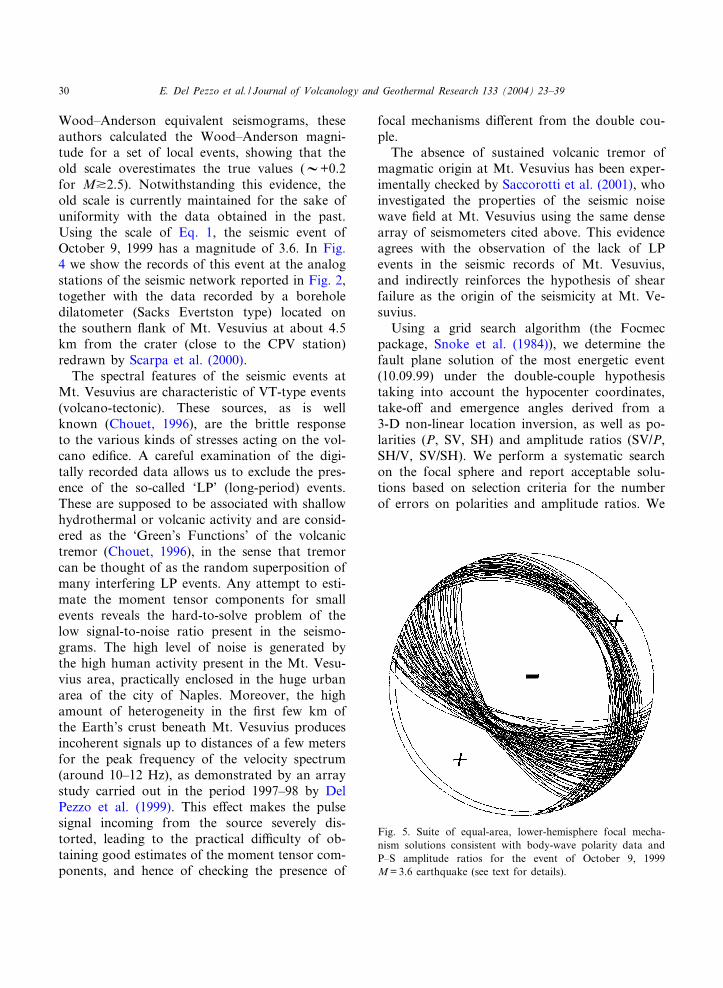
Using a grid search algorithm (the Focmecpackage, Snoke et al. (1984)), we determine thefault plane solution of the most energetic event(10.09.99) under the double-couple hypothesistaking into account the hypocenter coordinates,take-o¡ and emergence angles derived from a3-D non-linear location inversion, as well as po-larities (P, SV, SH) and amplitude ratios (SV/P,SH/V, SV/SH). We perform a systematic searchon the focal sphere and report acceptable solu-tions based on selection criteria for the numberof errors on polarities and amplitude ratios. We
Fig. 5. Suite of equal-area, lower-hemisphere focal mecha-nism solutions consistent with body-wave polarity data andP^S amplitude ratios for the event of October 9, 1999M=3.6 earthquake (see text for details).
VOLGEO 3017 6-4-04
E. Del Pezzo et al. / Journal of Volcanology and Geothermal Research 133 (2004) 23^3930
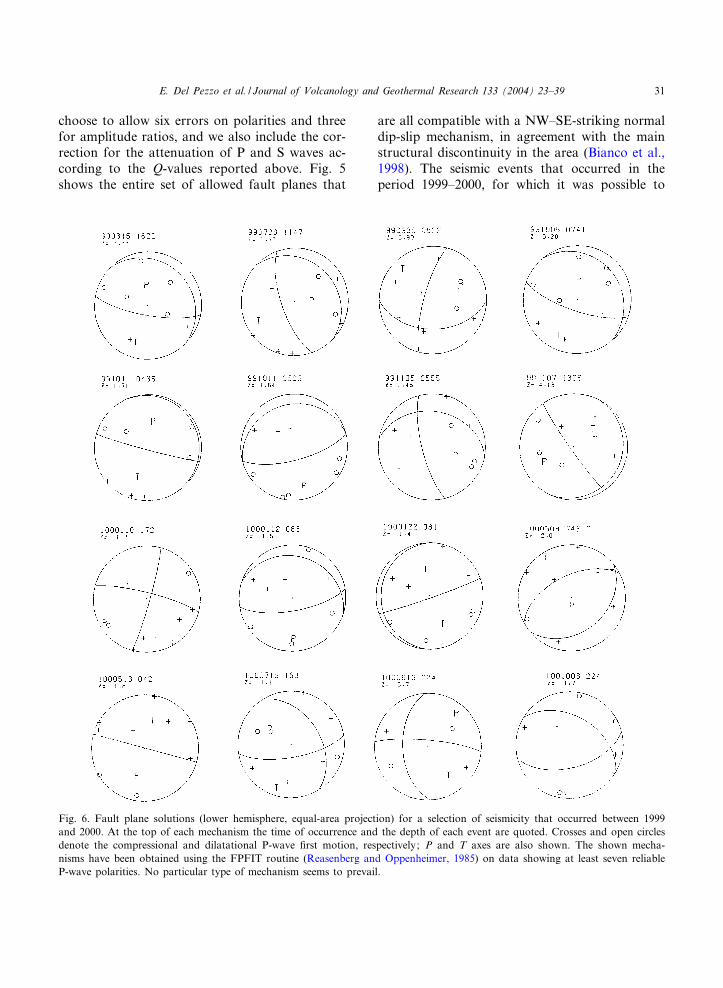
choose to allow six errors on polarities and threefor amplitude ratios, and we also include the cor-rection for the attenuation of P and S waves ac-cording to the Q-values reported above. Fig. 5shows the entire set of allowed fault planes that
are all compatible with a NW^SE-striking normaldip-slip mechanism, in agreement with the mainstructural discontinuity in the area (Bianco et al.,1998). The seismic events that occurred in theperiod 1999^2000, for which it was possible to
Fig. 6. Fault plane solutions (lower hemisphere, equal-area projection) for a selection of seismicity that occurred between 1999and 2000. At the top of each mechanism the time of occurrence and the depth of each event are quoted. Crosses and open circlesdenote the compressional and dilatational P-wave ¢rst motion, respectively; P and T axes are also shown. The shown mecha-nisms have been obtained using the FPFIT routine (Reasenberg and Oppenheimer, 1985) on data showing at least seven reliableP-wave polarities. No particular type of mechanism seems to prevail.
VOLGEO 3017 6-4-04
E. Del Pezzo et al. / Journal of Volcanology and Geothermal Research 133 (2004) 23^39 31
estimate reliably the fault plane solutions bymeans of the classical FPFIT routine (Reasenbergand Oppenheimer, 1985), show a highly non-reg-ular fault plane pattern (Fig. 6).
4.4. Spectral parameters, scaling law of the seismicspectrum and slip rate
Seismic moment, source radius and static stressdrop can be derived from the instrument, site andattenuation-corrected displacement spectrum ofdirect S waves. Seismic moment M0 can be esti-mated by the following relation (Maruyama,1968), which represents the expression of theS-wave spectral density radiated from a pointshear dislocation:
WSðg ; rÞ ¼ 14Z b 0
1L
30
1rY a P
_MMðg Þ ð2Þ
where M: (g) is the time derivative of the Fouriertransform of the seismic moment time function, gis the angular frequency, b0 is the density at thesource, and L0 is the S-wave velocity at the source(the Haskell model). For a pulse-like sourceshape, and for a constant moment time rate:
_MMðg Þ ¼M0sinðgd 0=2Þgd 0=2
where d0 is the source rupture duration and M0 isthe scalar seismic moment. At the limit gC0 (thelow-frequency asymptote), the S-wave radiatedenergy, 60, can consequently be written as a func-tion of M0, and hence the scalar seismic momentcan be obtained from:
M0 ¼4Zb 0L
30r6 0
2Y a P
where the factor 2 takes into account the free sur-face e¡ect, and Ya P is the radiation pattern term.The corner angular frequency, gc, is the frequencyat which gd0/2 = 1, corresponding to the fre-quency at which the low-frequency asymptoteand the high-frequency spectral envelope calcu-lated in a log^log plot intersect. This frequencycan be used to estimate the source linear dimen-sions L under the hypothesis of constant rupturespeed, assuming no directivity e¡ects and constantrupture velocity Lr, using:
g c ¼2L r
Lð3Þ
The static stress drop (Lay and Wallace, 1995)is de¢ned for a shear fracture by:
vc ¼ CM0
L3 ð4Þ
where C is a non-dimensional shape factor, closeto 1 for most rectangular faults and equal to 7/16for a circular crack.
We use the attenuation parameters and site cor-rection factors deduced from the work of Biancoet al. (1999a) to take into account the propagatione¡ects at Mt. Vesuvius. Then we calculate theFourier spectrum at four digital seismic stationslocated around the epicentral zone for a sample ofwell-recorded seismic events, selected on the basisof signal-to-noise ratio. We observe (see ¢gure 5of Bianco et al. (1999a)) that the spectra for thesame earthquake at di¡erent stations always sharea similar shape, indicating that directivity (or azi-muthal) e¡ects are of second order with respect toseismic noise e¡ects, which primarily a¡ect thespectral shape.
To study the spectral content of the S waves ofMt. Vesuvius local seismicity, we consequentlyuse horizontal component data from the soleBKE digital seismic station. We select a time win-dow that starts at the S-wave time onset with aduration of 2.5 s. The duration of the time win-dow was determined by making several estimatesof the spectral density in time windows with du-ration from 1 to 10 s. Results show that for time-window lengths greater than 1.5 s the spectralestimates are stable. 2.5 s duration appears to bethe best compromise between stability and calcu-lation speed. We are also con¢dent that a 2.5 slength window ensures the minimization of all theradiation pattern e¡ects. These e¡ects are in factvisible for the ¢rst pulse of the primary radiation,which can be estimated to be in the order of 0.1 s,whereas all the secondary radiation following thispulse for the successive 2 s can be attributed toforward scattering by the medium-sized inhomo-geneities in the Earth (Sato and Fehler, 1998). Asalready discussed, the heterogeneity is high at Mt.Vesuvius and its presence reinforces the e¡ect toaverage out all radiation pattern e¡ects in the ¢rst
VOLGEO 3017 6-4-04
E. Del Pezzo et al. / Journal of Volcanology and Geothermal Research 133 (2004) 23^3932
few seconds. We eventually averaged the two hor-izontal-component spectral density estimates car-ried out at BKE.
All the calculations were made using an auto-matic procedure implemented in a MATHCAD2001 worksheet. The low-frequency level was esti-mated by averaging the log-spectral amplitudesfrom 1 to 10 Hz, whereas the high-frequency en-velope was obtained with a linear ¢t of the log-spectral amplitudes in the frequency interval from13 to 25 Hz. The corner frequency was calculatedby the intersection of the low-frequency asymp-tote with the high-frequency envelope. A checkof the parameters obtained automatically wasmade visually by inspecting the spectral shapes,and data with spurious spikes or other disturban-ces that can modify the true spectral shape wererejected.
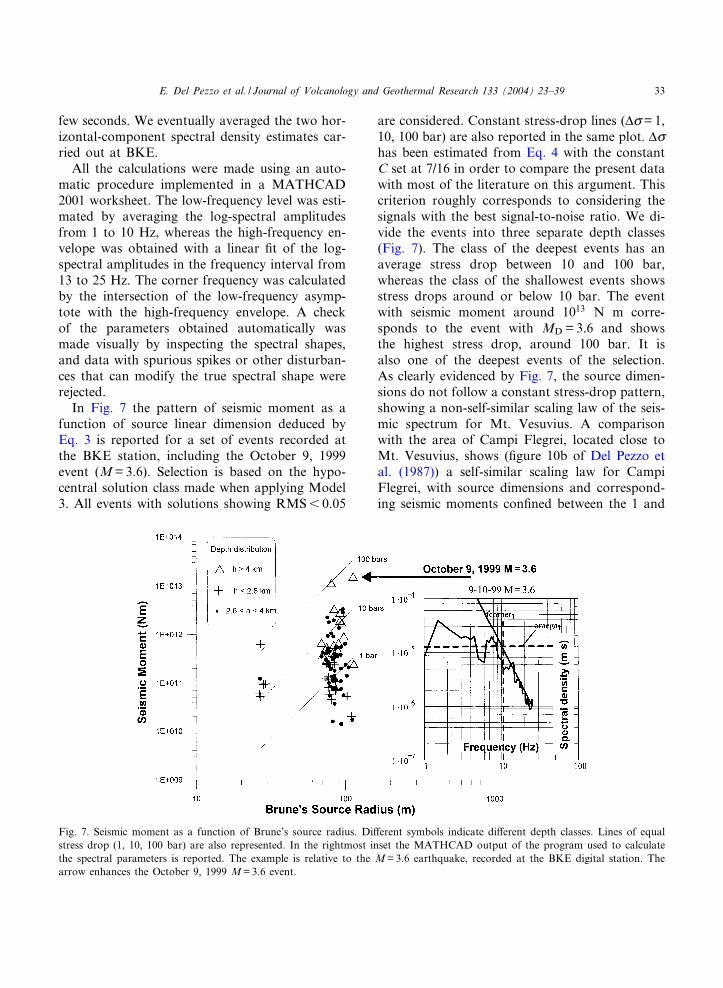
In Fig. 7 the pattern of seismic moment as afunction of source linear dimension deduced byEq. 3 is reported for a set of events recorded atthe BKE station, including the October 9, 1999event (M=3.6). Selection is based on the hypo-central solution class made when applying Model3. All events with solutions showing RMS6 0.05
are considered. Constant stress-drop lines (vc=1,10, 100 bar) are also reported in the same plot. vchas been estimated from Eq. 4 with the constantC set at 7/16 in order to compare the present datawith most of the literature on this argument. Thiscriterion roughly corresponds to considering thesignals with the best signal-to-noise ratio. We di-vide the events into three separate depth classes(Fig. 7). The class of the deepest events has anaverage stress drop between 10 and 100 bar,whereas the class of the shallowest events showsstress drops around or below 10 bar. The eventwith seismic moment around 1013 N m corre-sponds to the event with MD =3.6 and showsthe highest stress drop, around 100 bar. It isalso one of the deepest events of the selection.As clearly evidenced by Fig. 7, the source dimen-sions do not follow a constant stress-drop pattern,showing a non-self-similar scaling law of the seis-mic spectrum for Mt. Vesuvius. A comparisonwith the area of Campi Flegrei, located close toMt. Vesuvius, shows (¢gure 10b of Del Pezzo etal. (1987)) a self-similar scaling law for CampiFlegrei, with source dimensions and correspond-ing seismic moments con¢ned between the 1 and
Fig. 7. Seismic moment as a function of Brune’s source radius. Di¡erent symbols indicate di¡erent depth classes. Lines of equalstress drop (1, 10, 100 bar) are also represented. In the rightmost inset the MATHCAD output of the program used to calculatethe spectral parameters is reported. The example is relative to the M=3.6 earthquake, recorded at the BKE digital station. Thearrow enhances the October 9, 1999 M=3.6 event.
VOLGEO 3017 6-4-04
E. Del Pezzo et al. / Journal of Volcanology and Geothermal Research 133 (2004) 23^39 33
10 bar lines of constant stress drop. We deduce bythis comparison that Mt. Vesuvius behaves di¡er-ently from Campi Flegrei, as Mt. Vesuvius earth-quakes do not scale their focal dimensions withseismic moment, the corner frequency, and hencethe source linear dimension, being constant forthe whole range of magnitudes. Interestingly, atMt. Vesuvius the highest stress-drop values corre-spond to the events located at the greatest depths.
In Fig. 3, where the earthquake magnitude dis-tribution in space at Mt. Vesuvius is shown, dif-ferent symbols represent the di¡erent magnitudeclasses. From the ¢gure it can also be seen thatthe October 9, 1999 earthquake is one of thedeepest events with the greatest stress drops.
Using the spectral parameters calculated for theselected set of events we derive the relationshipbetween seismic moment and magnitude calcu-lated using Eq. 1. It is found that:
logM0 ¼ 9:8þ 0:8MD ð5Þ
where MD is the duration magnitude. Statisticaluncertainties on the ¢t are around 1% of the esti-mated parameters; the maximum contribution tothis uncertainty is given by the error associatedwith the estimate of magnitude (see Del Pezzoand Petrosino, 2001 for a detailed discussion).We then apply Eq. 5 to the catalog of seismicevents of Mt. Vesuvius starting from 1972. Thecatalog contains a list of seismic events recordedat OVO station, which remains with almost un-changed characteristics since the start date of thecatalog. Discussion about the nature of the seis-mic events recorded at Mt. Vesuvius in the ¢rst 13years of the seismic catalog together with a statis-tical description of their time of occurrence arereported in Bonasia et al. (1985); more detailedanalysis is done by Marzocchi et al. (2001) start-ing from 1983.
From the estimate of M0 and a reasonable val-ue of the rigidity coe⁄cient W, which we set equalto 1011 N/m2, we obtain from the de¢nition of theseismic moment:
M0 ¼ WL2vu ð6Þ
the estimate of the fault slip vu. In Eq. 6, the faultarea is estimated from the linear dimension L de-¢ned in Eq. 3. Setting L=90 m, the average
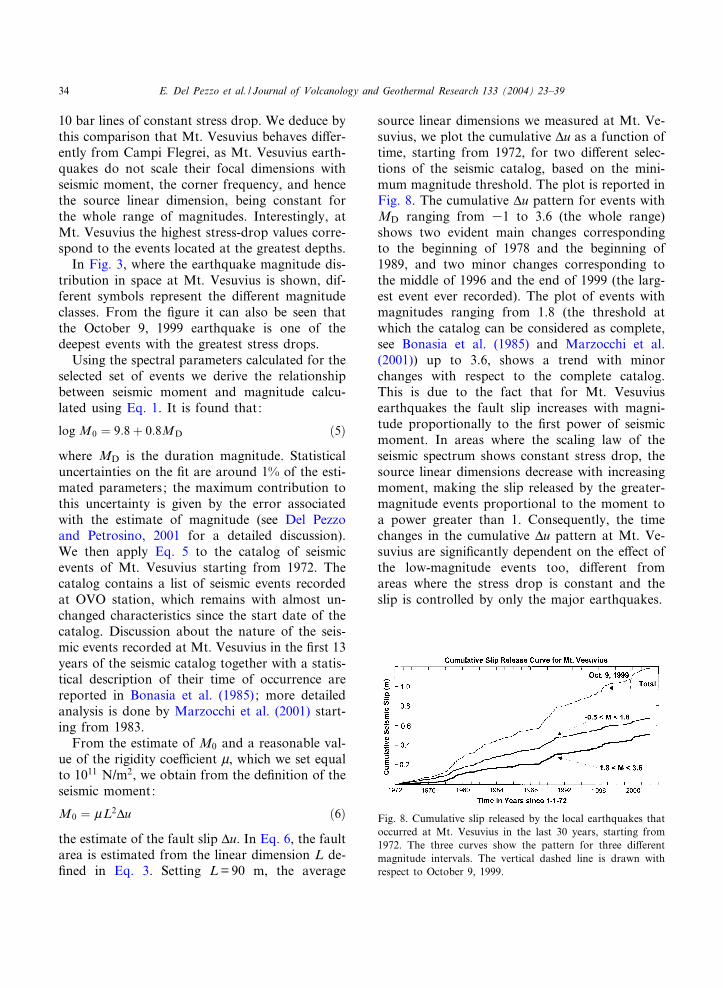
source linear dimensions we measured at Mt. Ve-suvius, we plot the cumulative vu as a function oftime, starting from 1972, for two di¡erent selec-tions of the seismic catalog, based on the mini-mum magnitude threshold. The plot is reported inFig. 8. The cumulative vu pattern for events withMD ranging from 31 to 3.6 (the whole range)shows two evident main changes correspondingto the beginning of 1978 and the beginning of1989, and two minor changes corresponding tothe middle of 1996 and the end of 1999 (the larg-est event ever recorded). The plot of events withmagnitudes ranging from 1.8 (the threshold atwhich the catalog can be considered as complete,see Bonasia et al. (1985) and Marzocchi et al.(2001)) up to 3.6, shows a trend with minorchanges with respect to the complete catalog.This is due to the fact that for Mt. Vesuviusearthquakes the fault slip increases with magni-tude proportionally to the ¢rst power of seismicmoment. In areas where the scaling law of theseismic spectrum shows constant stress drop, thesource linear dimensions decrease with increasingmoment, making the slip released by the greater-magnitude events proportional to the moment toa power greater than 1. Consequently, the timechanges in the cumulative vu pattern at Mt. Ve-suvius are signi¢cantly dependent on the e¡ect ofthe low-magnitude events too, di¡erent fromareas where the stress drop is constant and theslip is controlled by only the major earthquakes.
Fig. 8. Cumulative slip released by the local earthquakes thatoccurred at Mt. Vesuvius in the last 30 years, starting from1972. The three curves show the pattern for three di¡erentmagnitude intervals. The vertical dashed line is drawn withrespect to October 9, 1999.
VOLGEO 3017 6-4-04
E. Del Pezzo et al. / Journal of Volcanology and Geothermal Research 133 (2004) 23^3934
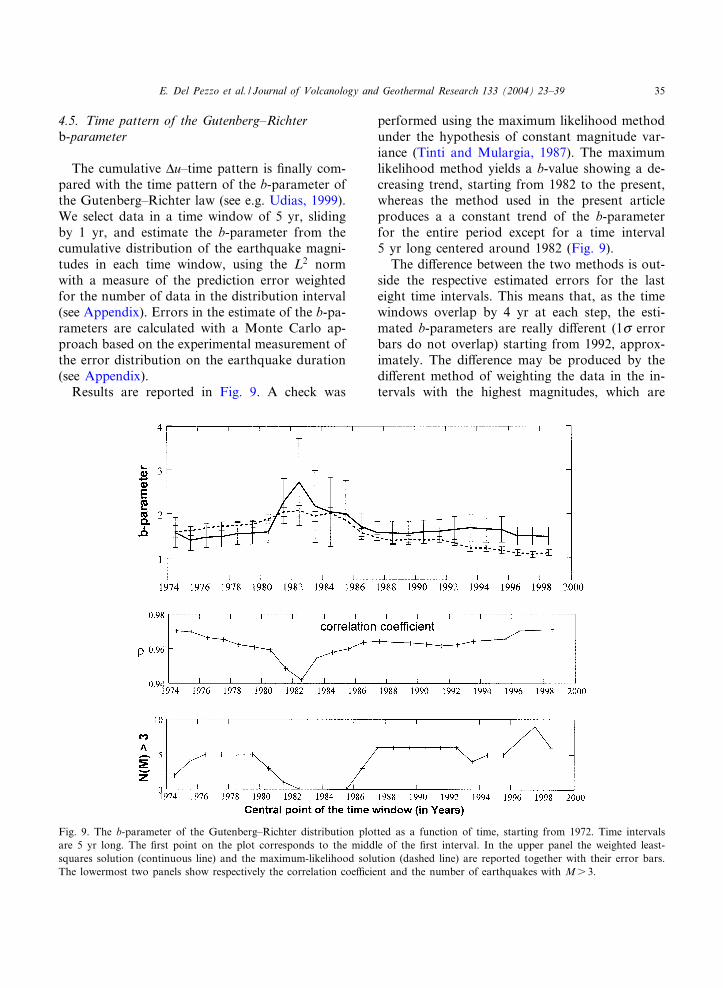
4.5. Time pattern of the Gutenberg^Richterb-parameter
The cumulative vu^time pattern is ¢nally com-pared with the time pattern of the b-parameter ofthe Gutenberg^Richter law (see e.g. Udias, 1999).We select data in a time window of 5 yr, slidingby 1 yr, and estimate the b-parameter from thecumulative distribution of the earthquake magni-tudes in each time window, using the L2 normwith a measure of the prediction error weightedfor the number of data in the distribution interval(see Appendix). Errors in the estimate of the b-pa-rameters are calculated with a Monte Carlo ap-proach based on the experimental measurement ofthe error distribution on the earthquake duration(see Appendix).
Results are reported in Fig. 9. A check was
performed using the maximum likelihood methodunder the hypothesis of constant magnitude var-iance (Tinti and Mulargia, 1987). The maximumlikelihood method yields a b-value showing a de-creasing trend, starting from 1982 to the present,whereas the method used in the present articleproduces a a constant trend of the b-parameterfor the entire period except for a time interval5 yr long centered around 1982 (Fig. 9).
The di¡erence between the two methods is out-side the respective estimated errors for the lasteight time intervals. This means that, as the timewindows overlap by 4 yr at each step, the esti-mated b-parameters are really di¡erent (1c errorbars do not overlap) starting from 1992, approx-imately. The di¡erence may be produced by thedi¡erent method of weighting the data in the in-tervals with the highest magnitudes, which are
Fig. 9. The b-parameter of the Gutenberg^Richter distribution plotted as a function of time, starting from 1972. Time intervalsare 5 yr long. The ¢rst point on the plot corresponds to the middle of the ¢rst interval. In the upper panel the weighted least-squares solution (continuous line) and the maximum-likelihood solution (dashed line) are reported together with their error bars.The lowermost two panels show respectively the correlation coe⁄cient and the number of earthquakes with Ms 3.
VOLGEO 3017 6-4-04
E. Del Pezzo et al. / Journal of Volcanology and Geothermal Research 133 (2004) 23^39 35
more numerous starting from 1992. Using theweighted prediction error approach we weightthe intervals with higher magnitude more, asshown in the Appendix. The errors in the b-pa-rameter estimated in the present article are basedon the experimental measurement of the RMS-noise distribution, from which an estimate of thestandard deviation of the earthquake duration,and hence of the duration magnitude, is derived.As already observed (Saccorotti et al., 2001),RMS-noise £uctuations are strong at Mt. Vesu-vius, severely a¡ecting the magnitude estimates,especially at low magnitude.
For the time interval centered between 1980and 1986 the b-parameter is greater, close to 2,showing on the other hand the greatest error in-terval. The change in b-parameter is essentiallydue to the occurrence of more small-magnitudeevents than for the other time intervals with thecontemporaneous lack of Ms 3 earthquakes. Asreported in the lowermost two panels of Fig. 9,the lack of Ms 3 earthquakes produces the e¡ectof reducing the correlation coe⁄cient, and conse-quently of increasing the error in the estimate ofthe b-parameter.
Interestingly, the time variation of the b-param-eter occurs slightly after the occurrence of theIrpinia earthquake (M=7.2; November 23,1980) whose epicentral area is about 100 kmaway from Mt. Vesuvius. We suspect for this rea-son that the change may not be an artifact intro-duced by the data, but produced by the interac-tion of the stress change imparted by the Irpiniaearthquake to the seismically active zone of Mt.Vesuvius. It is demonstrated (Nostro et al., 1998)that the transfer of 0.01^0.1 MPa of stress can beproduced by the occurrence of major earthquakesin the Southern Apennines. This stress transfermay have induced a pore-pressure change at Mt.Vesuvius, which may have triggered the occur-rence of more small-magnitude events than usual.
5. Discussion
The scaling law of the seismic spectrum revealsnon-linearity in the whole range of magnitudes.The stress drop is in fact dependent on depth
and magnitude of the events. The highest stress-drop values correspond to events with the highestmagnitude ever recorded, and to the greatest hy-pocentral depths. Low magnitude and/or shal-lower events show lower stress drops. This resultcan be interpreted in the framework of the geo-logical structure revealed by recent studies basedon seismic tomography. Higher-energy quakestend to occur close to the top of the carbonatebasement interface, whereas lower-magnitudeevents occur above this velocity discontinuity.All events have epicentral coordinates close tothe crater axis, and occur in a medium character-ized by higher velocity with respect to the sur-rounding rocks, possibly composed of the magmabody which gave rise to the last 1944 eruptionwhich is still cooling. Except for the deepestevents, which from their location are more likelygenerated by tectonic stress release in a pre-frac-tured carbonate basement, all the others mayhave a di¡erent origin. De Natale et al. (2000)consider the e¡ect of the gravitational-body forcesin a volcano as characterized by an axi-symmetricdensity and rigidity anomaly, indicating that thise¡ect could be responsible for the Mt. Vesuviusseismicity. The present results on the scaling lawof the seismic spectrum indicate that the stressdrop associated with the seismicity that originatesclose to the rigidity anomaly above the carbonatebasement is as low as 0.1 bar, with an averagearound 1^10 bar. The source linear dimensionsare approximately constant, of the order of 100m. The order of magnitude for the strain associ-ated with these events can be obtained to a ¢rstapproximation by the slip normalized for the lin-ear dimension of the source (Lay and Wallace,1995). We can estimate that the strain associatedwith the single seismic event ranges from 1037 to1035, assuming a rigidity of 1011 N/m2.
The order of magnitude for the total strain as-sociated with the thermal cooling can be esti-mated in the Hooke’s Law approximation of theorder of 5U1035 if we hypothesize a decrease of10 degrees of temperature since 1944 to thepresent (F. Quareni, personal communication)and a thermal expansion coe⁄cient of 8U1036.So, the seismicity at Mt. Vesuvius cannot be ex-plained in terms of the thermal strain alone, but a
VOLGEO 3017 6-4-04
E. Del Pezzo et al. / Journal of Volcanology and Geothermal Research 133 (2004) 23^3936
triggering mechanism for the release of the grav-itational stress discussed by De Natale et al.(2000) must be hypothesized to account for atleast the shallowest seismicity. Aquifers arepresent under Mt. Vesuvius cone down to a depthof 3 km (Saccorotti et al., 2002). Gravity model-ing (Berrino et al., 1993) and hydrological data(Celico et al., 1998) suggest that charge^dischargeprocesses of the aquifers involving the movementof £uids at depth a¡ect the entire Vesuvius cal-dera. We believe that the increase in £uid porepressure generated by the changes in the level ofaquifers may trigger the shallowest seismicity.This hypothesis implicitly predicts a seismic stressdrop lower than or at least equal to the value ofthe pore pressure. Ventura and Vilardo (1999)estimate a value of about 50 MPa for the £uidpore pressure at 2.5 km depth, which is ¢ve timesgreater than the stress drop for the greatest-mag-nitude events.
The focal mechanism of the greatest-magnitudeevent shows a dip-slip mechanism with strike di-rection oriented WNW^ESE, almost parallel tothe main fault pattern of the region (Venturaand Vilardo, 1999). As this seismic event is lo-cated inside the carbonate basement underlyingMt. Vesuvius we favor the hypothesis that it isgenerated by the release of tectonic stress alongthe main fracture system. In synthesis, we inter-pret the seismicity at Mt. Vesuvius as generatedby the e¡ects of pore pressure changes triggeringthe release of residual gravitational stress (as DeNatale et al. (2000) suggest) above the carbonatebasement, and by the regional tectonic stress re-lease at greater depth.
The time changes in the Gutenberg^Richterb-parameter have been interpreted by Zollo etal. (2002) as generated by the cooling of magmabody that gave rise to the last 1944 Vesuvius erup-tion. These authors exclude from the catalog thedata before 1981, indicating that there is the pos-sibility that the older data might be a¡ected bysome bias in the magnitude estimate. On the otherhand, Bonasia et al. (1985) use the older part ofthe same catalog to estimate the properties of sta-tistical clustering of Mt. Vesuvius seismicity, ¢nd-ing results that have been con¢rmed by Zollo etal. (2002), indicating that the possible changes
can be considered as not crucial. For this reasonthe present analysis of the b-parameter at Mt.Vesuvius has been carried out on all availabledata, from 1972 to the end of 2001. We estimatedthe b-parameter using a weighted least-squares es-timate of the slope of the Gutenberg^Richter cu-mulative distribution. Error analysis tends to ex-clude a statistically signi¢cant constant decreaseof the b-parameter after 1981; the error bars aretoo big to consider the time change of the b-pa-rameter visible around 1980 as signi¢cant, eventhough there is a real decrease of higher-magni-tude events accompanied by the lack of Ms 3earthquakes for the same period. We suspectthat this change may be the consequence of thestress pulse released by the Irpinia earthquake ofNovember 23, 1980, a¡ecting the local stress ¢eldwith the occurrence of more small-magnitudeearthquakes than in the usual conditions.
Acknowledgements
Steve Malone is acknowledged for the usefulcomments on the ¢rst version of the manuscript.Roberto Scarpa is gratefully acknowledged forhelpful discussions and for the valuable informa-tion on the characteristics of the instrumentswhich were operating at the OVO station duringthe early seventies. Marcello Martini is acknowl-edged for helpful comments, Francesca Quarenifor discussions on the cooling of the magmabody underneath Mt. Vesuvius, and Geppi Vilar-do for having summarized to the authors his re-search on aquifers at Mt. Vesuvius. The personnelof the seismic lab. of V.O. (G. Talarico, P. Ric-ciolino, G. Alessio, S. Petrosino, P. Cusano, G.Borriello, E. Torello) furnished the data set andgave any support and assistance needed in thechecking of the seismic catalog.
Appendix. Estimate of b-parameter and itsuncertainty
The uncertainty in the seismogram duration es-timate, from which magnitude is calculatedthrough Eq. 1, is determined by the £uctuations
VOLGEO 3017 6-4-04
E. Del Pezzo et al. / Journal of Volcanology and Geothermal Research 133 (2004) 23^39 37
of the noise RMS amplitude. We experimentallymeasure these £uctuations at Mt. Vesuvius, and¢nd that they exhibit a log-normal distribution(Del Pezzo et al., 2002). For a given earthquakemagnitude, the corresponding duration can be ob-tained theoretically. We assume that all earth-quakes in the same zone exhibit the same enve-lope shape, and calculate the duration by the timepoint at which the envelope can be equated to thenoise RMS amplitude. Then we randomly gener-ate a set of RMS-noise amplitudes, following alog-normal distribution with the same mean andvariance as that observed experimentally, and cal-culate the corresponding distribution of durationsfor several values of the maximum seismogramamplitude. We observe that the distributions ofseismogram durations are approximately Gaus-sian, for all amplitude values. Consequently, thedistributions of the duration^magnitude £uctua-tions are asymmetric, showing a longer tail tothe left of the maximum, with asymmetry decreas-ing with increasing duration^magnitude. In a ¢rstapproximation, we consider duration^magnitudeas normally distributed and derive from theMonte Carlo simulation the relationship betweenvariance and duration^magnitude, given by:
cM ¼ expð0:730:8MDÞ ð7Þ
We estimate the b-parameter of the Gutenberg^Richter relationship using the L2 norm with ameasure of the prediction error weighted for thenumber of data in the distribution interval. Weweight by 1/2cM the data intervals characterizedby a number of events lower than 3, and giveweight 1/cM to the other intervals, giving in thisway a lower weight to the extreme of the distri-bution. We also check the completeness of eachearthquake sub-catalog (in each time window) vis-ually on the plots. This approach is similar to thatdescribed by Guttorp (1987).
Errors in the b-parameter are estimated with aMonte Carlo approach. We generated a set of K(K=500) random magnitude residuals (using thenormal distribution with cM given by Eq. 7) ineach magnitude interval of the distribution. Cor-responding residuals in log(N), where N is thenumber of earthquakes with magnitudesM,were calculated by assuming that:
c logðNÞvbcM ð8Þ
where clogðNÞ is the standard deviation of the logof the earthquakes with magnitude sM and b isthe b-parameter, and generating K residuals uni-formly distributed between 3c logðNÞ and clogðNÞ.
Using this procedure we obtained K distribu-tions. The b-parameter was calculated for eachdistribution and this set of b-parameters wasused to calculate the standard deviation on b, cb.
References
Auger, E., Gasparini, P., Virieux, J., Zollo, A., 2001. Seismicevidence of an extended magmatic sill under Mt. Vesuvius.Science 294, 1510^1512.
Berrino, G., Coppa, U., De Natale, G., Pingue, F., 1993. Re-cent geophysical investigations at Somma Vesuvius volcaniccomplex. J. Volcanol. Geotherm. Res. 58, 239^262.
Bianco, F., Castellano, M., Milano, G., Ventura, G., Vilardo,G., 1998. The Somma-Vesuvius stress-¢eld induced by re-gional tectonic: evidences from seismological and mesostruc-tural data. J. Volcanol. Geotherm. Res. 82, 199^218.
Bianco, F., Castellano, M., Del Pezzo, E., Ibanez, J., 1999a.Attenuation of the short period seismic waves at Mt. Vesu-vius, Italy. Geophys. J. Int. 138, 67^76.
Bianco, F., Castellano, M., Milano, G., Vilardo, G., Ferrucci,F., Gresta, S., 1999b. The seismic crisis at Mt. Vesuviusduring 1995 and 1996. Phys. Chem. Earth 24, 977^983.
Bonasia, V., Del Pezzo, E., Pingue, F., Scandone, R., Scarpa,R., 1985. Eruptive history, seismic activity and ground de-formations at Mt. Vesuvius, Italy. Ann. Geophys. 3, 395^406.
Bruno, P., Cippitelli, G., Rapolla, A., 1998. Seismic study ofthe Mesozoic carbonate basement around Mt. Somma-Ve-suvius, Italy. J. Volcanol. Geotherm. Res. 84, 311^322.
Castellano, M., Buonocunto, C., Capello, M., La Rocca, M.,2001. Seismic surveillance of active volcanoes: the Osserva-torio Vesuviano Seismic Network (OVSN-Southern Italy).Seismol. Res. Lett. 73, 168^175.
Celico, P., Stanzione, D., Esposito, L., Ghiara, M., Piscopo,V., Caliro, S., La Gioia, P., 1998. Caratterizzazione idrogeo-logica dell’area vesuviana. Boll. Soc. Geol. It. 117, 3^20.
Chouet, B., 1996. New methods and future trends in seismo-logical volcano monitoring. In: Scarpa, R., Tilling, R.I.(Eds.), Monitoring and Mitigation of Volcano Hazards.Springer, Berlin, pp. 23^97.
Crampin, S., 1981. A review of wave motion in anisotropicand cracked elastic-media. Wave Motion 3, 343^391.
Del Pezzo, E., De Natale, G., Martini, M., Zollo, A., 1987.Source parameters of microearthquakes at Phlegrean Fields(Southern Italy) volcanic area. Phys. Earth Planet. Inter. 47,25^42.
VOLGEO 3017 6-4-04
E. Del Pezzo et al. / Journal of Volcanology and Geothermal Research 133 (2004) 23^3938
Del Pezzo, E., Bianco, F., Castellano, M., Petrosino, S.,Pingue, F., Capello, M., Esposito, T., Augusti, V., Saccor-otti, G., La Rocca, M., Maresca, R., Galluzzo, D., Cirillo,A., Grozea, B., Ibanez, J., Carmona, E., Alguacil, G., 1999.A seismic array on Mt. Vesuvius. O.V. Open File Report,online at www.ov.ingv.it.
Del Pezzo, E., Petrosino, S., 2001. A local-magnitude scale forMt Vesuvius from synthetic Wood Anderson seismograms.J. Seismol. 5, 207^215.
Del Pezzo, E., Bianco, F., Saccorotti, G., 2002. In£uence ofthe noise £uctuactions in the estimate of duration-magni-tude. Internal Report, online at www.ov.ingv.it.
De Natale, G., Petrazzuoli, S., Troise, C., Pingue, F., Capua-no, P., 2000. Internal stress ¢eld at Mt. Vesuvius: a modelfor background seismicity at a central volcano. J. Geophys.Res. 105, 16207^16214.
Di Maio, R., Mauriello, P., Patella, D., Petrillo, Z., Piscitelli,S., Siniscalchi, A., 1998. Electric and electromagnetic outlineof the Mount Somma - Vesuvius structural setting. J. Vol-canol. Geotherm. Res. 82, 219^238.
Fedi, M., Florio, G., Rapolla, A., 1998. 2.5D modelling ofSomma-Vesuvius structure by aeromagnetic data. J. Volca-nol. Geotherm. Res. 82, 239^247.
Guttorp, P., 1987. On the least-squares estimation of b values.Bull. Seismol. Soc. Am. 77, 2115^2124.
Hyppolite, J., Angelier, J., Roure, F., 1994. A major changerevealed by Quaternary stress patterns in the SouthernApennines. Tectonophysics 230, 199^210.
Lay, T., Wallace, T.C., 1995. Modern Global Seismology.Academic Press, London.
Lomax, A., Zollo, A., Capuano, P., Virieux, J., 2001. Precise,absolute earthquake location under Somma-Vesuvius volca-no using a new three-dimensional velocity model. Geophys.J. Int. 146, 313^331.
Marzocchi, W., Vilardo, G., Hill, D.P., Ricciardi, G.P., Ricco,C., 2001. Common features and peculiarities of the seismicactivity at Phlegraean ¢elds, Long Valley and Vesuvius.Bull. Seismol. Soc. Am. 91, 191^205.
Maruyama, T., 1968. On the force equivalents of dynamicalelastic dislocations with reference to the earthquake mecha-nism. Bull. Earth Res. Inst. Tokyo Univ. 41, 467^486.
Nostro, C., Stein, R.S., Cocco, M., Belardinelli, M.E., Mar-zocchi, W., 1998. Two way coupling between Vesuvius erup-tions and southern Apennine earthquakes, Italy, by elasticstress transfer. J. Geophys. Res. 103, 24487^24504.
Principe, C., Rosi, M., Santacroce, R., Sbrana, A., 1987. Ex-planatory notes to the geological map. In: R. Santacroce(Ed.), Somma-Vesuvius. Quad. Ric. Sci. 114, 11^51.
Reasenberg, P., Oppenheimer, D., 1985. FPFIT, FPPLOT andFPPAGE: Fortran computer programs for calculating anddisplaying earthquake fault-plane solutions. U.S. Geol.Surv. Open File Rep. 85, 109.
Rosi, M., Santacroce, R., Sheridan, M.F., 1987. Volcanic Haz-ard in Somma-Vesuvius. Quad. Ric. Sci., Consiglio Nazio-nale delle Ricerche, Rome, pp. 197^234.
Saccorotti, G., Maresca, R., Del Pezzo, E., 2001. Array anal-yses of seismic noise at Mt. Vesuvius Volcano, Italy. J. Vol-canol. Geotherm. Res. 110, 79^100.
Saccorotti, G., Ventura, G., Vilardo, G., 2002. Seismic swarmsrelated to di¡usive processes: The case of Somma Vesuviusvolcano, Italy. Geophysics 67, 199^203.
Santacroce, R., 1983. A general model for the behaviour of theSomma-Vesuvius volcanic complex. J. Volcanol. Geotherm.Res. 17, 237^248.
Sato, H., 1991. Study of the seismogram envelopes based onscattering by random inhomogeneities in the lithosphere: areview. Phys. Earth Planet. Int. 67, 4^19.
Sato, H., Fehler, M.C., 1998. Seismic Wave Propagation andScattering in the Heterogeneous Earth. Springer, New York.
Scandone, R., Giacomelli, L., Gasparini, P., 1993. Mt. Vesu-vius: 2000 years of volcanological observations. J. Volcanol.Geotherm. Res. 58, 5^26.
Scarpa, R., Amoruso, A., Crescentini, L., Linde, A.T., Sacks,S., Del Pezzo, E., Martini, M., 2000. Forecasting volcaniceruptions by geophysical methods: The case of Vesuvius andCampi Flegrei, Italy. In: Boschi, E., Ekstrom, G., Morelli,A. (Eds.), Problems in Geophysics for the New Millennium.Editrice Compositori, Bologna.
Snoke, J.A., Munsey, J.W., Teague, A.G., Bollinger, G.A.,1984. A program for focal mechanism determination bycombined use of polarity and Sv-P amplitude ratio data.Earthq. Notes 55, 15^20.
Tinti, S., Mulargia, F., 1987. Con¢dence intervals of b-valuesfor grouped magnitudes. Bull. Seismol. Soc. Am. 77, 2125^2134.
Udias, A., 1999. Principles of Seismology. Cambridge Univer-sity Press, Cambridge.
Ventura, G., Vilardo, G., 1999. Slip tendency analysis of theVesuvius faults: implications for the seismotectonic andvolcanic hazard assessment. Geophys. Res. Lett. 26, 3229^3232.
Vilardo, G., De Natale, G., Milano, G., Coppa, U., 1996. Theseismicity of Mt. Vesuvius. Tectonophysics 261, 127^138.
Wennerberg, L., 1993. Multiple scattering interpretation ofcoda-Q measurements. Bull. Seismol. Soc. Am. 83, 279^290.
Wu, H., Lees, J.M., 1996. Attenuation of Coso geothermalarea, California, from wave pulse width. Bull. Seismol.Soc. Am. 5, 1574^1590.
Zollo, A., Marzocchi, W., Capuano, P., Lomax, A., Iannac-cone, G., 2002. Space and time behaviour of seismic activityat Mt. Vesuvius volcano, Southern Italy. Bull. Seismol. Soc.Am. 92, 625^640.
Zollo, A., Gasparini, P., Virieux, J., Le Meur, H., De Natale,G., Biella, G., Boschi, E., Capuano, P., De Franco, R., Dell’Aversana, P., De Matteis, R., Guerra, I., Iannaccone, G.,Mirabile, L., Vilardo, G., 1996. Seismic evidence for a low-velocity zone in the upper crust beneath Mt. Vesuvius. Sci-ence 274, 592^594.
VOLGEO 3017 6-4-04
E. Del Pezzo et al. / Journal of Volcanology and Geothermal Research 133 (2004) 23^39 39