seismic risk management of non-engineered buildings
TRANSCRIPT

Seismic risk management of non-engineered buildings.
WINAR, Setya.
Available from the Sheffield Hallam University Research Archive (SHURA) at:
http://shura.shu.ac.uk/20554/
A Sheffield Hallam University thesis
This thesis is protected by copyright which belongs to the author.
The content must not be changed in any way or sold commercially in any format or medium without the formal permission of the author.
When referring to this work, full bibliographic details including the author, title, awarding institution and date of the thesis must be given.
Please visit http://shura.shu.ac.uk/20554/ and http://shura.shu.ac.uk/information.html for further details about copyright and re-use permissions.

Sheffield Hallaro University Learning and IT Services
Adsetts Centre City Campus Sheffield S I 1WB
Return to Learning Centre of issue Fines are charged at 50p per hour

ProQuest Number: 10701201
All rights reserved
INFORMATION TO ALL USERS The quality of this reproduction is dependent upon the quality of the copy submitted.
In the unlikely event that the author did not send a com p le te manuscript and there are missing pages, these will be noted. Also, if material had to be removed,
a note will indicate the deletion.
uestProQuest 10701201
Published by ProQuest LLC(2017). Copyright of the Dissertation is held by the Author.
All rights reserved.This work is protected against unauthorized copying under Title 17, United States C ode
Microform Edition © ProQuest LLC.
ProQuest LLC.789 East Eisenhower Parkway
P.O. Box 1346 Ann Arbor, Ml 48106- 1346

SEISMIC RISK MANAGEMENT OF NON-ENGINEERED BUILDINGS
Setya Winarno
A thesis submitted in partial fulfilment of the requirements of Sheffield Hallam University
for the degree of Doctor of Philosophy
September, 2007

Dedicated to all people who live in developing countries with earthquake risk, particularly those in Indonesia

ABSTRACT
Earthquakes have long been feared as one o f nature’s most terrifying and devastating events. Although seismic codes clearly exist in countries with a high seismic risk to save lives and human suffering, earthquakes still continue to cause tragic events with high death tolls, particularly due to the collapse of widespread non-engineered buildings with non-seismic resistance in developing countries such as Indonesia. The implementation o f seismic codes in non-engineered construction is the key to ensuring earthquake safety. In fact, such implementation is not simple, because it comprises all forms o f cross disciplinary and cross sectoral linkages at different levels o f understanding, commitment, and skill. This fact suggests that a widely agreed framework can help to harmonise the various perspectives. Hence, this research is aimed at developing an integrated framework for guiding and monitoring seismic risk reduction of non-engineered buildings in Indonesia via a risk management method.
Primarily, the proposed framework for the study has drawn heavily on wider literature, the three existing frameworks around the world, and on the contribution o f various stakeholders who participated in the study. A postal questionnaire survey, selected interviews, and workshop event constituted the primary data collection methods. As a robust framework needed to be achieved, the following two workshop events, which were conducted in Yogyakarta City and Bengkulu City in Indonesia, were carried out for practicality, validity, and moderation or any identifiable improvement requirements. The data collected was analysed with the assistance o f SPSS and NVivo software programmes.
This research found that the content o f the proposed framework comprises 63 pairs o f characteristic-indicators complemented by (a) three important factors o f effective seismic risk management o f non-engineered buildings, (b) three guiding principles for sustainable dissemination to the grass root communities and (c) a map o f agents o f change. Among the 63 pairs, there are 19 technical interventions and 44 non-technical interventions. These findings contribute to the wider knowledge in the domain o f the seismic risk management o f non-engineered buildings, in order to: (a) provide a basis for effective political advocacy, (b) reflect the multidimensional and inter-disciplinary nature o f seismic risk reduction, (c) assist a wide range o f users in determining roles, responsibilities, and accountabilities, and (d) provide the basis for setting goals and targets.

ACKNOWLEDGEMENTS
I acknowledge with gratitude to the G overnm ent of Indonesia who provided funding for this research project. I also acknowledge with warm thanks and appreciation to my colleagues who gave tremendous support and guidance for this research, in particular Professor D r Sarwidi, Professor D r W idodo, D r Ruzardi, and D r Ade Ilham .
This project would not have been possible without the support o f my director o f studies Professor D r Alan Griffith and my supervisor Professor D r Paul Stephenson. Their confidence in my work and tireless support in rough and tough times during the project gave me the motivation and inspiration at every stage o f the research. More importantly, their guidance and detailed and critical review, at various stages o f the research work kept the project on rails and in the right direction.
I am truly thankful to the lovely lady, Ann W ilson (research administrator for the Built Environment Division, Sheffield Hallam University). She bore with me, with enormous patience and un-daunting support during my research work.
Also, without the love and support o f my family, wife K un Sri Budiasih and kids H anifa and Faizurrahm an, this research would have been meaningless.
The important to the success o f this project as funding were the superb contribution from several organisations and agencies, and hundreds o f people around Indonesian region who participated in this project. These people generously gave time, advice, information, experience, story, and encouragement for the overall data collection phase. They did so in the hopes that these research findings would help not only their own communities but also other earthquake-threatened areas around Indonesia, and other developing countries as well.
Finally, many thanks to all fellow researchers especially Zainah, Izzam ir, M oham ed, Julius, Sadeg, Nina, M ildred, Abdul, M ostafa, and Chris as well as all Indonesian society members in Sheffield who have been real source o f inspiration.
Thank you all!

ABBREVIATIONS
ADPC:BAKORNAS:
BAPPENAS:
BPS:
BSSC:CEEDEDS:
DGURD:DFID:
DMO:
DPU:
EERI:
FEMA:
GRDC:GREAT:IDEA:
IITK-BMTPC:
ISDR:
IUDMP:MHA:NDMD:
NICEERMSI:SATKORLAK:
SATLAK:
SCEC:SRRNEB:
TBSC:UN CRD:
UNDP:
UN-ISDR:
USGS:
Asian Disaster Preparedness Center
Badan Koordinasi Nasional (National Disaster Management Coordinating Board)
Badan Perencanaan Pembangunan Nasional (National Development Planning Agency), Indonesia
Badan Pusat Statistik (Statistic Center Board)
Building Seismic Safety Council, USA
Center for Earthquake Engineering, Dynamic Effect, and Disaster Studies
Directorate General o f Urban and Rural Development, UNDepartment for International Development, UK
Disaster Management Organisation
Departement Pekerjaan Umum, Indonesia (Public Work Department)
Earthquake Engineering Research Institute. USA
Federal Emergency Management Agency, USA
Geological Research and Development Center, Indonesia
Gujarat Relief Engineering Advice Team
Instituto de Estudios Ambientales
Indian Institute o f Technology Kanpur and Building Materials and Technology Promotion Council, India
International Strategy for Disaster Reduction
Indonesian Urban Disaster Mitigation ProjectThe Ministry o f Home Affairs, India
National Disaster Management Division, India
National Information Center o f Earthquake Engineering, India
Risk Management Software India
Satuan Koordinasi Pelaksanaan (Provincial Disaster Management Coordinator Implementing), Indonesia
Satuan Pelaksanaan (District/Municipal Disaster Management Implementing Unit), Indonesia
Southern California Earthquake Center, USA
Seismic Risk Reduction o f Non-Engineered Buildings
Treasury Board o f Canada Secretariat
United Nations Centre for Regional Development
United Nations Development ProgrammeThe United Nations-Intemational Strategy for Disaster Reduction
The United Sates Geology Survey

GLOSSARY OF TERMS
Disaster: A serious disruption o f the functioning o f society, causing widespreadhuman, material or environmental losses, which exceed the ability of affected society to cope using only its own resources.
Earthquake: The shaking or vibrating o f the ground caused by the sudden release o fenergy stored in rock beneath the earth's surface.
Epicenter : The position on the earth’s surface above the focus o f an earthquake
Fault: A crack or fracture in the earth's surface along which the two sides havebeen displaced relative to each other. Active faults are assumed to be capable o f producing earthquakes.
Focal depth: The depth below the surface o f the hypocenter or focus o f an earthquake.
Intensity: A measure o f severity o f shaking at a particular site. It is usually estimated
Isoseismal: A contour on a map bounding areas of equal intensity for a particularearthquake
Magnitude: A quantity characteristic o f the total energy released by an earthquake, as
Non-engineered building: A building which is spontaneously and informally constructed in the traditional manner. House owner is very much involved, and skilled technicians (erigineers and architects) are generally not participated in their design and construction. They almost certainly have not been designed and constructed to resist earthquakes.
Risk: The possibility o f suffering loss as the product o f hazard and vulnerability

TABLE OF CONTENTS
Page
A b s tra c t ..................................................................................................................................... iiA cknow ledgem ents....................................................................................................................... iiiA bbrev ia tions................................................................................................................................. ivGlossary of te rm s ........................................................................................................................... vTable of Contents........................................................................................................................... viList of F ig u re s ................................................................................................................................ xList of T a b le s ................................................................................................................................. xiiiList of A ppendices......................................................................................................................... xv
I. Research In tro d u c tio n ................................................................. 1
1; 1 Research F o cu s ........................................................................................................................ 11.2 Rationale for the Research T op ic .......................................................................................... 31.3 Research Aim and Objectives............................................................................................... 71.4 Significance o f the Research.................................................................................................. 71.5 Overview of the Research M ethodology.............................................................................. 81.6 Guide to the T hesis................................................................................................................. 101.7 Sum m ary................................................................................................................................... 12
II. E arthquake Activities, Their Implications, and Situation in In d o n es ia ..................... 13
2.1 What is an Earthquake?......................................................................................................... 132.2 The Strength of Earthquakes - Magnitude and Intensity .................................................. 152.3 Earthquake Facts and Statistics............................................................................................ 17
2.3.1 Earthquake Occurrences............................................................................................. 172.3.2 Earthquake Implications.............................................................. 17
2.4 Lessons Learned from Earthquake D am age................................................... 192;5 The Situation in and around Indonesia................................................................................ 242.6 Seismic Mapping o f Indonesia.............................................................................................. 292.7 Sum m ary.................................................................................................................................. 31
m . Non Engineered Buildings and Seismic C odes.............................................................. 33
3.1 Non-Engineered Buildings and High Death Tolls during Earthquakes.......................... 333.2 Construction Practice in Non-Engineered Construction................................................... 353.3 Building Behaviours during Earthquake Shaking.............................................................. 41
3.3.1 Inertia Forces in Buildings......................................................................................... 413.3.2 Effect of Deformations in Buildings......................................................................... 423.3.3 Flow of Inertia Forces to Foundations...................................................................... 423.3.4 Importance o f Architectural Features........................................................................ 423.3.5 Twisting in Buildings.................................................................. 46
3.4 The Seismic Design Philosophy for Buildings.................................................................... 493.5 Building D uctility .................................................................................................................... 503*6 Effect upon Non-Engineered and Engineered Buildings during Earthquakes 52
3.6.1 Effects Upon Non-Engineered Buildings................................................................ 52
vi

3.6.2 Improving o f Seismic Resistance on Masonry and Multi-storey Reinforced Concrete Buildings..................................................................................................... 583.6.2.1 Masonry Buildings....................................................................................... 583.6.2.2 Multi-storey Reinforced Concrete Buildings..................................................68
3.6.3 Effects upon Engineered Buildings ........................................................... 833.7 The Existence o f Seismic C odes................................................................ 883.8 Seismic Features in B uilding.................................................................... 903.9 A Wide Gap between Earthquake Facts and the Existence o f Seismic C odes 923.10 Sum m ary............................... .............................................................................................. 93
IV. Seismic Risk Management, the Situation in Indonesia, and the Importance ofIntegrated Seismic Risk Management in Indonesia ..................................................... 95
4.1 Definition o f Risk M anagem ent......................................................................................... 954.2 Seismic Risk M anagem ent................................................................................... 98
4.2.1 Seismic Risk Management A pproach...................... 1014.2.2 Reducing the Cost o f Loss Using Seismic Risk Management A ctions............. 104
4.3 Some Evidence o f Good Practices o f Seismic Risk ManagementImplementation in Countries................... 1044.3.1 Direct Involvement of Multidiscipline Stakeholders in Seismic Risk
M anagem ent.................................................... 1054.3.1.1 Involvement o f Government A gencies.................................................... 1054.3.1.2 Involvement o f Non-government A gencies............................................ 107
4.3.2 Strengthening o f Local Capacities within Seismic Risk M anagem ent.............. 1094.3.3 Poverty Consideration in Seismic Risk M anagement......................................... 113
4.4 Seismic Risk Management and Sustainable Development............................................ 1164.5 An Overview o f Disaster Management According to the Decentralization Process in
Indonesia.............................................................................................................................. 1194.6 The Importance o f Integrated Seismic Risk Management in Indonesia...................... 123
4.6.1 Background............................................................................................................... 1234.6.2 Why a Framework?.................................................................................................. 1264.6.3 What is in the Proposed Framework?................................................................... 1274.6.4 What are the Potential Benefits Using the Proposed Fram ework?................... 1284.6.5 How Can the Proposed Framework be U sed?...................................................... 128
4.7 Sum m ary................................................................................................................................ 129
V. Review of Existing Frameworks in Disaster Risk Reduction, PreliminaryAnalysis, and Emerging Issues for Primary Data Investigation................................ 131
5.1 Review of Existing Frameworks in Disaster Risk Reduction......................................... 1315.1.1 Framework for Guiding & Monitoring o f Disaster Risk Reduction................... 1325.1.2 Framework for Reducing the Earthquake Threat in the Kathmandu Valley,
Nepal (ADPC, 2000)........................................ 1365.1.3 Framework for Urban Earthquake Vulnerability Reduction in India
(MHA, 2002)................................................................................................................ 1425.2 Shortfalls in the Three Existing Frameworks...................................................................... 1495.3 Preliminary Analysis from the Review of Literature and Existing Fram eworks 1505.4 Emerging Issues Arising from the Review of Literature for Primary Data Investigatio 154
5.4.1 Headings Related to Seismic Hazard A nalysis....................................................... 157

5.4.2 Headings Related to Seismic Risk Assessment................................................... 1575.4.3 Headings Related to Seismic Response................................................................ 158
5.5 Sum m ary................................................................................................................................ 170
VI. Research M ethodology..................................................................................................... 172
6.1 Definition o f Research....................... 1726.2 Methodological Framework Adopted in the Research................................................... 1736.3 Research Strategy Adopted for the Research.................................................................. 1746.4 Research Question Adopted for the Research................................................................. 1766.5 Research Design o f the Project............................................ 1786.6 Approaches to and Techniques for Data Collection Adopted for the R esearch 184
6.6.1 Approaches to Data Collection............................................................................... 1846.6.2 Techniques for Data Collection.............................................................................. 185
6.7 Sampling Method Adopted for the Research.................................................................. 1906.8 Method for Data Measurement and A nalysis.................................................................. 191
6.8.1 Method for Data M easurement............................................................................... 1916.8.2 Method for Data A nalysis............................. 192
6.9 Anticipated Findings............................................................................................................ 1946.10 Key Quality Concerns Adopted for the Research ................................................. 1966.11 Ethical Consideration o f the Research............................................................................ 1986.12 Sum m ary.............................................................................................................................. 200
VII. Pilot Research S tu d y ............................................................... .......................................... 201
7.1 Introduction to Pilot S tudy.................................................................................................. 2017.2 Pilot Study Design for the Research................................................................................ 2027.3 Objectives o f the Pilot S tudy ............................................................................................... 2037.4 Profiles o f Pilot Stakeholder Organisations ........................................................ 2057.5 Findings from the Pilot S tudy............................................................................ 205
7.5.1 Earthquake Effects, Seismic Codes, and Non-Engineered Building................. 2067.5.2 Practices o f Seismic Risk M anagem ent................................................................ 2077.5.3 The Proposed Framework for Guiding and Monitoring SRRNEB.................... 2097.5.4 Validation Media for the Proposed Framework ................................................... 211
7.6 Emerging Issues from Combining the Critical Review o f Literature andExisting Frameworks and Pilot Study F indings............................................................... 212
7.7 Contribution to Wider Knowledge...................................................................................... 2137.8 Refinement for the Research D esign..................................................... 2151:9 Summary................................................................................................................................ 217
VIII. Questionnaire Survey and Selected Interview D ata Collection and Analysis .... 218
8.1 Questionnaire Data Collection and A nalysis...................................................................... 2198.1.1 Rationale for the Questionnaire Survey......................................................... 2198.1.2 The Research Sam ple ..................................................................................... 2208.1.3 The Data Collected and Analysis o f the R esults.................................................. 222
8.1.3.1 The Characteristics o f the Sam ple..................... 2228.1.3.2 Calculation o f Spearman ‘rho’ Correlation among Respondents by
Category.................................... 2348.1.3.3 Additional Ideas Collected from Open-Ended A nsw ers........................ 2398.1.3.4 Emerging Questions Arising from the Questionnaire Survey .............. 241
8.2 Interview Data Collection and A nalysis............................................................................ 242
viii

8.2.1 Rationale for the Interview, the Research Sample, and the Questions............... 2428.2.2 Analysis of the Results o f the Collected D a ta ........................................................ 244
8.2.2.1 Influential Factors o f the Importance o f Technical Intervention 2458.2.2.2 Guiding Principles o f Sustainable and Effective Dissemination in
the Grass Root Initiatives...................... 2488.3 Refinement o f ’the First Draft o f the Proposed Framework’ ........................................... 2558.4 Sum m ary.................................................................................................................................... 261
IX. Workshop Event for Data Collection and Analysis, and Contribution toWider Knowledge Drawn from Overall Data Collection............................................ 263
9.1 Rationale for the Workshop E ven t....................................................................................... 2639.2 Workshop Structure................................................................................................................ 2649.3 Workshop Results, Analysis, and Findings......................................................................... 2689.4 Refinement of ‘the Second Draft of the Framework’ into ‘the Final Framework’ 2789.5 Contribution to Wider Knowledge Drawn from Thorough Analysis o f Overall Data
Collection.................................................................................................................................. 2809.6 Sum m ary.................................................................................................................................. 285
X. Framework Validation............................................................................................................ 287
10.1 Rationale and Structure o f the Workshop E ven t................................................................ 28710.2 Workshop Feedback and A nalysis.......................................................................... 29110.3 Summation of the Framework V alidation........................................................................... 30010.4 Sum mary.......................... 300
XI. C o n c l u s i o n s ................................................................................................................. 302
11.1 Main Conclusions..................................................................... ■.. 30211.2 Limitations of the Research.................................................................................................. 31011.3 Suggestions for Further Research W ork ............................................................................. 311
R eferences........................................................................................................................................ 313Appendices
ix

LIST OF FIGURES
Page
Figure 1.1 A brief research m ethodology.............................................................................. 9Figure 2.1 Earth tectonic plates (USGS, 2004a)................................................................... 14Figure 2.2 World seismicity from 1975 to 1995 (USGS, 2004c)........................................ 14Figure 2.3 The Ring o f Fire (USGS, 2004a).......................................................................... 15Figure 2.4 The framework o f earthquake effects inland caused by both the ground
shaking and ground failure (FEMA, 2001)............................................................ 18Figure 2.5 An area with almost completely collapsed buildings and houses caused
by the Yogyakarta earthquake in 2006 (BAPPENAS, 2 0 06 )............................. 21Figure 2.6 Total collapse o f the house due to poor design/construction and building
materials after the Changureh earthquake (Mansouri et al., 2002) .................. 22Figure 2.7 A building in the epicentral area, built with better construction techniques
after the "Chi-Chi" earthquake .............................................. 23Figure 2.8 Seismicity in Indonesia, Philippines, Australia, and New Zealand
1977-1997 (USGS, 2004e)...................................................................................... 25Figure 2.9 Residential building damaged after the Majalengka Indonesia earthquake
in 2001 (Sarwidi, 2001).............................................................. 27Figure 2.10 New retail building damaged after the Yogyakarta earthquake in 2006 ......... 28Figure 2.11 Earthquake hazard map o f Indonesia (GRDC, 2001)......................................... 29Figure 3.1 A characteristic comparison between non-engineered and engineered
houses in the Yogyakarta City (Sarwidi and Winamo, 20 0 6 )........................... 37Figure 3.2 Poor quality o f concrete, weak compressive strength (Boen, 2006a)................ 39Figure 3.3 Incorrect beam - column connection detail (Boen, 2006a).............. ................... 39Figure 3.4 Inertia force and relative motion within a building (IITK-BMTPC, 2002).... 41Figure 3.5 Simple plan shape buildings do well during earthquakes
(IITK-BMTPC, 2002)............................................................................................... 44Figure 3.6 Sudden deviations in load transfer path along the height lead to poor
performance o f buildings (IITK-BMTPC, 2002)................................................. 45Figure 3.7 Rope swings and buildings both swing back-and-forth when shaken
horizontally (the former are hung from the top, while the latter are raisedfrom the ground) (IITK-BMTPC, 2002)............................................................... 46
Figure 3.8 Even if vertical members are placed uniformly in plan o f building, moremass one side causes the floors to twist (IITK-BMTPC, 20 0 2 )........................ 47
Figure 3.9 Buildings have unequal vertical members; they cause the building to 42twist about a vertical axis (IITK-BMTPC, 2002 ).............................................. 48
Figure 3.10 One-side open ground storey building twists during earthquake shaking(IITK-BMTPC, 2002).............................................................................................. 48
Figure 3.11 Reinforced Concrete Building Design: the beams must be the weakest linksand not the columns (this can be achieved by appropriately sizing the members and providing correct amount o f steel reinforcement in them)(IITK-BMTPC, 2002)............................................................................................... 52
Figure 3.12 Basic components o f a masonry building: walls are sensitive to directionof earthquake forces (IITK-BMTPC, 2003)......................................................... 59
Figure 3.13 Advantage sharing between walls - only possible if walls are wellconnected (IITK-BMTP, 2003)................................................................... 59
Figure 3.14 Essential requirements to ensure box action in a masonry building(IITK-BMTPC, 2003).............................................................................................. 61
x

Figure 3.15 Regions o f force transfer from weak walls to strong walls in a masonry building: wall B1 pulls walls A1 and A2, while wall B2 pushes walls A1and A2 (IITK-BMTPC, 2003) ............................................................................ 62
Figure 3.16 Horizontal bands in masonry building: Improve earthquake-resistance(IITK-BMTPC, 2003)...................................................................... 63
Figure 3.17 Bending and pulling in lintel bands: Bands must be capable o f resistingthese (IITK-BMTPC, 2003)................................................................................. 64
Figure 3.18 Horizontal Bands in masonry buildings: RC bands are the best(IITK-BMTPC, 2003)............................................................................................ 65
Figure 3.19 Sub-units in masonry building - walls behave as discrete units duringearthquakes (IITK-BMTPC, 2003)...................................................................... 66
Figure 3.20 Earthquake response o f a hipped roof masonry building; no verticalreinforcement is provided in walls (IITK-BMTPC, 2003)............................... 66
Figure 3.21 Vertical reinforcement in masonry walls - wall behaviour is modified(IITK-BMTPC, 2003) ........................................................................................ 67
Figure 3.22 Cracks at comers o f openings in a masonry building - reinforcementaround them helps (IITK-BMTPC, 2003).......................................................... 68
Figure 3.23 Infill walls move together with the columns under earthquake shaking(IITK-BMTPC, 2003)............................................................................................ 70
Figure 3.24 Two distinct designs o f buildings that result in different earthquakeperformances-columns should be stronger that beams(IITK-BMTPC, 2003).............................................................. 71
Figure 3.25 Location and amount of vertical stirrups in beams-limit on maximumspacing ensures good earthquake behaviour (IITK-BMTPC, 2003)............... 73
Figure 3.26 Details o f lapping steel reinforcement in seismic beams(IITK-BMTPC, 2003)............................................................................................ 73
Figure 3.27 Placing vertical bars and closed ties in columns; column ends andlap lengths are to be protected with closely spaced ties(IITK-BMTPC, 2003)............................................................................................ 75
Figure 3.28 Pull-push forces on joints cause two problems-these result in irreparablein joints under strong seismic shaking (IITK-BMTPC, 2003 )........................ 76
Figure 3.29 Closed loop steel ties in beam-column joint: such ties with 135° hookedresist the ill effect o f distortion o f joints (IITK-BMTPC, 20 0 3 )..................... 77
Figure 3.30 Anchorage o f beam bars in interior joints; diagrams (a) and (b) showcross sectional views in plan o f joint region (IITK-BMTPC, 2003)............... 78
Figure 3.31 Upper storeys o f open ground storey buildings move together as a singleblock; such buildings are like inverted pendulums (IITK-BMTPC, 2003).... 79
Figure 3.32 Buildings with short columns - two explicit examples o f commonoccurrences (IITK-BMTPC, 2004)....................................................................... 80
Figure 3.33 Short columns are stiffer and attract larger forces during earthquakes;this must be accounted for in design (IITK-BMTPC, 2004 )............................ 81
Figure 3.34 Short columns effect in RC buildings when partial height walls adjoincolumns; the effect is implicit here because infill walls are often treated asnon-structural elements (IITK-BMTPC, 2004).................................................. 82
Figure 3.35 Details o f reinforcement in a building with short column effect in somecolumns (IITK-BMTPC, 2004)............................................................................ 83
Figure 3.36 The wide gap between earthquake facts and the existence o f seismic codes . 93Figure 4.1 Seismic risk management approach (SCEC, 2002).......................................... 102Figure 4.2 Three important factors of effective seismic risk management
of non-engineered buildings.................................................................................. 116Figure 4.3 SATLAK organisational structure (Ngoedijo, 2003)........................................ 122Figure 5.1 The procedure used to develop elements in ‘the first draft o f the framework5 156
xi

Figure 5.2 ‘The first draft o f the proposed framework’ complemented by three importantfactors o f effective seismic risk management o f non-engineered buildings.... 170
Figure 6.1 Simplistic term o f research process (Naoum, 1998)........................................... 173Figure 6.2 Design for the research............................................................................................ 179Figure 8.1 The result ’ fho’ coefficient from SPSS software
between Contractors and Forem en............................. 237Figure 8.2 The result o f ’rho’ coefficient from SPSS software
between Group A and Group B .............................................................................. 238Figure 8.3 NV ivo screen display of the nodes created from the interview.................................... 255Figure 8.4 Putting multidisciplinary stakeholders together as agents o f change
to share the seismic risk o f non-engineered buildings........................................ 258Figure 8.5 Comparison between ’the first draft o f the framework’ and ’the second
draft of the framework’ ................................................................................. 261Figure 9.1 Workshop program: activities prior to and during the w orkshop..................... 276Figure 9.2 NV ivo screen display of the nodes created from the workshop event........................ 274Figure 9.3 Fundamental elements to achieve change in the effective seismic risk
reduction of non-engineered buildings................................................................. 284Figure 10.1 NV ivo screen display of the nodes created from the two workshop events................ 299

LIST OF TABLES
Page
Table 2.1 Global occurrence o f earthquakes (USGS, 2004d)........................................... 16Table 2.2 The 10 largest recorded earthquakes in the world from 1900 to 26 Dec 2004
(USGS, 2004c)......................................................................................................... 17Table 2.3 International comparison of earthquake disasters, over the past ten y e a rs 19Table 2.4 Summary o f significant earthquakes in and around Indonesia 1996 - 2006
(USGS, 2004c)........................................................................................................ 25Table 3.1 Examples o f seismic features, for many non-engineered house ty p es 54Table 3.2 Examples o f seismic features, for many engineered house ty p es ................... 86Table 3.3 Common seismic features for masonry and reinforced concrete.................... 90Table 4.1 Similarities between Wideman’s and TBSC’s risk management
approaches (Wideman, 2004 and TBSC, 2001)................................................. 97Table 5.1 Framework for Guiding and Monitoring Disaster Risk Reduction
(ISDR, 2003 )............................................................................................................ 133Table 5.2 Framework for Reducing the Earthquake Threat in the Kathmandu Valley,
Nepal (ADPC, 2000)............................................................................................. 138Table 5.3 Framework for Urban Earthquake Vulnerability Reduction in India
(MHA, 2004)............................................................................................................ 143Table 5.4 Characteristics to ‘seismic hazard analysis’ ...................................................... 157Table 5.5 Indicators to ‘seismic hazard analysis’ ............................................................... 157Table 5.6 Characteristics to ‘seismic risk assessment’ ...................................................... 157Table 5.7 Indicators to ‘seismic risk assessment’ ............................................................... 158Table 5.8 Characteristics to ‘policy and planning’ ............................................... 158Table 5.9 Indicators to ‘policy and planning’ ...................................................................... 158Table 5.10 Characteristics to ‘legal and regulatory framework’ ........................................ 159Table 5.11 Indicators to ‘legal and regulatory framework’ ................................................. 159Table 5.12 Characteristics to ‘organizational structures’ ..................................................... 159Table 5.13 Indicators to ‘organizational structures’ ...................... 160Table 5.14 Characteristics t o ‘resources’ ................................................................................ 160Table 5.15 Indicators t o ‘resources’ ........................................................................................ 160Table 5.16 Characteristics to ‘information management and communication’ ................ 160Table 5.17 Indicators to ‘information management and communication’ ........................ 161Table 5.18 Characteristics to ‘education and training’ ............................................................. 161Table 5.19 Indicators to ‘education and training’ ................................................................. 161Table 5.20 Characteristics t o ‘public awareness’ .................................................................. 162Table 5.21 Indicators t o ‘public awareness’ ....................................... 162Table 5.22 Characteristics t o ‘research’ .................................................................................. 163Table 5.23 Indicators t o ‘research’ .................................... 163Table 5.24 Characteristics to ‘social and economic development practices’ ................... 163Table 5.25 Indicators to ‘social and economic development practices’ ............................ 163Table 5.26 Characteristics t o ‘physical measures’ ................................................................ 164Table 5.27 Indicators to ‘physical measures’ ......................................................................... 164Table 5.28 ‘The first draft of the proposed framework’,
consisting o f fifty-seven pairs o f characteristic-indicators................................ 164Table 6.1 Some differences between quantitative and qualitative research
(Naoum, 1998)......................................................................................................... 175Table 7.1 Profiles o f interviewees from various stakeholder organisations................... 205Table 7.2 Some refinements for the research design after conducting the pilot study ... 216
xiii

Table 8.1 Number and rate o f response by category ....................................................... 221Table 8.2 Raw data o f foremen’s opinion to seismic risk management statem ents 223Table 8.3 Summary o f average respondents’ mean scores and percentage o f
’don’t know’ responses............................................................................................. 224Table 8.4 Summary o f average respondents’ ranks................................................................. 225Table 8.5 Fifteen most important seismic risk management statem ents.............................. 228Table 8.6 Fifteen least important seismic risk management statem ents....... ..................... 229Table 8.7 Calculation of Spearman ‘rho’ correlation between contractors and foremen . 235Table 8.8 The overall correlation coefficient (rho) among respondents............................ 237Table 8.9 Summary and exploratoiy analysis o f the additional ideas .......................... 239Table 8.10 Profiles of the interviewees..................................................................................... 243Table 8.11 The refinements for the pairs of characteristic-indicators numbers 1,38,
and 57 ......................... 256Table 9.1 Profiles of the workshop participants.......................................................... 265Table 9.2 The distribution comments from the participants, which are related to
the 57 statem ents....................................................................................................... 270Table 9.3 The four additional ideas collected from the workshop even t........................... 271Table 9.4 The six new ideas collected from the workshop even t........................................ 272Table 9.5 Establishing the validity o f the workshop findings.............................................. 273Table 9.6 The refinements for ’the second draft of the framework’ .................................. 279Table 10.1 Some of the characteristics of Yogyakarta City and Bengkulu C ity ................. 288Table 10.2 The number o f people who were invited and those who participated in
the workshop events................................................................... 290Table 10.3 Distribution o f feedback collected in accordance with 63 pairs of
characteristic-indicators in the Yogyakarta W orkshop........................................ 295Table 10.4 Distribution of feedback collected in accordance with 63 pairs of
characteristic-indicators in the Bengkulu W orkshop............................................ 296Table 10.5 Four additional ideas in relation to the 63 statem ents................................. 297
xiv

LIST OF APPENDICES
Appendix-1:
Appendix-2:
Appendix-3:
Appendix-4:
Appendix-5:
Appendix-6:
Appendix-7:
Appendix-8:
Critical value o f p (rho) at various levels o f probability (Spearman rank correlation coefficient) (Naoum, 1998)(Appendix page: 1)
Survey questionnaire (Appendix page: 2-8)
Copy of some questionnaire circulation permits from organisations and/or agencies(Appendix page: 9-18)
Raw data o f questionnaire survey (Appendix page: 19-29)
The final framework for guiding and monitoring seismic risk reduction o f non-engineered buildings in Indonesia (Appendix page: 30-36)
Copy of Indonesian newspaper article (Appendix page: 37)
Copy of poster publication (Appendix page: 38)
Miscellaneous (Appendix page: 39-44)
xv

Chapter I Research Introduction
The principal aim o f this chapter is to guide and familiarise the reader with the purpose and
the subject area o f the research study. In order to identify the research problem statement, the
chapter begins with an explanation about global concerns, ranging from earthquake
implications to non-engineered buildings, as to the biggest cause o f human deaths and
injuries during strong earthquakes. It then focuses on the description o f the problem and its
context; this introduces the subject itself and also the importance o f reducing seismic risk in
Indonesia, focusing on such non-engineered buildings. Subsequently, aim and objectives of
the project are outlined, together with the significance o f the research and an overview o f the
research methodology. The final section provides a guide to the thesis and the summary
section.
1.1 Research Focus
An earthquake is a sudden, rapid shaking o f the Earth caused by the breaking and shifting of
rock beneath the Earth's surface. The National Earthquake Information Center (NEIC USA)
locates about 50 earthquakes each day or about 20,000 a year (USGS, 2004a). The infamous
Indian Ocean Indonesian Aceh’s Earthquake on 26th December 2004 (located off the West
Coast o f Northern Sumatra, Indonesia) was the 5th largest earthquake recorded in the world
since 1900 (USGS, 2004c). At the present time, scientists cannot predict precisely when and
where an earthquake will occur (BSSC, 1995). Although earthquakes cannot be prevented,
modem science and engineering provide tools that can be used to reduce their effects, based
on the fact that much o f the damage caused by earthquakes is predictable and preventable
(USGS, 2004b). Broadly speaking, predicting earthquakes may be difficult, but preparing for
disaster is not.
1

Several thousand earthquakes have occurred throughout the world, and populations have
witnessed massive deaths and a series of costly and damaging outcomes. The Asian Disaster
Preparedness Center (cited by BAPPENAS, 2006) comments that, certainly over the past ten
years, such massive death tolls have not been necessary from a technical and scientific point
o f view. These disasters include: the 1999 Turkish earthquake, with a death toll o f 17,127
people; the 2001 Indian earthquake, with 20,005 deaths; the infamous Indian Ocean
Indonesian earthquake and tsunami in 2004, with more than 225,000 deaths across 12
nations (165,708 deaths in Indonesia alone); the 2005 Pakistani earthquake with 73,338i
deaths, and again, in 2006, Indonesian Yogyakarta’s earthquake with 5,716 deaths. With
growing populations and infrastructures (high-rise buildings, bridges, apartments, pipelines,
communication towers, and other utilities), earthquakes pose a greater hazard to people’s
lives and communities than ever before. A few hundred years ago, even large earthquakes
could go unnoticed but now even a small earthquake is often felt by thousands o f people.
Based on such field investigations from past earthquakes, the majority o f damage caused by
the ground shaking has been inflicted on buildings and houses, poor in design and
construction, in both developing and developed countries. Most earthquake-related deaths
and injuries have resulted from the collapse o f such buildings. Almost all o f them have been
non-engineered buildings, particularly in developing countries (Mansouri et al., 2002;
Sarwidi, 2001; and Blondet, 2003). In 2000, the Indonesian Bengkulu earthquake affected
42,342 houses, damaging around 1,386 (IUDMP, 2000). In 2004, the Indian Ocean
Indonesian Aceh earthquake (together with tsunami) caused around 127,000
buildings/houses to be completely destroyed (BAPPENAS, 2005b). While the Indonesian
disaster manager was still sympathising with the Aceh survivors in a reconstruction process
following the Aceh earthquake, a second severe ground shaking hit Yogyakarta and Central
Java on 27 May 2006, and left 156,662 private houses totally destroyed and 202,031
damaged (BAPPENAS, 2006). Most o f the collapsed or heavily damaged buildings and
houses were non-engineered, masonry constructions, with or without a reinforced concrete
frame, in particular, those built by medium-low income communities or medium-low cost
housing. On the other hand, the few buildings that were constructed according to seismic
codes were able to survive the earthquakes. This evidence is similar to the findings from
other developing countries (Mansouri et al., 2002).
The lesson learned from Yogyakarta’s earthquake in 2006 brings home very forcefully the
fact that a great disaster occurred in a densely populated area, which did not have
earthquake-resistant constructions. Based on the Indonesian Seismic Zonation, clearly
2

Indonesia has large cities located in high seismic zones. It is found that almost 60% of the
cities and urban areas are located in the relatively high to very high seismic zone, around 290
cities out o f 481 cities in Indonesia (IUDMP, 2001). Constructions in these major cities are
not earthquake resistant, as reported by CEEDEDS (2004).
According to the huge number o f earthquake occurrences, the large amount o f building
damage after any quake and the concentration o f population in cities in and around Indonesia,
it can be widely seen that cities in Indonesia face a great earthquake hazard, threatening all
elements o f community life. As a result, earthquake disaster mitigation activities in the cities
should be strengthened immediately; there is no need to delay implementing comprehensive
earthquake disaster management plans in these cities. Tomorrow’s risk is today’s challenge.
1.2 Rationale for the Research Topic
A non-engineered building is an unsystematically designed, built, and supervised structure.
These buildings are usually constructed by traditional builders and/or building owners, using
common traditional approaches without intervention by qualified architects and engineers in
their design and construction. In Indonesia, non-engineered buildings dominate most
residential areas, are constructed of heavy materials such as masonry or multi-storey,
reinforced concrete, and are built up to two stories high (CEEDEDS, 2004). Most o f the loss
o f life in the past earthquakes has occurred due to the collapse o f these buildings. It is well
accepted amongst many engineers that earthquakes do not kill people; it is unsafe
construction of buildings that kills people as a result o f earthquakes.
Some of the evidence has shown that non-engineered buildings are still being constructed by
self-build owners, builders, and local engineers within medium-low-income populations in
Indonesia, due to demographic pressure (Sarwidi, 2001). Although these buildings will
slowly be replaced by those o f more reliable construction, it is widely accepted that they will
remain the single greatest source o f existing seismic risk for the foreseeable future. This
gives a stronger urgency to introduce seismic resistance for both existing and new buildings,
as it is imperative to reduce death tolls in future earthquakes.
In order to introduce seismic features in buildings, seismic codes have been generally
developed and are mature and well-known in countries with high seismic, areas. Seismic
resistance in the codes helps to improve the behaviour o f structures, so that they may
3

withstand earthquake effects at the appropriate levels o f ground motion. Proper
implementation o f seismic codes in structures created to be earthquake-resistant buildings
covers four virtues: good structural configuration, adequate lateral strength, adequate
stiffness, and good ductility. These standards and regulations do not ensure that structures
suffer no damage during earthquakes o f all magnitudes, but, to the best possible extent, they
ensure that structures are able to respond to earthquake shakings o f moderate intensities
without structural damage, and o f heavy intensities without total collapse (IITK-BMTPC,
2003). In Indonesia, the seismic codes for practical implementation o f residential houses
have been developed since 1978 (Boen, 1978). The newest formal seismic code for ordinary
buildings (SNI-1726-2002) was launched in 2002.
Although the seismic codes clearly exist in countries to save lives and human suffering,
earthquakes still continue to cause tragic events with high death tolls (Comartin et al., 2004).
Obviously, it is widely accepted that there is a broad gap between the existence o f seismic
codes and recent earthquakes with massive deaths. Many o f the deaths could have been
reduced, even avoided, if the implementation o f seismic codes had been properly employed.
The implementation of the seismic codes in actual construction is paramount as the key to
ensuring earthquake safety, particularly within non-engineered buildings, which are
responsible for massive death tolls during earthquakes (Shah, 2002 and IITK-BMTPC, 2003).
In fact, seismic risk reduction through the implementation o f seismic codes in construction is
not simply physical and technical intervention (Petak, 2002); it comprises all forms of
activities, multidisciplinary stakeholders, and citizens o f different levels o f understanding,
commitment, and skill, including structural and non-structural measures. Broadly speaking,
Wenzel (2006) mentions that slow progress in disaster risk reduction is due to five main
impediments: (1) poor governance structures, (2) lack o f a multi-sectoral, inter-disciplinary
work culture, (3) inefficient use o f resources, (4) lack o f awareness and poor knowledge o f
risk, (5) poor professional standards and ethics. These are the most critical challenges facing
a community living in a high seismic hotspot. Based on good practice in countries, the
implementation o f seismic codes can be achieved through an approach o f seismic risk
management, which includes: (1) seismic hazard analysis, (2) seismic risk assessment, and,
(3) economic and political actions (seismic response) within all aspects o f community life
(SCEC, 2002).
Adopted from Charette (2002), seismic risk management can be described as a systematic
process o f using administrative decisions, organisation, operational skills, and capacities to
4

implement policies and strategies for society and communities to lessen the impacts of
seismic hazards and related environmental and technological disasters. Seismic risk
management should be seen as advanced preparation and anticipation o f possible adverse
future seismic events, rather than responding as they happen. Generally, seismic risk
management is pro-active. Some countries have employed integrated seismic risk
management, embracing multidisciplinary stakeholders, with successful results (SCEC,
2002; UNDP, 2004; DFID, 2004; EERI, 1999; and IDEA, 2005).
The view that disasters are temporary disruptions to be managed only by humanitarian
response, or that their impact will be reduced only by some technical intervention, has long
been replaced by the recognition that they are intimately linked with sustainable
development (UNDP, 2004 and UN-ISDR, 2002). Clearly, physical exposure itself as a
result o f development does not explain, nor automatically lead to, increased risk. If urban
growth in a hazard-prone location is accompanied by adequate building standards and urban
planning that takes into account risk considerations, disaster risk can be managed and even
reduced. Therefore, seismic risk management should be factored into everyday decision
making in development planning; a shared responsibility and shared efforts are needed to
reduce the impact o f future earthquakes.
At present, disaster management programs in Indonesia are mostly oriented to provide
response actions during disasters, are hardly ever involved in risk management actions, and
furthermore, are not connected to an integral paradigm o f sustainable development
(Ngoedijo, 2003). Obviously, recognition of seismic risks as part and parcel o f development
planning can address some seismic risk management problems in Indonesia. At the same
time, the full range o f technical, social, cultural, and political consideration is evolving, and
links with different fields and various stakeholders introduce new challenges. Each multi
sector stakeholder apparently approaches the issue from a different perspective, brings new
practices, and has certain aspirations, which need to be harmonised to create the right
mixture of seismic risk management initiatives. At the moment, current advances in
information technology provide timely access to, and ease in transmission of, information
within the systems, and significantly increase the range o f interactions among individuals,
within organisations, and between sets o f organisations in reference to a common event or
problem (Comfort, 2002). Dissemination o f good practices and results can also encourage
more commitment to seismic risk reduction; however, what has been achieved is not
systematically assessed, recorded, and monitored (ISDR, 2003). As a result, the outcomes
from seismic risk reduction are not yet supported by hard evidence. Furthermore, “what
5

works and what does not work, and why” are not adequately known for informed advocacy,
policy decision, or strategic planning.
These facts suggest that a widely agreed framework for guiding and monitoring seismic risk
reduction can help to harmonise and systematise the field o f integrated seismic risk
management in order to implement seismic codes for non-engineered buildings in actual
construction. Such a framework could also constitute the necessary backbone to collect
information and data and capture good practices. It could also help to analyse trends in
seismic risk reduction practices, and identify gaps and constraints for informed decisions
(ISDR, 2003). The importance o f developing an integrated framework for seismic risk
reduction is also emphasised by Shah (2002), Petak (2002), and IDEA (2005).
It is definitely true for Indonesia that there appears to be a notable absence o f any attempts to
guide and monitor seismic risk reduction o f non-engineered buildings in the integrated
framework, at either a national or local level. The framework development could be a first
step towards an integrated seismic risk management approach to reduce risk
comprehensively in Indonesia. The proposed framework as a risk management tool offers a
powerful means o f changing policy and practice for Indonesian communities exposed to
seismic risk; this is a new research area in Indonesia and will also contribute to the seismic
risk management practices in developing countries. Moreover, the framework development
is also in response to "the Istanbul Declaration on Human Settlements" (Habitat II) drafted
on 14 June 1996, which underscores ‘the right for everyone to adequate housing and the
universal goal to provide safer, healthier, and sustainable human settlements’.
It must be emphasised, however, that the proposed framework is not the ultimate solution to
all problems related to the implementation o f seismic codes in the domain o f non-engineered
construction. Nevertheless, it is a tool or stepping stone which can be used to streamline
individual, organisation, and agency involvement objectives, to make them more productive,
efficient, and effective for all elements o f shared responsibility and shared efforts to reduce
seismic risk. The framework may be seen as a living document to be regularly reviewed and
modified as issues emerge, knowledge expands, and capacities change. Furthermore, it is
very important to disseminate the value o f the framework as a tool benefiting all parties to
achieve change permanently. Above all, the ultimate goal o f this research project is to save
lives and prevent human suffering due to the collapse o f non-engineered buildings during
strong earthquakes in the future.
6

1.3 Research Aim and Objectives
The principal aim o f the research is to develop an integrated framework for guiding and
monitoring seismic risk reduction o f non-engineered buildings in Indonesia via a risk
management approach. A key advantage in using a risk management approach in relation to
seismic risk is that it ensures seismic risk reduction o f non-engineered buildings is managed
as part o f wider decision-making. In sequence with the aim of the research, the objectives of
the research are as follows.
a. to study and list some seismic features in building;
b. to study and analyse good practices o f seismic risk management in specific countries;
c. to perform an in-depth evaluation of the implementation o f disaster management
activities in Indonesia;
d. to study, analyse, and evaluate three existing frameworks in disaster reduction around
' the world;
e. to develop a novel framework for guiding and monitoring seismic risk reduction o f non-
engineered buildings in Indonesia;
f. to review and validate the proposed framework for its application in two Indonesian
cities, located in high seismic areas.
In line with ISDR (2003), generally, the proposed novel framework is expected to (a)
provide a basis for effective political advocacy, (b) reflect the multidimensional and inter
disciplinary nature o f seismic risk reduction, (c) assist a wide range o f users in determining
roles, responsibilities, and accountabilities, and (d) provide a basis for setting goals and
targets. Chapter IV will explain this matter in detail.
1.4 Significance of the Research
Many integrated seismic risk management activities have already been deliberately studied
and employed in countries with excellent achievements (SCEC, 2002; UNDP, 2004; DFID,
2004; EERI, 1999; and IDEA, 2005). In contrast, unsystematic disaster management in
Indonesia commonly exists (Ngoedijo, 2001), even in seismic risk management areas.
Therefore, this study, which aims to develop a novel framework for guiding and monitoring
seismic risk reduction o f non-engineered buildings, is currently one o f novel research,
combining a seismic risk and integrated risk management approach in Indonesia. The
proposed framework differs from existing frameworks in other countries because it
7

comprehensively identifies the core issues that underpin the understanding and practice of
seismic risk reduction in Indonesia specifically; it: (a) focuses on non-engineered buildings,
(b) involves many Indonesian active and multidisciplinary stakeholders in order to represent
shared risk and adopt or adapt to their specific circumstances, (c) uses methodologies based
on local resources so that the approaches are common and the solutions are local, providing a
new form o f solidarity and respecting cultural differences, (d) incorporates the poverty factor,
as a common problem in developing countries. Accordingly, the proposed framework will be
based on true and authentic Indonesian resources.
Moreover, the findings o f this work may be useful in considerably assisting communities to
reduce seismic risk o f non-engineered buildings against future earthquakes in Indonesia.
Here, the term ‘community’ means a broad audience composed o f both those who have little
specific knowledge about building regulations, seismic phenomena, design, and engineering
and also those who are somewhat familiar with these concepts. This research refers to a
critical investigation and evaluation, which has extended and led to a significant independent
and original contribution to wider knowledge in the seismic risk management research area
in developing countries by theory development sections, as presented in Chapters VII and IX.
Furthermore, it could also be used to effectively mitigate the possible consequences o f
earthquakes by presenting balanced information in order to introduce seismic features on
non-engineered buildings.
1.5 Overview of the Research Methodology
Generally, based on the absence o f an integrated framework for disaster management in
Indonesia, the principles within the proposed framework were drawn heavily from wider
literature, the existing frameworks in other countries, and from the contributions o f those
who took part in the study; these contributions reveal the current conditions in Indonesia and
are tailor-made for the needs and requirements of the multidisciplinary stakeholders. A brief
research methodology is simply presented in Figure 1.1.
8

- ''F irs t Draft of the Frameworl
Second Draft of the Frameworl
Final Framework
= process
Conclusions= output or input
Pilot Study
Postal Questionnaire Survey and Interview
Framework Validation through 2 Workshop Events
Framework Refinement through Workshop Event
Review of Both Literature and Existing Frameworks
Figure 1.1 A brief research methodology
Firstly, a review of literature related to: earthquake definitions, lessons learned from past
earthquakes in both developed and developing countries, frameworks o f seismic implications,
and the situation in Indonesia was carried out to gain a clear understanding o f the causes o f
high death tolls during past earthquakes. The review encompasses literature from reference
books, project reports, seminar proceedings, and journals on web-sites, which provide up-to-
date information describing (1) why non-engineered buildings suffered most during past
earthquakes, (2) the implementation o f seismic risk management approaches around the
world, and (3) the implementation o f disaster management in Indonesia. These issues were
explored to satisfy research objectives a, b, and c. The literature review mentioned above
was intended to demonstrate a comprehensive grasp o f existing knowledge in relation to the
research subject. Furthermore, in addition to the categories o f literature already mentioned,
existing frameworks in disaster management around the globe were studied, analysed, and
evaluated to fulfil the research objective d. These steps were able to list some emerging
issues for primary data investigation; this was then called ‘the first draft o f the proposed
framework’.
9

Following the desk-based analysis o f the literature and the existing frameworks, research
methodology was elaborated, and then a pilot study was carried out. The pilot study was
conducted in order to refine the data collection plans as described in the research
methodology section. The next phase was primary data collection. The method of data
collection was justified primarily by the findings o f the pilot study. The first and foremost
data collection plan was a postal questionnaire survey, which was conducted by circulating
the questionnaire to multidisciplinary stakeholder representatives who live in high seismic
areas in Indonesia. Furthermore, an interview data collection method was conducted in order
to find the causality behind the postal questionnaire findings. Combining the questionnaire
survey and interviews generated 'the second draft o f the framework'. Next, the final
framework as the aim of the research (as precisely described in objective e) was achieved
through a multidisciplinary stakeholder workshop event. In order to achieve a robust
framework, the following two workshop events were held to review and validate the
proposed framework developed in the previous stages in order to accomplish objective f. The
final stage o f the research was to draw some conclusions. The data collected was analysed
with the use of a computer aided software programme i.e. SPSS. Specifically for qualitative
data, NVivo software was utilised. Details o f the research methodology are covered in
Chapter VI.
1.6 Guide to the Thesis
This thesis is organised into eleven chapters, which correspond with the research process
stages. A brief guide from Chapter II to Chapter XI is as follows:
Chapter II presents a comprehensive description about earthquake activities, their
implications, and the current situation in Indonesia. This involves critically appraising what
other people have written about earthquakes, from both developing and developed countries.
Chapter III focuses specifically on the relationship between non-engineered buildings and
the existence of seismic codes, beginning with a definition o f a non-engineered building. It is
followed by a description o f building behaviour during an earthquake then moves on to
elaborate some seismic features in building. The final section o f the chapter presents the
wide gap between massive deaths and the existence o f seismic codes.
10

Chapter IV covers many aspects o f the integrated seismic risk management approach and
good practice in certain countries. An in-depth evaluation o f current disaster management
programmes in Indonesia is given in the middle of the chapter, and then the final part
presents the importance of developing an integrated novel framework for guiding and
monitoring seismic risk reduction o f non-engineered buildings (SRRNEB) in Indonesia.
Chapter V describes the evaluation of three existing frameworks in disaster management
around the world, and emergent issues arising from the review o f literature and existing
frameworks, referred to as ‘the first draft o f the proposed framework’.
Chapter VI outlines the research methodology adopted for the project. Selected methodology
is based on research objectives and issues, which are identified from the literature and world
wide existing frameworks. It covers in detail the research process, different methodological
concepts and approaches and the strength, and weakness of different methods. Based on the
comprehensive introduction, the chapter then outlines the methodological framework for this
project and justifies the methods selected. The research design section o f the chapter presents
the structure o f the data collection plans and analysis phase o f the project and covers in detail
the procedures and the criteria for various choices made.
Chapter VII outlines the pilot study for the research in order to refine the data collection
plans, with respect to both the contents of the data and the procedures.
Chapter VIII reports on the data gathered from multidisciplinary stakeholders and examines
their views and perspectives. The foremost data collection method is via a postal
questionnaire survey and series o f interviews. This is followed by data analysis, for refining
‘the first draft of the proposed framework’ into ‘the second draft’.
Chapter IX elaborates the data collected from the workshop event and its analysis in order to
refine ‘the second draft o f the proposed framework’ into ‘the final framework’. This chapter
constitutes the final stage o f the primary data collection phase in the thesis. The result
analysis o f the workshop constitutes a major part o f the chapter.
Chapter X performs the validation o f ‘the final framework’ presented in Chapter IX.
Chapter XI presents the conclusions drawn from the research work, which covers all the
phases including the thorough review of literature and existing frameworks, data collection,
11

and its analysis. The chapter also identifies the limitations o f the research based on the fact
that, despite an attempt to provide a full perspective on most o f the more important issues,
coverage cannot be exhaustive in a single study. Finally, a recommendation for further
research in the area o f integrated seismic risk management is presented.
1.7 Summary
This chapter presents a strong rationale for, and the direction of, the research project.
Beginning with the definition o f an earthquake and the massive death tolls during past
earthquakes and based on lessons learned over time, it was followed by the definition o f a
non-engineered building. Next, it went on to introduce an integrated risk management
approach in order to reduce seismic risk and describes the importance o f developing an
integrated framework for guiding and monitoring SRRNEB as a starting point to reduce
seismic risk in Indonesia, since in Indonesia, there appears to be a notable absence o f any
attempt in the integrated framework to reduce seismic risk o f non-engineered buildings. The
aim and objectives of the research were covered in the middle o f the chapter as a guide to the
research direction. The significance o f the research, the overview of the research
methodology, and the guide to the thesis were described at the end o f the chapter. As
outlined above, the following chapter will present a thorough review o f literature in relation
to the research project.
12

Chapter II Earthquake Activities, Their Implications, and
Situation in Indonesia
This chapter provides extensive facts and figures about earthquakes, their implications, and
the current situation in Indonesia through an in-depth review of existing literature. This study
will explore current opinion that earthquakes are natural, devastating phenomena and their
impact remains a significant challenge to all community life. This understanding excludes
the view that earthquake disasters are ‘acts o f God’ or external forces beyond any sort of
possible human control or mitigation and praying to God is the primary solution to
catastrophic hardship. The next section o f this chapter introduces the definition o f an
earthquake, earthquake facts and statistics, and an earthquake implications framework.
Lessons learned from past earthquakes are also covered in detail. The chapter concludes with
an outline o f the high seismic areas o f Indonesia.
2.1 What is an Earthquake?
For hundreds of millions of years, the forces caused by the movement o f tectonic plates have
shaped the Earth. These tectonic plates are the large, thin, relatively rigid plates that move
relative to one another on the outer surface of the Earth (see Figure 2.1). Tectonic plates
form the Earth's surface and move slowly over, under, and past each other at different speeds
from those o f the neighbours. Sometimes the movement is gradual. At other times, the plates
are locked together, unable to release the accumulating energy. When this energy grows
sufficiently strong, the plates break free, causing the ground to shake, which is usually called
an earthquake (FEMA, 2004). Broadly speaking, an earthquake is a sudden, rapid shaking o f
the Earth caused by the breaking and shifting o f rock beneath the Earth's surface. They may
occur at any time of year, day or night, with sudden impact and without any warning sign.
Extensive research has been conducted in recent decades but there is no accepted method of
predicting when and where an earthquake will occur (BSSC, 1995). Most occur at the
boundaries where the plates meet; however, some earthquakes occur in the middle o f plates.
Most upheavals occur at depths o f less than 80 km (50 miles) from the Earth's surface.
13

Figure 2.2 depicts world seismicity from 1975 to 1995, which shows that most sources of
earthquakes are at the boundaries where the plates meet:
y v NORTH AMERICAN J & \ X7 . plat5 \ / y EURASIAN
PL ATEEURASIAN PI ATE
JUAN D£ FUCA PE ATIF' CARIBBEAN
r' V? (HATE sPHILIPPINEPtATI ARABIANPLATE
COCOSPLATECTAMTOR
AFRICANPLATENAZCA
PLATEPACIFICPL A T E SOUTH A M E R IC A N
^ , plateAUSTRALIAN PLATE JAUSTRALIAN
P U T E
SCOTIA PLA Tt-
A NTARCTICPLATE
Figure 2.1 Earth tectonic plates (USGS, 2004a)
Depth (km)
Note: *) The depth below the surface of the focus of an earthquake.
Figure 2.2 World seismicity from 1975 to 1995 (USGS, 2004c)
14

In the earthquake zone, there is a commonly used term: the ‘Ring o f Fire’. The ‘Ring of Fire’,
technically called the Circum-Pacific belt, is the zone of earthquakes surrounding the Pacific
Ocean; about 90% of the world's earthquakes occur there (see Figure 2.3). Indonesia is one
of the countries within the Ring of Fire. The next most seismic region (5-6% of earthquakes)
is the Alpide belt (extending from the Mediterranean region, eastward through Turkey, Iran,
and northern India (USGS, 2004a)).
Figure 2.3 The Ring of Fire (USGS, 2004a)
2.2 The Strength of Earthquakes - M agnitude and Intensity
The magnitude of an earthquake is a quantitative measure of the actual size of the earthquake
and is assigned as a figure on numerical scales. These numerical magnitude scales have no
upper and lower limits; the magnitude of a very small earthquake can be zero or even
negative. There are many magnitude scales, and one commonly used is the Richter Scale. An
increase in magnitude (M) of 1.0 implies a 10 times higher waveform amplitude and about
31 times higher energy released. For instance, energy released in a M7.1 earthquake is about
31 times that released in a M6. 7 earthquake, and is about 1,000 (~31x31) times that released
in a M5.7 earthquake. Most of the energy released goes into creating heat and fracturing the
rocks, and only a small fraction of it (fortunately) goes into the seismic waves that travel
large distances, causing a shaking of the ground en-route and hence, damage to structures
(IITK-BMTPC, 2002). The magnitude is the same no matter where you are, or how strong or
weak the shaking is in various locations.
15

Earthquakes are often classified into different groups based on their size; the annual average
number o f earthquakes across the Earth in each o f these groups is shown in Table 2.1. It
indicates that, on average, one ‘great earthquake’ occurs each year.
Table 2.1 Global occurrence o f earthquakes (USGS, 2004d)
Group Magnitude Annual average number
Great 8 or higher 1Major 7 - 7 .9 18Strong 6 - 6 .9 120
Moderate 5 - 5 .9 800Light 4 - 4 .9 6200 (estimated)Minor 3 - 3 .9 49000 (estimated)
Very minor < 3.0 M2-3: ~1000/day; M l-2: ~8000/day
Large earthquakes at great distances can produce weak motions that may not damage
structures or even be felt by humans; yet, sensitive instruments can still record them. From
an engineering viewpoint, however, only actual shaking at a particular location that could
possibly damage structures is o f interest. This can happen with earthquakes in the vicinity or
even with large earthquakes at reasonable medium to large distances.
Intensity is a qualitative measure o f the actual shaking at a location during an earthquake,
and is assigned as Capital Roman Numerals. This value does vary according to location and
the motion at any site on the ground is random in nature. There are many intensity scales;
one commonly used is the Modified Mercalli Intensity (MMI) Scale. The scale ranges from I
(least perceptive) to XII (most severe). The intensity scales are based on three features o f
shaking - perception by people and animals, performance o f buildings, and changes to
natural surroundings.
Intensity o f earthquake waves at a particular building location depends on a number o f
factors, including the magnitude o f the earthquake, the earthquake distance, and the type o f
ground that the earthquake waves travelled through before reaching the location o f interest.
Shaking is more severe (about twice as much) at the Earth's surface than at substantial depths.
This is often the basis for designing structures buried underground for smaller levels o f
acceleration than those experienced above the ground (IITK-BMTPC, 2002).
16

2.3 E arthquake Facts and Statistics
2.3.1 E arthquake O ccurrences
The United States Geological Survey (USGS) estimates that several million earthquakes
occur in the world each year. Many go undetected because they hit remote areas or have very
small magnitudes. The National Earthquake Information Center (NEIC) USA now locates
about 50 earthquakes each day or about 20,000 a year. Table 2.2 shows the 10 largest
recorded earthquakes in the world from 1992; two of them occurred in Indonesia.
Table 2.2 The 10 largest recorded earthquakes in the world from 1900 to 26 Dec 2004(USGS, 2004c)
Location Date Magnitude Coordinates
1. Chile 22 May 1960 9.5 38.24 S 73.05 W2. Prince William Sound, Alaska 28 March 1964 9.2 61.02 N 147.65 W3. Andrean of Islands, Alaska 09 March 1957 9.1 51.56N 175.39 W4. Kamchatka 04 Nov 1952 9.0 52.76 N 160.06 E5. Off West Coast of Northern Sumatra, Indonesia 26 Dec 2004 9.0 3.30 N 95.78 E6. Off the Coast of Ecuador 31 Jan 1906 8.8 1.0 N 81.5 W7. Rat Islands, Alaska 04 Feb 1965 8.7 51.21 N 178.50 E8. Assam - Tibet 15 Aug 1950 8.6 28.5 N 96.5 E9. Kamchatka 03 Feb 1923 8.5 54.0 N 161.0 E10. Banda Sea, Indonesia 01 Feb 1938 8.5 5.05 S 131.62 E
2.3.2 E arthquake Implications
Ground shaking from earthquakes can collapse buildings and bridges, disrupt gas, electric,
and phone services, and sometimes trigger landslides, avalanches, flash floods, fires, and
huge destructive ocean waves (tsunamis). Buildings with foundations resting on
unconsolidated landfill and other unstable soil and homes not tied to their foundations are at
risk because they can be shaken off their mountings. When an earthquake occurs in a
populated area, it may cause deaths and injuries and extensive property damage. Earthquakes
have long been feared as one of nature’s most terrifying and devastating phenomena (BSSC,
1995).
Earthquake damage to the built environment is caused by a number o f factors. FEMA (2001)
has developed a framework o f earthquake effects, specifically inland. The framework starts
with ground shaking (see Figure 2.4). Then, ground shaking can generate ground failure such
17

as landslides and liquefaction (a process by which sediments below the water table
temporarily lose strength and behave as a viscous liquid rather than a solid (EERI, 1999)).
p irec jj’hysjcajj3amage_
Induces Physical, Damage Direct Economic/Social Losses
Fire Debris Casualties Shelter EconomicInundation HazardousMaterial
Indirect Economic Losses
General Building Stock
Lifelines-UtilitySystems
G round M otion
Lifelines-TransportationSystems
Essential and High Potential Loss Facilities
G round Failure
Figure 2.4 The framework of earthquake effects inland caused by both the ground shakingand ground failure (FEMA, 2001)
Both ground shaking and ground failure can cause direct physical damage to buildings,
facilities, and lifeline systems. The direct physical damage can then induce other physical
damage such as fire, inundation, hazardous material, and debris and can cause direct and
non-direct economic and social losses. The indirect economic losses might be an additional
cost due to damage or collapse o f buildings, such as the cost o f shelter, broken property, and
major fire.
Ground movement during an earthquake is seldom the direct cause o f death or injury. Most
earthquake-related deaths and injuries result from collapsing walls and falling objects as a
result o f the ground shaking. Although earthquakes cannot be prevented, modem science and
engineering provide new ways o f tackling them and limiting their effects, based on the fact
that much of the damage in earthquakes is predictable and preventable (USGS, 2004b).
18

The main concern caused by earthquakes is the number o f deaths. There are several thousand
earthquakes throughout the world, and people have witnessed massive deaths and a series of
costly and damaging outcomes. The Asian Disaster Preparedness Center (cited by
BAPPENAS, 2006) highlights that, over the past ten years, it has not been necessary from a
technical and scientific point o f view to see such massive death tolls, as presented in Table
2.3:
Table 2.3 International comparison of earthquake disasters, over the past ten years
Country Disasterevent
Date Numberkilled
D am age & losses (US$ m illion)
D am age & losses (US$ m illion, 2006
constant prices)
Turkey Earthquake 17 Aug 1999 17,127 8,500 10,281India
(Gujarat)Earthquake 26 Jan 2001 20,005 2,600 2,958
Indonesia(Aceh)
Earthquake & tsunami
26 Dec 2004 165,708 4,450 4,747
Pakistan Earthquake 5 Oct 2005 73,338 2,651 2,947Indonesia
(Yogyakarta& Central Java)
Earthquake 27 May 2006 5,716 3,134 3,134
Sources: Asia Disaster Preparedness Center, Thailand; ECLAC, EM-DAT, World Bank (cited by BAPPENAS, 2006)
2.4 Lessons Learned from E arthquake Damage
Every year, people around the globe can see the increasingly lethal effects o f earthquakes.
Because of the growing increase in the population and hence, infrastructure (high-rises,
bridges, apartments, pipelines, communication towers, and other utilities), earthquakes pose
a greater hazard to people’s lives and communities than ever before. A few hundred years
ago, even large earthquakes could go unnoticed, but now even a small earthquake is often
felt by thousands o f people. A major earthquake in a sparsely populated area, for example, is
a natural phenomenon, not a hazard. Yet, when this natural ground shaking interacts with
vulnerable man-made buildings and fragile infrastructures, this disruption o f normal
activities due to the natural strong jolting has the potential to cause widespread damage.
The earthquake engineering profession has learnt more from the performance o f man-made
structures during earthquakes than from laboratory tests or from analytical studies.
Damaging earthquakes provide excellent full-scale test results on real-life structures; such
results involve no modelling errors or approximations. Moreover, the results are for
19

everyone to see and no sophisticated interpretation o f results by the “experts” is required.
Lessons learned from earthquake damage will present many explanations for damage regions,
such as Indonesia, Iran, and Philippines, which represent developing countries, and Taiwan
and USA, which represent developed countries.
The Indonesian Bengkulu earthquake took place on 4 June 2000. The earthquake affected
42,342 houses, 711 school buildings, 325 government offices, 3 university buildings, and
357 places o f worship. The damage caused to the buildings varied from total collapse
(around 1,386), heavy damage, and light damage (IUDMP, 2000).
On 26th December 2004, an earthquake and tsunami - the world’s worst natural disaster at
the dawn of this new century - struck the Indian Ocean region, killing more than 165,708
people in Indonesia alone, made almost a million people homeless, and sent a wave o f shock
across the globe, resulting in an outpouring o f sympathy and worldwide offers o f assistance.
Indonesia bore the brunt o f the disaster, concentrated in the Provinces o f Aceh and North
Sumatra. Hundreds o f communities were washed away. In many cities and villages, the
tsunami painted a line o f destruction across the landscape. But the wounds on the other side
were devastating as well, as the people of Aceh and North Sumatra were severely
traumatised by the scale o f the tragedy. The total estimated damage and loss amounted to
97% o f Aceh Province’s GDP/Gross Domestic Product. The highest damages and losses
were in the building/housing sector. Around 127,000 buildings/houses were completely
destroyed, leaving around 600,000 people homeless. Furthermore, about 152,000 housing
units suffered damage estimated at 50% o f their value. Private/residential houses suffered
most, with damage 500 times higher than buildings in the public sector (BAPPENAS,
2005a).
While the Indonesian nation was still grappling with widespread demands for reconstruction
following the Aceh earthquake, a second major earthquake struck Yogyakarta City on Java
island (the most densely populated island in Indonesia) and its surrounding areas, on 27th
May 2006. Private homes were the hardest hit, i.e. 156,662 totally destroyed and 202,031
damaged (Figure 2.5). This figure was far beyond the Aceh earthquake. Due to the series of
disasters occurring around Indonesia, the area has faced situations whereby limited resources
earmarked for development projects have had to be diverted to aid recovery and
construction. Does this indicate that currently Indonesia is living in a constant state of
recovery and reconstruction instead o f development?
20

Figure 2.5 An area with almost completely collapsed buildings and houses caused by the Yogyakarta earthquake in 2006 (BAPPENAS, 2006)
Regarding the above three Indonesian earthquakes, building or home damages and losses
dominated in number. It was clear in the Bengkulu and Yogyakarta earthquakes that most of
the collapsed or heavily damaged buildings and houses were of a non-engineered origin,
made of heavy materials, masonry constructions, with or without a reinforced concrete frame,
in particular, those built by medium-low-income communities or low cost housing (IUDMP,
2000 and Boen, 2006a).
Based on field investigations in regions damaged by strong earthquakes such as Changureh,
Iran on 22nd June 2002, immediately after the jolts, buildings and houses suffered the most
damage. The main cause of the devastating destruction was due to poor design/construction
(Figure 2.6) and the selection of poor building materials. Conversely, the few buildings that
were constructed according to the Iranian building code were able to survive the earthquake
(Mansouri et al., 2002).
21

Figure 2.6 Total collapse of the house due to poor design/construction and building materials after the Changureh earthquake (Mansouri et al., 2002)
Many residents of the historic city of Bam, Iran were still sleeping when the Magnitude 6.6
earthquake struck on 26th Dec 2003. Their traditional mud-brick and clay homes put up little
resistance to the violent shaking, and as walls and roofs crumbled and collapsed, tens of
thousands o f victims were trapped beneath the rubble. According to recent reports, the death
toll reached 41,000, with a final expected figure closer to 45,000. The Government of Iran
estimated that a further 45,000 people were displaced from their homes, which may have
risen to 75,000 as residents staying elsewhere with friends and relatives began to return
(Adams et al., 2004).
Although there was an updated building code that was comparable to the Uniform Building
Code (UBC) of the United States and was also used by Iranian civil engineers, the
application of this code was limited primarily to the larger cities of Iran. In villages, there
was typically no standard for the seismic design and/or construction of buildings. Villagers
tend to build their own houses at minimal cost and with minimal safety measures in place.
The Qazvin region is prone to earthquakes, with its most recent event occurring 39 years ago.
That earthquake affected the Booeen Zahra region with devastating results. Unfortunately,
little has changed in terms of the design or construction of village houses in that region,
compared to those that were damaged then, 39 years ago (Mansouri et al., 2002).
A further example was seen on 16th July 1990, in an earthquake in the Philippines; about 90
percent of building stock in areas affected by the earthquake were non-engineered, designed
22

and built by private homeowners, carpenters, and other non-professional builders. A large
majority o f those structures were residential buildings (Corpuz, 1990).
On 21st September 1999, the "Chi-Chi" earthquake struck the central region o f Taiwan with a
magnitude o f Ms = 7.6 (Richter scale). A large percentage o f buildings that collapsed due to
the main shock or strong aftershocks were non-engineered, one-to-three stories reinforced
concrete frame structures constructed with brick in-fill partitions and exterior walls. Many
collapsed buildings had a pedestrian corridor and an open front at the ground floor, and only
one wall at the back o f the building along the direction o f the street. This type o f damage
accounts for the majority o f the complete building collapses near the epicentre due to severe
ground shaking. However, in the "Chi-Chi" earthquake, more than 7,000 damaged buildings
that were constructed according to the building code were able to survive the earthquake
(Figure 2.7) and remained standing in and around the epicentre (Bruneau and Tsai, 2003).
irfLLttcrn
Figure 2.7 A building in the epicentral area, built with better construction techniques,after the "Chi-Chi" earthquake
On the morning o f the 20th April 2002, an earthquake struck at 6:50 a.m., approximately 15
miles southwest of Plattsburgh, New York. The USGS reported a preliminary magnitude o f
5.1. Plattsburgh is located in New York State's Adirondack Mountain region, an area of
relatively frequent seismic activity. There were reports o f minor damage in the epicentre area.
A bridge was damaged in Jay, New York, and road damage was reported in Keeseville, New
York. A chimney was reported damaged in Lake Placid, and a window and foundation were
cracked in Au Sable Forks, New York (USGS, 2004f).
23

Based on such field investigations above, it is clear that buildings and houses, which are poor
in design and construction, suffer the majority o f damage caused by the ground shaking in
both developing and developed countries. Most earthquake-related deaths have resulted from
the collapse o f such buildings. Almost all were non-engineered buildings, which are
spontaneously and informally constructed in the traditional manner. House owner is very
much involved, and skilled technicians (engineers and architects) are generally not
participated in their design and construction. They almost certainly have not been designed
and constructed to resist earthquakes. The detail definition o f non-engineered building will
be presented in Chapter III. On the other hand, the few buildings that were constructed
according to seismic codes were able to survive the earthquakes.
In conclusion, it is widely agreed that there is a strong correlation between loss o f life and
the collapse o f non-engineered buildings around the world. Non-seismic resistance o f non-
engineered buildings is the underlying cause for the increase in losses from earthquake
disasters. Hence, this research will focus on the risk posed by and to non-engineered
buildings in earthquakes and the steps that can be taken, through building regulation and
voluntary design education, to reduce this risk. Beyond the risk to life is the economic and
social disruption caused by an earthquake; even moderate earthquakes can result in the loss
o f many homes, jobs, investments, and community resources.
2.5 The Situation in and around Indonesia
Tectonically, the Indonesian archipelago is one o f the most active areas in the world,
commonly called as ‘The Ring o f Fire’ (see Figure 2.3). It has a typical four junction plate
convergence (Australian plate in the South, Eurasian plate in the Northwest, Philippine plate
in the North, and Pacific plate in the East) leading to the complicated geological and tectonic
mechanisms of the region (see Figure 2.1). In addition, Indonesia suffers the highest number
o f potential volcano eruptions. Taken from earthquake data recorded by USGS (2004e) USA,
earthquake occurrences in and around Indonesia (Indonesia, Philippines, Australia, and New
Zealand) are depicted in Figure 2.8:
24

Depth (km)*
*) the depth below the surface o f the focus o f an earthquake
Figure 2.8 Seismicity in Indonesia, Philippines, Australia, and New Zealand 1977-1997(USGS, 2004e)
The significant earthquakes in and around Indonesia from 1996 to 2006 are summarised in
Table 2.4:
Table 2.4 Summary of significant earthquakes in and around Indonesia 1996 - 2006(USGS, 2004c)
Year The number of significant
earthquakes
The biggest magnitude (Richter)
Region struck by the biggest magnitude & comments
2006* 13 7 .7 SOUTH OF JAVA, INDONESIAFour-hundred and thirteen people killed, 2,741 injured and 15 missing in Ciamis; 62 people killed, 6,124 injured and 2 missing in Tasikmalaya; 15 people killed and 244 injured at Banjar; 1 person killed and 30 injured in Garut. At least 1,540 buildings damaged or destroyed, 176 boats destroyed and many roads damaged in Jawa Barat. Felt (IV) at Bandung, Jakarta, Pangandaran and Tasikmalaya.
2005 20 8.6 NORTHERN SUMATRA, INDONESIAAt least 1,000 people killed, 300 injured and 300 buildings destroyed on Nias; 100 people killed, many injured and several buildings damaged on Simeulue; A 3 meter tsunami damaged the port and airport on Simeulue. Felt (VIII) at Gunungsitoli and (VII) at Telukdalem, Nias. Felt (VI) at Banda Aceh and (V)at Medan, Padang and Palembang; (IV) at Jambi; (III) at Bengkulu
2004 22 9 OFF WEST COAST OF NORTHERN SUMATRA, INDONESIA.The death toll from the earthquake and tsunamis across 12 nations (Indonesia, India, Srilanka, Thailand, Somalia, Maldives, Malaysia, Myanmar, Tanzania, Seychelles, Bangladesh, Kenya) has approached 200,000, with Indonesia worst affected (125,000 death), followed by Sri Lanka, India, and Thailand,
25

Table 2.4 continued
2003 18 7.2 SOUTH ISLAND OF NEW ZEALANDMinor damage in Otago and Southland. Chimneys fell and walls cracked at Dunedin, Invercargill and Te Anau. More than 200 landslides were observed and minor damage occurred to park infrastructure in Fiordland National Park.
2002 16 7.7 SOUTH OF THE FIJI ISLANDSFelt at Suva. Also felt in the Auckland area, New Zealand.
2001 20 7.5 a. MINDANAO, PHILIPPINESFelt at Butuan. Felt (III) on Temate and at Manado, Sulawesi, Indonesia.
b. BANDA SEA, INDONESIAFelt (IV) at Kendari and Raha, Indonesia.
2000 33 6.8 SOUTHERN SUMATRA, INDONESIAAt least 103 people killed, 2,174 injured, extensive damage (VI) and landslides in the Bengkulu area; minor injuries and damage on Enggano. Felt (IV) in Lampung Province and at Paiembang. Felt (III) at Jakarta, Jawa. Felt in much of southern Sumatra. Felt throughout Singapore. Also felt at Johor Bahru, Kuala Lumpur
1999 23 6.5 a. LUZON, PHILIPPINE ISLANDS.One person killed at Masinloc. Four people died from heart attacks and 40 injured on Luzon. Damage to structures (VIIRF) at Santa Cruz; (V IRF) at Iba, Manila and Masinloc. Felt (VI RF) at Clark Air Base, Olongapo and San Fernando; (V RF) at Dagupan, Pasig, Quezon and Taguig; (IV RF) at Baguio, Lucban, Malolos,
b. TAIWAN.At least 2,297 people killed, 8,700 injured, 600,000 people left homeless and about 82,000 housing units damaged by the earthquake and larger aftershocks. Maximum intensity (VIJMA) in Nan-tou and Tai-chung Counties. Half of a village was lost by subsidence into the Ta-an Hsi and landslides blocked the Ching-shui Hsi, creating a large lake. Two other lakes were created by substantial ground deformation near the epicenter. Surface faulting occurred along 75 km of the Chelungpu Fault. Felt (V JMA) at Chia-i and Man; (IV JMA) at Kao-hsiung, Taipei and Tai-tung.
c. NEW BRITAIN REGION, PAPUA NEW GUINEAFelt on New Britain. Also felt at Port Moresby, New Guinea.
1998 29 6.6 MINDANAO, PHILIPPINE ISLANDSItems knocked from shelves (IV RF) at General Santos. Felt (IV RF) on Samal; (III RF) at Butuan, Davao and Kidapawan; (II RF) at Bislig, Cagayan de Ore and Cotabato; (I RF) at Zamboanga. Felt in much of Mindanao. Two events about 2.5 seconds apart.
1997 17 6.7 SOUTH OF FIJI ISLANDSFelt at Wellington, New Zealand. Complex earthquake, with Two events occurring about 6 and 12 seconds after the onset.
1996 23 6.6 FLORES SEA, INDONESIASome damage at Kupang, Indonesia. Felt at Larantuka andMaumere, Indonesia. Also felt in the Kota Kinabalu area,Malaysia. Complex event.
*) in 2006, the most tragic earthquake event was in Yogyakarta, Java on 6.3 Richter. At least 5,749 people were killed, 38,568 were injured and as many as 600,000 people were displaced in the Bantul-Yogyakarta area. More than 127,000 houses were destroyed and anadditional 451,000 were damaged in the area, with the total loss estimated at approximately 3.1 billion U.S. dollars. Felt (IX) at Bantul and Klaten, (VIII) at Sleman and Yogyakarta, (V) at Surakarta, (IV) at Salatiga and Blitarand (II) at Surabaya. Felt in much of Java. Also felt at
. Denpasar, Bali.
From Table 2.4, it can be assumed that the significant earthquakes in and around Indonesia
were in the range o f 13 to 33 occurrences, with an average o f about 25 per year. It can be
seen that there were many people killed, injured, missing, or homeless after the quakes.
Many buildings were damaged or destroyed, and landslide and ground cracks were reported
at several locations in the affected areas. The Bengkulu, Aceh, and Yogyakarta earthquakes
clearly demonstrated the seismic vulnerability o f Indonesia areas. Yet, there are many
26

significant earthquakes that hit remote areas and/or the sources have great distances, so there
is no further information about the effect of the quakes.
The Center for Earthquake Engineering, Dynamic Effect, and Disaster Studies (CEEDEDS),
Islamic University of Indonesia, Yogyakarta, has organised field investigations in regions
damaged by strong earthquakes, immediately after the jolts. Those investigation included:
1998 Blitar, 2000 Banggai, 2000 Bengkulu, 2000 Sukabumi, 2000 Banjarnegara, 2000
Pandeglang, 2001 Yogyakarta, and 2001 Majalengka (see Figure 2.9) (Sarwidi, 2001); also,
the Yogyakarta earthquake 2006 (see Figure 2.10). In addition, CEEDEDS has also
organised seminars, discussions, and other activities related to earthquake engineering issues.
Findings of those investigations and other relevant activities showed that non-engineered
buildings dominated in number and always suffered most, although there was a different
percentage in each damaged area. Casualties and damage to property were mostly caused by
the failure of non-engineered residential buildings (far less public buildings failed) due to
ground shaking. The CEEDEDS investigation result was in line with earthquake damage in
other countries, particularly in developing countries (Mansouri et al., 2002).
Figure 2.9 Residential building damaged after the Majalengka Indonesia earthquake in 2001(Sarwidi, 2001)
27

Figure 2.10 New retail building damaged after the Yogyakarta earthquake in 2006
The lessons learned from the Bengkulu and Yogyakarta earthquakes bring home very
forcefully the fact that, due to inland earthquakes, great disasters occurred in cities where
most of the buildings or houses were not constructed to be earthquake-resistant. Based on
Indonesian Seismic Zonation, Indonesia has large cities located in high seismic zones. It is
found that almost 60% of the cities and urban areas are located in the relatively high to very
high seismic zone, totalling around 290 out of 481 cities in Indonesia (IUDMP, 2001).
Constructions in these major cities are not earthquake resistant, as reported by CEEDEDS
(2004).
According to the huge number of earthquake occurrences and extensive building damage
after quakes, and the concentration of the population in cities in and around Indonesia, it can
be seen that cities in developing countries such as Indonesia and the Philippines pose a
greater earthquake hazard to lives and communities than cities in developed countries such
as New Zealand and Taiwan. As a result, earthquake disaster mitigation activities in the
cities should be increased immediately. There is no need to delay implementing
comprehensive earthquake disaster management plans in cities.
28

2.6 Seism ic M apping o f Indonesia
As a seismic prone region, the data compiled by national and international foundations
showed that the total number o f earthquakes occurring in Indonesia between 1897 and 1999
with Magnitude >5.0 were approximately 8,237, of which about 5 percent occurred around
Jawa Island, the most densely populated island in Indonesia (PLN Enjineering, 2003).
According to the seismic prone region of Indonesia, in 2001 the Geological Research and
Development Centre (GRDC), Indonesia, arranged T h e Earthquake Hazard Susceptible
Map of Indonesia’, which was compiled on the basis of the highest intensity figure or the
highest level of destruction resulting from earthquake events. The magnitudes of the
intensity and the level of destruction depend largely on a number of factors, e.g. distance
from the earthquake source and the geology of the area. The closer the distance to the source,
the higher the intensity figure and the more severe the destruction (see Figure 2.11):
Banda Aceh
Manado
Ternate
f - Gorontalo'
Padang
JayapuraAmbonJakarta
Bengkulu
YogyakartaKupangMataram
Figure 2.11 Earthquake hazard map of Indonesia (GRDC, 2001)
Places on the map which have a similar degree o f intensity or a similar level of destruction
are represented by an isoseismic line; this map, therefore, indicates or defines places or
regions of an equal level of destruction. The intensity scale used in the map is the Modified
Mercalli Intensity (MMI), with a range of intensity from I (lowest intensity) to XII (highest
intensity).
The seismic zone maps are revised from time to time, as further data and understanding are
gained of the geology, the seismotectonics, and the seismic activity in the country. This 2001
29

seismic zone map is not the final word on the seismic hazard o f the country, and hence, there
can be no sense o f complacency in this regard.
The national Seismic Zone Map presents a large-scale view of the seismic zones in the
country. Local variations in soil type and geology cannot be represented at that scale.
Therefore, for important projects, such as a major dam or a nuclear power plant, the seismic
hazard is evaluated specifically for that site. Also, for the purposes o f urban planning,
metropolitan areas are microzoned. Seismic microzonation accounts for local variations in
geology and local soil profile.
As shown in Figure 2.11, there were 12 national capital cities in 2001 that had a high level of
earthquake hazard, in which it was possible for the ground to shake on a scale o f more than 6
MMI. In Figure 2.11, the zones are indicated by the colour red. The cities are Yogyakarta,
Mataram, Banda Aceh, Manado, Gorontalo, Bengkulu, Kupang, Padang, Temate, Palu,
Ambon, and Jayapura. Among the 12 cities, the most densely populated city is Yogyakarta
(BPS, 2003). It is also indicated that there are high concentrations o f buildings and
infrastructure at Yogyakarta City. In other word, Yogyakarta poses the greatest risk to its
population in the event o f a strong earthquake because o f high population density and a high
level of earthquake hazard.
Obviously, according to the map, the high seismic exposure o f cities in Indonesia has been
fully recognised by key government staff in GRDC, a few researchers, and specialists since
1998, but it is not widespread among local practitioners or community members as a whole.
It would seem that the persistence o f Bengkulu, Aceh, Yogyakarta, and other Indonesian
communities not to implement strategic measures to cope with the existing huge seismic risk
was because critical information and knowledge about earthquake data and its seismic map
remained in the hands o f a few experts and was never disseminated to all community
member, agencies, and organisations in those affected areas. The public institutions, the
people and the whole community seem to have a low awareness o f that risk and o f affordable
means to reduce it and neglect the risk, leading to unpreparedness toward disaster. As a
result, the outcome of the Aceh earthquake and tsunami in 2004 was unnecessary: 165,708
people dies and around 127,000 houses totally collapsed. Again, the Yogyakarta earthquake
in 2006 tragically caused a further 5,716 unacceptable deaths and destroyed 156,662
residential houses and other constructions.
30

In conclusion, earthquakes are a real fact and also a threat for most Indonesian communities.
This threat is inherently related to Indonesian geology; therefore, Indonesians should realise
that the existence o f seismic risk is unavoidable, and they should learn to live harmoniously
with the risk in their everyday lives because an earthquake may happen at any time without
any warning. As both people and seismic risk become attached to a place, Indonesian
communities should be able to develop a sense o f belonging and feel at home there, with the
place being an anchor for his or her identity; this is inextricably linked to lives and activities.
It is a very basic human need to feel attached to the landscape and community, to feel valued
by friends and family, and to feel secure in all the things that make life truly meaningful.
This term of sense o f place is referred from Covenry and Dutson (2006) and Lynas (2007).
Moreover, it would be ideal if there was enough historical data about earthquakes and
existing conditions in the cities to fit a model and its parameters in order to estimate the
probability o f losses if the big ones come. Unfortunately, such data exists only in the hands
o f a very few key government staff or experts. Therefore, the availability o f current
earthquake data and the geology profile in Indonesia should be soon disseminated to the
local communities in order to enhance their awareness and encourage their active
participation in local decision making.
2.7 Summary
An earthquake is a sudden, rapid shaking o f the earth caused by the breaking and shifting of
rock beneath the earth’s surface. Earthquakes have long been feared as one o f nature’s most
terrifying and devastating events. Although earthquakes cannot be prevented, modem
science and engineering provides tools that can be used to reduce their effects, based on the
facts that much of the damage caused by earthquakes is predictable and preventable. The
main concern caused by earthquakes is the number o f deaths and injuries caused by the
collapse o f buildings, which are poor in design and construction in both developing countries
and developed countries. Almost all of them are non-engineered buildings. Conversely, the
few buildings that were constructed according to the modem building code were able to
survive the earthquakes.
On account o f its geological conditions, the Indonesian region is highly prone to earthquakes,
one o f the most destructive natural hazards, with the potential to inflict huge losses to lives
and property. Earthquakes pose a real threat to Indonesia, with almost 60% of cities and
31

urban areas located in the relatively high to very high seismic zone. The Bengkulu, Aceh,
and Yogyakarta earthquakes clearly demonstrated the seismic vulnerability o f Indonesian
areas. Findings from many of CEEDEDS’s investigations around Indonesia into earthquake
damage occurring after the jolts showed that non-engineered buildings dominated in number
and always suffered most. Casualties and damage to property were mostly caused by the
failure o f non-engineered residential buildings. This situation is very similar around the
globe, particularly in developing countries.
As Indonesia is an earthquake country, earthquake events are a real fact for Indonesian
communities. Therefore, they should be able to live harmoniously with the event by
developing a sense of place and incorporate the risk into everyday decision making. In
addition, the availability o f current earthquake data and the geology profile o f Indonesia
should soon be disseminated to local communities in order to enhance their awareness and
encourage their active participation in local decision making. The next chapter will describe
many aspects o f non-engineered buildings and the existence o f seismic codes.
32

Chapter III Non Engineered Buildings and Seismic Codes
Based on lessons learned from past earthquakes, Chapter II explained that the non-seismic
resistance o f non-engineered buildings is the weakest link amidst the urban landscape during
the strong, sudden onset o f a quake. The aim o f this chapter is to comprehensively examine
existing literature on non-engineered buildings and seismic codes. It begins, by explaining
precisely that non-engineered buildings are the biggest cause o f high death tolls during
earthquakes. In order to broadly understand such buildings, the following section presents
non-engineered construction practice and general information on building behaviour during
earthquakes, followed by the seismic design philosophy for buildings, building ductility, the
effect upon non-engineered and engineered buildings during earthquakes, and the existence
o f seismic codes. Furthermore, this chapter summarises a list o f seismic features in buildings,
based on the explanation mentioned above. Finally, this chapter will elaborate on the wide
gap between massive deaths and the existence o f seismic codes. The summary concludes this
chapter.
3.1 Non-Engineered Buildings and High Death Tolls During Earthquakes
Recently, strong earthquakes have occurred throughout the world. These earthquakes led to
several early developments in earthquake engineering. Some developed countries have an
excellent tradition o f scientifically studying earthquake shaking. Referring to the
performance of buildings during earthquake effects, man-made buildings can be classified
into two extreme groups, engineered and non-engineered. The engineered building is
systematically designed, built, and supervised using engineering approaches with the
participation o f competent professionals (Sarwidi, 2001). Conversely, the non-engineered
building is an unsystematically designed, built, and unsupervised structure. Those non-
engineered buildings are usually built by traditional builders and/or building owners using
common, traditional approaches. GREAT (2001) refers to non-engineered buildings because
often little or no engineering has gone into their design, and they almost certainly have not
been designed and constructed to resist earthquakes. Moreover, NICEE (2004) mentions that
non-engineered buildings are buildings which are spontaneously and informally constructed
33

in the traditional manner without intervention by qualified architects and engineers during
their design and construction, but which may follow a set of recommendations derived from
the observed behaviour o f such buildings during past earthquakes and trained engineering
judgement. Between the two extreme groups, there are buildings classified as semi
engineered; however, people usually incorporate semi-engineered building into non-
engineered building (Sarwidi, 2001). Therefore, the non-engineered buildings mentioned in
this study are buildings other than those conforming to the engineered definition.
Non-engineered buildings are usually constructed from traditional materials such as stone,
brick, adobe, and wood. Most o f these buildings are identified as low-rise buildings, up to
two storeys plus attic (GREAT, 2001). In Indonesia, non-engineered buildings dominate
most residential areas; houses are constructed o f one brick thick masonry without
reinforcements and half brick thick masonry, with or without reinforced concrete, up to two
storeys. Over the past 30 years, the latter has developed as ‘a new culture’ all over Indonesia:
i.e. half-brick thick masonry buildings, built with reinforced concrete framing, consisting o f
the so called “practical columns and beams” (Sarwidi, 2001 and Boen 2006). The driving
force behind the common use o f heavy materials is the high price of appropriate wood, as the
cost o f light weight material is now increasing significantly. However, Boen highlights that
if the new cultures o f heavy non-engineered buildings were built with good quality materials
and good workmanship, they would probably survive the strongest earthquakes in
accordance with the Indonesian seismic hazard map. In fact, the Bengkulu and Yogyakarta
earthquakes demonstrated that the majority o f buildings constructed under the new culture
were still not appropriately built for earthquake resistance, and only a very few were
constructed according to advisable seismic resistance procedures.
Due to the rapid economic growth in Indonesia as a developing country, it is clear that many
new buildings in cities are still needed to accommodate the large and increasing population.
This indicates that non seismic resistance o f non-engineered buildings is still being practised
by self-build owners, builders, and local engineers. Although these buildings will slowly be
replaced by those o f a more reliable construction, they will remain the majority o f total
building stock and will be the single greatest source o f existing seismic risk for the
foreseeable future, especially those masonry houses o f questionable structure, which are
mainly occupied by medium-low income families in Indonesia (IUDMP, 2002).
Statistically, the number o f non-engineered buildings is enormous. More than 95% of
buildings, the existing as well as new constructions in Nepal, including those in urban areas,
34

are built by owners using small-medium contractors who do not have any knowledge on
earthquake-resistance construction. In Manila, Philippines, more than 90% of the buildings
are non-engineered (Corpuz, 1990). Studying the quantitative number o f non-engineered
buildings at Yogyakarta City just before the 2006 earthquake, Sarwidi and Winamo (2006)
described that 93.5% of Yogyakarta City residential housing stocks were non-engineered
structures (see Figure 3.1). The percentage o f non-engineered houses made o f heavy
materials, i.e. one dr half-brick thick masonry buildings, was 84.8%, o f which 1% were the
very old houses without reinforcement and proper maintenance and the remainder seemed to
be ‘the new culture’ buildings. The percentage o f non-engineered houses built with
lightweight materials such as teak wood in traditional and historic houses, or other
lightweight materials elsewhere, was 8.7%. Some of them belong to the poorest o f the poor
and are made from very lightweight materials that, perhaps, may be able to resist strong
ground shaking and would also be less deadly if they collapse. The remaining 6.5% are the
engineered houses, which definitely belong to wealthy people.
Explanation in Chapter II has shown that the true nature o f the seismic risk has shown that
most o f the loss of life in past earthquakes has occurred due to the collapse o f those non-
seismic resistant buildings made o f heavy materials, in both developing and developed
countries, as described in Chapter II, Section 2.4 (Mansouri et al., 2002; Ellull et al, 2004;
Blondet, 2003; Corpuz, 1990; Lee et al., 2003; Sarwidi, 2001). Hence, this research will
focus on 'the new culture' non-engineered buildings made o f heavy materials, which tend to
be the majority o f building stock in Indonesia.
The strong correlation between the large number o f deaths and injuries and the collapse of
non-engineered buildings suggests it is imperative to introduce seismic resistance for both
existing and new non-engineered buildings in order to reduce death tolls in future
earthquakes. The ground shaking when earthquakes strike will not become a disaster if
communities have such measures to reduce the risk beforehand. The following section
mentions some understanding o f the building behaviours during earth-quake, seismic codes,
and other relevant issues compiled from many healthy literature.
3;2 Construction Practice in Non-Engineered Construction
In a simplified version o f the process, the management o f construction moves from the
investment appraisal study and then goes to design and planning stage. The last stage is the
35

construction process. Progression through the above construction stages is complex,
requiring a wide range of interrelated activities. Such complexity is, in fact, amplified by
many external factors. Better management o f the first stage will contribute to improvement
in the execution of the next stage. In engineered constructions such as high rise buildings, the
above stages are usually carried out in detail. The construction risk is already analysed from
the very beginning o f the whole process. Because the stages are usually developed within a
period o f time, the decision can therefore be determined from a comprehensive point o f view.
The advancement o f information technology and the utilisation o f many experts and
professionals maintain the quality o f the product they create. Moreover, government decision
makers are likely to arrange the policy and regulation in accordance with this high
investment in engineered construction.
On the other hand, construction practice on non-engineered buildings is totally different to
engineered ones. Usually, non-engineered buildings include the simple houses or low rise
buildings, where local builders, foremen, masons, carpenters, and small-medium contractors
are the main actors. In certain cases, the house owners act as the builders as well. Design and
planning stages are very rarely conducted in a systematic way. Sometimes, the construction
risk is considered as the process is going on. Lack o f training, standards, access to
information, and less attention to strict regulations are part o f this practice; most residential
houses in developing countries are built this way. Wealthy people, however, can hire
professional actors to build their houses, so the quality and structural integrity o f their
buildings can stay at a high level. Figure 3.1 describes a characteristic comparison between
non-engineered and engineered houses.
36

1. The2. The3. Cor4. Strii5. Wei6. Res7. Usu
Non-engineered houses made of lightweight materials (8.7%)(such as wood and other lightweight materials)1. Some of them belong to wealthy people for
which their houses are made of high quality of teak wood
2. Some of them belong to the poorest poor, and are made from very lightweight materials that, perhaps, may be able to resist strong ground shaking and would also be ■ less deadly if they collapse.
Non-engineered houses made of heavy materials (84.8%)(such as masonry with or without reinforced concrete framing)1. The construction actors are foreman, mason, carpenter, and medium-
small contractor, sometimes also the self built house owner2. Lack of training, standard, and information access are part of this
construction practice3. There is no details in design and planning4. Construction risk is considered as the process is going on5. Government regulation is often too loose to these houses6. The medium-low income population belongs to these houses7. Less attention is often given by researcher8. Political actors may see no clear financial benefit to think about these
houses9. Usually, these houses suffer most during strong earthquakes
Figure 3.1 A characteristic comparison between non-engineered and engineered houses in the Yogyakarta City (Sarwidi and Winarno, 2006)
Building simple or low rise houses is relatively uncomplicated and the project duration is a
short period. For example, building one house unit with a floor area of 36 n r can be
accomplished within 2-4 months, as the design for this type of house construction is not
complex. For the purpose of the seismic resistance of houses, the common design o f seismic
leered houses made of heavy materials (6.5%) nry with reinforced concrete framing) construction actors are experts and professionals
re are some details in design and planning istruction risk is analyzed and managed comprehensively igent regulation is always carried out to these houses althy people belong to these houses :earchers often focus on these buildings lally, these houses survive during strong earthquakes
of the
84.8%
37

resistance is now available in a simple manual on how to implement seismic resistance in a
simple structure. After the Aceh and Yogyakarta earthquakes, many organisations, agencies
and individuals made and distributed thousands o f such manuals to the affected areas. Also,
many electronic books and articles on a similar subject from many countries can be
downloaded from the internet. Through this approach, the seismic design time is reduced,
and then many seismic structural engineers are able to urge non-engineered construction
actors to focus on the construction process. If they build a house corresponding to the
manual, the building will comply with the advisable seismic features. Broadly speaking, the
tools to implement such seismic codes now truly exist in non-engineered construction
environments; thus, the most important issue is the construction process.
The construction process involves a physical covering procedure, from the foundations to the
walls, columns, floors, and roofing. All components should conform to the quality standard,
particularly to ensure structural integrity. However, various reconnaissance reports (Ellul et
al, 2004 and Sarwidi, 2001) and interviews with local practitioners such as those undertaken
in Majalengka, reveal some inadequate construction materials. Frequently, mortar and in-situ
concrete is batch mixed on site. Aggregate and sand are not washed or sieved and any water
source which is at hand is used in the mix. Such methods result in mixing by volume and not
by weight and therefore no account for moisture content is made. The resulting mortar and
concrete are generally o f poor quality, with a weak compressive strength (see Figure 3.2).
Additionally, it is poorly graded, compaction on site being inadequate, having a high water
content and aggregates over 30mm in size. Segregation and honeycombing are common,
whilst concrete cover to the reinforcement varies widely, though generally less than 25mm.
All reinforcement is generally smooth mild steel. Steel reinforcement ratios and details are
usually only adequate for gravity loading considerations, and include 90 degree hooks at
longitudinal bar ends (stirrups) and lap slice locations not suitable for laterally loaded
frames. All too often, there is incorrect beam - column connection detail (see Figure 3.3).
The volumetric ratio o f transverse steel is often less than 0.3% and therefore does not
provide the necessary tri-axial state of stress for the concrete core. The masonry infills vary
in form and material, ranging from hollow or solid clay bricks, cement and concrete blocks,
and hewn stones amongst others, generally laid in a cement mortar.
38

Figure 3.2 Poor quality of concrete, weak compressive strength (Boen, 2006a)
Figure 3.3 Incorrect beam - column connection detail (Boen, 2006a)
The quality of materials, in fact, depends largely on the knowledge o f the builders. Local
builders, foremen, masons, and carpenters continue to practise the traditional approach and
39

are often reluctant to accept new techniques. They feel that what they do is in line with their
belief and tradition, and there is no strict regulation which confronts their practices. In this
situation, many organisations have organised training for those actors. For example,
CEEDEDS (2001) conducted training for many foremen on how to implement seismic
features in simple houses, administered with the Government o f Japan. CEEDEDS believes
that the role o f foreman is important in the existence o f non-engineered buildings, because
they are in the front line during the construction process. Frequently, the house owners hire
the foremen to build their houses by providing all labour forces, such as masons, carpenters
and non-skilled labour. In many cases, the masons and carpenters work directly on the house
construction without the involvement o f foremen. In common construction practice, the
foremen supply 95.63% of the labour force in the construction industry, because they have
knowledge o f a construction labour force who are not permanent workers in the construction
industry. During the construction process, the awarded contractor hires the foreman to
supply the labour force. When the construction ceases, the foremen, together with their
labour force, move to another construction site. Based on the present situation in Indonesia,
it would seem that the role o f foreman will continue to exist for years, perhaps even decades.
Build-Change NGO (Hausler, 2006) has also conducted training for technical assistance and
capacity building on local construction actors in Aceh. Build-Change is providing technical
expertise on design and construction o f earthquake resistant, culturally appropriate, and low-
cost houses.
Past experiences o f the collapse o f many non-engineered buildings give a stronger urgency
to change the non-engineered construction practice permanently. The tools to implement this
change are now widely available. It would seem that the greatest challenge is to improve the
skill o f people in the domain of the non-engineered construction sector. However, at the
moment, most o f the outstanding resources are prevalently used for the more formal sector,
such as the research and teaching of structural engineering which, however, does not study
or analyze in detail the structure o f the small residential masonry buildings. At the same
time, key government officials seem less enthusiastic to arrange a regulation to cultivate the
seismic resistance on non-engineered buildings in this sense, as they see no clear financial
and political benefit. Therefore, a combination o f skilled, non engineered construction actors
and the proactive involvement o f government and non-government organisations are
imperative in these circumstances to change construction practice. Everybody should bear in
mind that each brick laid in the construction process can either contribute to risk reduction or
become an enabler for the next big disaster.
40

3.3 B uilding B ehaviours during E arthquake Shaking
From Section 3.3 to 3.7 below, many more explanations are taken from Earthquake Tip 1-24
which were published from 2002 to 2004 by Indian Institute of Technology Kanpur and
Building Materials and Technology Promotion Council, India. The basic concept of
earthquake resistant construction through simple language which is described in Earthquake
Tip 1-24 is very helpful for and quite similar with Indonesian construction.
3.3.1 Inertia Forces in Buildings
During earthquake shaking, a building resting on ground will experience motion at its base.
From Newton’s First Law of Motion, even though the base of the building moves with the
ground, the roof has a tendency to stay in its original position. Since the walls and columns
are connected to it, they drag the roof along with them. This tendency to continue to remain
in the previous position is known as inertia. In the building, since the walls or columns are
flexible, the motion of the roof is different from that of the ground.
Inertia Force
R oof
w: 1 • \
•
\ \C olum n
wY\
Foundation
\ \ \ \\ \
S oil | |IB:* . ; * ' . * i!■ ’ n ' “ ’ i . . . . . . . . . . . . . . . . . . . . ■ V ' i ‘ " ■ i ‘ "■ ' I' >^y,kl,a • in ■ ‘.I r*
OiOlO:
Acceleration
Figure 3.4 Inertia force and relative motion within a building (IITK-BMTPC, 2002)
Consider a building whose roof is supported on columns (Figure 3.4), when the ground
moves, even the building is thrown backwards, and the roof experiences a force, called
inertia force. If the roof has a mass M and experiences an acceleration a , then from Newton’s
Second Law of Motion, the inertia force/IF is mass M times acceleration a , and its direction
is opposite to that of the acceleration. Clearly, more mass means a higher inertia force.
Therefore, lighter buildings resist the earthquake shaking better.
41

3.3.2 Effect of Deformations in Buildings
The inertia force experienced by the roof is transferred to the ground via the columns,
causing forces in columns. These forces generated in the columns can also be understood in
another way. During earthquake shaking, the columns undergo relative movement between
their ends. In Figure 3.4, this movement is shown as quantity u between the roof and the
ground. Yet, given a free option, columns would like to come back to the straight vertical
position, i.e., columns resist deformations. In the straight vertical position, the columns carry
no horizontal earthquake force through them. Yet, when forced to bend, they develop
internal forces. The larger is the relative horizontal displacement u between the top and
bottom of the column, the larger this internal force is in columns. It is true that the stiffer the
columns are {i.e., the column cross section is bigger), the larger is this force. For this reason,
these internal forces in the columns are called stiffness forces. In fact, the stiffness force in a
column is the column stiffness times the relative displacement between its ends.
3.3.3 Flow of Inertia Forces to Foundations
Under shaking o f the ground, inertia forces are generated at level o f the mass o f the structure
(usually situated at the floor levels). These lateral inertia forces are transferred by the floor
slab to the walls or columns, to the foundations, and finally to the soil system underneath. So,
each of these structural elements (floor slabs, walls, columns, and foundations) and the
connections between them must be designed to transfer safely these inertia forces through
them.
Walls or columns are the most critical elements in transferring the inertia forces. Yet, in
traditional construction, floor slabs and beams receive more care and attention during design
and construction than walls and columns. Walls are relatively thin and often made o f brittle
materials like masonry. They are poor in carrying horizontal earthquake inertia forces along
the direction of their thickness. Failures o f masonry walls have been observed in many
earthquakes in the past. Similarly, poorly designed and constructed reinforced concrete
columns can be disastrous.
3.3.4 Importance of Architectural Features
The behaviour o f a building during earthquakes depends critically on its overall shape, size,
and geometry, in addition to how the earthquake forces are carried to the ground. Hence, at
the planning stage itself, architects and structural engineers must work together to ensure that
the unfavourable features are avoided and a good building configuration is chosen.
42

A desire to create an aesthetic and functionally efficient structure drives architects to
conceive wonderful and imaginative structures. Sometimes the shape o f the building catches
the eye o f the visitor, sometimes the structural system appeals, and in other occasions both
shape and structural system work together to make the structure marvellous. However, each
o f these choices of shapes and structure has significant bearing on the performance o f the
building during strong earthquakes. The wide range o f structural damages observed during
past earthquakes across the world is very educational in identifying structural configurations
that are desirable versus those which must be avoided.
a. Size of buildings
In tall buildings with large height-to-base size ratio, the horizontal movement o f the floors
during ground shaking is large. In short but very long buildings, the damaging effects during
earthquake shaking are many. Moreover, in buildings with large plan area like warehouses,
the horizontal seismic forces can be excessive to be carried by columns and walls.
b. Horizontal layout of buildings
In general, buildings with simple geometry in plan (Figure 3.5a) have performed well during
strong earthquakes. Buildings with re-entrant comers, like those U, V, H and + shaped in
plan (Figure 3.5b) have sustained significant damage. Many times, the bad effects o f these
interior comers in the plan o f buildings are avoided by making the buildings in two parts. For
example, an L-shaped plan can be broken up into two rectangular plan shapes using a
separation joint at the junction (Figure 3.5c). Often, the plan is simple, but the columns/walls
are not equally distributed in plan. Buildings with such features tend to twist during
earthquake shaking.
43

Figure 3.5
c. Vertical layout of buildings
The earthquake forces developed at different floor levels in a building need to be brought
down along the height to the ground by the shortest path; any deviation or discontinuity in
this load transfer path results in poor performance of the building. Buildings with vertical
setbacks (like the hotel buildings with a few storeys wider than the rest) cause a sudden jump
in earthquake forces at the level of discontinuity (Figure 3.6a). Buildings that have fewer
columns or walls in a particular storey or with unusually tall storey (Figure 3.6b) tend to
damage or collapse which is initiated in that storey. Many buildings with an open ground
storey intended for parking collapsed or were severely damaged in most earthquakes.
Buildings on sloping ground have unequal height columns along the slope, which causes ill
effects like twisting and damage in shorter columns (Figure 3.6c). Buildings with columns
that hang or float on beams at an intermediate storey and do not go all the way to the
foundation, have discontinuities in the load transfer path (Figure 3.6d). Some buildings have
reinforced concrete walls to carry the earthquake loads to the foundation. Buildings, in which
these walls do not go all the way to the ground but stop at an upper level, are liable to get
severely damaged during earthquakes.
□ □□ □ □ □ □ □ a o a o n □ □ o □□□ □□ □ □□ □ □ □ □ □□□□□□□
□ □□ □ □ □□ □□ □ □ □□ □□ □ □ □□ □ □ □ □ a□ □□ □ □ □
ID □ □ □ □ □ □ □ □ □ p □□□□N □□□□
(b) Comers and Curves :: poor
(c) Separation joints make complex plans into simple plans
Simple plan shape buildings do well during earthquakes (IITK-BMTPC, 2002)
(a) Simple Plan good
44

□ □ □ □ □ O D D O OO D D D D D D O D D
Id d d d d d d d d d
[□ □ □ □ D O □ □ □ !□□□□□□□□□ □ □□□□□□□□I
(a) S e tb a ck s
/ m□ □ □ □ m L ——=zr□ □ □ □ m n _□ □ □ □ VA
f
UnusuallvTallS torey
(b) W eak or Flexible S to rey
a
l i(c) S lopy Ground (d) Hanging or Floating Colum ns
I I
I* I * i m f
Reinforced Concrete Wall D iscontinued in Ground S torey
(e) Discontinuing Structural M em bers
Figure 3.6 Sudden deviations in load transfer path along the height lead to poor performance of buildings (IITK-BMTPC, 2002)
In conclusion, of course, one will continue to make buildings interesting rather than
monotonous. However, this need not be done at the cost of poor behaviour and earthquake
safety of buildings. Architectural features that are detrimental to earthquake response of
buildings should be avoided. If not, they must be minimised. When irregular features are
included in buildings, a considerably higher level of engineering effort is required in the
structural design and yet the building may not be as good as one with simple architectural
features. Decisions made at the planning stage on building configuration are more important,
or are known to have made greater difference, than accurate determination of code specified
design forces.
45

3.3.5 Twisting in Buildings
Consider a rope swing, a wooden cradle tied with coir ropes to the sturdy branch of an old
tree that is tied identically with two equal ropes. It swings equally, when someone sits in the
middle of the cradle. Buildings too are like these rope swings; just that they are inverted
swings (Figure 3.7). The vertical walls and columns are like the ropes, and the floor is like
the cradle. Buildings vibrate back and forth during earthquakes. Buildings with more than
one storey are like rope swings with more than one cradle.
(a) Single-storey building (h) Three-storey building
Figure 3.7 Rope swings and buildings both swing back-and-forth when shaken horizontally (the former are hung from the top, while the latter are raised from the ground)
(IITK-BMTPC, 2002)
46

Twist
H eavy Side o f Build ing
Light S id e o f B uild ing
□ □ □ □ □. □ ' □ □ □ □□ □ □ □ O□ □ □ □ □
Earthquake Ground Shaking
Figure 3.8 Even if vertical members are placed uniformly in plan o f building, more mass on one side causes the floors to twist (IITK-BMTPC, 2002)
Again, let us go back to the rope swings on the tree: if someone sits at one end of the cradle,
it twists (i.e., moves more on the side she is sitting). Likewise, if the mass on the floor o f a
building is more on one side (for instance, one side of a building may have a storage or a
library), then that side of the building moves more under ground movement (Figure 3.8).
This building moves such that its floors displace horizontally as well as rotate.
Once more, let us consider the rope swing on the tree. This time let the two ropes with which
the cradle is tied to the branch of the tree be different in length. Such a swing also twists
even if you sit in the middle (Figure 3.9a). Similarly, in buildings with unequal vertical
members (i.e., columns and/or walls) also the floors twist about a vertical axis (Figure 3.9b)
and displace horizontally. Likewise, buildings, which have walls only on two sides (or one
side) and thin columns along the other, twist when shaken at the ground level (Figure 3.9c).
47

Columns
Gr<GroundMovement
(h) Building on slopy ground
(a) Swing with unequal ropes
Vertical Axis about which building twists
C o lu m n s -^ .
(c) Buildings with walls on two/one sides (in plan)
Figure 3.9 Buildings have unequal vertical members; they cause the building to twist about a vertical axis (IITK-BMTPC, 2002)
Buildings that are irregular shapes in plan tend to twist under earthquake shaking. For
example, in a propped overhanging building (Figure 3.10), the overhanging portion swings
on the relatively slender columns under it. The floors twist and displace horizontally.
EarthquakeGroundShaking
Figure 3.10 One-side open ground storey building twists during earthquake shaking(IITK-BMTPC, 2002)
48

3.4 The Seismic Design Philosophy for Buildings
Severity o f ground shaking at a given location during an earthquake can be minor, moderate,
and strong. Relatively speaking, minor shaking occurs frequently, moderate shaking
occasionally, and strong shaking rarely. For instance, on average annually about 800
earthquakes o f magnitude 5.0-5.9 occur in the world while the number is only about 18 for
magnitude range 7.0-7.9 (see Table 1.1). So, should engineers design and construct a
building to resist that rare earthquake shaking that may come only once in 500 years or even
once in 2000 years at the chosen project site, even though the life o f the building itself may
be only 50 or 100 years?. Since it costs money to provide additional earthquake safety in
buildings, a conflict arises: Should engineers do away with the design o f buildings for
earthquake effects? Or should engineers design the buildings to be “earthquake proof’
wherein there is no damage during the strong but rare earthquake shaking? Clearly, the
former approach can lead to a major disaster, and the second approach is too expensive.
Hence, the design philosophy should lie somewhere in between these two extremes.
The engineers do not attempt to make earthquake proof buildings that will not get damaged
even during the rare but strong earthquake; such buildings will be too robust and also too
expensive. Instead, the engineering intention is to make buildings earthquake resistant; such
buildings resist the effects o f ground shaking, although they may get damaged severely but
would not collapse during the strong earthquake. Thus, safety o f people and contents is
assured in earthquake-resistant buildings, and thereby a disaster is avoided. This is a major
objective of seismic design codes throughout the world.
The earthquake design philosophy may be summarized as follows:
a. Under minor but frequent shaking, the main members o f the building that carry vertical
and horizontal forces should not be damaged; however building parts that do not carry
load may sustain repairable damage.
b. Under moderate but occasional shaking, the main members may sustain repairable
damage, while the other parts o f the building may be damaged such that they may even
have to be replaced after the earthquake; and
c. Under strong but rare shaking, the main members may sustain severe (even irreparable)
damage, but the building should not collapse.
Thus, after minor shaking, the building will be fully operational within a short time and the
repair costs will be small. Next, after moderate shaking, the building will be operational once
49

the repair and strengthening o f the damaged main members is completed. Yet, after a strong
earthquake, the building may become dysfunctional for further use, but will stand so that
people can be evacuated and property recovered.
The consequences o f damage have to be borne in mind in the design philosophy. For
example, key buildings, such as hospitals and fire stations, play a critical role in post
earthquake activities and must remain functional immediately after the earthquake. These
structures must sustain very little damage and should be designed for a higher level of
earthquake protection. Collapse o f dams during earthquakes can cause flooding in the
downstream reaches, which itself can be a secondary disaster. Therefore, dams (and similarly,
nuclear power plants) should be designed for still higher level o f earthquake motion.
Design o f buildings to resist earthquakes involves controlling the damage to acceptable
levels at a reasonable cost. Contrary to the common thinking that any crack in the building
after an earthquake means the building is unsafe for habitation, engineers designing
earthquake-resistant buildings recognize that some damage is unavoidable. Different types of
damage (mainly visualized though cracks; especially so in concrete and masonry buildings)
occur in buildings during earthquakes. Some of these cracks are acceptable (in terms o f both
their size and location), while others are not. For instance, in a reinforced concrete frame
building with masonry filler walls between columns, the cracks between vertical columns
and masonry filler walls are acceptable, but diagonal cracks running through the columns are
not. In general, qualified technical professionals are knowledgeable o f the causes and
severity o f damage in earthquake-resistant buildings.
Earthquake-resistant design is therefore concerned about ensuring that the damages in
buildings during earthquakes are o f the acceptable variety, and also that they occur at the
right places and in right amounts. This approach o f earthquake-resistant design is much like
the use of electrical fuses in houses: to protect the entire electrical wiring and appliances in
the house, someone sacrifices some small parts o f the electrical circuit, called fuses; these
fuses are easily replaced after the electrical over current. Likewise, to save the building from
collapsing, someone needs to allow some pre-determined parts to undergo the acceptable
type and level o f damage.
50

3.5 Building Ductility
Earthquake-resistant buildings, particularly their main elements, need to be built with
ductility, the property that allows buildings to sway back-and-forth by large amounts, in
them. Such buildings have the ability to sway back-and-forth during an earthquake, and to
withstand earthquake effects with some damage, but without collapse. Ductility is one o f the
most important factors affecting the building performance. Thus, earthquake-resistant design
strives to predetermine the locations where damage takes place and then to provide good
detailing at these locations to ensure ductile behaviour o f the building.
In Indonesia, most residential urban and non-urban buildings are made in masonry
(CEEDEDS, 2001). In the plains, masonry is generally made o f burnt clay bricks and cement
mortar. However, in hilly areas, stone masonry with cement mortar is more prevalent; but, in
recent times, it is being replaced with masonry. Masonry can carry loads that cause
compression (i.e., pressing together), but can hardly take load that causes tension (i.e.,
pulling apart).
Concrete is another material that has been popularly used in building construction
particularly over the last four decades. Concrete is made o f crushed stone pieces (called
aggregate), sand, cement, and water mixed in appropriate proportions. Concrete is much
stronger than masonry under compressive loads, but again their behaviour in tension are poor.
The properties o f concrete critically depend on the amount o f water used in making concrete;
too much and too little water both can cause havoc. In general, both masonry and concrete
are brittle, and fail suddenly.
Steel is used in masonry and concrete buildings as reinforcement bars o f diameter ranging
from 6mm to 40mm. Reinforcing steel can carry both tensile and compressive loads.
Moreover, steel is a ductile material. This important property o f ductility enables steel bars
to undergo large elongation before breaking.
Concrete is used in buildings together with steel reinforcement bars. This composite material
is called simply reinforced concrete (RC). The amount and location o f steel in a member
should be such that the failure o f the member is by steel reaching its strength in tension
before concrete reaches its strength in compression. This type o f failure is ductile failure, and
hence is preferred over a failure where concrete fails first in compression. Therefore,
contrary to common thinking, providing too much steel in RC buildings can be harmful
even!!
51

Buildings should be designed like the ductile chain which has the weakest link. For example,
consider the common urban residential apartment construction - the multi-storey building
made of reinforced concrete. It consists of horizontal and vertical members, namely beams
and columns. The seismic inertia forces generated at its floor levels are transferred through
the various beams and columns to the ground. The correct building components need to be
made ductile. The failure of a column can affect the stability of the whole building, but the
failure of a beam causes localized effect. Therefore, it is better to make beams to be the
ductile weak links than columns. This method of designing RC buildings is called the strong-
column weak-beam design method (Figure 3.11).
iWeak Beam
[FI
_____ Strong
Intik"” ✓
Weak Column
1
7
Strong-CotumnWeak-Beani
Design
Weak-ColumnStrong-Beam
Design
StrongBeam
Figure 3.11 Reinforced Concrete Building Design: the beams must be the weakest links and not the columns (this can be achieved by appropriately sizing the members and providing
correct amount of steel reinforcement in them) (IITK-BMTPC, 2002)
3.6 Effect upon Non-Engineered and Engineered Building during Earthquakes
3.6.1 Effects Upon Non-Engineered Building
Based on critical analysis in Chapter II, poor design and construction on non-engineered
buildings was the main cause of the devastating construction during the strong jolting
throughout Indonesia and in other developing countries. It has revealed the global scale of
the problem. Boen (2006) highlight that in general, the damage and collapse o f the new
52

culture ‘non-engineered’ reinforced masonry buildings during the Yogyakarta earthquake of
27 May 2006 are mostly caused by the poor quality o f materials and poor workmanship,
resulting in, among others poor detailing, poor mortar quality, poor concrete quality, and
poor brick laying. It is a common practice that roof trusses are not strongly anchored to the
ring beams. Non-engineered buildings in this category include houses, one story shops, two
story shops, religious and school buildings.
In the last few years, EERI (Earthquake Engineering Research Institute) and IAEE
(International Association Earthquake Engineering) have made a modest step forward in this
direction, by creating the WHE (World Housing Encyclopaedia), an Internet-based network
o f volunteer architects and engineers from 34 countries that has been collecting information
on housing construction practices in zones o f high seismic risk (www.world-housing.net). It
was believed that the WHE should be used as a platform to allow EERI members and others
to identify and pursue activities to make buildings safer from earthquakes around the world.
According to WHE, Table 3.1.a and 3.1.b describe a lot of non-engineered houses in
countries which are still being practised both in urban and rural areas. Almost all o f
structural and architectural features in these houses do not comply with seismic resistance
codes, therefore the very poor or poor seismic performance is common in these houses. In
addition, the economic o f inhabitants are below the medium class (very poor or poor
population).
53

Tab
le
3.1.
a E
xam
ples
of
seis
mic
fe
atur
es,
for
man
y no
n-en
gine
ered
ho
use
type
sCD _
a n CD ° ° TO
o _J 2 0 2
2 to co co 5
X X X
o t o j " o I - c .E <u
5 - 1 1 oTO TO Z3 Q . O X X X X Xrrc
CDQ J
I—CDV)Z J0 X1
"cZ JoO
S I
TO g 02 jg TO E -TO
S E o ~CO -TO Q .cc
X X X X X X
‘ TOJS c: .£= o; t5
EC/3 CO
X X X X X X X X X02<
" O o .CD " O £< -S
TO y o &*‘c/2 O 'E TO0 ) X I oTO .TO ^ Cgo 02 03 TO
5 r o E
X X X X X
co
& §
u . C L «
02 CD 02 2 f 85 S i
S’
'-11 8 202 jg
P£'§CO03 >,
*5TO TO
03 .52 5 0 3
2 |■ P = 02 — xr h-
to
« g "S0 - i(1) =3 Q _ " O
S5 p ■=•81 ^CO ro
"TO Q . CO . 0 2 CO 2 TO .1= CO <d co w
-Q : •?=o .S ^
s«2 C D.8 & s .£2 p .£■E i2 c02 .TO 022 o c
f = *:§ ’5 ®* o > ^— Q) .TOJ3 O-£ TO (O 03
0 3 Q)TO. =
| lE coTO <l>
2 & E I « £2'8 ' S cn * 2
---- ---- CDO ) 5 TO ro
£ (O CO
o-'aTfe
H ir 2 "tO t 3
8 .-I*x ™
2 S ’O C 8 TOS f
- g o
S sro o JE 02TO 2 JCf l g s■C J 5 Ctf H £ QJ
TO.CO 5
1 ToS o
— to l- ca§ E
= T3x: 93 O fc£
8*2 c TO *G3
1 1 1 s £ I*TO « OCD 02 CO£ ^ EO CM -g o x u
TO 1*2 *- 5 .TOTO | eQJ ^ C
CD O o
S’ IS' in : cnj
. 5 5 C «
s o
J5So c TO —» *oTO .03 03 03j* I *€0*0
E 5.2 "O
8 TO¥ 11 103 030 3 Q>
•§ CO £1
-9 !"C2 CO
§ il l'•TO =02 O> u .
to(D TO.c to1 co J= Q - 2i e2 o
TO' "O - - 03 TO| !S {03 ^ TO 0)= TO| E , r_ 0 2 o E
■TO X I 02 CL X .CO1
U J X 2
02 CO
H iro g £E 02 CO2 l S
£ ° to £5i S ■«-to!
O -TO* In c
S ’-G O E
C/3 03 03e? | =c CO oTO ^ ^ TO ^ CO £ TO =Q J ^ | "O ° 03"2 £2 toTO 7—• E— 1_ ^ o o c c
8cnj i :• — rrt CO
# 8 S5 — pm Q - : W W u
o o * 2
« E co •"O . .S = m .
TO E CO
%™ TO .£ 8 ca £•2 § to 58
£ o oto ~~ . C ( 0 ■ S
I f §5 O .TO 02 ' c n
X I 2 3 CO :
=: 2 [ 0 D 2
3. "S 3o -S2 ro 2 Ic ® i= o u- co B
CO
E 8 § toT J 2 o | c o t= P^ 5 = 0 .TO CO TO —
^ § 1 1 == TO
54

Tabl
e 3.
1.a
cont
inue
d
X X
X
"oc 2 J O to
2 c= ssC C -P
co
8 =-2
£
d;
X Xcc
-ocCO
2 o8 ° a . q _
CD>
X X X
COCD
o S CO
E g=5 -□ Ct !s >-
X X XC C
&cCDE
8
5 05 jp -g u_ co o - a
Q . . 2c o o
E ~ 2 « = c o co iS = cCD CO OP > _s•S -O o)= 0 I-<5 CO CD
CO *uco . Q . O
X I O CO CD— a>r o _q
! « | S 8
CD_ _ o - a-S'-®I S I 8 a o a .ss
"1 CD O .Qc Ee 58303 "D
s SCD
£ CD
S P .E o- I I1 - i*1£0 CD
CO o
8.1 E.52 o
’c " aj o "a>
E 0 ’co
CD
O wco 5 caCD “D J= c co2 "co 2 E £ c S'Se =oCO
CD
= _coE w o -S3
CO.£• ra co E3 -£
co G > r
£ S § I 8 |
— o -■x= TO CO CD t= .52
.52 O t j _ G E E <=>■
"co
£3» iE ca
&>-£ i'XD E! O "S 1 i B S l1 p O) m45 "O <n S o ®
8 ro 80 3 “t :
W 2
55

Tabl
e 3.
1.b
Exam
ples
of
seism
ic fe
atur
es,
for m
any
non-
engi
neer
ed
hous
e ty
pes
CDQ J>%h-CDV)q0 n:1
= 3oO
<13 CO <= 3O O
E *P<13 03
S O3 1/3 ££ 2
CO
JS CD
I I ILi.
T3^ ^ C t nco £ 5 g O
'rn 03 CO — . t o 5 Q3 P ^ -OE o E
X3
X X
X X
X X
0= fc*c 5 °C/3Q) w CO W
2 E EI ° ^ E■3 JQ CD > .
X
■ai ? to < C 3
I O X X X X " r
1 3 "°“ § p03 d
O . E55 JS co 2 .E CD
S | P l r g °-l«S
X X X X X X
c zCD.E03
sCO
.S2 ~
i s *— Q- co “D -5=§ s03 S 03 £ |-8 8 1 ro 3 = 1
■2.-5'• p 1 t o
3 '—• g o
■c03 pCO c
CO
CO_ CD02 S' 2a>
0 '5 to to
1 2 3
"§i f fg j . O O .
8 *2 ®E & 02 .<= jo co
.0 - o
■2 .2? I 8*°3 3■o ■— '« £ 8 .Ecd -S
cd .jg 3 "ts 2 '9 S |02 3
~ 3 3 . = 03
SS % • o »
Q . 03•E 3 T3 tj
2
C/2 .C/2
to o
2 ?gCO 03
03
8 J0 3 QJ
3- =s iE <0 03 QJo £2 o o O •8 0 ■8 §l l| K'8 o8 , - t x 5,® S?o 3
8 03o £03 3
S o S it=O « 03c S - x. e ggs s E93 ts -e
~ 503 £■ > c CD O
co
8 I% 'g« ICD *2-•I
J 2 ,3. "co o 5 co
8 « = . 3 £ 2to co ?03 £•
* _ s i . Oo CM CO
B 5T ISi!0«j£ 5 2c — 8 2 ? 8 i2 1 0 cor C M f.S > c c m ca CO X £ £
£ . 0
■SBo e CO — t=j “O to jdCD CD
= mco c: 5 raE *
. 2 " o8 g ¥11 1CD CD 0 5
£* to ?5E c J>£ 8 8 c og c o g £S CD E Q) COgO *0 C CD “
Cj0t3 O CO p1/5 T1 *=1 0 “ (OE 0 3 =
” s —"3 OT -g O j = 8 ' O CO
£ co
o
8 8
CD CO
! ero ^2 - CO 03
= £i 2^ 03o 28 ■q.>< . o 1
c “ “ Q3 < - og - s £ I “O O
■g c 'S E■g 8to
• - co coi s 85 LJ
8 -S2
o b E CO
2 *G° 2^ COS E5 8 £ jp
3 jo E8 e|E
COCD C« 8 C (O
8 2 §0 3 -3 -0
3 3 CO
2 o
^3 2 j5 3 5 )J2 "S =roE IE a> ffi<
c c
ts5 dCO CO
8 8O 0X iZ
« 8 .2 ecoCD ^
m w & = E t) c tt CO o•E ^ -o o-
S c
•o 33 0 3^ 5 -g B.ro w E to
2 -G= 03
56

Tabl
e 3.1
.b co
ntin
ued
X X X
Rura
l and
urb
an
area
s
C/505
> -
Poor
and
mi
ddle
class
CO1
CM
o2
Very
poor
~~7" T
Rura
l and
urb
an
area
s
vsCD
>
Midd
le cla
ss
CO1
CM
o:2 :
Med
ium
X X X
Urba
n ar
eas
V)CD
> -
Very
poor
- Po
or-M
iddl
e cla
ss o ooCL
X X X
Rura
l and
ur
ban
area
s tn 03
>
Very
poor
- Po
or
- Mi
ddle
class
o2
Very
poor
X X X
Urba
n ar
eas
V)03
> -
ooCLc o
1CM
o2 Po
or
Qualit
y of
build
ing
mater
ials
is co
nside
red t
o be
adeq
uate
per r
equir
emen
ts of
natio
nal c
odes
and
stand
ards
(an e
stima
te)Qu
ality
of wo
rkman
ship
(base
d on
visua
l ins
pecti
on o
f few
typica
l buil
dings
) is
cons
idered
to
be goo
d (pe
r loc
al co
nstru
ction
stan
dard
s).
Build
ings
of this
type
are
gene
rally
well
maint
ained
and
there
are n
o vis
ible
signs
of de
terior
ation
of b
uildin
g ele
ments
(co
ncret
e, ste
el, a
nd tim
ber).
a) In
urban
areas
, b) I
n rur
al are
as, c
) In
subu
rban
area
s, d)
Both
in rur
al and
urb
an ar
eas
a) Ye
s, b)
No
a) Ve
ry po
or, b
) Poo
r, c)
Middle
Clas
s, d)
Rich
a) Ye
s, b)
No
a) Ve
ry po
or, b
)Poo
r, c)
Mediu
m, d
)Goo
d,
e) Ve
ry go
od,
f) Ex
celle
nt
Quali
ty, of
buil
ding
Mater
ials
Qualit
y of
W
orkm
ansh
ip
Maint
enan
ce
Where
is
this
cons
tructi
on
comm
only
found
?Is
this
cons
tructi
on s
till
being
pr
actis
ed?
Econ
omic
level
of
inhab
itants
Typic
al nu
mber
of sto
ries
Is thi
s co
nstru
ction
typ
e ad
dress
ed
by
code
s/stan
dard
s?Se
ismic
perfo
rman
ce
-CM CO CO CO
t—CO CTi
57

3.6.2 Improving of Seismic Resistance on Masonry and Multi-Storey Reinforced Concrete Building
CEEDEDS (2004) highlight that non-engineered buildings are commonly constructed with
masonry or multi-storey reinforced concrete, therefore this section describes only on these
types which have been responsible for very high death toll during seismic events. By the way,
there are uncommon wood and steel buildings as residential buildings in developing
countries which are not further explained.
3.6.2.1 Masonry Building
a. Brick masonry buildings behaviour during earthquakes
Masonry buildings are brittle structures and one o f the most vulnerable o f the entire building
stock under strong earthquake shaking. The large number o f human fatalities in such
constructions during the past earthquakes in Indonesia corroborates this. Thus, it is very
important to improve the seismic behaviour o f masonry buildings. A number o f earthquake-
resistant features can be introduced to achieve this objective.
Ground vibrations during earthquakes cause inertia forces at locations of mass in the
building. These forces travel through the roof and walls to the foundation. The main
emphasis is on ensuring that these forces reach the ground without causing major damage or
collapse. O f the three components o f a masonry building (roof, wall, and foundation) (Figure
3.12.a), the walls are most vulnerable to damage caused by horizontal forces due to
earthquake. A wall topples down easily if pushed horizontally at the top in a direction
perpendicular to its plane (termed weak direction), but offers much greater resistance if
pushed along its length (termed strong direction) (Figure 3.12.b).
The ground shakes simultaneously in the vertical and two horizontal directions during
earthquakes. However, the horizontal vibrations are the most damaging to normal masonry
buildings. Horizontal inertia force developed at the roof transfers to the walls acting either in
the weak or in the strong direction. If all the walls are not tied together like a box, the walls
loaded in their weak direction tend to topple (Figure 3.13.a).
58

Foundation
Pushed
Direction of
Toppling
■yVi’ection of ^earthquake
Walls
(a) Basic components of a masonry building in the plane of the wall
earthquake sh am g
(b) Direction of force on a wall critically determines its earthquake performance
Poshed perpendicular to the plane of the wall
shaking
Figure 3.12 Basic components of a masonry building: walls are sensitive to direction of earthquake forces (IITK-BMTPC, 2003)
Direction
■ ,V*V’■
loppiing
earthquakeshading
(a) For the direction of earthquake shaking shown, wall B tends to fail
Toothedjoints in masonry
courses orL-shaped dowel bars
Direction of earthquake
- R i K w w w w w - - shaking(b) Wall B properly connected to Wall A (Note: roof
is not shown): Walls A (loaded in strong direction) support Walls B (loaded in weak direction)
Figure 3.13 Advantage sharing between walls - only possible if walls are well connected(IITK-BMTPC, 2003)
To ensure good seismic performance, all walls must be joined properly to the adjacent walls.
In this way, walls loaded in their weak direction can take advantage of the good lateral
59

resistance offered by walls loaded in their strong direction (Figure 3.10.b). Further, walls
also need to be tied to the roof and foundation to preserve their overall integrity.
b. How to improve behaviour of masonry walls
Masonry walls are slender because o f their small thickness compared to their height and
length. A simple way of making these walls behave well during earthquake shaking is by
making them act together as a box along with the roof at the top and with the foundation at
the bottom. A number o f construction aspects are required to ensure this box action. Firstly,
connections between the walls should be good. This can be achieved by (a) ensuring good
interlocking o f the masonry courses at the junctions, and (b) employing horizontal bands at
various levels, particularly at the lintel level. Secondly, the sizes o f door and window
openings need to be kept small. The smaller the openings, the larger the resistance offered by
the wall. Thirdly, the tendency o f a wall to topple when pushed in the weak direction can be
reduced by limiting its length-to-thickness and height to thickness ratios. Design codes
specify limits for these ratios. A wall that is too tall or too long in comparison to its thickness
is particularly vulnerable to shaking in its weak direction.
c. Choice and quality of building materials
Earthquake performance o f a masonry wall is very sensitive to the properties o f its
constituents, namely masonry units and mortar. The properties o f these materials vary across
Indonesia due to variation in raw materials and construction methods. A variety o f masonry
units are used in the country, e.g., clay bricks (burnt and unbumt), concrete blocks (solid and
hollow), stone blocks. Burnt clay bricks are most commonly used. These bricks are
inherently porous, and so they absorb water. Excessive porosity is detrimental to good
masonry behaviour because the bricks suck away water from the adjoining mortar, which
results in poor bond between brick and mortar, and in difficulty in positioning masonry units.
For this reason, bricks with low porosity are to be used, and they must be soaked in water
before use to minimise the amount o f water drawn away from the mortar.
Various mortars are used, e.g., mud, cement-sand, or cement-sand-lime. O f these, mud
mortar is the weakest; it crushes easily when dry, flows outward and has very low
earthquake resistance. Cement-sand mortar with lime is the most suitable. This mortar mix
provides excellent workability for laying bricks, stretches without crumbling at low
earthquake shaking, and bonds well with bricks. The earthquake response o f masonry walls
depends on the relative strengths o f brick and mortar. Bricks must be stronger than mortar.
60

Excessive thickness of mortar is not desirable. A 10mm thick mortar layer is generally
satisfactory from practical and aesthetic considerations.
d. Simple structu ral configuration in m asonry building
Brick masonry buildings have large mass and hence attract large horizontal forces during
earthquake shaking. They develop numerous cracks under both compressive and tensile
forces caused by earthquake shaking. The focus of earthquake resistant masonry building
construction is to ensure that these effects are sustained without major damage or collapse.
Appropriate choice of structural configuration can help achieve this.
The structural configuration of masonry buildings includes aspects like (a) overall shape and
size of the building, and (b) distribution of mass and (horizontal) lateral load resisting
elements across the building. Large, tall, long and asymmetric buildings perform poorly
during earthquakes. A strategy used in making them earthquake resistant is developing good
box action between all the elements of the building, i.e., between roof, walls and foundation
(Figure 3.14). Loosely connected roof or unduly slender walls are threats to good seismic
behaviour. For example, a horizontal band introduced at the lintel level ties the walls
together and helps to make them behave as a single unit.
Lintel
Stiff Foundation
" Good connection
Good connection between roof and walls
Roof that stays together as a single / ' integral unit during earthquakes
Walls withsm alopenings
Good connection
between walls and
foundation
Band
at wall com ers
Figure 3.14 Essential requirements to ensure box action in a masonry building(IITK-BMTPC, 2003)
e. Influence of openings
Openings are functional necessities in buildings. However, location and size of openings in
walls assume significance in deciding the performance of masonry buildings in earthquakes.
61

To understand this, consider a four-wall system of a single storey masonry building (Figure
3.15). During earthquake shaking, inertia forces act in the strong direction of some walls and
in the weak direction of others. Walls shaken in the weak direction seek support from the
other walls, i.e., walls B1 and B2 seek support from walls A1 and A2 for shaking in the
direction shown in Figure 3.12. To be more specific, wall B1 pulls walls A1 and A2, while
wall B2 pushes against them. At the next instance, the direction of shaking could change to
the horizontal direction perpendicular to that shown in Figure 3.12. Then, walls A and B
change their roles; Walls B1 and B2 become the strong ones and A1 and A2 weak.
Thus, walls transfer loads to each other at their junctions (and through the lintel bands and
roof). Hence, the masonry from the walls meeting at corners must have good interlocking.
For this reason, openings near the wall corners are detrimental to good seismic performance.
Openings too close to wall comers hamper the flow of forces from one wall to another.
Further, large openings weaken walls from carrying the inertia forces in their own plane.
Thus, it is best to keep all openings as small as possible and as far away from the corners as
possible.Inertia force from roof
Direction of'
inertia force from roof
earthquakeshaking
Regions where ioad
transfer takes place
from one wail to
another
Figure 3.15 Regions of force transfer from weak walls to strong walls in a masonry building: wall B1 pulls walls A1 and A2, while wall B2 pushes walls A1 and A2
(IITK-BMTPC, 2003)
Inclined staircase slabs in masonry buildings offer another concern. An integrally connected
staircase slab acts like a cross-brace between floors and transfers large horizontal forces at
the roof and lower levels. These are areas of potential damage in masonry buildings, if not
62

accounted for in staircase design and construction. To overcome this, sometimes, staircases
are completely separated and built on a separate reinforced concrete structure. Adequate gap
is provided between the staircase tower and the masonry building to ensure that they do not
pound each other during strong earthquake shaking.
f. Necessity of horizontal bands in m asonry building
R o o f
Masonry above iintei
Lintel Band c
Masonrybelow linie.
Plinth Band
— ——
i » » K l
______Wall
Foundation
(a) Building with Flat R oo f
LintelBand
'£Cross wall connection
AfcPenpherai wail
Gable-roof connection
R oofBand
Floor-wallsconnection
PlinthBan
Trvss-wallconnection
m^ 0 0 ^ ^ ^ ^ M ^ c p n n e c t io n * • -*
(b) Two-storey Building with Pitched R oo f
Figure 3.16 Horizontal bands in masonry building: Improve earthquake-resistance (IITK-BMTPC, 2003)
Horizontal bands are the most important earthquake-resistant feature in masonry buildings.
The bands are provided to hold a masonry building as a single unit by tying all the walls
together, and are similar to a closed belt provided around cardboard boxes. There are four
63

types of bands in a typical masonry building, namely gable band, roof band, lintel band, and
plinth band (Figure 3.16), named after their location in the building. The lintel band is the
most important of all, and needs to be provided in almost all buildings. The gable band is
employed only in buildings with pitched or sloped roofs. In buildings with flat reinforced
concrete or reinforced brick roofs, the roof band is not required, because the roof slab also
plays the role of a band. In buildings with pitched or sloped roof, the roof band is very
important. Plinth bands are primarily used when there is concern about uneven settlement of
foundation soil.
The lintel band ties the walls together and creates a support for walls loaded along weak
direction from walls loaded in strong direction. This band also reduces the unsupported
height o f the walls and thereby improves their stability in the weak direction. During the
1993 Latur earthquake (Central India), the intensity of shaking in Killari village was IX on
MSK scale. Most masonry houses sustained partial or complete collapse. On the other hand,
there was one masonry building in the village, which had a lintel band and it sustained the
shaking very well with hardly any damage.
Bending of Lintel Band
Lintel.Band
Direction of | Inertia Force
/ : /: : : yro&tf: ;: : >£•>:&#•
V?1 ?r?fTr?r?rft'?,'FWW ?r!r?r!rrfrr:r.:'m;r-'
Direction of earthquake
Small
Figure 3.17 Bending and pulling in lintel bands:Bands must be capable of resisting these (IITK-BMTPC, 2003)
64

g. Design of lintel bands
During earthquake shaking, the lintel band undergoes bending and pulling actions (Figure
3.18). To resist these actions, the construction of lintel band requires special attention. Bands
can be made of wood (including bamboo splits) or of reinforced concrete (RC); the RC
bands are the best. The straight lengths of the band must be properly connected at the wall
corners. This will allow the band to support walls loaded in their weak direction by walls
loaded in their strong direction. Small lengths o f wood spacers (in wooden bands) or steel
links (in RC bands) are used to make the straight lengths of wood runners or steel bars act
together. In wooden bands, proper nailing of straight lengths with spacers is important.
Likewise, in RC bands, adequate anchoring of steel links with steel bars is necessary.
Wood Spacers
Wooden Band
SteelLicks
Steel Bars
CorrectPractices
(b) RC Band
WoodRunners
Figure 3.18 Horizontal Bands in masonry buildings: RC bands are the best(IITK-BMTPC, 2003)
h. Vertical reinforcem ent in m asonry buildings
Horizontal bands are provided in masonry buildings to improve their earthquake
performance. These bands include plinth band, lintel band, and roof band. Even if horizontal
bands are provided, masonry buildings are weakened by the openings in their walls (Figure
3.19). During earthquake shaking, the masonry walls get grouped into three sub-units,
namely spandrel masonry, wall pier masonry and sill masonry.
65

Roof
Foundation
SpandrelMasonry
Lintel
Wail PierLevel
Masonry
...ML.Sill
L evel
’ MasonryPlinth
b Level
Figure 3.19 Sub-units in masonry building - walls behave as discrete units during earthquakes (IITK-BMTPC, 2003)
Rocking o f Pier
Crushing!
U plifting O fm a so n ry (b) Rocking of Masonry Pier.
Foundation
Foundation
----------R oof
. . . . -___RoofBand
LintelWindowOpening
Plinth
Band
X-Cracking of Masonry
/ Piers
(c) X-Cracking of
BandMasonry
Building Components Pier
Figure 3.20 Earthquake response of a hipped roof masonry building; no vertical reinforcement is provided in walls (IITK-BMTPC, 2003)
Consider a hipped roof building with two window openings and one door opening in a wall
(Figure 3.20.a). It has lintel and plinth bands. Since the roof is a hipped one, a roof band is
66

also provided. When the ground shakes, the inertia force causes the small-sized masonry
wall piers to disconnect from the masonry above and below. These masonry sub-units rock
back and forth, developing contact only at the opposite diagonals (Figure 3.20.b). The
rocking of a masonry pier can crush the masonry at the corners. Rocking is possible when
masonry piers are slender, and when weight of the structure above is small. Otherwise, the
piers are more likely to develop diagonal (X-type) shear cracking (Figure 3.20.c); this is the
most common failure type in masonry buildings.
i. How vertical reinforcem ent helps?
Embedding vertical reinforcement bars in the edges of the wall piers and anchoring them in
the foundation at the bottom and in the roof band at the top (Figure 3.21) forces the slender
masonry piers to undergo bending instead of rocking. In wider wall piers, the vertical bars
enhance their capability to resist horizontal earthquake forces and delay the X-cracking.
Adequate cross-sectional area of these vertical bars prevents the bar from yielding in tension.
Further, the vertical bars also help protect the wall from sliding as well as from collapsing in
the weak direction.
Bending o f Pier
ifee1 bars anchored i r t i ‘y .......•vat&n and roc?band
piers 10
*.■ r-* ■-*'-* * ■ pP
31 reinforcement prevents sliding in ,vaiis
foundation and
(a) Vert;cai reinforcement causes bending of masonry piers in place of rocking
0 ) Vertical
Figure 3.21 Vertical reinforcement in masonry walls - wall behaviour is modified(IITK-BMTPC, 2003)
67

j. Protection of openings in walls
Sliding failure mentioned above is rare, even in unconfined masonry buildings. However, the
most common damage, observed after an earthquake, is diagonal X-cracking of wall piers,
and also inclined cracks at the corners of door and window openings. When a wall with an
opening deforms during earthquake shaking, the shape of the opening distorts and becomes
more like a rhombus - two opposite corners move away and the other two come closer.
Under this type of deformation, the comers that come closer develop cracks (Figure 3.22.a).
The cracks are bigger when the opening sizes are larger. Steel bars provided in the wall
masonry all around the openings restrict these cracks at the comers (Figure 3.22.b). In
summary, lintel and sill bands above and below openings, and vertical reinforcement
adjacent to vertical edges, provide protection against this type of damage.
Earthquake-induced inertia force
Cracking
(a) Cracking in building with no corner reinforcement
Lintel Band Reinforcement b_- Bars
Sill BandISimtlai to
Bar,: -----out discontinued a f door openings:
(b) No cracks in building with vertical reinforcement
Figure 3.22 Cracks at comers of openings in a masonry building - reinforcement aroundthem helps (IITK-BMTPC, 2003)
3.6.2.2 M ulti-Storey Reinforced Concrete Building
a. Reinforced concrete building
In recent times, reinforced concrete buildings have become common in Indonesia,
particularly in towns and cities. Reinforced concrete (or simply RC) consists of two primary
68

materials, namely concrete with reinforcing steel bars. Concrete is made o f sand, crushed
stone (called aggregates) and cement, all mixed with predetermined amount o f water.
Concrete can be moulded into any desired shape, and steel bars can be bent into many shapes.
Thus, structures o f complex shapes are possible with RC.
A typical RC building is made o f horizontal members (beams and slabs) and vertical
members (columns and walls), and supported by foundations that rest on ground. The system
comprising o f RC columns and connecting beams is called a RC Frame. The RC frame
participates in resisting the earthquake forces. Earthquake shaking generates inertia forces in
the building, which are proportional to the building mass. Since most o f the building mass is
present at floor levels, earthquake-induced inertia forces primarily develop at the floor levels.
These forces travel downward - through slab and beams to column and walls, and then to the
foundations from where they are dispersed to the ground. As inertia forces accumulate
downwards from the top of the building, the columns and walls at lower storeys experience
higher earthquake -induced forces and are therefore designed to be stronger than those in
storeys above.
b. Roles of floor slabs and masonry walls
Floor slabs are horizontal plate-like elements, which facilitate functional use of buildings.
Usually, beams and slabs at one storey level are cast together. In residential multi-storey
buildings, thickness o f slabs is only about 110-150 mm. When beams bend in the vertical
direction during earthquakes, these thin slabs bend along them. Furthermore, when beams
move with columns in the horizontal direction, the slab usually forces the beams to move
together with it. In most buildings, the geometric distortion o f the slab is negligible in the
horizontal plane; this behaviour is known as the rigid diaphragm action. Structural engineer
must consider this during design.
After columns and floors in a RC building are cast, and the concrete hardens or matures,
vertical spaces between columns and floors are usually filled-in with masonry walls to
demarcate a floor area into functional spaces (rooms). Normally, these masonry walls, also
called infill walls, are not connected to surrounding RC columns and beams. When columns
receive horizontal forces at floor levels, they try to move in the horizontal direction, but
masonry walls tend to resist this movement. Due to their heavy weight and thickness, these
walls attract rather large horizontal forces. However, since masonry is a brittle material,
these walls develop cracks once their ability to carry horizontal load is exceeded. Thus, infill
walls act like sacrificial fuses in buildings; they develop cracks under severe ground shaking
69

but help share the load of the beams and columns until cracking. Earthquake performance of
infill walls is enhanced by mortars of good strength, making proper masonry courses, and
proper packing of gaps between RC frame and masonry infill walls. However, an infill walls
that is unduly tall or long in comparison to its thickness can fall out-of-plane, which can be
threatening. In addition, placing infill irregularly in the building causes ill effects like short
column effect and torsion (Figure 3.23).
Gap
Cracks
Figure 3.23 Infill walls move together with the columns under earthquake shaking(IITK-BMTPC, 2003)
c. Strength hierarchy
For building to remain safe during earthquake shaking, columns (which receive forces from
beams) should be stronger than beams, and foundations (which receive forces from columns)
should be stronger than columns. Further, connection beams-columns and columns-
foundations should not fail so that beams can safely transfer forces to columns and columns
to foundations.
When this strategy is adopted in design, damage is likely to occur first in beams. When
beams are detailed properly to have large ductility, the buildings a whole can deform by
large amounts despite progressive damage caused due to consequent yielding of beams. In
contrast, if columns are made weaker, they suffer severe local damage, at the top and bottom
of a particular storey. This localized damage can lead to collapse of a building, although
columns at storeys above remain almost undamaged (Figure 3.24).
70

I Large ! displacement aiecliapse
[Damage distributed in all storeys
Ail damage in one storey
(a) Strong Columns, (b) W eak Columns,Weak Beams w Strong Beams ^
Figure 3.24 Tw o distinct designs o f buildings that result in d ifferent earthquake perform ances-colum ns should be stronger that beam s (IIT K -B M T PC , 2003)
d. Beam in RC building during earthquakes
In RC buildings, the vertical and horizontal m em bers (i.e., the beam s and colum ns) are built
integrally w ith each other. Thus, under the action o f loads, they act together as a fram e
transferring forces from one to another. This is m eant for beam s that are part o f a building
fram e and carry earthquake-induced forces.
Beams in RC buildings have tw o sets o f steel reinforcem ent, nam ely: (a) long straight bars
(called longitudinal bars) placed along its length, and (b) closed loops o f sm all d iam eter steel
bars (called stirrups) placed vertically at regular intervals along its full length.
Beam s sustain tw o basic types o f failures, nam ely:
i. Flexural (or bending) failure
As the beam sags under increased loading, it can fail in tw o possible w ays. If relatively
m ore steel is present on the tension face, concrete crushes in com pression; this is a brittle
failure and is therefore undesirable. If relatively less steel is present on tension face, the
steel yields first (its keeps elongating but does not snap, as steel has ability to stretch
large am ount before it snaps) and redistribution occurs in the beam until eventually the
concrete crushes in com pression; this is a ductile failure and hence is desirable. The
ductile failure is characterised with m any vertical cracks starting from the stretched
beam face, and going tow ards its m id-depth.
ii. Shear failure
A beam m ay also fail due to shearing action. A shear crack is inclined at 45° to the
horizontal; it develops at m id-depth near the support and grow s tow ards the top and
bottom faces. C losed loop stirrups are provided to avoid such shearing action. Shear
71

damage occurs when the area o f these stirrups is insufficient. Shear failure is brittle, and
therefore, shear failure must be avoided in the design of RC beams.
e. Beam design strategy
Designing a beam involves the selection o f its material properties (i.e., grades o f steel bars
and concrete) and shape and size; these are usually selected as a part o f an overall design
strategy o f the whole building. Furthermore, the amount and distribution o f steel to be
provided in the beam must be determined by performing design calculations (Figure 3.25
and 3.26).
Longitudinal bars are provided to resist flexural cracking on the side o f the beam that
stretches. Since both top and bottom faces stretch during strong earthquake shaking,
longitudinal steel bars are required on both faces at the end and the bottom face at mid
length. Most seismic codes prescribes that
i. At least two bars go through the full length of the beam at the top as well as the bottom
. o f the beam.
ii. At the ends o f beams, the amount o f steel provided at the bottom is at least half that at
top.
Stirrups in RC beams help in three ways, namely
i. they carry the vertical shear force and thereby resist diagonal shear cracks
ii. they protect the concrete from bulging outward due to flexure, and
iii. they prevent the buckling o f the compressed longitudinal bars due to flexure.
Steel reinforcement bars are available usually in length o f 12 m. Thus, it becomes necessary
to overlap bars when beams of longer lengths are to be made. At the location o f the lap, the
bars transfer large forces from one another. Thus, the seismic code prescribes that such laps
o f longitudinal bar are
i. made away from the face the column, and
ii. not made at locations where they are likely to stretch by large amounts and yield (e.g.,
bottom bars at mid length o f the beams). Moreover, at the locations o f laps, vertical
stirrups should be provided at a closer spacing.
72

Spacing of stirrups as calculated
(but net mors than d/4 and 8 tim es beam bar
diam eter Spat rtf of stifraps as per cakutethons
Spacing of stirrups as calculated
(but not mors man d/4 and 8 tim es beam bar
diam eter
Beam
ColumnColumn
Figure 3.25 Location and amount of vertical stirrups in beams-limit on maximum spacing ensures good earthquake behaviour (IITK-BMTPC, 2003)
Lapping of longitudinal bars
Column
Spacing cf stirrups
Beam
Column
Lapping prohibited in regions where
longitudinal bars can yield in tension
Figure 3.26 Details of lapping steel reinforcement in seismic beams (IITK-BMTPC, 2003)
f. Column in RC building earthquake resistant
Columns, the vertical members in RC buildings, contain two types of steel reinforcement,
namely: (a) long straight bars (called longitudinal bars) placed vertically along the length,
and (b) closed loops of smaller diameter steel bars (called transverse ties) placed horizontally
at regular intervals along its full length. Columns can sustain two types of damage, namely
axial-flexural (or combined compression bending) failure and shear failure. Shear damage is
brittle and must be avoided in columns by providing transverse ties at close spacing.
g. Column design strategy
Designing a column involves selection of materials to be used (i.e., grades of concrete and
steel bars), choosing shape and size of the cross-section, and calculating amount and
distribution of steel reinforcement. The first two aspects are part of the overall design
strategy of the whole building. Seismic code requires columns to be at least 300mm wide.
Columns that are required to resist earthquake forces must be designed to prevent shear
failure by a skilful selection of reinforcement.
73

h. Column vertical bars tied together with closed ties
Closely spaced horizontal closed ties help in three ways, namely (i) they carry the horizontal
shear forces induced by earthquakes, and thereby resist diagonal shear cracks, (ii) they hold
together the vertical bars and prevent them from excessively bending outwards (in technical
terms, this bending phenomenon is called buckling), and (iii) they contain the concrete in the
column within the closed loops. The ends o f the ties must be bent as 135° hooks. Such hook
ends prevent opening of loops and consequently buckling o f concrete and buckling of
vertical bars.
Construction drawings with clear details o f closed ties are helpful in the effective
implementation at construction site. In columns where the spacing between the comer bars
exceeds 300mm, seismic code prescribes additional links with 180° hook ends for ties to be
effective in holding the concrete in its place and to prevent the buckling o f vertical bars.
These links need to go around both vertical bars and horizontal closed ties; special care is
required to implement this properly at site.
i. Column lapping vertical bars
In the construction o f RC buildings, due to the limitations in available length o f bars and due
to constraints in construction, there are numerous occasions when column bars have to be
joined. A simple way of achieving this is by overlapping the two bars over at least a
minimum specified length, called lap length. The lap length depends on types of
reinforcement and concrete. For ordinary situations, it is about 50 times bar diameter.
Further, seismic code prescribes that the lap length be provided only in the middle half of
column and not near its top or bottom ends (Figure 3.27). Also, only half the vertical bars in
the column are to be lapped at a time in any storey. Further, when laps are provided, ties
must be provided along the length of the lap at a spacing not more than 150 mm.
74

At least larger of D. h /6 and 450 mm
Beam
Lappingvertical bars
in middleo f column
Beam
At ieasi larger of D. h /6 and 450 mm
Spacing of tiesnot more than D/4, nut need not be less than 75mm nor
more than 100 mm
Spacing o f ties* not more than D/2
Spacing o f ties in lap lengthnot more than smaller of
D/2 and 150 mm
Spacing of tiesnot more than D/2
Spacing of tiesnot more than DM, but need not be less than 75mm nor
more than 100 mm
Figure 3.27 Placing vertical bars and closed ties in columns; column ends and lap lengths are to be protected with closely spaced ties
(IITK-BMTPC, 2003)
j. Beam-column jo int in RC building earthquake resistant
In RC buildings, portion of columns that are common to beams at their intersections are
called beam-column joints. Since their constituent material has limited strength, the joints
have limited force carrying capacity. When forces larger than these are applied during
earthquakes, joints are severely damaged. Repairing damaged joints are difficult, and so
damage must be avoided. Thus, beam-column joints must be design to resist earthquake
effects.
75

k. E arthquake behaviour of joint
Under earthquake shaking, the beams adjoining a joint are subjected to moment in the same
(clockwise or anti-clockwise) direction. Under these moments, the top bars in the beam-
column joint are pulled in one direction and the bottom ones in the opposite direction. These
forces are balanced by bond stress developed between concrete and steel in the joint region.
If the column is not wide enough of if the strength of concrete in the joint is low, there is
insufficient grip of concrete on the steel bars. In such circumstances, the bar slips inside the
joint region, and beams loose their capacity to carry load (Figure 3.28)
Compression
Tension
(3) Loss of grip on beam bars (b) Distortion of joint; in joint region: causes diagonalLarge column width and good cracking and crushingconcrete help tn holding the of concretebeam bars
Figure 3.28 Pull-push forces on joints cause two problems- these result in irreparable in joints under strong seismic shaking (IITK-BMTPC, 2003)
Further, under the action of the above pull-push forces at top and bottom ends, joints
undergo geometric distortion, one diagonal length of the joint elongates and the other
compresses. If the column cross-sectional size is insufficient, the concrete in the joint
develops diagonal cracks.
1. Reinforced the beam-column joint
Problem of diagonal cracking and crushing of concrete in the joint region can be controlled
by two means, namely providing large column sizes and providing closely spaced closed-
loop steel ties hold together the concrete in the joint and also resist shear force, thereby
reducing and crushing of concrete (Figure 3.29).
76

^-C losed ties
10 times diameter of tieBean;
Figure 3.29 Closed loop steel ties in beam-column joint: such ties with 135° hooked resist the ill effect of distortion of joints (IITK-BMTPC, 2003)
Providing closed-loop ties in the joint requires some extra effort. Seismic code recommends
continuing the transverse loops around the column bar through the joint region. In practice,
this is achieved by preparing the cage of the reinforcement (both longitudinal and stirrups) of
all beams at a floor level to be prepared on op of the beam formwork of that level and
lowered into the cage. However, this may not always be possible particularly when beams
are long and the entire reinforcement cage becomes heavy.
m. Anchoring beam bars
The gripping of beam bars in the joint region is improved first by using column of
reasonably large cross-sectional size. Seismic code requires building columns in red seismic
zones to be at least 30 cm wide in each direction of the cross-section when these columns are
taller than 4m between floors (or beams). The American Concrete Institute recommends a
column width of al least 20 times the diameter of largest longitudinal bar used in the
adjoining beam.
In exterior joints where beams terminate at columns, longitudinal beam bars to be anchored
into the column to ensure proper gripping of bar in joint. The length of anchorage for a bar of
grade fy415 (characteristic tensile strength of 415MPa) is about 50 times its diameter. This
length is measured from the face of the columns to the end of the bar anchored in to the
column. In columns of small widths and when beam bars are of large diameter a portion of
beam top bar is embedded in the column that is cast up to the soffit of the beam, and a part of
it overhangs. It is difficult to hold such an overhanging beam top bar in position while
casting the column up to the soffit of the beam. On the other hand, if column width is large,
the beam may not extend below the soffit of the beam. Thus, it is preferable to have columns
with sufficient width. Such an approach has been used in the American practice.
77

Beam bars bent in joint region do not( cany tension force unless straightened
(a) Poor Practice
BeamBeam bars are within column
bars and also straight
(b) Good Practice
Figure 3.30 Anchorage of beam bars in interior joints; diagrams (a) and (b) show cross sectional views in plan of joint region (IITK-BMTPC, 2003)
In interior joint, the beam bars (both top and bottom) need to go through the joint without ant
cut in the joint region. In addition, these bars must be placed within the column bars and with
no bends (Figure 3.30).
n. Vulnerability of open-ground storey building during earthquakes
Reinforced concrete (RC) frame buildings are becoming increasingly common in developing
country. Many such buildings constructed in recent times have a special feature - the ground
storey is left open for the purpose of parking, i.e., columns in the ground storey do not have
any partition walls (of either masonry or RC) between them. Such buildings are often called
open ground storey buildings. Open ground storey buildings have consistently shown poor
performance during past earthquakes across the world (for example during 1999 Turkey,
1999 Taiwan and 2003 Algeria earthquakes.
An open ground storey building, having only columns in the ground storey and both partition
walls and columns in the upper storeys, have two distinct characteristics, namely:
i. It is relatively flexible in the ground storey, i.e., the relative horizontal displacement it
undergoes in the ground storey is much larger than what each of the storeys above it
does. This flexible ground storey is also called soft storey.
ii. It is relatively weak in ground storey, i.e., the total horizontal earthquake force it can
carry in the ground storey is significantly smaller than what each of the storeys above it
can carry. Thus, the open ground storey may also be a weak storey. Often, open ground
storey buildings are called soft storey buildings, even though their ground storey may be
soft and weak. Generally, the soft or weak storey usually exists at the ground storey level,
but it could be at any other storey level too.
78

The presence of walls in upper storeys makes them much stiffer than the open ground storey.
Thus, the upper storeys move almost together as a single block, and most of the horizontal
displacement of the building occurs in the soft ground storey itself. In common language,
this type of buildings can be explained as a building on chopsticks. Thus, such buildings
swing back-and-forth like inverted pendulums during earthquake shaking (Figure 3.28.a),
and the columns in the open ground storey are severely stressed (Figure 3.28.b). If the
columns are weak (do not have the required strength to resist these high stresses) or if they
do not have adequate ductility, they may be severely damaged which may even lead to
collapse of the building.
Earthquakeoscillations
^ Pendulum
Stiff upper storeys:Small displacement betw een^
adjacent floors
Soft ground storey:Large displacement Detween
foundation and first floor
r i pm m l i
m 1 3sff: f
o :-Sho 1
ii i i n ■ i f■
KSSS."iTU" rsssrsrti
■RSVUS------
(b) Ground storey columns severely stressed
Figure 3.31 Upper storeys of open ground storey buildings move together as a single block; such buildings are like inverted pendulums (IITK-BMTPC, 2003)
.>
Open ground storey buildings are inherently poor systems with sudden drop in stiffness and
strength in the ground storey. In the current practice, stiff masonry walls are neglected and
only bare frames are considered in design calculations. Thus, the inverted pendulum effect is
not captured in design.
o. Open ground storey improved design strategies
Many seismic codes have included special design provisions related to soft storey buildings.
Firstly, it specifies when a building should be considered as a soft and a weak storey building.
Secondly, it specifies higher design forces for the soft storey as compared to the rest o f the
structure. Seismic code suggests that the forces in the columns, beams and shear walls (if any)
79

under the action o f seism ic loads specified in the code, may be obtained by considering the
bare fram e building (w ithout any infill). H ow ever, beam s and colum ns in the open ground
storey are required to be designed for 2.5 tim es the forces obtained from th is bare fram e
analysis.
For all new RC fram e buildings, the best option is to avoid such sudden and large decrease in
stiffness and/or strength in any storey; it w ould be ideal to build w alls (either m asonry or RC
w alls) in the ground storey also. D esigners can avoid dangerous effects o f flexible and w eak
ground storeys by ensuring tha t too m any w alls are not d iscontinued in the ground storey, i.e.,
the drop in stiffness and strength in the ground storey level is not abrupt due to the absence
o f infill walls.
The existing open ground storey buildings need to be strengthened suitably so as to prevent
them from collapsing during strong earthquake shaking. The ow ners should seek the services
o f qualified structural engineers who are able to suggest appropriate solutions to increase
seism ic safety o f these buildings.
p. Short columns during earthquakes
D uring past earthquakes, reinforced concrete (RC) fram e buildings that have colum ns o f
d ifferent heights w ithin one storey, suffered m ore dam age in the shorter colum ns as
com pared to ta ller colum ns in the sam e storey. Two exam ples o f buildings w ith short
colum ns are shown in Figure 3.32 - buildings on a sloping ground and buildings w ith a
m ezzanine floor.
(b)Mezzanine
Floor\
(a) □ □ □ □ □ □ □ □ □ □ □ □
□ □ □ a□ □ □ a□ □ □ a□ □ c u nE
TallColumn
v y I w '' Regular
Column■ShortColumn
Sloped Ground
Figure 3.32 Buildings w ith short colum ns - tw o explicit exam ples o f com m on occurrences(IITK -B M TPC , 2004)
80

Poor behaviour o f short colum ns is due to the fact that in an earthquake, a tall colum n and a
short colum n o f sam e cross-section m ove horizontally by sam e am ount A (Figure 3.33).
H ow ever, the short colum n is stiffer as com pared to the tall colum n, and it attracts larger
earthquake force. S tiffness o f a colum n m eans resistance to deform ation - the larger is the
stiffness, the larger is the force required to deform it. I f a short colum n is not adequately
designed for such a large deform ation, it can suffer significant dam age during an earthquake.
This behaviour is called Short C olum n Effect. The dam age in these short colum ns is often in
the form o f X -shaped cracking - this type o f dam age o f colum ns is due to shear failure
Short Column:Attracts larger horizontal force
horizontal force
Figure 3.33 Short colum ns are stiffer and attract larger forces during earthquakes; this m ust be accounted for in design (IITK -B M TPC , 2004)
q. The short column behaviour
M any situations w ith short colum n effect arise in buildings. W hen a building is rested on
sloped ground, during earthquake shaking all colum ns m ove horizontally by the sam e
am ount along w ith the floor slab at a particular level (this is called rigid floor d iaphragm
action). I f short and tall colum ns exist w ithin the same storey level, then the short colum ns
attract several tim es larger earthquake force and suffer m ore dam age as com pared to taller
ones. The short colum n effect also occurs in colum ns that support m ezzanine floors or loft
slabs that are added in betw een tw o regular floors.
There is another special situation in buildings w hen short-colum n effect occurs. C onsider a
wall (m asonry or RC) o f partial height built to fit a w indow over the rem aining height. The
adjacent colum ns behave as short colum ns due to presence o f these walls. In m any cases,
o ther colum ns in the sam e storey are o f regular height, as there are no w alls adjo in ing them .
W hen the floor slab m oves horizontally during an earthquake, the upper ends o f these
colum ns undergo the sam e displacem ent (F igure 3.34). H ow ever, the s tiff w alls restrict
horizontal m ovem ent o f the low er portion o f a short colum n, and it deform s by the full
81

amount over the short height adjacent to the window opening. On the other hand, regular
columns deform over the full height. Since the effective height over which a short column
can freely bend is small, it offers more resistance to horizontal motion and thereby attracts a
larger force as compared to the regular column. As a result, short column sustains more
damage.PartialHeightWall
Shortcolumn
RegularColumnOpening
Portion of column restrained from mo vi no
Figure 3.34 Short columns effect in RC buildings when partial height walls adjoin columns; the effect is implicit here because infill walls are often treated as non-structural elements
(IITK-BMTPC, 2004)
In new buildings, short column effect should be avoided to the extent possible during
architectural design stage itself. When it is not possible to avoid short columns, this effect
must be addressed in structural design. Seismic code for ductile detailing o f RC structures
requires special confining reinforcement to be provided over the full height of columns that
are likely to sustain short column effect. The special confining reinforcement (i.e., closely
spaced closed ties) must extend beyond the short column into the columns vertically above
and below by a certain distance as shown in Figure 3.35.
82

Short Column Regular Column
Length depends on diameter of
Mezzanine
Figure 3.35 Details o f reinforcement in a building with short column effect in somecolumns (IITK-BMTPC, 2004)
In existing buildings with short columns, different retrofit solutions can be employed to
avoid damage in future earthquakes. Where walls of partial height are present, the simplest
solution is to close the openings by building a wall of full height - this will eliminate the
short column effect. If that is not possible, short columns need to be strengthened using one
of the well established retrofit techniques. The retrofit solution should be designed by a
qualified structural engineer with requisite background.
3.6.3 Effects upon Engineered Buildings
The primary focus of most model engineered building codes, which are also currently
released by the International Building Code, is to ensure life safety. According to seismic
design philosophy, the engineering intention is to make buildings earthquake resistant; such
buildings resist the effects of ground shaking, although they may get damaged severely, but
83

would not collapse during a strong earthquake, so that people can be evacuated. Designing
buildings to resist earthquakes involves controlling the damage to acceptable levels at a
reasonable cost. Obviously, engineers designing earthquake-resistant buildings recognise
that some damage is unavoidable. Earthquake-resistant design is therefore concerned about
ensuring that the damage in buildings during earthquakes is o f the acceptable variety, and
also that it occurs at the right places and in the right amounts.
Observations of the nature, degree, and spatial distribution o f damage in past earthquakes
have shown that engineered buildings are not expected to collapse in a major earthquake,
both in developed and developing countries. In engineered buildings, almost no structural
components failed due to the shaking, but a large number o f the non-structural components
such as partition walls were damaged, even failed. Sometimes, such a destructive earthquake
generates a peak ground acceleration more (PGA) than that o f maximum design criterion. In
the Taiwan earthquake (1999), there was PGA (0.99g) o f more than four times this
maximum design criterion (0.23g). It is easy to see why so many buildings and bridges
collapsed, including engineered buildings (Lee et al, 2003).
Based on excellent full-scale test results on real-life structures after earthquakes, seismic
codes used to design engineered building have rapidly matured. In the Kobe earthquake
(1995), the damage statistics data described that there was clear evidence o f the impact o f
substantial improvements in the Japanese codes and standards o f design practice according
to ground shaking; the engineered buildings built post 1982 survived the earthquake much
better than those constructed prior to 1982. In the Taiwan earthquake (1999), all failure
niodes observed were well known and have been extensively described in the past (Bruneau
et al, 2003).
However, in the Yogyakarta earthquake, some engineered buildings collapsed. Boen (2006b)
observes that the most obvious type o f damage is to the first, soft story. From the damaged
columns o f all those buildings, it can be concluded that the reinforcement detailing,
particularly the size and spacing o f stirrups, did not cater for earthquake resistance. The
spacing o f the stirrups (transverse reinforcement/column ties) is inadequate. The hooks at the
ends o f the stirrups are not 135°. Inadequate lap slices and embedment lengths for the
longitudinal bars are observed. Poor quality concrete is evident. The STIE and ISI buildings
represent interesting findings. There are four identical buildings at the STIE site. One
suffered a first soft story type of damage and in the second building, the roof collapsed and
the top floor suffered structural damage. On the other hand, the third and fourth survived
84
with minor damage. There are two identical buildings at the ISI area; one suffered partial
first soft story damage and the second survived without any visible damage.
From a general assessment, it could be assumed that those identical buildings were designed
in the same way, but the construction process was actually completely different, although the
performance o f the identical buildings was exactly the same after the overall construction
processes were finished. Those buildings have been utilised in a normal manner for many
years. In fact, the latest earthquake has proven that something goes deadly wrong with the
poorly constructed buildings. Is there any misconduct during the construction process,
corruption for example? It is difficult to evaluate the extent to which corruption might have
played a role. Corruption in the Indonesian government is prevalent and seem to contribute
to corrupt practice in the construction industry. In the construction o f public low or high rise
buildings, corruption can occur when building permits are obtained through bribes and
political favours or inspectors are paid to design or building practices that deviate from the
compliance o f code and standard specification. Here, it can be surmised that, no matter how
good or sophisticated the design or planning in both engineered and non engineered
buildings, it will be the people who make the decisions on how extensive the risk will be.
The morals and ethics are very crucial in every decision.
In general, the engineered buildings constructed in recent years were built using modem
seismic codes. An enormous impact has been made in improvements to the new buildings,
both in rural and urban areas. Good, very good, and even excellent seismic performance has
been shown in engineered buildings during past earthquakes. WHE (World Housing
Encyclopaedia) in www.world-housing.net, which is founded by EERI and IAEE, have
resumed some engineered building in many high seismic zones (Table 3.2). Almost all the
structural and architectural features in these houses comply with seismic resistance codes.
85

Tabl
e 3.2
E
xam
ples
of
seis
mic
fe
atur
es,
for
man
y en
gine
ered
ho
use
type
s
TJ O) <155 i 1 0) >> < E U) ro E ZD .E 42
~~r
s i | iS--2 8 °5 05 > x:
E CO
CDC L>»CDCOZDOX
I
oO
= 0)0to f c - ’g o “ c
— CJ CD COO O to
__ CO -Q ,
| - ° T J O ®1 CD co . E __S S i 3 “ S £ o
• i o o E '5 2 ° q co ,<n X3
~7r "7-
CD. "8 2 1 P Ojc
CD q C O~ 42 o o ^ . 5 ^ 5CD CD >■»DZ J5
o
£ • 0 5
E - a
X X
1 ® TO 0 <«g 2 $ .2 g > £ £ to x : iS ra o O’ .E 1 ’5O O -*= -c _o
~7- ~7- "7" '7*
I 42 ro os= O | = Dr - C CD TZZ
n o Q ) =3<-> £< x: -O w co
~7- 'P- ~?-
£ 8o oE •=
(DEQ>TO
CO
£ £Q. CDE 8 00 _
£ c --g c 5 *
.2 to co- S i -
43q o £* ^ 2 co: •= o
•■i s iCD
c " 2
S i s• c ^ - 8(D 'C O n O ) Q )
^ ^ O j -2 c >< ^ •= Q><d is an'co 2 0} c c c8 *C0 L -
E o.52 .Z o>E*i1S
£ o ’ ■= -P x=| e S^ w c o ^ ro 2 § ra
s .&•0 5 'C
o I b£ c g S JG 03i i si i sC/5 CO " 2
E= CDS’ 58 = 8
CD
E o ’20 5 0 (DE 2 c
X o c oCO X3
as-gt x “ co 1— £ CD
5=1 c_ E CO CD E
NCO - ■O .&
CD . 2•S5£ co ^8ts .55 £ J2
O - c5 TOCO
w fl) £S’ £ ■§ ® x 2
B oo _
e r
.2 8 CO
2 ECD *o
O £ eg £ ,-Lx= . s ^o p coCO « 3 - 2® o tra « EC/5 2 o
= CO CO5 £ co ^ « EJzz CO *n
| A lW CN o
s f i
i f 5"co 2 c co £ co8 8 £
H CN CD
O CO CO
.e>8 = |
£ £0 C CO —
3=: x j co jd<D CDj* I1o ■»^ £ s: co
- to CO =
1 5^ T38 Sja | c E S =
£ 8 a) a)0 5 'a3
• c O co 2■9 ,8 _“D CO*
■SI I
I g !> u. £
£ e
CD CO
| iS |a> ^ co ^
= s§ E r ! o : o £5
• c XI CD O.■>< .ro> LLI -O
^ 2 2 = E^ a =3■S ^ to - g - g £
*0 3=3^m 8 o
m w 5•S | Sc O c CO p 3 = j= XJco co E
CO? I!'■§ TO 2■g 8
toao CDC5 oO
86

Tabl
e 3.2
co
ntin
ued
“7 - ~7- ~7-■s <2 8 "o
^ - t— (n0 ) O m
> O CO0-0
" r Xcr
~7"oa:
~7- X Xcd
I -2' -O §.= § I s ’CL
>-
>-
£3 Hi 0)<- .2 <o <0 b >2 'o 8 & = == ° — R 2ro o o $
f p 8 IO C CD c w r o te
•CO J z C r o p :J= »_ CDro c to o a £ 0 w^mJD (U TO . CO O — ^ *7
> CO - rn i * • -. oQJ ro ro ^ £ . r a £ 0 I c "5 rvT OT ”I w ! § 5
^ .E cr ° rog c r o ~ 2 o o £ O ro m to ^ ro “ x; c c S * tu £ ro o ro
S - g
1P1e co . a -qg ^ 8 E
-2 o §> o £ «" CO *0 ---ro CO CO E TD £
Q. 05 Q) COro .Eg- roro ro"O tz— 3
.S’2 to -o -a2 ga? ro
T5 o ro o o . —
CO ^ CZ C8 ro
CO .— 2 CO 8I Ito oE’-SO) c
g rohC X
'5 2 jx c= u - ro ° E ^ ro'51 _i cr O 2
i= — “Oco 2 c3 COa .o w
E a3<0 .05 CDCD CD2 ro •a o ro c■S 8 .8i2S g •i Ero cd E CD
!•" > *o= 3 co -QcCD C 0).QE PCO o a) •£=Q_ 0>ro co " F
CO ,2 > j §o ) co *2 .ro ^ fc3 W C
CD * > CO
--ICOQ) *o ro ro co2 "ro2 2S'S - o8 m
oco
E j E | LU O czr- o
o o o o COQ. 0)| 0
COCD o
o o
Tt-ooCM
s-S.q .52 O r o
ros |a o
ro c 2oto T3 _E l io g E5 8 8
g> £ J 2 E5 |E ro
g - > ..
.roi ro 2 i jd jo 1 -a ro ! -a ro: ro 8
2 a3 < o gM3 "2;o gw 2
87

3.7 The Existence of Seismic Codes
Ground vibrations during earthquakes cause forces which deform structures. Structures need
to be designed to withstand such forces and deformations. Seismic codes help to improve the
behaviour o f structures, so that they may withstand the earthquake effects at the appropriate
levels o f ground motion. A seismic code is a set o f legal requirements intended to ensure that
a building is designed and constructed so that, if it is subjected to earthquake destructive
forces, it will present no significant threat to the life, health, or welfare o f its occupants or
the general public (BSSC, 1995).
The primary focus o f most seismic codes is to ensure life safety. Continued operation o f a
facility and reduction of economic losses associated with earthquake damage to the facility
are o f secondary consideration, if they are considered at all during the design process (Gould,
2002). Seismic codes are minimum standards, but they ensure a certain quality of
construction and performance when enforced. Countries around the world have procedures
outlined in seismic codes to help design engineers in the planning, designing, detailing, and
cpnstructing o f structures. An earthquake-resistant building covers four virtues, as follows:
a. Good structural configuration
Its size, shape, and structural system carrying loads are such that they ensure a direct and
smooth flow of inertia forces to the ground.
b. Adequate lateral strength
The maximum lateral (horizontal) force that it can resist is such that the damage induced
does not result in collapse.
c. Adequate stiffness
Its lateral load resisting system is such that the earthquake-induced deformations do not
damage its contents under low-to-moderate shaking.
d. Good ductility
Its capacity to undergo large deformations under severe earthquake shaking, even after
yielding, is improved by favourable design and detailing strategies.
Generally, the use o f seismic design provisions can affect a building owner or a community
in various ways and to varying degrees. Among the major factors to be considered are the
followings (BSSC, 1995):
a. Buildings designed and constructed in accordance with up-to-date seismic provisions can
be expected to reduce life loss, injuries, and property damage when an earthquake occurs.
For an individual building owner, this should reduce the cost o f repairs and minimize the
amount o f time that the building cannot be used. For a community, this should reduce

the costs o f emergency response and recovery, keep essential facilities operational, and
lower the cost o f replacing public buildings.
b. The possibility o f costly litigation concerning liability for earthquake effects would most
likely be reduced for all those involved in the building process.
c. Requiring seismic design and construction o f new buildings may increase costs but far
less than many people think.
Seismic codes are unique to a particular region or country. They take into account the local
seismology, accepted level o f seismic risk, building typologies, and materials and methods
used in construction. Furthermore, they are indicative o f the level o f progress a country has
made in the field o f earthquake engineering.
The manual for seismic resistance in simple houses in Indonesia has been published since
1978 (Boen, 1978). The newest formal seismic code in Indonesia for ordinary buildings,
namely SNI-1726-2002, was published in 2002 (DPU, 2002). This code replaced the old one,
SNI-1726-1989, published in 1989. In SNI-1726-2002, ordinary buildings are designed for
an earthquake return period o f 500 years, which corresponds to approximately 10 percent
probability o f exceedance in 50 years. It was assumed that the economic life o f ordinary
buildings is about 50 years. On the other hand, SNI-1726-1989 was designed for a return
period o f 200 years only. The earthquake return period o f 500 years was also adopted for
ordinary buildings by the USA Seismic Code. In addition, for essential facilities in the USA
(such as electrical power and water networks, hospital, bridges which are required to be
operational after the quake event), they are designed for earthquake return period o f 2,500
years, which corresponds to approximately 2 percent probability of exceedance in 50 years
(Gould, 2004).
Countries with a history o f earthquakes have well developed earthquake codes. Thus,
countries such as Japan, New Zealand, and the United States of America have detailed
seismic code provisions. Development o f seismic codes in Indonesia started rather late. The
most important thing, according to the existence o f seismic codes, is that there is no need to
delay enforcing and implementing these design code provisions in actual construction,
particularly on non-engineered buildings in areas susceptible to earthquakes.
89

3.8 Seismic Features in Building
It is widely accepted that the adoption of seismic features, based on up-to-date seismic safety
design provisions for new and existing buildings, is generally considered to be a significant
way o f lessening the risk to life by requiring that such buildings be designed and constructed
in a manner that will prevent their structural collapse during an earthquake (BSSC, 1995). In
this respect, past experience shows the world community just how horrifying an earthquake
is, while also illustrating that buildings, designed and constructed under up-to-date seismic
features, will perform well.
Therefore, it is very useful to list some seismic features for masonry and reinforced concrete
buildings, materials used for most 'new culture' non-engineered buildings in Indonesia. Some
seismic features mentioned in Table 3.3 are scrutinised and extracted from several literature
corresponding with Tables 3.1 and 3.2 and presents a checklist consisting o f general
structural and architectural features, together with a brief explanation:
Table 3.3 Common seismic features for masonry and reinforced concrete
No Structural/Architectural
Features
Statement
1 Lateral load path The structure contains a complete load path for seism ic force effects from any horizontal direction that serves to transfer inertial forces from the building to the foundation. This include plinth band, lintel band, sill bands, roof band, gable band, vertical reinforcement in all wall comers.
2 Building configuration The building is regular with regards to both the plan and the elevation.
3 R oof construction The roof diaphragm is considered to be rigid and it is expected that the roof structure w ill maintain its integrity, i.e. shape and form, during an earthquake o f the intensity expected in this area.
'4 Floor construction The floor diaphragm(s) are considered to be rigid and it is expected that the floor structure(s) w ill maintain its integrity, during an earthquake o f the intensity expected in this area.
5 Foundationperformance
There is no evidence o f excessive foundation movement (e.g. settlement) that would affect the integrity or performance o f the structure in an earthquake.
6 Wall & frame structures-redundancy
The number o f lines o f walls or frames in each principal direction is greater than or equal to 2.
7 Wall proportions Height-to-thickness ratio o f the shear walls at each floor level is: (a) Less than 25 (concrete walls); (b)Less than 30 (reinforced masonry walls); (c) Less than 13 (un-reinforced masonry walls).
8 Foundation-wall connection
Vertical load-bearing elements (columns, walls) are attached to the foundations; concrete columns and walls are doweled into the foundation.
90

Table 3.3 continued
9 Wall-roof connections Exterior walls are anchored for out-of-plane seismic effects at each diaphragm level with metal anchors or straps.
10 Wall comer connections
Wall comer connections are considered to be good.
11 Wall openings The total width of door and window openings in a wall is: (a) for brick masonry construction in cement mortar: less than 14 of the distance between the adjacent cross walls; (b) for adobe masonry, stone masonry and brick masonry in mud mortar: less than 1/3 of the distance between the adjacent cross walls; (c) for precast concrete wall structures: less than 3A of the length of a perimeter wall.
12 Vertical reinforcements Steel bars provided in the wall masonry all around the openings restrict X-cracks at the openings in walls.
13 Compliance with the soil and reinforced concrete analysis
Compliance with the reinforced concrete analysis is considered to be good (per local construction standards). Some failures below should be highlighted: (a) failure of weak and soft stories, (b) failure due to irregularity, (c) failure due to overturning, (d) failure of columns in shear, (e) failure due to short column, (f) failure of beam-to-column joints, (g) damage to precast concrete cladding elements.
14 Quality of building materials
Quality of building materials is considered to be adequate per requirements of national codes and standards (an estimate)
15 Quality of workmanship
Quality of workmanship (based on visual inspection of few typical buildings) is considered to be good (per local construction standards).
16 Maintenance Buildings of this type are generally well maintained and there are no visible signs of deterioration of building elements (concrete, steel, and timber).
In conclusion, lateral load path or horizontal bands (including vertical reinforcement in all
wall comers) are the most important earthquake-resistant feature in masonry buildings. The
bands are provided to hold a masonry building as a single unit by tying all the walls together,
and are similar to a closed belt provided around cardboard boxes. These bands need to be
provided in almost all buildings. The gable band is employed only in buildings with pitched
or sloped roofs. In buildings with flat reinforced concrete or reinforced brick roofs, the roof
band is not required, because the roof slab also plays the role o f a band. In buildings with
pitched or sloped roof, the roof band is very important. Plinth bands are primarily used when
there is concern about uneven settlement o f foundation soil. Although almost all o f the
seismic features mentioned in Table 3.3 are in line with the existing seismic codes in
Indonesia, the above checklist provides a systematic way to have a look seismic features
element by element, and this can be used as a complement for the existing codes in Indonesia.
91

3.9 A Wide Gap between Earthquake Facts and the Existence of Seismic Codes
The catastrophic earthquakes around the globe have reminded the world communities of the
importance of understanding the facts of high seismic risk. Over the past few years, this type
o f depressing scenario has repeated itself in India, Afghanistan, Algeria, Iran, and, the most
tragic at the end o f 2004, across 12 nations, during which Indonesia suffered most. The
Yogyakarta earthquake in 2006 is also a remainder. Lessons learned from past earthquakes
have indicated that non-engineered buildings will suffer most during earthquakes. Most of
the loss o f life during earthquakes has occurred due to the collapse o f these buildings. This is
especially true in the developing world in areas such as Indonesia, where most residential
buildings are low rise, non-engineered constructions. With increasing number o f non-
engineered buildings without seismic resistance into areas susceptible to earthquakes,
vulnerability to earthquakes will intensify. It is deeply concerning that communities continue
to experience excessive losses o f precious human lives and valuable property, as well as
serious injuries and major displacement, due to earthquake events (UNDP, 2004). Some of
the evidence above shows that earthquake incidents will remain the single largest cause of
massive human deaths and injuries as long as many non-engineered buildings without
seismic features still exist in high seismic areas.
On the other hand, most developing countries in high seismic areas such as India and
Indonesia have developed seismic features/codes. Proper implementation o f seismic codes in
construction can help structures to withstand ground shaking during earthquake. The
existence o f seismic codes can be easily applied to non-engineered buildings. Hence, non-
engineered buildings without seismic features will eventually be replaced by more reliable
constructions built using seismic code features, both new and retrospectively.
All professionals and people who have embraced seismic reduction find the high death tolls
to be emotionally wrenching and simply unacceptable (Comartin et al., 2004). Professionals
in each country have sufficient knowledge o f seismic codes to save lives and human
suffering. It is evident from many examples that progress has been made in the analysis of
risk and vulnerabilities, or knowledge o f how to reduce these risks. Yet, earthquakes
continue to claim thousands of lives every year due to the persistence o f people not
implementing the existing seismic codes. Obviously, it is widely accepted that there is a
wide gap between massive death tolls caused by earthquakes and the existence o f seismic
codes (Figure 3.36). Many of the deaths could have been reduced, even avoided, if
understanding and implementation o f seismic codes had been employed properly. In fact,
92

failures are often due to a lack of action or enforcement of well-known solutions, namely
seismic codes. The most important means of tackling the compelling problem is to realise
that the key to ensuring earthquake safety lies in having a robust mechanism that enforces
and implements these design code provisions in actual construction, bridging the gaps
between knowledge and action, to avoid the generation of new risks (IITK-BMPTC, 2002
and Shah, 2002).
Earthquake facts• Earthquakes continue to claim thousand
of lives every year• Most of the deaths are caused by the
collapse of non-engineered buildings
A wide gap between earthquake facts & the existence of seismic codes
There is widespread persistence of people not implementing the existing seismic codesThe key to ensuring earthquake safety lies in having a robust mechanism that enforces and implements these codes in actual construction, particularly within non-engineered building
Figure 3.36 The wide gap between earthquake facts and the existence of seismic codes
It is clear that unless something is done quickly to implement significantly seismic codes in
developing countries, earthquakes will continue to cause tragically greater human and
economic losses in these countries. All too often in developing countries, the resources
available in terms of manpower, money and management skills are limited, therefore it is
suggested that they are primarily focused on setting up systems to ensure that all new
constructions are seismically safe. Once there is a level of confidence in new constructions,
efforts can be directed towards seismic retrofitting programmes.
3.10 Sum m ary
A non-engineered building is an unsystematically designed, built, and supervised
construction. They are usually built by traditional builders, and/or building owners, using
common traditional approaches without intervention by qualified architects and engineers in
their design and construction. In Indonesia, non-engineered buildings dominate most
The existence of seismic codes• Seismic codes exist in high seismic countries
in order to reduce seismic risk, including those in Indonesia
• Self-build owner, builders, and local engineer can find and use them in easy way
93

residential buildings constructed by masonry or multi-storey reinforced concrete, up to two
stories. Most o f the loss o f life in past earthquakes has occurred due to the collapse o f these
buildings in both developing and developed countries.
Some o f the evidence shows that non-engineered buildings are still being constructed by
self-build owners, builders, and local engineers within medium-low-income populations in
Indonesia. Although these buildings will slowly be replaced by those o f a more reliable
construction, it is widely accepted that they will remain the single greatest source o f existing
seismic risk for the foreseeable future. Therefore, this gives a stronger urgency to the
introduction o f seismic resistance for non-engineered buildings, both for existing and new
buildings; in fact, it is imperative in order to reduce death tolls in future earthquakes.
Descriptions o f structural behaviours during earthquakes and a comparison o f seismic effects
between non-engineered and engineered buildings in simple language are very useful as a
starting point to introduce the importance o f seismic features for 'new culture' non-
engineered. buildings made o f heavy materials within medium-low-income populations in
Indonesia. The seismic features cover many aspects in both masonry and RC buildings, and
describe elements such as: simple structural configuration, influence o f openings, vertical
reinforcement, necessity o f horizontal bands in masonry buildings, openings in walls, roles
o f floor slabs and masonry walls, strength hierarchy in RC, beam and column design
strategies, beam-column joints, vulnerability o f open-ground storey, and short columns.
Seismic codes help to improve the behaviour o f structures so that they may withstand
earthquake effects at the appropriate levels o f ground motion. The enforcement and
implementation o f the seismic codes in actual construction is the key to ensuring earthquake
safety. The newest formal seismic code in Indonesia for ordinaiy buildings, namely SNI-
1726-2002, was published in 2002.
94

Chapter IVSeismic Risk Management, the Situation in Indonesia, and the
Importance of Integrated Seismic Risk Management in Indonesia
The previous chapter mentioned some tremendous and detrimental impacts o f earthquakes
and the wide spread persistence o f communities not to implement seismic codes on their
non-engineered buildings; the solution seemed merely to be physical or technical
intervention. This chapter, however, gives a broader spread o f ideas and useful seismic risk
management methods in relation to why the problem o f introducing seismic codes is not only
related to technical intervention, but also non-technical measures. In general, Chapter IV will
set out some good practices in seismic risk management activities in various countries,
provide an in-depth evaluation of these activities in the current Indonesian situation, and,
highlight the importance o f conducting integrated seismic risk management in Indonesia
through the development o f an integrated seismic risk management framework. The latter is
obviously an important section and also emphasises the benefits, the novelty, and the
contribution of the developed framework.
4.1 Definition of Risk Management
The term ’risk’ can be defined in variety o f ways. Risk is commonly used as a synonym for
‘hazard’, ‘danger’, or ‘threat’, i.e. an unplanned and undesirable event. It can also correspond
to the likelihood of an event occurring. Another meaning is the loss, injury, or other outcome
resulting from an event. It can also be described as the generality o f volatility and
uncertainty - the combined effect o f all the individual risks in an investment or situation
(Telford, 1998).
In terms o f a disaster (such as earthquake and flood), risk can be defined as the probability o f
harmful consequences or expected loss (of lives, people injured, property, livelihoods,
disruption o f economic activity or environment damage) resulting from interactions between
natural or human-induced hazards and vulnerable conditions (UN-ISDR, 2002). Risk is
95

conventionally expressed by the equation: Risk = Hazard + Vulnerability (UNDP, 2004). In
this research, the risk means the possibility o f suffering loss as the product o f hazard and
vulnerability.
Telford (1998) mentions that the basic model o f the classic art system o f management
consists o f input, process, output, and feedback loop, which is very vital to effective control
o f any system. Management decision-makers have the responsibility to make formal
judgements and appropriate decisions that will lead the organisation to a successful destiny.
Ideally, such decisions should be taken in an environment o f total certainty. In reality, the
decisions are contemplating future events, the outcomes o f which are therefore uncertain. As
a. result, risk has always been an intrinsic part of the decision making process. Decision
makers cannot generally predict a particular outcome with absolute confidence.
Nevertheless, using relevant experience and judgement, they can usually define the range of
possible outcomes, and then generate estimates o f the likelihood and consequences o f each,
with a reasonable degree o f confidence.
Wideman (1992) highlights that risk management is seen as a formal process, whereby risks
are systematically identified, assessed, and provided for. Risk management should be seen as
advanced preparation for possible adverse risk events, rather than being taken by surprise
when they arise; with such advanced planning, it still enables system objectives to be
achieved successfully. Flanagan and Norman (1996) mention that risk management is a
discipline for living with the possibility that future events may cause adverse effects. In other
word, risk management is pro-active in long term vision. In contrast to the pro-active mode,
crisis management is identified as being re-active, which consists of selecting an appropriate
response; however, if deliberate planning makes it possible to avoid an adverse situation in
the first place, then the pro-active approach would obviously be much better.
Similar to Wideman, Charette (2002) notes that risk management can be described as the
continuous analysis o f the current situation to realign current resources and management
policies against current and future threats, or to maximise the opportunities that are present,
thus helping to ensure that the desirable state originally envisioned occurs. Today's risks are
often yesterday's opportunities, and tomorrow's success is constrained by how well today's
risks are managed.
The status o f risk on a system varies significantly, during the course o f its life cycle, and, as
with most o f the other system functions, the most effective time for achieving the greatest
96

impact on system results is early.in the system development phase. Consequently, risk
management should be established as a continuing integrative function throughout the
system’s life cycle. In its most simplistic form, Wideman (1992) explains that the risk
management approach consists essentially o f four phases, i.e. risk identification, risk
assessment, risk response, and risk documentation. Meanwhile, the Government o f Canada,
in their context o f public policy, has developed an integrated approach to risk management
(TBSC, 2001), which is really similar to Wideman’s approach. The similarities between
Wideman’s and TBSC’s risk management approaches are illustrated in Table 4.1 as follows:
Table 4.1 Similarities between Wideman’s and TBSC’s risk management approaches(Wideman, 2004 and TBSC, 2001)
Wideman’s Risk Management Approach TBSC’s Risk Management Approach
Risk IdentificationThis phase consists o f identifying all the possible risks, which may significantly impact the success o f the system. Conceptually, these may range from high-to-low impact vice versa. Obviously, the high and medium risks should receive the most attention.
R isk IdentificationRelated activities are identifying issues and setting context. This can be achieved through defining the problem or opportunities, scope, context, and associated risk issues and deciding on necessary people, expertise, tools, and techniques.
R isk A ssessm ent Having identified the range o f possible risks, the next step is to assess them. The purpose is to determine their status in term o f type, impact, and probability. In practice, depending on the size and nature o f the system, effective risk management may require some quite detailed quantitative assessment o f the impact o f the various uncertainties. This data provides a basis for judging the reliability o f the original estimates, the effectiveness o f possible alternative strategies, and for planning the best overall responses.
R isk Assessm entThree activities related to this phase area. Assessing key risk areas (analysing
context/result o f environmental scan and determining types/categories o f risk to be addressed)
b. Measuring likelihood and impact (determining degree o f exposure and considering both the empirical/scientific evidence)
c. Ranking risk (ranking risk, considering risk tolerance, using existing or developing new criteria and tools)
R isk ResponseRisk response requires decisions that will enhance opportunities and reduce threats to the organisation’s objectives, as followsa. Establishing an appropriate system strategy,
such as avoiding the risk (do something to remove it), mitigating the risk (taking actions to lessens the impact or chance o f the risk occurring), and accepting the risk (the risk might be so small, the effort to do anything is not worthwhile),
b. Taking out insurance as appropriate as transferring the risk.
R esponding to R iskThis requires four activities as followsa. Setting desired result (defining objectives and
expected outcomes for ranked risksb. Developing actions (identifying and analysing
options - ways to minimise threats and maximise opportunities - approaches, and tools
c. Selecting a strategy (choosing strategy, applying decision criteria)
d. Implementing the strategy (developing and implementing a plan
97

Table 4.1 continued
Risk DocumentationFinal documentation is a vital part of any project activity though regretfully often overlooked. The purpose is to build database of reliable data for the continuing evaluating of risk on the current system, as well as for improving the database for all subsequent systems
Monitoring and EvaluationThis can be conducted through learning, improving the decision making/risk management process locally and organisation-wide, using effectiveness criteria, and reporting on performance and results.
Based on Table 4.1, it can be seen that the contents o f the risk management approach vary in
rigour or the extent o f actions considered, but the basic steps are similar. Particularly, risk
response may embrace risk retention/absorption, risk mitigation, risk transfer, and risk
avoidance (similar to Flanagan and Norman, 1996). Organisations may vary the supporting
task most suited to achieve common understanding and the implementation o f consistent,
efficient, and effective risk management. Organisations need to work with creativity and a
desire to innovate in order to meet their evolving needs and priorities.
4.2 Seismic R isk M anagem ent
Based on the above definition o f risk, seismic risk can be defined as the possibility o f
suffering loss (of lives, people injured, property, livelihoods, disruption o f economic activity
or environment damage) resulting from interactions between seismic hazard and vulnerable
conditions. The term of seismic risk is occasionally used in a general sense to mean the
potential for both the occurrence of natural phenomena and the losses associated with
earthquakes.
If the earthquake occurrence causes widespread losses that exceed specified values at a site,
at several sites, or in an area, during a specified exposure time, this event will become a
disaster. A disaster is a sudden, calamitous event that seriously disrupts the functioning o f a
community or society, causing widespread human, material, economic, or environmental
losses that exceed the community’s or society’s ability to cope using its own resources.
Disasters result from a combination o f hazards, vulnerability, and inability to reduce the
potential negative consequences of risk (UN-ISDR, 2003). Disaster risk represents public
risk, which affects all residents o f a risk-prone community with shared responsibility.
Reduction of disaster risk can be conducted through two principal methods (NDMD, 2004b),
i.e. preparedness and mitigation. Preparedness is a protective process, embracing measures
98

which enable governments, communities and individuals to respond rapidly to disaster
situations and to cope with them effectively. Preparedness includes the formulation o f viable
emergency plans, the development o f warning systems, the maintenance o f inventories and
the education and training o f personnel. It may also embrace search and rescue measures as
well as evacuation plans for areas that may be at risk from a recurring disaster. Meanwhile,
mitigation embraces all measures taken to reduce both the effect o f the hazard itself, and
conditions vulnerable to it, in order to reduce the scale o f a future disaster. Therefore,
mitigation activities can be focused on the hazard itself or the elements exposed to the threat.
An example o f a mitigation measure is the implementation of seismic features in buildings.
All disaster reduction strategies need to be supported by appropriate legislation with a clear
allocation o f responsibilities and budgetary provisions. In this research, such implementation
o f seismic features on non-engineered buildings is not only a simply physical measure, but
also conforms to non-technical intervention, such as government political will, education,
and training o f personnel. Therefore, the term ‘seismic risk reduction’ is highly utilised
instead o f ‘seismic risk mitigation’.
Specific to seismic risk, SCEC (2002) explains that seismic risk contains three factors, as
follows:
a. Hazard (faulting, shaking, land-sliding, liquefaction)
Living in a seismic prone area means that seismic risk is unavoidable. The risk is a fact
o f everyday life. It is impossible to manage the risk through prevention o f future
earthquakes, but improvement o f seismic hazard assessment and the provision of
reliable seismological and engineering-seismological information for planning and
design purposes is an important factor contributing to the efficiency o f risk management
programs.
b. Exposure (extent and density o f built environment)
When earthquakes occur in uninhabited areas, they are not considered to be disasters.
Sometimes civilisation and urbanisation make human beings more vulnerable to natural
phenomena. It happens, in particular, when there is high concentration o f population
and complicated infrastructure in earthquake prone zones. Hence, the processes o f land
use and urban planning, as well as the development o f new technologies, should take
into account the existing seismic threat.
c. Fragility (structural fragility)
The bitter engineering truth is that earthquakes do not kill people, vulnerable buildings
do. Though future earthquakes cannot be avoided, the community can improve the
seismic performance o f buildings and lifelines; reconstruct or retrofit old structures and
99

build new earthquake-resistant constructions using modem seismic codes, in particular,
for residential and critical buildings.
According to the definition o f disaster risk management developed by UNDP (2004), seismic
risk management can be described as the systematic process o f using administrative
decisions, organisation, operational skills and capacities to implement policies, strategies and
coping capacities o f society and communities to lessen the impacts of seismic hazards and
related environmental and technological disasters. This comprises all forms o f activities,
multiple groups at different levels o f understanding, commitment, and skill, including
structural and non-structural measures to avoid or to limit adverse effects o f hazards. Similar
to Wideman (1992), seismic risk management has been advanced as an integral paradigm
that builds on and incorporates all the previous strategies from the perspective that all
development activities should reduce seismic risks. Seismic events are uncontrollable and
unstoppable; hence much more activity in seismic risk management is required to produce
controllable long-term strategies and priorities. Usually, some elements in seismic risk
response correspond highly to risk absorption, risk mitigation, and risk transfer.
Problem of seismic risks different from risk in some business organizations. In such
organizations, the goal may be narrowly defined, such as profitability for the corporation.
Different measures o f profitability - each representing different level o f risk - are used as the
basis for projecting the next state of the corporations as a system. The goal o f the system is
control in the system’s performance (Comfort, 1999). In contrast, she also points out that
some problems of seismic risk are much more complicated as follows.
a. The management o f seismic risk poses several problems for decision-makers. For
example, the large scale seismic events for which planning is required are rare.
Consequently, planners rarely have access to realistic information upon which to base
their deliberations. The rarity of seismic event also means that experience is often
limited to one or two, often small-scale events that can bias thinking and result in an
underestimation o f the complexity o f seismic hazard activity.
b. Seismic risk represents public risk, which affects all residents o f a risk-prone
community. Whether or not they have contributed to the condition producing the threat.
c. Not only the problem, but also the decision-making responsibilities are shared in matters
o f public risk. Public managers are accountable to the citizens for the actions they take
(or do not take) in the interest o f public safety and welfare. The methods needed to solve
problems of seismic risk require a continuing process o f collective learning, rather than
control, to support collective action. Flux in global processes, tied in particular to
100

economic globalisation, changing local conditions, and including rapid urbanisation,
mean that seismic risk is not a static condition.
d. The policy problem becomes not how to achieve a specific outcome, but rather how to
generate and sustain a process of iterative inquiry and action that will, through its
system, lead its members to create new and more appropriate policies and practices in
response to needs from its environment.
e. The capacity of a community to mobilize collective action in anticipation and response
to perceived risk depends directly upon the degree o f awareness, level o f skills, access to
resources, and commitment to informed action among its members prior to the
occurrence o f a damaging event.
f. In seismic risk that endangers an entire community, interdependencies among technical,
organizational, cultural, and other types o f systems affect a community’s capacity to
both mitigate and respond to disaster. The best interest o f the individual is directly tied to
the community’s capacity to provide services that benefit the whole. There is no longer a
single actor, but many actors, involved in interdependent decisions that increase or
decrease the threat o f danger to the community. Seismic risk represents the type o f actual
policy problem that illustrates the interdisciplinary, inter-organisational, and inter-
jurisdictional characteristics that have made problems of shared risk extraordinarily to
resolve.
g. Seismic risk includes a class of policy problems that have defied solution by traditional
means o f analysis and planning.
4.2.1 Seismic R isk M anagem ent A pproach
Seismic risks can be managed effectively in a number o f ways. SCEC (2002) has developed
a. seismic risk management approach as advanced preparation, using a multidisciplinary
method. There are three phases that influence the seismic risk management approach.
Seismic hazard analysis corresponds with science, seismic risk assessment conforms to
engineering, and finally, political and economic action accords with mitigation. The length
or relative importance o f each component phase may vary and the boundaries between each
phase are not well defined, depending largely on the certain situation. Moreover, the seismic
risk management approach developed by SCEC (2002) tends to divide into three phases: risk
identification, risk assessment, and risk response, where risk documentation is embedded in
each phase, explained in Figure 4.1:
101

Seismic hazard analysis*
(as Risk Identification)
Fault characterization
4Earthquake scenario
4Seismic-wave propagation
Seismic risk assessm en t* (as Risk A ssessm ent)
i
Science
Political and economic actions* (as Risk R esponse)
*) including Risk Documentation in each phase
Site response
4---------------Structural response
4
-------------- In tensity m easu res --
Engineering
Perform ance modeling
'J'Risk estim ation
4--------Mitigation options
Damage m easu res —
4Mitigation
Mitigation decisions
Im plem entation
-- - Decision variables --
Figure 4.1 Seismic risk management approach (SCEC, 2002)
During the phase of seismic hazard analysis and seismic risk assessment, scientists and
engineers seek methods and approaches that will reduce the levels o f uncertainty associated
with the causes o f an event and the fragility and vulnerability o f structures subjected to the
event. Individuals become advocates of methods and approaches which, when accepted,
provide individual recognition and rewards. In addition, an important role for science and
engineering is to improve knowledge about the mitigation of the effects o f extreme events,
effectively transferring knowledge and facilitating collaboration among users o f the
knowledge (Petak, 2002).
In general, there are two types o f seismic hazard analysis, deterministic and probabilistic
(Gould, 2003). In a deterministic analysis, an earthquake event o f a specified magnitude is
assumed to occur on the fault that causes the greatest damage to the subject building(s). This
approach can intuitively be expected to generate a reasonably conservative “worst-case”
scenario for loss. On the other hand, a probabilistic analysis accounts for the full range of
possible earthquakes, their location, return period, size, and the propagation o f the
earthquake motion from the rupture zone to the site(s) o f interest. This provides a return
period curve with a more complete and ‘realistic’ evaluation o f the potential earthquake
losses.
102

In line with Figure 4.1, the next phase is political and economic actions as a seismic risk
response, which corresponds with mitigation action. An effective mitigation plan anticipates
actions that a community must take before a disaster strikes. Planning is one o f the most
important parts o f any mitigation effort. Taking the time up front to make people aware of
the earthquake risk to their community, making a plan o f how to reduce that risk over time,
and what to do in the event o f an earthquake can make a tremendous difference in post
disaster recovery efforts.
It is clear from Figure 4.1 that seismic risk management needs risk “dimensioning”, and risk
sizing takes into account not only the expected physical damage, victims and equivalent
economic loss, but also social, organisational and institutional factors. The difficulty in
achieving effective seismic risk management, in part, has been the lack o f a comprehensive
conceptual framework o f seismic risk, facilitating its evaluation and intervention from a
multidisciplinary perspective. Most existing indices and evaluation techniques do not express
risk in words adequate for the diverse types of decision-makers, and they are not based on a
holistic approach that invites intervention (IDEA, 2005).
According to the growing recognition mentioned above, although the risk management
approach in Figure 4.1 shows distinctive steps, those activities in the seismic risk
management approach enables an overlap between each step. This means that the activities
in each step are not as clear-cut as are sometimes implied. In most cases, while different
countries have implemented earthquake risk management movements that differ from each
other in detail and degree, they are nevertheless the same in principle.
The seismic risk management approach in Figure 4.1 has been adopted in this research. In
addition, it should be emphasised that Chapters II and III have clearly identified the true
nature of the seismic risk focused on by this research, i.e. the continued non-seismic
resistance of non-engineered buildings in Indonesia. Hence, the risk identification phase in
this research is not to further identify the risk, rather to capture progress, hence the name
‘seismic hazard analysis’, as precisely adopted from SCEC. However, the term ‘political and
economic actions’ used by SCEC is not adopted, and seismic response phase in this research
is simply named 'seismic risk response’. Finally, the seismic risk management approach
adopted in this research will comprise three headings: seismic hazard analysis, seismic risk
assessment, and seismic risk response. The first draft o f the proposed framework in Chapter
V will elaborate this matter further.
103

4.2.2 Reducing the Cost of Loss Using Seismic Risk Management Actions
Seismic risk management has been well known in recent decades. Some countries have
employed seismic risk management actions, based on a belief that investment in mitigation is
much more cost effective than expenditure on relief and rehabilitation (NDMD, 2004a). In
other words, the expected cost of loss after an earthquake has occurred can be reduced using
seismic risk management actions. Chen et al., (2003) mentions that expected loss during an
earthquake can be cut down significantly through preventive activities before the disaster
happens. Some examples below present the cost-effectiveness o f disaster risk reduction
(DFID, 2004):
a. The World Bank and the US Geological Survey calculated that economic losses
worldwide from disasters during the 1990s could have been reduced by US$ 280 billion
worldwide if US$ 40 billion were invested in mitigation and preparedness.
b. In China, an investment o f US$ 3.15 billion in flood control measures over 40 years is
believed to have averted potential losses o f US$ 12 billion.
c. In Vietnam, 12,000 hectares o f mangroves planted by the Red Cross protect 110 km of
sea-dykes. Planting and protection cost US$ 1.1 million but has reduced the cost o f dyke
maintenance by US$ 7.3 million per year (and the mangroves have protected 7,750
families living behind the dyke).
d. According to Oxfam, the value of cattle saved on a flood shelter o f four acres in
Bangladesh during the 1998 floods was as much as £150,000, against a construction cost
o f only £8,650.
Obviously, seismic risk management decisions must be made and implemented, particularly
in high seismic areas around the world. Setting priorities for action is imperative, since the
need for improvement will always vastly exceed the available resources (SCEC, 2002).
4.3 Some Evidence of Good Practices of Seismic Risk Management Implementation in Countries
In many countries with significant seismic problems, the implementation o f seismic risk
management has increased. Some evidence o f good practices employing seismic risk
-management fionrtheir seismic hazard, assessment, and response might be used as best
examples for other countries with similar problems. This section presents, as extracted from
many sources o f literature, three important factors that drive successful and effective
implementation o f seismic risk management in various countries, particularly interrelated
with non-engineered buildings. These are (a) direct involvement o f multidisciplinary
104

stakeholders, (b) strengthening o f local capacities, and (c) poverty consideration. Evidence
that the successful three factors have widely contributed in reducing seismic risk in countries
such as the United States o f America, Taiwan, India, Algeria, Colombia, Nepal, and Peru
will be presented as follows.
4.3.1 Direct Involvement of Multidisciplinary Stakeholders in Seismic Risk Management
As described in Chapter II, the key to bridging the wide gap between massive death tolls and
the existence o f seismic codes is a robust mechanism o f enforcement and implementation of
the seismic codes in actual construction. The enforcement and implementation o f seismic
codes is not simple because seismic risk is interrelated with interdependencies among
technical, organisational, cultural, and other types o f systems affecting a community’s
capacity to both mitigate and respond to disaster. There is no longer a single actor, but many
actors, involved in interdependent decisions that increase or decrease the threat o f danger to
the community (Comfort, 1999). Moreover, there is growing evidence that the partial
perspective o f disciplines among community members generate actions that are
unsustainable (Petak, 2002). Thus, bringing a wide range o f stakeholders together to cross
both disciplinary boundaries and sectors in seismic risk management is a substantial key to
sharing effort and responsibility before disaster strikes. How well they work together can
determine the quality and outcome of the risk management process.
In general, multidisciplinary stakeholders involved in seismic risk management can be
divided into two extreme groups: government and non-government agency. Both o f them
have specific and significant roles within their sphere o f operation.
4.3.1.1 Involvement of Government Agencies
UNDP (2003) claims that the role of government, in order to reduce disaster, is very
important. It is because governments as public institutions generally view the mitigation o f
extreme event consequences as an integral part o f their responsibility to provide for public
safety, which they see as occurring through their regulatory-controlled activities, which are
in the “public interest”. At the present time, many governments in the examples below have
brought a new paradigm shift in their approach to disaster management, based on the
conviction that investments in risk management as pro-active actions are much more cost
effective than expenditure on relief and rehabilitation. They have the existence o f an
administrative structure responsible for seismic risk reduction as a structural entity with
105

adequate budget allocation as evidence o f their commitment to disaster management. In
general, UNDP (2004) highlights that the lack o f wider political commitment to disaster
reduction is often stated as the main barrier to progress in implementation.
In the USA, earthquakes are the most costly natural hazard. In 1978, the US government
created the National Earthquake Hazards Reduction Program (NEHRP) under the Federal
Emergency Management Agency (FEMA) to improve the nation’s understanding of
earthquake hazards and to mitigate their effects (www.fema.gov). Since its creation, NEHRP
has provided a comprehensive framework for efforts to reduce the risk from earthquakes.
Besides NEHRP, in the area o f seismic hazard, the U.S. Geological Survey (USGS)
Earthquake Hazards Program is the world scientific leader in seismic-hazard studies
(www.usgs.gov). In implementing the results o f their activities to understand and mitigate
the effects o f earthquakes, US government agencies have actively collaborated with state
geological surveys, emergency-response officials, earthquake engineers, local governments,
and the public. This collaboration has resulted in dramatic improvements in earthquake
preparedness and public safety in the United States.
Similar to the USA, the Government o f Taiwan has established a National Center for
Research in Earthquake Engineering (NCREE) to promote seismic hazard mitigation in an
integrated and systematic approach (www.ncree.gov). Furthermore, the Government o f India
launched a ‘National Programme for Capacity Building o f Architects in Earthquake Risk
Management’. The overall goal o f the programme is sustainable earthquake risk reduction.
The Government of India has brought about a paradigm shift in the approach to disaster
management, namely that development cannot be sustainable unless disaster mitigation is
factored into the development process (NDMD, 2004a). In Algeria, there are Seismological
and Earthquake Engineering Centres (Belazougui, 2003). In Nepal, there were three
municipalities which expressed their interest immediately after the Government o f Nepal
launched the ‘Kathmandu Valley Earthquake Risk Management Project’ in 1997 (ADPC,
2000).
In conclusion, the existence o f government agency(s) as a structural entity, which actively
manages seismic risk, is the primary role in mitigating, directing, and organizing disaster
response operations. This shows the high degree o f political commitment o f the government
to disaster management, which is accompanied by a high level o f commitment to
implementation. The Government o f the USA, for example, mentioned that between 1983
106

and 2001, only 129 people died in eight severe earthquakes, compared to 1,600,000 world
wide (SCEC, 2002).
4.3.1.2 Involvement of Non-government Agencies
While governments bear the primary responsibility with regard to safety and security, they
cannot and should not shoulder these tasks alone. Non-government agencies, or the private
sector, are a government’s partner in reducing disaster. Private sectors include non-profit
organisations, non-government organisations, and the business sector. Encouraging
governments and private sectors to formally take account o f disaster risk together in their
decision-making might be a first step in raising the profile o f disaster in corporate social
responsibility, as well as promoting the responsibility o f employers for human rights and
environmental stewardship in and beyond the workplace, in order to prevent the
accumulation o f disaster risk (UNDP, 2004).
Indeed, the private sector has a role to play, in moving towards community resilience, that
incorporates an awareness o f disaster risk. Unfortunately, there are veiy few recorded
examples o f corporate social responsibility that have engaged with the disaster risk reduction
agenda in developing countries (UNDP, 2004). There is great scope for encouraging the
private sector to incorporate disaster risk issues into their corporate social responsibility
planning. In the developed countries with significant earthquake problems, it is the
professional engineers that have been at the forefront o f earthquake reconnaissance studies
(Jain, 1998). .
There are a lot o f non-government agencies in the area o f Earthquake Engineering (EE) in
the USA. Tremendous improvement has been achieved in order to manage seismic risk
(EERI, 2003), as described below:
a. Establishment o f major EE research centres in the United States, such as PEER Center
headquartered at the University of California at Berkeley, Multidisciplinary Center for
Earthquake Engineering Research (MCEER) at SUNY Buffalo, and Mid-America
Earthquake (MAE) Center at the University o f Illinois, Urbana-Champaign. These three
centres are funded bv thoNatlonal-ScienceT'oundationTNSEt^vith matching tunds from
other sources.
b. Establishment o f several important experimental facilities to conduct EE research
including, among others: Cornell University UCB, University at Buffalo (SUNY),
University o f Michigan, University o f Minnesota, University o f Nevada at Reno,
107

University o f Texas at Austin, University o f Washington, Georgia Institute of
Technology, Lehigh University, Ransellaar Polytechnic Institute.
c. Establishment o f the Applied Technology Council (ATC) in 1971 and its first significant
activity, ATC 3-06 “Tentative provisions for the development o f seismic regulations for
buildings,” was a turning point, casting a framework for the next generation o f seismic
design code.
d. Establishment of California Universities for Research in Earthquake Engineering
(CUREe) in 1988, and its reorganization to Consortium of Universities for Research in
Earthquake Engineering (CUREE) in 2000.
e. Publication o f reports from studies conducted at the above-mentioned research centres.
Also, EE specific journals, including Earthquake Engineering and Structural Dynamics,
Earthquake Spectra, Soil Dynamics and Earthquake Engineering, Journal o f Earthquake
Engineering, among others, have provided media to disseminate research and
development.
f. Publications of books, monographs, and reports have greatly enhanced people’s
understanding o f earthquakes, and performance o f facilities. These include reports
published by ATC, EERC, EERI, FEMA, SCEC, MAE, MCEER, NCEER, PEER,
SEAOC, USGS, among others.
Furthermore, there is an Earthquake Engineering Centre in Algeria, which was founded in
January 1987. Their missions and objectives are (a) to perform investigation and research
activities in the field o f seismic risk reduction, (b) to train its future researchers, (c) to build
its specific research and testing laboratories, (d) to train and improve the knowledge o f
specialists in seismic design at the national level (seminar courses, conferences and
symposia), (f) to educate and inform the public and the authorities, (g) to aid and assist the
engineering offices and concerned institutions, and (h) to integrate hazard mapping and the
results o f vulnerability and risk investigations in development and the urban planning with
mandatory implementations. In India, there is the National Core Group for Earthquake
Mitigation, founded in 2003, with seven National Resource Institutions: (a) Centre for
Environmental Planning and Technology, (b) Indian Institute o f Technology Kharagpur, (c)
Indian Institute o f Technology Roorkee, (d) Jawaharlal Nehru Technical University, (e)
-M ampaHnslilule ofTecftnology, (t) Maulana Azad National Institute o f Technology, and (g)
School o f Planning and Architecture, New Delhi (NDMD, 2004a)
Private sectors operate their business within the structure o f the free market, where there is
most often significant market competition. Their focus is on increased and improved sales o f
108

products and services, meeting customer needs while achieving an acceptable return on their
investment. In contrast, governments operate within the structure o f the political system and
understand that extreme events often produce broad scale damage with losses having large
socio-economic impacts or significant impacts on community resilience. Governments
generally view mitigation o f extreme event consequences as part o f their responsibility to
provide for public safety. The conflict here is between advocates for risk management
through appropriate mitigation facilitated through government action and the notion o f a free
market maximisation of return on investments with minimum governmental regulation.
There is a disconnection between the short term good o f the business in private organisation
and the long term good of the community. In other words, there is considerable controversy
regarding how the government and the private sector can best implement seismic loss-
reduction measures through regulatory policies, economic incentives, long-term investment,
and public education (Bruneau et al., 2004). Apparently, the role o f business sectors in
seismic risk management still needs to be enhanced.
In summary, involvement o f multidisciplinary stakeholders should embrace multi-target
audiences to develop a sense o f responsibility in seismic risk reduction in daily life. Some
literature suggests that those parties are government officials, community leaders,
businessmen, small and medium contractors, educators, foremen, researchers, scientists, and
NGOs (IUDMP, 2001; CEEDEDS, 2004; SCEC, 2002; GREAT, 2001)
4.3.2 Strengthening of Local Capacities within Seismic Risk Management
Each risk scenario at the local level represents a unique configuration o f hazards and
vulnerabilities in the context o f broader processes o f development at the national and global
levels. Yet ultimately, vulnerability and risk are manifested at the local level (UNDP, 2004).
Local level community response remains the most important factor enabling people to
reduce and cope with the risks associated with disaster. Local organisations play a pivotal
role in overcoming local obstacles, in defining and shaping a regional level o f risk
management policy, in sharing and promoting further exchanges and knowledge between
other localities or regional levels and between key agencies and individuals, and in
supporting the development of national capacities. In general, strength enin^-of—local-
communities can be achieved through three aspects: developing local leadership, conducting
participatory approaches, and increasing public seismic awareness.
109

a. Developing local leadership
Local authorities are in charge o f basic needs such as land-use planning, construction
planning and control, including the protection o f people on its territory. In addition, outsiders
are rarely able to effectively contribute single-handedly to safety programmes in developing
countries. It is rare to find outside experts with a good understanding o f the local situation,
who can work in developing countries for long periods o f time. Hence, the best results are
achieved when the problem is tackled by local experts, with outsiders providing a guiding
role: developing local leadership is the key to success.
In developing local leadership in communities, a long-term commitment is needed, which is
often beyond the funding and staffing cycles o f many agencies. Perhaps, in developing
countries, the greatest difficulty is avoiding the trap of communities becoming dependent on
well-meaning external agencies. The application o f appropriate technology is one approach
that has been promoted as a way to overcome some of the problems associated with the
implementation and long-term sustainability o f development projects in the Third World.
Appropriate technology should be able to satisfy the requirements for fitness for purpose in
the particular environment in which it is to be used. It should also be maintainable using
local resources, and it should be affordable (Vickridge, 1996).
Examples o f the successful and long-term improvement o f local communities do exist, but
remain uncommon. The earthquake event in Northridge, California on 17th January 1994 is a
good example. Response operations were immediately activated by the earthquake and
carried out largely by experienced, well-trained, local emergency service organisations
(Comfort, 1999). Improving local capacity to repair and strengthen their own houses using
modem seismic features can be seen in the increasing number o f house units in Maharastra,
India. In 1995, the number o f completed repaired or strengthened houses was around 38,000
units; in 1998 the number reached approximately 182,000 units, a tremendous increase
(EERI, 1999).
b. Conducting participatory approaches
Capacity improvement at a local level, together with a participatory approach, might bring
about other important things to strengthen local communities. For policy interventions
seeking to include a participatory approach, preliminary discussions to help map the social
relationships within the community are essential if the vulnerable (who are also the socially
excluded) are to be reached and helped to build their own levels o f resilience through
participation. Building meaningful participation with vulnerable groups and individuals in
110

development is not easy. Principle characteristics o f social vulnerability are political
marginalisation and social exclusion. Encouraging social integration and political
participation to enhance resilience and other goals for quality o f life is a major challenge to
disaster and development policy (UNDP, 2004). The example o f participatory process has
been carried out by the Government o f Nicaragua, who undertook a participatory process of
local development planning within a disaster reduction approach. Disaster reduction was
factored into a range o f planning sectors, including infrastructure development, productive
sectors, social sectors and environmental management (UNDP, 2004). Community
participation has also been noted in the small Senegalese town of Rufisque (UNDP, 2004).
The participatory programme is itself a learning process. Key elements o f success have
included the realisation that risk profiles and participatory processes in each region are
different, so strategies should rely on local decision-making and be flexible in approach and
implementation. In addition, local plans should be linked with central institutions to access
support and blend with national development policy, called bottom up vision The
involvement o f local stakeholders into disaster risk management and participation are also a
key factor in maintaining local support and generating significant local outputs for disaster
risk reduction, as well as motivating the acceptance o f shared responsibilities and
cooperation.
c, Increasing public seismic awareness
The next factor to enhance local communities is public seismic awareness. Lack o f public
awareness to seismic risk tends to contribute to essential barriers in implementation o f
seismic codes within non-engineered building. SCEC (2002) highlights that public seismic
awareness can be achieved primarily through public education. Creating a community o f
knowledgeable people through public education is essential to the development o f
‘resonance’ or willingness to support shared action, when necessary, to sustain the goal o f a
responsible, civil society. In the USA, publications o f books, monographs and reports using
both hard copy and on-line systems have greatly enhanced community understanding about
earthquakes and performance o f facilities. These include reports published by ATC, EERI,
FEMA, SCEC, MCEER, and USGS (EERI, 2003). The citizens, elected officials, property
owners, and other decision makers must be informed about the nature o f the risks, their
mitigation options, and the costs o f action and inaction. In order to close the gap between
existing knowledge and its implementation, public education is the best solution (SCEC,
2002).
I l l

A good example o f a strong, earthquake resilient local community might be seen in
Manizales City, Colombia. The success o f the seismic risk management action was evident
during the massive earthquake o f 1938, which did not damage the city significantly.
Similarly, the earthquakes o f 1962, 1964, 1979, 1995, and 1999 caused only minor or
moderate damage. Since the 1980s, the city has had a municipal disaster prevention system
in place, based on municipal development and land-use plans, that incorporates disaster risk
management as a strategic and political cornerstone. Disaster preparedness has become part
o f the city’s culture. Prevention-related information and education activities are conducted
regularly in schools. Drills are held periodically to ensure that awareness and alertness
remain high. The mayor has a disaster risk advisor for inter-agency co-ordination and the
city employs a team of professionals who work at scientific research centres. All residents
who take steps to reduce the vulnerability o f their homes receive a tax break as an incentive.
A collective and voluntary housing insurance scheme has been promoted by the city. It is
added to local bimonthly tax payments, with the aim of covering the tax-free lower socio
economic strata, once a defined percentage o f taxpayers paying for the insurance has been
achieved. Seismic micro-zonation has enabled the local administration to estimate the
expected annual losses of its public buildings and insure them selectively. The city
administration of Manizales has produced a disaster risk plan that aims to translate state-of-
the-art theory into practice, transfer best practice from current experiences in other places,
focus on local participation and sustainability, and build in local ownership (UNDP, 2004).
Conversely, specific to Indonesia, a survey about public awareness o f earthquake and quake
preparedness given to the community in the Minomartani residential area, adjacent to
Yogyakarta City, reveals that the whole community tends to overlook the future earthquake
risk. It seems that there is no public education o f the grass-root community o f seismic risk
from government and private agencies (Chandra et al., 2004).
In summary, the strengthening o f local capacities through improving their local leadership,
participatory approaches, and public awareness is important to enhance resilient
communities against future disaster. According to the World Disasters Report, UNDP (2004)
claims ‘effective and accountable local authorities are the single most important institution
for reducing the toll of natural and human-induced disasters in urban areas’. Furthermore,
providing a local lens allows a large number o f small events to be catalogued, re-shaping
perceptions on risk as a priority concern for development policy and contributing to a
potentially genuine process o f self-organization to reduce risk. This is an essential precursor
to a bottom up decision making process for development policies, strategies, plans, programs
112

and projects in disaster reduction (Yodmani, 2003) focusing on the local ownership o f
prevention projects. Sometimes, knowledge from a developed country is not fully suitable
for the local situation, and the impact on policy and practice at a local level is dubious.
4.3.3 Poverty Consideration in Seismic Risk Management
UNDP (2004) reveals that, in global terms, disaster risk was found to be considerably lower
in high-income countries than in medium- and low-income countries. Disasters affect the
poor disproportionately. Poor people are often the most likely to be exposed to natural and
non-natural hazards. “Disasters in medium- and low-income countries are an integral part o f
their poverty cycle. Poverty causes disasters, and disasters exacerbate poverty” (UNDP,
1994). It is true that the majority o f the earthquake losses are concentrated in non-engineered
buildings, which mostly belong to the poor, who often bear the greatest cost in terms o f lives,
and livelihood, aind rebuilding their shattered communities and infrastructure (Sarwidi,
2001).
Poor people are often unable to obtain basic services because (a) institutions are not
accountable, (b) local elites dominate the political process and control private sector
resources, (c) corruption is widespread, (d) social relationships are inequitable, and (e) poor
people lack experience with participation. Poverty levels, or the absolute number o f poor and
destitute persons, have increased continually, with dramatic effects in terms o f increases in
social risk and disaster vulnerability (UNDP, 2004).
The urban poor are often forced to make difficult decisions about risk. In low-and-middle
income countries, city governments have often proved ineffective in regulating the process
o f urban expansion through land-use planning and building codes. Unregulated low-income
settlements, where land values are lowest, often occupy the most hazard-prone locations, for
example, in peripheral squatter settlements located in ravines, on unstable slopes or in flood-
prone areas, or else in dense inner city slums.
Living in hazardous locations is sometimes ‘chosen’ if individuals seek opportunities not
only to improve their own quality o f life, but also to enhance the hea1th_and-fidnnntiQnal-
attainment o f their children, for greater prospects for their children tomorrow. Poor or non
existent sanitation, high unemployment and underemployment, deficient health and
education services, insecure land tenure, crime and violence, and other factors configure a
panorama of everyday risk. For individuals caught up in the immediate concerns o f daily
113

survival, disaster risk management is often not a priority. Hence, everyday risks accumulate
and prepare the way for disaster (UNDP, 2004).
The disaster impact largely depends on the kind o f development choices countries have made
previously. As countries become more prosperous, for example, they are often better able to
afford the investments needed to build houses more likely to withstand earthquakes. At the
same time, the rush for growth and the resulting urbanisation can trigger haphazard urban
development, which increases the risk o f large-scale fatalities during such a disaster. When
populations expand faster than the capacity o f urban authorities or the private sector to
supply housing or a basic infrastructure, risk can accumulate quickly in informal settlements.
The urbanisation process leads to the concentration o f populations in risk-prone cities, and
risk-prone locations within cities. This is true in megacities and in rapidly expanding small-
and medium-sized urban centres in developing countries (UNDP, 2004).
Regression analysis o f vulnerability indicators shows that, statistically, physical exposure
and the rate o f urban growth acted together in being associated with the risk o f death by
earthquake (UNDP, 2004). In other words, the risk o f dying in an earthquake is greater in
countries with rapid urban growth. Mass migration from rural to urban settlements has
resulted in the growth o f city slums; many located on unsafe land and built with
environmentally inadequate construction techniques. Low building standards may reflect a
lack o f control and supervision in middle income areas and the lack o f resources to build
hazard resistant structures in low-income areas. It is a fact that, in many rapidly growing
cities, earthquake risk considerations have not been factored into the building and planning
process. In general, city governments have not been capable o f regulating either building or
settlement in a way that reduces risks (UNDP, 2004).
International experiences, including tragic lessons from the recent large earthquakes in Aceh
on 26th Dec 2004 and Yogyakarta, on 27th May 2006, show that the growth o f earthquake
prone communities, following the global processes o f development and urbanisation,
commonly give rise to seismic risk unless proper countermeasures are taken to prepare for
future earthquakes and to manage the risk. This is also true for countries o f low and
moderate seismicity, taking into account that the risk value depends not only on the hazard
level, but also on the aggregate elements at risk and their vulnerability to probable seismic
influence. The overcrowding and deterioration o f inner city slum areas in Lima, Peru has
been identified as a critical process of seismic risk accumulation in that city (UNDP, 2004).
114

This situation may be attributable to resource constraints in poorer countries. In 2001, in
Indonesia, for example, only 7.2% of the population lived below l$/day, but up to 55.4%
lived below 2$/day (Timmer, 2004). The governments o f such countries lack, not only the
financial resources needed to shoulder the economic burden, but also the institutional and
human resource capacities needed to deal quickly and comprehensively with disasters and
emergencies. Also since the 1970s, but with increasing emphasis in the 1980s and 1990s,
researchers from social sciences and humanities have argued that the impact o f a natural
hazard depends, not only on the physical resistance o f a structure, but also on the capacity o f
people to absorb the impact and recover from loss or damage (UNDP, 2004).
In the area o f seismic risk management, in order to protect poor people from the collapse o f
non-engineered buildings, which are prevalent among the medium to low income population,
it is urgent to disseminate seismic codes which are (a) socially acceptable, (b) economically
feasible, and (c) easily absorbed into local construction methodologies down through the
grass root communities (Arya, 1994). In fact, earthquake resistance need not be expensive
when incorporated into a sound design from the very beginning o f the planning effort by a
competent team; it usually only amounts to about 1.5% of the cost o f construction (BSSC,
1995). Again, Maharastra, India, provides an example o f good practice; there were over 500
model houses constructed in order to demonstrate cost-effective building techniques, use o f
local materials and seismic features in 1998 (EERI, 1999). One way for communities to
encourage well-enforced seismic codes, and not add a monetary burden, is to provide tax
incentives for more disaster-resistant homes. For example, if a homeowner reduces the
chances of damage from an earthquake by installing a mitigation measure, then this taxpayer
would receive a rebate on state taxes to reflect the lower costs for disaster relief (Kunreuther,
2000).
Finally, it can be assumed that the widespread persistence o f collapse o f non-engineered
buildings in developing countries has a tremendously devastating impact on efforts to
eradicate poverty at all levels. As a whole, the collapse o f such buildings during an
earthquake seriously undermines the result of development investment, and therefore
remains a major threat and impediment to sustainable development and poverty alleviation.
In conclusion, based on the three essential factors captured from such good practices in
seismic risk management mentioned above, this points towards the need for policy responses
that begin to identify and then tackle the root causes o f risk that are embedded within
contemporary development practices — as an integrated part o f sustainable development
115

policy. Thus, the proper approach to the problem of seismic risk management should include
consideration of all three contributing factors, particularly within the broader context of
sustainable development. There is a strong sense that these factors are inter-linked. It is true
that the length and importance of the three factors should be cornerstones and influence each
other to ensure continuous movement and improvement of seismic risk management actions,
particularly within non-engineered construction in developing countries (Figure 4.2), so that
the approach is common but the solutions are local.
Multidisciplinary Stakeholder Involvement
There is no longer a single actor, but many actors, invo lved in in terdependent decis ions in underscoring the importance of strengthening cooperative and synergistic interactions among various stakeholders for disaster reduction
Strengthening of Local Capacities I Poverty ConsiderationEffective and accountable local authorities are the single most important institution for reducing the toll of disasters. Through: im prov ing local lead ersh ip , cond ucting participatory approaches, and increasing public awareness 1 Disaster in medium-and low income countries F
are an integral part of their poverty cycle, F Poverty causes disasters and disasters [ exacerbate poverty
Figure 4.2 Three important factors of effective seismic risk management of non-engineered buildings
4.4 Seismic Risk M anagem ent and Sustainable Development
Development actions of both yesterday and today can increase or reduce disaster risk in the
foreseeable future. Seismic risks are no longer seen as extreme events created entirely by
natural forces but as manifestations of unresolved problems of development. In recent years,
there has been a major shift in people’s attitudes and behaviour towards coping with natural
disasters. In the past, more emphasis was placed on humanitarian response and relief
activities, with little attention being paid to disaster reduction strategies that have the
potential to save thousands of lives by even the simplest of measures. Today, there is
116

increasing recognition that, while humanitarian efforts are important and need continued
attention, risk and vulnerability are crucial elements in reducing the negative impacts of
hazards and are thus essential to the achievement o f sustainable development (UN-ISDR,
2002). This translates into the need for much greater attention in the implementation of
protective strategies, which can contribute to saving lives and protecting property and
resources before they are lost. It is for this reason that a more holistic approach, that
emphasises vulnerability and risk factors, has coalesced around the concept o f seismic risk
management.
Clearly, physical exposure itself as a result o f development does not explain nor
automatically lead to increased risk. I f urban growth in a hazard-prone location is
accompanied by adequate building standards and urban planning that takes into account risk
considerations, disaster risk can be managed and even reduced. This is difficult in the cities
o f Low and Middle Human Development countries, where more than half o f the urban
population may be living in illegal and unserviced neighbourhoods. It is important to address
these issues at the scale of the city and over the medium to long-term by arguing for a
reorientation in disaster reduction — an approach that focuses exclusively on reducing the
impact o f disasters on development towards an integrated risk management approach that, in
addition, promotes forms o f development that help reduce, rather than increase, disaster risk.
Municipal government will have a central role to play in strategic planning for disaster risk
at this scale (UNDP, 2004).
UN-ISDR (2002) defines sustainable development as development that meets the needs of
the present, without compromising the ability o f future generations to meet their own needs.
Seismic risk management should be seen in the broader context o f sustainable development.
The frequency with which some countries experience seismic disaster should certainly place
seismic risk at the forefront o f development planners’ minds. It is argued that the post
disaster reconstruction period provides the most opportune time to introduce seismic risk
reduction into sustainable development planning. Therefore, political commitment and social
acceptance of the value o f risk reduction are necessary for forward-looking developers who
want to increase the sustainability o f communities. Development needs to be regulated in
"terms—of—its impact on seismic risk. "There is a need for institutional systems and
administrative arrangements that link public, private, and civil society sectors and build
vertical ties between local, district, national and global scale actors. To achieve safety and
sustainability o f livelihood for effective disaster management at a grass-roots level, UNCRD
(2003) mentions three key elements: self help, co-operation, and education.
117

It is clear that nobody can prevent earthquakes but it is possible to mitigate the seismic risk
using available means. SCEC (2002) highlights that earthquakes damage the environment
more than any other extreme event. Their occurrence is highly uncertain; there is no known
method for the reliable, short-term prediction of large earthquakes. Therefore, seismic risk
management should be factored into development planning, which needs shared
responsibility and shared efforts to reduce the impact o f future earthquakes. This leads to
considerable challenges in the building o f ecologically sustainable communities. It is
imperative for society to develop integrative approaches that combine the disciplinary
insights and strengths o f the disciplines to give appropriate consideration to the reduction of
risk, through both voluntary and regulatory approaches.
Successful integration o f the disciplines will be difficult to demonstrate empirically. Case
studies are needed to document experiences in the successful implementation o f resilience
and enhanced standards in order to help learning. Work should be done that helps to
facilitate integration o f the disciplines through best practice benchmarking, software,
simulation, training materials, and curriculum enhancements. Fundamental research is
needed for the development o f understanding and methods to enhance the process of
integrating technical, economic and organisational/institutional disciplines to achieve
increased seismic resilience and knowledge transfer.
The degree to which these effects will be felt depends on several factors, including the nature
o f the seismic hazard, the degree o f seismic risk that a building owner or a community deems
to be acceptable, and the extent to which attempts have already been made to mitigate the
risk. A variety o f community members with expertise in different roles and varying interests
will play a part in assessing the significance of these effects, and the decision each makes
will reflect his or her view on how well seismic risk is managed. Therefore, seismic risk
management policies should be harmoniously integrated into a responsibility among
governmental entities, economic interests, communities and citizens. This requires
integration o f expertise from many disciplines and close cooperation among professionals
from varying and often hardly overlapping fields (such as building and social welfare)
fWenzel. 2005). Therefore, putting the seismic risk management of non-engineered buildings
into a disaster management system with the integration o f a large amount o f expertise is very
important.
118

4.5 An Overview of Disaster Management According to the Decentralization Process in Indonesia
Indonesia is a vast, populous country with enormous economic and cultural diversity. Spread
over 5,000 kilometres and more than 13,000 islands, the countiy has more than 300
identified languages and about 20 distinct cultural groups (Kassum et al., 2003). For three
decades until 2001, the Indonesian government was highly centralised. Indonesia joined a
global trend to decentralise government, which began in January 2001. Decentralisation
substantially changed the pattern o f government and administration in Indonesia by giving
the sub-national level (especially for local government) far-reaching responsibilities for the
provision o f the public services. A wide range o f functions was transferred to local
government control, city [kota] and regency [kabupaten] (Turner et al., 2003). It is clear that
decentralisation is intended to strengthen the local government (city and regency) and to
bring them closer to their community. In contrast, provincial authority was considerably
diminished. There is now clear recognition o f the need for local governments, not only to be
involved, but to directly lead the planning, decision-making, budgeting, and monitoring
process.
The implementation o f Indonesia’s new decentralisation policy has provided a new setting
for disaster management. Despite recent efforts o f the Government o f Indonesia to
strengthen the regulation, structure, and organisation o f the National Coordinating Board for
Disaster Management (BAKORNAS), significant gaps still exist in policy, planning
processes, mechanisms and procedures; legislation, institutions, organizations and budgeting
at different levels o f government also need to be strengthened to ensure disaster management
is effectively carried out at the local/regional level (Ngoedijo, 2003).
This section provides a general picture o f disaster management practices in Indonesia, which
is primarily summarised from “An Overview of Disaster Mitigation in Local Planning and
Programming in Decentralized Indonesia” written by Ngoedijo (2003). The pattern o f
disaster management tends to be vastly different across regions and different levels o f
government in their disaster mitigation planning and budgeting practices.'
a. There are no Disaster Management Organisations (DMO) established structurally in
government organisation from the central to a local level. BAKORNAS, SATKORLAK,
and SATLAK are DMO and non-structural entity organisations, which manage disaster
management at central, provincial, and local level respectively. The form o f non-
structural organisation causes lack o f coherence and competence in disaster
119

management. Specifically in SATKORLAK and SATLAK, the nature o f non-structural
organisation has meant that no expert or competent person works continuously in
disaster management on local agenda. This limits the seriousness o f attention given to
disaster management and, subsequently, any increase in capacity for good governance in
disaster management. Agencies and individuals see working for disaster management as
a side job assignment or as an additional workload.
b; There is a lack o f detailed guidelines and manuals for disaster management.
BAKORNAS Decree 2-2001 on general guidelines provides broad policies, strategy, and
a management framework for handling disasters; however, it has not been accompanied
by detailed guidelines for implementing disaster management. Besides, limited
socialisation o f the guidelines means that only a few local governments can fulfil the
functions assigned by the Decree. According to the Decree, local governments are
required to prepare guidelines for the implementation of a response for managing
disasters, and co-ordination o f efforts for disaster, reporting, monitoring and supervision.
c. There is a lack o f effective links between DMO and its horizontal organisation as well as
its strategic partner in disaster management. A clear and effective link among
BAKORNAS, BAPPENAS (The National Development Planning Agency), and BKTRN
(The National Coordinating Board for Spatial Planning) has not been fully developed.
The lack o f an effective link with strategic partners in disaster management can be seen
in the members o f BAKORNAS that are purely sectoral departments.
d. Currently, most planning, programming and budgeting related to disaster issues is left to
. sectoral departments, without the intensive co-ordination and involvement o f
BAKORNAS, SATKORLAK, and SATLAK. There is no incorporating disaster
management within a wider context in sustainable development. For example, the Urban
Sector Development Reform Program (USDRP) was an Indonesian government program
in 2003, which purported to support local governments in their efforts to alleviate
poverty, stimulate the development o f the local/regional economy, and to improve the
delivery o f sustainable and demand-driven urban services. The ultimate goal o f these
efforts was to improve the living quality o f the urban population (DGURD, 2003).
Within the programs, there were no specific actions correlating with disaster
management.
120

e. There is also a lack o f National Strategy and Plan for disaster management. For
influencing the decision making process related to planning and budgeting in disaster
management, it is important for BAKORNAS to prepare a National Strategic Plan for
Disaster Management in consultation with regional/local governments and non
government stakeholders.
f. Most o f disaster management expenditure comes from a contingency fund and almost all
o f the expenditure is for disaster response. Permanent expenditure budget for disaster
issues, particularly in disaster mitigation, depends largely on sectoral department
programs and is not carried out systematically and comprehensively.
g. There is still no established and sustainable framework for financing disaster mitigation.
Local governments funds are characterised by a high level o f routine budget (more than
60 percent) allocated mostly for personnel expenditure, while budget allocation for
development expenditure is limited. There is a high degree o f dependency on central
government transfers and provincial subsidies for financing development activities,
including disaster mitigation and management. They are in an uncertain position to
obtain multiple sources o f funding for disaster management. Every year, they have to be
active in preparing proposals and consulting and negotiating with departments/agencies
at the Central and Provincial levels to obtain financial assistance for disaster
management. There is no guarantee that their proposal will be accepted.
h. The primary role o f SATKORLAK and SATLAK at a regional level is to co-ordinate
and implement responses for all phases o f disaster management; they are hardly ever
involved in any preventive actions. The organisational structure can be seen in Figure
4.3.
121

Sub-districtlevel
Task Force SATGAS
Task Force SATGAS
Task Force SATGAS
Task Force SATGAS
Secretary:Assistant District Secretary District Disaster Relief
Members:Vertical Gov. Officers Provincial Officers Territorial Commanders
Red CrossScout OrganisationsNon Government OrganisationBussinessman
Chairman: Head of District/Mayor Vice chairman I: District Arm Forces Commander
Vice chairman II: Distric Police Commander Excecutive chairman: Head of Civil Defense Office
Figure 4.3 SATLAK organisational structure (Ngoedijo, 2003)
The vice chairmen and the members o f the SATLAK organisation in Figure 4.5 are
from departments that only manage disaster response. There is not any established link
between SATLAK and other departments, which relate to a wider context o f sustainable
development.
There is a lack o f ‘locus’, leadership, and capacity in disaster management organisation.
Since SATKORLAK and SATLAK are ‘non structurally’ organised with a high
orientation to provide response actions during disaster, they will find it very difficult to
build capacity and competence in disaster management.
A minimum service performance for disaster management is not yet developed. In order
to implement effective disaster management at a regional level, minimum service
standards for disaster management, as the obligatory functions of regional government,
need to be developed. This will guide regional governments in developing a systematic,
efficient program and budget; allocate sufficient expenditure for disa<Terrrnnagem ent~
and help regional government build credible disaster management. The development o f a
minimum standard o f service performance will also help regional government to
implement the newly introduced regulations on performance budgeting effectively.
122

economic globalisation, changing local conditions, and including rapid urbanisation,
mean that seismic risk is not a static condition.
d. The policy problem becomes not how to achieve a specific outcome, but rather how to
generate and sustain a process o f iterative inquiry and action that will, through its
system, lead its members to create new and more appropriate policies and practices in
response to needs from its environment.
e. The capacity o f a community to mobilize collective action in anticipation and response
to perceived risk depends directly upon the degree o f awareness, level o f skills, access to
resources, and commitment to informed action among its members prior to the
occurrence o f a damaging event.
f. In seismic risk that endangers an entire community, interdependencies among technical,
organizational, cultural, and other types o f systems affect a community’s capacity to
both mitigate and respond to disaster. The best interest o f the individual is directly tied to
the community’s capacity to provide services that benefit the whole. There is no longer a
single actor, but many actors, involved in interdependent decisions that increase or
decrease the threat o f danger to the community. Seismic risk represents the type o f actual
policy problem that illustrates the interdisciplinary, inter-organisational, and inter-
jurisdictional characteristics that have made problems of shared risk extraordinarily to
resolve.
g. Seismic risk includes a class of policy problems that have defied solution by traditional
means o f analysis and planning.
4.2.1 Seismic Risk Management Approach
Seismic risks can be managed effectively in a number o f ways. SCEC (2002) has developed
a. seismic risk management approach as advanced preparation, using a multidisciplinary
method. There are three phases that influence the seismic risk management approach.
Seismic hazard analysis corresponds with science, seismic risk assessment conforms to
engineering, and finally, political and economic action accords with mitigation. The length
or relative importance of each component phase may vary and the boundaries between each
phase are not well defined, depending largely on the certain situation. Moreover, the seismic
risk management approaclrdeveloped by SCEC (2UU2) tends to divide into three phases: risk
identification, risk assessment, and risk response, where risk documentation is embedded in
each phase, explained in Figure 4.1:
101

Seismic hazard analysis*
(as Risk Identification)
Fault characterization
Earthquake scenario
iSeismic-wave propagation
VJ/Seismic risk assessm en t*
(as Risk A ssessm ent)
I
Science
Political and economic actions* (as Risk Response)
* ) including Risk Documentation in each phase
— *--------Site response
— $---------------Structural response
4
— Intensity m easu res *-
IEngineering
Perform ance modeling
Risk estim ation
— 4------------Mitigation options
Damage m easu res —
J.Mitigation
Mitigation decisions
'J'Im plem entation
Decision variables - -
Figure 4.1 Seismic risk management approach (SCEC, 2002)
During the phase o f seismic hazard analysis and seismic risk assessment, scientists and
engineers seek methods and approaches that will reduce the levels o f uncertainty associated
with the causes o f an event and the fragility and vulnerability o f structures subjected to the
event. Individuals become advocates of methods and approaches which, when accepted,
provide individual recognition and rewards. In addition, an important role for science and
engineering is to improve knowledge about the mitigation of the effects o f extreme events,
effectively transferring knowledge and facilitating collaboration among users o f the
knowledge (Petak, 2002).
In general, there are two types o f seismic hazard analysis, deterministic and probabilistic
(Gould, 2003). In a deterministic analysis, an earthquake event o f a specified magnitude is
assumed to occur on the fault that causes the greatest damage to the subject building(s). This
approach can intuitively be expected to generate a reasonably conservative “worst-case”
scenario for loss. On the other hand, a probabilistic analysis accounts for the full range o f
possible earthquakes, their location, return period, size, and the propagation o f the
earthquake motion from the rupture zone to the site(s) o f interest. This provides a return
period curve with a more complete and ‘realistic’ evaluation o f the potential earthquake
losses.
102

In line with Figure 4.1, the next phase is political and economic actions as a seismic risk
response, which corresponds with mitigation action. An effective mitigation plan anticipates
actions that a community must take before a disaster strikes. Planning is one o f the most
important parts o f any mitigation effort. Taking the time up front to make people aware o f
the earthquake risk to their community, making a plan o f how to reduce that risk over time,
and what to do in the event of an earthquake can make a tremendous difference in post
disaster recovery efforts.
It is clear from Figure 4.1 that seismic risk management needs risk “dimensioning”, and risk
sizing takes into account not only the expected physical damage, victims and equivalent
economic loss, but also social, organisational and institutional factors. The difficulty in
achieving effective seismic risk management, in part, has been the lack o f a comprehensive
conceptual framework o f seismic risk, facilitating its evaluation and intervention from a
multidisciplinary perspective. Most existing indices and evaluation techniques do not express
risk in words adequate for the diverse types o f decision-makers, and they are not based on a
holistic approach that invites intervention (IDEA, 2005).
According to the growing recognition mentioned above, although the risk management
approach in Figure 4.1 shows distinctive steps, those activities in the seismic risk
management approach enables an overlap between each step. This means that the activities
in each step are not as clear-cut as are sometimes implied. In most cases, while different
countries have implemented earthquake risk management movements that differ from each
other in detail and degree, they are nevertheless the same in principle.
The seismic risk management approach in Figure 4.1 has been adopted in this research. In
addition, it should be emphasised that Chapters II and III have clearly identified the true
nature of the seismic risk focused on by this research, i.e. the continued non-seismic
resistance o f non-engineered buildings in Indonesia. Hence, the risk identification phase in
this research is not to further identify the risk, rather to capture progress, hence the name
‘seismic hazard analysis’, as precisely adopted from SCEC. However, the term ‘political and
economic actions’ used by SCEC is not adopted, and seismic response phase in this research
is simply named ‘seismic risk response’. Finally, the seismic risk management approach
adopted in this research will comprise three headings: seismic hazard analysis, seismic risk
assessment, and seismic risk response. The first draft o f the proposed framework in Chapter
V will elaborate this matter further.
103

4.2.2 Reducing the Cost of Loss Using Seismic Risk Management Actions
Seismic risk management has been well known in recent decades. Some countries have
employed seismic risk management actions, based on a belief that investment in mitigation is
much more cost effective than expenditure on relief and rehabilitation (NDMD, 2004a). In
other words, the expected cost o f loss after an earthquake has occurred can be reduced using
seismic risk management actions. Chen et al., (2003) mentions that expected loss during an
earthquake can be cut down significantly through preventive activities before the disaster
happens. Some examples below present the cost-effectiveness o f disaster risk reduction
(DFID, 2004):
a. The World Bank and the US Geological Survey calculated that economic losses
worldwide from disasters during the 1990s could have been reduced by US$ 280 billion
worldwide if US$ 40 billion were invested in mitigation and preparedness.
b. In China, an investment o f US$ 3.15 billion in flood control measures over 40 years is
believed to have averted potential losses of US$ 12 billion.
c. In Vietnam, 12,000 hectares o f mangroves planted by the Red Cross protect 110 km of
sea-dykes. Planting and protection cost US$ 1.1 million but has reduced the cost o f dyke
maintenance by US$ 7.3 million per year (and the mangroves have protected 7,750
families living behind the dyke).
d. According to Oxfam, the value of cattle saved on a flood shelter o f four acres in
Bangladesh during the 1998 floods was as much as £150,000, against a construction cost
o f only £8,650.
Obviously, seismic risk management decisions must be made and implemented, particularly
in high seismic areas around the world. Setting priorities for action is imperative, since the
need for improvement will always vastly exceed the available resources (SCEC, 2002).
4.3 Some Evidence of Good Practices of Seismic Risk Management Implementation in Countries
In many countries with significant seismic problems, the implementation o f seismic risk
management has increased. Some evidence o f good practices employing seismic risk
management from their seismic hazard, assessment, and response might be used as best
examples for other countries with similar problems. This section presents, as extracted from
many sources o f literature, three important factors that drive successful and effective
implementation o f seismic risk management in various countries, particularly interrelated
with non-engineered buildings. These are (a) direct involvement o f multidisciplinary
104

stakeholders, (b) strengthening o f local capacities, and (c) poverty consideration. Evidence
that the successful three factors have widely contributed in reducing seismic risk in countries
such as the United States o f America, Taiwan, India, Algeria, Colombia, Nepal, and Peru
will be presented as follows.
4.3.1 Direct Involvement of Multidisciplinary Stakeholders in Seismic Risk Management
As described in Chapter II, the key to bridging the wide gap between massive death tolls and
the existence of seismic codes is a robust mechanism of enforcement and implementation of
the seismic codes in actual construction. The enforcement and implementation o f seismic
codes is not simple because seismic risk is interrelated with interdependencies among
technical, organisational, cultural, and other types o f systems affecting a community’s
capacity to both mitigate and respond to disaster. There is no longer a single actor, but many
actors, involved in interdependent decisions that increase or decrease the threat o f danger to
the community (Comfort, 1999). Moreover, there is growing evidence that the partial
perspective o f disciplines among community members generate actions that are
unsustainable (Petak, 2002). Thus, bringing a wide range o f stakeholders together to cross
both disciplinary boundaries and sectors in seismic risk management is a substantial key to
sharing effort and responsibility before disaster strikes. How well they work together can
determine the quality and outcome of the risk management process.
In general, multidisciplinary stakeholders involved in seismic risk management can be
divided into two extreme groups: government and non-government agency. Both of them
have specific and significant roles within their sphere of operation.
4.3.1.1 Involvement of Government Agencies
UNDP (2003) claims that the role of government, in order to reduce disaster, is very
important. It is because governments as public institutions generally view the mitigation o f
extreme event consequences as an integral part of their responsibility to provide for public
safety, which they see as occurring through their regulatory-controlled activities, which are
brought a new paradigm shift in their approach to disaster management, based on the
conviction that investments in risk management as pro-active actions are much more cost
effective than expenditure on relief and rehabilitation. They have the existence o f an
administrative structure responsible for seismic risk reduction as a structural entity with
105

economic globalisation, changing local conditions, and including rapid urbanisation,
mean that seismic risk is not a static condition.
d. The policy problem becomes not how to achieve a specific outcome, but rather how to
generate and sustain a process o f iterative inquiry and action that will, through its
system, lead its members to create new and more appropriate policies and practices in
response to needs from its environment.
e. The capacity o f a community to mobilize collective action in anticipation and response
to perceived risk depends directly upon the degree o f awareness, level o f skills, access to
resources, and commitment to informed action among its members prior to the
occurrence o f a damaging event.
f. In seismic risk that endangers an entire community, interdependencies among technical,
organizational, cultural, and other types o f systems affect a community’s capacity to
both mitigate and respond to disaster. The best interest o f the individual is directly tied to
the community’s capacity to provide services that benefit the whole. There is no longer a
single actor, but many actors, involved in interdependent decisions that increase or
decrease the threat o f danger to the community. Seismic risk represents the type o f actual
policy problem that illustrates the interdisciplinary, inter-organisational, and inter-
jurisdictional characteristics that have made problems of shared risk extraordinarily to
resolve.
g. Seismic risk includes a class o f policy problems that have defied solution by traditional
means o f analysis and planning.
4.2.1 Seismic Risk M anagem ent Approach
Seismic risks can be managed effectively in a number o f ways. SCEC (2002) has developed
a. seismic risk management approach as advanced preparation, using a multidisciplinary
method. There are three phases that influence the seismic risk management approach.
Seismic hazard analysis corresponds with science, seismic risk assessment conforms to
engineering, and finally, political and economic action accords with mitigation. The length
or relative importance o f each component phase may vary and the boundaries between each
phase are not well defined, depending largely on the certain situation. Moreover, the seismic
risk management approach developed by SCEC (2002) tends to divide into three phases: risk
identification, risk assessment, and risk response, where risk documentation is embedded in
each phase, explained in Figure 4.1:
101

Seismic hazard analysis*
(as Risk Identification)
Fault characterization
4Earthquake scenario
4Seismic-wave propagation
Science
NIXSeismic risk assessm en t*
(as Risk A ssessm ent)
ISite response
4---------Structural response
4
--------------- In tensity m easures
Engineering
Political and economic actions* (as Risk Response)
* ) including Risk Documentation in each phase
Perform ance modeling
Risk estim ation
4--------Mitigation options
vl'
Damage m easu res —
4Mitigation
Mitigation decisions
'I'Im plem entation
Decision variables - -
Figure 4.1 Seismic risk management approach (SCEC, 2002)
During the phase of seismic hazard analysis and seismic risk assessment, scientists and
engineers seek methods and approaches that will reduce the levels o f uncertainty associated
with the causes o f an event and the fragility and vulnerability o f structures subjected to the
event. Individuals become advocates o f methods and approaches which, when accepted,
provide individual recognition and rewards. In addition, an important role for science and
engineering is to improve knowledge about the mitigation o f the effects o f extreme events,
effectively transferring knowledge and facilitating collaboration among users o f the
knowledge (Petak, 2002).
In general, there are two types o f seismic hazard analysis, deterministic and probabilistic
(Gould, 2003). In a deterministic analysis, an earthquake event o f a specified magnitude is
assumed to occur on the fault that causes the greatest damage to the subject building(s). This
approach can intuitively be expected to generate a reasonably conservative “worst-case”
scenario for loss. On the other hand, a probabilistic analysis accounts for the full range o f
possible earthquakes, their location, return period, size, and the propagation o f the
earthquake motion from the rupture zone to the site(s) o f interest. This provides a return
period curve with a more complete and ‘realistic’ evaluation o f the potential earthquake
losses.
102

In line with Figure 4.1, the next phase is political and economic actions as a seismic risk
response, which corresponds with mitigation action. An effective mitigation plan anticipates
actions that a community must take before a disaster strikes. Planning is one o f the most
important parts o f any mitigation effort. Taking the time up front to make people aware of
the earthquake risk to their community, making a plan o f how to reduce that risk over time,
and what to do in the event o f an earthquake can make a tremendous difference in post
disaster recovery efforts.
It is clear from Figure 4.1 that seismic risk management needs risk “dimensioning”, and risk
sizing takes into account not only the expected physical damage, victims and equivalent
economic loss, but also social, organisational and institutional factors. The difficulty in
achieving effective seismic risk management, in part, has been the lack o f a comprehensive
conceptual framework o f seismic risk, facilitating its evaluation and intervention from a
multidisciplinary perspective. Most existing indices and evaluation techniques do not express
risk in words adequate for the diverse types o f decision-makers, and they are not based on a
holistic approach that invites intervention (IDEA, 2005).
According to the growing recognition mentioned above, although the risk management
approach in Figure 4.1 shows distinctive steps, those activities in the seismic risk
management approach enables an overlap between each step. This means that the activities
in each step are not as clear-cut as are sometimes implied. In most cases, while different
countries have implemented earthquake risk management movements that differ from each
other in detail and degree, they are nevertheless the same in principle.
The seismic risk management approach in Figure 4.1 has been adopted in this research. In
addition, it should be emphasised that Chapters II and III have clearly identified the true
nature o f the seismic risk focused on by this research, i.e. the continued non-seismic
resistance o f non-engineered buildings in Indonesia. Hence, the risk identification phase in
this research is not to further identify the risk, rather to capture progress, hence the name
‘seismic hazard analysis’, as precisely adopted from SCEC. However, the term ‘political and
economic actions’ used by SCEC is not adopted, and seismic response phase in this research
is simply named ‘seismic risk response’. Finally, the seismic risk management approach
adopted in this research will comprise three headings: seismic hazard analysis, seismic risk
assessment, and seismic risk response. The first draft o f the proposed framework in Chapter
V will elaborate this matter further.
103

4.2.2 Reducing the Cost of Loss Using Seismic Risk Management Actions
Seismic risk management has been well known in recent decades. Some countries have
employed seismic risk management actions, based on a belief that investment in mitigation is
much more cost effective than expenditure on relief and rehabilitation (NDMD, 2004a). In
other words, the expected cost o f loss after an earthquake has occurred can be reduced using
seismic risk management actions. Chen et al., (2003) mentions that expected loss during an
earthquake can be cut down significantly through preventive activities before the disaster
happens. Some examples below present the cost-effectiveness o f disaster risk reduction
(DFID, 2004):
a. The World Bank and the US Geological Survey calculated that economic losses
worldwide from disasters during the 1990s could have been reduced by US$ 280 billion
worldwide if US$ 40 billion were invested in mitigation and preparedness.
b. In China, an investment o f US$ 3.15 billion in flood control measures over 40 years is
believed to have averted potential losses o f US$ 12 billion.
c. In Vietnam, 12,000 hectares o f mangroves planted by the Red Cross protect 110 km of
sea-dykes. Planting and protection cost US$ 1.1 million but has reduced the cost o f dyke
maintenance by US$ 7.3 million per year (and the mangroves have protected 7,750
families living behind the dyke).
d. According to Oxfam, the value of cattle saved on a flood shelter o f four acres in
Bangladesh during the 1998 floods was as much as £150,000, against a construction cost
o f only £8,650.
Obviously, seismic risk management decisions must be made and implemented, particularly
in high seismic areas around the world. Setting priorities for action is imperative, since the
need for improvement will always vastly exceed the available resources (SCEC, 2002).
4.3 Some Evidence of Good Practices of Seismic Risk Management Implementation in Countries
In many countries with significant seismic problems, the implementation o f seismic risk
management has increased. Some evidence o f good practices employing seismic risk
management from their seismic hazard, assessment, and response might be used as best
examples for other countries with similar problems. This section presents, as extracted from
many sources o f literature, three important factors that drive successful and effective
implementation o f seismic risk management in various countries, particularly interrelated
with non-engineered buildings. These are (a) direct involvement o f multidisciplinary
104

stakeholders, (b) strengthening o f local capacities, and (c) poverty consideration. Evidence
that the successful three factors have widely contributed in reducing seismic risk in countries
such as the United States o f America, Taiwan, India, Algeria, Colombia, Nepal, and Peru
will be presented as follows.
4.3.1 Direct Involvement of Multidisciplinary Stakeholders in Seismic Risk Management
As described in Chapter II, the key to bridging the wide gap between massive death tolls and
the existence o f seismic codes is a robust mechanism of enforcement and implementation o f
the seismic codes in actual construction. The enforcement and implementation o f seismic
codes is not simple because seismic risk is interrelated with interdependencies among
technical, organisational, cultural, and other types o f systems affecting a community’s
capacity to both mitigate and respond to disaster. There is no longer a single actor, but many
actors, involved in interdependent decisions that increase or decrease the threat o f danger to
the community (Comfort, 1999). Moreover, there is growing evidence that the partial
perspective o f disciplines among community members generate actions that are
unsustainable (Petak, 2002). Thus, bringing a wide range o f stakeholders together to cross
both disciplinary boundaries and sectors in seismic risk management is a substantial key to
sharing effort and responsibility before disaster strikes. How well they work together can
determine the quality and outcome of the risk management process.
In general, multidisciplinary stakeholders involved in seismic risk management can be
divided into two extreme groups: government and non-government agency. Both of them
have specific and significant roles within their sphere o f operation.
4.3.1.1 Involvement of Government Agencies
UNDP (2003) claims that the role of government, in order to reduce disaster, is very
important. It is because governments as public institutions generally view the mitigation of
extreme event consequences as an integral part o f their responsibility to provide for public
safety, which they see as occurring through their regulatory-controlled activities, which are
in the “public interest”. At the present time, many governments in the examples below have
brought a new paradigm shift in their approach to disaster management, based on the
conviction that investments in risk management as pro-active actions are much more cost
effective than expenditure on relief and rehabilitation. They have the existence o f an
administrative structure responsible for seismic risk reduction as a structural entity with
105

adequate budget allocation as evidence o f their commitment to disaster management. In
general, UNDP (2004) highlights that the lack o f wider political commitment to disaster
reduction is often stated as the main barrier to progress in implementation.
In the USA, earthquakes are the most costly natural hazard. In 1978, the US government
created the National Earthquake Hazards Reduction Program (NEHRP) under the Federal
Emergency Management Agency (FEMA) to improve the nation’s understanding of
earthquake hazards and to mitigate their effects (www.fema.gov). Since its creation, NEHRP
has provided a comprehensive framework for efforts to reduce the risk from earthquakes.
Besides NEHRP, in the area of seismic hazard, the U.S. Geological Survey (USGS)
Earthquake Hazards Program is the world scientific leader in seismic-hazard studies
(www.usgs.gov). In implementing the results o f their activities to understand and mitigate
the effects o f earthquakes, US government agencies have actively collaborated with state
geological surveys, emergency-response officials, earthquake engineers, local governments,
and the public. This collaboration has resulted in dramatic improvements in earthquake
preparedness and public safety in the United States.
Similar to the USA, the Government o f Taiwan has established a National Center for
Research in Earthquake Engineering (NCREE) to promote seismic hazard mitigation in an
integrated and systematic approach (www.ncree.gov). Furthermore, the Government o f India
launched a ‘National Programme for Capacity Building o f Architects in Earthquake Risk
Management’. The overall goal o f the programme is sustainable earthquake risk reduction.
The Government o f India has brought about a paradigm shift in the approach to disaster
management, namely that development cannot be sustainable unless disaster mitigation is
factored into the development process (NDMD, 2004a). In Algeria, there are Seismological
and Earthquake Engineering Centres (Belazougui, 2003). In Nepal, there were three
municipalities which expressed their interest immediately after the Government o f Nepal
launched the ‘Kathmandu Valley Earthquake Risk Management Project’ in 1997 (ADPC,
2000).
In conclusion, the existence o f government agency(s) as a structural entity, which actively
manages seismic risk, is the primary role in mitigating, directing, and organizing disaster
response operations. This shows the high degree o f political commitment o f the government
to disaster management, which is accompanied by a high level o f commitment to
implementation. The Government o f the USA, for example, mentioned that between 1983
106

and 2001, only 129 people died in eight severe earthquakes, compared to 1,600,000 world
wide (SCEC, 2002).
4.3.1.2 Involvement of Non-government Agencies
While governments bear the primary responsibility with regard to safety and security, they
cannot and should not shoulder these tasks alone. Non-government agencies, or the private
sector, are a government’s partner in reducing disaster. Private sectors include non-profit
organisations, non-government organisations, and the business sector. Encouraging
governments and private sectors to formally take account o f disaster risk together in their
decision-making might be a first step in raising the profile o f disaster in corporate social
responsibility, as well as promoting the responsibility o f employers for human rights and
environmental stewardship in and beyond the workplace, in order to prevent the
accumulation o f disaster risk (UNDP, 2004).
Indeed, the private sector has a role to play, in moving towards community resilience, that
incorporates an awareness o f disaster risk. Unfortunately, there are veiy few recorded
examples o f corporate social responsibility that have engaged with the disaster risk reduction
agenda in developing countries (UNDP, 2004). There is great scope for encouraging the
private sector to incorporate disaster risk issues into their corporate social responsibility
planning. In the developed countries with significant earthquake problems, it is the
professional engineers that have been at the forefront o f earthquake reconnaissance studies
(Jain, 1998).
There are a lot o f non-government agencies in the area o f Earthquake Engineering (EE) in
the USA. Tremendous improvement has been achieved in order to manage seismic risk
(EERI, 2003), as described below:
a. Establishment o f major EE research centres in the United States, such as PEER Center
headquartered at the University o f California at Berkeley, Multidisciplinary Center for
Earthquake Engineering Research (MCEER) at SUNY Buffalo, and Mid-America
Earthquake (MAE) Center at the University o f Illinois, Urbana-Champaign. These three
centres are funded by the National Science Foundation (NSF) with matching funds from
other sources.
b. Establishment o f several important experimental facilities to conduct EE research
including, among others: Cornell University UCB, University at Buffalo (SUNY),
University o f Michigan, University o f Minnesota, University o f Nevada at Reno,
107

University o f Texas at Austin, University o f Washington, Georgia Institute of
Technology, Lehigh University, Ransellaar Polytechnic Institute.
c. Establishment o f the Applied Technology Council (ATC) in 1971 and its first significant
activity, ATC 3-06 “Tentative provisions for the development o f seismic regulations for
buildings,” was a turning point, casting a framework for the next generation o f seismic
design code.
d. Establishment o f California Universities for Research in Earthquake Engineering
(CUREe) in 1988, and its reorganization to Consortium of Universities for Research in
Earthquake Engineering (CUREE) in 2000.
e. Publication o f reports from studies conducted at the above-mentioned research centres.
Also, EE specific journals, including Earthquake Engineering and Structural Dynamics,
Earthquake Spectra, Soil Dynamics and Earthquake Engineering, Journal o f Earthquake
Engineering, among others, have provided media to disseminate research and
development.
f. Publications of books, monographs, and reports have greatly enhanced people’s
understanding o f earthquakes, and performance o f facilities. These include reports
published by ATC, EERC, EERI, FEMA, SCEC, MAE, MCEER, NCEER, PEER,
SEAOC, USGS, among others.
Furthermore, there is an Earthquake Engineering Centre in Algeria, which was founded in
January 1987. Their missions and objectives are (a) to perform investigation and research
activities in the field o f seismic risk reduction, (b) to train its future researchers, (c) to build
its specific research and testing laboratories, (d) to train and improve the knowledge o f
specialists in seismic design at the national level (seminar courses, conferences and
symposia), (f) to educate and inform the public and the authorities, (g) to aid and assist the
engineering offices and concerned institutions, and (h) to integrate hazard mapping and the
results o f vulnerability and risk investigations in development and the urban planning with
mandatory implementations. In India, there is the National Core Group for Earthquake
Mitigation, founded in 2003, with seven National Resource Institutions: (a) Centre for
Environmental Planning and Technology, (b) Indian Institute o f Technology Kharagpur, (c)
Indian Institute o f Technology Roorkee, (d) Jawaharlal Nehru Technical University, (e)
Manipal Institute o f Technology, (f) Maulana Azad National Institute o f Technology, and (g)
School o f Planning and Architecture, New Delhi (NDMD, 2004a)
Private sectors operate their business within the structure o f the free market, where there is
most often significant market competition. Their focus is on increased and improved sales o f
108

products and services, meeting customer needs while achieving an acceptable return on their
investment. In contrast, governments operate within the structure o f the political system and
understand that extreme events often produce broad scale damage with losses having large
socio-economic impacts or significant impacts on community resilience. Governments
generally view mitigation o f extreme event consequences as part o f their responsibility to
provide for public safety. The conflict here is between advocates for risk management
through appropriate mitigation facilitated through government action and the notion of a free
market maximisation o f return on investments with minimum governmental regulation.
There is a disconnection between the short term good of the business in private organisation
and the long term good of the community. In other words, there is considerable controversy
regarding how the government and the private sector can best implement seismic loss-
reduction measures through regulatory policies, economic incentives, long-term investment,
and public education (Bruneau et al., 2004). Apparently, the role o f business sectors in
seismic risk management still needs to be enhanced.
In summary, involvement o f multidisciplinary stakeholders should embrace multi-target
audiences to develop a sense o f responsibility in seismic risk reduction in daily life. Some
literature suggests that those parties are government officials, community leaders,
businessmen, small and medium contractors, educators, foremen, researchers, scientists, and
NGOs (IUDMP, 2001; CEEDEDS, 2004; SCEC, 2002; GREAT, 2001)
4.3.2 Strengthening of Local Capacities within Seismic Risk Management
Each risk scenario at the local level represents a unique configuration of hazards and
vulnerabilities in the context o f broader processes o f development at the national and global
levels. Yet ultimately, vulnerability and risk are manifested at the local level (UNDP, 2004).
Local level community response remains the most important factor enabling people to
reduce and cope with the risks associated with disaster. Local organisations play a pivotal
role in overcoming local obstacles, in defining and shaping a regional level o f risk
management policy, in sharing and promoting further exchanges and knowledge between
other localities or regional levels and between key agencies and individuals, and in
supporting the development o f national capacities. In general, strengthening o f local
communities can be achieved through three aspects: developing local leadership, conducting
participatory approaches, and increasing public seismic awareness.
109

a. Developing local leadership
Local authorities are in charge o f basic needs such as land-use planning, construction
planning and control, including the protection o f people on its territory. In addition, outsiders
are rarely able to effectively contribute single-handedly to safety programmes in developing
countries. It is rare to find outside experts with a good understanding o f the local situation,
who can work in developing countries for long periods o f time. Hence, the best results are
achieved when the problem is tackled by local experts, with outsiders providing a guiding
role: developing local leadership is the key to success.
In developing local leadership in communities, a long-term commitment is needed, which is
often beyond the funding and staffing cycles o f many agencies. Perhaps, in developing
countries, the greatest difficulty is avoiding the trap o f communities becoming dependent on
well-meaning external agencies. The application o f appropriate technology is one approach
that has been promoted as a way to overcome some o f the problems associated with the
implementation and long-term sustainability o f development projects in the Third World.
Appropriate technology should be able to satisfy the requirements for fitness for purpose in
the particular environment in which it is to be used. It should also be maintainable using
local resources, and it should be affordable (Vickridge, 1996).
Examples o f the successful and long-term improvement o f local communities do exist, but
remain uncommon. The earthquake event in Northridge, California on 17th January 1994 is a
good example. Response operations were immediately activated by the earthquake and
carried out largely by experienced, well-trained, local emergency service organisations
(Comfort, 1999). Improving local capacity to repair and strengthen their own houses using
modem seismic features can be seen in the increasing number o f house units in Maharastra,
India. In 1995, the number o f completed repaired or strengthened houses was around 38,000
units; in 1998 the number reached approximately 182,000 units, a tremendous increase
(EERI, 1999).
b. Conducting participatory approaches
Capacity improvement at a local level, together with a participatory approach, might bring
about other important things to strengthen local communities. For policy interventions
seeking to include a participatory approach, preliminary discussions to help map the social
relationships within the community are essential if the vulnerable (who are also the socially
excluded) are to be reached and helped to build their own levels o f resilience through
participation. Building meaningful participation with vulnerable groups and individuals in
110

development is not easy. Principle characteristics o f social vulnerability are political
marginalisation and social exclusion. Encouraging social integration and political
participation to enhance resilience and other goals for quality o f life is a major challenge to
disaster and development policy (UNDP, 2004). The example o f participatory process has
been carried out by the Government o f Nicaragua, who undertook a participatory process of
local development planning within a disaster reduction approach. Disaster reduction was
factored into a range o f planning sectors, including infrastructure development, productive
sectors, social sectors and environmental management (UNDP, 2004). Community
participation has also been noted in the small Senegalese town of Ruflsque (UNDP, 2004).
The participatory programme is itself a learning process. Key elements o f success have
included the realisation that risk profiles and participatory processes in each region are
different, so strategies should rely on local decision-making and be flexible in approach and
implementation. In addition, local plans should be linked with central institutions to access
support and blend with national development policy, called bottom up vision The
involvement o f local stakeholders into disaster risk management and participation are also a
key factor in maintaining local support and generating significant local outputs for disaster
risk reduction, as well as motivating the acceptance o f shared responsibilities and
cooperation.
c, Increasing public seismic awareness
The next factor to enhance local communities is public seismic awareness. Lack o f public
awareness to seismic risk tends to contribute to essential barriers in implementation o f
seismic codes within non-engineered building. SCEC (2002) highlights that public seismic
awareness can be achieved primarily through public education. Creating a community o f
knowledgeable people through public education is essential to the development o f
‘resonance’ or willingness to support shared action, when necessary, to sustain the goal o f a
responsible, civil society. In the USA, publications o f books, monographs and reports using
both hard copy and on-line systems have greatly enhanced community understanding about
earthquakes and performance o f facilities. These include reports published by ATC, EERI,
FEMA, SCEC, MCEER, and USGS (EERI, 2003). The citizens, elected officials, property
owners, and other decision makers must be informed about the nature o f the risks, their
mitigation options, and the costs o f action and inaction. In order to close the gap between
existing knowledge and its implementation, public education is the best solution (SCEC,
2002).
I l l

A good example o f a strong, earthquake resilient local community might be seen in
Manizales City, Colombia. The success o f the seismic risk management action was evident
during the massive earthquake o f 1938, which did not damage the city significantly.
Similarly, the earthquakes o f 1962, 1964, 1979, 1995, and 1999 caused only minor or
moderate damage. Since the 1980s, the city has had a municipal disaster prevention system
in place, based on municipal development and land-use plans, that incorporates disaster risk
management as a strategic and political cornerstone. Disaster preparedness has become part
o f the city’s culture. Prevention-related information and education activities are conducted
regularly in schools. Drills are held periodically to ensure that awareness and alertness
remain high. The mayor has a disaster risk advisor for inter-agency co-ordination and the
city employs a team of professionals who work at scientific research centres. All residents
who take steps to reduce the vulnerability o f their homes receive a tax break as an incentive.
A collective and voluntary housing insurance scheme has been promoted by the city. It is
added to local bimonthly tax payments, with the aim of covering the tax-free lower socio
economic strata, once a defined percentage o f taxpayers paying for the insurance has been
achieved. Seismic micro-zonation has enabled the local administration to estimate the
expected annual losses of its public buildings and insure them selectively. The city
administration of Manizales has produced a disaster risk plan that aims to translate state-of-
the-art theory into practice, transfer best practice from current experiences in other places,
focus on local participation and sustainability, and build in local ownership (UNDP, 2004).
Conversely, specific to Indonesia, a survey about public awareness o f earthquake and quake
preparedness given to the community in the Minomartani residential area, adjacent to
Yogyakarta City, reveals that the whole community tends to overlook the future earthquake
risk. It seems that there is no public education o f the grass-root community o f seismic risk
from government and private agencies (Chandra et al., 2004).
In summary, the strengthening o f local capacities through improving their local leadership,
participatory approaches, and public awareness is important to enhance resilient
communities against future disaster. According to the World Disasters Report, UNDP (2004)
claims ‘effective and accountable local authorities are the single most important institution
for reducing the toll of natural and human-induced disasters in urban areas’. Furthermore,
providing a local lens allows a large number o f small events to be catalogued, re-shaping
perceptions on risk as a priority concern for development policy and contributing to a
potentially genuine process o f self-organization to reduce risk. This is an essential precursor
to a bottom up decision making process for development policies, strategies, plans, programs
112

and projects in disaster reduction (Yodmani, 2003) focusing on the local ownership o f
prevention projects. Sometimes, knowledge from a developed country is not fully suitable
for the local situation, and the impact on policy and practice at a local level is dubious.
4.3.3 Poverty Consideration in Seismic Risk Management
UNDP (2004) reveals that, in global terms, disaster risk was found to be considerably lower
in high-income countries than in medium- and low-income countries. Disasters affect the
poor disproportionately. Poor people are often the most likely to be exposed to natural and
non-natural hazards. “Disasters in medium- and low-income countries are an integral part of
their poverty cycle. Poverty causes disasters, and disasters exacerbate poverty” (UNDP,
1994). It is true that the majority o f the earthquake losses are concentrated in non-engineered
buildings, which mostly belong to the poor, who often bear the greatest cost in terms o f lives,
and livelihood, and rebuilding their shattered communities and infrastructure (Sarwidi,
2001).
Poor people are often unable to obtain basic services because (a) institutions are not
accountable, (b) local elites dominate the political process and control private sector
resources, (c) corruption is widespread, (d) social relationships are inequitable, and (e) poor
people lack experience with participation. Poverty levels, or the absolute number o f poor and
destitute persons, have increased continually, with dramatic effects in terms o f increases in
social risk and disaster vulnerability (UNDP, 2004).
The urban poor are often forced to make difficult decisions about risk. In low-and-middle
income countries, city governments have often proved ineffective in regulating the process
o f urban expansion through land-use planning and building codes. Unregulated low-income
settlements, where land values are lowest, often occupy the most hazard-prone locations, for
example, in peripheral squatter settlements located in ravines, on unstable slopes or in flood-
prone areas, or else in dense inner city slums.
Living in hazardous locations is sometimes ‘chosen’ if individuals seek opportunities not
only to improve their own quality o f life, but also to enhance the health and educational
attainment o f their children, for greater prospects for their children tomorrow. Poor or non
existent sanitation, high unemployment and underemployment, deficient health and
education services, insecure land tenure, crime and violence, and other factors configure a
panorama of everyday risk. For individuals caught up in the immediate concerns o f daily
113

survival, disaster risk management is often not a priority. Hence, everyday risks accumulate
and prepare the way for disaster (UNDP, 2004).
The disaster impact largely depends on the kind o f development choices countries have made
previously. As countries become more prosperous, for example, they are often better able to
afford the investments needed to build houses more likely to withstand earthquakes. At the
same time, the rush for growth and the resulting urbanisation can trigger haphazard urban
development, which increases the risk o f large-scale fatalities during such a disaster. When
populations expand faster than the capacity o f urban authorities or the private sector to
supply housing or a basic infrastructure, risk can accumulate quickly in informal settlements.
The urbanisation process leads to the concentration o f populations in risk-prone cities, and
risk-prone locations within cities. This is true in megacities and in rapidly expanding small-
and medium-sized urban centres in developing countries (UNDP, 2004).
Regression analysis o f vulnerability indicators shows that, statistically, physical exposure
and the rate o f urban growth acted together in being associated with the risk o f death by
earthquake (UNDP, 2004). In other words, the risk o f dying in an earthquake is greater in
countries with rapid urban growth. Mass migration from rural to urban settlements has
resulted in the growth o f city slums; many located on unsafe land and built with
environmentally inadequate construction techniques. Low building standards may reflect a
lack o f control and supervision in middle income areas and the lack o f resources to build
hazard resistant structures in low-income areas. It is a fact that, in many rapidly growing
cities, earthquake risk considerations have not been factored into the building and planning
process. In general, city governments have not been capable o f regulating either building or
settlement in a way that reduces risks (UNDP, 2004).
International experiences, including tragic lessons from the recent large earthquakes in Aceh
on 26th Dec 2004 and Yogyakarta, on 27th May 2006, show that the growth o f earthquake
prone communities, following the global processes o f development and urbanisation,
commonly give rise to seismic risk unless proper countermeasures are taken to prepare for
future earthquakes and to manage the risk. This is also true for countries o f low and
moderate seismicity, taking into account that the risk value depends not only on the hazard
level, but also on the aggregate elements at risk and their vulnerability to probable seismic
influence. The overcrowding and deterioration of inner city slum areas in Lima, Peru has
been identified as a critical process of seismic risk accumulation in that city (UNDP, 2004).
114

This situation may be attributable to resource constraints in poorer countries. In 2001, in
Indonesia, for example, only 7.2% of the population lived below l$/day, but up to 55.4%
lived below 2$/day (Timmer, 2004). The governments o f such countries lack, not only the
financial resources needed to shoulder the economic burden, but also the institutional and
human resource capacities needed to deal quickly and comprehensively with disasters and
emergencies. Also since the 1970s, but with increasing emphasis in the 1980s and 1990s,
researchers from social sciences and humanities have argued that the impact o f a natural
hazard depends, not only on the physical resistance o f a structure, but also on the capacity o f
people to absorb the impact and recover from loss or damage (UNDP, 2004).
In the area o f seismic risk management, in order to protect poor people from the collapse o f
non-engineered buildings, which are prevalent among the medium to low income population,
it is urgent to disseminate seismic codes which are (a) socially acceptable, (b) economically
feasible, and (c) easily absorbed into local construction methodologies down through the
grass root communities (Aiya, 1994). In fact, earthquake resistance need not be expensive
when incorporated into a sound design from the very beginning o f the planning effort by a
competent team; it usually only amounts to about 1.5% of the cost o f construction (BSSC,
1995). Again, Maharastra, India, provides an example o f good practice; there were over 500
model houses constructed in order to demonstrate cost-effective building techniques, use o f
local materials and seismic features in 1998 (EERI, 1999). One way for communities to
encourage well-enforced seismic codes, and not add a monetary burden, is to provide tax
incentives for more disaster-resistant homes. For example, if a homeowner reduces the
chances o f damage from an earthquake by installing a mitigation measure, then this taxpayer
would receive a rebate on state taxes to reflect the lower costs for disaster relief (Kunreuther,
2000).
Finally, it can be assumed that the widespread persistence o f collapse o f non-engineered
buildings in developing countries has a tremendously devastating impact on efforts to
eradicate poverty at all levels. As a whole, the collapse o f such buildings during an
earthquake seriously undermines the result o f development investment, and therefore
remains a major threat and impediment to sustainable development and poverty alleviation.
In conclusion, based on the three essential factors captured from such good practices in
seismic risk management mentioned above, this points towards the need for policy responses
that begin to identify and then tackle the root causes o f risk that are embedded within
contemporary development practices — as an integrated part o f sustainable development
115

policy. Thus, the proper approach to the problem o f seism ic risk m anagem ent should include
consideration o f all three contributing factors, particularly w ithin the broader context o f
sustainable developm ent. There is a strong sense that these factors are inter-linked. It is true
that the length and im portance o f the three factors should be cornerstones and influence each
other to ensure continuous m ovem ent and im provem ent o f seism ic risk m anagem ent actions,
particularly w ithin non-engineered construction in developing countries (F igure 4.2), so that
the approach is com m on but the solutions are local.
Multidisciplinary Stakeholder Involvement
There is no longer a single actor, but many actors, invo lved in in terdependent decis ions in underscoring the importance of strengthening cooperative and synergistic interactions among various stakeholders for disaster reduction
Strengthening of Local CapacitiesEffective and accountable local authorities are the single | most important institution for reducing the toll of disasters. Through: im prov ing local leadersh ip , co n d u ctin g | participatory approaches, and increasing public awareness
Poverty ConsiderationDisaster in medium-and low income countries are an integral part of their poverty cycle. Poverty causes disasters and disasters exacerbate poverty
Figure 4.2 Three im portant factors o f effective seism ic risk m anagem ent o f non-engineered buildings
4.4 Seismic Risk M anagem ent and Sustainable Development
D evelopm ent actions o f both yesterday and today can increase or reduce d isaster risk in the
foreseeable future. Seism ic risks are no longer seen as extrem e events created entirely by
natural forces but as m anifestations o f unresolved problem s o f developm ent. In recent years,
there has been a m ajor shift in people’s attitudes and behaviour tow ards coping w ith natural
disasters. In the past, m ore em phasis w as placed on hum anitarian response and re lie f
activities, w ith little attention being paid to disaster reduction strategies that have the
potential to save thousands o f lives by even the sim plest o f m easures. Today, there is
116

increasing recognition that, while humanitarian efforts are important and need continued
attention, risk and vulnerability are crucial elements in reducing the negative impacts of
hazards and are thus essential to the achievement o f sustainable development (UN-ISDR,
2002). This translates into the need for much greater attention in the implementation of
protective strategies, which can contribute to saving lives and protecting property and
resources before they are lost. It is for this reason that a more holistic approach, that
emphasises vulnerability and risk factors, has coalesced around the concept o f seismic risk
management.
Clearly, physical exposure itself as a result o f development does not explain nor
automatically lead to increased risk. If urban growth in a hazard-prone location is
accompanied by adequate building standards and urban planning that takes into account risk
considerations, disaster risk can be managed and even reduced. This is difficult in the cities
o f Low and Middle Human Development countries, where more than half o f the urban
population may be living in illegal and unserviced neighbourhoods. It is important to address
these issues at the scale of the city and over the medium to long-term by arguing for a
reorientation in disaster reduction — an approach that focuses exclusively on reducing the
impact o f disasters on development towards an integrated risk management approach that, in
addition, promotes forms o f development that help reduce, rather than increase, disaster risk.
Municipal government will have a central role to play in strategic planning for disaster risk
at this scale (UNDP, 2004).
UN-ISDR (2002) defines sustainable development as development that meets the needs of
the present, without compromising the ability o f future generations to meet their own needs.
Seismic risk management should be seen in the broader context o f sustainable development.
The frequency with which some countries experience seismic disaster should certainly place
seismic risk at the forefront o f development planners’ minds. It is argued that the post
disaster reconstruction period provides the most opportune time to introduce seismic risk
reduction into sustainable development planning. Therefore, political commitment and social
acceptance o f the value of risk reduction are necessary for forward-looking developers who
want to increase the sustainability o f communities. Development needs to be regulated in
terms o f its impact on seismic risk. There is a need for institutional systems and
administrative arrangements that link public, private, and civil society sectors and build
vertical ties between local, district, national and global scale actors. To achieve safety and
sustainability o f livelihood for effective disaster management at a grass-roots level, UNCRD
(2003) mentions three key elements: self help, co-operation, and education.
117

It is clear that nobody can prevent earthquakes but it is possible to mitigate the seismic risk
using available means. SCEC (2002) highlights that earthquakes damage the environment
more than any other extreme event. Their occurrence is highly uncertain; there is no known
method for the reliable, short-term prediction of large earthquakes. Therefore, seismic risk
management should be factored into development planning, which needs shared
responsibility and shared efforts to reduce the impact o f future earthquakes. This leads to
considerable challenges in the building o f ecologically sustainable communities. It is
imperative for society to develop integrative approaches that combine the disciplinary
insights and strengths o f the disciplines to give appropriate consideration to the reduction of
risk, through both voluntary and regulatory approaches.
Successful integration of the disciplines will be difficult to demonstrate empirically. Case
studies are needed to document experiences in the successful implementation o f resilience
and enhanced standards in order to help learning. Work should be done that helps to
facilitate integration of the disciplines through best practice benchmarking, software,
simulation, training materials, and curriculum enhancements. Fundamental research is
needed for the development of understanding and methods to enhance the process o f
integrating technical, economic and organisational/institutional disciplines to achieve
increased seismic resilience and knowledge transfer.
The degree to which these effects will be felt depends on several factors, including the nature
o f the seismic hazard, the degree o f seismic risk that a building owner or a community deems
to be acceptable, and the extent to which attempts have already been made to mitigate the
risk. A variety o f community members with expertise in different roles and varying interests
will play a part in assessing the significance of these effects, and the decision each makes
will reflect his or her view on how well seismic risk is managed. Therefore, seismic risk
management policies should be harmoniously integrated into a responsibility among
governmental entities, economic interests, communities and citizens. This requires
integration o f expertise from many disciplines and close cooperation among professionals
from varying and often hardly overlapping fields (such as building and social welfare)
(Wenzel, 2005). Therefore, putting the seismic risk management o f non-engineered buildings
into a disaster management system with the integration o f a large amount o f expertise is very
important.
118

4.5 An Overview of Disaster Management According to the Decentralization Process in Indonesia
Indonesia is a vast, populous country with enormous economic and cultural diversity. Spread
over 5,000 kilometres and more than 13,000 islands, the country has more than 300
identified languages and about 20 distinct cultural groups (Kassum et al., 2003). For three
decades until 2001, the Indonesian government was highly centralised. Indonesia joined a
global trend to decentralise government, which began in January 2001. Decentralisation
substantially changed the pattern o f government and administration in Indonesia by giving
the sub-national level (especially for local government) far-reaching responsibilities for the
provision o f the public services. A wide range o f functions was transferred to local
government control, city [kota\ and regency [kabupaten] (Turner et al., 2003). It is clear that
decentralisation is intended to strengthen the local government (city and regency) and to
bring them closer to their community. In contrast, provincial authority was considerably
diminished. There is now clear recognition o f the need for local governments, not only to be
involved, but to directly lead the planning, decision-making, budgeting, and monitoring
process.
The implementation o f Indonesia’s new decentralisation policy has provided a new setting
for disaster management. Despite recent efforts o f the Government o f Indonesia to
strengthen the regulation, structure, and organisation of the National Coordinating Board for
Disaster Management (BAKORNAS), significant gaps still exist in policy, planning
processes, mechanisms and procedures; legislation, institutions, organizations and budgeting
at different levels o f government also need to be strengthened to ensure disaster management
is effectively carried out at the local/regional level (Ngoedijo, 2003).
This section provides a general picture o f disaster management practices in Indonesia, which
is primarily summarised from “An Overview o f Disaster Mitigation in Local Planning and
Programming in Decentralized Indonesia” written by Ngoedijo (2003). The pattern o f
disaster management tends to be vastly different across regions and different levels of
government in their disaster mitigation planning and budgeting practices.'
a. There are no Disaster Management Organisations (DMO) established structurally in
government organisation from the central to a local level. BAKORNAS, SATKORLAK,
and SATLAK are DMO and non-structural entity organisations, which manage disaster
management at central, provincial, and local level respectively. The form o f non-
structural organisation causes lack o f coherence and competence in disaster
119

management. Specifically in SATKORLAK and SATLAK, the nature o f non-structural
organisation has meant that no expert or competent person works continuously in
disaster management on local agenda. This limits the seriousness o f attention given to
disaster management and, subsequently, any increase in capacity for good governance in
disaster management. Agencies and individuals see working for disaster management as
a side job assignment or as an additional workload.
b; There is a lack o f detailed guidelines and manuals for disaster management.
BAKORNAS Decree 2-2001 on general guidelines provides broad policies, strategy, and
a management framework for handling disasters; however, it has not been accompanied
by detailed guidelines for implementing disaster management. Besides, limited
socialisation o f the guidelines means that only a few local governments can fulfil the
functions assigned by the Decree. According to the Decree, local governments are
required to prepare guidelines for the implementation of a response for managing
disasters, and co-ordination o f efforts for disaster, reporting, monitoring and supervision.
c. There is a lack o f effective links between DMO and its horizontal organisation as well as
its strategic partner in disaster management. A clear and effective link among
BAKORNAS, BAPPENAS (The National Development Planning Agency), and BKTRN
(The National Coordinating Board for Spatial Planning) has not been fully developed.
The lack o f an effective link with strategic partners in disaster management can be seen
in the members o f BAKORNAS that are purely sectoral departments.
d. Currently, most planning, programming and budgeting related to disaster issues is left to
sectoral departments, without the intensive co-ordination and involvement o f
BAKORNAS, SATKORLAK, and SATLAK. There is no incorporating disaster
management within a wider context in sustainable development. For example, the Urban
Sector Development Reform Program (USDRP) was an Indonesian government program
in 2003, which purported to support local governments in their efforts to alleviate
poverty, stimulate the development o f the local/regional economy, and to improve the
delivery o f sustainable and demand-driven urban services. The ultimate goal o f these
efforts was to improve the living quality o f the urban population (DGURD, 2003).
Within the programs, there were no specific actions correlating with disaster
management.
120

e. There is also a lack o f National Strategy and Plan for disaster management. For
influencing the decision making process related to planning and budgeting in disaster
management, it is important for BAKORNAS to prepare a National Strategic Plan for
Disaster Management in consultation with regional/local governments and non
government stakeholders.
f. Most o f disaster management expenditure comes from a contingency fund and almost all
o f the expenditure is for disaster response. Permanent expenditure budget for disaster
issues, particularly in disaster mitigation, depends largely on sectoral department
programs and is not carried out systematically and comprehensively.
g. There is still no established and sustainable framework for financing disaster mitigation.
Local governments funds are characterised by a high level o f routine budget (more than
60 percent) allocated mostly for personnel expenditure, while budget allocation for
development expenditure is limited. There is a high degree o f dependency on central
government transfers and provincial subsidies for financing development activities,
including disaster mitigation and management. They are in an uncertain position to
obtain multiple sources o f funding for disaster management. Every year, they have to be
active in preparing proposals and consulting and negotiating with departments/agencies
at the Central and Provincial levels to obtain financial assistance for disaster
management. There is no guarantee that their proposal will be accepted.
h. The primary role o f SATKORLAK and SATLAK at a regional level is to co-ordinate
and implement responses for all phases o f disaster management; they are hardly ever
involved in any preventive actions. The organisational structure can be seen in Figure
4.3.
121

Chairman: Head of District/Mayor Vice chairman I: District Arm Forces Commander
Vice chairman II: Distric Police Commander Excecutive chairman: Head of Civil Defense Office
Secretary:Assistant District Secretary District Disaster Relief
Red CrossScout OrganisationsNon Government OrganisationBussinessman
Sub-districtlevel
Figure 4.3 SATLAK organisational structure (Ngoedijo, 2003)
The vice chairmen and the members o f the SATLAK organisation in Figure 4.5 are
from departments that only manage disaster response. There is not any established link
between SATLAK and other departments, which relate to a wider context o f sustainable
development.
i. There is a lack o f ‘locus’, leadership, and capacity in disaster management organisation.
Since SATKORLAK and SATLAK are ‘non structurally’ organised with a high
orientation to provide response actions during disaster, they will find it very difficult to
build capacity and competence in disaster management.
j. A minimum service performance for disaster management is not yet developed. In order
to implement effective disaster management at a regional level, minimum service
standards for disaster management, as the obligatory functions o f regional government,
need to be developed. This will guide regional governments in developing a systematic,
efficient program and budget; allocate sufficient expenditure for disaster management
and help regional government build credible disaster management. The development o f a
minimum standard o f service performance will also help regional government to
implement the newly introduced regulations on performance budgeting effectively.
Task Force Task ForceSATGAS SATGAS
Task Force SATGAS
Task Force SATGAS
Members:Vertical Gov. Officers Provincial Officers Territorial Commanders
122

For many years, legislation on a specific agency o f disaster management in Indonesia has not
existed. The regulations on disaster management, however, are stipulated and scattered in
several sectoral bylaws such as Public Acts on Spatial Planning, Water Resources,
Environment, Forestry, Epidemics (Public Acts no 4 Year 1984), and Government
Regulation on Disease Outbreak (GR no 40 Year 1991). In response to what it labelled as the
ineffective management o f national disasters over several years, on the 29th March 2007, the
House o f Representatives approved a bill that will introduce a new agency to manage natural
disasters and give more protection to Indonesian communities who face such occurrences.
This new agency is a non-departmental agency to replace the current ad hoc one. The new
agency is to organise preventative measures, handle disaster in emergency conditions, and
conduct post-disaster rehabilitation and reconstruction work. In particular, it is hoped that the
future disaster management in Indonesia can reduce the loss o f life and human suffering.
In conclusion, institutional issues are key in disaster management in Indonesia. It should be
recognised that, without proper locus o f disaster management in the organisational structure
at all levels o f government, progress in disaster management will be very difficult to achieve.
Currently, programs in disaster management are mostly oriented towards providing response
actions during disasters, hardly ever preventive actions, and, furthermore, are not connected
with the integral paradigm of sustainable development. The new promising agency in
disaster management in Indonesia should enhance an integrative approach with the public,
universities, businessmen, and other non-government stakeholders. The central challenge of
the new agency is to ensure that decentralisation becomes a positive force to: promote
disaster management as a key issue in the local agenda; develop an integrated program for
disaster activities; and increase local budget allocation for disaster mitigation and
management.
4.6 The Importance of Integrated Seismic Risk Management in Indonesia
4.6.1 Background
Due to rapid economic growth and complex socio-economic and technical problems in
developing countries, Corpuz (1990) highlights that earthquake-resistant construction in the
high seismic regions is challenging because: (a) cities have experienced explosive
urbanisation, (b) most o f the population lives in informal housing and slums, which pose a
relatively low standard of living, (c) seismic codes/standards have been poorly implemented,
and (d) many buildings and other structures are very old and weak. Countries like Indonesia
need effective solutions that are unique to their local needs. It is clear that many new
123

residential buildings in cities are still widely needed to accommodate a large population.
Thus, the increasing number o f non-engineered buildings constructed with non-seismic
resistance prepares the way to the next disaster.
Nepal and India, for example, as developing countries have initiated and incorporated
seismic risk management activities together with a sustainable development process. These
activities address seismic risk management as a pro-active rather than re-active approach. In
contrast, currently, seismic risk management in Indonesia seems to be unsystematic and
incomprehensive. Ngoedijo (2003) highlights that most development planning in
government agencies is left to sectoral departments without intensive co-ordination and
involvement with other sectors, even non-government agencies. It seems to be a lack o f
uniformity in policy approach regarding the various aspects o f disaster and risk management.
Aceh’s and Yogyakarta’s tragic events in 2004 and 2006 respectively, for example, illustrate
the inadequacy o f seismic risk management capability in major Indonesian cities.
People do not implement seismic codes in their houses, probably because they do not
recognise the existing local seismic risk and the importance o f seismic codes or perhaps they
are just being negligent. In general, communities consider implementing seismic codes
through voluntary and regulatory approaches as well as by a combination o f the two. Lay
people who are living in high seismic areas attempt voluntarily to incorporate seismic codes
in their homes if they have a high awareness about seismic risk; however, in most cases, they
do not have any adequate information about seismic hazard and the importance o f seismic
codes in their areas to improve their awareness. At the same time, government agencies often
do not have adequate resources to enforce seismic codes through regulation in actual
construction. In addition, petty contractors, foremen, masons, and carpenters who build most3
residential buildings in grass root communities never implement seismic features because o f
a lack o f training and information access. In certain cases, researchers and scientists often
leave their research findings on a shelf, without any concrete implementation (IUDMP,
2000; CEEDEDS, 2004; and Jain, 1998). These indicate that a variety o f community
members have their own specific circumstances, play different roles and exercise varying
interests about seismic code implementation. These facts suggest that the problem o f
implementation o f seismic codes in actual construction is not simple, and may even be
extraordinary to solve.
It is true that what is needed tends to be an integrative approach that bridges the disciplines
of science, engineering, politics, economic, and organisational and institutional analysis
124

(Petak, 2002). Therefore, establishing and improving integrated seismic risk management of
non-engineered buildings, as a risk management tool for major cities, is extremely urgent in
Indonesia. In addition, this would essentially contribute also to a reduction in poverty levels
by enabling communities to be better prepared for facing the seismic risk in their city.
There are five crucial reasons why it is imperative to carry out integrated seismic risk
management for the reduction o f seismic risk in non engineered buildings in Indonesian
cities, as follows:
a. Based on Indonesian Seismic Zonation (IUDMP, 2001), it is found that almost 60% of
the cities and urban areas are located in the relatively high to very high seismic zone
(290 out o f 481 cities in Indonesia). A series o f tragic events in Indonesia have once
again opened a precious window o f opportunity to remind the Indonesian community
that major regions of Indonesia are located in a high seismic area (see Chapter II).
b. City levels indicate the existence of a highly concentrated, expanding population and
tightly packed building stocks or infrastructures; most residential buildings in Indonesian
cities are non-engineered buildings (Sarwidi, 2001). This is in line with the
decentralisation process in Indonesia, at a local level. Local communities are the actual
owners o f the seismic risk management actions. They represent the greatest potential
source o f local knowledge regarding hazardous conditions, and are the repositories of
many traditional coping mechanisms suited to their individual environment (UNCRD,
2003). Furthermore, a major earthquake similar to those in Aceh and Yogyakarta is just
waiting to happen in the hear future in Indonesia.
c. Similar to other developing countries with a high seismic zone, it is clear that, in
Indonesia, there is a wide gap between massive death tolls and the existence o f seismic
‘ codes. Progress has been made in the analysis o f seismic risk and vulnerabilities clearly
written in seismic codes. Yet, failures are often due to a lack o f implementation o f well-
known seismic codes in actual construction, as precisely described in Chapter III.
d. Currently, disaster management programs in Indonesia are mostly oriented to provide
response actions during disasters, hardly ever mitigation actions (Ngoedijo, 2003). This
leads to a conviction that implementation o f seismic risk management will give not only
‘help’ but also ‘hope’.
e. There is no incorporating disaster management systematically and comprehensively
within the wider context o f development planning (Ngoedijo, 2003). It is based on
policies that allow cities to include the knowledge o f the risk and the consequent
measures in their development plans to reduce such a risk, in order to preserve the
wellbeing o f communities and avoid sudden regress o f the development process.
125

Based on the conviction that development investment that fails to appropriately consider
disaster risks could increase vulnerability, recognition o f seismic risks as part and parcel of
sustainable development can address some of these five reasons and barriers presented
above. Much work should be done to help to facilitate integration o f the different fields and
varieties o f stakeholder, who introduce new challenges and opportunities. Naturally, all
stakeholders, including governments, non-government organisations, volunteers, the private
sector, and the scientific community, speak different languages and bring new practices
which need to be harmonised. Dissemination o f the successful implementation o f practices
and results can also encourage more commitment to seismic risk reduction; however,
achievements are not systematically assessed, recorded and monitored. As a result, how
much seismic risk reduction is paying off is not yet supported by hard evidence.
Furthermore, “what works and what does not and why” are not adequately known for
informed advocacy, policy decisions, or strategic planning (UN-ISDR, 2002). Therefore, it is
critically important that a widely agreed framework should be developed to help harmonise
and systematise the field o f integrated seismic risk management in Indonesia. The
importance o f developing a framework for seismic risk reduction is also emphasised by Shah
(2002), Petak (2002), and IDEA (2005). It is true for Indonesia that there appears to be a
notable absence in the frameworks o f any attempts to reduce seismic risk o f non-engineered
buildings, for either national or local levels.
4.6.2 Why a Framework?
The critical investigation on Chapters II and III has described that coping with the seismic
risk reduction o f non-engineered buildings is one o f the most critical challenges facing the
Indonesian community. Moreover, the importance o f strengthening cooperative and
synergistic interactions among various stakeholders is also highlighted. Therefore,
responding to the need to establish and improve integrated seismic risk management as a
priority on a local community agenda in line with the decentralisation process in Indonesian
cities, it is clearly imperative to develop a seismic risk management framework at a local
level, as a first step towards integrated seismic risk management into sustainable
development. This proposed framework, as a risk management tool, is designed to guide and
monitor the seismic risk reduction o f non-engineered buildings (SRRNEB) that can be useful
and timely to address some of the issues raised above, and establish a global ‘convention’
that could be adapted to local context. Such a framework could also constitute the necessary
backbone to collect information and data and capture good practices. It could help to analyse
126

trends in seismic risk reduction practices and identify gaps and constraints for informed
decisions (UN-ISDR, 2002).
By following a global ‘conviction’, the proposed framework to guide and monitor SRRNEB
is based on ISDR (2003). The proposed novel framework is expected to:
a. provide a basis for effective political advocacy, as well as practical action and
implementation, which facilitate the participation o f the people related to non-engineered
buildings in the decision process;
b. reflect the multidimensional and inter-disciplinary nature o f seismic risk reduction;
c. assist a wide range o f users in determining roles, responsibilities and accountabilities for
their own contexts, without any duplication o f work, as necessary and in-line with the
government decentralization process in Indonesia;
d. provide the basis for setting goals and targets, adapted to different circumstances and
contexts, against which progress can be measured and gaps can also be identified.
In all, the actions o f look-assess-commit-act-monitor-measure-record are the framework's
hallmark. Obviously, the proposed framework is based on truly Indonesian local resources
and is authentically Indonesian.
4.6.3 What is in the Proposed Framework?
The proposed framework as a risk management tool has to identify the following core issues
that underpin the understanding and practice o f seismic risk reduction. It is hoped that the
content o f the proposed framework can address five main impediments in disaster risk
reduction, as identified by Wenzel (2006), i.e. poor governance structures, lack o f multi
sectoral, interdisciplinary work culture, inefficient use o f resources, lack o f awareness and
poor knowledge o f risk, and poor professional standards and ethics. As already described in
previous chapters and sections, specifically, the content o f the proposed framework is unique
by:
a. focusing on non-engineered buildings and all seismic risks associated with them,
b. embracing three phases within the seismic risk management approach as follows: (1)
seismic hazard analysis (as risk identification), (2) seismic risk assessment (as risk
assessment), and (3) seismic risk response (as risk response),
c. involving as many active and multidisciplinary stakeholders as possible, to represent
shared risk and adopt or adapt to their specific circumstances,
127

d. increasing capacity at a local level, supported by a wider network o f resources from
regional, national, and global jurisdictions. Moreover, an efficient co-operation should
be aimed, not only at the transfer o f technologies, but mostly to the transfer o f
methodologies based on local resources, so that the approaches are common and the
solutions are local.
e. Incorporating the poverty factor, as a common problem in developing countries
The detail within the proposed framework is a unique and a great challenge, which will be
originally identified and scrutinised through this study, to provide landmark guidance on
SRRNEB. As an increasingly complex issue in seismic risk management, it is important that
community members are encouraged to translate the five core issues mentioned above in
their environment with creativity and a desire to innovate. At the same time, however, their
initiatives should be directed in providing shared responsibility and an effort to maintain
continuous movement in seismic risk management actions. Achieving this balance is what
the content o f this proposed framework is all about.
4.6.4 What are the Potential Benefits of Using the Proposed Framework?
By systematically compiling information about seismic reduction initiatives using an agreed
framework to guide and monitor SRRNEB, benefits are expected to include abilities to:
a. Relate and integrate seismic risk management issues into development planning;
b. Establish generic standards and guidelines for seismic risk reduction;
c. Help establish priorities within the domain o f seismic risk reduction;
d. Develop systematic, comprehensive data and information about seismic risk reduction;
e. Provide a basis for research in seismic risk reduction;
f. Compare approaches and analyse trends;
g. Identify existing gaps and address them through new or improved programmes, policies,
or plans.
The above benefits would essentially also contribute to poverty reduction by enabling
communities to better operate mitigation o f non-engineered buildings in their territory.
4.6.5 How Can the Proposed Framework be Used?
The proposed framework is just not enough without any concrete implementation
complemented with a high commitment from all community members, government and non
government organisations. Users should be able to utilise the proposed framework according
128

to their own needs and situations. UN-ISDR (2002) highlights that political advocacy and the
promotion o f risk reduction in a coherent fashion will be an overarching role in disaster
reduction. A lack o f wider political commitment to disaster reduction is the main barrier to
progress in implementation. It is clear that what is still required is the demonstration o f the
political will to carry out commitments already made and to implement strategies and
programmes already worked out. Setting goals and targets can offer a means to accelerate the
pace of implementing disaster reduction and measuring results. Widely agreed goals and
targets can force governments and organisations to be accountable for what they will
promise to achieve through these targets. These goals and targets are expected to be set at the
local level, defining local priorities and action plans in order to meet them, but also linked to
regional and national level.
4.7 Summary
Risk management can be seen as a formal process whereby risks are systematically
identified, assessed, and provided for; it should be considered to be advanced preparation for
a possible adverse future event, rather than responding as it happens. The risk management
approach adopted in this research embraces three phases within the seismic risk management
approach as follows: (a) seismic hazard analysis (as risk identification), (b) seismic risk
assessment (as risk assessment), and (c) seismic risk response (as risk response).
The management o f seismic risk poses several problems for decision-makers, particularly
because (a) they impact on all residents of a risk-prone community, (b) the methods needed
to solve problems of seismic risk require a continuing process o f collective learning, rather
than control, to support collective action, (c) the capacity o f a community to mobilize
collective action in response to perceived risk depends directly upon the degree of
awareness, level o f skills, access to resources, and commitment to informed action among its
members prior to the occurrence o f a damaging event, (d) interdependencies among
technical, organizational, cultural, and other types o f systems affect a community’s capacity
to both mitigate and respond to disaster.
Some countries have employed seismic mitigation as a seismic risk management tool based
on a belief that investment in mitigation is much more cost effective than expenditure on
relief and rehabilitation. The three essential factors captured from good practices in such
countries are: multidisciplinary stakeholder involvement, strengthening o f local capacity, and
129
consideration o f poverty. The multidisciplinary stakeholder involvement means that all
stakeholders need to develop a sense o f responsibility to reduce seismic risk daily. The
length and importance o f the three factors should be cornerstones and influence each other to
ensure continuous movement o f seismic risk management actions, particularly within non-
engineered building in developing countries
Currently, disaster management programs in Indonesia are mostly oriented to provide
response actions during disasters, hardly ever in mitigation, and, furthermore, are not
connected with the integral paradigm of sustainable development. The central challenge o f
the new promising agency, as approved on the 29th March 2007, in disaster management
organisation is to ensure that government decentralisation becomes a positive driving force
to: promote disaster management as a key issue in the local agenda; develop an integrated
program for disaster activities; and increase local budget allocation for disaster reduction.
Recognition o f seismic risks as part and parcel of sustainable development can address some
problems in Indonesia. Some evidence shows that seismic risk reduction o f non-engineered
buildings needs an integrative approach within various stakeholders. At the same time, links
with different fields and a variety o f stakeholders introduce new challenges. Apparently, all
multi-sector stakeholders speak different languages and bring new practices, which need to
be harmonised. A widely agreed framework can help to harmonise and systematise the field
o f integrated seismic risk management. It is true for Indonesia that there appears to be a
notable absence in the frameworks o f any attempt to reduce seismic risk o f non-engineered
buildings, either at national or local levels.
Responding to the need to establish and improve seismic risk management as a priority on a
local community agenda in line with the decentralisation process in Indonesian cities, it is
clearly urgent to develop a seismic risk management framework at a local level. The
proposed framework can be a stepping stone towards integrated seismic risk management
into sustainable development. Obviously, the proposed framework is truly based on
Indonesian local resources and is authentically Indonesian.
130

Chapter VReview of Existing Frameworks in Disaster Risk Reduction,
Preliminary Analysis, and Emerging Issues for Primary Data Investigation
Previous chapters have critically investigated the conceptual issues extracted from an in-
depth literature review that was clearly the initial task in developing a framework for guiding
and monitoring seismic risk reduction o f non-engineered buildings (SRRNEB). Besides
studying wider literature, in order to achieve a strong and solid foundation for the data
collection phase, it is important to study, analyse, and evaluate the existing frameworks in
disaster reduction worldwide, since there is notable absence o f any endeavor to reduce
seismic risk o f non-engineered buildings through an integrated framework in Indonesia.
Therefore, the beginning o f this chapter will study in-depth some existing frameworks in
disaster reduction and will present an overview of the origin and content o f these existing
frameworks and their surrounding commentary. The following section compiles preliminary
analysis raised from the in-depth review of both literature and existing frameworks. The end
o f this chapter serves to present some emerging issues for primary data investigation drawn
from combining wider literature and the existing frameworks. This segment is the principal
section in this chapter, before deciding research methodology and gathering research data,
which is then called ‘the first draft of the proposed framework’.
5.1 Review of Existing Frameworks in Disaster Risk Reduction
Currently, a number o f ‘frameworks’ for reducing disaster risk are in existence. The idea for
developing such frameworks seems to follow the United Nations International Decade for
Natural Disaster Reduction, which ran from 1990-1999. Three o f the frameworks, which will
be reviewed as a part o f this study, were published around 2000 and 2003. These are:
131

a. Framework for guiding and monitoring o f disaster risk developed by UN-ISDR in 2003
b. Framework for reducing the earthquake threat in the Kathmandu Valley, developed by
Government o f Nepal in 2000
c. Framework for urban earthquake vulnerability reduction developed by the Government
o f India in 2002
All o f the frameworks, as they are termed collectively here, have a variety o f origins and
differ in terms o f the purpose for which they were derived. Yet, all had a primary concern,
which was the reduction o f disaster risk. Each author gives definitions o f an indicator or
benchmark in their framework articles. These range from fairly brief descriptions of the
indicator to more detailed expositions of its foundation and philosophical perspective.
5.1.1 Framework for Guiding and Monitoring of Disaster Risk Reduction (ISDR,2003)
The International Strategy for Disaster Reduction (ISDR) Secretariat and UNDP have
developed a framework for guiding and monitoring disaster risk reduction at all levels. The
ultimate goal o f this collective and iterative endeavour was to encourage and increase
appropriate, effective disaster reduction practices. The framework provided a starting point
to guide and monitor disaster risk reduction. Five core areas were identified that underpin the
understanding and practice o f disaster risk reduction: (a) governance, (b) risk identification,
(c) knowledge management, (d) risk management applications, and (e) preparedness and
emergency management. These complementary areas describe the essential components of
disaster reduction. The framework was expected to guide global political advocacy as well
as practical action at all levels. Users at all levels should be able to adapt and utilise it
according to their own needs and specific situation.
The Framework as given in Table 5.1 will also be used for developing specific goals and
targets to be achieved in all five-core areas. It will also provide the structure for national
reporting and global monitoring o f progress o f these goals and targets. This process should
result in increased commitment for action in disaster risk reduction by governments and
other stakeholders.
132

Tab
le
5.1
Fram
ewor
k for
G
uidi
ng
and
Mon
itorin
g D
isaste
r Ri
sk
Redu
ctio
n (I
SDR
, 20
03)
"ac<
EEoU
U S' 3
o
.2 c ' dcl, - a
&ISI I
83 .ss s o o
as 3 O gex J—as oO U O gw a, •a os sM o c *o
■g o E a s£ 3• Sc £O CO .E CO° * _ r o c — o
•8 2 S sexO 3O
- s*5 "do O
Pi Pi 3
•xs .5.52 afc- o
*8=1 r* I-*0 u ■1 £f is cx<
cd o cu "S
•occd
:> ca a .
f io3 co”3 * O. °£ 42 o c■4-* EC toc *o E go 3
.is co 3 o c r *o o o
(2 U
O O£2 ts£o £
co o .22x
U o
•S3bDg coUt ^*T3 fa rr cd
S ’s2
. CO £3 o£ ’O 5 o -) O
c a sO 3E a o 3 g 0o 0 <2 2 s * o *o
• a S
O •—3 £ 3 co
SS C cx oE cx coO Oo Pi
Cw
■bo
■ O cM o
"O - aE ^X) O
•g qx> BtL) 00
0 £1 2w cd 3 B
1 ’S' § .2«§.§■
I I3 *E*
3 •r-.2 c
a s COoE g aH w 3 .SO *o o g
Pi cE
Pi
<4H 3 O ”0 O g
.52 3■*< CO
W *3
Oo
o I a o
0 oE ^
1 §&o
£ -sa E E oo3 rg _ O *-*cx'S ”a
—. 3 3 3 SS 3O co oB o g
03 CJ co
33
a s
3E
«8b38
co a s.2 a.*2 'oO co
tD -J3 • s 3
1 5"P 3
I t1 12 E E o
j j u O. T )B 8
■S S
8 .■« "8 .E 8 8 3 Ym b ■B 38 *3E «
• a exO co1c2 o 3 O.2 JS B 3?•— (L)
U 2 E 3
3 _•S O3 aS 8 & j u
S o -| c v s E
coe "O E <-■O 33 J .
a s J 3 •d tioto , g . W)T3 3'ea oCX «Mco O
•a bD
ascxo 'BU S
3 E— \ "O^ 3.2 o f 3to M *3 •3 8 • —
o 5
s. IE B— *ocf 3.i2
C/5.2 *ccd C o uC/D
(_) C/5o *C ^ . . <-h c/5c 2 &S a § E c 2 Eco —, M co 3 co O i_ -r" CO 3S3 4 «r3 0o *as
S3 Ea s coo g .id gw 3 X -Qg &s a*0 - cc3a s
f fi E
3 *3 !S3 g as cx . 2 3 3 , t i cxO s s 3
•rt 0 03 a M 3 _ r c x 2 ‘2. ^ 3 O 3 o •- s 3 C 3 S OO O E 3 -p M 3 & .52> o (2
133

Tabl
e 5.1
co
ntin
ued
<e
00
o p3 oe E £ £ — uB 8£S Cd O CO C COe °3 P o u to >p o
o•o§
.2 o .co E "
o +-TS. s « o u3 O PS 2 ■?co to -m co o to O O OJ m U
p#ocd co Q. 60;s .s1 IO* £1 ° d o.. coJ2 c o o E clP COcd o •C ,u‘ o Cmg 2.2 to5 u2 p C oE toO o8 ,<L>.2 fa Q W
toT3C to cd oS> .S3o o *i cog ^
cd£’£ W) c c 0) .2 to C co C i£S *C od <d 60 So c c■5 0 E £■cd
^ 52 st eg
bo"Oo£oc
cd 13co •—•O coo 5 8 £ a IX) c cd o
cd *g
o toE CO
CO3 .O 0O g Q to
Cm P° O 3 (DOC 2 to «d 2 CO-a E 2 c a* : « J 7 flM 12 O
.2 S “rt g. ° P M toE to I<L> > C.2 I «s D j ,5
C
t o c
s g
*0ccd£1)E<Db£)cd£cd £E .2£ cd
.2 .2"cd £
££ E
c2 E£ 00
_ 3cd to3 2 n c-O co 3 cd >3 .2 W to
•OC3COo123o0 fato 3
=3 ■g 5 .2 2 3Q, M00 H
ccT
«3 £ 0 p•§ I| & O uto ^o e> o.£ — *313 is^ C+m cd o £ b£) .2 .£ o .£ 3 cd no u U *“*o cda ‘~
60 L* £to •£—• *32 E 2 o « fl3 o 3o .2 o2 33 O"3 3 3 T?
3 Oto toO ?>
oc
S3cd.1 o'^ I3 C•is 3Cm fe) O oco Cu 60 CS ’se EC ui O *“*1 .-& E c E 3 E eo gCO p .2 § Q U
• a S
§ a" 3 . 2
g .2 to> *3 rj O U 3U E cu
o .2
60§JSoX
•— co O 'Po. feT3 -2 to ccd 2 e■ to 3E *3 to 3 to otoCO O■c to
t o to c o3 3CO * gO T3 C O c , 0E ^3 -3feb gO r,M CO& c J5 .2O3 3 3uyco 3 O >to w
to c ■O 3S 6 3 o .
i f.2 co-a
3 Sic o2 33 "oz to.
to
134

Tab
le
5.1
cont
inue
d
CLCL
*<
*oa
cd
p a 2 §• c - 5 ■2 *3i3 c Mco P c
p*a
1 *o
p .id .52 to P -C
J 3X J o
4> P 2 wH P
pp cdO I*
S3 bO O P2 .SCL “
O ®P (U
cde1-1 *o• a pC J3
■03 2« £ oj cdP ZSPc .3
E i 8i2G
c S « g S 8GJ ^* . s
O r* N G
4>
p 3o . y
• s sP CL C C
3 O O ‘*322 cd
5 gI 6O M
G£ .2 CO o cd 3
"O 23 P p ue Jd > ..5 2 •S' C/P i-^ pCO CO
*rt Ge . 2ed x)2 ^ •2 c2&) Oo .R
cS O
p . a 2 S c3
G ^ fWg o p
< ,- 00 p CO
E P 2 £
.22 o
p
oo
S 3p
co cd
J gc l £
.S CL C & ° e N B
U8 Jc
• § oP XJ= §O co
G Oto o
G "OH3 c3o a
5 ^ 0cd o
CO
CO #c61)C . 2
o 5 -S-gp .cd .2 H "S, 3!_ Cl co T3 C O O O
U C
Cl +-* £ r co
l aU cd
2 ^ 1 3 .SP 2
•“ • f i b ° trfp . r a
X) e>03 P P
CL P K
• c x :
EWXJc
cdEo
•CH
coCLco O P S3!r * °>> 3c * £ p p top 3p . £
CL Jdp-lo g bh o S "
'■§ « ■o g CL . 2
« td *P C
W) c3•2 "ECO T 3p C H rt
up £ m i ?cd p c- b
ooco
•a§CO
•O3a&gMu cd _
> CL Po 8 2 u & w
^ c co c$ G *G
,*3 co <Dco'' G
O *o •- u.52 e3bO CL O P
C 33 o O . S > . ■a o cC 3 P — SO rt C C
•S3 O C ’'S3 O 3
o p
. £• 3L*ooCJ CO
■g JG QdG ^ O ©
G o G o O G
G O§ 2 E & ER §
o 3c2 S3CL PW Pi
135

It can be seen in Table 5.1 that the framework has a broad context o f disaster risks, from
natural to man-made, and consists of a set of principles that can be applied to any country in
the world. It is highlighted here that the ‘political commitment and institutional aspect’
referred to is definitely in line with UNDP (2004) findings.
The framework develops a way of capturing progress qualitatively and quantitatively. The
Internet site www.unisdr.org (ISDR, 2003) suggests that the framework is provided as a
starting point for an initial core set o f principles and goals to understand, and thus guide and
monitor, disaster risk reduction. Thus, the framework does not indicate clearly how the users
wish to take the process forward, considering the diversity o f disaster risk they have faced.
The framework appears most suited to application at a national scale. For application
specific in seismic risk reduction of non-engineered buildings at a local scale, the core set of
principles can be adopted, but much more explanation needs to be developed in detail, both
within its characteristics and its benchmark.
5.1.2 Framework for Reducing the Earthquake Threat in the Kathmandu Valley, Nepal (ADPC, 2000)
This framework was designed for the Kathmandu Valley Earthquake Risk Management
Project (KVERMP) funded by the Government o f Nepal and GeoHazard Intemational/GHI,
USA (Table 5.2). KVERMP started in September 1997 and continued through to the end of
February 2000. The situation in the field o f earthquake risk management in the Kathmandu
Valley, and in Nepal as a whole, could briefly be described as given below:
a. Seismic hazard assessment performed earlier under the Building Code Development
Project (1992-1994) did conclude that the earthquake risk in the Kathmandu Valley was
identified as very high. The level o f awareness towards earthquake hazard and risk was
very low among the population, as well as among the decision-makers and municipal
authorities. Despite this threat, there was no institution within the Kathmandu Valley to
assess earthquake hazards or promote an earthquake risk management program to
develop an organised approach towards reducing the earthquake risk. People asked two
important questions, notably, (i) what will happen to the Kathmandu Valley if an
earthquake similar to the one in 1934 strikes again? and (ii) what should be done to
reduce the earthquake disaster? However, these questions remained unanswered.
136

b. National Society for Earthquake Technology (NSET) Nepal was created in 1993, and it
tried to work in this direction. Yet, in those days, NSET was simply a group of
enthusiastic professionals. It did not have any office or physical infrastructure, nor any
permanent staff. Institutionally, it was very weak. Thus, despite the potential o f it
contributing to earthquake risk reduction, it was unable to deliver significant results due
to a lack o f resources and support.
c. The technical information about the earthquake risk in the Kathmandu Valley was
incomplete and scattered among several governmental agencies. It was not synthesized,
was not applied to the infrastructure of modem day Kathmandu Valley, and was not
presented in a form that the public and government officials could digest.
d. The National Seismological Center o f the Department o f Mines and Geology conducted
monitoring o f Himalayan seismicity, and was implementing a project for expansion of
the network to 17 stations.
e. Draft o f the national building code was prepared, but it was just lying on a shelf,
unimplemented.
f. It was obvious that there were four fundamental elements necessary to reduce the
earthquake threat in the Kathmandu Valley:
i. An estimation, using all information currently available, o f the probable
consequences of a repeat o f the 1934 earthquake on modem day Kathmandu Valley.
This estimation should be expressed in non-professionals’ terms so as to be readily
understood by the public, business leaders and government officials. This will
provide a factual basis for a sound public policy concerning earthquake safety.
ii. A comprehensive set o f earthquake risk management recommendations based on the
expected consequences o f a large earthquake, which is developed by local and
international specialists in government, city planning, urban infrastructure, and
emergency services and addresses the most significant aspects o f the Valley’s risk.
iii. A properly constituted and equipped organisation, in which government, business
and academic leaders collaborate to foster earthquake risk management and
incorporate earthquake disaster mitigation strategies into the Kathmandu Valley
urban development process. This organisation would also be vital to facilitate,
monitor, and assist in the implementation of risk management programs.
iv. A demonstration project in which the earthquake risk o f some critical, vulnerable
element o f society is reduced. Such a project should not only accomplish a tangible
improvement (to leave something more than reports and organisations), but also
contribute to the training o f local people.
137

Tabl
e 5.2
Fr
amew
ork
for
Red
ucin
g the
E
arth
quak
e Th
reat
in
Kat
hman
du
Val
ley,
Nep
al (
AD
PC,
2000
)©OSo■oc
6X1
D ca
ip. i t s0 0 ^ 0
2
•sS -g
I l f■ So■° tS 6 o <2 £ > o § o »-> u feo p
c3.5 ts
O O•c S |o n._>
2 t;
■2 £ uE o 53 . T3 4- O u 6
cos£o
U
03>3*3C
E
0 os1X!S3(Z)T3GOS
w
•a
r3 ^ o . "O ca <4-» r o p O O n cr- ? - 4*
a .ts cC M O
8 I IS c3I I IS .1*- ' S' o >, 5 c iii s . 2 w « .3 >.2 s 3o g - - 2.2 •c E6-( G . *S° 5 « £O 1) (w • ? | ° 2 3 22
? ? O. s a g > w s a o a
O O T3 "O O s o p o “ ^c «J 3
| c o'<D J ji3 «
i g 3i w c rp« 1e
8 8 . I „ U in
;-a i Io o2 E
3 E « '— i) rSo 3 >% "5 o *°
EO 60 g J= c ° o ■ = in . 3 EEn- vp i l£ o o “a « &.-S3 « S in ■ — '.p c in «w • — “ O 0 3 ^ 6 . 3 8 o!S «P» 6) o \ n** -n • a o
lu w
.b §~ "OO 3 .63 O**—' a .
o o
I s f aoO & C3 rjn . ea
8 . 5 caK o °•O S ' S 3
■s g l sn hfi 5 P- 3 o
E
60 O _ O . O.
■C r*
Sr,S "to J>
43 C3 .2 ^ 3 3
•S 3 o
£ <:3 c3
60C
in
in
ISi, 13 3 O > .ts « S > in . 5 „3 - 3 0 ..2 E 5 3 Mj2 ■“ •E S
o £ u £ o “
3 "3 0-i
■M gc co CX O o
a ■&<c/i O
•= c o3 *i5_
O 3 p
P 3 v*
% t sT 3 in • 3 O C 3 oE m o
c 3 o o _in 33 5 “ E ^c5 3 U5? 3
S . E O . E D
u -o
3 606-1 Co s g . 3 .
1 1 -a8 s .|3 S - B3 * - bo° c . 3S s 5M in U* S c §■
>3! o °* E cO 3 op o • -3 o ■n -o .2 fcfiE a o o* o 33 O l E5u 2 aaf i 3 . 2^ C oo c•x. •—> o5 - w)
o D 2S3 to *o § ca 3j—' c/3 rt3 o in— *£5 =
CU g . 2 c cr 3I
■3 w M
c/iWC/l
cs cn
3c r
x ;
td
OS
Cj 2
3EEo
U
b
O W0 WS 3 ^• 3 ca £>E E 3 P .E {*-1 S 3© U -g “1 a '8° o o
’> ea 2
o 3 oo ?£ Eo W ~ u oo Q OS
W co
138

Tabl
e 5.2
co
ntin
ued
G M o
E .2 E
“ u< o
* 1 ) u
M-s '-3 EE ra TS u U C3•o Q_ c3 u
5.Z
o W on•= O- W) T d TD> 3
>»■ §) « rap cU c « >>nj
.£P *oH U p iQ Q U <2 E t c
O <4-<
CL, LXJ
139

Tabl
e 5.2
co
ntin
ued
to
, E C
S 3 to (u t sf S .S3 <u■ E3 «
3
««•
* 5i* 2« > , oCL o <t_i
' 5 5= ’5C CDS u
2 E<u3 -■2 ■o'
| .icq o>
^ CL
? Bo s
<= . 2id rE a§ £ co 1,1 a to
e °®E cW CJ —U CD .E
o
O c
CO CJ
ta _cd co CO Cd U CO
J C o
£ o
S3 ?.22 O■o jt■3u c o •C c
§ S I« •! E *
,E a
jS "S u ^ 2 5C3 > O
_ ’o P aS a g a l“ o t S *
u s ; «to a * " 3a x .2 o u o
2 p o_G ^h a
EO \3E ’>
CS "c!s^ aC .o
5 .2
2 aflj 4-1•"2 Sto ac £ o o u a .
s.§? o
£ | s* “'§ «03 33 to O
IE fea .
■i
a •=fSa-’
1 £ .2 <oCO GJ CO ccS *s
- » e .1 £:hy eu' o ' ctf
>m5U r«oPi CWs s2 NCO ^&> 553 z3 B - 3 00s D.j= ^•5 a
g.:§o tJ
fa 1cd 5/3 ^ £3 H ^lw 80 0 toz c • s c 1-2 x S p q
0 ) * oCO cd
S J2 - °
t 2 2 ^ Si > C w 30 . x 0 5
U S B J
1 ^ C m * O O o®* s ®C P 05 «§.sc = a33 o 3 c 0 o u S E
2 o S § - s <r■3 B >-.I s a.3
a 2
.g >CO W
> >
H
o 2 H 2 - cCO Ocr -1 co& - aZ <y
co o
&*00 rsz ^
I d s
a g o
a *°cd fli
! ^1 5/5
.■ 5’E c3 oE »E ^o
C u
Q
2 “ < E c g "Z to S PCL bDO .E ti -Ecd cd
a - i s
CL o
O y ^o ■ E SU w . ..ft .a .0 «
oCO *Z2 COi . & iP ti ?5 1feb-s eba S i S i S a- E a ..52M t_ M 3a 3 a a "3 a +;a B -a 5a ^ E E "ra
— - 1 z2 "2 4J _ 4J > 3 > 8 *2 S
p
T3 § *3 "2(L) E O Eto to TO
g K g c S . 5 2 n o E?£ E? E o o o S
t - 1 wi H W "2 U2 aw 01 M aZ ? ^ c
•c EO <L>a SP *0 2o §
U S
140

The Kathmandu Valley Earthquake Risk Management Project was designed to meet four
objectives:
a. Evaluate earthquake risk and prescribe an action plan for managing that risk;
b. Reduce the public schools’ earthquake vulnerability;
c. Raise awareness o f the public, o f Nepalese government officials, o f the international
community resident in the Kathmandu Valley, and o f influential organisations abroad
concerning Kathmandu Valley’s earthquake risk; and
d. Build local institutions that can sustain the work launched in this project.
The framework in Table 5.2 has a broad context in seismic risk management steered from a
national level. For detailed implementation on a local level, the framework needs to be
developed and suited to local needs. The indicators in the framework are clearly obsessed
with a quantitative measure that is easy for the assessor to measure the progress and
achievement, especially around ideas of sustainability. The order o f the framework tends to
follow seismic risk management methodology developed by SCEC (2002), starting with
seismic hazard analysis and seismic risk assessment, and then following with developing
strategic mitigation. This is very useful to replicate within development o f the proposed
framework.
Starting with an earthquake scenario as a seismic hazard analysis and risk assessment was
successful in implementation because (ADPC, 2000):
a. It was prepared with the active involvement o f all concerned (stakeholders)
b. It took place through the process o f interaction, interviews, workshops
c. Loss estimates were used to initiate and sustain the dialogue/discussion
d. Simple laminated maps were very effective to sustain the dialogue
e. Respective institutions involved assessed their own institutional capabilities for recovery
Moreover, the earthquake scenario can be used as an effective awareness promotion tool
(ADPC, 2000):
a. To buy-in authorities, to develop an Action Plan
b. Provide the required motivation to seek/identify actions
c. The scenario was effective because the stakeholders were involved in its preparation
d. The scenario provided the motivation: risk reduction ideas started coming in from
officials, when the institutions were formally requested to identify actions that could
help reduce the risk.
141

5.1.3 Framework for Urban Earthquake Vulnerability Reduction in India (MHA, 2004)
The framework for urban earthquake vulnerability reduction was a structure of national
initiative to reduce the vulnerability o f communities in some o f the most hazard prone
districts of India (169 districts and 17 states); it was developed by the Government o f India
and UNDP under the Disaster Risk Management Programme in 2002-2007 (Table 5.3).
Their aims were: to contribute to the social and economic development goals o f the National
and State Governments, enable them to minimise losses to development gains and to reduce
their vulnerability to natural disasters. The overall goal was a sustainable reduction in
earthquake risk in the most earthquake-prone urban areas across the country. The programme
relied upon a community based approach to disaster management, and sought to build the
capacities o f communities, government functionaries at all levels, and other stakeholders in
disaster management, at all levels, in an organised manner. The Ministry o f Home Affairs
was the executing agency with the support of UNDP Country Office for implementation.
This project is essentially aimed at strengthening the capacities of communities, urban local
bodies and the administration in mitigation, preparedness and response in 38 cities in India.
These cities have been chosen on the criteria o f being located in Seismic Zones 3, 4, or 5,
with a population of more than half a million. The project is a suitable model for the
mainstreaming o f earthquake risk management initiatives at all levels and help to reduce
earthquake risk in the most earthquake-prone urban areas in India.
Urban Planning Institutions and Agencies in the selected cities would be directly involved in
the planning process to ensure the sustainability o f these initiatives. A wide representation of
women was envisaged in this project during the planning process and also in the capacity
building component, not just to be prepared in the event o f a disaster, but also to act as
disaster managers and to focus on the special needs o f women in disasters. This project
worked closely with relevant Government departments and institutions at the National and
State levels. Knowledge from this initiative fed into the national capacity building
programmes o f the Government o f India, and helped to mainstream training in disaster
management in all regular training programmes o f the Government.
142

Tabl
e 5.3
Fr
amew
ork
for
Urb
an
Ear
thqu
ake
Vul
nera
bilit
y R
educ
tion
in In
dia
(MH
A,
2004
)
2oa*3e
ECl
>u•o■a£
•o
<u
ca . woo xj o
"a o ij.5 £ Is « « 2H DO ca
E o<L> to
bp
52p
ga . CJ
>oo aVIto
.£ 1cn
fi 5caDO5
5 oI Io EO flJ1 > yo; -o c2__2 S "2.E *a p -E-- u W S.
53- S 3
I l l s .i I I Ica o V E U 0 , 0
v
a.c:w<us*o
u
£
60 5
2 60
60 o
S'? 60
M P
ca po
ca «DO H
W oDO C
* ca & .2? ~ c
CL &D O w --
*© WU £ W O
ca ca
•a .•=e ^J g
c w a. g O -aE ® 5 E u ”SJ «r£ o o — “ O ’? 60 >7 EC ^ o2 «.£ E g o o .2 > « E o pe '5 wg « = S -s M? ca
U : *2 . ca T\O o -■ 'C +3 U
•£ s i •£S' OES.—S o c >O C g u0 5 8 &
143

Tabl
e 5.3
co
ntin
ued
00 o
U 6D
5 6JD c
E .J - S Q.-S
D oo cl.
a M
ca ca u u
O ca g -.f ib “ o P i»,a n c
53 ° » - . 2 M S u. £ - 9 "bD >
g.-S.^S S I | CH ,« w nO 00
Sf)-p c x - .S {3 o-S) bD c
S i S SCJ ts Q _e ^ •"* r \•5 oo X) U
o o
o I E 5P m tfa C ^ Ob «2 c2 ca ca3 “ bfl _J J O
o-i E o o o oC Co §O o —E ° £■ o ' o ' o O E °f c ' S i Q J* g « s>«u f f O
S o "
£ . § i
W s—✓ CA
144

Tabl
e 5.3
co
ntin
ued
W).-
60-0 UE c • -
bO U
-•rn.bct o CL c
bB 3
■£ S' •« W)U t i l O n
u rt2 ? E c — n. y S ° E^ n o S
*> c l >> ca o _£ U D Q
£ SPQ
C/3 iZ hrti i hD a w £ fc- U <L> ~h ’owUw w w H CL C/3
>».spO CJ3
c/3 W5
145

Using the framework, the project envisaged the following five broad objectives, as follows:
a. Awareness generation
b. Development o f preparedness and response plans at community and administrative
levels
c. Development o f a techno-legal regime for the States
d. Capacity building at all levels
e. Knowledge networking on International and National best-practice among all the cities
and urban centres in the programme.
The following were the expected direct outcomes o f the programme:
a. Enhanced capacities in the Ministry o f Home Affairs for disaster risk management
b. Administrative and institutional framework for earthquake risk management in the most
vulnerable urban centres of the country
c. Capacity building in earthquake risk management at National, State, District, City,
Ward/Community level, including strengthening o f resource institutions and establishing
o f linkages.
d. Development o f an Earthquake Scenario document for each city so as to know the
consequences of an earthquake (estimation o f damage probabilities, etc.) and preparation
o f an Action Plan for the purpose o f emergency planning and preparedness for the 38
cities.
e. A comprehensive earthquake risk management framework and recovery plan for each of
the 38 cities.
f. Awareness of earthquake risk among functionaries o f Urban Local Bodies
g. Disaster resource inventory prepared for the cities covered under the programme.
h. Sectoral Preparedness plans for all nodal agencies in the ULBs and for the residents
welfare associations o f the city
i. An aware and informed community, students and teachers, key government
functionaries, masons and engineering institutions, policy makers etc.
j. Compulsory certification course for practising engineers and architects, including
detailed course curriculum.
k. Training and capacity building for engineers/architects and builders in safe-building
practices and retrofitting techniques.
1. Awareness o f safe building practices among practising architects/engineers/builders.
m. Support to generate awareness among school students and scheduling o f drills in disaster
prevention and response for schools and the promotion o f programmes such as the
School Earthquake Safety Programme.
146

n! Institutionalisation o f regular preparedness drills at various levels including all
stakeholders
o. Capacity building activities for all stakeholders including civil society organisations in
the search and rescue, first aid, relief and restoration in post earthquake recovery
situations.
p. Risk analysis o f key public utilities, prioritisation o f the same in terms o f the need for
retrofitting and resource (finance, manpower, etc) plan,
q. Review & amendment o f the existing zoning regulations, building codes and byelaws
and sensitisation o f building experts about the same, and review o f enforcement
mechanisms for the byelaws etc.
r. Adoption o f preventive maintenance policies and action towards earthquake safety in
. hospitals and key public institutions,
s. Dissemination o f cost effective retrofitting technologies for hazard resistant housing
t. Enhanced capacity o f women as disaster managers in first aid, shelter management,
search and rescue, trauma counselling etc.
u. Manuals, training modules, SOPs and awareness strategies to be made available for
replication in other areas.
V. Enhanced capacity o f the training institutions for training in seismic hazard mitigation
and risk management,
w. Knowledge networks for better involvement o f stakeholders
x. The development of a National and State database on natural disaster risk management,
y. Integration of vulnerability reduction into development programmes to allocate
resources more effectively based on needs,
z. A web-based portal on knowledge sharing and inter-city co-operation on earthquake
vulnerability reduction initiatives
The following were the expected indirect outcomes of the programme:
a. Reduction o f expenditure on disaster relief and reconstruction with an increased
investment in preparedness measures.
b. Sharing o f disaster relief cost by the community.
c. Self-reliant urban local bodies for preparedness.
d. Linkages o f earthquake preparedness plan to urban development plans.
e. An increase o f people’s awareness and participation.
f. Access to information by the people.
g: Development o f highly trained construction personnel,
h. Strengthening o f academic/key resources institutions.
147

The framework in Table 5.3 has demonstrated complete and comprehensive seismic risk
management and response in order to reduce urban earthquake vulnerability in 38 cities with
a high seismic risk around the regions o f India. It appears that the success o f the programme
o f national initiative relies upon a community based approach to disaster management and a
building o f capacity for communities, government agencies at all levels and other
stakeholders, in an organised manner. The compulsory certification course for practising
engineers and architects; training and capacity building for engineers, architects and builders
in safe-building practices and retrofitting techniques; dissemination o f cost effective
retrofitting technologies for hazard resistant housing, and the strengthening o f local
academic institutions are good examples in seismic risk reduction that can be applied in the
proposed framework. In the framework, the expected outcomes have mentioned the probable
consequences of an earthquake for the purpose of emergency planning and preparedness.
Based on the explanation from the three existing framework, all three frameworks have
generally implemented three key characteristics o f a successful disaster reduction framework
in their contents: generating political will, flexibility (particularly in their indicators that are
not rigidly or prescriptively applied), and the ability to encourage ownership (Mitchell,
2003). Generating political will is the first key characteristic, in line with the conviction that
lack o f wider political commitment to disaster reduction is often stated as the main barrier to
progress in implementation (UNDP, 2004). Secondly, the framework must be flexible
enough to adapt all aspects within community life and their socio-economic situation and
also to incorporate local knowledge on risk and vulnerability according to socio-cultural
diversity. This second key characteristic is closely related to multidisciplinary stakeholder
involvement and the strengthening o f local capacity, as precisely described within three
important factors o f effective seismic risk management o f non-engineered buildings in
Chapter IV. Thirdly, the framework must be able to encourage ownership, since a sense of
ownership is really needed, not only to encourage and maintain actions voluntarily in order
to generate a culture o f prevention, but also to make community members feel part o f the
effort. As a result, people will actively make contributions to reduce vulnerability. Through
a high sense o f ownership, people tend to recognise that seismic risk reduction needs shared
responsibility and shared effort. This is also underpinning what Lustig (1997) has found: for
a disaster-management system to be sustainable, it should be designed not only to convey the
message to the members o f the disaster-prone community that they are in control, but also
that the system is actually under their control.
148

Referring to the two frameworks from Nepal and India, which represent developing
countries, attention is called to the most vulnerable countries where disaster risks and
chronic vulnerabilities are closely linked, and are part o f the poverty cycle. Without
proactive and effective involvement o f the donor countries, it may be unrealistic to expect
poor countries to make significant progress on many aspects o f disaster reduction.
5.2 Shortfalls in the Three Existing Frameworks
In recent years, there has been increasing pressure on reducing disaster risk. Some countries
and organizations have developed a strategic framework for reducing disaster risk. The
frameworks from UN-ISDR, Nepal, and India which have been examined in the previous
sub-section represent good example frameworks in this matter. All three frameworks above
have demonstrated their specific area o f interest in reducing disaster risk. It is widely agreed
that consensus building and transparency among a wide range o f stakeholders are vital to its
success.
Although there is much strength in these frameworks, some shortfalls are still remained. The
framework from UN-ISDR describes very broad areas o f disaster ranging from natural to
man-made disaster, whereas the frameworks from Nepal and India focus on earthquake
disaster management. All seem to focus on national level, where the consideration o f local
wisdom, practice, and belief do not emerge clearly. In relation to their benchmark to measure
the progress o f implementation, the UN-ISDR's framework develops several indicators
qualitatively and quantitatively, whereas the Nepal's and India's framework give a few,
relatively simple measures and likely to be focused on quantitative measures.
There is relatively little explicit reference to the method to which the three frameworks
above apply, for example, a number include specific indicators concerning generated data
(for example: interview, focus group). There is still considerable variation in the density o f
the frameworks in terms o f the number o f specific features o f indicators that are included for
appraisal. To some extent, this is related to the particular focus o f the framework. Although
there is some degree o f consensus about a broad quality o f criteria, different emphasis is
placed on specific features o f content, depending on the purpose o f the framework, any core
concepts or principles within which it operates and the way it is formulated.
149

Mitchel (2003) mentions that the choice to use qualitative indicators allows everybody to
form an opinion on the ‘grading’ o f such indicators and does not necessary require extensive
data collection. Moreover, there is general agreement that a qualitative benchmark
encompasses a wide array o f approaches. As a result, qualitative rather than quantitative
indicators are preferred as a way to engage as many parties as possible. In certain cases,
sometimes, many projects focus on short-term outputs such as the programme in Nepal,
rather than long-term outcomes, due to funding constraints and pressure to provide quick
evidence o f project success. In this situation, quantification is not completely abandoned.
Quantification o f sub-indicators can help to inform broader qualitative indicators examining
the quality o f disaster mitigation.
In order to overcome the above shortfalls, this research proposes an integrated framework
equipped with advantages o f both qualitative and quantitative indicators. Some elements in
the proposed framework provide the demanding consideration from local level as an
important part o f seismic risk reduction as well as the national level. Unlike the Nepal's and
India's framework, this research focuses particularly on non-engineered buildings as the
biggest cause for the earthquake disaster.
5;3 Preliminary Analysis from the Review of Literature and Existing Frameworks
This section seeks to appraise the salient points o f the review of both the literature and
existing frameworks presented in the preceding sections, particularly focusing on the
development o f the proposed framework within the Indonesian local community. This
appraisal makes a robust background for the following section that identifies the focus and
direction o f the next phase o f the research.
a. Most Indonesian Regions Located in High Seismic Areas
An earthquake event is unstoppable. Strong-major earthquakes have long been feared as one
of nature’s most terrifying and devastating events. On account o f its geological conditions,
the Indonesian regions are highly prone to earthquakes with the potential to inflict huge
losses on lives and property. Earthquakes pose a real threat to Indonesia, with almost 60% of
the cities and urban areas located in the relatively high to very high seismic zone. The Aceh
and Yogyakarta earthquakes clearly demonstrated the seismic vulnerability o f Indonesian
areas. Considering the area’s historic seismicity, population density, and building and
infrastructure stocks, it is clear that major Indonesian cities will suffer considerable seismic
consequences in terms o f public safety and economic impact in the near future.
150

b. The Collapse of Non-Engineered Buildings as the Biggest Cause o f Human Deaths
Findings from many of CEEDEDS’s investigations in earthquake damaged regions, after the
jolts around Indonesia, showed that non-engineered buildings dominated in number and
always suffered most. Human deaths and injuries, as well as damage to property during
earthquake, were mostly caused by the failure o f such buildings. This situation is very
similar to other circumstances around the globe, particularly in developing countries.
Conversely, the few buildings that were constructed according to the modem building code
were able to survive the earthquakes.
Some of the evidence shows that non-engineered buildings are still being constructed by
self-build owners, builders, and local engineers within medium-low-income populations in
Indonesia. Although these buildings will gradually be eliminated by natural ground shaking
and be substituted with better construction, it is widely accepted that they will remain the
single greatest source o f existing seismic risk for the foreseeable future. Therefore, this gives
a stronger urgency to the introduction of seismic resistance to non-engineered buildings, both
for existing and new building stocks; this is imperative in order to reduce death tolls in future
earthquakes.
c. A Wide Gap between Massive Deaths and the Existence of Seismic Codes
The catastrophic earthquakes around the globe have reminded the world communities o f the
importance of understanding earthquake facts. Lessons learned from past earthquakes have
clearly indicated that non-engineered buildings will suffer most during earthquakes. This is
especially true in the developing world, for example, Indonesia, where most residential
buildings are low rise and non-engineered. Evidence shows that earthquakes will still claim
massive death tolls in the future as long as many non-engineered buildings without seismic
features still exist in high seismic areas.
At the same time, most developing countries in high seismic areas such as India and
Indonesia have developed seismic features/codes for low-rise buildings for self-built owners,
builders, and local engineers. Implementation o f seismic features helps to improve the
behaviour of structures, so that they may withstand the earthquake effects at the appropriate
levels o f ground motion. Seismic features are contained within characteristics o f structure,
including structural and architectural configuration, design, material, quality o f construction
and maintenance. Due to the nature o f the ground shaking, installation o f reinforced concrete
bands at the plinth, lintel, and roof level are the most important items in seismic features.
151

The key role o f the bands is to ensure a desirable ‘box-like’ building behaviour during
earthquakes and also to reduce the chance o f walls tilting due to out-of-plane seismic actions.
All professionals and people who have embraced seismic reduction find the high death tolls
emotionally wrenching and simply unacceptable. Professionals in many countries have the
seismic codes to save lives and human suffering. It is evident from many examples that
progress has been made in the analysis o f risk and vulnerabilities, or knowledge o f how to
reduce these risks. Yet, earthquakes still continue to claim thousands o f lives every year.
Obviously, it is widely accepted that there is a wide gap between massive deaths and the
existence o f seismic codes. The number o f deaths could have been reduced, perhaps even
avoided, if an understanding and implementation o f seismic codes had been enforced and
employed properly. In fact, failures are often due to a lack o f action to combat even the
known risks or a lack o f enforcement of well-known solutions, seismic codes. The most
important thing is that the key to ensuring earthquake safety lies in having a robust
mechanism that enforces and implements these design code provisions in actual
construction.
d. The Importance of Integrated Seismic Risk Management of Non-Engineered Buildings in Indonesia to Bridge the Gap
Due to the rapid economic growth, complex socio-economic and technical problems in
developing countries, it is well known that earthquake-resistant construction in developing
countries is challenging. Countries like Indonesia need effective solutions that are unique to
their local needs. Good practices in countries elaborate three factors that contribute
significantly in maintaining continuous seismic risk management activities within non-
engineered buildings. These are: multidisciplinary stakeholder involvement, strengthening o f
local capacity, and the incorporation o f the poverty factor.
Nepal and India, for example, as developing countries, have initiated and incorporated
seismic risk management activities, together with a sustainable development process (ADPC,
2000 and NDMD, 2004a). These activities place seismic risk management as a pro-active
rather than reactive approach. In contrast, disaster management in Indonesia is currently a
problem. It is unsystematic, not planned, and incomprehensive. The awareness level o f the
public and officials is really low. (Ngoedijo, 2003)
To bridge the gap between massive death tolls and the existence o f seismic codes,
enforcement and implementation o f these seismic codes for non-engineered buildings is the
152

key to ensure earthquake safety. The implementation o f seismic features in actual
construction is not simple. Integrative approaches are needed to bridge the disciplines o f
science, engineering, politics, economic, and organisational and institutional analysis (Petak,
2002). Based on good practices in various countries, this can be achieved through an
approach o f integrated seismic risk management. Therefore, establishing and improving
integrated seismic risk management o f non-engineered buildings, as a risk management tool
for major cities, is extremely urgent in Indonesia.
e. A Novel Framework for Guiding and Monitoring Seismic Risk Reduction of Non- Engineered Buildings as a Starting Point to Reduce Seismic Risk
Currently, there is a growing recognition that multidisciplinary stakeholders should be
involved in solving the problem within seismic risk management mentioned above. All
stakeholders introduce new challenges, bring new practices and speak different languages,
which need to be harmonised. A widely agreed framework can help to harmonise and
systematise the field o f integrated seismic risk management (UN-ISDR, 2003).
Responding to the need to establish and improve seismic risk management as a priority on
local community agendas, in line with the decentralisation process in Indonesia, it is clearly
imperative to develop an integrated seismic risk management framework at a local level.
This would be a first step toward integrated seismic risk management to reduce seismic risk
in Indonesia. Therefore, the principal aim o f this research is to develop an integrated novel
framework for guiding and monitoring SRRNEB in Indonesia, using a risk management
approach. It is true for Indonesia that there appears to be a notable absence in the
frameworks o f any attempts to reduce seismic risk o f non-engineered buildings
Given the nature o f the research aim, the principles within the proposed framework draw
heavily on the wider literature, the existing frameworks, and on the contribution o f those
who will take part in the study. Moreover, the proposed framework has to be flexible to
adopt the concept that sustainability may differ among different types o f people and
organisations. A community needs to overlap and integrate its social, environmental, and
economip spheres. Each sphere or system has many components, and in every community,
the quality, quantity, importance, and balance may be different (UNCRD, 2003).
153

5.4 Emerging Issues Arising from the Review of Literature and Existing Frameworks for Primary Data Investigation
This section mentions some emerging issues arising from the review o f literature and
existing frameworks for primary data investigation, in order to develop the ‘Framework for
Guiding and Monitoring Seismic Risk Reduction o f Non-Engineered Buildings in
Indonesia’. These encompass a literature review in Chapters II, III, and IV as well as the
review of the three existing frameworks in Section 5.1 as elaborated above. This is also the
launching pad for the next stage of this study, hereinafter called ‘the first draft o f the
proposed framework’ for guiding and monitoring seismic risk reduction o f non-engineered
buildings (SRRNEB).
Firstly, from the exploration o f the critical review of literature and the existing frameworks,
all common risk-based issues associated directly or indirectly with non-engineered building
and seismic code implementation were captured, identified, and arranged within the three
steps o f seismic risk management approach adopted in this research. The overall purpose of
this stage was to identify critical and glaring issues and areas for potential improvements.
With all common risk-based issues identified, the extent o f the principles in ‘the first draft’
would be easier to establish and embrace a wide variety o f Indonesian social and culture.
The established links between discipline, scientific, and indigenous sources o f knowledge
develop the capacity to move from knowledge to action. It was hoped that the approach
would be common, but the solution local. A local solution means that one cannot simply
adopt the ordinance, program, or approach o f a community in one seismic area and expect
that it will be technically appropriate or useful in a different community in another seismic
area.
In all, the principles o f ‘the first draft o f the proposed framework’ contain many common
aspects of non-technical and technical measures usually facing a community and in line with
the research topic. The principles deal with the comprehensive regulatory, technical, social,
and economic issues involved in seismic risk management activities, inside which the role o f
various stakeholders such as researcher, scientist, contractor, foreman, government,
businessman, educator, NGO, community leader and reporter lie.
The structure o f ‘the first draft’ is divided into three headings, which correspond with the
three steps in seismic risk management approach adopted in this research. These are: seismic
hazard analysis, seismic risk assessment, and seismic risk response. Twelve core areas were
154

identified that underpin the understanding o f seismic risk reduction o f non-engineered
buildings. The length or relative importance o f each core area might vary, depending largely
on the needs o f users. Each core area provides statements consisting o f characteristics and
their indicators. Characteristics are the breakdown of core areas, which relate to guiding
elements to SRRNEB comprising the full set o f components in current community activities,
such as individuals, organizations, policies, and technical resources. The characteristics
highlight important areas to reduce significantly the seismic risk o f non-engineered
buildings, moving from knowledge to action. Whereas, indicators are elements to monitor
and measure the progress o f implementation, as well as to address existing resources,
capacities, and/or attitudes. The indicators were designed to be achievable, desirable, and
measurable. The procedure used to develop elements (i.e. headings, core areas,
characteristics, and indicators) in ‘the first draft’ is structurally depicted in Figure 5.1.
155

Sour
ces
, r—
El
emen
ts in
'the
first
draf
t of
the
prop
osed
fra
mew
ork'
COcncTDcoQ)X
cCL)
ECL)O)
| idE o
uE
■S’S c
CL to iVJ
CO CL"E c‘l_u
ro toNltoszajEtoto
E u£ajtotoCO to to
‘cu ■<UtoCO
<U1- to13 10 10 <U to _±= CD l l ) P T 3
03 XCO CO
fu to
10 O)
CD cuto u j
CD ra oc-n S in
CD ac
S2 To
Si tooi ty
*a <y ro Is =£ to £- _ i— to qj u u gj -aj_» C ro c~ u £CD o Q.U to v
to co—
to u
2 W Ol wi t a; r -
C 3 53 oo i J W >2 x mm flt ^ro a3
*i 0)Sa
T)CDcoOa,oiiO h
<D43h-jt*-co?t3
CD43
tMO
cdoT3
5
ocdI hcd
43OcdCDucdCDu,Ooco'W
*3cdCD
43
CXC>13>(DTD
T3<Dco3CDtn3
T3<DOOtHO h
CD43fa
V)<uS-s
.2 ffa
156

The initial result o f development o f ‘the first draft o f the proposed framework’ via Figure 5.1
is then described in Sections 5.3.1, 5.3.2, and 5.3.3 below. The terms F-I, F-II, and F-III
represent the frameworks in Section 5.1.1, 5.1.2, and 5.1.3 respectively. A symbol tick (V ) represents the source o f the relevant statement within F-I, F-II, and/or F-III. The higher
number in relevant references in each statement does not correspond with the higher level o f
importance in the relevant statement. These references are merely to indicate that ‘the first
draft’ heavily relied upon both wider literature and the existing frameworks for clear
justification and sound theory.
5.4.1 Headings Related to Seismic H azard Analysis
Table 5.4 Characteristics to ‘seismic hazard analysis’
Characteristics References related to the characteristics
F-I F-II F-III Literature1. Earthquake occurrence data: their history,
spatial distribution, characteristics, and impacts
V (FEMA, 2001), (Tantala et al., 2001)
2. Earthquake scenario data (Gould, 2003), (FEMA, 2001), (Tantala et al., 2001)
Table 5.5 Indicators to ‘seismic hazard analysis’
Indicators References related to the indicators
F-I F-II F-III Literature1. Data recorded, mapped, and updated regularly V (FEMA, 2001), (Tantala et al.,
2001)2. Existence of earthquake data to conduct
deterministic earthquake scenario(FEMA, 2001), (Tantala et al.,
2001)3. Existence of systematic analysis of return
period of earthquake occurrence to conduct probabilistic earthquake scenario
(FEMA, 2001), (Tantala et al., 2001)
5.4.2 Headings Related to Seismic Risk Assessment
Table 5.6 Characteristics to ‘seismic risk assessment’
Characteristics References related to the characteristics
F-I F-II F-III Literature1. Inventory data: geology/soil profiles and
buildings(FEMA, 2001), (Tantala et al.,
2001)2. Building fragility curves V (Gould, 2003), (FEMA, 2001),
(Tantala et al., 2001)3. Damage assessment V (GREAT, 2001)
157

T able 5.7 Indicators to ‘seism ic risk assessm ent’
Indicators References related to the indicators
F-I F-II F-III Literature1. Geology/soil profiles and buildings inventory
data are recorded, mapped, and updated regularly as necessary, particularly in order to calculate the quantitative number of nonengineered buildings and their spatial distribution
V (FEMA, 2001), (Tantala et al., 2001)
2. Existence of building fragility curves: updated ; regularly and associated with the newest data V V V (Gould, 2003), (FEMA, 2001),
(Tantala etal., 2001)3. Existence of systematic damage assessment of
the possible economic impact to buildings using seismic risk scenario both deterministic and probabilistic approach
V (GREAT, 2001)
5;4.3 Headings Related to Seismic R isk Response
Table 5.8 Characteristics to ‘policy and planning’
Characteristics References related to the characteristics
F-I F-II F-III Literature1. Seismic risk reduction of non-engineered . buildings (SRRNEB) as a policy priority V (Jain, 1998), (Shah, 2002)
2. Integration of SRRNEB in development planning and sectoral policies (including poverty eradication)
V (UNDP, 2004), (UN-ISDR, 2002)
3. Responsibilities of SRRNEB V (CEEDEDS, 2004)
Table 5.9 Indicators to ‘policy and planning’
Indicators References related to the indicators
F-I F-II F-III Literature1. Existence of SRRNEB commitment and
strategy in city level (including collaboration with donor agencies) in relation to the context of decentralization)
V (Comartin et al., 2004)
2. Established or revised policies to facilitate action, regulation, enforcement, and/or incentives
V (Hays, 2001), (UNDP, 2004)
3. Map out institutions with responsibilities of SRRNEB V (Hays, 2001)
158

Table 5.10 Characteristics to ‘legal and regulatory framework’
Characteristics References related to the characteristics
F-I F-II F-III Literature1. Seismic codes V (DPU, 2002), (IITK-BMPTC,
2002)2. Laws and regulations V (Petak, 2002)
3. Compliance and enforcement V (Shah, 2002)
4. Certification system for engineers, architects, and foreman V (Sarwidi, 2001), (CEEDEDS,
2004)5. Responsibility and accountability V (UNDP, 2004)
Table 5.11 Indicators to ‘legal and regulatory framework’
Indicators References related to the indicators
F-I F-II F-III Literature1. Seismic codes (socially acceptable, written in
simple language, easy to implement, and economically feasible) are in existence and updated
V (DPU, 2002), (IITK-BMPTPC, 2002)
2. Existence of administrative and institutional mechanism framework for implementation of seismic codes
V (Petak, 2002)
3. Existence of regulation of builders and real • estate developers for creation of seismic
resistant buildings
V (Shah, 2002)
4. Existence of regulation of Financial Institution for ensuring seismic resistant features in new and extension of existing constructions while giving loans and insurance
V (Kunreuther, 2000)
5. Existence of systems to control compliance and enforcement in actual practices V (UNDP, 2004)
6. Existence of compulsory certification system for engineers, architects, and foreman V (IUDMP, 2001), (CEEDEDS,
2004)7. Existence of watchdog groups V
Table 5.12 Characteristics to ‘organizational structures’
Characteristics References related to the characteristics
F-I F-II F-III Literature1. Implementing and co-ordinating bodies V (UNDP, 2004)
2. Intra and inter-ministerial, multidisciplinary & multisectoral mechanisms V (UNDP, 2004), (Petak, 2002)
3. Civil society, NGOs, private sector and community participation V (UNDP, 2004)
159

T able 5.13 Indicators to ‘organizational structures’
Indicators References related to the indicators
F-I F-II F-III Literature1. Existence of an administrative structure
responsible for disaster reduction V V (UNDP, 2004)
2. Existence of sectoral programmes in line ministries V (UNDP, 2004), (Petak, 2002)
3. Existence of consultation, and role for civil society, NGOs, private sector and the communities.
V (UNDP, 2004)
4. Existence of groups or individuals that have incorporated earthquake risk reduction as a permanent or significant part of their operations and commitment
V (IUDMP, 2000)
Table 5.14 Characteristics to ‘resources’
Characteristics References related to the characteristics
F-I F-II F-III Literature1. Resource mobilisation and allocation: financial
(innovative and alternative funding, incentives), human, technical, material
V (Ngoedijo, 2003)
Table 5.15 Indicators to ‘resources’
Indicators References related to the indicators
F-I F-II F-III Literature1. Existence of disaster management office V (Ngoedijo, 2003)
2. Evidence of permanence budgetary allocation V (Ngoedijo, 2003)
3. Expert staffing allocation V (Ngoedijo, 2003)
4. Existence of established link with donor organizations
(UNDP, 2004)
Table 5.16 Characteristics to ‘information management and communication’
Characteristics References related to the characteristics
F-I F-II F-III Literature1. Information and dissemination programmes
and channels V (BSSC, 1995)
2. Networks for seismic risk management(scientific, technical, and applied information, traditional/indigenous knowledge),
(UNDP, 2004)
160

T able 5.17 Indicators to ‘information management and com m unication’
Indicators References related to the indicators
F-I F-II F-III Literature1. Existence of dissemination media through web
site V V V (BSSC, 1995)
2. Existence of documentation and databases on seismic risk V V (SCEC, 2002), (Kunreuther,
2000)3. Continuity of dissemination channels and
participation down through grass-root communities and use of traditional/indigenous knowledge and practice
V (SCEC, 2002), (Kunreuther, 2000), (UNDP, 2004)
4. Existence of multidiscipline stakeholders networks in seismic risk management V a/ (UNDP, 2004)
5. Existence o f information centers and networks in seism ic risk management
a/ (UNDP, 2004)
6. Existence inter-city exposure visits for city managers for mutual learning a/
(EERI, 1999)
7. Existence of pro-active sharing of best • practices for earthquake risk management for
wider circulation
V (EERI, 1999)
Table 5.18 Characteristics to ‘education and training’
Characteristics References related to the characteristics
F-I F-II F-III Literature1. Inclusion of seismic risk reduction at all levels
of education (curricula, educational material) V V (UNDP, 2004)
2. The role of teachers through school activitiesa/ (NDMD, 2004), (UNDP, 2004)
3. Training of trainer (TOT) programmes V (UNDP, 2004)
4. Local, National, and International training program V (UNDP, 2004), (IUDMP, 2001)
Table 5.19 Indicators to ‘education and training’
Indicators References related to the indicators
F-I F-II F-III Literature1. Existence of appropriate curricula in seismic
risk reduction V (UNDP, 2004)
2. Existence of the role of teacher to disseminate and apply seismic codes in the real practice through their student activities (including collaboration with other parties)
a/ (UNDP, 2004)
3. Existence of TOT for community leaders periodically V (UNDP, 2004)
4. Existence of training for developmentauthorities, Community Organization, NGOs, group of foreman, private sectors: real-estate firms, builders, small-medium contractors in safe-building practices and retrofitting techniques
V (UNDP, 2004)
5: Existence of apprentice programmes in seismic risk management for government disaster management staff
a/ a/ (UNDP, 2004)
161

T able 5.20 Characteristics to ‘public awareness’
Characteristics References related to the characteristics
F-I F-II F-III Literature1. Public awareness policy, programmes, and
material V (UNDP, 2004)
2. Dissemination and use oftraditional/indigenous knowledge through media involvement in communicating seismic risk
V V (Vickridge, 1996)
3. Earthquake Safety Day V (ADPC, 2000)
4. Documentation V •(UNDP, 2004)
Table 5.21 Indicators ‘public awareness’
Indicators References related to indicators
F-I F-II F-III Literature1. Existence of city specific awareness campaign
strategies in seismic risk.V V (UNDP, 2004)
2. Availability and accessibility of information (handbook, poster, newspaper, exhibition, talk show, etc) in introducing seismic features of buildings with simple technical approaches understandable to the layperson, including the existence of several model houses with low- cost and simple seismic features in neighbouring areas
V < (EERI, 1999)
3. Tradesman involvement in producing and circulating the seismic features information
(IUDMP, 2000)
4. Existence of a mechanism to monitor the increasing number of aware and informed community members such as students and teachers, key government functionaries, construction actors and engineering institutions, policy makers etc.
V V (UNDP, 2004)
5. Existence of community-based informal meeting discussing good practices in seismic features of buildings
(Comfort, 1999)
6. Visibility of Earthquake Safety Day through: school activities, audio-visual programmes, competitions, mock drills, etc
V (ADPC, 2000)
7. Existence of document of appropriate cost effective retrofitting techniques and sharing of best practices, conference proceedings and articles in popular magazines
V (UNDP, 2004)
162

T able 5.22 Characteristics to ‘research’
Characteristics References related to the characteristics
F-I F-II F-III Literature1. Cost-effectiveness research in application of
seismic features. V (ADPC, 2000)
2. Interdisciplinary research between science and policy
(UNDP, 2004)
3. Evaluation and feedback V (UNDP, 2004)
4. Local, National, and International co-operation in research, science and technology development
V (UNDP, 2004)
Table 5.23 Indicators to ‘research’
Indicators References related to the indicators
F-I F-II F-III Literature1. Existence of cost-effectiveness research in
application of seismic features both for new and existing buildings (retrofitting)
V (UNDP, 2004)
2. Existence of reducing seismic risk through Interdisciplinary research between science and policy (evidence-based policy) comprehensively
V V (UNDP, 2004)
3. Existence of indicators, standards and . methodologies for seismic hazard analysis and
assessment, unique to their local needs
V (UNDP, 2004), (Vickridge, 1996)
4. Providing technical support, training, and periodic assessments on earthquake vulnerability through the research/knowledge at all community levels.
V (UNDP, 2004)
5. Existence of local academic institutions as Key Resource Institutions for earthquake risk management
V (GREAT, 2001)
6. Existence of Local, National, and International exchange
(UNDP, 2004)
Table 5.24 Characteristics to ‘social and economic development practices’
Characteristics References related to the characteristics
F-I F-II F-III Literature1. Pro-poor strategy and sustainable livelihood
strategies V (UNDP, 2004), (Timmer, 2004)
2. Financial instruments — (Kunreuther, 2000)
Table 5.25 Indicators to ‘social and economic development practices’
Indicators References related to the indicators
F-I F-II F-III Literature1. Existence of information that introducing
seismic features in buildings is low-cost and simple (not burdensome) down through to the
. grass root communities
(Arya, 2004), (BSSC, 1995)
2. Existence of incentive strategy for new buildings with seismic features
(Kunreuther, 2000)
3. Existence of earthquake insurance initiatives V V (Morrow, 1999)
163

T ab le 5.26 Characteristics to ‘physical measures’
Characteristics References related to the characteristics
F-I F-II F-III Literature1. Land use applications V (Tantala et al., 2001)
2. Introducing seismic codes in new and existing buildings V (Tantala et al., 2001)
3. Good examples o f real constructions (EERI, 1999)
Table 5.27 Indicators to ‘physical measures’
Indicators References related to the indicators
F-I F-II F-III Literature1. Existence o f seismic risk map using
Geographic Information System (GIS) V (Tantala et al. 2001)
2. Compliance o f public and private buildings with seismic codes and standards V (BSSC, 1995)
3. Existence o f retrofitting program for public buildings (health facilities, schools, lifelines, etc) at high seismic risk
V (BSSC, 1995)
4. Existence o f regular maintenance o f seismic features in structures V (GREAT, 2001)
5. Existence o f a number o f model houses with seismic features, low-cost, and simple as well as ready to be replicated in other areas
(EERI, 1999)
All Tables, 5.4 to 5.27, are then combined into Table 5.28 as follows, representing ‘the first
draft o f the proposed framework’, consisting o f 57 pairs o f characteristic-indicators.
Moreover, each pair related to technical intervention is coded with ‘*/star’.
Table 5.28 ‘The first draft o f the proposed framework’,consisting o f fifty-seven pairs o f characteristic-indicators
Seismic Hazard Analysis
Characteristics Indicators
Core area: Seismic Hazard Analysis1. Earthquake occurrence data: their
history, spatial distribution, characteristics, and impacts *
Data is recorded, mapped, and up-dated regularly
2. Earthquake scenario data * Existence of earthquake data to conduct deterministic earthquake scenario
3. Earthquake scenario data * Existence of systematic analysis of return period of earthquake occurrence to conduct probabilistic earthquake scenario
164

T able 5.28 continued
Seismic Risk Assessment
Core area: Seismic Risk Assessment4. Inventory data: geology/soil profiles
and buildings *Geology/soil profiles and buildings inventory data are recorded, mapped, and up-dated regularly as necessary, particularly in order to calculate the quantitative number o f non-engineered buildings and their spatial distribution
5. Building fragility curves * Existence o f building fragility curves: up-dated regularly and associated with the newest data
6. Damage assessment * Existence o f systematic damage assessment o f the possible economic impact to buildings using a seismic risk scenario both the deterministic and probabilistic approaches
Seismic Risk Response
Core area: Policy and Planning7. Seismic risk reduction of non-engineered
buildings (SRRNEB) as a policy priority
Existence o f SRRNEB commitment and strategy on a city level (including collaboration with donor agencies, in relation to the context o f decentralization)
8. Integration o f SRRNEB indevelopment planning and sectoral policies (including poverty eradication)
Established or revised policies to facilitate action, regulation, enforcement, and/or incentives
9. Responsibilities o f SRRNEB Map out institutions with responsibilities o f SRRNEB
Core area: Legal and Regulatory Framework10. Seismic codes * Seismic codes (socially acceptable, written in
simple language, easy to implement, and economically feasible) are in existence and updated
11. Laws and regulations Existence o f an administrative and institutional mechanism framework for the implementation o f seismic codes
12. Compliance and enforcement Existence o f regulation o f builders and real estate developers for the creation o f seism ic resistant buildings
13. Compliance and enforcement Existence o f regulation o f Financial Institutions for ensuring seism ic resistant features in new buildings and extension o f existing constructions while giving loans and insurance
14. Compliance and enforcement Existence o f systems to control compliance and enforcement in actual practice
15. Certification system for engineers, architects, and foreman
Existence o f compulsory certification system for engineers, architects, and foremen
16. Responsibility and accountability Existence o f watchdog groups
165

Table 5.28 continued
Core area: Organizational Structure17. Implementing and co-coordinating
bodiesExistence of an administrative structure responsible for disaster reduction
18. Intra and inter-ministerial,multidisciplinary & multisectoral mechanisms
Existence of sectoral programmes in line ministries
19. Civil society, NGOs, private sector and community participation
Existence of consultation, and role for civil society, NGOs, private sector and the communities to reduce seismic risk
20. Civil society, NGOs, private sector and community participation
Existence of groups or individuals that have incorporated earthquake risk reduction as a permanent or significant part of their operations and commitment
Core area: Resources21. Resource mobilization and
allocation: financial (innovative and alternative funding), incentives, human, technical, material
Existence of disaster management office
22. Resource mobilization andallocation: financial (innovative and alternative funding, incentives), human, technical, material
Evidence of permanent budgetary allocation
23. Resource mobilization andallocation: financial (innovative and alternative funding, incentives), human, technical, material
Expert staffing allocation
24. Resource mobilization andallocation: financial (innovative and alternative funding, incentives), human, technical, material
Existence of established link with donor organizations
Core area: Information Management and Communication25. Information and dissemination
programmes and channelsExistence of dissemination media through websites
26. Information and dissemination programmes and channels
Existence of documentation and databases on seismic risk
27. Information and dissemination programmes and channels
Continuity of dissemination channels and participation down through grass-root communities and use of traditional/indigenous knowledge and practice
28. Networks for seismic riskmanagement (scientific, technical, and applied information, traditional/indigenous knowledge),
Existence of multidisciplinary stakeholder networks in seismic risk management
29. Networks for seismic riskmanagement (scientific, technical, and applied information, traditional/indigenous knowledge),
Existence of information centers and networks in seismic risk management
30. Networks for seismic riskmanagement (scientific, technical, and applied information, traditional/indigenous knowledge),
Existence of inter-city exposure visits for city managers for mutual learning
31. Networks for seismic riskmanagement (scientific, technical, and applied information, traditional/indigenous knowledge),
Existence of pro-active sharing of best practices for earthquake risk management for wider circulation
166

Table 5.28 continued
Core area: Education and Training32. Inclusion of seismic risk reduction at
all levels of education (curricula, educational material)
Existence of appropriate curricula in seismic risk reduction at all levels of education
33. The role of teachers through school activities
Existence of the role of teacher to disseminate and apply seismic codes in real practice through their student activities (including collaboration with other parties)
34. Training of trainer (TOT) programmes
Existence of TOT for community leaders periodically
35. Local, National, and International training programmes
Existence of training for development authorities, Community Organizations, NGOs, groups of foremen, private sector: real-estate firms, builders, small-medium contractors in safe- building practices and retrofitting techniques
36. Local, National, and International training programmes
Existence of apprentice programmes in seismic risk management for government disaster management staff
Core area: Public Awareness37. Public awareness policy,
programmes, and materialExistence of city specific awareness campaign strategies in seismic risk.
38. Dissemination and use oftraditional/indigenous knowledge through media involvement in communicating seismic risk
Availability and accessibility of information (handbook, poster, newspaper, exhibition, talk show, etc) in introducing seismic features of buildings with simple technical approaches, understandable to the layperson, including the existence of several model houses with low-cost, and simple seismic features in neighbouring areas
39. Dissemination and use oftraditional/indigenous knowledge through media involvement in communicating seismic risk
Existence of tradesman involvement in producing and circulating the seismic features information
40. Dissemination and use oftraditional/indigenous knowledge through media involvement in communicating seismic risk
Existence of a mechanism to monitor the increasing number of aware and informed community members such as students and teachers, key government functionaries, construction actors and engineering institutions, policy makers etc.
41. Dissemination and use oftraditional/indigenous knowledge through media involvement in communicating seismic risk
Existence of community-based informal meetings discussing good practices in seismic features of buildings
42. Earthquake Safety Day Visibility of Earthquake Safety Day through: school activities, audio-visual programmes, competitions, mock drills, etc
43. Documentation Existence of documents of the appropriate cost of effective retrofitting techniques and sharing of best practices, conference proceedings and articles in popular magazines
Core area: Research44. Cost-effectiveness research on the
application of seismic features *Existence of cost-effectiveness research in the application of seismic features both for new and existing buildings (retrofitting)
167

Table 5.28 continued
45. Interdisciplinary research between science and policy *
Existence of reducing seismic risk through interdisciplinary research between science and policy (evidence-based policy) comprehensively
46. Evaluation and feedback * Existence of indicators, standards and methodologies for seismic hazard analysis and assessment, unique to their local needs
47. Local, National, and International cooperation in research: science and technology development
Providing technical support, training, and periodic assessments on earthquake vulnerability through research/knowledge at all community levels.
48. Local, National, and International co Existence of local academic institutions as Keyoperation in research: science and technology development
Resource Institutions for earthquake risk management
49. Local, National, and International co Existence of Local, National, and Internationaloperation in research: science and technology development
exchange
Core area: Social and Economic Development Practices50. Pro-poor and sustainable livelihood
strategiesExistence of information that introducing seismic features in buildings is low-cost and simple (not burdensome) down trough to the grass root communities
51. Financial instruments Existence of an incentive strategy for new buildings with seismic features
52. Financial instruments Existence of earthquake insurance initiative
Core area: Physical Measures53. Land use applications * Existence of seismic risk map using Geographic
Information System (GIS)54. Introducing seismic codes in new and
existing buildings *Compliance of public and private buildings with seismic codes and standards
55. Good examples of real constructions* Existence of a retrofitting program for public buildings (health facilities, schools, lifelines, etc) at high seismic risk
56. Good examples of real constructions* Existence of regular maintenance of seismic features in structures
57. Good examples of real constructions* Existence of the number of model houses with seismic features, low-cost, and simple as well as ready to replicate in other areas
*) The pairs are close to the technical intervention
Table 5.28 gives clear evidence that the above 57 pairs o f characteristic-indicators are
divided into 15 technical intervention and 42 non-technical intervention. Although the
framework is designed to guide and monitor SRRNEB, in fact, non-technical aspects serve
as the bulk o f the 57 pairs of characteristic-indicators. Thus, it can be summarised that, while
technical interventions within non-engineered buildings are important, non-technical
measures are an essential element in guiding and monitoring SRRNEB. This evidence is in
line with UNDP findings (2004) that human aspects tend to dominate the barriers in reducing
disaster. In a broader context, this translates into the need for much greater attention to non
168

technical measures in order to reduce disaster. In addition, the contents o f what are in ‘the
first draft o f the proposed framework’ show that, although the proposed framework is
designed for non-engineered buildings, most o f the principles stated herein will apply to
engineered buildings as well with equal force.
It is widely believed that the earthquake event itself is uncontrollable, thus the overall
elements in seismic risk management in Table 5.28 are designed in such a way that people
can control them to reduce seismic risk. For example, implementation o f seismic codes and
public education to seismic risk are controllable. Generally, some elements in Table 5.28
reveal a wide and interrelated set o f issues that interweave seismic risk management with
issues o f seismic risk responses, such as risk absorption, risk mitigation, and risk transfer.
Some pairs o f characteristic-indicators are related to the government functions that need to
be reformed toward effective seismic risk management. This includes three levels: individual
level, organisational level, and system level. The needs to be reformed in government on an
individual level are, for example, in pairs 23, 28, 30, and 36. Whereas, the urgent reform on
an organisational level are, for example, in pairs 17, 18, and 21. The bulk o f the capacity
reforms on a system or policy level are, for example, in pairs 7, 8, 9, 11, 12, 13, 14, and 37.
The above three levels are closely related to the building capacity in the government
decentralisation process. Turner, et.al. (2003) mentions that capacity building in the
government decentralisation process has to include three levels o f intervention in order to be
effective and sustainable, as follows.
a. The systems level, i.e. the regulatory framework and policies that support or hamper
the achievement o f certain policy objectives
b. The institutional or entity level, i.e. the structure o f organizations, the decision-making
processes within organizations, procedures and working mechanisms, management
instruments, the relationships and networks between organizations.
c. The individual level, i.e. individual skills and qualifications, knowledge, attitudes, work
ethics and motivations o f the people working in organizations.
Figure 5.2 presents the ‘the first draft o f the proposed framework’, complemented by three
important factors of effective seismic risk management o f non-engineered buildings:
169

First draft of the framework
A. Seismic hazard analysis
B. Seismic risk assessment.
c o n e AREA OF SEISMIC HAZARD ANALYSIS1. Earthquake occurrence data .
, 2. Earthquake scenario data.... ....:3. ........... .
CORE AREA OF SEISMIC RISK ASSESSMENT'4. Inventory d a ta ................................5. Building fragility curves ......
CORE AREA OF POLICY AND PLANNING7 . Reducing seismic risk...................8. Integration of reducing SRNEB......9.C. Seismic risk response
CORE AREA OF57. Good examples in real
Complement Ai Three important factors of effective seismic risk ’ management of non-engineered buildings:1. . Direct Involvement of Multidisciplinary Stakeholders2. Strengthening of Local Capacities
• • • developing local leadership• . * * conducting participatory approaches tv . . • : increasing public seismic awareness ; 3. Poverty Consideration:
The first draft was developed through critical review of literature and existing frameworks
Figure 5.2 ‘The first draft o f the proposed framework’ complemented by three important factors o f effective seismic risk management o f non-engineered buildings.
5.5 Sum m ary
The, beginning o f this chapter presented an overview o f the origin and content o f three
existing frameworks and their surrounding commentary. All had a primary concern with
reducing disaster risk; however, they demonstrated their specific area o f interest. There was
still considerable variation in the density o f the frameworks in terms o f the number o f
specific features of indicators that were included for appraisal. Most o f their principles
comprised many aspects o f structural measures (for example: damage assessment, structural
intervention, implementing and retrofitting o f important buildings) and non-structural
measures (for example: public awareness, institution building, organizational structure).
Preliminary analysis from the literature review discovered the following facts: (a) most
Indonesian regions are located in high seismic areas, (b) the collapse o f non-engineered
170

buildings is the biggest cause o f human deaths, (c) there is a wide gap between earthquake
facts and the existence o f seismic codes, (d) the importance o f integrated seismic risk
management o f non-engineered buildings in Indonesia to bridge the gap, (e) a novel
framework for guiding and monitoring seismic risk reduction of non-engineered buildings as
a starting point to reduce seismic risk.
Finally, the end o f this chapter elaborated emerging issues arising from the literature review
for primary data investigation, which encompass: (a) headings related to seismic hazard
analysis (b) headings related to seismic risk assessment (c) headings related to seismic risk
response. This is ‘the draft o f the proposed framework’ which is complemented by three
important factors o f effective seismic risk management o f non-engineered buildings and is
intended to be the cornerstone for the next stage of this study. Consisting o f 57 pairs of
characteristic-indicators, dominated mainly by non-technical measures, the proposed
framework gives strong evidence that whenever technical interventions are important, non
technical measures are the substantial element in SRRNEB. Three levels o f government
function that needed to be reformed, i.e. individual level, organisational level, and system
level, also emerged. This is very similar to the capacity building in government
decentralisation, as mentioned by Turner et al (2003). The next chapter will present research
methodology for the research work.
171

Chapter VI R e s e a r c h M e t h o d o l o g y
This chapter constitutes the pivotal part o f the study, which explains how the research
problem is being investigated, and describes the tool being used to make the investigation. In
general, the chapter aims to describe, explain, and justify the methodological process
adopted for this research. The chapter begins with a description o f the methodological
framework o f the research. It then provides the logic and rationale for the selected approach.
Next, the discussion moves to explore the research techniques used; a critical analysis o f the
research design adopted is also included. The following explanation covers data
measurement and its analysis. Finally, this chapter mentions anticipated findings and key
quality issues, as well as ethical concerns adopted in this study.
6*1 Definition of Research
Bums (2000) describes research as a systematic investigation to find answers to a problem.
More elaborately, as suggested by Blaxter et al. (1996), research is a planned, cautious,
systematic, and reliable way of finding out or deepening understanding. For the social
scientists or researcher in applied fields, research is a process of trying to gain a better
understanding o f the complexities o f human experience and, in some genres o f research, to
take action based on that understanding. Through systematic and sometimes collaborative
strategies, the researcher gathers information about actions and interactions, reflects on their
meaning, evaluates, arrives at conclusions and eventually puts forward an interpretation,
most frequently in written form (Marshall & Rossman, 1999).
Research can be conducted in many ways. Blaxter et al. (1996) maintains that even a brief
review of literature on research will uncover a lengthy and potentially baffling list o f types o f
research. Some examples o f methods o f research are as follows:
a. Pure, applied, and strategic research
b. Descriptive, explanatory, and evaluation research
c. Market and academic research
172

d. Exploratory, testing-out, and problem solving research
e. Covert, adversarial, and collaborative research
f. Basic, applied, instrumental, and action research
Basically, all the different kinds and views o f research share the same characteristics given in
the definitions earlier (Blaxter et al., 1996). Moreover, there is no hard and fast process
model available for every research project to follow. A research process should be reflexive,
operating through every stage. In its most simplistic term, Naoum (1998) describes the
research process in Figure 6.1:
Researchdesign
Selecting a topic
Dataanalysis
Literaturereview
Datacollection
Conclusion
Figure 6.1 Simplistic term o f research process (Naoum, 1998)
6.2 M ethodological Fram ew ork Adopted for the Research
Nachmias and Nachmias (1996) mention that the use o f a methodological framework in
research provides rules for communication, reasoning, and inter-subjectivity. In general,
Blaxter et al., (1996) distinguish two divergent paths o f basic research concept, i.e.
positivism or a scientific approach, leading to deductive research, and naturalism or a
phenomenological approach, leading to inductive research. A deductive approach involves
the testing o f already established ideas, theories, and hypotheses using data collected
specifically for this purpose. In contrast, an inductive approach involves deriving ideas and
opinions directly from research data to enhance understanding o f an issue or situation.
Typically, the inductive approach involves a qualitative methodology and the deductive
approach utilises a quantitative methodology. Here, both approaches are briefly compared.
To determine the methodological framework, it is useful to describe the preliminary study
from the in-depth literature review in Chapters II, III, and IV. This started with the assertion
that most Indonesian regions are located in high seismic areas. Lessons learned from past
earthquakes indicated that the collapse o f non-engineered buildings has been the biggest
cause of human deaths. On the other hand, it is evident from many examples that progress
has been made in the knowledge o f how to reduce these risks using the implementation o f
seismic codes. An unacceptable number o f human deaths could have been reduced if seismic
codes had been implemented rigorously in actual non-engineered construction.
173

At present, there is a widespread recognition that the implementation o f seismic codes in
actual construction in developing countries, for example, in Indonesia, encounters
complicated barriers. This is not a simple matter, because it comprises all kinds o f issues, i.e.
physical, financial, educational, and administrative problems. Subsequent to the extensive
use o f risk management practices in many countries with successful results, it is important to
carry out integrated seismic risk management o f non-engineered buildings in Indonesia to
solve these issues by the involvement o f multidisciplinary stakeholders in the decision
process. Finally, the evidence elaborated from the literature review (Chapters II, III, and IV)
pointed to research to focus on the development o f an integrated framework among
multidisciplinary stakeholders for seismic risk reduction o f non-engineered buildings
(SRRNEB) as a starting point to reduce seismic risk in Indonesia.
Next, the research stage moved onto studying and evaluating some existing frameworks in
disaster reduction from around the globe, as outlined in Chapter V. This activity gave a
general picture o f frameworks generated by other institutions to reduce the disaster. A
combination o f the literature review and analysis o f the existing frameworks has formed ‘the
first draft o f the proposed framework’ for guiding and monitoring SRRNEB as a robust
foundation for the next research stage.
It is clear that the research seems to explore and understand seismic risk management
practices for non-engineered buildings, working towards a reduction in seismic risk. It is,
therefore, an exploratory research study, with a principal aim o f developing an integrated
framework for guiding and monitoring SRRNEB. The research intends to provide a
foundation to expand knowledge in seismic risk management practice, for future quantitative
and qualitative research. The methodology adopted satisfies the need for exploration, insight,
depth, and knowledge. Given the nature o f the research project, an inductive approach has
been identified as appropriate for the research.
6.3 Research Strategy Adopted for the Research
In general, research strategy can be divided between two categories, i.e. quantitative and
qualitative. Historically, there has been a heavy emphasis on quantification in science.; the
quantitative approach sometimes gamers more respect, reflecting the tendency to regard
science as related to numbers and implying precision (Berg, 1998). Quantitative research is
regarded as “ objective” in nature. This is based on testing a hypothesis or a theory
composed o f variables, measured with numbers, and analysed with statistical procedures, in
order to determine whether the hypothesis or theory hold true (Naoum, 1998).
174

Conversely, qualitative research is considered “ subjective” in its origin. Nachmias and
Nachmias (1996) hold that qualitative research attempts to understand behaviour and
institutions by analysing values, rituals, symbols, beliefs, and emotions. The approach
emphasises meanings, experiences (often verbally described), description and so on (Naoum,
1998). Qualitative methods are stereotyped with a narrative response from the respondent
and, in addition, allow flexibility. Thus, the responsiveness o f the individuals’ and
organisations’ conceptualisation o f themselves is also related to a willingness to formulate a
new hypothesis and alter existing ones as the research progresses, in the light o f emerging
insights (Cassell and Symon, 1994). However, the popularity, status and use o f qualitative
methods still vary among different social and behavioural sciences. In addition, Marshall and
Rossman (1999) and Gummesson (2000) agree that the qualitative methodology provides
powerful tools for research in management subjects, including general management,
organisation, corporate strategy, and more.
The quantitative and qualitative approaches differ fundamentally in their philosophies, aims,
and abilities. Qualitative research is not about providing statistical evidence for its findings,
it is about providing insight and depth; it is typically an iterative rather than a linear process
and often involves a researcher moving back and forth between sources o f data and ongoing
data analysis. Although there are considerable distinctive features between the two strategies,
the relationship between the theory/concepts and research strategy in terms o f verifying the
theory/concept against proffering theory to emerge from the data is not as clear-cut as is
sometimes implied (Naoum, 1998). Table 6.1 compares the differences between two
research strategies from different perspectives:
Table 6.1 Some differences between quantitative and qualitative research (Naoum, 1998)
Quantitative Qualitative
1. Role Fact-finding based on evidence or records
Attitude measurement based on opinions, views and
perceptions measurement2. Relationship between
researcher and subjectDistant Close
3. Relationship between theory/concepts and research
Testing/confirmation Emergent / development
4. Nature o f data Hard and reliable Rich and deep
175

The research work for this project is focused on multidisciplinary stakeholders’ perspectives
and their cultures and strategies. Clearly, it requires a deeper understanding o f the intentions
underlying the action. As explained in the research strategy characteristics mentioned above,
the qualitative approach makes more sense and tends to dominate the research process.
Relying only on a rigorous qualitative approach does not necessarily provide all the data
needed in order to embrace the various backgrounds o f multidiscipline participants.
Consequently, the subject matter in this research did not lend itself easily to the qualitative
approach, so the quantitative method was also employed to pose the statistical analysis, in
order to estimate the distribution o f characteristics in the population obtained from the postal
questionnaire survey. Therefore, this research process used both qualitative and quantitative
approaches, which also proved how these two different research approaches can be
integrated to develop the proposed framework. Combining different positive attributes in the
two methods could result in gaining the best o f both research worlds.
6.4 Research Question Adopted for the Research
Usually, quantitative research is designed to test or validate a hypothesis or a conceptual
theory; hence, a hypothesis o f at least one sentence needs to be established, which should
clearly and specifically state the position for the argument or investigation. On the other
hand, qualitative research is generally designed to develop a theoretical framework, then a
number o f ‘research questions’ need to be formulated, which should determine the direction
for the study (Naoum, 1998).
According to the methodological framework evaluated in Section 6.2, this research has used
an inductive approach, with mainly qualitative methodology, thus it needs to generate a
‘research question’. It is true that the methodological foundation o f any research project
depends largely on research questions; as highlighted by Morse (1994), the wording o f the
research question determines the focus and scope o f the study. Designing a good research
question is considered to be the most difficult task o f a researcher (Stake, 1995).
Furthermore, Blaxter et al. (1996) mention that research questions are more like objectives
than aims: they should contain within themselves the means for assessing their achievement.
Marshall and Rossman (1999) suggest the need for flexibility in the research questions, so
that data gathering can satisfy in the refining o f the research questions, especially in the
qualitative approach, which is uniquely suited to uncovering the unexpected and exploring
new avenues. However, it should be sufficiently clear to be adequately evaluated for
practicality; on the other hand, it should reserve the flexibility that is the hallmark o f
176

qualitative methods. This suggests that the research question should be general enough to
permit exploration, but focus on research objectives.
Here, the main research question for this research project, after carrying out the critical
review of the literature and existing frameworks, has been identified as follows:
“How can multidisciplinary stakeholders in Indonesia set up a seismic risk reduction o f non-
engineered buildings via a seismic risk management approach that works well? ”
Fundamentally, the research is about the understanding and developing o f integration from
the multidisciplinary stakeholders’ perspective within a seismic risk management approach.
Further to this, the research not only describes intentions, but also evaluates in-depth and
analyse the integrated seismic risk management o f non-engineered buildings for the
development o f an implementation framework, as a starting point to reduce seismic risk of
non-engineered buildings in Indonesia.
In order to answer the main research question, the research project had to look at things like
how other countries have done it and what were the surrounding commentaries. The research
also gathered information from a wide range o f respondents around Indonesia, and talked
with some of them to find out the practical solution in order to break the problem. Therefore,
the following research sub-questions were emerged.
a. What kinds o f seismic risk reduction program have other countries set up, and what are
their surrounding commentaries?
b. What kinds o f important activities on SRRNEB based on wider literature and other
countries' program?
c. What do multidisciplinary stakeholders in Indonesia respond and say the important
activities on SRRNEB and what ideas do they have for making it work well?
d. What particular aspects should stakeholders in Indonesia emphasise to make significant
impact in SRRNEB?
The above first two sub-questions have been critically accomplished in Chapter V, whereas
the next sub-questions are further examined in Chapters VIII and IX through primary data
collection.
177

6.5 Research Design of the Project
The research design is the guide that enables the researcher to come up with solutions to the
research problems (Nachmias and Nachmias, 1996). It is a pathfinder to the process of
collecting, analysing, and interpreting observations. Moreover, it details the procedures
necessary for obtaining the information and data needed to achieve the research aim.
Research design also elaborates the details o f implementing the research process.
The number o f methods o f research design is countless in variation. Research design
involves the concrete steps that the researcher needs to take in order to do the research.
Research design covers the various issues which should be borne in mind when carrying out
a research project. Thinking through and writing up a research design perspective helps a
researcher to decide which type o f research he/she wants to do, helps to choose an approach
to data collection and analysis and how to write up findings (Gilgun, 2004), thus arriving at
an appropriate and sound research methodology.
Research design adopted for this research project is elaborated in Figure 6.2. The design
consists o f the following four main steps: (1) developing ‘the first draft o f proposed
framework’ through critically reviewing the literature and existing frameworks, (2) refining
‘the first draft’ to be ‘the second draft’ via a pilot study, postal questionnaire survey, and
interview method, (3) refining ‘the second draft’ into ‘the final proposed framework’ by
conducting a workshop event and (4) validating the final framework through two workshop
events and drawing the conclusion. It may be helpful to define the above steps as discussed
below, together with the accompanying further explanation:
178

Firs
t ste
p (to
de
velo
p the
fir
st dr
aft
of the
pr
opos
ed
fram
ewor
k)
a .
T3a.
a .
Q.
(X
ex
179
Figu
re
6.2
Desig
n fo
r the
re
sear
ch

a. Developing ‘the first draft of the proposed framework’
Keeping in mind the aim and objectives o f this research project, a thorough desk-based
review o f literature and existing frameworks was conducted as the first step o f the research
design. It is one o f the earliest stages in the research process and it amounts to a significant
proportion of research content as a strong foundation for the next stage o f the study. The
literature and existing framework review as secondary data involved reading, mapping, and
criticising what other people have written about the research subject area. This was not only
descriptive, in that it described the work o f previous authors, but also analytical, in that it
critically scrutinised the contribution o f others, with the view of identifying similarities and
contradictions made by previous writers. This shows the quality o f references that indicate
familiarity with key literature.
This critical literature review generated comprehensive information on (1) the high seismic
areas in Indonesia, (2) the human deaths caused by the collapse o f non-engineered buildings,
(3) the wide gap between massive death tolls caused by the collapse o f non-engineered
buildings and the existence o f seismic codes, (3) the widespread use o f seismic risk
management practices, and finally, (4) the focus on developing an integrated framework for
guiding and monitoring SRRNEB as a starting point to reduce seismic risk in Indonesia. The
critical literature review was given in Chapters II, III, and IV. In the beginning o f Chapter V,
there was a review of three existing frameworks in disaster reduction.
Relying heavily upon the wider literature and the existing frameworks as secondary data, this
first research design was able to explain and list some emerging issues for primary data
investigation; this was then called ‘the first draft o f the proposed framework’. This first draft
provides a launching pad for the next stage o f the research process.
b. Refining ‘the first draft’ to be ‘the second draft’
This was the second step o f the research design, which aimed to refine ‘the first draft o f the
proposed framework’. This consisted of a pilot study and primary data collection through a
postal questionnaire survey and interview. The pilot study was conducted by interviewing 16
important people from various background to help refine the data collection plans and to
recognise any potential flaws and inadequacies with regard to both the contents o f the data
and the procedures. It could also be used for adding or subtracting some elements in the
initial research design. This also allowed the researcher to develop an understanding with
participants. Chapter VII covers further details o f the pilot study and its findings.
180

Given the nature o f the research aim and objectives, ‘the first draft’, drawn merely from
secondary data, was not enough to embrace the common cultural diversity and its origin in
Indonesia, which should be factored into the proposed framework. It should be highlighted
here that the proposed framework should embrace as many common issues and
characteristics related to the daily activities o f Indonesian people as possible. Thus, the next
step after the pilot study was primary data collection via a postal questionnaire survey and
interview method. The use o f a postal questionnaire and interview were employed in the
process of collecting primary data from a sample o f people who were selected to represent a
larger population.
As stated in previous chapters, a number o f multidisciplinary stakeholders were identified for
this research topic as the main actors in a seismic risk management programme of non
engineered building. These were: researchers/scientists, small-medium contractors, foremen,
government officials, businessmen, educators, NGO and community leaders. It was
important to invite their contribution to refine ‘the first draft’ based on their level of
knowledge and expertise as primary data. The final number o f multidisciplinary stakeholders
involved in this research was justified through a pilot study detailed in Chapter VII. In
general, the stakeholder criteria used for primary data collection were as follows:
i. The important person in each stakeholder organisation was identified to be the main
contact person for the primary data collection
ii. He/she was actively involved in and formed policy issues
Data collection phase was conducted in Indonesia. During the data collection phase, the
author organized a research committee consisting o f two senior Civil Engineering university
lecturers, one construction professional and four Civil Engineering students. Duties and
responsibilities o f the research committee are as follows:
i. to help the researcher in organising the data collection phase
ii. to advise the researcher on the research strategy in order to stimulate creative activity
and liaise with many agencies
iii. to review the proposed research findings with an independent review o f the facts and
free o f vested personal or professional interest in the general and specific objectives to
obtain adequate and appropriate group decision.
The first and foremost data collection method was a postal questionnaire survey in order to
gather primary data from a potentially large number of stakeholders as respondents in
Indonesia within a limited timeframe, to achieve a generalised result, which was extracted
181

from respondents’ opinions. Because the principal issues and characteristics for primary data
collection (‘the first draft o f the proposed framework’) were already stated in Section 5.3, the
aims o f the postal questionnaire were (1) to describe the distribution o f characteristics in the
population, (2) to capture some additional characteristics, comments, or feedback not stated
in the questionnaire to refine ‘the first draft’ through leaving adequate space for respondents
to write in and (3) to estimate the correlation in ranking opinion.
875 questionnaires were circulated to a wide variety o f respondents, representing
multidisciplinary stakeholders in Indonesia, and 305 were returned. The list o f name and
address o f the respondents was collected from government agency and private organisation
base data. In this research, a stratified random sampling method was adopted.
The second primary data collection method was by interview. In this sense, an interview was
conducted with those involved in the previous postal questionnaire survey, and there were 9
interviewees. The aim o f conducting an interview at this stage was particularly to explain
'why* the questionnaire findings took place and to find some answer for certain questions
emerging from the questionnaire survey. Through this method, a narrative response was
achieved because the respondents had greater freedom of expression. Furthermore, the
respondents were able to qualify their answers. Furthermore, the interview was important to
validate the postal questionnaire findings.
The rationale o f why these types of data collection were used, the numbers o f questionnaires,
and the sampling method mentioned above were chosen is further explained in the
subsequent section. Chapter IX elaborates further on the postal questionnaire and interview
data collection and their findings.
c. Refining ‘the second draft’ into ‘the final framework’
The aim o f this step was to develop ‘the final framework’ based on ‘the second draft o f the
proposed framework’. The workshop event, attended by 18 multidisciplinary stakeholder
representatives, was conducted to serve this stage, the core o f the research aim. This method
was selected, based on the assumption that each workshop participant wished to share and
exchange common experience and knowledge about existing barriers and possible solutions
directly and openly (Andrew, 2004). The workshop participants were the people who had
particularly taken part in the questionnaire survey and who held an important position within
each stakeholder organisation, regardless o f their regency, city, provincial, or national work
scope level.
182

Through the formal workshop, stakeholder representatives were invited to present their
experiences, their needs, and their aspirations to refine ‘the second draft’ and to identify
many aspects that were needed for further work. Because stakeholders would definitely
implement the framework, they were expected to be full participants in its development; this
needed to be flexible and simple using clear language to ensure open channels o f
communication. The detail rationale for conducting the workshop is explained in the
subsequent section.
Two people from each stakeholder representative were invited and participated in the
workshop. The research committee carried out the workshop activities, and the researcher
acted as a workshop facilitator. At the beginning o f the workshop, the workshop facilitator
presented the findings o f the postal questionnaire and interview (or ‘the second draft o f the
proposed framework’) first as it then stood, and next, participants discussed the structure and
content o f the framework and issues in a small group and plenary session, which they felt
required further development. With this interactive effort, the workshop was able to provide
a sound proposed framework for guiding and monitoring SRRNEB. Chapter X presents the
details o f the development o f the final framework through the workshop event.
d. Validating ‘the final framework’ and drawing the conclusion
Having achieved the final framework, based on the outcome o f the workshop, the research
committee then implemented the developed framework in two Indonesian cities located in
high seismic areas as a validation media, through another workshop. The workshop
participants were different and independent people from the previous workshop participants
in order to achieve a robust framework validation. They were actively involved in policy
issues in certain levels of city work scope located in high seismic areas in Indonesia. In
addition, it was particularly that they had already taken part in the questionnaire survey and
were important within their own stakeholder organisation. The pilot study in Chapter VII
determined the two cities (Yogyakarta City and Bengkulu City) where the framework
validation workshop should be carried out. The method of conducting this second workshop
was analogous to the first workshop. With this synergetic effort, the workshop served a
feasible empirical testing o f the proposed framework successfully.
The final stage o f this research was to draw firm conclusions ranging from the literature
review to the framework validation. The framework validation is presented in Chapter XI,
183

and Chapter XII gives the research conclusion and limitations as well as recommendation for
further research.
6.6 Approaches to and Techniques for Data Collection Adopted for the Research
6.6.1 Approaches to Data Collection
The data collection approach adopted for research depends on the nature o f the research
question, and the type of data and information that is required and available. Most literature
suggests that the data collection approach in general inductive research can be conducted in
two ways, namely fieldwork for primary data collection and desk study for secondary data
collection (Naoum, 1998). Primary data (first hand data) collected from fieldwork can be
associated with three practical approaches, as follows:
a. Survey approach. Surveys are used to gather data from a relatively large number o f
respondents within a limited time frame. They are thus concerned with a generalised
result, when data is abstracted from a particular sample or population.
b. Case study approach. Case studies are utilised when the researcher intends to support
his/her argument by in-depth analysis o f a person, a group o f persons, an organisation or
a particular project. As the nature o f the case study focuses on one aspect o f a problem,
the conclusion drawn will not be generalised but rather related to one particular event.
c. Problem solving approach (action research). With the survey and the case study
approach, the researcher tends not to affect or interfere with that which is being studied.
In the problem-solving approach (also named action research), the researcher reviews the
current situation, identifies the problem, gets involved in introducing some changes to
improve the situation and possibly, evaluates the effect o f his/her changes. This type o f
research is more attractive to practitioners, industrialists and students from a professional
background who have identified a problem during the course o f their work and wish to
investigate and propose a change to improve the situation.
On the other hand, the desk study approach uses secondary data obtained from other sources,
which can be stored either in a statistical or descriptive format. Secondary data has some
distinctive advantages over the efforts needed for primary data collection related to time and
cost. In general, it is much less expensive and takes less time to use secondary data, than to
conduct a primary research investigation. If stringent budget and time constraints are
imposed on primary research, secondary data may provide a useful comparative tool.
184

Having explained the approach to data collection and research design described above, the
fieldwork approach was judged best to be able to obtain the information needed in the
research. Fieldwork with a survey approach gave sound rationale to a primary data approach,
in order to gather data from a large number o f multidisciplinary stakeholders within the
broader culture o f Indonesian people. Using this survey enabled the researcher to reach an
objective conclusion by sampling a broad spread of participants.
6.6.2 Techniques for Data Collection
According to the fieldwork adopted in this research, this section presents the main features o f
three research data collection techniques available to elicit primary data and information
from respondents, i.e. a postal questionnaire survey, interview method, and workshop event.
The decision to determine data collection technique depended on the judgement as to which
methods or techniques best obtained the information needed in order to achieve the purpose
o f the research. The discussion below gives principal characteristics of the three data
collection techniques in relation to the research design:
a. Postal questionnaire survey
Naoum (1998) highlights that postal questionnaires have been widely used for descriptive
and analytical surveys in order to discover facts, opinions and views on what is happening,
who, where, how many, or how much for data collection. When using the questionnaire
survey method, data is not deliberately controlled,it is described as it naturally exists. The
response rates for postal surveys usually range between 40-60 percent depending on certain
situation. The survey is able to serve qualitative and quantitative research. The two main
advantages o f postal questionnaires are:
i. Economy. Postal questionnaires are perceived as offering relatively high result validity
because o f their wide geographic coverage. As a result, this technique is suited to
assembling a mass o f information at a minimum expense in terms o f finance, human, and
other resources.
ii. Speed. Postal questionnaires are certainly a quick method of conducting a survey. If
administered properly, the bulk o f the returns will probably be received within two
weeks; however, time must be allowed for late returns and responses to follow-up
attempts.
However, there are limitations to postal questionnaires, as follows:
i. Must contain simple questions. The postal questionnaire is only suitable for simple and
straightforward questions, which can be answered with the aid of easy instructions and
185

definitions. The questions should be very carefully worded and free from faults such as
ambiguity, vagueness, technical expression, and difficulty. These faults can affect the
results o f the postal questionnaire even more seriously than when conducting any other
. method.
ii. Inflexible technique. Inflexible in this sense means that postal mail questionnaires do not
allow the opportunity for probing. In other words, the answers have to be accepted as
final and there is no opportunity to clarify ambiguity or to appraise the non-verbal
behaviour o f respondents, though the latter sometimes creates bias.
iii. Accuracy. Respondents may answer generally when the research questions are seeking a
response on a specific level o f analysis. People may also answer according to what they
think the researcher wants to hear. Moreover, they may answer according to their public
profile rather than the underlying corporate reality.
iv. No control over respondents. This means that although there is a clear statement in the
questionnaire that a particular person should complete the questionnaire (such as a policy
maker or community leader), there is no guarantee that this statement will ensure that the
right person completes the questionnaire. However, this is less o f a problem that not
getting a response at all.
v. Industry fatigue. Companies receive a steady stream of questionnaires and the pressures
o f modem business mean that, for many organisations and individuals, students’
questionnaires are o f less priority.
b. Personal interview
The personal interview is another major technique for collecting factual in-depth
information, opinions, or the story behind a participant’s experiences (Naoum, 1998). It is a
face-to-face interpersonal role situation in which the researcher asks an individual a series of
questions designed to elicit answers pertinent to the research topic. The questions, their
wording, and their sequence define the structure o f the interview. The interview technique is
suitable under the following circumstances:
i. When the people being interviewed are homogenous and share the same characteristics.
ii. When the researcher knows enough about the interviewee to concentrate on important
questions and know how to ask them.
iii. When an interpersonal encounter is essential to explain and describe the questions
iv. When a case study needs to investigate a certain detail, asking questions such as how and
why things had happened the way they did.
186

v; When the research requires an explanation as to why the respondents are answering or
feeling the way they do, i.e. requires more than a ‘Yes or N o’ or ‘Agree or Disagree’
answer.
The nature of interview responses allows respondents greater freedom o f expression, and
results in a richer set o f data, in-depth analysis of individual experiences, and a more
enhanced understanding o f the problem. Therefore, this technique is often used in the
qualitative approach. Unlike postal questionnaires, the interviewer has the opportunity to
probe or ask follow up questions. As a result, the interview technique can be useful to
follow-up or further investigate the postal questionnaire responses (Naoum, 1998). However,
this method is time consuming and tends to be resource intensive.
There are three types o f interview method, i.e. unstructured, semi-structured, and structured
interviews (Naoum, 1998). The form o f unstructured interview uses ‘open ended’ or ‘open
questions’ and the questionnaire is often pitched at a very general level, so that the
researcher can see in which direction the interviewee takes their responses. The semi
structured interview is more formal than the unstructured, in that there are a number of
specific topics around which to build the interview. This method uses ‘open’ and ‘closed-
ended’ questioning but the questions are not asked in a specific order and no schedule is
used. Through this approach, the task is to discover as much as possible about specific issues
related to subject area. In the semi-structured interview, the interviewer has a great deal of
freedom to probe various areas and to raise specific queries during the course o f the
interview. Lastly, in the structured interview, the questions are presented in the same order
and with the same wording to all interviewees. The interviewer will have full control o f the
questionnaire throughout the entire process of the interview. In this technique, the
questioning may start with some ‘open’ questions, but will soon move toward a ’closed’
question format (Naoum, 1998).
c. Workshop Event
With the postal questionnaire technique and interview data collection, respondents do not
affect or interfere with each other to argue their opinion, position, and argument. In data
collection via workshops, each participant gets involved directly in introducing his/her
opinion, position, and argument as well as appraising verbal behaviour during the event. The
workshop is highly interactive, combining presentations, exercises and discussions in small
and plenary sessions. Moreover, each participant contributes significantly to the formulation
of the workshop results, which are usually held in plenary session. This type o f data
187

collection is more relevant to formulate and solve multiple dimensions o f the problem from
different perspectives. According to the nature o f workshop events, the qualitative approach
is suitable for its analysis.
Spencer et al. (2003) mention that one research strategy for developing a framework after
conducting the literature review and survey is utilisation o f the workshop method to explore
the participants’ reactions to the initial framework developed by the researcher. In the area of
disaster reduction, Mitchell (2003) highlights the importance o f the workshop method as a
forum for stakeholders to argue their policy positions and consider the arguments o f other
participants. The idea is to explore the ground where a range o f resource people can agree on
a policy direction, but for different reasons. Multidisciplinary stakeholders’ participation can
be effective as a means o f formulating citizen grievances, ideas, interest, opinions, and views
and feeding them into the policy process. In addition, the workshop method can fit various
participants who possess the ability and resources to adopt and implement the results
(Andrews, 2004). It is also important to conduct a workshop on the development o f a seismic
risk management framework, when enhancing seismic risk reduction is inherently a political
process with many players, each with different worldviews, struggling to reach some modest
agreement on what constitutes the problem and what constitutes a workable solution (Petak,
2002).
As discussed earlier, however, the data collection strategy is determined by the nature o f the
research question. As Denzin and Lincoln (1998) affirm, data collection strategies are merely
tools; it is the researcher's responsibility to understand the variety available and the different
purposes of each strategy, to appreciate in advance the ramifications for selecting one
method over the other and to become astute in the selection o f one method over another.
Each qualitative strategy offers a particular and unique perspective that illuminates certain
aspects o f reality more easily than others and produces a type of results more suited for some
applications than others.
The above explanation of data collection techniques highlights a number o f specific features
o f each technique. The postal questionnaire survey, selected interview, and workshop event
mentioned above were identified as the best techniques in order to obtain necessary data and
to achieve the purpose o f the research. The rationales for choosing the three techniques were
as follows:
a. As there were a potentially large number o f multidisciplinary stakeholders as
respondents with an enormous diversity in background from around Indonesia, it was
188

important to collect primary data from a sample o f them, as they were selected to
represent a larger population. Therefore, a generalised result extracted from a larger
number o f respondents was needed. Based on the nature o f fieldwork survey, the postal
questionnaire survey was best judged to be the first and foremost data collection
technique, in order: (1) to describe the distribution o f characteristics in the respondent
opinions, (2) to refine ‘the first draft o f the proposed framework’ by leaving adequate
space for respondents to make a comment or provide feedback not captured by the
questionnaires, and (3) to estimate the correlation in ranking opinion. The benefit o f its
economy and speed constituted the major factors in choosing this technique; however, to
overcome its deficiencies in opportunities for probing, the interview method was
definitely needed in the next technique, as described in point (b) as follow.
b. It was important to follow the questionnaire survey with the interview method, because
this technique gave the opportunity for probing 'why’ the questionnaire findings took
place. Another reason was to validate the postal questionnaire findings. Through this
powerful technique, in-depth investigation o f causality was achieved. Therefore,
misleading conclusions could be avoided because the respondents were able to qualify
their responses e.g. 'Yes, but....' or 'It depends....'. While the interview technique
provides the comprehensive solution to obtain the causality o f the questionnaire findings,
the lack o f interactive response between each respondent still existed, because each
respondent worked individually in the two techniques mentioned above. It would have
been very hard to solve the multiple dimensions o f seismic risk management problems
by only using these methods, when competing multidisciplinary worldviews are
influential. Therefore, the synergetic and interactive effort o f the workshop method was
vital, as discussed in point (c) as follows:
c, The workshop event provided answers to overcome the deficiencies o f the postal
questionnaire and interview techniques. The powerful features o f the workshop provided
closer contact and interactive discussion in small groups and plenary sessions among
participants. This strategy was used in the development o f ‘the final framework’ and the
validation media. The purpose o f the workshop was to formulate and solve multiple
dimensions of the problem from the different perspectives of the multidisciplinary
stakeholders, raised by the postal questionnaire and interview, as suggested by Spencer
et al. (2003), Mitchell (2003), Andrews (2004), and Petak (2002). In this sense, the event
provided a unique platform to discuss and assess achievements, identify challenges and
concrete future action to reduce seismic risk o f non-engineered buildings in Indonesia.
189

Characterised by open and substantive discussions in a cordial and co-operative
atmosphere, the framework was discussed openly and agreed by the stakeholder forum,
and the workshop ended on a positive and successful note.
The types o f data collection techniques were substantiated through pilot study in Chapter
VII.
6.7 Sampling Method Adopted for the Research
Selecting the research sample is very important and great care must be taken when choosing
the type o f sample design. This is to ensure that the characteristics o f the sample are the
same as its population and act as representatives o f the population as a whole. Usually, the
means o f drawing a representative sample is done either randomly or non-randomly. The
term ‘random’ means selecting subjects (respondents) arbitrarily and without purpose
(Naoum, 1998). Designing the research sample can take many forms, each o f which is
suitable to a particular situation. The explanation below describes three types o f sampling:
simple random sampling, stratified random sampling, and selected sampling extracted from
Naoum (1998) and StatPac (2005):
a. Simple random sampling. This method is the basic sampling technique to select a group
o f subjects (a sample) for research from a larger population. Each individual is chosen
by chance and each member o f the population has an equal chance o f being included in
the sample. This sampling can be used when specifics about the characteristics o f the
sample are not essential, such as the background of respondents, size o f company, and
type o f work, and so on. In other word, the population is homogeneous.
b. Stratified random sampling. There may be often be factors that the researcher wants to
examine, not only the result from the overall population, but also the differences
between key demographic subgroups within the population. This can be achieved
through stratified random sampling, which involves dividing the heterogeneous
population into homogenous subgroups and then taking a simple random sample from
each subgroup. The process is slightly more time consuming, but this technique can be
very valuable
c. Selected sampling. This type o f sampling begins with choosing a list o f names and
addresses o f participants with specific characteristics, for example, the top contractors
190

who are offering alternative procurement methods and undertaking refurbishment work
for commercial clients. All other contractors will be excluded from the survey.
In this study, a stratified random sampling was thought to be more appropriate than a simple
random sampling and selected sampling due to the various characteristics o f the
multidisciplinary stakeholders as respondents. In this sense, because each respondent seemed
different in characteristics, philosophy, and experience, the stratified random sampling was
chosen to accommodate the heterogeneous population. It was also in line with research
design, which required comparing the views o f many stakeholders from different
backgrounds.
6.8 Method for Data Measurement and Analysis
6.8.1 Method for Data Measurement
The foundation o f all questionnaires in research, whether postal or to be used for interviews
as well as workshops, should be analysed. Questionnaires are classified into two types, i.e.
closed and open (Naoum, 1998), whereas, measurements in the questionnaire can be
categorised into ‘fixed response’ for the closed form o f questions and ‘narrative response’
for the open, as well as a combination o f the two. The ‘fixed response’ is closely related to
quantitative questions, while the ‘narrative response’ is for qualitative.
In the quantitative area, measurement is a procedure in which a researcher assigns numerals
(numbers or other symbols) to empirical properties (variables) according to rules. ‘Fixed
response’ questions are easy to ask and quick to answer, they require no writing by either
respondent or interviewer, and their analysis is straightforward (Nachmias and Nachmias,
1996). In general, quantitative data measurement is divided into four levels o f measurement,
namely nominal, ordinal, interval, and ratio (Naoum, 1998), as follows:
a. Nominal scale. Nominal numbering implies belonging to a classification or having a
particular property and a label. It does not imply any idea o f rank or priority. Nominal
numbering is also conventional integers; that is, positive. This may well be due to the
fact that most statistics are analysed by computer which handles numbers more easily
than letters or strings.
b. Ordinal scale. This is a rating or a ranking o f data, which normally uses integers in
ascending or descending order. The rating scale is one o f the most common formats for
191

questioning respondents on their views or opinions o f an object, event, or attribute. In
this sense, the respondent has the choice to express his/her degree o f agreement or
disagreement and assess importance on a particular scale. The ranking format is used
when the respondent is asked to place a set o f attitudes or objects in order, indicating
their importance, priorities, or preferences,
c. Interval scale. The numbering system in the nominal and ordinal measurement is purely
an arbitrary label for identifying each type o f person. If there is a set o f observations or
data where the distance between each observation is constant, this type o f measurement
is called an interval level o f measurement. Examples often used are minutes, kilograms,
the number o f words recalled in a memory test, or percentage marks in an exam,
d; Ratio scale. The ratio scale is similar to the interval scale, except it involves the type o f
numerical scale which has a natural zero, such as age, salary, time, and distance.
Conversely, in qualitative questions, data is presented in a ‘narrative response’, which allows
respondents greater freedom of expression. Once the respondent understands the theme of
the investigation, he/she can let thought roam freely, unencumbered by a prepared set of
replies (Naoum, 1998).
According to ‘the first draft o f the proposed framework’ in Table 5.28, there are 57 pairs o f
characteristic-indicators. This means that the postal questionnaire consists o f a lot o f
questions and the respondent should freely give his/her opinion. Therefore, the responses
will be time consuming if the question is open ended and respondent becomes bored and
fatigued. To overcome this matter, a ‘fixed response’ postal questionnaire, where the
question is easily answered, was adopted in this research. A five-point rating scale (an
ordinal scale) was used to test the degree o f importance o f each characteristic, together with
its indicators. Meanwhile, during the interview and workshop event, the research data input
from participants was definitely captured in a ‘narrative response’. As a result, qualitative
analysis was utilised in this manner.
6.8.2 M ethods for D ata Analysis
Once research data is collected, the next research stage is to analyse the results to determine
the direction of the study. It is true that this research will gather a lot o f information, which
makes it difficult to present all o f it. This section elaborates the rationale for deciding
methods o f analysis that are used to summarise and organise both the ordinal data and
narrative data in most effective and meaningful way. All the data collected was analysed
192

with the use o f a computer aided software programme i.e. SPSS to analyse the quantitative
data and NVivo to assist organisation and analysis o f the narrative data.
a. Method of analysis for ordinal data
The ordinal data was captured from the postal questionnaire survey, which consisted o f a
number o f factors/characteristics. This data was then used in two ways: (1) to determine a
general picture o f every pair o f characteristic-indicators and (2) to measure whether the
difference in opinion between stakeholder groups is significant or not.
According to Nauom (1998), in order to measure the difference in opinion (ordinal data) o f a
number o f factors between two groups, the Spearman rank correlation coefficient method is
the answer. The SPSS software programme was used in this stage. Steps to be carried out in
the Spearman correlation method are as follows (Naoum, 1998):
i. Formulate the research hypothesis (HA) in terms o f the predicted results.
The hypothesis adopted in this analysis is ‘there is a correlation in ranking opinion
between the two stakeholder groups toward characteristics and their indicators within the
proposed framework’.
ii. State the null hypothesis (Ho).
The null hypothesis is a statement which is the antithesis o f the research hypothesis.
Therefore, the null hypothesis adopted in this study is ‘there is no correlation in ranking
opinion between the two stakeholder groups toward characteristics and their indicators
within the proposed framework’.
iii. Calculate the ranking and 'rho ’.
Step-1: Calculate the ranking by converting the score value into rankings.
Step-2: Calculate ‘rho’ (p) through the following simple formula
6 Y d i 2rho = 1----- ---------
n(n - 1 )
Where, di = the difference in ranking between each pair of characteristic-indicators
n = number of pairs of characteristic-indicators
iv. Decide whether there is a high positive correlation
Look up the critical value (r0) in the Spearman irho’> table in Appendix-1. Compare the
calculated value (rho) with the critical value (r0). If the calculated value is larger than the
critical value, it means that the research hypothesis is accepted and null hypothesis is
193

rejected, meaning that there is no significant difference in opinion between the data sets.
Finally, the correlation among all stakeholder opinions can be arranged in matrix format,
in order to provide a general overview of the result.
Most statisticians consider 20 plus to be the minimum number o f data required in order to
apply the Spearman correlation method (Naoum, 1998).
b. Method of analysis for narrative data
The narrative data was collected from interview and workshop events. Analysis of the
narrative data can be rather complicated and not as straightforward as a close-ended
questionnaire. The best way to analyse narrative data is to code the information in terms o f
ideas, patterns, and themes (Naoum, 1998). The purpose o f coding such questions is to
reduce the large number o f individual responses to a few general categories o f answer that
can be assigned a numerical code. Coding is the process o f identifying and classifying each
answer with a numerical score or other character symbol. It usually involves entering the
data for analysis or for computer storage. The coding categories should be exhaustive and
provide for all possible responses. They should be mutually exclusive and independent so
that there is no overlap among categories. This process is generally referred to as post-coded.
This means that the categories are assigned after the data has been collected. After
establishing the coding, the descriptive statistics method was employed to provide a general
overview of the result. NVivo software programme was utilised at this stage.
6.9 Anticipated Findings
There were three primary data collection techniques, which were extensively utilised in this
research in order to obtain data from multidisciplinary stakeholders as respondents, i.e. a
postal questionnaire, interview, and workshop event. In order to bring together all o f the
necessary expertise and all relevant public and private interests, it was believed that issues
related to the seismic safety o f non-engineered building could be resolved. Each had specific
positive attributes, which conformed to the data and information needed in order to solve the
research problem. Here, anticipated findings for each technique are presented as follows:
a. Postal questionnaire
The questionnaire asked respondents to give their opinion according to three sections, as
follows:
i. Assign a level o f importance to each pair o f characteristic-indicators
194

In this section, respondents were asked to give their opinion on the importance of
each pair o f characteristic-indicators already written in the questionnaire. The
anticipated findings were that most stakeholders assigned a high priority or
ranking to technical intervention in the proposed framework, although the
distribution o f opinions would tend to be scattered.
ii. Comment or feedback from respondents not captured in the questionnaire
The critical literature review referred to the fact that the current situation in
Indonesian disaster management displays a lack o f adequate activities in risk
management, as they are mostly focused on disaster response activities. The
anticipated findings in this section were therefore that the 57 pairs ‘ o f
characteristic-indicators in Table 5.28 were comprehensive enough from a
respondent’s point o f view and only a few respondents would write additional
ideas, comments, or feedback in the space available in the questionnaire.
iii. An estimation o f the correlation in the ranking o f opinion
In this section, based on the respondents’ preferences o f importance for each pair
o f characteristic-indicators, the anticipated findings were that there would be a
high positive correlation in the ranking o f opinion between each stakeholder
group toward characteristics-indicators within the proposed framework.
b. Interview method
The interview method was primarily designed to answer ‘why’ the questionnaire findings
took place. The anticipated finding was that most people consider that the common activities
or characteristics in a seismic risk management framework should be balanced between
technical activities and non-technical activities.
c. W orkshop event
Through the workshop event, each participant shared direct discussion with other
participants based on the findings from the postal questionnaire and interview. It was very
much hoped that the workshop event would achieve the best resolution in the proposed
framework from the multidisciplinaiy stakeholder point o f view when they shared their
experiences, perspectives, and needs directly. Based on the findings from previous activities,
together with both the benefit o f the research for the community as a whole and the positive
features o f the workshop method, the anticipated findings o f this workshop were that the
final proposed framework would be agreed by workshop participants, including as many
195

characteristics and their indicator(s) as possible in seismic risk management of non
engineered buildings. In addition to the fact that most of the failures were often in the
concrete implementation of seismic codes within non-engineered buildings rather than the
existing seismic codes itself, the additional anticipated findings were that the human aspect
was one of the major problems in the implementation of seismic codes, particularly the lack
of activities that hardly generated political commitment from government. This led to a
conclusion that technical intervention was not in the highest ranking in seismic risk
management activities in Indonesia. Furthermore, this anticipated finding was similar to
common global problems in developing countries (UNDP, 2004).
6.10 Key Quality Concerns Adopted for the Research
Analogous to research conducted by Spencer et al, (2003), the following four guiding
principles of the study were key quality concerns and were adopted. The research needed to
be: contributory, defensible in design, rigorous in conduct, and credible in claim. The
purpose of this section is to show that the research findings are the product of conscious
analysis. The explanations are as follows.
a. Contributory in advancing wider knowledge or understanding.
The findings of this research definitely showed its relevance or contribution to wider
knowledge. The following displays evidence of this:
iv. The developed framework, as the principal research aim, was the main contribution
to the wider knowledge and understanding for the Indonesian community as a whole,
to the wider knowledge and understanding for the Indonesian community as a whole.
Through its proper utilisation, this would have considerable impact and would be
useful to the future of building work, particularly in Indonesia, but also for other
developing countries as necessary. Chapter IX presents the framework in detail.
v. Some of the research contributions have been presented in the section of contribution
to wider knowledge in Chapters VII and IX. This included new understanding or
insight and creative interpretations, which were probably neglected or under
researched in the past.
vi. Moreover, the research findings were linked to, strengthen, and/or complement the
existing research and theory
196

b. Defensible in design
This research was designed by providing a sound research strategy to ensure that it addressed
the aim and objectives. The following displays evidence of this:
i. The underpinning research methodology was clearly in place to facilitate the
successful achievement of the research aim and objectives.
. ii. A clear rationale for the research question was developed in Section 6.3
iii. A defensible rationale for the choice of data collection methods was presented in
Section 6.4
iv. A defensible sampling strategy, a logical and clear sample selection criteria, and
comprehensive and balanced sample coverage were highly elaborated in Section 6.6.
v. Detailed sample profiles of each data collection phase were tabulated in the
beginning of every primary data collection chapter.
c. Rigorous in conduct
The research was carried out through the systematic and transparent collection, analysis, and
interpretation of quantitative and qualitative data. This procedure is often associated with the
term ‘reliability or notion of consistency’. The following displays evidence of this:
i. The research methodology was developed with a plausible argument by considering
the many strengths and weaknesses of appropriate techniques and selecting the most
appropriate method for the research purpose.
ii. In-depth research data was collected through two methods: (1) from secondary data
collection through desk-based critical literature review and analysis of the three
existing frameworks around the globe, and (2) from primary data collection through
a postal questionnaire survey, selected interviews, and a workshop event.
iii. Data was recorded carefully and analysed with the assistance of SPSS and NVivo
software to minimise error during the statistical and qualitative data analysis.
iv. The correlation analysis was calculated with a manual calculation first and then
cross-checked with the assistance of SPSS software.
v. Some pictures were utilised to clearly aid conceptualism and explain the
phenomenon investigated.
vi. The emerging issues were always interwoven with the previous findings or the
existing theory.
vii. During primary data collection in Indonesia, the author formed a research committee
to facilitate and maintain validity and reliability in accomplishing the research, and
also particularly to guide the data collection, analysis, and interpretations in the right
direction.
197

d. Credible in claim
The research offered well-founded and plausible arguments about the significance of the data
generated. This procedure is associated with the term ‘validity’. The following displays
evidence of this:
i. The developed research data instrument was carefully checked and piloted.
ii. The data source was triangulated to conceptualise the research problem and to arrive
at the research findings.
iii. A statistical test was administered to confirm the validity of the findings.
iv. Emergent issues and findings were always guided by views of the existing theory or
literature.
v. Two senior university lecturers were involved in the significance of data generated,
analysed, and interpreted as part of the research committe.
vi. The respondents were important people or a key person in their organisation and
involved in decision making to maintain the high quality data achieved and to avoid
bias.
vii. The findings were linked between different assertions and conclusions.
viii.The final research findings were then validated through two workshop events.
6.11 Ethical Consideration of the Research
The aim of this section is to confirm that the conduct, management, and administration of
this research are framed in a way which is consistent with ethical codes. These codes are
concerned with the definition of the substantive questions being considered for investigation
and also with the decisions made concerning the conduct of the research, the methodologies
employed and the people and organisations involved. The codes are also to ensure the
harmonisation of people and organisations. As mentioned below, these codes were in line
with the Sheffield Hallam University’s research principles (available at www.shu.ac.uk), and
can be summarised as follows:
a* Beneficence and Non-Malfeasance
i. The research aim, which proposed an integrated framework for guiding and
monitoring SRRNEB, was widely agreed to be scientifically sound. Moreover, the
198

benefit of this research originally contributed to wider knowledge in relation to risk
management practice in developing countries.
ii. While the importance of these research objectives was clearly intended to benefit
communities at all levels, there was no inherent risk in the subject.
iii. Adequate research procedures were identified so as not to bring about any
potentially harmful effects of participating.
iv. In conducting the research procedures, the researcher was always respectful toward
the participants and respected the subject’s wishes.
b. Informed Consent
i. The research respondents were adequately informed of the aims, methods, and
anticipated benefits, mostly by a face-to-face meeting and a letter before they
contributed to the research process.
ii. The documentation given to potential participants was made as comprehensible as
possible to facilitate a clear understanding of the significance of the research for
people as a whole.
iii. There was an opportunity for participants to raise any issues of concern or to make
complaints by contacting the researcher’s address or telephone number stated in the
research documentation. This meant that the researcher always shared what was
already created with them.
iv. Organisation consent was in writing, and records of consent were maintained.
v. Potential participants were able to withdraw their consent to participate at any time.
c. Confidentiality/Anonymity
i. Details that would allow individuals to be identified were not be published, or made
available, to anybody not involved in the research unless explicit consent was given
by the individuals concerned (in particular for workshop participants), or such
information was already in the public domain.
ii: Within the covering letter for the questionnaire and the introduction of the interview
and workshop process, there was text to assure respondents that the information
provided was held in strict confidence. This step succeeded in overcoming any
resistance or prejudice the participants might have against the research data
collection process.
199

6.12 Summary
The chapter highlighted the methodological approach adopted to obtain the information
necessary for this study to solve the research problem. As this was one of most important
parts of the research work, different methodological concepts and approaches were explained
in detail. It was evident from the critical literature review early on that the type of research
inquiry identified could be best explored, explained, and analysed by an inductive approach,
mainly employing a qualitative methodology. The explanation of different data collection
methods in the chapter justified that, among the different research strategies available, the
suggested postal questionnaire survey, interview, and workshop methods were best suited to
the research question and to the objectives of the research. Although this research mainly
consisted of qualitative method, the quantitative approach was also employed in order to
accommodate statistical analysis, particularly from questionnaire survey data. The research
design section in the chapter stipulated in detail the data collection and analysis approaches
adopted for the project. The anticipated findings from the three data collection methods were
also mentioned in the following explanation. Next, the four guiding principles of key quality
issues were adopted for the research, i.e. it should be contributory, defensible in design,
rigorous in conduct, and credible in claim. The chapter ends with the ethical concern adopted
in this research, i.e. beneficence and non-malfeasance, informed consent, and confidentiality/
anonymity. The following chapter discusses the pilot research study.
200

Chapter VIIP i l o t R e s e a r c h S t u d y
This chapter presents the pre-data collection phase of the pilot study after developing the
research methodology section in Chapter VI. It starts with an introduction to the pilot
studies, including their importance in the study and then follows the pilot study design for
this research. Subsequent sections mention the list of objectives set out to achieve from the
study; the presentation of findings from this chapter also constitutes an important part. This
leads to initial contribution to wider knowledge and, finally, refinement of the research
design.
7.1 Introduction to Pilot Study
A pilot study can be described as a study that involves a small-scale investigation or trial of
the materials and methods adopted in searching for the study's general objective(s) (Cassell
et al., 1994). Blaxter et al., (1996) opines that a researcher may think they know enough, but
things never work quite the way they are envisaged, even if done many times before. If a
pilot study is not carried out, the initial period of data collection would probably turn into a
pilot in any case.
Many advantages can be achieved through conducting a pilot study. A pilot study helps to
refine the data collection plans with respect to both the contents of the data and the
procedures. Janesick (1994) maintains that the pilot study allows the researcher to focus on
particular areas that may have been unclear previously. In addition, the pilot may be used to
test certain questions. This initial period allows the researcher to develop an understanding
with participants. Some insight into the shape of the study that was not previously apparent
might also be uncovered by reviewing the records and documents.
201

According to the definition mentioned above, when conducting a research project, it is good
practice to run a trial of the methods and procedures to be employed before the start of the
main data collection. This helps to recognise any potential flaws and inadequacies in the
designed methods. Important time, which could be wasted in modifying the methods later, is
saved. Moreover, it authenticates the relevance and practicality of the research issues and
methods early in the research. In addition, research is an arduous and significant time
commitment and would be better preceded by a pilot (Janesick, 1994).
As described broadly in Section 6.2, because the research methodology adopted satisfies the
need for exploration, insight, depth, and knowledge, an inductive approach has been
identified as appropriate for the research, with mainly qualitative methodology. As a result,
the pilot study conducted in this step is closely related to the nature of pilot inquiry. A pilot
inquiry can be much broader and less focused than the ultimate data collection plan, covering
both substantive and methodological issues (Yin, 1994). Effective use of time, participant
issues, and researcher issues are some matters to be decided in a pilot study. Janesick (1994)
recognises the usual unpredictability of fieldwork. The qualitative research must be ready to
adjust schedules, to be flexible about interview times and about adding or subtracting
observations or interviews. In addition, the pilot reports should be explicit about the lessons
learned for both research design and field procedures. The pilot reports might even contain
sub-sections on these topics (Yin, 1994).
7.2 Pilot Study Design for the Research
The nature of the research question in this work, as precisely elaborated in Section 6.3,
provided clear evidence that qualitative research constitutes the bulk of the data collection
plan, whereas a quantitative approach is also utilised in order to analyse the statistics from
the questionnaire findings. It is well known from the previous chapters that developing a
framework for guiding and monitoring seismic risk reduction of non-engineered buildings
(SRRNEB) needs an integrative approach that combines stakeholders’ perspective. Section
4.3.1 also mentioned the eight types of stakeholders involved in the decision process in
SRRNEB, i.e. researchers or scientists, small-medium contractors, foremen, policy makers
(within government agencies), businessmen, educators, non-government organisations
(NGOs), and community leaders.
202

As a part of the research strategy, this pilot research study substantiated the relevance and
practicality of the research issues and confirmed some conceptual clarification for the early
research design. The latter conformed to the contents of the data and the procedures. In order
to conduct the pilot research inquiry, Naoum (1998) suggests utilising an exploratory
interview method, where the questionnaire is often pitched at a general level, covering
substantive and methodological issues. Therefore, it was decided to conduct a pilot research
study by in-depth interviews with 16 people, consisting of two people for each stakeholder,
with different organisation between the two. The stakeholder criteria used for selecting
interviewees for the pilot study were as follows:
a. The important person in each stakeholder organization is identified to be the main
contact person for the pilot assessment.
b. He/she is actively involved in and forms policy issues
c. He/she has been a permanent resident in a high seismic area in Indonesia since his/her
birth, particularly living on Jawa island (the most densely populated island in Indonesia),
so that he/she has their own experience in living with seismic event(s).
The first interview was conducted with the first person from each stakeholder and is aimed at
a broader assessment of the issues identified from the critical literature review to the early
research methodology described in Chapter VI. The second interview was then employed to
crosscheck, consolidate, and authenticate findings from the first interview. According to
Naoum (1998), the powerful attributes of the semi-structured interview was judged best
suited in this pilot study. The next section gives the details of the lines of discussion
followed in interviews.
7.3 Objectives of the Pilot Study
There are four main objectives for the pilot study that are primarily related to the main study.
Objective one relates to the research background and research objective one, while objective
two corresponds to research objectives two, three, and four. Objective three conforms to the
research aim, objectives, and research methodology, including research objective five as a
whole. Finally, objective four accords to the framework validation as precisely described in
research objective six. The objectives for the pilot study were as follows:
Objective 1:
An assessment of the current state of non-engineered building collapse during earthquakes
and the existing seismic codes in Indonesia, which is explained as follows:
203

a. High death tolls caused by the collapse of buildings due to earthquakes,
b; The collapse of buildings, mostly dominated by non-engineered buildings
c. The existing seismic codes for the improvement of seismic resistance of non-engineered
buildings
d. The implementation problems of seismic codes in actual construction.
Objective 2:
An evaluation of seismic risk management practices for non-engineered buildings towards
seismic risk reduction, which is explained as follows:
a. Understanding of integrated seismic risk management (seismic hazard analysis, seismic
risk assessment, and seismic response) as a tool to implement seismic codes in actual
construction.
b. Understanding of many stakeholders involvement, strengthening of local community, and
poverty factor incorporation as key factors within integrated seismic risk management of
non-engineered buildings
c. Problems faced in seismic risk management practices for seismic codes implementation
d. Desirable level of seismic risk management practices
Objective 3:
The proposed framework for guiding and monitoring SRRNEB as a starting point to reduce
seismic risk as a whole (output of this research project), which is explained as follows:
a. Feasibility and relevancy of the research aim, objectives, and research methodology (as
precisely described in Chapter VI)
b. Desirable characteristics and indicators for the suggested framework
c. Support of the stakeholders for the research project
Objective 4:
The implementation of the' proposed framework for validation, which is explained as
follows:
a. Selection of cities for the implementation
b. Available material related to the implementation of the proposed framework in actual
life (data, procedures, manual, reports, etc)
204

7.4 Profiles of Pilot Stakeholder Organisations
Personal identifications of each interviewee are not described clearly in this report to protect
their confidentiality. In connection with the research topic, a stakeholder from the
‘businessmen’ category is taken from a real estate developer, which produces residential
building in their business activity. Detail profiles of pilot stakeholder organisations are
described in Table 7.1 as follows:
Table 7.1 Profiles of interviewees from various stakeholder organisations
No Stakeholders Stakeholder A Stakeholder B
1 Governmentorganisations
Activity: Disaster Management at Provincial Level
Position: Assistant of Officer
Activity: Infrastructure Management Position: Staff o f Public Building
Development2 Researchers or
ScientistsActivity: Earthquake Engineering Position: University Researcher/Lecturer
Activity: Civil Engineering and Disaster Management
Position: University Researcher Lecturer3 Small-medium
ContractorsActivity: House Builders Position: Director
Activity: House Builders and Civil Works Position: Director
4 Foreman Activity: House Builders Position: individually
Activity: House Builders Position: individually
5 Businessmen Activity: Real Estate Developer Position: Director
Activity: Real Estate Developer Position: Marketing Manager
6 Educators Activity: Primary school teacher Position: individually
Activity: High school teacher Position: individually
7 NGOs Activity: Disaster Management Position: Director
Activity: Poverty Alleviation Position: Director
8 CommunityLeaders
Activity: Youth activities Position: Leader
Activity: Neighbourhood Administrative and Religion activities
Position: Secretary
7.5 Findings from the Pilot Study
Interviewees possessed many skills and attributes, from educational practices to technical
expertise, and they gave freely their views and aspirations. Generally, most of them
appreciated that the research topic had a new paradigm within the context of sustainable
development, embracing many types of stakeholders. The research area was relatively new
and unfortunately, not enough information was available in the literature and actual
practices. Many terms and aspects related to the research topic were partially recognized by
interviewees, particularly along with step-by-step seismic risk management definitions;
because there were many new terms within the interviewees’ vocabulary, the researcher, as
an interviewer, should often explain the definitions first when asking questions.
205

It was widely agreed by the stakeholders that the primary organization activities in Indonesia
associated with disaster were to coordinate the response to disasters in all phases, hardly ever
to mitigate activities before the disaster strikes. This meant that almost all of the
interviewees, except government staff and researchers/scientists, did not give a clear opinion
for each pilot study objective. According to the findings, generally, the second interviewee
from each stakeholder gave an opinion which was in line and/or strengthened by the first.
The findings from pilot research study are described below:
7.5.1 Earthquake Effects, Seismic Codes, and Non Engineered Buildings
It is generally concluded that earthquake effects, particularly from collapsing buildings and
their components, can cause losses to life and property. Generally, all the interviewees
agreed that the failures result from buildings with deficiencies in design, poor quality in
construction, and a lack of maintenance. However, the definition of a non-engineered
building was not known among them, indeed, it was only recognized by
researchers/scientists.
Interviewees from government staff, researchers/scientists, contractors, and foremen
admitted that information on building using seismic codes with seismic features exists and
can be accessed by those who need it. For example, the formal seismic codes for concrete
structures began to be published by the government for academic and practice purpose in
1971 (PBI 1971) and a manual of seismic resistance for residential houses designed for lay
people was available in 1978, and revised periodically (as necessary). In reality, the seismic
codes are not implemented widely, particularly within non-engineered buildings, which
belong to medium-poor people. From the point of view of contractors and foremen, it was
true that there were regulations with limited enforcement and no accountability. The
government has not been able to implement even the existing seismic codes because of a
lack of suitable implementation mechanism and limited resources for building inspection and
control. Self-builders, foremen, and small-medium contractors currently tend to construct
buildings which are spontaneously and informally constructed in the common traditional
manner.
On the other hand, the people who are represented by the community leaders, NGOs,
teachers, and businessmen said that the building code was not disseminated down through to
the grass root communities. At the moment, most people who build their own house just
want primarily to have a space to live and/or work and do not consider their safety from
seismic hazard through the implementation of seismic codes. As a result, non-engineered
206

buildings as vulnerable buildings continue to be built and this would continue the risk for the
foreseeable future.
Common to all, the opinions above show that, in many rapidly growing cities, earthquake
risk considerations have not been factored into the building and planning process.
Governments have not been capable of regulating building in a way that reduces seismic
risk, although the seismic codes exist. Finally, this indicates that there is a wide gap between
the existence of seismic codes and their implementation.
7.5.2 Practices of Seismic Risk Management
A definition of seismic risk management was categorized as a new word within
interviewees’ terminology. After an explanation by the researcher, almost all of the
interviewees agreed that reducing seismic risk within non-engineered buildings could be
done using the implementation of a step-by-step seismic risk management concept before the
big one happens. However, the implementation was hardly ever passed down through to the
community level in Indonesia. There are many reasons why implementation was rare or very
slow. Discussion among the interviewees summarised such factors: (1) a big seismic event is
generally a long term, low-visibility process, with no guarantee of tangible rewards in the
short term, (2) seismic safety consideration is not a priority within their daily life activities,
(3) there is no integrated involvement of many actors within seismic risk management, (4) A
big seismic event in Indonesia is often used by politicians to gain kudos from being
associated with humanitarian responses, (5) local communities who actually suffer the
disaster are never empowered appropriately.
Interviewees suggested that the implementation of seismic risk management practices should
embrace the role of technology, the media, and interdisciplinary stakeholders in the
communication of seismic risk information. Obviously, this must be integrated and there is a
need to continue to expand knowledge of how people and organisations perceive and react to
seismic risk management practices, making the information more useful to end-user
communities. This leads to the conclusion that the reporters/journalists who drive the
information through mass media should also be considered in the decision making process
and convey the seismic risk management, practices to end-user communities.
The suggestion from most of the interviewees described above was to add reporters as key
stakeholders as well, to act beside the eight stakeholder organisations already mentioned.
Finally, the number of stakeholder organisations who engaged in this research was to be
207

nine. These are: government agencies, researchers/scientists, small-medium contractors,
educators, foremen, NGO’s, businessmen, community leaders, and reporters. The nine
stakeholder organisations listed above represented nine groups of respondents in order to
collect the research data.
Interviewees from government staff suggested that very few government agencies have
performed a formal risk assessment or developed plans to reduce building vulnerabilities.
This type of disaster management system is not currently integrated, thus each type of
disaster is managed by a separate command centre, which does not share actions with other
centres. This can illustrate the inadequacy of disaster prevention capability and require
concerted effort across departments to co-ordinate and communicate key information on the
initiative in Indonesia. Such good practices in other countries can be studied and altered to
suit current conditions in Indonesia.
Interviewees from the categories of contractors and foremen opined that the improvement of
seismic risk management practices concerning non-engineered buildings could be achieved
through (1) improving the mechanism of control over building construction, (2)
dissemination of new understandable seismic codes using workshops and training, and (3)
adequacy of certification for civil engineers, architects, and foremen. Specifically,
interviewees from the category of researchers/scientists elaborated that the use of science in
seismic risk management is not only in order to develop technologies that ultimately serve
the goal of disaster loss reduction but also to provide the means for society to become more
resilient to disaster. Yet, at the moment, the mechanism to make society more resilient is
very unsystematic and needs an integrated approach.
More generally, interviewees from NGOs, community leaders, teachers and businessmen
suggested that effective development of seismic risk management is a ‘community based’,
‘bottom up’ approach, looking from a ‘socio economic perspective’, focusing on the ‘process
and product’ of built environment formation with an emphasis at local level. They were
tired of seeing millions of rupiahs spent on research and studies without any implementation
of actions.
All descriptions of seismic risk management practices in this pilot study suggest that the
outcome of an effective integrated seismic risk management plan should be a balance
between improvements to public safety and to organizational effectiveness. This can be
208

achieved by ensuring that the actors are the right people, with the right skills, doing the right
things, in the right place, at the right time.
7.5.3 The Proposed Framework for Guiding and Monitoring SRRNEB
The above description about earthquake effects, seismic codes, and seismic risk management
practices gives a clear understanding that there is no established and sustainable framework
for guiding and monitoring SRRNEB in Indonesian cities. Therefore, developing a
framework for these circumstances by embracing all stakeholder views and aspirations was
extremely favourable to them. Most of them said that the proposed framework requires that
all stakeholders change their perception and behaviours to place a high priority on safety in
planning and development. In order for such a change to take place, prevention and
mitigation programming must be sustainable and must provide a sense of ownership to the
community. Moreover, the proposed framework should be designed as a flexible tool for
many types of organizations in Indonesia. The proposed framework should allow each actor
to fit their own strategies for risk management into the overall corporate objectives of their
organization. In broad perspective, many elements of the proposed frameworks might
overlap with other aspects of engineered buildings and other relevant features without any
contradictions.
At the early stage of this study, the researcher developed ‘the first draft of the proposed
framework’, combining an in-depth review of literature and existing frameworks around the
globe. Having read ‘the first draft’, all interviewees realised that many stakeholders could
contribute to the refinement of the first draft of the proposed framework, in order to shape it
to suit the current condition of the cities in Indonesia. Therefore, the second step in
developing the proposed frameworks is to gather ideas and initiatives from many forms of
stakeholders within Indonesia. In developing a method to refine the first draft of the
proposed framework, the different levels of readiness and experience of all stakeholders
knowledge, as well as variations in available resources, need to be recognized. As a result,
most interviewees suggested that methods need to be flexible and simple, using clear
language to ensure open channels of communication.
Moreover, all interviewees agreed that, to cover the diversity of their opinions, the
questionnaire survey was more appropriate in order to gain more and more input from
stakeholder representatives. Using postal questionnaires to cope the variety of stakeholder
addresses within a limited period is economic in terms of both money and time. All
interviewees predicted that all respondents from each stakeholder would participate, because,
209

they would hopefully understand that the benefit of the research is for the Indonesian
community as a whole. In order to make the circulation path of the survey easier,
respondents could be triggered to contribute to the survey using the formal administrative
structure umbrella from their own organizations. Using the formal letter from their leader or
manager, respondents could be urged to complete and return the questionnaire.
At the same time, interviewees from researchers/scientists and government staff urged the
researcher to add a selected interview beside the questionnaire surveys. The reason was
based on the fact that not all respondents would understand the exact meaning of the
questionnaire contents, and might need face to face clarification. However, if there were a lot
of respondents who wanted to meet the researcher to clarify queries from the questionnaire,
it would certainly take a lot of time. This is the reason why the selected interviews are
appropriately planned. Other interviewees did not have any comments on this matter.
At the next stage, all interviewees agreed that ‘the second draft of the proposed framework’
formulated from the questionnaire survey (and selected interviews) needed to be brought to
the formal workshop event attended by stakeholder representatives. Using the workshop,
stakeholders would be invited to present and discuss their experiences directly and openly,
their needs, and their aspirations for the refinement of ‘the second draft of the proposed
framework’ to achieve a final framework.
Having read the first draft of the proposed framework, developed using the literature and
existing frameworks, all interviewees said that the characteristics and their indicators
included in the draft have comprised most aspects that need to be integrated. It could
represent the ideal framework. Considering the current situation in Indonesia, interviewees
from government staff and researchers/scientists realised that, to achieve the actual
integrated implementation within the framework, all community components would need to
do a lot of work. However, all interviewees gave strong support to the research aim in order
to create a starting point to make city communities more resilient to seismic risk. To achieve
community resilience, it is important to make seismic risk reduction mainstream by actively
marketing the value of the framework as a tool benefiting all parties. High commitment and
integrated actions from all people, especially within government organisations, are needed to
market the proposed framework down through to the grass root communities. The role of
reporter in conveying the straightforward information in the right direction is very important.
This is also the reason why most interviewees agreed that reporters should also be
respondents in this research.
210

7.5.4 Validation Media for the Proposed Framework
All interviewees agreed that validation of the final framework could be carried out using a
workshop event. More specifically, interviewees from the category of researchers/scientists
gave full attention to the cities where the final framework would be applied, using workshop
events. Interviewees from the researchers gave strong support to the choice of Bengkulu City
as the first city for the validation. The city was chosen by the interviewees because a big
earthquake occurred there in 2000. The earthquake caused a lot of non-engineered buildings
to collapse. The workshop would then be attended by stakeholders with real earthquake
experiences embedded in their memories from the modem era.
In the beginning, Yogyakarta City was selected to be the second city for application and
validation because it has a high potential of seismic risk in the near future, as described in
the literature review. This would validate the new results because the workshop would be
presented by stakeholders without any experience of big earthquakes in recent decades, even
in their life, but whose city is very vulnerable to seismic risk. The selection of Yogyakarta
City was made before the tragic Yogyakarta earthquake on 27th May 2006. As the earthquake
had already occurred by the date of the workshop, the framework validation was therefore
conducted in two cities that had both experienced the most devastating event of the modem
era, a strong earthquake. The first city was Yogyakarta, and then the second was Bengkulu.
In conclusion, the above findings of the pilot study have been successful in substantiating the
essential issues of the research project. It is amazing how many lessons can be learned from
the findings. In general, all interviewees agreed that the research topic is very interesting and
all communities would gain much benefit from the research aim. Thus, it is widely agreed
that a lot of stakeholders would not mind participating in this study if they are appropriately
informed of the right direction of the research aim. It is true that ideas, opinions, aspirations,
and support from the stakeholders as respondents and workshop participants are paramount
as a key to successfully achieve the research aim.
211

7.6 Emerging Issues from Combining the Critical Review of Literature andExisting Frameworks and Pilot Study Findings
This section lists many issues that have been identified from the analysis of the review of
literature and existing frameworks and the pilot study, as follows;
a. Implementation of Seismic Codes within Non-Engineered Building Practices
i. Seismic codes written for academic purposes and in a simple language exist in
Indonesia, whose many cities are located in high seismic areas, yet they need to
match unique local resources, according to the enormous diversity of the Indonesian
region, economy, and culture. The seismic codes should be suited appropriately so
that they are socially acceptable, at reasonable cost, and easily absorbed into local
construction methodologies.
ii. The implementation of seismic codes in practice encounters complicated problems
associated with many factors such as: limited enforcement and no accountability in
regulations, lack of a suitable implementation mechanism, limited resources for
building inspection and control, and lack of public awareness.
iii. Such problems mentioned above currently lead self-builders, foremen, and small-
medium contractors to construct buildings which are spontaneously and informally
constructed in the common traditional manner, categorised as non-engineered
buildings, in order to fulfil the high demand for housing and buildings in developing
countries.
iv. Non-engineered buildings are particularly vulnerable and belong to medium-low
income communities; they are still being constructed, which will accumulate
foreseeable future risk in Indonesia and then prepare for the next disaster.
b. Current SRRNEB in Indonesia
i. The reduction of seismic risk can be achieved through the implementation of seismic
codes within non-engineered buildings to bridge the wide gap between high death
tolls and the existence of seismic codes, moving from knowledge into action.
ii. The implementation of seismic codes within non-engineered buildings is not easy. It
embraces many factors such as: the involvement of many actors, the involvement of
the local community, and incorporation of the poverty factor.
iii. The concept of integrated seismic risk management can be used as an easier path to
the implementation of seismic features within non-engineered buildings.
212

iv. Many definitions within seismic risk management are unfamiliar and recognised
only partially by most Indonesian people. Enhancing all concerned stakeholders’
awareness about seismic risk management could reduce a hindrance to implement
the codes in order to reduce seismic risk.
v. The practices of seismic risk management are not currently integrated in Indonesian
cities. None of the primary stakeholders seems to be discussing the problem in any
common forum comprehensively. This illustrates the inadequacy of seismic
prevention capability and requires concerted effort within multidisciplinary
stakeholders.
vi. Much of the evidence gives a clear understanding that there is no established and
sustainable framework for guiding and monitoring SRRNEB in Indonesia.
vii. It is clearly imperative to develop a seismic risk management framework for guiding
and monitoring SRRNEB in Indonesia as a stepping stone towards integrating
seismic risk management into sustainable development.
c. The Proposed Framework for Guiding and Monitoring SRRNEB in Indonesia
i. The proposed framework should be based heavily on the review of in-depth literature,
existing frameworks, and multidisciplinary stakeholders’ perspectives, so that it will
suit the current conditions in Indonesia.
ii. The proposed framework should be designed as a flexible tool for any organizations
in Indonesia, as a starting point to reduce seismic risk comprehensively.
iii. The proposed framework should allow each actor to fit their own strategies for risk
management into the overall corporate objectives of their organization.
iv. Characteristics and indicators within the proposed frameworks might overlap with
other aspects of engineered buildings and other relevant features without any
contradictions.
v. It is important to market the value of the framework as a tool benefiting all parties.
7.7 Contribution to Wider Knowledge
The critical literature review and the findings of the pilot study suggest that the damage to
human life and property by the collapse of non-engineered buildings, particularly residential
houses, during strong earthquakes has been increasing in recent decades. The greater need
for housing for a growing population, together with the inadequacy of seismic risk
prevention strategies in developing countries, means the number of non-engineered buildings
213

with non-seismic resistance has expanded. A current percentage estimation of non-
engineered urban building stock in developing countries is about 90%; this figure is even
higher in rural areas. These conditions drive the increase in exposure and vulnerability of
human society to the impact of strong earthquakes. Because seismic risk is a real fact for
people who live in seismic prone areas and the occurrence of seismic events may not be
predictable or avoidable, it is not a wise solution to force them to leave their beloved
homeland even if it is a hostile area, therefore the people should learn to live harmoniously
with the seismic risk. They should be able to develop a sense of place and feel at home there,
with feelings of belonging for the place being an anchor for people’s identity. One of the
strategic , solutions is to carry out mitigation actions aimed at reducing losses through the
implementation of seismic codes on non-engineered buildings; in these circumstances,
seismic codes are available and can be easily found.
Based on a general assessment, the implementation of seismic codes on non-engineered
buildings is not only related to physical measures, but also to all forms of activities, multiple
organizations, and citizens at different levels of understanding, commitment, and skill. This
comprehensive perspective of reducing seismic risk and also disaster risk as a whole should
merge into development planning completely. It is true that, for a developing country like
Indonesia, after the basic poverty issues (food, shelter, health, and education), the priority is
to protect life and property from devastation caused by natural disasters such as earthquakes.
Three suggested important factors to comprehensively reduce seismic risk of non engineered
buildings in developing countries are concerted effort among many actors, the strengthening
of local capacities, and poverty consideration.
There is an integrative need to bring the full range of technical, social, and political
consideration to bear on each seismic risk responsibility, with a fuller appreciation of their
mutual inter-dependence to gain significant levels of hazard reduction and increasing
resilience. Many actors should be involved in step-by-step seismic risk management
practices in order to reduce seismic risk, representing shared effort and a sense of
responsibility among all community members. Finally, developing an integrative framework
for guiding and monitoring SRRNEB is essential, as it can be used as a starting point or a
stepping stone to incorporate seismic risk management into development planning in
developing countries in order to achieve change.
The ideal framework should guide strategic conversation between various stakeholders and
cover many characteristics and indicators to define and/or point to more significant issues.
214

These are selected from a greater mass of information, to capture common and global
conventions of seismic risk reduction of non-engineered buildings in developing countries. It
is also conceivable that the characteristics and indicators may not only embrace aspects
within non-engineered buildings, but also within engineered buildings and other relevant
factors. While geography seems likely to influence relevance, the various common
characteristics and indicators should be scrutinised comprehensively in the proposed
framework to cover many areas where the community is living in terms of its social cohesion
and spirit. However, the proposed framework is just a tool. The next important thing is to
build popularity for mainstreaming seismic risk reduction by actively marketing the
proposed framework as a clear, unambiguous tool for achieving incremental improvements.
7.8 Refinement for the Research Design
The emerging issues outlined earlier show the significance of the critical review of literature
and existing frameworks and the pilot study. Where the preliminary research has an insight
and understanding of the current seismic risk situation around the globe, at the same time, it
has pointed out essential issues according to the present situation in Indonesia, developing a
framework for guiding and monitoring SRRNEB in Indonesia. Combining the research
methodology section and the findings of pilot study, there are some refinements for the
research design, which was formulated in the previous chapter. The methodological
approach adopted by this research still uses a qualitative approach. This research would be
able to explore and provide insight on the necessary theoretical, cultural, structural and
political issues associated with the integration of seismic risk management within
multidisciplinary stakeholders. Some refinements to the research design are as follows
(Table 7.2);
a. It is widely agreed that many stakeholders mention that seismic risk management is a
previously unrecognised term. Therefore, questionnaire survey was designed so that
there is an opportunity for the respondent to choose a ‘not known * answer after ‘the
fixed responses of the importance level of each statement’ as described early in Section
6 .8. 1.
b. Due to the introduction of the new term, not all the respondents would understand the
exact meaning of the language used in the questionnaire statements; it is possible that
they have their own ideas in accordance with the questionnaire findings, which can
hopefully complement the proposed framework. This situation led the researcher to
discover factual stories by face to face discussion with the respondents. Therefore, the
215

purpose of the interview method, as described early in Section 6.4, is not only to explain
'why' the questionnaire findings took place, but also to discover respondents’ opinions in
a clear, unambiguous fashion, and particularly to achieve a comprehensive picture of the
proposed framework. This is the justification for the interview with selected important
people after the findings of the postal questionnaire.
c. In addition to the 8 types of stakeholder organisations, reporters were important
stakeholders in this circumstance as well. They drive the information through the mass
media are also important stakeholders in the decision making process and convey the
seismic risk management practices to end-user communities. Finally, the number of
stakeholder organisations who would engage in this research is to be nine. These are:
researchers/scientists, small-medium contractors, foremen, government agencies,
businessmen, educators, NGO’s, community leaders, and reporters. The nine stakeholder
organisations listed above would represent nine groups of respondents as a wider
sample.
d. The cities selected for the implementation of the proposed framework as validation
media are Yogyakarta City and Bengkulu City, via workshop events. Both of the cities
suffered the tragic experience of a strong earthquake recently.
Table 7.2 Some refinements to the research design after conducting the pilot study
No Descriptions Research Design
Before Pilot Study After Pilot Study
1 The type of questionnaire survey Fixed response Fixed response with an opportunity for respondent to
choose ‘not know’ answer2 The interview method In order to explain
'why' the questionnaire findings
took place only
Not only to explain 'why' the questionnaire findings took
place, but also particularly to achieve comprehensive picture
of the proposed framework.3 The number of stakeholder organisations
who would be targeted to participate in this research
Eight Nine(including reporters)
4. The cities selected for implementation the proposed framework as validation media
Not yet decided Yogyakarta City and Bengkulu City
216

7*9 Summary
This chapter created a foundation for the primary data collection of the research in order to
authenticate the rationale behind the research topic and the data collection plans. A brief
introduction to the pilot study was given in the beginning. This emphasised the importance
of pilot studies in any research project. The introduction covered the general criteria for the
selection of pilots, followed by the broader issues. The chapter further outlined the pilot
study design for this research. The exploratory interview method stood out as the apparent
choice for a pilot tool.
It was identified earlier that the research objectives would be best achieved using a
qualitative methodology. The selection criterion for the pilot organisations was also given in
the chapter. The criteria were successfully met in finding the pilots. Then, the broader
objectives set out for the study followed; these objectives reflected the analysis of the
research topic and research design. In order to relate the pilot study findings to the
background of the stakeholders, the profile of pilot organisations was presented.
Stakeholders selected for the pilot studies were not identified by their names, but with the
fictitious names of Stakeholder A and Stakeholder B for reasons of confidentiality. This was
followed by the all-important section of the findings from the pilot studies. These findings
are critical for the research, as they authenticated and consolidated the issues, and unmasked
those that did not show in the literature review. Some essential findings from the pilot study
have been utilised to refine the research design, i.e. the type of postal questionnaire, the
interview method, the number of stakeholder organisations, and the cities for the proposed
framework implementation.
Based on these findings, this chapter then listed the emerging issues for the next research
stage. The list would be very helpful in giving a initial contribution to wider knowledge and
refinement for the research design. The final research design was then utilised to obtain
primary data from the wider sample, through postal questionnaire surveys, selected
interviews, and workshop events, as detailed in the subsequent chapter.
217

Chapter VIII Questionnaire Survey and Selected Interview
Data Collection and Analysis
Once ‘the first draft of the proposed framework’ has been developed and the research design
has been detailed, the next stage moves to the collection of some primary data. There are
three phases of the data collection for the research project, i.e. a questionnaire survey,
selected interviews, and a workshop event. The principal aim of the three data investigations
and their analysis is to refine ‘the first draft of the framework’, which was extracted through
a review of literature and existing frameworks (as mentioned in Chapter V), to be the final
framework suitable for Indonesian cities, as per the main research aim.
The data was collected from respondents who represented a range of the different kinds of
multidisciplinary stakeholders from a wide cross-region of Indonesia with differing levels of
experience and expertise, and with vaiying roles. Although they were not fully representative
of the whole Indonesian region, they nevertheless gave an indication of Indonesian diversity
of policy and provision. During the data collection phase in Indonesia, the established
research committee facilitated and maintained the validity and reliability of the data in
accomplishing the research, and also particularly guided the right direction for the data
collection and analysis.
This Chapter presents details of the questionnaire and interview data collection and analysis,
whereas Chapter IX will report workshop data collection and analysis as the final phase of
the primary data collection. The main aim of this chapter is to refine ‘the first draft of the
framework’ into ‘the second draft of the framework’ and also to validate the emerging
findings from the previous chapter. Generally, this chapter is divided into three sections.
These are: (1) questionnaire data collection and analysis, (2) selected interview data
collection and analysis, and (3) refinement of ‘the first draft of the framework’. Finally, this
chapter concludes with a summary.
218

8.1 Questionnaire Data Collection and Analysis
The questionnaire survey is the first phase of the data collection for the research project. The
survey was conducted primarily to validate and authenticate ‘the first draft of the proposed
framework’. This chapter begins with the rationale for the questionnaire. The average rate of
response and a detailed break down of responses from different categories of respondent are
given. Generally, this section also describes three methods of analysis that are employed to
summarize and organize the data in the most effective and meaningful way. These are (1) the
descriptive statistics method of analysis to describe a general overview of the research
sample, (2) the inferential statistics method of Spearman irho\ ranking correlation to
measure the difference in ranking among respondents’ opinion by category, and (3) the
exploratory data analysis to scrutinize open-ended answers from the questionnaire. The
analysis is presented under the same order used in the questionnaire. The end of this section
elaborates emerging questions arising from this analysis.
8.1.1 Rationale for the Questionnaire Survey
The content of ‘the first draft of the proposed framework’ revealed some interesting issues,
headings, characteristics, and indicators, as given in Chapter V. However, because of the
many terms extracted from around the globe and the limited sources of information available
from Indonesia when arranging ‘the first draft of the framework’, it necessitated a
mechanism where the content of ‘the first draft of the framework’ could be authenticated and
validated by a large number of key decision makers in Indonesia, and explored further for
better understanding. Hence, it was decided to conduct a postal questionnaire survey in
Indonesia.
The questionnaire is related to the common global aim of seismic risk management of non-
engineered buildings and current issues in relation to reducing seismic risk. It is taken from
‘the first draft of the proposed framework’ as formatted in Table 5.28, and then simply
depicted in Figure 5.1. ‘The first draft of the framework’ consisted of three section headings:
seismic hazard analysis, seismic risk assessment, and seismic risk response. Among the three
headings, there were twelve core areas that underpin the understanding of seismic risk
reduction of non-engineered buildings (SRRNEB). Core areas were the breakdown of
headings, which are a global concern in SRRNEB. The twelve core areas comprised 57
statements or pairs of characteristic-indicators. The 57 statements then were divided into 15
technical intervention and 42 non-technical intervention statements, as elaborated in Table
5.28, Chapter V. In addition to the content of the questionnaire, blank space was also
219

provided at the end of the each section of the questionnaire to allow the respondent to write
additional ideas or information if necessary. The sample of the questionnaire is attached as
Appendix-2.
The draft of the questionnaire was already piloted by a variety of key people by interviewing
16 important people from many organizations to ensure that questions were simple, clear,
and unambiguous (see Chapter VII). This was particularly important, since it was anticipated
that certain terms might not be understood by the respondents. Nevertheless, the ‘don’t
know’ answer was provided in the questionnaire to accommodate this matter. The
questionnaire was issued in the Indonesian language, since they were distributed in
Indonesia. A covering letter outlining the purposes of the survey and requesting co-operation
in completing the document accompanied the questionnaire.
The questionnaire was then circulated to a large number of respondents, who were asked to
grade the importance of the 57 seismic risk management statements, to be carried out in
Indonesian cities located in high seismic hazard, by ticking the appropriate box and by
writing any additional ideas or information if they consider important in the blank space
provided. Here, the descriptive dimension of importance scale was converted into numerical
value using the five-point bipolar importance scale, with contrasting adjectives at each end
(i.e. 5=very important; 4=important; 3=neither; 2=not important; l=absolutely not important;
0= don't know). Hence, the respondents could be forced to declare their opinions and, in
addition, the score of 3 would serve as a neutral position, avoiding the two extreme
positions. The ‘0’ or ‘don’t know’ response was designed to accommodate terms unfamiliar
to the respondent when answering the questionnaire.
8.1.2 The Research Sample
Altogether, 875 questionnaires were distributed among the nine types of stakeholders
involved in the decision process in SRRNEB: researcher or scientist, small-medium
contractors, foreman, policy maker (within government agencies), businessmen, educators,
non-government organizations (NGOs), community leaders, and reporters around Indonesia
region. The level of expertise or criteria of each respondent was: (1) he/she was the
important person in each stakeholder organization and (2) he/she was actively involved in
and shaped policy issue. The names and addresses of the respondents were selected from
several sources, particularly from their associated organizations. The leader or director in
many organizations was approached to get a permit for distributing the questionnaire to
appropriate management positions, as attached in Appendix-3.
220

There were 305 responses from many part of the Indonesian region. Most of the researchers
came from the Civil Engineering university department. Key staff from the Building
Division of Infrastructure Department, Regional Development Board, and Regional
Information Board represented the government officials whom contributed largely in the
survey. Important people from several real estate firms represented businessmen; most
educators who were involved in the survey were school headmasters. The other respondents
were targeted from various organizations in a similar manner. Particularly, respondents from
the category of foremen were selected from the participant list of seismic resistant building
training conducted by CEEDEDS during 2004-2005 because they did not have a trade
association or organization. Most questionnaires were sent by post, while a few were
distributed by direct survey due to the fact that the author had a close relationship with the
respondents, formed over several years.
Each questionnaire was coded to assess the rate of return and facilitate the analysis. In total,
305 questionnaires were returned, attaining a 34.9% response rate. All the returned
questionnaires were usable. The reasons for this comparatively good response rate may be
the close relationship base, the third-person contacts, and the telephone contacts, which were
established prior sending out the questionnaire. The lowest response is from businessman
category, which is only 26.7%. Based on further investigation, some businessmen mentioned
that they felt less enthusiastic to participate in the questionnaire survey due to the pressure of
every day work schedule, and student’s questionnaire is of less priority. Some other
mentioned that the research topic was far from their business goal. The detailed breakdown
of the questionnaire return is given in the Table 8.1:
Table 8.1 Number and rate of response by category
N o Respondents by Category Questionnaire Issued Responses* % Responses
1 Researcers/Scientists 50 31 62**2 Contractors 110 49 44.53 Foremen 95 34 35.84 Government 100 30 305 Businessmen 120 32 26.76 Educators 100 36 367 NGOs 100 30 308 Community Leaders 100 30 309 Reporters 100 33 33
875 (Total) 305 (Total) 34.9 (Average)*) 92% of the responses were received by postal survey and 8% of the responses was reached by direct survey
**) This high response was due primarily to the fact that the author had a close contact base which was formedduring the professional placement
221

8,1.3 The Data Collected and Analysis of the Results
The principal narration of data collected and analysis for this section is divided into four
headings as follows:
a. The descriptive statistics method to describe the characteristics of the sample
b. The inferential statistics method to measure the Spearman ’rho’ correlation in ranking
among respondents’ opinions
c. The exploration method for the descriptive open-ended answer
d. The emerging specific research questions for further investigation
8.1.3.1 The Characteristics of the Sample
This section mentions the descriptive statistics method of analysis, which provides a general
overview of the results of how the data is distributed on all the items of the investigation,
particularly in mean, percentage, and rank. Indeed, altogether there are 305 respondents and
each respondent graded the importance of 57 statements. Therefore, this survey comprises
305 x 57 data, which is equal to 17,385 of data or values; it is certainly not necessary to list
every single value and analyse them value by value because the output would be extremely
long. This method collects the descriptive information on all data in one go, providing
summary statistics such as mean, percentage, and rank.
Broadly speaking, a mean score is the average of all the responses in a set of data. In this
research, the mean score of each statement in each category of respondent was calculated by
adding all the respondents’ opinions or scores in the same category within the related
statement and then dividing by the number of respondents, excluding the number of
respondents who stated ’0’ or ’don’t know’ response(s). The overall mean score then was
calculated in the same manner. The rank of each statement in each category of respondent
was assigned by converting the highest of mean score in the same categoiy among 57
statements into ranking number one, the second highest was ranking number two, and so on.
The overall ranks were arranged in the same method. As two or more statements shared the
same average of mean scores, apparently they shared the same ranking. The range of the
ranks was assigned from 1 to 57. Besides the means and ranks, the number of ’0’ or ’don’t
know’ responses was analysed in percentages.
Table 8.2 presents an example of raw data gathered from foremen, comprising the responses,
the means, the ranks, and percentage of responses which stated ’0’ or ’don’t know’. The
complete raw data is attached in Appendix-4.
222

Tabl
e 8.2
Ra
w Da
ta of
Fore
men
’s Op
inion
to
Seism
ic Ri
sk
Man
agem
ent
Stat
emen
ts
i g jaq m n jv i (u a m a jB is Of > > > > •o > > Wo Wo > WOWo Of wo Of wo Of Of cn Wo cn Of Of Of wn wn wn > wn 38C*fr Z l95 ja q u m jq ju a u ia jE is Of co > > > > <N > > > wo > CO wo wo wo Of wo Of Of cn Of cn Of Of Of Of Of wn Of Of U 6 'E S’ I f
155 ja q u m fq jn a ra a jE JS *o > > > > > > > wo wo wo > WOwo wo Wo Of o Of Of > Of Of cn Of wn wn wn wn Of Of t o r * 91
t?5 ja q m n fs j ju am ajE JS Of *o > > > > > > > <o > > > wo > Of- wo wo Of WOCO Of Of cn Of Of Of Of Of Of Of Of CM 6 3 0 ‘* S '9 £
£5 ja q u m M ju a u ia jE JS Of wo »o > > > > »n > > > WO > oc Of Wo wo Of CO Of Of Of Wo cn Of Of wn Of wn Of wn o t L Z ' t 02
2 5 j s q u m N (u au ia jB JS Of CM*n > > > > CO > > > CO Wo wo CMOf WO Of Of Of Of cn Of Of *o wn Of o wn wn 6 06’G 8 f
15 aa q u m M ju a u ia jE is Of wo > > > fN *o *n > > > CO Wo > wo wo Wo WO - Wo Of Of CM Of Of Of Of Of wn Of o Of Of oecrfr fE
0 5 J sq u m M lu am ajB JS *o > > > *o WOWo CO > OC WOWo WO Of Wo Of Of w-> Wo Of Of Of wn Of wn o wn Of s w * £
6 t» ja q u m jq ju a u ia jE JS WO > > > > > *n > <o *n Wo wo Wo > Of wo Wo wo wo Of > Wo WO Of Of Of wn Of wn wn Of Of DOS’* V8 (7. ja q u m jq ju au ia jE JS wo *n •o > > > > > cm > CO > > > WO Of Wo CO CO Wo Of Of cm Of cn Of Of Of Of Of CMOf cm tS B T 0 9
L p j a q u m N j u a u r a m s wo of > > > > > > Wo CO Wo Wo WOOf wo Wo Of Wo Of Of Of Wo cn Of > wn wn Of wn Of Of *Z£*t 51
g p j s q t n n ^ lu a m a iu is > cn > > > > > o **n <N > - > > Of Of - Cm Of Of Of Of Of cn Of cn Of Of Of cn Of o s s r e Z5
5 P j a q u in N ju am ajE JS wo > > > > > > o > cm CO > cm > Of Wo • - Of Wo Of Of cn Of cn wn Of Of Of Of Of Of CM L Z L 'Z W
(7(7 jo q o m M ju a u ia jB is of <N > > > > <N >o > > Wo > CO wo Of WO CO Of > Of Of Of cn w-i Of Of Of wn wn Of Of 630** 5 '9 £
£ p Jsq iim M ju am ajE JS wo > > > > > »o > > wo Wo > > > Wo WOWo Of Of Of Of Of wo cn Of Of wn wn Of wn Of CM S£3** £2
2(7 j s q u m N ju a m a jE JS °n >3- > > > > <N > > > > cm > > wo wo Wo Of Of CMOf CMcn cn Of cn Of Of Of cn cn o 9 0 9 ? 9 5
1(7 j a q in n ^ i j a a u i a m s > *n > > > fn <n > > > wo > > Of Wo Wo Of Wo Of Of Of Of Of wn Of Of Of Of Of Of CM m * * 6 2
0(7 ja q u m ts i ju a m a iE is > > > > > >* > > <o > CO wo > wo Of wo Of CO WO Of Of o Of Of Of Of Of Of Of Of Of CM QZ6T n6 £ ja q tm iM j u a m a r a s wo > > > > > > > > cm > O* Of Wo CO Of Wo Of Of Wo Of cn Of Of Of Of Of wn cn cn 3 1 6 ? S '9 t-
8 £ jaqu in fv j ju au ia jE JS > > > > > > > >5- >o »o > WOwo > WO wo wo Wo Of wo Of Of wo Of cn Of Of wn wn Of Of Of CM *63** S Z 1
L I ja q u m jq ju au ia jB JS > > > > > > > > Wo > 'M- wo Of WO CO Wo Of Of o Of Of > Of Of Of CM Of cn CM 000** S '6 E
9 £ ja q tn n M ju a u ia jE JS > > > > > > > > > <N > CO Of Of CO Of Of Of Of cn Of Of Of cn Of Of wn Of Of Of 316? U 9S £ la q u m jq (u a m a iE JS wn > > > > > > Wo wo WO > >9* wo wo Wo WO WO Of Of wo Wo Of Of > wn wn Of wn wn Of 6SS** z(-£ ja q u m jq ju a tu a jE JS of > > > > ‘O •o > > Wo o CMo CO Of WOCO CO Of CMOf Of Of Of Of Of Of Of cn O Of CM 9 0 8 ? £ 5
£ £ ja q u in jq ju a u ia jE is wn > > *n > > > CM> OJ- Of Wo CO Of Wo Of Of cn Of Of wn Of Of Of Of Of O cn 0Z6? n2 £ ja q u m M ju a u ia jE is wn > > fn *o > Wo WO> > Of WOwo Of Wo Of Of Of Of Of Of cn wn wn Of Of Of cn 9zr* 9 2
I £ ja q u m ^ q ju a m a jE jg of > > > > > > > > wo wo WOCO WO Wo WO Of Wo CMOf WO Of Of Of Of Of Of Of wn Of cm zn** 6 2
0 £ ta q u in M )u a u ia )E )s > > > > v-» WOwo WOWo oa- wo Wo Wowo Wo Of Of CMwo Of Of Of wn wn wn wn Of wn 31*** S‘66 2 Jaq u m M ju am ajE JS > > > > > > > > > > > CM> OJ- Of WOCO Of Wo CMOf Of Of Of Of Of cn cn Of wn Of CM * 3 8 ? 2 5
8 2 J a q u m ^ ju a m a jE JS > > > > > > > >o > > > > > WOwo Wo Of WO wo CM Of Of Of Of Of Of cn cn cn wn Of cn 630** S '9 £
L i ja q rn n M ju au ia jE JS wo > > > > *n > Wo WOWO > Of wo Of wo WOWo CMOf wo Of Of Of Of wn wn Of wn Of Of W * S ‘9
9 2 ja q u m ^ q ju a u ia jE is > > > > > <n > > > > > > WO> WOWOWo Wo Of WOCm Of Of Of Of Of Of wn wn Of Of Of CM 8U"* 1£5 2 ja q u in N jn a u ia jE is of > »o > > > > CO WO> > Of Of Wo Of Of Wo cm Of cn Of Of Of Of wn wn Of Of Of Of 000** S'6£P Z Jaq u m tsi jn am ajE JS wn > > > > > > > > > WOWo > Of wo Wo Wo wo WOOf Of Of WO Of cn Of wn wn Of wn Of wn 31-*** S'6£2 ja q u m M ju au ia jE JS wo > > > > > wo wo Of WOWOWO wo wo Of Of wo wo Of Of Of wn wn wn wn Of Of 819** I2 2 Ja q u m jq ju au ia jE JS > •o > > > > CO > > > wo Of Of wo Of Of wo CM> Of wo Of Of Of Of Of Of wn Of Of 880** 2 £
12 ja q u in M ju au ia jE JS of *o > > > <n > > > CO > WOWo Oj* wo wo WO wo wo Of Of CMWo Of Of Of wn wn Of wn Of wn *3f* H0 2 ja q u in (q ju a u ia jE is of > > > > > > <N > CO > CO > > CO Of Of wo wo wo CMOf cn Of Of cn cn Of O cn Of cn Of Z 6 9 ? 5 5
61 J a q m n jq ju a u ia jE is > > > > fn > > *o > > > > WO > Of Of Wo Of Of WOcm Of Of > Of cn Of Of Of Of Of cn cn U 6? S 'If81 ja q u m jq ju a u ia jE JS of > > > > Wo WOWO> Of wo wo wo CO Of Of Of Cm Of Of cn Of Of Of Of Of Of cm 3 8 8 ? 6f21 j a q m n jq ju au ia jE JS of •n > > >o **» > »o > wo > > wo WOWOwo WO Of wo Of Of Cm WO Of Of Of wn wn wn wn Of wn W * S '9
91 ja q m n js i ju a u ia jE JS > > > **> > > > > > > Wo wo CO Wo WOCMWO Of Cm Of Of Of cn «N cn Of Of Of Of cn wn * 3 8 ? IS51 r a q u in ^ j ju a u ia jE is wo > > > »o > > CM> COWo > CO Of Wo Of Of Wo Of Of wo Of cn Of Of wn wn wn Of wn Of 9 Z r * 9 2
p i jaqmnM juauiajEJS wo > > > > O > CO> WOWo WO Of Of WOWO wo Of Of Of cn Of Of wn Of wn wn Of wn wn Of *68’* n£1 J a q u m jq juauiam s wo > > > > > > »o COCO > Wo Wo CO Of Of Of Of Wo Of Of cm WO Of wn Of Of Of Of wn Of Of Z H ’* 6 2
21 ja q n m M ju au ia jE JS wo > > > CO > > Wo WO Of wo Wo WO wo Wo Of Of WO Of > wn Of wn wn Of wn Of CM >Z*‘* 5
11 ja q u m fq ju au ia jE JS wo > > > •o > > > > CO > > wo > Of wo wo Of Of o Of Of CMOf Of Of Of Of Of Of Of Of CM 0 Z 6 ? W
01 j a q u m fq ju a u ia jE is wo > > > co > wo > > Wo wo Wo Of Of Of Of Of cn Of o wn wn wn wn Of cn wn wn *3*’* 8
6 J a q m n jq ju au ia jE JS wo > > > > CM> > wo > wo CO CO wo WO WO Of Of W-) Of cn Wo Of cn Of Of Of Of wn Of CM 6 5 0 ’* ££8 ta q u m jq ju au ia jE JS wo > > > *n *n > > > wo WO> Of > Wo WO wo Wo Of Of Of Wo Of CMOf Of Of wn wn Of Of S9Z** 22
L ja q m n jq ju au ia jE JS WO> > > »n "n > > > > > WO > Of Of Of WO Of Of Of Of Of WO Of Of wn wn wn wn wn Of wn *63** S 'Z l
9 ja q u m jq ju a u ia iE is wo > > > > > > > > > > COWo COOf WOWo WO Of Of o Of cn Wo Of Of Of Of wn Of wn Of Of 3 8 1 ’* U
5 ja q m n jq ju a u ia jE is WO > > > > > > > > *o > > wo > Of Of wo wo Of wo CMOf CMwo Of cn Of Of Of Of Of Of Of 6 3 0 ’* S '9 £
p jaquin^i juauiajEJS WO > > > >o > > *o <n > > > WO Of wo Wo Wo WO Of Of Of Of Of cn Of Of wn wn CMwn wn CM 9zr* 9 2
£ ja q tn n jq ju a u ia jE is Of > > > > > o wo > wo > Wo Of wo Wo Of Of Of Of Of Wo cn Of Of wn wn Of Of Of Of CZ3’* 022 ja q tn n js i ju au ia jE JS Of > > > > > 'n o > > Wo > wo WO Of WO Of Of Of Of Of Wo Of Of Of wn wn Of ‘o Of CM 8Z3** 02I j a q t u n M j u a u i a j E J S wo > > >9* > WOWOo wo wo Wo WOOf WO WOOf Of Of wo Of Of Of Of Of Of Of wn CM 888’* £1
Res
pond
ent
Num
ber
- (N c n r f vO r - 00 ON o - (N CO wo VD 00 OS oCM s
CMCM
c nCM CM
woCM
s oCM CM
00CM
OnCM
©c n c n
CMc n
c nc n
TJC*"
Ave
rage
to
each
stat
emen
t*
Ran
ks
223
NotC
' 1.
The
state
men
t nu
mbe
rs
corre
spon
d to
the
orde
r of
the
ques
tionn
aire
2. Re
spon
dent
s we
re
aske
d to
rate
57se
ismic
ris
k m
anag
emen
t st
atem
ents
the
y co
nsid
er i
mpo
rtant
to
be ca
rried
ou
t in
Indo
nesia
n cit
ies
loca
ted
in hig
h se
ismic
ha
zard
(5
=v.im
porta
nt;4
=im
porta
nt;3
”nor
,2=n
ot i
mpo
rtant
;l=ab
solu
tely
no
t im
porta
nt;0
*don
,t kn
ow)
3.1.
19%
of
resp
onse
s sta
ted
'O' (
don't
kno
w)
*) Th
e m
ean
scor
e of
all s
tate
men
ts
is 4.
137
(bet
wee
n im
port
ant
and
very
impo
rtan
t)

Table 8.3 describes a summary of overall means and percentage of ’O’ or ’don’t know’
responses, whereas Table 8.4 presents a summary of ranks among respondents by category.
The descriptive analysis in this research uses table format to compare items of various
groups in terms of mean scores, ranks, and percentages.
Table 8.3 Summary of average respondents’ mean scores and percentage of ’don 7 know' responses
StatementNumber
SI* 4.903 4.714
1
b
4.333
l
4.700
|
m4.813 4.556
NG
Os
Com
mun
ityLe
ader
s 1 Over
all
1 me
an
score*
* J
4.833 4.633 4.545 4.699■ S2* 4.414 4.396 4.273 4.448 4.567 4.353 4.483 4.222 4.031 4.415
S3* 4.393 4.396 4.273 4.536 4.567 4.353 4.536 4.214 4.469 4.443S4* 4.516 4.306 4.176 4.400 4.281 4.143 4.733 4.367 4.212 4.368S5* 4.207 4.122 4.029 4.300 4.188 4.028 4.400 4.000 4.182 4.169S6* 4.194 4.184 4.182 4.333 4.188 4.194 4.633 3.966 4.344 4.256S7 4.258 4.143 4.294 4.448 3.967 4.147 4.700 4.300 4.576 4.332S8 4.161 4.163 4.265 4.300 3.833 4.086 4.633 4.133 4.424 4.247S9 4.226 3.918 4.059 4.379 4.125 4.088 4.467 3.967 4.455 4.197
S10* 4.645 4.551 4.424 4.367 4.469 4.083 4.533 4.033 4.333 4.417Sll 4.290 4.143 3.970 4.143 4.156 4.200 4.448 3.767 4.030 4.168S12 4.290 4.490 4.471 4.500 4.156 4.343 4.586 4.357 4.273 4.418S13 4.032 4.163 4.147 4.250 4.188 4.250 4.467 4.069 3.636 4.216S14 4.233 4.347 4.394 4.345 4.094 4.194 4.429 4.267 3.758 4.302S15 4.065 4.286 4.176 4.267 4.156 4.417 4.567 4.167 4.485 4.303S16 3.710 3.755 3.824 3.862 3.750 4.143 4.400 3.800 4.000 3.947S17 4.097 4.000 4.441 4.200 4.219 4.222 4.467 4.167 4.485 4.257S18 3.903 3.939 3.882 4.034 3.774 4.222 4.133 3.833 4.121 3.997S19 3.903 3.857 3.971 3.933 4.063 4.114 4.241 3.933 4.121 4.033S20 3.710 3.592 3.697 3.750 3.774 3.944 3.800 3.433 4.061 3.773S21 4.226 4.102 4.324 4.133 4.063 4.278 4.400 4.200 4.212 4.238S22 4.129 4.082 4.088 4.133 4.031 4.306 4.500 4.167 4.424 4.214S23 4.419 4.396 4.618 4.333 4.438 4.500 4.633 4.286 4.333 4.485S24 4.258 4.041 4.412 4.100 4.438 4.400 4.500 4.133 3.939 4.265S25 4.000 4.224 4.000 4.367 4.219 4.278 4.333 3.767 4.545 4.211S26 4.387 4.388 4.118 4.467 4.375 4.194 4.533 4.033 4.545 4.352S27 4.355 4.327 4.441 4.367 4.438 4.167 4.533 4.100 4.545 4.389S28 4.323 4.265 4.029 4.267 4.281 4.222 4.433 4.067 4.515 4.280S29 4.161 4.306 3.824 4.100 4.375 4.265 4.467 4.167 4.515 4.258S30 3.806 3.939 4.412 3.833 3.875 4.057 4.533 3.833 4.091 4.053S31 4.065 4.082 4.147 3.867 4.094 4.171 4.267 3.767 4.152 4.099S32 4.419 3.918 4.176 4.100 3.938 3.778 4.433 3.833 4.121 4.079S33 4.194 3.857 3.970 4.100 3.875 3.806 4.200 3.967 4.182 4.017S34 3.774 3.837 3.806 3.900 3.969 4.000 4.207 3.655 4.061 3.936S35 4.065 4.163 4.559 3.933 4.125 4.083 4.533 4.000 4.273 4.207S36 3.968 3.816 3.912 3.966 3.969 3.912 4.214 3.500 3.636 3.922S37 4.258 4.000 4.000 4.034 3.875 4.111 4.133 4.000 4.424 4.103S38 4.387 4.347 4.294 4.267 4.000 4.200 4.467 4.367 4.364 4.314S39 3.903 4.224 3.912 4.133 3.844 4.028 3.933 4.067 4.152 4.046
224

Table 8.3 continued
. S40 4.194 4.082 3.970 4.103 3.844 3.917 4.276 4.179 4.212 4.107S41 4.000 3.918 4.147 4.067 3.938 3.824 4.167 4.033 4.212 4.040S42 3.581 3.750 3.606 3.867 3.938 3.943 4.067 3.793 3.939 3.866S43 4.194 4.245 4.235 4.133 3.906 4.139 4.267 3.800 4.212 4.148S44* 4.065 4.265 4.029 4.100 4.063 3.972 4.333 3.967 4.091 4.118S45* 3.710 4.061 3.727 3.900 3.719 3.972 4.300 3.733 3.909 3.927S46* 3.774 4.000 3.455 4.067 3.750 4.000 4.167 3.733 3.636 3.913S47 4.194 4.167 4.324 4.133 4.031 4.083 4.267 3.933 4.242 4.168S48 4.161 3.875 3.853 3.867 3.844 3.833 4.300 3.933 4.152 3.983
. S49 4.129 4.224 4.500 4.167 4.125 4.114 4.533 4.233 4.152 4.254S50 4.452 4.449 4.545 4.300 4.531 4.371 4.667 4.433 4.545 4.505S51 3.355 3.816 4.030 3.900 3.781 3.886 4.233 3.793 3.636 3.850S52 3.500 3.898 3.909 3.767 4.000 4.028 4.133 4.200 3.848 3.947S53* 4.355 4.388 4.273 4.467 4.313 4.306 4.552 4.333 4.333 4.395S54* 4.133 4.143 4.029 4.133 4.063 4.000 4.367 4.000 3.939 4.117S55* 4.194 4.490 4.303 4.400 4.406 4.250 4.167 4.345 4.424 4.383S56* 3.968 4.188 3.971 4.100 4.125 4.194 4.333 4.167 4.000 4.159S57* 4.194 4.265 4.382 4.333 4.313 4.333 4.600 4.333 4.485 4.368
Average 4.132 4.145 4.137 4.170 4.109 4.140 4.399 4.184 4.308 4.187
% of ‘O’ responses
0.62% 0.36% 1.19% 0.99% 0.55% 1.36% 0.88% 1.11% 2.55% 1.05%
*) technical intervention statements**) The overall mean score was calculated by adding all the respondents’ opinions or scores within the related
statement and then dividing by the number of respondents, excluding the number of respondents who stated ’O’ or ’don’t know’ response(s).
Table 8.4 Summary of average respondents’ ranks
StatementNumber
si* 1 1
|
U -i
13 1l1 1
1
1
I Com
mun
ity
| Le
ader
s
4
Overallrank**
J
S2* 7 7 20 6.5 2.5 6.5 21 13 44 7S3* 8 7 20 2 2.5 6.5 12 14 12 4S4* 3 14.5 26 8.5 14.5 29.5 2 3.5 28 11.5S5* 22 33 36.5 19 19 42 32 33.5 31.5 31S6* 26 25 24 16 19 23.5 6 39 19 22S7 17 31 17.5 6.5 40 28 3 9 1 14S8 31 28 22 19 51 36 6 23.5 15.5 24S9 20.5 46 33 10 25.5 35 24 37 13 30
S10* 2 2 8 12 5 38 15.5 30 21 6S ll 14.5 31 44 27 22 20.5 27 51 45 32.5S12 14.5 3.5 5 3 22 8 9 5 23.5 5S13 41 28 29 24 19 15.5 24 26 55.5 26S14 19 11.5 11 14 28.5 23.5 30 11 53 17S15 38.5 16 26 22 22 3 10 20 10 16S16 53 55 51 54 55.5 29.5 32 46.5 46.5 49.5
225

Table 8.4 continued
S17 36 41 6.5 25 16.5 18 24 20 10 21S18 47 43.5 49 43.5 53.5 18 53 44 38 47S19 47 50.5 41.5 46.5 31.5 32.5 44 41 38 45S20 53 57 55 57 53.5 49 57 57 42.5 57S21 20.5 34 14 30.5 31.5 12.5 32 15.5 28 25S22 34.5 36 32 30.5 34.5 10.5 19.5 20 15.5 27S23 5.5 7 1 16 7 2 6 10 21 3S24 17 39 9.5 37.5 7 4 19.5 23.5 49 19S25 42.5 22 39.5 12 16.5 12.5 36 51 4 28
• S26 9.5 9.5 31 4.5 10.5 23.5 15.5 30 4 13S27 11.5 13 6.5 12 7 27 15.5 25 4 9S28 13 18 36.5 22 14.5 18 28.5 27.5 7.5 18S29 31 14.5 52 37.5 10.5 14 24 20 7.5 20S30 49 43.5 9.5 55 46 40 15.5 44 40.5 42S31 38.5 36 29 52 28.5 26 42 51 34.5 40S32 5.5 46 26 37.5 42 57 28.5 44 38 41S33 26 50.5 44 37.5 46 56 48 37 31.5 46S34 50.5 52 53 49 38.5 45 15.5 55 42.5 51S35 38.5 28 2 46.5 25.5 38 17 33.5 23.5 29S3 6 44.5 53.5 47 45 38.5 52 46 56 55.5 53S37 17 41 39.5 43.5 46 34 53 33.5 15.5 39S38 9.5 11.5 17.5 22 36.5 20.5 24 3.5 18 15S39 47 22 46.5 30.5 49 42 56 27.5 34.5 43S40 26 36 44 34 49 51 40 17 28 38S41 42.5 46 29 41.5 42 55 50 30 28 44S42 55 56 56 52 42 50 55 48.5 49 55S43 26 20 23 30.5 44 31 42 46.5 28 35
S44* 38.5 18 36.5 37.5 31.5 47.5 36 37 40.5 36S45* 53 38 54 49 57 47.5 38.5 53.5 51 52S46* 50.5 41 57 41.5 55.5 45 50 53.5 55.5 54S47 26 26 15 30.5 34.5 38 42 41 25 32.5S48 31 49 50 52 49 54 38.5 41 34.5 48S49 34.5 22 4 26 25.5 32.5 15.5 12 34.5 23S50 4 5 3 19 4 5 4 2 4 2S51 57 53.5 34 49 52 53 45 48.5 55.5 56S52 56 48 48 56 36.5 42 53 15.5 52 49.5
S53* 11.5 9.5 20 4.5 12.5 10.5 11 7.5 21 8S54* 33 31 36.5 30.5 31.5 45 34 33.5 49 37S55* 26 3.5 16 8.5 9 15.5 50 6 15.5 11.5S56* 44.5 24 41.5 37.5 25.5 23.5 36 20 46.5 34S57* 26 18 12 16 12.5 9 8 7.5 10 10
*) technical intervention statements**) The overall rank was assigned by converting the highest overall mean score (see Table 8.3) into ranking
number one, the second highest was ranking number two, and so on.
In a more general way which is easier to assess, the nine categories o f respondents are then
divided into two main groups according to the nature of their duties, Groups A and B. Group
A are researchers/scientists, contractors, and foremen who might closely relate to technical
226

intervention statements (those who are somewhat familiar with the concept o f building
construction, design, and seismic phenomena), whereas Group B are government staff,
businessmen, educators, NGOs, community leaders, and reporters who might closely relate to
non-technical intervention statements. From Table 8.5, they can be arranged further to be the
’fifteen most important seismic risk management statements’ (Table 8.5) and the ’fifteen least
important seismic risk management statements’ (Table 8.6), that all community members in
Indonesian cities should take into consideration.
227

Tabl
e 8.5
Fi
fteen
m
ost
impo
rtan
t of
seis
mic
ris
k m
anag
emen
t st
atem
ents
uo-Meao'Oc
o«ucsJSUCm
o
*03Pm
X aj
o x
CO , 2S.x* c« 3cC3 co
•a il 1 aE o l 3 x to "C>> SC/3 3Cm O O *X 3 52 o 3£ 3C/3 X
x £W D.
3 W bO c 3I- X Cm 73 O 3 CL) - O
3 C o 3 to .CO
= 1co 3—' X to D. 3 3 1■O MlO T3° sO «E i ico co
o
o 5 «o u f S313 jf- •o “ o x E oCm C O —'M «« t3 E = .3 D-c If1 2 CmO 123 o 3 Ms ssx « W £
3 "3 »o M
§)"§) U C 1-1 3
c 2 6 3 C
X Cmo. ©3 3
•3 X)5 E
•a §U OS* 2: gt3 E *2 ■a § "H &0 3 3 J3 3 *33 i i1 5*o S
is,3 M > 3 ■e *3 .
• — M •co O 50 c.E ’•3 3? 72 'm3 3•° 3 ••a cjS ’■£ ’3 i • 8 ^ Eo {33 co .CL CO :
— 3 .o 8 CO 3 . U 3 13
CL,
X!U
W) 3
12 1313 is3 co
I -• in — o « -a x • S e x3 uis co' ~3 3
•3 Xo .52
3 1 So -g «» o „ *3 3 e ' o■a
3 3 ° c rjs o
X 3= CL
3 .52 2 pj x Ph
§E3X
3 3
i j1 sM-< (Jc-S2 bS3 .sM S*3 EX 3c >3 X3 c 2 cM 3N ”3 .22 H0 3 3E * ? S
5 2co C O c-o
CLEoU
3 CL| X
O
co3Oe3
.SP e *0 E .2 c•C 3’S EC 3.2 JZ x o x >2 .S ^H—* COCm .52 X O X o3 2 *3S E E ^ x .312 M 3§ 3 w O tsOg £ . s
X 11 33 a .2
E GS Ic -S
•3 *0E i i3 >CO ^co O
5 ison 1BJS
228
*) te
chni
cal
inte
rven
tion
stat
emen
ts
Not
e:
Grou
p A
are
rese
arch
ers,
cont
ract
ors,
& fo
rem
en
(clo
sely
re
lated
to
tech
nica
l in
terv
entio
n st
atem
ents
) &
Grou
p B
is cl
osel
y re
lated
to
non-
tech
nica
l in
terv
entio
nI =
aver
age
of re
spon
dent
s’ op
inio
n an
d II
= ra
nk

Tab
le
8.6
Fifte
en
least
impo
rtan
t of
seism
ic ris
k m
anag
emen
t st
atem
ents
O03U«JCUo»_'ejCM
e>03O
O =3 A! "C2 *0 §*•* Jc ° « s03 E W .
33 l> X3 Gj'55 E 'C o
1CO0)CO
, 2 CO
2 8 o s"O —O 03•5 8<u —•a JBs ~oCO .
■g 'Cd :
• O .!
5 1C3CO
S3
OGH &-g 3CL, m cd co
5 ft] ^ oo
.&*5CO
12 *| JJ u c >^ *35>3 cW) o 3 x: o uL_ I ij= a
1 .2 8 i_ _° ^E ato o’5 gCO - QbO O.S S3§•? •a<o - 2 3 HtH lHO I© - o > ^
CO .2 W XWD. W
c wrr* kt
3 co — (U co ’3 O 3 •a co O GO i_.2 xE o•gsG 2S.E3 -3c s3 .3 O ~c5 O 3 O 'S bOu .E 8 -2
flj CO•C .JJ O 5 cdo .>Cm O O cdJ2 ce-sjj 2M CO
<M .h O O(U *5g wJ« r * *-« w 6
TO Wrf' &)o w■3 W3 g
3 *©w P
^ o5 o .2 <u .ts o c3 32 E■a Iw 8
00
E I
Cm o© C-o o c 5/3g g.S2 5*5 ^ w cE
c3J3u
oG•a333O C 3 o2 EU 3J G O9 u
><u
Oa
^ § u .E5 to o Q.
JO . -
'> C3 3V Gl
3a*3t:3W
1.2 5 CO oO o
3 wZ J3„ O*3 E U U1 uh—J l l
3E
—r co
■c Eo .2 to §I*8C oE E(D ^ti C u— o’S ^5 <DTO cod S
3,5 E
OO
^ gu .2 'o 13O D- J O . j j
u a
CO3o8<D.£P ©T3 *jn■S e< <u 3 E8 U.2 JZ
S o *o >2 .S■‘-1 n-t 1/3g .2 'Co 3 uO 2 .22 E E
-e .2 •a m S§ = 00 O M*3 m 88 Pn O .2 3?'EE « 3 <u ^ E co o E Q M 8
3O8cj.SP © -a 'r; .E 8< CJ8 E8 aj O >
3 Cfi ■ TOo *3u 22 E
“ o Mlo ^ - B*5 85 2n -.E ^ - E «V >1,3 ^ co O5 J
ON 'rosOl
229
') te
chni
cal
inte
rven
tion
stat
emen
ts
Not
e:
Grou
p A
are
rese
arch
ers,
cont
ract
ors,
& fo
rem
en
(clo
sely
re
lated
to
tech
nica
l in
terv
entio
n st
atem
ents
) &
Grou
p B
is cl
osel
y re
late
d to
non-
tech
nica
l in
terv
entio
nI =
aver
age
of re
spon
dent
s’ op
inio
n an
d II
= ra
nk

From analysis o f the results shown in the above Tables 8.2, 8.3, 8.4, 8.5, and 8.6, the following
comments and interpretations emerge:
a. Based on the general responses and their mean scores, most respondents attached a high or
very high importance to the seismic risk management statements to be carried out in
Indonesian cities. This evidence is gathered from the following findings:
i. In total, based on overall responses o f 17,385 (see Appendix-4), the number of
responses which have a score o f 4 (important) and a score o f 5 (very important) to
statements mentioned in the questionnaire is 14,666 or about 84.36%. Moreover, the
overall average mean score is 4.187, between important and very important.
ii. Taking an average o f the mean scores over all fifty-seven statements, it reveals that
every group of respondent has an average mean score o f more than or equal to 4 (see
Table 8.4). The highest average mean score is 4.399, which came from Non-
Govemment Organizations; on the other hand the lowest is 4.109, which came from
businessmen. Surprisingly, the difference in average mean scores amongst nine groups
o f respondents is very small and there is not a very extreme result in the overall
responses.
iii. According to the summary mean scores in each statement, the highest mean is 4.699,
which is in ‘earthquake occurrence data’ (SI). In contrast, the lowest mean is 3.773,
which is in ‘civil society, NGOs, private sector and community participation’ (S20).
Although the mean score o f 3.773 is the lowest, the number o f respondents who
placed score 4 or 5 in S20 were 200 out o f 305, or about 65,6% (see Appendix-4).
This means that most respondents still assigned high importance to S20, even though
the statement is in the lowest rank.
The three findings above have proved that the content o f ‘the first draft o f the proposed
framework’ which consists of 57 statements, has been highly validated or authenticated by
305 respondents and the respondents have placed a high importance on all the statements to
be carried out in Indonesian cities.
b. Going back to Table 8.4, the majority o f the respondents expressed ’0’ or ’don’t know’
responses in response to only a very few questions, i.e. 182 out o f 17,385 responses or 1.05%
(see Appendix-4). The lowest percentage came from small-medium contractors, which is
0.36%, on the other hand the highest came from Reporters, which is 2.55%. This low
percentage of ’don’t know’ responses might be related to the simple language used in the
questionnaire, so most respondents were able to easily understand when answering the
questions and only 1.05% of responses were’don’t know’.
c. According to the ranks in Table 8.5, the most interesting result comes from ’earthquake
occurrence data’ (SI). Seven groups o f respondents out o f nine generally agreed that SI was
230

ranked first. Only Foremen and Reporters indicated the first rank was not SI, but S23
('resource mobilization for expert staffing allocation') and S7 ('reducing seismic risk as a
priority policy') respectively. In overall, SI was ranked first. In a similar vein, four groups
o f respondents ranked S20 last and, in overall, S20 is indeed ranked last. Between the first
and last ranks, the remainder o f ranks for each statement were scattered fairly and evenly
with no evidence o f a pattern.
d. Based on Tables 8.6 and 8.7, comparison to mean scores between Group A and Group B, the
difference is definitely very small. Similar results to the above ’Point c ’ apply to both Group
A and Group B, who ranked SI ('earthquake occurence data') and S20 (' civil society, NGOs,
private sector and community participation') first and last respectively. Further analysis o f
this result will be conducted in the next section: Spearman ’rho’ ranking correlation.
e. Based on Table 8.6, most respondents considered that the most important statement is SI (a
technical intervention statement): i.e. 'earthquake occurrence data' and the average mean
score is 4.699. This finding might be influenced by the current situation; earthquake data is
never disseminated to people in Indonesia, as elaborated by Chandra et al (2004). Therefore,
people are very eager to understand the seismic hazard in detail and therefore put this
statement at the highest priority.
f. Surprisingly, ‘existence information for pro-poor strategies’, S50 (a non-technical
intervention), is in the second rank. Probably, the high proportion o f poor in the
communities who are very vulnerable to disaster hazards in Indonesia are easy to find in
every city. This might be why most respondents assign this matter a very high priority;
however, reverse is true for government staff, whom do not regard it as highly important and
assigned a low rank o f 19.
The following interpretations are based only on Table 8.6 (the 15 most important statements):
a. Among the 15-most important statements in Table 8.6, there are eight statements related to
technical intervention (out of 15 technical intervention statements) and seven statements
related to non-technical intervention (out o f 42 non-technical intervention statements). Most
o f the eight technical intervention statements came from core areas o f ‘Seismic Hazard
Analysis’ and ‘Physical Measures’. Indeed, it might indicate that most people in Indonesia
assign the highest priorities to such technical intervention activities to be implemented in
Indonesian cities, whilst non-technical interventions were also an important factor to be
carried out. Traditionally, in order to reduce the physical vulnerability o f non-engineered
buildings by introducing seismic features, it is well known that researchers, scientists, .
contractors, foremen, and construction workers should be in the forefront o f change. Today,
a new paradigm shift has proved that a combination o f technical and non-technical
intervention is an important factor as a fundamental element in the wider context o f disaster
231

reduction; even political commitment, as a non-technical measure, should be o f the highest
importance (UNDP, 2004). Here, the combination o f the two has emerged clearly, even
though technical intervention is still in the majority.
b. As mentioned in UNDP (2003): a ‘lack o f wider political commitment to disaster reduction
is often stated as the main barrier to progress in implementation’, hence it was expected that
the importance of government commitment (S7) as a non technical intervention would be in
the highest rank. Here, the findings are that only Reporters assigned the highest rank to the
importance o f government commitment (rank number one), and the overall responses to S7
as ‘government commitment’ gave it little support, attaining the low rank o f 14. It is true that
the structure o f the Indonesian government is still fragile. Everyday needs o f citizens may
detract attention from this circumstance and definitely, when discussing the implementation
o f seismic features, people tend to focus more on physical measures o f seismic risk
reduction and seismic codes (technical intervention) rather than on political issues. This
finding ties in closely with the earlier result in ‘Point a’.
c. From the 15 most important statements in Table 8.6, it is generally accepted that many
statements need a strong engagement and large responsibility from the government,
researchers, scientists, small-medium contractors, and foremen in the actual actions. The role
o f government is very crucial in many areas, e.g. ‘generating political w ill’, ‘pro-poor and
livelihood strategies’, ‘compliance and enforcement o f seismic codes’, and ‘dissemination
programmes’. The involvement o f researchers/scientists in ‘earthquake data’, ‘earthquake
scenario’, ‘seismic code’, and ‘land use application’ is very urgent, while contractors and
foremen can participate actively in ‘good examples in real construction’.
d. In a similar way, it was expected that ’damage assessment’, S6 would be considered o f high
importance, as demonstrated by the good example from the Government o f Nepal (see
Chapter V), who made this activity their first action and the foundation for reducing the
earthquake threat in the Kathmandu Valley (ADPC, 2000). Here, the importance o f ’damage
assessment’ is considered to be a little lower: it is ranked at number 22 and only Non-
Govemment Organizations accorded it high importance, giving it a high rank o f 6. The
reluctance o f most respondents to give ’damage assessment’ a high importance may,
presumably, be based on a lack o f knowledge as to the purposes and scope o f the statement
in real activity. Based on the literature available in Indonesia, it is widely agreed that
damage assessment prior to a strong earthquake event is relatively new to seismic
researchers or scientists, even for the community as a whole.
e. There was significant disagreement between Groups A and B on ’seismic codes’, S10.
Group A assigned it as highly important, according it the rank o f 2, while Group B regarded
it with little support in the rank o f 15.
232

f. Among the 15-most important statements, many were arranged at the end section o f the
questionnaire, such as Statement Numbers 50, 53, 55, and 57, and in fact, the responses to
the statements were very high. This might indicate that respondents were not fatigued when
answering the questionnaire and the data could be considered to be high quality.
The following comments are focused only on Table 8.7 (the 15 least important statements):
a. According to the 15 least important statements, there is no significant disagreement between
Group A and B regarding the ranking. S20: ‘Civil society, NGOs, private sector, and
community participation’ was assigned the least rank and the mean score is 3.731. In
general, the majority o f the 15 least important statements appear to illustrate an aspect o f non
technical intervention, where the involvement o f many related parties, excluding government
officials such as civil societies, NGOs, the private sector, and teachers in reducing seismic
risk is reasonably less important. Although the statements in Table 8.7 are the 15 least
important statements, their mean scores are still high, and most repondents (more than 65%)
still considered that it is important or very important to be carried out in Indonesia (see
Appendix-4).
b. Other unfavourable statements within Table 8.7 are financial instruments such as incentive
strategies and insurance initiatives (S51 and S52). Both Group A and B expressed the same
view. The low level o f importance in this matter might come from the fact that safety
consideration o f seismic risk is still not a high priority among people in Indonesia and,
obviously, they are overwhelmed with basic needs such as food, shelter, and health in the
first place rather than focusing on rare visitations o f earth tremor.
c. Also, the respondents in this survey assigned less importance to seismic safety programmes
as an integral part of school awareness strategies (S33 and S42). On the other hand, based on
the general assessment from the majority o f literature, the understanding o f this is increasing
in many countries.
In conclusion, extracted from the findings from 15-most and 15-least important statements, the
content of ‘the first draft o f the framework’ clearly reflects the multidimensional and inter
disciplinary nature o f seismic risk reduction as a substantial key to sharing efforts and
responsibilities before disaster strikes. In this respect, more actions are assigned high importance
in technical intervention than non-technical. Although the content o f the questionnaire is
designed for non-engineered buildings, most o f the principles stated herein will also conform to
engineered buildings with equal importance.
233

8.1.3.2 Calculation of Spearman irhoi Correlation among Respondents by Category
This section focuses on the inferential statistics method, where analysis entails the comparison of
results for different categories o f data collected, particularly to carry out a statistical significance
test on the difference between the proportions. According to the ordinal number employed in the
scoring value, the Spearman trhd‘ correlation is employed to provide an indication that there is a
relationship between the two categories of respondent. Because there are nine categories of
respondents, obviously, there are 36 pairs of correlation between each two categories of
respondent. The step-by-step calculation o f the Spearman ‘rho’ correlation between contractors
and foremen is selected, for example (Table 8.8), and the assistance o f SPSS software is
employed in this matter. The overall correlation is shown in Table 8.9 as the output o f SPSS
software.
Moreover, distinguishing between technical and non-technical intervention, the nine categories
then are divided into two groups, Groups A and B. Firstly, researchers/scientists, contractors,
and foremen are formed into Group A, as their main duties are closely related to the term o f the
technical intervention. Secondly, government officials, businessmen, educators, NGOs,
community leaders, and reporters are arranged into Group B where non-technical activities are
most suited to their duties. Here, the two groups are compared and analyzed. The comment and
interpretation o f this correlation output is then discussed in the next explanation.
a. Correlation between contractors and foremen as an example
The research question:
Is there any correlation between Contractors' and Foremen's opinions towards ‘Seismic Risk
Management Statements’ as stated in the questionnaire?
The research hypothesis (HA):
There is a correlation in opinions between contractors and foremen with regard to ‘Seismic Risk
Management Statements’. These correlations are related to ‘Seismic Hazard Analysis’, ‘Seismic
Risk Assessment’, and ‘Seismic Risk Response’.
The null hypothesis (H0):
There is no correlation in ranking for ‘Seismic Risk Management Statements’ between
contractors' and foremen's opinions.
234

Here, the calculation is formed in two ways: i.e. the manual method and by SPSS software (to
crosscheck the result o f manual method). Table 8.7 presents the calculation by the manual
method and Figure 8.1 depicts the output of SPSS software.
Table 8.7 Calculation o f Spearman irhd> correlation between contractors and foremen
StatementNumber
s i
Ctontractorsranks
Foremenranks
Difference in ranks (cfi)
Difference in ranks square^)
(!)____1 13
(3)=(1X2)-12
(4H3)*(3)144
S2 7 20 -13 169S3 7 20 -13 169S4 14.5 26 -11.5 132.25S5 33 36.5 -3.5 12.25S6 25 24 1 1S7 31 17.5 13.5 182.25S8 28 22 6 36S9 46 33 13 169
S10 2 8 -6 36S l l 31 44 -13 169S12 3.5 5 -1.5 2.25S13 28 29 -1 1S14 11.5 11 0.5 0.25S15 16 26 -10 100S16 55 51 4 16S17 41 6.5 34.5 1190.25S18 43.5 49 -5.5 30.25S19 50.5 41.5 9 81S20 57 55 2 4S21 34 14 20 400S22 36 32 4 16S23 7 1 6 36S24 39 9.5 29.5 870.25S25 22 39.5 -17.5 306.25S26 9.5 31 -21.5 462.25S27 13 6.5 6.5 42.25S28 18 36.5 -18.5 342.25S29 14.5 52 -37.5 1406.25S30 43.5 9.5 34 1156S31 36 29 7 49S32 46 26 20 400S33 50.5 44 6.5 42.25S34 52 53 -1 1S35 28 2 26 676S36 53.5 47 6.5 42.25S37 41 39.5 1.5 2.25S3 8 11.5 17.5 -6 36S39 22 46.5 -24.5 600.25S40 36 44 -8 64S41 46 29 17 289
235

Table 8.7 continued
S42 56 56 0 0S43 20 23 -3 9S44 18 36.5 -18.5 342.25S45 38 54 -16 256S46 41 57 -16 256S47 26 15 11 121S48 49 50 -1 1S49 22 4 18 324S50 5 3 2 4S51 53.5 34 19.5 380.25S52 48 48 0 0S53 9.5 20 -10.5 110.25S54 31 36.5 -5.5 30.25S55 3.5 16 -12.5 156.25S56 24 41.5 -17.5 306.25S57 18 12 6 36
Total di2 12216.75
rho = 1 -6 * ^ di2
n(n2 - l )
where,rho = Spearman ’rho’ correlation coefficientdi = the difference in ranking between 2 respondents’ opinionn = number o f statements
= 1 -6*12216.75
_ 57(572- l ) _= 0.604
Based on earlier analysis, the positive direction o f correlation seems to make sense, indicating
that a high ranking in one variable corresponds to a high ranking in the other. Therefore, one tail
test o f significance was chosen for this case in order to have a reason to support a positive
direction. In relation to the boundaries o f a confidence intervel, conventionally, the confidence
level , is set at 95% to coincide with the 5% convention o f statistical significance in hypothesis
testing (or 95% confidence limits). In fact, these research data is able to produce 99% confidence
limits (as the result from SPSS software), or the probability o f the result being due to chance is
less than one percent or 1 in 100 (P<0.01).
S tatem ent of hypothesis testing
Concerning the tail test o f significance and P<0.01, the critical value (r0) for the Spearman ’rho’
correlation is 0.432 adopted from the Spearman ’rho’ table (see Appendix-1). The above results
236

shows that rho=0.604 > ro=0.432: hence, the research hypothesis is accepted and the null
hypothesis can be rejected, concluding that contractors and foremen have a significant
correlation or do not perceive the ’Seismic Risk Management Statements’ differently. The
calculation also describes an overall agreement between both examples toward ’Seismic Risk
Management Statements’ {rho-0.604). This indicates that the high ranking given by contractors
to the ’Seismic Risk Management Statements’ correspond to high ranking given by foremen to
the same statements, and vice versa. Figure 8.1 presents the result from SPSS software to
crosscheck the ’rho’ value and significance level:
Correlations
CONTRACT FOREMENSpearman's rho CONTRACT Correlation Coefficient 1.000 .604*’
Sig. (1-tailed) .000N 57 57
FOREMEN Correlation Coefficient .604** 1.000Sig. (1-tailed) .000N 57 57
**• Correlation is significant at the .01 level (1-tailed).
Figure 8.1 The result ’r/zo’ coefficient from SPSS software between Contractors and Foremen
b. The Sum m ary of Overall Correlation
Analoguous to the above example, the critical value is also the same, which is r0= 0.432. Here,
overall correlation among each pair of respondents is described in Table 8.8; Figure 8.2
mentions the SPSS software result regarding the correlation between Group A and Group B.
Table 8.8 The overall correlation coefficient {rho) among respondents
Res
earc
hers
-Sc
ient
ists
Con
trac
tors
Fore
men
Gov
ernm
ent
Bus
ines
smen
Educ
ator
s
NG
Os
Com
mun
ityLe
ader
s
Rep
orte
rs
Researchers-ScientistsContractors 0.681
Foremen 0.591 0.604Government 0.757 0.805 0.570Businessmen 0.650 0.733 0.579 0.709
Educators 0.469 0.657 0.506 0.608 0.711NGOs 0.592 0.575 0.644 0.643 0.602 0.566
Community Leaders 0.593 0.691 0.618 0.658 0.572 0.607 0.555Reporters 0.547 0.534 0.440 0.617 0.489 0.484 0.516 0.475
237

Correlations
GROUPA GROUPBSpearman's rho GROUPA Correlation Coefficient
Sig. (1-tailed)N
1.000
57
.875*'
.00057
GROUPB Correlation Coefficient Sig. (1-tailed)N
.875**
.00057
1.000
57
**• Correlation is significant at the .01 level (1-tailed).
Figure 8.2 The result o f ’rho’ coefficient from SPSS software between Group A and Group B
c. Comments and Interpretations
Based on the above analysis o f the Spearman 'rho' correlation, the following findings are made:
i. It can be seen clearly in Table 8.8 that all coefficient correllations ’rho’ are higher than the
critical value r0 = 0.432. This indicates that high rankings given by each group of
respondents to the ’Seismic Risk Management Statements’ correspond significantly to high
ranking given by another group o f respondents to the same statements, and vice versa.
ii. The highest correlation coefficient (rho = 0.805) is between the government and contractors
and the lowest correlation coefficient {rho = 0.440) is between foremen and reporters.
iii. Surprisingly, the correlation coefficient between Group A and B {rho = 0.875) is higher than
the correlation coefficient between the government and contractors {rho = 0.805). This
indicates that the formation o f researchers, contractors, and foremen into Group A and the
rest into Group B renders a stronger correlation.
iv. In summary, there is significant agreement from every group of respondents concerning the
rank o f the 57 seismic risk management statements stated in the questionnaire. Furthermore,
when discussing the level of importance o f the seismic risk management statements, there is
no significant difference in opinion among researchers/scientists, contractors, foremen,
government officials, businessmen, educators, NGOs, community leaders, and reporters.
Broadly speaking, all the respondents are relatively homogenous and share the same
characteristics. In addition, the configuration of Group A and B has confirmed homogeneity
in the same characteristics within members o f each group, rather than within the respondents
grouped in each category.
238

8.1.3.3 Additional Ideas Collected from Open-Ended Answers
At the end o f each section o f the questionnaire, there was a blank space to accommodate the
respondent expressing some additional ideas or issues if necessary. The exploratory descriptive
analysis is employed in this section. Drawn from 305 returned questionnaires, the number of
respondents who gave an open ended answer in the space provided was only 48 out o f 305.
Respondents who took part usually wrote one or more additional ideas. Therefore, more than 48
responses or statements were gathered from 48 respondents.
There were a wide variety o f ideas and information received. It would be an extremely long
sentence if every additional idea captured from the questionnaire was written as the original.
Therefore, in this exploratory analysis, the additional ideas are stated in a typical statement with 1
a general meaning. In general, this can be divided into three categories, i.e. (1) typical additional
ideas related to 57 statements or pairs of characteristic-indicators, (2) typical additional ideas
related to the respondent’s expectation o f further dissemination o f the findings, and (3) typical
miscellaneous additional ideas, which are not considered further. A summary o f the additional
ideas and their analysis is described in Table 8.9 below:
Table 8.9 Summary and exploratory analysis o f the additional ideas
No Typical additional ideas by categoriesExploratory analysis
A Typical additional ideas related to the 57 statements
1. Comments from two community leaders, a educator, and a reporter:
’’Regular dissemination of earthquake data, mechanism, and effect”
This typical idea was already elaborated in Statement Number 1 and was added further to the statement
2. Comments from two educators and a businessman:”It is hoped that community as a whole can understand easily how to construct seismic resistant houses”
This idea supported Statement Number 10
3. Comments from two NGOs and a foreman:’’Since Indonesia is a developing country, this research should focus on the method of construction of a simple house with seismic resistance, as the number of them are predominant”
This idea supported Statement Number 10
4. Comments from two contractors and a foreman:’’The existence of ’punishment’ mechanisms for peple who compromise seismic features in their houses”
This idea supported Statement Number 12
5. Comments from two reporters and a contractor:”It is necessary to deliberately enforce the building law”
This idea supported Statement Number 12
6. Comment from a contractor:”In fact, the construction certification is only ’a normative credential’ and it can be easily afforded with a little cash. Sometimes, the credential is not required for design and construction”.
Although this idea gave low support to the ’certification’ (Statement Number 15), overall responses still gave high importance with a mean score of 4.303 (Table 8.4). Therefore, the idea of certification was not deleted.
239

Table 8.9 continued
7. Comment from a NGO:’’The implementation of government budget allocation is supervised in detail”
This idea supported Statement Number 16
8. Comment from a NGO:’Please socialize/disseminate the existing earthquake resistant house through NGO’
This idea supported Statement Number 20
9. Comment from a reporter and a community leader:”A further consideration is the scarcity of government budget and low awareness from a political perspective”
This idea supported Statement Number 24 and 7 respectively.
10. Comment from a community leader:’’Clear information will give useful ’feed back’ to the government and many parties to minimize the losses”
This idea supported Statement Number 26 and/or 29
11. Comments from two government officials, a educator, a businessman, and a reporter:
’’The important thing is to deliver the information to the larger society so that they completely understand what they should do if the adverse event happens”
This idea supported Statement Number 27
12. Comments from two researchers and a contractor: ’’The implementation of seismic features needs a wider involvement and co-operation from many parties”
This idea supported Statement Number 28
13. Comments from a foreman and a reporter:”A short program in public or private TV about the importance of seismic features in house”
This typical idea was already mentioned in Statement Number 38 and was added
14. Comment from a community leader:’’Conduct an audiovisual program to the community more intensively”
further to the statement
15. Comment from a foreman:”A simple example of a seismic resistant house can be applied to a post patrol (’gardu ronda’) in the neighbourhood area”
This typical idea was already mentioned in Statement Number 57 and was added further to the statement
B Typical additional ideas related to the respondent’s expectation of further dissemination of the findings
There were 36 responses; some examples are noted below:1. ’’The next important thing after this research is the
implementation of the findings in high seismic hazard areas”
These additional ideas were merely respondents’ expectations of the aspects of
2. ’’The findings of the research shall be publicised to all community members to anticipate the earthquake disaster”.
’dissemination’, therefore there was no further analysis.
3. ’’Although a seismic event is very rare in Indonesia, the dissemination mechanism and its practice should be conducted and not left in the research report only”.
4. ’’Hope this can be implemented within the grass roots community!”
5. ”Do not do only in ’research’, please make it’reality’.”6. ’’Hope everything can be carried out in real actions!”7. ”We wait for the follow-up of the findings”8. ’’Please publicize the findings in common language!”9. ’’Please apply it to Yogyakarta city!”
240

Table 8.9 continued
c Typical m iscellaneous additional ideas
There were 15 responses and some examples are noted below:1. ’’The importance o f understanding seismic risk for
effectiveness in the long term”.These additional ideas were merely miscellanious and/or
2. ’’The scope o f the research is very large” beyond the research aim and3. ”Be successful in your research!” thus were not considered
further.4. ’’The seismic problem is very important to be understood
because it relates to human safety”5. ”1 hope the dissertation is able to give useful input to the
community as a whole in order to reduce seismic risk in Indonesia”
6. ’’Please remember God, since the earthquake belongs to Him!”
7. ’’Please can the foreign terms in the questionnaire be translated into common Indonesian language, so that it is understandable to foremen.”
Table 8.9 can be summarised as follows:
a. There are only three refinements for the pair of characteristic-indicators, i.e. Statement
Numbers 1, 38, and 57
b. Many respondents assigned a high emphasis to the area o f dissemination. This finding also
validates Statement Numbers 27 and 38 about ’dissemination’ in the 15 most important
statements.
In general, open-ended answers from respondents have demonstrated critical review to the
content o f ’the first draft o f the proposed framework’, although only three refinements have been
agreed after detailed collating. Furthermore, the dissemination issue is veiy important in this
sense due to the 36 responses. It is also strengthened the 15-most important statements (Table
8.5), as two of them concern the dissemination issue. Based on 36 responses regarding the
dissemination and research aim, it is very useful to investigate further on dissemination issues o f
the seismic features in real construction (particularly in residential houses) in an effective and
easy way in Indonesia. It is expected that the content o f the proposed framework will not only
cover many approaches of dissemination, but also many basic guiding principles to assist a wide
range o f users for their own contexts.
*
8.1.3.4 Emerging Questions Arising from the Questionnaire Survey
Quite a lot of information was generated as a result o f this questionnaire survey. Many issues
emerge from the findings; however, only a few will be investigated due to the research aim and
time pressure o f the project. Generally, underlying all the above questionnaire findings is some
form of important technical intervention and seismic feature dissemination. In particular, the
241

follow-up question o f the technical intervention issue stems from the findings in Table 8.5,
where most respondents rated technical intervention as important, while the dissemination issue
o f seismic codes is due ,to results from the open ended question. Therefore, it is very useful to
discover the answer or story behind the two principal emerging questions arising from this
questionnaire survey. These are:
a. Why do people tend to assign a higher priority to technical intervention than non-technical
issues when discussing the implemetation o f seismic features?
b. What is the best way to disseminate and familiarize the seismic features in real construction
(particularly in grass root residential houses) in a sustainable, effective, and easy way?
8.2 Interview Data Collection and Analysis
Data collection via an interview is the subsequent phase o f the above postal questionnaire
survey. This section begins with the rationale for the interview data collection method. The
research sample, including the profile o f the interviewees, then follows. The major part o f this
section contains the presentation of different themes or patterns emerging from the analysis o f
the interview data.
8.2.1 Rationale for the Interview, the Research Sample, and the Questions
The findings o f the questionnaire survey has brought to light two inviting principal questions, i.e.
the importance of technical intervention and seismic feature dissemination to the lay person, in
order to comprehensively understand the research aim. Indeed, the answer to the two questions is
fully related to the full set o f components in current community activities, such as individuals,
organizations, policies, and technical resources. The activities o f the community represent a
continuing process, in which the components interact with one another to adapt to the demand
and resources o f their environment more efficiently. Therefore, the answer to the two questions
needs a fresh perspective from the factual story behind people’s experience, where much o f the
accurate information might not be available from a reference book. As a result, it was decided to
conduct interviews to elicit a richer and in-depth story as well as dynamic patterns according to
the two questions, which were not fully investigated during the initial data collection.
A similar impediment to the interview conducted in the pilot study (see Chapter VII) arose, as it
was not easy to comprehensively discuss the definition o f seismic risk management with people,
as the research topic was relatively new in their mind. In ofder to overcome this barrier,
therefore, this interview was conducted with those involved in the previous postal questionnaire
242

survey, in order to follow the flow and logical thinking o f the research topic, without having to
make a huge effort to familiarise interviewees with the details o f the research topic at the
beginning o f the interview.
For this course o f action, nine interviewees were selected and approached from the number o f
respondents involved in the previous questionnaire survey, giving a representative reflection o f
the nine multidisciplinary stakeholders in the research arena. Since the current disaster risk
management hardly embraces a multidiscipline approach, and this is also rarely incorporated into
development planning in Indonesia, the mix o f interviewees’ backgrounds is a fair representation
o f multi angle perspectives. The interviewees were selected from middle to high management in
each organization, as the area o f expertise o f interviewees would facilitate the validity and
significance o f the data generated. Table 8.10 gives the general description and profile o f the
interviewees participating in the interview. The interviewees were categorized to remove names
or any reference made to any other organization or person by name.
Table 8.10 Profiles o f the interviewees
Number Interviewees
1 Category: ResearcherPosition interviewed: University lecturer and practitioner in Structural Engineering
2 Category: Small-Medium ContractorPosition interviewed: Director of a medium contractor
3 Category: ForemanPosition interviewed: Individual foreman
4 Category: GovernmentPosition interviewed: Middle management government staff of Infrastructure Department
5 Category: BusinessmanPosition interviewed: Middle management staff of a real estate firm
6 Category: EducatorPosition interviewed: Headmaster of a school
7 Category: Non Government Organization Position interviewed: Director of a national NGO
8 Category: Community leaderPosition interviewed: Head of a village administrative structure
9 Category: ReporterPosition interviewed: Deputy Editor of a local newspaper agent
As mentioned in the earlier section, there are two main questions for further investigation. These
are related to the importance o f technical intervention and sustainable and effective methods of
dissemination of seismic features. The interview method was conducted with a semi structured
approach, not only focusing on the topics for discussion but also allowing the interviewee to
243

explore the subject and express opinions and evaluations, since these may reveal previously
unidentified issues or ideas or new perspectives on existing risks.
With reference to the result o f the Spearman ’rho’ correlation (see the above Section 8.1.3.2),
there is a homogenous nature which shares the same characteristics between nine types of
respondents when discussing the seismic risk management statement. This indicates that the nine
interviewees will respond to the two questions with equal force and then all the answers can be
analysed and compared in one go, regardless o f their backgrounds.
Prior to the interview, the author communicated the invitation to the interviewees by telephone.
This focused on the purpose and importance of the interview, requested co-operation, assured
confidentiality, mentioned the key topics to be addressed during the interview, and confirmed
the time and place. Sometimes the agreed interview events were delayed or rescheduled due to a
matter of great urgency to do with the interviewees’ work or due to a sudden change in
timetable, since the interviewees were all important people within their organisations. Hence,
this part o f the research was problematic, especially when combined with other interview
appointments where the respondent’s address was geographically remote and in light o f the time
pressure on research.
8.2.2 Analysis of the Results of the Collected Data
The interview took place over a period o f about a month. The interviews were digitally recorded
using a digital voice recorder, i.e. a Mustek PVR-A1, loaded onto a PC, and transcribed. The
data was then analyzed, using NVivo software, version 2.0. The software helped to code the data
and identify themes and/or patterns generated. The interview was carried out in Indonesia in the
Indonesian language and the original data was also written in the same manner, so the translation
to English might cause a slight irregularity in syntax.
In general, interviewees inspired many new ideas when responding to the two questions,
although the respondents did not keep their responses focused only on the main questions.
Because it is widely agreed that the interviewees’ backgrounds were different, it seemed the
respondents were expressing the activities of a range o f goals they had in mind, instead of
restricting themselves only to the questions. As a result some o f the respondents comments
included in the discussion covered more general reactions.
Matched to the two questions, the findings from this interview are also categorized into two
main topics, i.e. influential factors o f the importance o f technical intervention and seismic
feature dissemination principles.
244

8.2.2.1 Influential Factors of the Importance of Technical Intervention
Three influential factors that drove respondents to assign a high level o f importance to
intervention from technical actors in seismic risk reduction through the implementation of
seismic features emerged in this interview. They are: (1) closeness to physical building/house
vulnerability reduction, (2) lack o f public knowledge about government functions and their
commitment to maintaining public safety from seismic disaster, and (3) the importance of
earthquake data.
The first reason that technical intervention is very important in reducing seismic risk is linked
with the relative closeness to a reduction o f the vulnerability o f physical buildings/houses. It is
all too easy to understand. All interviewees conveyed a sense of confidence that seismic risk was
widely influenced by the level o f building/house vulnerabilities. At this discussion, they
principally urged that petty contractors, foremen, masons, and/or carpenters should be at the
forefront during residential house construction. The quality levels o f residential houses or low-
story buildings and whether or not they are seismic resistant depends largely on the knowledge
and workmanship o f such builders. As the community leader said:
“ ...I think people easily understand that most o f the problems during an earthquake event
are due to the collapse o f residential houses or buildings this points that those who are
involved in the process of building a house in the community as a whole should be
highlighted to reduce the same tragic event in the future.........
In a similar vein, the government staff stressed:
“...As you know, in general, the greater vulnerability o f the house is the higher o f seismic
risk to be exposed, isn’t it? It is simply because masons and carpenters (tukang) who are
building a residential house as usual don’t know how to build a seismic resistant
structure ” .
Furthermore, the real estate firm staff commented:
“....I agree that the houses including those I am selling could be vulnerable to ground
shaking. People see no surprise that in the current earthquake, many houses collapsed
because the houses were too weak against strong shaking However, the details are
completely upon the mason and carpenter....”.
While the close interrelation between the importance o f technical intervention and the level o f
vulnerability o f a house/building was widely recognized, interviewees from the categories o f
contractor, reporter, researcher, and foreman augmented the above finding from a different
angle. They also argued that most people probably do not have any understanding, information,

or knowledge that the government should be responsible for public safety, including protecting
the population from seismic tremor. If most people understood that the fundamental root
problem o f poor seismic risk management stemmed from the absence o f political commitment,
as highlighted by UNDP (2003), not necessarily only from technical problems, they would
acknowledge quite precisely that political commitment is probably o f the highest importance. In
fact, it is easy to find that most people point to the vulnerability o f structure as the main source
of overwhelming seismic risk, rather than political commitment itself. Many people would never
have thought to ask and take a careful look at the basic issue o f disaster risk reduction, thus
raising the question of why the government poorly organizes public safety, along with disaster
risk management systems, following the latest tragic, disastrous events? In conclusion, a lack o f
public knowledge o f government functions justifies the second factor o f why most people focus
on technical intervention when dealing with seismic risk reduction.
This evidence was acquired during an interview with the contractor, as follows.
“....For example, if there are many public school collapses during an earthquake, people
place the blame directly on us as builders From a public point o f view, most lay people
don’t know that the government is certainly also responsible...”
In addition, the reporter elaborated:
“ Because o f a lack o f public education about what are the government’s duties,
community members don’t have any idea to blame government, but they tend easily to point
to contractors as the main cause o f the collapse of public buildings. In my opinion, the
government should provoke in the first line”.
In a different pattern, the educator also mentioned a third factor, i.e. the importance of
earthquake facts, as follows:
“ As you said, scientists such as geologists who are analyzing earthquake data are
included in the technical group, I also guess people want to understand first the characteristic
o f historical earthquake data over time and also the existing fault line, and take reflection on
that matter for further activities ”
From the above explanation, these findings confirm that the three factors contribute largely to
why people tend to assign a high priority to technical intervention when dealing with seismic
risk reduction through seismic feature implementation. The three factors are summarized as
follows:
246

a. Direct relationship with physical vulnerability
Certainly, it is clear and easy to understand that intervention from technical actors in seismic risk
reduction is very closely related to a reduction in physical vulnerability. The improvement o f
technical ability o f builders, such as small-medium contractors, foremen, masons, and carpenters
play an important factor in non-engineered construction practice. Ultimately, they are the major
factor in governing whether seismic features are implemented in the construction o f non
engineered structures. Obviously, the higher the workmanship o f such builders in real non
engineered construction, the lower the exposure to seismic risk will be.
b. Lack o f people’s understanding o f government functions
If people understood that one o f the government’s main duties is to maintain public safety,
people would probably show no surprise that physical vulnerability is intrinsically linked with
government political commitment. In reality, people’s understanding of government functions is
very low and weak, and also is far from the desired goal. Certainly, this commitment should be
in the forefront. The skill improvement o f contractors, foremen, masons, and carpenters, who are
primary technical actors in real non-engineered construction, is easily achieved under the
umbrella of good and clean government. It is hoped that government awareness of the degree o f
seismic risk is soon translated into concrete action rather than contemplation. Furthermore, it is
quite surprising that the researchers, contractors, and foremen, who are closely involved in the
technical measures, commented about the importance o f political commitment (non-technical
measures). This may indicate that the technical actors’ duty o f care to reduce seismic risk is fully
in the right direction, then they look at the inadequacies o f overall government initiatives, which
need to be seriously improved.
c. The importance o f earthquake data
Based on its nature, earthquake data is included in the technical statement. Better understanding
and correct information on earthquake data constitutes a foundation for people to become
proactively involved in seismic risk management activities, since without this knowledge,
seismic risk is simply thought to be negligible. All too often, scientific knowledge o f the
geological conditions and seismic history had not been incorporated into local planning or
community awareness programs. Based on larger literature, this data is widely available from
many sources, and is even up-to-date, but this is never disseminated to the lay people in a timely
manner, in order to trigger a sense o f shared risk. Although only one respondent mentioned the
earthquake data as being the influential factor o f the importance o f technical intervention, this
assertion authenticates the finding o f the questionnaire survey, where this statement was placed
in the highest rank (see Statement Number 1 in Table 8.4)
247

Broadly speaking, the above findings reveal the important issues o f improving the skill of
builders, government political commitment, and earthquake data dissemination in seismic risk
reduction. The role o f builders appears to be very important, while respondents did not mention
the role o f scientists and researchers as a crucial factor, as well as the other stakeholders, such as
community leaders, educators, reporters, businessmen, and NGOs. Surprisingly, the role o f
government is increasing more critical to this matter, as one interviewee stated: the government
should appear in the first line.
Corresponding to the questionnaire survey result, the above findings may also indicate an
increasing concern over the issue o f government commitment (Statement Number 7 in Table
8.4) at a much higher level; whereas the survey findings only award this issue a rank o f 14. Also,
from the reporters’ point o f view alone, this factor definitely authenticates the findings o f
questionnaire survey, where Statement Number 7 about political commitment was placed at the
highest rank (see Table 8.4).
8.2.2.2 Guiding Principles of Sustainable and Effective Dissemination in the Grass Root Initiatives
The explanation for this section corresponds with the second question about sustainable and
effective dissemination o f seismic codes in grass root initiatives, as many respondents raised
many aspects o f this issue. It is not a surprise because grass root residential houses always suffer
most during strong ground shaking, as elaborated by CEEDEDS (2004). The reasoning is that a
series o f costly earthquakes have proven that there is a widespread persistence o f grass root
communities not to implement seismic codes or perhaps an inability to learn from past
earthquakes. Furthermore, the implication of a general assessment o f people at the grass roots
level is that the manual of seismic features is understood in different ways and not through
standard curricula.
While most respondents mentioned some dissemination methods already listed in the
questionnaire, such as posters and newspapers (Statement Number 38), three sustainable
dissemination principles were raised throughout, when respondents were asked about an easy,
sustainable, effective, successful, and streamlined way towards the dissemination o f seismic
features among the community members, particularly at the grass roots level, with considerable
effects. These are: (1) the government should act as a proactive backbone o f the dissemination
initiative, (2) the dissemination mechanisms should use the existing social bond and/or
indigenious method, and (3) the dissemination message should convince the community member
that the implementation o f seismic codes is easily achievable under their control.
248

a. Government should enact as a proactive backbone o f the dissemination initiative
To disseminate the benefits o f seismic features in real construction successfully and
continuously, all respondents mentioned the importance o f the government’s role, and even
mentioned it as the most important factor. This emphasis comprises many aspects o f activities,
particularly the dissemination project initiated by the government as well as by the community
group itself and the enforcement o f seismic code mechanism. Although the government are not
necessarily solely resposible for disseminating information regarding seismic features, and there
is a new opportunity for multidisciplinary involvement in this matter, nevertheless, the
government itself should act as a proactive backbone o f the dissemination initiative. It means
that, while dissemination initiatives may come from any other source o f people and
organizations, the government’s role is central to encourage and invite more and more people to
engage in this issue. The ability o f government to listen, respect, encourage, and motivate grass
root programs initiated by community groups is indispensable. At the same time, the government
should generate campaigns or dissemination programs down to the community members to
motivate people to gradually prepare for the next disaster, highlighting a shared risk and also
enforcing seismic codes. The government’s role is to be the focal point for communication,
coordination, programme monitoring, delivery o f knowledge, and accountability.
One respondent from the category o f contractors believed that the government could carry out a
pilot project about a seismic resistant model houses, in collaboration with many other
organizations. By visiting the model houses during their construction phase, people can better
understand how to implement seismic features correctly, using real construction as a
dissemination media. In addition, the construction process can be filmed for wider circulation,
changing construction practice, and replicating success in other areas. This film can facilitate
seismic code enforcement, as the contractor suggested:
”....1 believe that exemplary model house can encourage people to implement seismic
features as a dissemination tool. It is a good idea to invite people or, probably, students in
the construction field to see directly. If government wants to enforce seismic codes
through their regulation, such implementation can be documented in film format as a pilot
to increase people’s understanding on how to implement the codes. Probably, due to the
decentraliation process, the government can begin these activities in wealthy districts as
pilot projects. Because they have many resources, they can conduct it in many easy
ways....”
It is believed that, if the government makes a huge effort to rigorously enforce seismic features
today in many model houses so people see what they look like and feel very proud, many more
model houses would soon be replicated everywhere. When a strong earthquake strikes, the
249

government will make only a little effort in response because the collapse o f buildings/houses
would be rare, even avoided. Furthermore, it would ensure faster recovery and reconstruction.
The researcher felt the government could play a very important role in helping communities who
have recently built their new houses to adjust to the new design of seismic resistant houses,
through a steady flow of government campaigns, as follows.
” Clearly, the procedure to include it in common residential houses is long and
widespread If the government has such easy accessible information for people to begin
understanding the degree o f risk and then to build their own house with such codes and in
line with the existing regulations, I think it is very important and an easier path for a safer
environment...”
The greater need for a proactive government in this sense was also suggested by the community
leader, underscoring a ’bottom-up’ approach, as follows:
“...For my point o f view, it depends absolutely on the government Government staff
responsible for public safety should make more visits and have more face-to-face
discussion with the group to acquire the community need directly...”
b. The dissemination method should utilize existing social bonds and/or indigenous methods.
Three out o f nine respondents stated the importance o f social bonds and indigenous methods
when dealing with communal grass root dissemination. This finding argues that when
government staff, researchers, scientists, and/or other disaster management experts gather to
elucidate the lay people, this process will be effective if it uses or merges into the formal or
informal existing tradition o f community meetings. Innovative initiatives, new synergies, and
networks are easily absorbed over those already established. This will fit into the existing
community structures without any friction and also value everybody’s unique contribution.
People will be comfortable, happier, and less worried about being involved in the dissemination
process if they are among people they have worked with in the past and with whom they have
developed a long-term relationship and have similar beliefs. This approach also emphasizes the
importance o f sustainability. This process breaks powerful psychological barriers and continues
to build up trust amongst them and also acts as encouragement for others who have not been
involved in any initiatives in the past. It is a better and less expensive method for including
communal actions. At last, this method makes it easier to enforce proper maintenance of
community based disaster-management systems.
250

Perhaps, the current dissemination method initiated by government officials uses government
standards which are often not flexible enough to adjust to various people’s needs. The
government tends to be just interested in promoting their own status, and the use o f existing
social bonds is often greatly neglected. This section explains that successful adaptation to
changing circumstances can be enhanced through the availability o f existing social cohesion.
Learning to live with seismic risk can be assisted by uniting current good practices o f seismic
features with people’s own societal practices. Evidence o f this conclusion has been conveyed by
respondents as follows:
The reporter said:
“ Sometimes people who disseminate, such as government officials or university
lecturers, fail to identify that the community leader has a totally different approach of
delivering programs and on the other hand, lay people have a different style o f learning in
a particular environment...”
The respondent from the NGO said:
” It is helpful for people who will give a speech or advice to the community member, if
they go to available neigbourhood meetings. People are very welcome and voluntarily
involved in this situation, not surprisingly, the meetings receive high attendances...”
In addition, the community leader said:
” our community is clever enough to revitalize themselves as long as there are co
operative networks or efforts, funding, and support from local officials I think our
community likes to move at their own pace....”
The above explanation confirms the importance o f the use o f the existing social bond and
indigenious technique for succesfull adaptation in delivering any dissemination initiatives and
also for addressing citizens’ needs more effectively and efficiently. In this way, the role o f
community leader is substantial, as the community leaders have traditionally taken on consistent
long-term relationships in steering social practice. If billions o f people do as the leaders tell
them, it could have a real effect. Yet, it is not an easy task to persuade low educated people to
take part in sound seismic risk management. Probably, the community leader should first
establish people’s interest at the first point o f contact, secondly: encourage and support them, at
the same time introducing them to good practices o f seismic features which they may not have
been aware of.
251

In addition, the existing social bond has shaped the community’s capacity in their daily lives.
Through this bond, community members can better adjust their own practices to improve
performance. If this dissemination mechanism is well done and streamlined over time before
disaster strikes, obviously this channel will be sustainable and will also work well in the critical
stages o f disaster response. Community members help one another, sharing information and
resources as it becomes available.
The above discussion is about channeling dissemination by giving a talk or elucidation to grass
root communities. This dissemination technique is conducted by ‘visiting’ the community group.
On the other hand, the dissemination technique by ‘inviting’ individuals to the meeting,
discussion, or seminar is very suitable for people from medium-top management in organizations
who have experienced better education because they have an appropriate level o f expertise and
knowledge. This is why the dissemination to the grass root community by ’inviting’ them to a
formal forum, such as a discussion in government offices, always fails to motivate them into
concrete action. This is likely to be because the prescriptive mechanisms are not compatible with
their beliefs. To achieve the best result, the government officials should ’visit’ the community
directly.
Therefore, this finding confirms that one reason why community members do not implement
seismic codes persistently is because the disseminators never ’visit’ the grass root community
and merge with the existing social practices, where most grass root community members in a
developing country are relatively poorly educated. This approach is completely different from
those who have higher education. As long as the dissemination method for most lay people
corresponds with their existing social spirit and cohesion, and it is compatible with people driven
practices, and they have an opportunity for interaction, then considerable effects can be achieved
easily. Here, it should be understood that the existing number o f dissemination channels and
methods, beside giving talks and face-to-face communication in the long tradition o f the
community, are virtually endless. However, current studies have shown that once a certain level
o f prosperity is passed, more economic growth actually erodes personal satisfaction and social
wellbeing in most cities, and then the above principle is less attention.
c. The message should be achievable under control o f the people
After the correct dissemination channel is diligently decided, here, two respondents stated that
the message about the implementation o f seismic features should be achievable under the control
o f the people. This finding underpins what Lustig (1997) has found: that for a disaster-
management system to be sustainable, it should be designed not only to convey the message to
252

the members o f the disaster-prone community that they are in control, but also that the system is
actually under their control.
Although the seismic event itself, when it occurs and how big the magnitude will be, is
uncontrollable, most o f the components o f seismic risk people face are absolutely controllable.
Community members who are living in a seismic hazard prone area can control the suffering
from , seismic tremor, for example, through implementing such codes in their houses/buildings
and making any other appropriate preparations. If people rationalize that the implementation of
seismic features in their own houses is the most effective strategy for minimizing losses, and at
the same time, perceive it is practical, possible and achievable and they can control it, this
strategy will have a tremendous effect on how well they can cope with it.
It is an unwise solution to force people to leave their homeland because o f the high level of
uncertain but inevitable threats o f an earthquake event, as an inconvenient truth. Thus, the
dissemination message should convince people to devote themselves to living harmoniously with
seismic risk through matters they perceive they can control. The ideal solution is to give people a
better understanding about seismic hazard and risk in a reasonable and rational manner and then
convince them they can cope and control it with the proper implementation o f seismic codes. As
a result, people become happier and do not worry about living in seismic prone areas because
they have some control over events. Better understanding o f seismic hazard and risk will
encourage people to implement seismic features voluntarily without coercion. In similar way, it
can be compared to a person who is driving a motorcycle on a motorway and is voluntarily
wearing a helmet to prevent a fatal road accident. Although disseminating new ideas to people is
not welcomed at first, even fought against, efforts must be made to present persuasive arguments
o f the soundness of the protective and cost-effective measures.
The foreman said:
” I think a common house owner can overcome this matter positively It is good if
people have a desire to be involved....”
The community leader argued:
“ If they are persuaded with respect, their confidence goes up, and they feel that their
activity is part o f the government program. If you can capture their basic trust, I think it is
better As you know, last time, the government launched a ‘family planning
initiative’ to overcome overpopulation in Indonesia. This is quite successful because
people own it and can gain the benefit, isn’t it?....”
253

It is important to educate people that the implementation o f seismic codes is simple,
economically feasible, and achievable, and culturally acceptable to obtain their sense o f control
over their destinies. If people have a sense o f control and are clever enough to implement
seismic features properly, then they can also achieve a sense of ownership. This sense of
ownership is really needed, not only to encourage and maintain actions voluntarily in order to
generate a culture o f prevention, but also to make community members feel part o f the effort.
As a result, people will actively make contributions to reduce vulnerability. Through a greater
sense o f ownership, more people tend to recognize that reducing seismic risk needs shared
responsibility and shared effort.
Indeed, delivering such dissemination messages so that people feel in control largely depends on
the individual who conveys the message. This person should have the ability to deliver the
knowledge precisely and timely in relation to the people’s need. In addition, it is greatly
recommended that the disseminators have intelligence and sometimes a sense o f humour to
intersperse the odd good joke during the course o f dissemination. Failure to attract the people’s
sense o f control could hamper the process.
In conclusion, the above finding suggests three guiding principles for a sustainable and
successful dissemination process, which may have been greatly neglected in the past. The above
three principles confirm that: (1) the government role is the backbone o f the dissemination
initiative, (2) the dissemination channel through the existing social bond is imperative, and (3)
the message should convince people that they have control over the implementation o f seismic
codes. If the three principles are applied rigorously, the dissemination process will obtain great
achievement. This is truly beyond technical capacity. However, sometimes the key government
officials and the disseminators, who are usually from a wealthy background, do not persevere in
conducting dissemination to the low-medium income population, as they are not on the ‘poor’
people’s side and also do not gain any clear financial and political benefit.
In particular, the first principle confirms heavily that the government role emerges as being
essentially in the critical component o f shared seismic risk, which should stand at the very top o f
the agenda for change, in line with UNDP (2003). As seismic risk reduction is intrinsically
linked with the development of government related issues, in general, most the decisions are
made either explicitly or implicitly in regard to political considerations.
Principle number 2 is closely related to the idea o f a sense o f place, meaning that feeling is
attached to a place, and feeling secure in all the things that make life truly meaningful is
important for people’s identity as mentioned by Covenry and Dutson (2006) and Lynas (2007).
254

The government should be more accommodating to people’s needs and understand what works
in one region is unlikely to work in another. In addition, to address the persistent inability of
grass root communities to implement seismic features, the dissemination should engage many
actors with local wisdom, complemented with many opportunities and strategies by developing a
sense of responsibility for all community members. Finally, these three principles are also
designed to convince people not to deny the problem and to eliminate apathy as the most
frustrating factor. Figure 8.3 depicts the findings of the interview, with the assistance of NVivo
software:
u » m m I ' i f H l ^ - i v — ■ v - A - v - . T - i
m • a j j & 0 \Browse Properties A ttrib u te s | DocLlnks NodeLtnhs |
Y J *
Nodes N odes in .'Guiding principles of dissemination
' » Free (0 ) £ § Title No. Passages C rested Modified
Trees (8)
- ? Technical in te rven tion im portance
4 C loseness to physical building vulne
i t Lack of public know ledge o f g o v ern m e
i t E arth q u ak e d a ta im p o rtan ce
- ® Guiding principles o f dissemination
A G o v ern m en t a s p ro a c tiv e b ac k b o n e
4 D issem ination m e th o d should utilise
4 D issem ination m e s s a g e should b e achi
© Cases (0) y
♦ Governm ent as p ro ac tive backbone 1 14 16 /0 5 /2 0 ... 1 7 /0 5 /2 0 ...
4 Dissemination m ethod should utilise 2 8 16 /0 5 /2 0 ... 2 2 /0 5 /2 0 ...
4 Dissemination message should be achi 3 4 1 6 /0 5 /2 0 ... 1 7 /0 5 /2 0 ...
1 ........................................................- ...........................................................................................................- ............................................ .............................................................. ..............1
Figure 8.3 NVivo screen display of the nodes created from the interview
8.3 Refinement of ’the F irst Draft of the Proposed Fram ew ork’
Drawn from the above questionnaire survey and interview findings, this section describes some
refinements to make ’the first draft of the framework’ into ’the second draft’. ’The first draft of
the framework’ was formed in Figure 5.1 (complemented by three important factors of effective
seismic risk management of non-enginered buildings). ’The first draff consisted of 57 pairs of
characterictic-indicators (or statements). There are three refinements to ’the first draft of the
framework’, the first extracted from the questionnaire survey, the second summarised from
selected interviews, and the third produced from a combination of the two.
A critical analysis of the open-ended answer in the questionnaire survey constitutes the first
refinement, which deals with the additional ideas within the pairs of characteristic-indicators
numbers 1, 38, and 57 (see Table 8.9); there are no refinements at all for the remainder o f the
pairs of characteristic-indicators. Thus, the overall number of pairs of characteristic-indicators is
exactly constant at 57 pairs. Particularly seen in Statement Number 1, the additional word is not
only’to disseminate the risk’ but also ’to communicate the risk’ as suggested by the community
255

leader: ’’government staff responsible for public safety should make more visits and engage more
face-to-face discussion with the group to directly discover the community need”., Also, the
educator added: ’the fault line’ to the characteristic in Statement Number 1. At a different time,
the researcher was urged to add: ’a number o f houses made o f different material, extendable
houses’ in relation to Statement Number 57. Table 8.11 describes the refinements for the pairs of
characteristic-indicators, numbers 1, 38, and 57:
Table 8.11 The refinements for the pairs o f characteristic-indicators numbers 1, 38, and 57.
Statementnumber
Characteristics Indicators'
SI Earthquake occurrence data: their history, spatial distribution, characteristics, impacts, and the existing fault line.
Data recorded, mapped, up-dated, disseminated and communicated* regularly
S38 Dissemination and use of traditional/indigenous knowledge through media involvement in communicating seismic risk
Availability and accessibility of information (handbook, poster, newspaper, exhibition, talks show, short TV program, audiovisual program*, etc) in introducing seismic features of buildings with simple technical approaches understandable to the laypersons, including the existence of model houses with seismic features, low-cost, and simple in neighbouring areas
S57 Good examples of real constructions
Existence of a number of model houses with seismic features, low-cost, and simple as well as ready to be replicated in other areas. For example: a number of houses made of different materials, extendable houses, and a post patrol Cgardu ronda') in the neighbourhood area*
*) the refinements (written in bold and italic letter)
According to Table 8.11, the above three refinements do not seem to be significant enough to
upgrade the essential content o f ‘the first draft o f the proposed framework’. However, the above
finding, which is no subtraction or removal on all pairs o f characteristic-indicators, has
confirmed that the content o f ‘the first draft o f the proposed framework’, consisting o f the 57
pairs, has been highly approved by respondents to be carried out in Indonesian cities.
The second refinement comes from data collected from selected interviews. This refinement
focuses on three basic guiding principles in the dissemination o f seismic features to the grass
roots community in order to complement the overall 57 pairs o f characteristic-indicators. These
three principles are: (1) the government role is the backbone o f the dissemination initiative, (2) a
dissemination channel through existing social bonds is imperative, and (3) the message should
convince people that they have control over the implementation o f seismic codes.
256

The third refinement is drawn from the findings o f both the questionnaire survey and interview.
This maps out multidisciplinary stakeholders as agents o f change, highlighting a shared risk and
responsibility and focusing on grass root initiatives with local wisdom, as later elaborated in
Figure 8.4. This refinement also complements the overall 57 pairs o f characteristic-indicators.
Based on the data collected and the general facts, many forms o f people and organizations can
act as agents o f change and have unique roles, which are highly varied due to the their nature of
duty o f care. Therefore, it is important to depict the influence level o f many stakeholders as
agents o f change in good seismic risk management o f non-engineered buildings. The principal
aim of this depiction is to give a better understanding that many people or organizations have an
important stake in steering the seismic risk management process, although their influence levels
vary due to their nature o f duty. It is hoped that a full spectrum o f tasks and activities and broad
banded partnerships in relation to the implementation o f seismic codes to non-engineered
buildings are well done and assimilated continuously, integratively, and harmoniously by a new
configuration o f various people and organizations to ensure a new generation o f sustainable
seismic risk management. Then, more and more non-engineered buildings with seismic
resistance will grow and flourish everywhere.
Most arguments in the interview state directly that the government’s role greatly influences the
successful seismic risk management o f non-engineered buildings. In particular, the top
management in local government, together with the legislative council, has the authority and the
power to give approval or disapproval for all development related issues. The top local authority
can communicate with different department heads and can make them act on issues o f seismic
risk which need to be accomplished. In this case, they should make important and strategic
decisions with regard to the implementation o f seismic codes to mainstream seismic risk
management initiatives under their principal aim of public safety in general.
Essentially, local government should rigorously disseminate and communicate their local
seismic risk and the benefit o f seismic codes by educating people to implement them voluntarily;
at the same time, they should enforce the codes through effective regulation. In addition, this
includes rules for the control o f development, land use regulations, and suitable compliance
mechanisms for building construction. The quality o f their leadership is an indispensable
component o f success. They serve as a source o f hope. Here, the role o f the government appears
to be as major contributors to the successful seismic risk management o f non-engineered
buildings. Finally, the role o f the government (together with the role o f the legislative council)
and their concrete actions in disaster reduction remain the biggest challenge for effective seismic
risk management today.
257

Note:Th is a rrow rep resen ts 'a top -dow n app roa ch ' on how go ve rn m e n t
^ d issem ina te s and com m un ica tes se ism ic risk and co s t-e ffe c tive n e ss o f ' im p le m en ta tion se ism ic fea tu res , at the sam e tim e e n fo rc ing se ism ic codes
rigo rou s ly th rough e ffec tive regu la tion
Th is a rrow describes 'a bo ttom -up a p p ro a ch ’ w here m any s take ho lde rs pa rtic ipa te and have a say to the dec is ion p rocess o f se ism ic risk m a nage m en t re la ted issues
<-......................... -> Th is a rrow ou tlin es ‘a m u tua l ho rizon ta l re la tio n sh ip ’ am ong s take ho lde rsfo r be tte r and com preh ens ive se ism ic risk m a nage m en t sys tem
Figure 8.4 Putting m ultidisciplinary stakeholders together as agents o f change to share the seism ic risk o f non-engineered buildings
As m entioned in T able 8.5 w ith regard to the 15 m ost im portant factors in seism ic risk
m anagem ent and the im portance o f technical intervention sum m arised from the interview stage,
the role o f builders such as contractors, forem en, m asons, and carpenters is very influential, as
they are at the forefront in the actual construction o f non-engineered buildings. In addition,
som etim es difficulties appear w hen they have to change their traditional approach to fall in line
with a new technique o f seism ic feature im plem entation. As one forem an said: “ ...I found m any
tim es that traditionally experienced m asons and carpenters are reluctant to fam iliarize
them selves w ith this new m ethod, com ing from young trained forem en, as they feel that it is not
respectful to their seniority ...” . Therefore, changing the practice o f builders is very necessary to
G overnm ent (including the legislative council)
R esearchersand
Scientists
Sm all-m edium contractors and Forem en (including m asons and carpenters)
C om m unity Leaders (The>f\ *» also represent house ownersV \
Educators, N on-G overnm ent O rganizations, Reporters,
_ B usinessm en, and O thers _
Second
Third
258

make more seismic resistant buildings/houses and, as a result, they constitute the second agent of
change.
On the other hand, researchers and scientists can be both the first and second agents o f change.
For example, the researcher/scientist role was ranked as the most important o f the earthquake
data (Table 8.4) and was the first agent o f change in this sense. The researcher who conducts the
cost-effectiveness o f seismic feature implementation can perform at the second level after the
government role to support law enforcement of seismic codes. Researchers and scientists can
inspire many aspects o f good seismic risk management o f non-engineered buildings, such as the
development o f seismic features suited to the specific area, introducing earthquake facts for land
use planning and a seismic awareness program. Moreover, social and psychology researchers
can innovate on how to deliver information, leading to a change in attitude and a change in
behavior. They also can serve as a source o f new knowledge and inspiration for those
implementing the changes.
When discussing the effectiveness o f social bonds and how to break psychological barriers o f
community perception to achieve a feeling o f control (as mentioned in the interview findings), it
is clear that the role o f community leader is very important to explain the whole thinking
process. In certain cases, the construction process o f residential houses/buildings is directly
under the guidance o f the owner, who often doesn’t have sufficient skill in the concept of
seismic features or neglects the workmanship o f the builders due to the time completion pressure
and the overwhelming need for steel reinforcement. One foreman said: “ ..Indeed, often they
(house owners) were intractable to accept new ideas...”. Again, in this situation, the community
leader can contribute to the education o f those people and also act as an intermediary between
the government and the house owner when government staff enforces seismic features during the
construction process o f the residential house. In certain cases, the house owner often acts as a
self-builder due to limited funding available. Here the community leaders (who also represent
the house owner) are the third agent o f change.
The last agent o f change belongs to the groups o f educators, NGOs, businessmen, reporters, and
others, since the general assessment o f the 15 least important statements o f seismic risk
management (Table 8.6) appeared to illustrate aspects o f non technical intervention, where the
involvement o f many parties related to non-technical intervention (excluding government
officials) was reasonably less important.
Obviously, the picture o f the agents o f change in Figure 8.4 is merely a general assessment as an
indicative explanation drawn from the data collected. Probably, certain cases will illustrate
259

different patterns o f the degree o f the influence within larger parties as conditions change over
time. Subsequent investigation is truly needed to explore further for better understanding and to
validate against any misunderstanding or bias due to interviewees strong personal opinions.
In conclusion, the three refinements have improved ’the first draft o f the proposed framework’
into ’the second draft’. It is argued that the second and third refinements are pivotal to
complement the proposed framework more comprehensively and will also be easily
implemented. Now, ’the second draft o f the proposed framework’ comprises 57 pairs of
characteristic-indicators complemented by (A) three important factors o f effective seismic risk
management o f non-engineered buildings, (B) three guiding principles o f dissemination, and (C)
a map of multidisciplinary stakeholders as agents o f change. Figure 8.5 depicts the comparison
between ’the first draft o f the proposed framework’ and ’the second draft o f the proposed
framework’.
260

First draft of the framework
j fifty seven pairs of characteristic-indicatorsCQft£ AREA O f SEISMIC HAZARD ANALYSIS 7
1. E w t^ 'a k e occurrence dalaA. Seismic hazard a n a ly s i s ^
B Seismic risk a s s e s s m e n t^ 5; S S * 4 £ » c u v « ,:
C. Seismic risk respon
:::$QR£AREA PCI irv ANDPLAHfiMG/ ifcductng seismic risk............. .6.Tni»gt»t»on of leduung SRNE8 .....
T he refin em en ts w ere:1. th ree refin em en ts w ithin th e 57 pairs o f
ch a ra cter istic -in d ica to rs2. add itional c o m p lem en t o f th ree g u id in g
p rin cip les o f su sta in a b le d is sem in a tio n3. add itional co m p le m e n t o f p ictu re o f multi
disc ip lin ary s ta k e h o ld er s a s a g e n ts o f c h a n g e
C om plem ent A
Three important factors of effective toKmic risk management of non-englim red buildings:1 OtrfiCt frtvolvern»nt of MulUdmcipilnaiy Sweiio.'2 Strsngtrinni.-^ of bocal Ciwcititts
• n&v&ioprng local fctt&rtfup• qcMlductiifg parikuji^ory appi ouches• incmashv,} public spi&mic uwaren v»-a
: P-J-n-rty OcHWief utlfm
The first draft was developed through critical review of literature and existing frameworks
Second draft of the framework
1 Fifty seven pairs of characteristic-indicators \
A. Seismic hazard a n a ly s is# -? ;
i. Seismic risk assessm ent
C Seismic risk response
* j 57. Gorxj example* m real .
i
C oinptoinent A Complement B
flirue nriptirhmt tjciort. -f u g3Thf*e guiding principles of sustainsman«Hjoment of noo-ongimn f ffretur#* In the grase root
U»: >n taWt-u s-\ ?.’• govemmmrt ro!•* is the t><*cXbc «2. S*-r*se»vttlVs?’i*'z* l.Of.iO t * i'i: rfcfj-ir.rrVn-Ui.-in intmliuf
i t r u p u U t - .-.c The fhp**e»g« eboukf convince i
rJThe second draft was developed from the first draft via a questionnaire survey and selected interview
Figure 8.5 C om parison betw een ’the first draft o f the fram ew ork’ and ’the second draft o f thefram ew ork’
8.4 Sum mary
A postal questionnaire survey and interview w ere conducted in order to refine the conten t o f ‘the
first draft o f the proposed fram ew ork’, to be authenticated and validated by a large num ber o f
key decision m akers in Indonesia and explored further for better understanding. A ltogether, 875
questionnaires w ere distributed am ong nine types o f stakeholder and 305 w ere returned, equating
to a response rate o f 34.9% . Surprisingly, 84.36% o f respondents assigned all statem ents in the
questionnaires as im portant or very im portant w ith an average m ean score o f 4.187. In general,
there was strong agreem ent am ong respondents as to the h ighest and low est im portance o f the
statem ents in the questionnaire, and all respondents w ere relatively hom ogenous and share the
sam e characteristics.
261

The fifteen most important statements o f SRRNEB to be carried out in Indonesia include:
earthquake occurrence data dissemination, existence o f information for pro-poor strategies,
resource mobilization for expert staffing allocation, existence o f deterministic and probabilistic
earthquake scenario, existence o f regulation o f builders, existence o f seismic codes with simple
language, existence o f seismic risk map using Geographic Information System, continuity of
dissemination channels, good examples in real constructions, existence of inventory data: soil
profiles and buildings, existence o f seismic risk reduction as a policy priority, availability and
accessibility o f information in introducing seismic features o f buildings.
Two questions about the importance o f technical intervention and the sustainable dissemination
issue emerged as a result .of the questionnaire survey. The selected interviews with nine
respondents was carried out to elicit a richer and in-depth story as well as dynamic patterns
according to the two questions. The interview course revealed three reasons why people tend to
assign high importantance to technical intervention i.e. (1) a direct relationship with physical
vulnerability, (2) people’s lack o f understanding o f government functions, and (3) the
importance of earthquake data. In addition, three guiding principles o f sustainable dissemination
also emerged, i.e. (1) the government should act as a proactive backbone o f the dissemination
initiative, (2) the dissemination mechanisms should use existing social bonds and/or indigenious
method, and (3) the dissemination message should convince the community member that the
implementation o f seismic codes is easily achievable under their control. The interview revealed
that the government role was very crucial, and was even given the highest importance according
to the successful seismic risk management of non-engineered buildings via a pro-active approach
of informing, motivating, and engaging grass root communities in all aspect o f SRRNEB in their
own local circumstances.
Combining the results o f the questionnaire survey and interview, ’the first draft o f the proposed
framework’ was then refined to be ’the second draft’. The refinements from the questionnaire
survey were only three additional ideas in Statement Numbers 1, 38, and 57. In addition, the
three guiding principles o f the sustainable dissemination o f seismic features to the grass root
community and a map of multidisciplinary stakeholders as agents o f change were quite essential
to complement the proposed framework more comprehensively and will also easy to implement.
262

Chapter IX Workshop Event for Data Collection and Analysis,
and Contribution to Wider Knowledge Drawn from Overall Data Collection
The questionnaire survey and interview data collection was presented in the previous
chapter. This chapter mentions the subsequent phase o f primary data collection, i.e. the
workshop event. The workshop topic was ‘Seismic Risk Management o f Non-Engineered
Buildings’. The primary aim o f this chapter is to describe data collection methods using the
workshop event and to analyse the results in order to refine ‘the second draft o f the proposed
framework’ into ‘the final framework’. This is also conducted to validate and authenticate
the findings that emerged from the previous chapter. This chapter starts with a rationale o f
the workshop and then moves to describe the workshop structure. The subsequent section is
the core o f this chapter, describing its result and analysis. The framework refinement then
follows. A section o f contribution to wider knowledge drawn from overall data collection
and the summary section provide the conclusion. This summary provides brief background
information on the workshop, describes the facilitation processes used in the discussion, and
summarises the results o f the discussion.
9.1 Rationale for the Workshop Event
Two data collection methods were already utilised, in which each respondent expressed their
opinion individually. Since the complex, interdependent, and dynamic problem o f seismic
risk is subject to evolution over time, developing the framework for guiding and monitoring
SRRNEB is better achieved not only through individual respondent’s opinions, i.e. a
questionnaire survey and interview, but also through a complementary method, whereby
various stakeholders can share and argue their opinion and position directly and openly, and
also consider the ideas o f others. This type o f data collection is more relevant to formulate
and solve multiple dimensions o f the problem from different perspectives. Therefore, a
workshop event is highly selected because it is highly interactive, combining presentations
263

and exercises, discussion in small groups and a plenary session. In addition to the previous
two data collection techniques, this method also facilitates well-founded and plausible
arguments about the significance o f the data generated in order to confirm the sense of
validity to arrive at comprehensive, overall research findings.
9.2 Workshop Structure
The primary aim o f this workshop was to bring together many stakeholders in a discussion
forum in order to evaluate and refine ‘the second draft o f the proposed framework’, which
was already structured coherently through a review o f literature and three existing
frameworks and an analysis of the questionnaire survey and selected interviews, into ‘the
final framework’. The notion was that the stakeholders were better equipped to formulate the
complicated future risk than theoretical approaches and an extrapolation o f trends; also, they
had both the appropriate knowledge and problem solving skills. The workshop aim was not
to lead to a kind of consensus, but rather to critically identify elements in ‘the second draft’
which needed to be improved or refined. This focused on finding relevant arguments, rather
than focusing on the specific output. Therefore, the brainstorming technique constituted the
major activity during the workshop.
The event took place on Friday, 22nd September 2006 under the name ‘Workshop on Seismic
Risk Management o f Non Engineered Buildings’ at the Centre o f Earthquake Engineering,
Dynamic Effect, and Disaster Studies (CEEDEDS), Islamic University o f Indonesia (UII). It
was administered in association with the Faculty o f Civil Engineering and Planning, UII. An
established research committee served as a workshop committee; the author acted as the
workshop facilitator. Those participated in the workshop included 18 people, who
represented a mix o f nine types o f stakeholders. The participants were specifically selected
from the people who had taken part in the questionnaire survey and/or interview and were an
important person within each stakeholder organisation, regardless o f their regency, city,
province, or national work-scope levels. The participants were categorised to remove names
or any reference made to any other organisation or person by name, as described in Table
9.1.
264

T able 9.1 Profiles o f the workshop participants
No Categories Workshop participants
1 Researcher A Position: University lecturer and practitioner in Residential Architecture2 Researcher B Position: University lecturer and practitioner in Disaster Management3 Contractor Position: Director of Medium Contractor4 Foreman A Position: Individual foreman5 Foreman B Position: Individual foreman6 Government A Position: Government Staff in Meteorology and Geophysics Board7 Government B Position: Government Staff in Disaster Management8 Businessman A Position: Research and Development Staff of Real Estate Association9 Businessman B Position: Real Estate Firm Staff10 Educator A Position: School Headmaster11 Educator B Position: High School Teacher12 NGOA Position: Director of Community Development NGO13 NGOB1 Position: Disaster NGO staff14 NGO B2 Position: Disaster NGO staff15 Com. Leader A Position: Head of a neighbourhood administrative structure16 Com. Leader B Position: Head of a village administrative structure17 Reporter A Position: Deputy Editor of a local newspaper agent18 Reporter B Position: Senior reporter of a national newspaper agent
In addition, like the previous interviews, it was believed that introducing the term of
systemic seismic risk management o f non-engineered buildings to the Indonesian people was
not an easy task due the non-existence o f preventive culture to reduce seismic risk in all
Indonesian regions. To overcome such identified problem, prior to the workshop, every
prospective person who was targeted to participate in the workshop was approached and
properly briefed in a small face-to-face discussion (about 1-3 weeks prior to the workshop
date) in order:
a. to receive a bundle o f workshop material (i.e. an invitation letter, workshop time table, a
list o f prospective workshop participants, a copy o f ‘the second draft o f the proposed
framework’, 3 pieces of blank paperwork, each with an instruction for the participants to
write additional ideas in relation to ‘the second draft’, and a map to find the workshop)
b. to introduce the purpose of the overall workshop event (also to inform who will be
involved, and what the benefit, value, and feedback will be to the participants and the
others)
c. to stimulate brainstorming ideas by asking them to read and study carefully ‘the second
draft o f the framework’ and then to write as many additional ideas as possible for the
evaluation or refinement o f ‘the second draft’ on the paperwork available as homework
and to bring it to the event. This was to ensure that the participants were properly briefed
as to their duties.
265

Because ‘the second draft o f the framework’ was structured area-by-area, using work-
breakdown-structure, in clear and simple language to be understood easily, the workshop
participants conducted the initial structured brainstorming session in their home in order to
utilise the workshop time effectively. The overall workshop activities are presented in Figure
9.1:
Prior to the workshop
Every prospective person who was targeted to participate in the workshop was approached and properly briefed (about 1-3 weeks prior the workshop date) in a small face-to-face discussion in order to• to receive a bundle o f workshop material (including “the second draft o f the proposed
framework”)• to introduce the purpose of the overall workshopevent• to stimulate brainstorming of ideas by asking them to read and study carefully 'the
second draft o f the framework' and then to write as many additional ideas as possible for the evaluation or refinement of 'the second draft' on the paperwork available as homework and to bring it to the event
During the workshop(22 Septem ber 2006), x V V / ./ > • / / / /
• • • • • • •08.30 am 09.00 am 09.10 am 09.30 am 10.45 am 11.30 am
Figure 9.1 Workshop program: activities prior to and during the workshop
One copy about enlightening example o f framework for seismic risk management in India
and Nepal was circulated to all participants, as additional workshop material. In the
beginning, there was an introductory presentation by the author, introducing the purpose of
the event and including a presentation on the recent adoption o f seismic risk management
strategies in Nepal and India as a good example o f two case studies. The presentation
provided a short, high-level briefing on ‘the second draft o f the framework’, as this matter
had been already introduced to the participants prior to the event, the rules o f discussion, and
the proposed time. This also highlighted that the input required from the participants was
their opinion or comments for the evaluation and/or refinement o f ‘the second draft’, the
output was the agreement for the refinement achieved, and the next step would be a
266

suggestion for further concrete action to many parties, particularly for government agencies;
it also served as the author’s PhD data collection.
The following session was the main part o f the workshop. The core o f the workshop was
divided into two phases, i.e. a small group discussion and a plenary session. Because the
participants had already prepared and exercised the workshop information before attending
the event, the discussion did not need any other exercise and thus time usage during the
workshop was very effective. There were two principal rules employed in the discussion, i.e.
(1) criticism was disallowed to permit unique and individual opinions to emerge and (2)
freewheeling and improvement were welcomed to allow individuals to offer differing
perspectives and to generate better ideas by building upon the other ideas.
In the small group discussion, the participants were divided into two groups, each reflecting
the mix o f professions in the room. One graduate from the Civil Engineering Department and
the author facilitated this session, each accompanied with a person as documenter. The
documenter was responsible for recording important outcomes o f the discussion in the blank
paperwork. The session aimed to obtain some unique ideas from the participants on how to
reduce seismic risk comprehensively on non-engineered building, particularly on residential
houses with regard to the content of ‘the second draft of the framework’. As much as
possible, the discussion environment was situated using flexible, simple, and clear language
to ensure open channels of communication. The participants presented their argument and
also considered other perspectives; most o f their comments were based on the previous
brainstorming exercise at their home, which had been already written in their paperwork.
This facilitation tool generated many productive ideas and also the available amount o f
workshop time was able to be used effectively.
The next session was the plenary session, where all respondents met together in the same
room to discuss what had been achieved from the previous small discussion. It began with
the two documenters reiterating the important outcomes o f the small discussion; again, the
participants discussed openly and synergistically. The last session was the concluding
remark where the facilitator outlined some the workshop deliverables, which were presented
meaningfully and reflected exactly what the participants ‘built’ in the workshop. They were
also motivated to further participate by disseminating the value from the information they
received and the expected result o f the process. To manage time effectively, there was no
break for tea. A light snack and juice was served during the session.
267

After the closing o f the event, some of the participants left their paperwork (as their
homework), explaining the logic of their ideas to the committee for further confirmation of
their comments. As a general assessment, each participant contributed significantly to the
formulation o f the workshop results and participants did not seem fatigued by the discussion
over a productive time for about three hours. In general, the participants commented on
matters that were already included in the content o f ‘the second draff; only a few items were
added to the refinements.
9.3 Workshop Results, Analysis, and Findings
Altogether there were 18 people participating in the workshop, in both Group A and B as
well as in the plenary session. Overall discussion was digitally recorded using ‘Coolsoft
Power MP3 Sound Recorder’ software and transcribed. According to the nature o f workshop
event, the qualitative approach was chosen as being suitable for analysis. The data was then
analysed using NVivo software, version 2.0. The software helped to code the data and
identify themes and/or patterns generated. The analysis is presented under the same order as
used in ‘the second draft o f the proposed framework’ (see Table 5.28). Table 9.2 presents the
distribution comments, which are related to the 57 statements (pairs of characteristic-
indicators) already written in ‘the second draft’. In addition to Table 9.2, Tables 9.3 and 9.4
describes the additional and new ideas achieved from the discussion respectively. Statement
Number 1 is coded by SI, Statement Number 2 is assigned by S2, and so on.
It is needed to highlight that this workshop event was a technique for qualitative data
collection adopted for the research. Generally, the essence o f qualitative assessment is its
dependence upon people judgement. Good people are the key to good qualitative assessment.
Thus, selection o f appropriate personnel, proper orientation o f them for the assessment, and
effective management o f their assessment are crucial for credible and reliable assessment.
Besides the people judgement, some other research findings or literature can also strengthen
the qualitative findings. At last, an approach is needed to encourage more formal processes
in qualitative assessment so that their findings will be less subject to individual prejudice and
bias, and so that findings from such assessment will be more repeatable (a characteristic of
valid assessment).
In order to achieve some valid workshop findings and less subject to individual bias, the
researcher came up with a structured triangulation approach that two senior lecturer as the
research committees already helped to evaluate and review the workshop findings, based on
268

general agreement that any method that is used to help researcher to think more effectively
and systematically would probably be useful in research formulation. Furthermore, the
workshop participants were key important people, and the findings from previous
questionnaire survey and interviews also strengthened the workshop findings. Therefore, the
workshop finding validation as presented in Tables 9.2, 9.3, and 9.4 involved the use of
some research data and two evaluators (i.e. workshop participants’ comments, the
questionnaire and interview findings, and the two senior lecturers serving as evaluators from
the established research committee). The details o f validation method for the workshop
findings are presented in Table 9.5.
269

Tabl
e 9.2
D
istrib
utio
n of
com
men
ts co
llect
ed
in ac
cord
ance
wi
th 57
pairs
of
char
acte
ristic
-indi
cato
rsin
the
wor
ksho
p
L g jaquinjq juauiajtns 7 -95 jaquinfq juauiajtns ■
55 jaqumjq juauiajms •t?5 joqumfq juauiajtns >■ -£5 jaqumfq juouiajms 7 -25 jaquinjsj juaiuajcisj 5 jaquintq juouiajcjs |Of jaquinfq juaiuajcjs |6£ jaquinjq juauiajtns8t> jaquinjq juauiajcis > (Ni p joquinfvi juauiauns 1g p jaquinfsj luauiajcis 1g p jaquinjsj juauiajtns 1p p jaquinjq juauiajtns 1g p jaqiunfsj juauiajtnsZ p jaquinjsj juauiajtns 7 7 <N
wqtun^j juauiajtns 7 >Otr Jaquinfvj juaiuajBis 7 -6£ jaqiunfsj juauiajtns •8£ jaquinfq juaiuauns > 7 >LZ Jaquinfsj juaiuauus 7 -9£ jaquinfsj juauiajtns ■5£ jaquinfsj juauiajtns 7 7 > 7t>£ jaquinfq juauiajtns •££ ioqumjq luauiajcis 7 -ZZ Jaquinfsj juauiajtns > > 7 > *rI £ jaqumjq juauiajtns •0£ jaquinfsj luauiaicjS •6c Jaquinjsj juauiauns > -82 jaqiunfsj juauiajtns •L Z JaqmnN juauiajtns 7 7 7 > 7 7 > 7 -p- 7 7 7 7 7 7 7 VO
92 jaquinjsj juauiajtns ■52 jaquinjsj juauiauns •P Z Jaquinfsj juauiajtns I •£2 Jaquinfsj juauiajtns | •22 Jaquintq luauiajcis 7 1 •>| (N12 inquinfsj juauiaitns i <02 Jaquinfsj luauiauns V 7 7 ro61 jaquinfsj juauiajtns 7 -*8[ Jaquinfsj luauiajtns ■L I jaquinfsj juauiajtns 7 7 ■7 7 • r9[ jaquinfsj juauiajtns '?■ 7 IN5 j jaqiunfsj juaujojins > -jq Jaqiunfsj juauiajins > > CS£j jaqiunfsj juauiauns > > <N21 jaquinjsj juauiajtns 7 > > 7 7[ j jaqiunfsj juauiajcis •01 Jaquinfsj juauiajtns 7 7 7 7 7 7 7 r-6 jaquinfsj juauiajtns 7 -8 Jaqiunfsj juauiajtns 7 <NL jaquinfsj juaiuajtus > V > V 7* "V 7 O
9 jaquinjsj juauiajtns ■5 jaquinjsj juaiuajnjs •j- jaquinfsj juaiuajeis£ jaqiunfsj juauiaims •2 jaquinjsj juauiauns < e 7 7 (Sj jaqiunfsj juauiajtns ft
9a9 > 7 7 s 7* i <n
Wor
ksho
ppa
rtic
ipan
ts
J-oc•£9
5
u8 '€ ££ C
ontr
act-
A <;e££
Gov
emn-
Al
1 B
usm
ss-A <
89
s
<6oz
<MV
ea
Rep
ort-
A uOato
9
5
Res
earc
-BI
£E£
Gov
cmn-
BB
usin
ss-B
Edu
cat-B
NG
O-B
l
paOOz
cA•OCJ2G
8
Rep
ort-
B .20(/}&Clc
u8CCti B
usin
ss-A
Rep
ort-A
^ c6c£p0a
NG
O-B
lR
cpor
t-B
Num
ber
of
com
men
ts
270
1. Sy
mbo
l V
indi
cate
s a
conf
irmat
ion
that
the
re
leva
nt s
tate
men
t wa
s co
mm
ente
d by
part
icip
ant,
and
prob
ably
ne
eds
to be
refin
ed
or im
prov
ed2.
The
high
er n
umbe
r of
com
men
ts
does
no
t re
flect
to
the
high
er
impo
rtanc
e le
vel
3. St
atem
ents
wi
th
no co
mm
ent
indi
cate
th
at t
hese
st
atem
ents
are
im
port
ant
and
do no
t ne
ed
refin
emen
ts

T able 9.3 The four additional ideas collected from the workshop event
No Additional ideas Exploratory analysis
1 Additional idea of a ‘building construction permit’As businessman A commented:“.... to fulfil the legal aspect, the regulation to get a ‘buildingconstruction permit’ mentions some requirements for structural analysis......”
Moreover, government staff A stated:“....it should be highlighted here that the house owner should have a proper ‘building construction permit’........ ”
This additional idea of a ’building construction permit’ was added further to Statement Number 12 (SI2)
2 Additional idea of ‘city construction control committee’As the businessman A said:“.... for example: establishing a kind of ‘city construction controlcommittee’ like in Jakarta, where there is a TPKB: Tim Pengendali Konstruksi Bangunan...”
This additional idea of a ’city construction control committee’ was added further to Statement Number 14 (SI4)
3 Additional idea of ‘formal fit for sale certificate”As the businessman A commented:“....we will issue a kind of ‘fit for sale certificate’ to every product (house) we are selling ...”
This additional idea of a ’fit for sale certificate’ was added further to Statement Number 12 (S12)
4 The additional idea about ‘city-wide’As community leader A stated:“....if the government struggles to do this, for example through village administration....we as neighbourhood administration staff should be invited into the many initiatives such as physical development. I think it is not a difficult task”.
Moreover, foreman A elaborated:“........There is an urgent need for the existence of a properdissemination method which is more straightforward, going down through the grass roots community for better understanding.....”
This additional idea of ’city wide’ was added further to the Statement Number 17 (SI7) and 37 (S37)
271

Table 9.4 The six new ideas collected from the workshop even t.(which were fully added in the proposed framework)
No New ideas
1 Core areas: Seismic Risk Assessment Characteristic: Land use application Indicator:Existence o f followed-up program o f damage assessment in relation to the city spatial planning under ‘the city spatial planning board’
As businessman B said:“....he was dead because o f the falling wall. I saw that their house stock was built very densely. On the other hand, they had a large property area....but they prefer to build their house closer to the others. I think it needs regional building stock planning, not just individual building...”
Moreover, government B commented:“...at Jakarta, the access to their house is disorganised...therefore the evacuation process in the densely populated areas (during and after an earthquake event) is not easy. Thus the layout o f the planning (in the region) should be considered...”
2 Core areas: Seismic Risk Assessment Characteristic: Land use application Indicator:Existence o f balanced information between a ‘geographic seismic risk map’ and a ‘geographic city economic development map’ for a better understanding for public and investor
As businessman A said:“....at the moment there is a map o f fault line which is considered to be ‘a daunting map’. Then, the daunting map is overlapped with a land use planning map, and also overlapped with a property land map belonging to the certain people who own the land, which is a productivepaddy field located just over the fault line....... Soon after the map o f fault line is published, theeconomic value o f the land w ill fall dramatically...”
3 Core areas: Seismic Risk Assessment Characteristic: Land use application Indicator:Community members and many stakeholders become involved in seismic risk map dissemination and communication
As reporter A mentioned:“...it is very possible, very possible to publish it (seismic risk map) in the newspaper....”
Moreover government staff B added:“...but i f I release it (a map o f fault line) openly to the public, this w ill cause a benefit or drawback. I prefer to give this to competent and responsible parties so that everything is clear....”
272

T ab le 9.4 continued
4 Core areas: Seismic Risk Assessment Characteristic: Building interior layout Indicator: Existence of information about a seismic resistant
Interior layout: disseminated and communicated to the public
As government staff B suggested:“...as long as a strong building can withstand the earthquake shaking, if the building interior layout is not proper, during the earthquake the building structure probably will not collapse, but this event can cause fatalities because of falling objects....”
5 Core area: Public awarenessCharacteristics: Monument of tragic earthquake event Indicator: Existence of monument to commemorate the tragic
Event of an earthquakeAs foreman A stated: “....I have seen many monuments on street comers to commemoratesomething. Perhaps, we can build a similar monument as well for this last earthquake occurrence....”
6 Core area: Public awarenessCharacteristic: Dissemination and use of traditional/indigenous
knowledge through media involvement in communicating seismic risk
Indicator: Existence of artist involvement in communicating Seismic features
As foreman A said: “...I think it is possible to involve artists in communicating seismic risk through their shows and exhibitions...”
Moreover, reporter A added: “....this idea (involvement of the artist) is brilliant, because our community like ‘watching’ rather than ‘reading’....”
273

T able 9.5 Establishing the validity o f the w orkshop findings
N o W orkshop findings How to validate the findings
1 Table 9.2 D istribution o f the w orkshop participants' com m ents
The findings w ere supported bya. The com m ents from w orkshop participantsb. The questionnaire and interview findingsc. The evaluation from the established
research com m ittee2 Table 9.3 The four additional ideas
collected from the w orkshop eventThe findings w ere supported by
a. The com m ents from w orkshop participantsb. The questionnaire and interview findingsc. The evaluation from the established
research com m ittee3 Table 9.4 The six new ideas
collected from the w orkshop eventThe findings w ere supported by
a. The com m ents from w orkshop participantsb. The critical evaluation from the established
research com m ittee
Beside Tables 9.2, 9.3, 9.4, and 9.5, Figure 9.2 presents the findings o f the w orkshop event
w ith the assistance o f N V ivo software:
L* $ $ !f§§|8 5* TpS p i i f p P p f l . . . - g i ls l *1
1 1!f§ ♦ « j & 0 8> Y >
B row se Proper* iw A ttribu tes | PocUnks N odeL m k I EditSsfc A ssay Search
Nodes Nodes in /Support to the contents
Trees (42) ǤSi Title No, Passages Created Modified
- JJ. New ideas 4 Statement Number 1 1 7 02/06/2007 - 20:07:54 02/06/2007-21:51:27
4 C ity s p a t i a l p la n n in g 4 Statement Number 2 2 2 02/06/2007 - 20:08:09 02/06/2007-22:01:16
4 B a la n c e d in f o r m a t io n t o t h e g e o g r a p h 4 Statement Number 7 3 11 02/06/2007-20:08:24 02/06/2007-21:51:40
4 S e is m ic r i s k m a p d i s s e m in a t io n 4 Statement Number 8 4 2 02/06/2007 - 20:08:48 02/06/2007-21:53:07
4 B u ild in g i n t e r io r l a y o u t 4 Statement Number 9 5 1 02/06/2007 - 20:09:01 02/06/2007-20:32:11
4 M o n u m e n t t o c o m m e m o r a t e 4 Statement Number 10 6 10 02/06/2007 - 20:09:20 02/06/2007-21:46:59
4 I n v o l v e m e n t o f a r t i s t 4 Statement Number 12 7 5 02/06/2007 - 20:09:41 02/06/2007-21:47:23
j - Additional ideas 4 Statement Number 13 8 2 02/06/2007 - 20:11:05 02/06/2007-20:57:52
4 B u ild in g c o n s t r u c t i o n p e r m i t 4 Statement Number 14 9 2 02/06/2007 - 20:11:31 02/06/2007-21:48:58
4 C ity c o n s t r u c t i o n c o n t r o l c o m m i t t e 4 Statement Number 15 10 1 02/06/2007-20:11:57 02/06/2007-20:49:13
4 Fit f o r s a l e c e r t i f i c a t e 4 Statement Number 16 11 3 02/06/2007 - 20:12:18 02/06/2007-20:52:06
4 C ity w id e 4 Statement Number 17 12 5 02/06/2007 - 20:12:52 02/06/2007-21:53:15
- Support to the contents 4 Statement Number 19 13 1 02/06/2007 - 20:13:07 02/06/2007 - 21:42:44
4 S t a t e m e n t N u m b e r 1 4 Statement Number 20 14 3 02/06/2007-20:13:36 02/06/2007-21:24:47
4 S t a t e m e n t N u m b e r 2 4 Statement Number 22 15 3 02/06/2007 - 20:13:59 02/06/2007-22:01:08
4 S t a t e m e n t N u m b e r 7 4 Statement Number 27 16 19 02/06/2007-20:14:18 02/06/2007-22:01:23
4 S t a t e m e n t N u m b e r 8 4 Statement Number 29 17 1 02/06/2007 - 20:14:33 02/06/2007-20:41:53
4 S t a t e m e n t N u m b e r 9 4 Statement Number 32 18 4 02/06/2007-20:14:56 02/06/2007-21:38:40
4 S t a t e m e n t N u m b e r 10 4 Statement Number 33 19 1 02/06/2007-20:15:10 02/06/2007-20:34:22
4 S t a t e m e n t N u m b e r 12 4 Statement Number 35x . . . . .
20 4 02/06/2007 - 20:15:27 02/06/2007-21:51:56v 14 S t a t e m e n t N u m b e r 13 < S i |S 8 |iS ^ S § I |i||i§ - . . > . J4 S t a t e m e n t N u m b e r 1 4 y
i
1 A
Figure 9.2 N V ivo screen display o f the nodes created from the workshop event
274

The following explanations and interpretations emerge from an analysis o f the results shown
in Tables 9.2, 9.3, and 9.4 as well as the additional participant comments gathered during
the event.
a. In general, all participants reached a general agreement on some resolved fundamental
principles and their associated elements in the proposed framework that could be
applied on a common basis at a local level (as well as national) and institutional
adaptation. All were unanimous in agreement with the value added from this exchange
o f ideas.
b. In discussing these elements o f ‘the second draft o f the proposed framework’, every
participant seemed to comment on the information that was already included in the
content o f the proposed framework from their own special interest. Their comments
were distributed, along with the 57 statements. The top four comments were in the areas
o f the dissemination o f information (S27), political commitment (S7), seismic codes
(S10), and law enforcement o f seismic codes (S12). However, some statements did not
receive any comment at all, such as the core area o f social and economic development
practices (S50, S51, and S53).
c. The discussion about dissemination emerged frequently among participants, about 16
times. This finding also verifies the finding o f the open-ended question in the
questionnaire survey. Because the idea o f dissemination is very critical, it is urgent for
three guiding principles for dissemination to the grass root communities (as the finding
from the selected interviews) to be understood for the successful implementation o f
seismic codes. It is believed that if people had a high awareness about seismic risk and
the importance seismic codes, then they would implement the code voluntarily. The
additional idea o f ‘city wide’ for dissemination also supports this finding. The issue o f
dissemination is probably raised very frequently (and also in the previous data
collection) due to the fact that many hard copies o f the implementation o f seismic
features are available to the public and are easy to access after the tragic events in Aceh,
2004 and Yogyakarta, 2006, but the mechanism to ensure people translate from the hard
copy to real construction is still low. The most challenging part is not finding the tools,
but realising that a seismic event is a real fact; we cannot predict when it will happen or
how big the magnitude will be, and it is therefore better to grasp it rather than denying
or ignoring it.
275

d. Again, a lack o f political commitment (S7) was stressed as a challenge by participants.
This situation is truly similar with the finding o f the previous selected interviews, where
decision-makers in government agencies and legislative council constituted the highest
level o f agents o f change. Government staff A mentioned three main inhibiting factors
in current disaster management activities, i.e. (1) frequent rotation of government key
staff, (2) factors in relation to the decentralisation process, and (3) inadequacy of
government capacity to cope with the complex problem o f disaster management. The
comment about ‘frequent rotation’ o f key staff was captured as follows: “ I am
sometimes confused by the frequent senior key staff turnover in their position. Also,
particularly, we see when our President change ministers, thus there are new policies
which are different to the previous ones....”. One of the possible solutions for the first
factor is to develop a widely agreed ‘grand master plan or road map for disaster
management’, so that eveiyone who is a key government decision maker should refer to
it in order to accomplish a solution to the problem in the right direction in the same
language. The NGO B1 commented: “ it is important to develop a comprehensive
plan with integration between development planning and disaster management
strategies...”. In addition, government A stressed: “ very often we cannot coordinate
the (disaster management) process with regency or city government because o f the
current decentralisation arrangement...”. Following that theme, the NGO B1 said:
’’...BAKORNAS, SATKORLAK, and SATLAK should be revitalised totally. Their
capacity is too low. The organisation is very weak and their staff knowledge is
inappropriate....” . The possible solution for this, drawn from the essence o f the
discussion, is to revitalise three essential levels o f capacity in the disaster management
organisation. The first is revitalisation in the systems level, i.e. the regulatory
framework^and policies, the second is revitalisation in the institutional level, i.e. the
structure of organizations, and the third is revitalisation in the individual level, i.e.
individual skills, qualifications, and knowledge. Moreover, community leader B stated:
” one week after the last earthquake, no government agencies produced concrete
actions ”.
e. The next key element that is essential to reducing seismic risk is the importance of
seismic code and its enforcement. Here, the term ‘building construction permit’ was
suggested to emerge clearly in the proposed framework, as pointed out by businessman
A and government staff A. This finding confirms that the enforcement o f the
implementation o f seismic codes should become a high priority o f the many
requirements for people in order to receive ‘the building construction permit’. It is well
276

believed theoretically that if the government rigorously enforces the regulation o f a
‘building construction permit’, the seismic code will also be implemented by people. As
a result, many and many more buildings will be equipped with seismic features.
Furthermore, the exposure to seismic risk will dramatically decline. In reality, the
success o f this mechanism lies in the coalitions o f city stakeholders around local
government policy makers, who are in charge o f the issuance o f ‘building construction
permits’ along with their management o f urban growth and land use planning.
f. The inspiring findings come from the new ideas captured from this discussion. There
are six new ideas focusing on the core area o f seismic risk assessment and public
awareness. These are: (1) city spatial planning, (2) balanced information on the
geographic seismic risk map, (3) seismic risk map dissemination and communication,
(4) building interior layout, (5) a monument to commemorate the dead, and (6)
involvement o f artists in communicating seismic risk. All the new ideas emerged during
the plenary session, except for number four, which appeared during the small discussion
and was then repeated in the plenary session. The involvement o f artists emerged due to
the fact that common people like ‘watching’ rather than ‘reading’. Overall processes o f
capturing new ideas indicate that the second phase o f the workshop, i.e. the plenary
session, enabled participants to partake in a more intense discussion to generate new
ideas.
g. The NGO B1 affirmed strongly that the key criteria o f success would be the existence o f
a mixed government-public administrative structure responsible for disaster reduction.
The existence o f this mix-structure would identify, guide, and monitor the risk
comprehensively, be less bureaucratic, and not too regimented. In addition to this, the
allocation o f a permanent, adequate budget dedicated to the implementation o f disaster
risk reduction was an essential challenge, as mentioned by reporter B. These comments
support S17 and S22.
h. The NGO B1 also stressed, the integration o f disaster reduction into development
planning twice, both in the small discussion and the plenary session. This also
highlights the importance o f establishing linkages with relevant existing frameworks,
such as the city decentralisation process, community development, and poverty
reduction to ensure continuity and consistency for effective integration o f disaster risk
reduction into the comprehensive development process. This idea is in line with S8.
277

i. Discussion about the importance o f seismic data in SI also emerged, although the
participants commented on it about five times. Nevertheless, the relatively high intense
discussion on this matter supports the postal questionnaire findings, where an average o f
305 respondents designated SI as o f the highest importance to be disseminated and
communicated to all community members. In addition to the seismic data, the
construction practice o f non-engineered building emerged in the discussion, particularly
about the importance of training in safe-building practices and retrofitting techniques.
In summary, the workshop event was successfully conducted by achieving feedback and
comments for the refinement o f ‘the second draft o f the proposed framework’ into ‘the final
proposed framework’. Even though the term o f systematic seismic risk management o f non-
engineered buildings was a relatively new initiative, all participants highly appreciated the
content o f ‘the second draft’, and there are six new ideas or statements which will be added
to the refinement. Most o f the comments so far conform to the previous findings from the
questionnaire survey and selected interview; Some comments about activities within disaster
responses, such as how to reduce stress after the disaster, also emerged in the discussion but
this was ignored as being beyond the scope o f the research work.
9.4 Refinement of ‘the Second Draft of the Framework’ into ‘the Final Framework’
Given the findings o f the above workshop event, this section elaborates on some refinements
o f ’the second draft o f the framework’ into ’the final framework’. ’The second draft o f the
framework’ consisted o f 57 pairs o f characteristic-indicators and was complemeted by (1)
three important factors o f good seismic risk management o f non-enginered buildings, (2)
three guiding principles for dissemination, and (3) a map o f agents o f change, which was
formed in Figure 8.4. Here, there are two principal refinements for ’the second draft o f the
framework’. The first refinements are the six new statements and the second refinements
deal with the additional ideas within the pairs o f characteristic-indicators.
The new six statements (or pairs o f characteristic-indicators) are as follows:
a. Core area: Seismic Risk Assessment, i.e. (1) city spatial planning, (2) balanced
information on the geographic seismic risk map, (3) seismic risk map dissemination and
communication, (4) building interior layout,
b. Core area: Public Awareness, i.e. (1) monument to commemorate the dead, and (2) the
involvement o f artists in communicating seismic risk.
278

The nature o f the new ideas they allude to four technical interventions and two non-technical
interventions. Thus, the final number o f pairs o f characteristic-indicators in ’the final
framework’ are 63 pairs. The additional ideas within the 57 pairs o f characteristic-indicators
are in S12, S14, S17, and S37. The overall refinements are presented in Table 9.6:
Table 9.6 The refinements for ’the second draft o f the framework’
No Characteristics Indicators
A New pairs of characteristic-indicators
a. Core area: Seismic Risk AssessmentLand use application Existence of followed-up program of damage
assessment in relation to the city spatial planning under ‘the city spatial planning board’
Land use application Existence of balanced information between a ‘geographic seismic risk map’ and a ‘geographic city economic development map’ for a better understanding for public and investors
Land use application Community members and many stakeholders become involved in seismic risk map dissemination and communication
Building interior layout Existence of information about seismic resistant interior layout: disseminated and communicated to the public
b. Core area: Public AwarenessMonument of tragic earthquake event Existence of monument to commemorate the tragic
event of an earthquakeDissemination and use of traditional/indigenous knowledge through media involvement in communicating seismic risk
Existence of artist involvement in communicating seismic features
B Additional ideas within pairs of characteristic-indicatorsStatement Number 12: Compliance and enforcement.
Existence of rigorous regulation of the issuance of a *building construction permit’for builders and the issuance of the formal fit for sale certificate* for every house as a product of real estate firms for widespread* creation of seismic resistant buildings
Statement Number 14: Compliance and enforcement
Existence of systems to control compliance and enforcement in actual practices under the ’city construction control committee ’*
Statement Number 17: Implementing and co-coordinating bodies
Existence of a city-wide* administrative structure responsible for disaster reduction
Statement Number 37: Public awareness policy, programmes, and material
Existence of city-wide* specific awareness campaigns and strategies in seismic risk.
*) the refinements for additional ideas (written in bold and italic letter)
279

In conclusion, the two principal refinements have improved ’the second draft o f the proposed
framework’ into ’the final framework’. It is argued that the refinements are quite
fundamental to increase the content o f the proposed framework from 57 pairs to 63 pairs o f
characteristic-indicators. Now, ’the final proposed framework’ comprises 63 pairs o f
characteristic-indicators complemented by (A) three important factors o f good seismic risk
management o f non-engineered buildings, (B) three guiding principles of dissemination, and
(C) a map o f multidisciplinary stakeholders as agents o f change. Within the 63 pairs, there
are 19 technical interventions and 44 non-technical interventions. To achieve better
clustering, Statement Number 53 about a ’seismic risk map using Geographic Information
System’ is moved to be included under the heading: Seismic Risk Assessment and core
areas: Seismic Risk Assessment. The detail o f the final framework is attached as Appendix-
5.
Looking back at Chapter V, most o f the above contents of ‘the final framework’ in this
research project, after being validated and refined by a thorough analysis o f questionnaire
survey, interview, and workshop event, was in line with the referred existing frameworks
published by ISDR (2003), ADPC (2000), and MHA (2004). To achieve the robust proposed
framework, Chapter IX presents two other workshop events with different participants in
Yogyakarta City and Bengkulu City specifically for the validation media.
9.5 Contribution to Wider Knowledge Drawn from Thorough Analysis o f Overall Data Collection
Based on the wider critical review of literature and the existing frameworks, it is believed
that people who are living in seismic vulnerable areas should be able to live harmoniously
with the seismic risk by developing a sense o f place. Due to the growing population, together
with the expanding figure o f non-engineered buildings in developing countries, for example,
Indonesia, one o f the primary solutions to reduce seismic risk is to carry out mitigation
actions aimed at reducing losses through the implementation of seismic codes on non-
engineered buildings. Yet, the implementation o f the codes is not simply technical
intervention. This should be intrinsically linked with development planning as a whole. The
involvement o f many stakeholders sharing risk in effort and responsibility to provide
evidence that the seismic risk management o f non-engineered building is everyone’s
business, strengthen local capacity to develop local leadership, to engage local community
participation, to increase public seismic awareness, and poverty consideration; these are
important factors to achieve continuous change in these circumstances. Therefore,
280

developing an integrative framework for guiding and monitoring seismic risk reduction of
non-engineered buildings is crucial as it can be used as a starting point or a stepping stone to
incorporate seismic risk management into development planning in Indonesia.
Findings from overall primary data collections confirm that to break the reluctance of
communities to implement seismic codes, the decision makers cannot simply give seismic
code manuals or practical training to local builders and then ask them to rigorously
implement it. High awareness of seismic risk with a better understanding o f earthquake data:
their history, spatial distribution, characteristics, impact, and the existing fault line, underlies
every initiative to reduce seismic risk. If people learn to live harmoniously with seismic risk,
they will automatically strive to implement seismic codes voluntarily. Also, a high
awareness o f government key staff and legislative council will set communities tirelessly on
a better and safer development path through which they should disseminate and
communicate the seismic risk and, at the same time, enforce seismic codes through their
robust regulation.
The traditional approach, in which technical and physical intervention to reduce seismic risk
is o f the highest importance, has been shifted by a better combination o f technical and non
technical measures to put integrated management for seismic risk into practice
collaboratively. An integrated risk management approach ensures that the risks can be
managed as a part of wider decision-making. Thus, current understanding confirms that a
successful implementation o f seismic codes through voluntary people initiatives or through
regulation enforcement can be achieved by government political commitment in the first
line. It is imperative to sensitise policy makers toward seismic risk, followed by the
involvement o f many technical and non-technical actors, such as researchers, scientists,
contractors, foremen, masons, carpenters, businessmen, educators, NGOs, community
leaders, reporters, and others. Wider recognition is needed that building a culture o f disaster
prevention should become everybody’s duty o f care on a daily basis to ensure sustainability.
It means that, while initiatives and a share of the expenses may come from any other source
o f people and organizations, the central point and final decision on whether there is any
progress o f implementation mostly rests with the government, acting as public safety
decision makers.
In reality, most vulnerability and disaster occurrences are manifested at a local level, where
medium-low income populations and less educated people at grass root levels always suffer
most during disasters, and at the same time, local authorities are responsible for land use
281

planning and construction planning and control. It is vital for decision-makers at local
government levels to constantly develop deeper dialogues with the grass root communities
about the changes they need to make. In this sense, three guiding principles should be
understood by many key stakeholders when conducting dissemination to them, i.e. (1)
government involvement should act as a backbone in every initiative, (2) the use o f social
bonds and indigenous methods is imperative, and (3) the message should be achievable and
under the control o f the people. This confirms that, to achieve successful and effective
dissemination, the disseminator (such as government officials or the science community)
should visit the community group and attend existing social meetings. Innovative initiatives,
new synergies, and networks are easily absorbed over those already established. This will fit
into the existing community structures without any friction and also value everyone’s unique
contribution. This process breaks powerful psychological barriers and continues to build up
trust amongst them and also emphasises the importance o f sustainability. In relation to the
dissemination message, if people rationalise that the implementation o f seismic features in
their own house is the most effective strategy for reducing or avoiding losses and at the same
time they perceive it is practically possible and achievable and they can control it, this
strategy will have a tremendous effect on how well they can cope with change. If people
have a sense o f control and are clever enough to implement seismic features properly, then
they can also achieve a sense o f ownership, building upon a community’s collective strength
and skills. This sense o f ownership enables people to generate a culture o f prevention and
also makes community members feel part o f the effort.
The implementation of the above principles can bridge the gap between scientific expertise
and the concerned public, particularly lay people. This is far beyond technical capacity and
these principles were probably greatly neglected in the past, as many people in grass root
communities are not able to learn from disaster lessons over time. In addition, it is greatly
recommended that the disseminator have the intelligence and the sense o f humour to
intersperse the odd good joke during the course. Failure to attract the people’s attention and
sense o f control could hamper the process.
Construction in common houses is completely different from the mechanism o f engineered
construction, a modem technique practiced by many engineers; construction management,
formal contract, quantity and quality control are usually employed in this environment. Non
engineered construction practice is often driven by the local notion o f social cohesion and
spirit. Small-medium contractors, foremen, masons, and carpenters, as the main actors in
non-engineered construction practices, usually use the vernacular method, local resources,
282

and labour intensive methods, even unwritten rule without any formal contract or
arrangement. In certain cases, the homeowner sometimes has full control o f the overall house
construction process, and the builders have no bargaining power to implement a new
approach if they have. They are often less educated, had less training, less access to
information, and less attention from modem science and technology. They leam construction
practice naturally by doing and watching neighbourhood practices. In fact, they are
ultimately the major factor in governing whether the seismic features are implemented in the
construction o f non-engineered structures. Unfortunately, researchers tend to focus on
research in engineered buildings, such as high rise buildings, and are less enthusiastic about
studying the common practice o f low-rise non-engineered buildings. Based on the above
evidence, this is not a surprise, as poor design and construction are major and common
problems for non-engineered buildings, which are responsible for a very large portion o f the
losses during a strong earthquake.
To achieve change among non-engineered construction actors by introducing a new concept
o f seismic resistance is not an easy task. The first initiative should begin with providing a
better understanding o f local seismic risk and then the second is to change their construction
practice. Changing construction practice in the domain o f non-engineered construction
should focus on a better fit between a steady stream o f dissemination and communication of
local seismic risk and the skill improvement o f individual non-engineered construction
actors. Meanwhile, to achieve continuous change in a government body, there are three
levels that should be revitalised. The first is a revitalisation o f the systems level, i.e. the
regulatory framework and policies, the second is the revitalisation o f the institutional level,
i.e. the structure of organizations, and the third is the revitalisation o f the individual level, i.e.
individual skills, qualifications, and knowledge.
In all, it is very hard, even impossible to build a culture o f prevention without the
enhancement o f seismic risk awareness o f government officials, construction actors, and
community members as a whole. For grass root communities, understanding their beliefs and
needs, social cohesion and spirit constitutes the foundation to achieve change continuously.
Wide ranging reform in construction practice should be by a locally-adapted technique,
culturally accepted and compatible, local resource-based, flexible, not burdensome, less
bureaucratic, less normative, less standardised, not too regimented, not too authoritative,
moral and ethics based, and more innovative and improvised in intervention mechanisms. It
is like engineering beyond the engineer. The purpose is to provide non-engineered
construction actors and homeowners with a proper understanding o f seismic risk and the
283

sim ple im plem entation o f seism ic codes, then they are capable o f im plem enting the codes by
them selves. Figure 9.3 depicts the fundam ental elem ents to achieve change in governm ent,
non-engineered construction actors, and all com m unity m em bers and o ther organisations.
ra (. ±3 to-9 </i © cQJ © XJ ©ST-Sfi
§11 = - E E . 9
i J I s !■O c
ro a n 3 - h_- £ b © "g® 8 5 2.^
© w"o~ a.® S VO 1) .Com o a) 0) „ti o c p a>Q. ©£■§>2 © o ° 3P 8 c
C l © 8 'O n o ~ c® 3 c © ~ V ©
Government
to achieve good government in seismic risk management
Government shpuld have high awareness of seismic risk first and then should revitalize in their system, institutional, and individual level
Non-engineered construction actors(small-medium contractor, foreman,
mason, and carpenter)
to change construction practice
The construction actors should be equipped with better fit between steady flow of dissemination and communication of locally seismic risk and the importance of seismic
features and their continuous individual skill improvement
T H esrshouldbeconsidered-to
They should communication of
Community members, and other individuals and organizations
to obtain a culture of prevention
se equipped with steady flow of dissemination and ocally seismic risk and the importance of seismic features
Figure 9.3 Fundam ental elem ents to achieve change in the effective seism ic risk reduction o f non-engineered buildings, m oving from know ledge to action
It is also recom m ended that dynam ic audio-visual m edia such as film s, show s, m ovies, and
clips, be utilised to encourage people to im plem ent seism ic codes, rather than static m edia
such as posters and brochures. This is due to the fact that people prefer w atching to reading
hence the suggestion o f utilising visual m edia as an educational tool for the w ider people in
the dom ain o f non-engineered construction practice, including those w ho self-build their
home. Local authorities and others should w ork together in the im plem entation o f seism ic
codes, to com e up w ith dynam ic and innovative solutions that m eet the ir com m unity ’s needs,
rather than a centrally driven system that has a tendency to ignore local needs.
L ooking at integrated seism ic risk m anagem ent o f non-engineered buildings as an object o f
rapid change and high com plexity poses new challenges. Indeed, the new challenges m ay
seem daunting. Poor and vulnerable com m unities, w ho usually occupy non-engineered
buildings, are often ignored by key decision-m akers w hose role is not to be on the side o f the
poor people; perhaps there m ay be no clear political and financial benefit for them to arrange
th is m atter. N onetheless, the fact that earthquakes continue to claim thousands o f
unnecessary deaths every year is our m ain reason to tackle the com pelling subject. There
284

have been encouraging best practices and no lack o f brilliant local ideas for the future. All
individuals, organisations, and agencies should face this politically sensitive challenge with
the knowledge and resources that are available collectively.
Underlying the above explanation, the most challenging part o f successful seismic risk
management o f non-engineered buildings is not finding the tools, but realising and accepting
that a seismic event is simply a real fact for all people who live in a seismic prone area. We
cannot predict when an earthquake will occur or how big the magnitude will be. In addition,
a severe earthquake is low in probability, but has high consequences. Therefore it is better to
grasp it rather than denying or ignoring it. The implementation of proper seismic codes in
real non-engineered construction is the principal solution to make a substantial difference in
seismic risk reduction. A balance should be struck between communicating local seismic risk
and the importance o f seismic codes to the people, and enforcing them to implement the
codes; whilst some intense regulation is imperative, it should be non-prescriptive.
Tomorrow’s risk is a challenge for development.
9.6 Summary
The workshop event was carried out in order to comprehend research data generated after
conducting a postal questionnaire and selected interview method by inviting various
stakeholders to share and argue their opinion and position directly and openly, and also to
consider the ideas o f others. The event took place on the 22nd September 2006 under the
name ‘Workshop on Seismic Risk Management o f Non Engineered Buildings’ and was
attended by 18 people, who represented a mix o f nine types o f stakeholder. Prior to the
event, the workshop participants were asked to brainstorm ideas at their home by reading and
studying carefully ‘the second draft o f the framework’ and then writing as many additional
ideas as possible for the evaluation or refinement o f ‘the second draft’ on the paperwork, and
to bring it along to the event. This event was successfully conducted in around three hours,
and mainly consisted of two small group discussions and a plenary session.
In general, all participants reached a general agreement on some resolved fundamental
principles and their associated components in the proposed framework that could be applied
on a common basis at a local level (as well as national) and institutional adaptation. Their
comments were distributed along with the 57 statements, with the top four most mentioned
comments being in the area o f the dissemination o f information, political commitment,
285

seismic codes, and law enforcement of seismic codes. The inspiring findings come from the
six new ideas captured from this discussion, i.e. (1) city spatial planning, (2) balanced
information on the geographic seismic risk map, (3) seismic risk map dissemination and
communication, (4) building interior layout, (5) a monument to commemorate the dead, and
(6) the involvement of artists in communicating seismic risk.
The workshop findings were used for both framework refinements and validation of the
previous findings in the questionnaire and interview. There were two principal refinements
for the proposed framework, i.e. (1) six new pairs of characteristic-indicators and (2) four
additional ideas within the previous 57 pairs of characteristic-indicators. Now, ’the final
proposed framework’ comprises 63 pairs of characteristic-indicators, complemented by: (A)
three important factors of effective seismic risk management of non-engineered buildings,
(B) three guiding principles of dissemination, and (C) a map of multidisciplinary
stakeholders as agents of change.
Through the critical analysis of the overall data collection, some propositions emerged as
follows: (1) seismic risk management of non-engineered building should merge with overall
development planning, (2) a high awareness of seismic risk with better understanding of the
earthquake data underlies every initiative to reduce seismic risk, (3) a successful
implementation of seismic codes through voluntary people initiatives or through regulation
enforcement can be achieved by government political commitment in the first line and then
followed by the involvement of many technical and non-technical actors, (4) constantly
deeper dialogues with the grass root communities about the changes they need will
encourage a sense of ownership that enables people to generate a culture of prevention and to
feel part of the effort, (5) wide ranging reform in non-engineered construction- practice
should be based on locally-adapted techniques, culturally accepted and compatible, local
resource-based, flexible, not burdensome, less bureaucratic, not too regimented, and not too
authoritative, (6) the two fundamental elements to introduce a new concept of seismic
resistance to the domain of non-engineered construction practice is to give a better
understanding about local seismic risk and then to change their construction practice.
The following chapter will present two brainstorming workshop events conducted in
Yogyakarta City and Bengkulu City in Indonesia for validation of the final framework
achieved in this chapter as practical, sound evidence.
286

Chapter X Framework Validation
In the previous chapter, the final framework for guiding and monitoring the seismic risk
reduction of non-engineered buildings was developed through three phases, i.e. (1) a review
of wider literature and existing frameworks, (2) questionnaire and interviews, and (3) a
workshop event. This chapter presents two workshop events conducted in Yogyakarta City
and Bengkulu City, which were intended to be a validation tool for the final framework.
They were attended by many stakeholders, who are intended to be actually included in the
framework users. This process is the final stage of the research project, which provides
evidence that the final framework, as a result of the research project, is truly robust. The
beginning of this chapter mentions the rationale and structure for the workshop events.
Comments, feedback, and the response from workshop participants are then presented and
analysed. The next section sums up the validation process, summarising the stakeholder
views on the content of the final framework. A summary section concludes the chapter.
10.1 Rationale and Structure of the Workshop Event
It is true that ‘the final framework’ comprises 63 pairs of characteristic-indicators,
complemented by (A) three important factors of effective seismic risk management of non-
engineered buildings, (B) three guiding principles of dissemination, and (C) a map of
multidisciplinary stakeholders as agents of change. There are plenty of core areas covered in
’the final framework’ and each core area has comprehensive elements which stakeholders
and community members can address for a better and safer future for non-engineered
buildings, particularly in Indonesian cities. Therefore, validating all the core areas of ’the
final framework’ bit by bit will take an extremely long time. As a result, two workshop
events were selected as a validation method by inviting many stakeholders in a discussion
forum to assess ’the final framework’ for its practicality and validity, for moderation, or any
identifiable improvement requirements.
Similar to the rationale of the previous workshop, these two workshop events were highly
favoured at this stage, because this method is very useful to tap into the group’s knowledge,
287

energy, creativity and different views, openly and directly on the complex, interdependent,
and dynamic problem of the seismic risk reduction of non-engineered buildings. As the
proposed framework was designed to suit the common Indonesian city environment,
stakeholders from Yogyakarta and Bengkulu City in Indonesia were selected as workshop
participants through an understanding of Indonesian seismic zoning, together with the
findings of the pilot research study, as described in Chapter VII. Table 10.1 describes some
of the characteristics of Yogyakarta and Bengkulu City. The distance between Yogyakarta
and Bengkulu is around 1,030 km or 640 miles (see Figure 2.12 in Chapter II). Although the
implementation of systematic and integrated seismic risk management in Indonesia is non
existent nevertheless, some stakeholders who took part in these events were key people and
at the leading edge of decision making within each city, in order to achieve the best
validation.
Table 10.1 Some of the characteristics of Yogyakarta City and Bengkulu City
N o Characteristics Y ogyakarta C ity* B engk ulu C ity
1 The location Jawa island (the m ost densely populated
island in Indonesia)
Sumatra island
2 The total area ** 32.5 km2 144.52 km23 The population density in 2005** ± 15,545 person/km2 ± 2,491 person/km24 The last tragic earthquake event 27 May 2006
(with more than 5,716 deaths)4 June 2000
(w ith more than 90 deaths)*) Yogyakarta City is w ell known as City o f Education in Indonesia**) C ollected from w w w .jogja.go.id and w w w .bengkulu.go.id
The primary aim of these two workshops was to bring together many stakeholders in a
discussion forum in order to obtain participant’s feedback on the content of ‘the final
framework’ in relation to the needs of many common Indonesian city stakeholders. This
event focused on validating the relevant argument in relation to the city’s unique features
rather than focusing on specific output. Therefore, brainstorming techniques constituted the
major activity during the workshop.
Yogyakarta’s workshop took place on Monday, 26th October 2006 under the name
‘Workshop on Identification of Characteristic-indicators of Seismic Risk Reduction of Non-
Engineered Buildings to Implement Measures in Yogyakarta City’ at the Master Program in
Civil Engineering, Islamic University of Indonesia (UII) and administered in association
with the same institution. Bengkulu’s workshop was conducted on Thursday, 30th November
2006 at the University of Bengkulu (UNIB) and administered in association with the
Department of Civil Engineering UNIB, under the title ‘Workshop on Identification of
288

Characteristic-indicators of Seismic Risk Reduction of Non-Engineered Buildings to
Implement Measures in Bengkulu City’. A previously formed, established research committe
served as the workshop committee and the author acted as workshop facilitator. Particularly
in Bengkulu’s workshop, some lecturers and undergraduate students from the Department of
Civil Engineering UNIB were primarily involved in the workshop committee.
The workshop participants were different and independent people from the previous
workshop participants, were important people within each stakeholder organisation, and
were actively involved in policy issues in each city work-scope. Also, most of them
experienced the last tragic earthquake event that occurred in their region. Particularly in
Yogyakarta’s workshop, they were selected from the people who had taken part in the
questionnaire survey and/or interview. The ideal local government officials who were
targeted to participate in the workshop were in high management positions or the manager of
a disaster management board, but at that time, the local Indonesian government of
Yogyakarta and Bengkulu had no disaster management board concerned with disaster risk
management. The non-structural local disaster management body (SATLAK) on local
government only operates if a disaster occurs. Therefore, important people from the
government agency involved in the decision on ‘building construction permits’ and building
construction and control, and also important government staff from the geophysics board,
were selected to be the workshop participants representing government officials.
About one month before the workshop event, the prospective workshop participants were
contacted by telephone to check their availability to participate in the events. One-two weeks
beforehand, the prospective person targeted to participate in the workshop was approached in
order to be given a bundle of workshop material (i.e. an invitation letter, workshop timetable,
a list of prospective workshop participants, a copy of ‘the final framework’, three pieces of
blank paperwork, each with instructions for the participants to write additional ideas in
relation to ‘the final framework’, and a location map for the workshop). Very often, when
giving the documents, the research committe was able to meet the participants and discuss
the purpose of the overall workshop event with them and ask them to brainstorm as many
ideas as possible for the evaluation or refinement of ‘the final framework’ and bring the
ideas to the event. This was to ensure that the participants were properly briefed as to their
duties; however, a few of the prospective workshop participants did not attend because of
several reasons. In the following explanation, the participants were categorised to remove
'289

names or any other reference made to any organisation or person. Table 10.2 presents the
number of people who were invited and those who participated in the workshop events:
Table 10.2 The number of people who were invited and those who participatedin the workshop events
N o C ategoriesY ogyakarta’s w orkshop B en gk u lu ’s w orkshop
The number o f people invited
The number o f people participated
The number o f people invited
The number o f people participated
1 Researcher 4 3 4 42 Contractor 1 1 1 13 Foreman 1 - 1 14 Government 2 2 4 35 Businessman 1 1 1 -
6 Educator 1 1 1 17 NGO 2 2 1 18 Community
Leader3 2 1 1
9 Reporter 1 1 1 -
Total 16 13 15 12
In general, the two workshops were conducted in similar manner: (1) a welcome speech, (2)
a short, high-level presentation, (3) a discussion, and (4) closing remarks. On arrival, one
copy of enlightening example of framework for seismic risk management in India and Nepal
were circulated to all participants as additional workshop material. The workshop began with
a welcome speech by the head of the host institution. This was followed by an introductory
presentation by the author, introducing the purpose of the event and the results of the
previous workshop, i.e. the final framework, including a brief presentation on best practice
examples from Nepal and India, as they are developing countries, similar to Indonesia. The
presentation provided a concise, high-level briefing on ‘the final framework’, the rules of
discussion, and the proposed duration. Participants were also asked to open up areas of
discussion and add to the issues according to their city’s specific needs. The required input
from the participants were their comments or feedback for the evaluation and/or refinement
of ‘the final framework’, the output was the agreement for the refinement achieved, and the
next step would be a suggestion for further concrete action, because they were actually
framework users, in addition to the relevance to the author’s PhD research project.
The following session was a discussion to obtain participant’s feedback as the main part of
the workshop. The participants gave their feedback, mostly coming from two consecutive
sources: (1) their ideas as a result of their brainstorming session at their home, together with
290

(2) their further comments as result of discussion in the events. Introducing the copy of ’the
final framework’ before the events was critical, because the nature of the topic about seismic
risk management of non-engineered buildings was a ’brand new initiative’ in Indonesia.
Moreover, current disaster management in Indonesia only responds after a disaster occurs.
This situation lead to the people’s lack of knowledge of the systematic seismic risk
management of non-engineered buildings, including low participant’s knowledge. Therefore,
the question launched by the facilitator in the discussion was not as straightforward as to ask
whether the framework was valid or needed to be improved; it was necessary to allow them
to explore their own ideas first before the facilitator introduced the relevance and suitability
of their comments within the context of ‘the framework’. Here, each participant answered
the question or gave their comments on: “How to reduce seismic risk comprehensively on
non-engineered buildings, particularly on residential houses, from the participant’s point of
view and with respect to their city’s needs in relation to the content of the final framework”.
The participants communicated many ideas synergistically, particularly based on the results
of their initial structured brainstorming session in their home. The available amount of
workshop time was able to be used effectively, and this session took around 120 minutes.
The last session was the closing remark, where the facilitator mentioned some of the
workshop deliverables as what the participants ‘built’ in the workshop. Since they were
viewed as frameworks users in their respective city, they were also invited to actively further
participate by disseminating from the information the expected result of the process. To
manage time effectively, there was no break for tea. A small box of light snacks and juice
was served during the session. All workshop participants then took pictures and had lunch
together.
As a general assessment, each participant discussed the topic with their own specific interest
and proposed comprehensive, very positive, and encouraging feedback and suggestions on
the content of ‘the final framework’. Participants did not seem fatigued, discussing and
arguing in a productive manner for approximately three hours. The participants widely
welcomed the content of ‘the final framework’. Nevertheless, some suggestions were made
to further improve the framework.
10.2 Workshop Feedback and Analysis
Altogether, there were 13 people participating in the Yogyakarta workshop and 12 people in
the Bengkulu workshop. Discussion was digitally recorded throughout using ‘Coolsoft
291

Power MP3 Sound Recorder’ software and transcribed. The result of discussion was then
analysed using NVivo software, version 2.0. The software helped to code the data in relation
to the content of ‘the final framework’. The explanation of the 63 pairs of characteristic-
indicators was presented under the same order used in ‘the final framework’, as attached in
Appendix-5.
Indeed, the goal of the two workshop events was to provide enough evidence for a sound
conclusion about the validity of the proposed framework. The following evidence of validity
is outlined as follows:
a. The people who participated in the workshops were important people to ensure that
individual's assessment was factual and logically sound.
b. Their feedback (mainly distributed in four areas: dissemination, government political
commitment, seismic codes, and ‘building construction permit’ regulation)
authenticates the similar conclusions with the 15 most important statements as presented
in Table 8.5.
c. Although some of the elements did not receive comment at all, the previous pairs of
characteristic-indicators had been rigorously validated by 305 respondents during the
phase of the postal questionnaire; all respondents assigned a high degree of agreement
to the initial pairs of characteristic-indicators.
d. Thorough research committee's evaluation of the research findings was conducted, so
that the findings were supported by workshop participants on one side and the research
committees on the other one.
The examples below mention some participant’s feedback as agreement (particularly on the
issues of dissemination, government political commitment, seismic codes, and ‘building
construction permit’ regulation) to the content of ‘the framework’, as follows:
The dissemination issues gained the most feedback in these discussions, as it was stressed
eight times in Yogyakarta’s workshop and seven times in Bengkulu’s workshop. This
dissemination is closely related to the Statement Number 32. Government staff A in
Yogyakarta’s workshop mentioned: “ We transfer our knowledge to the public who are
currently building their houses. But sustainability would depend largely on the government
budget available....”. In wider issues, the community leader (Bengkulu’s workshop)
elaborated: “ Truly, the book (a copy of the final framework) which has been distributed
to us and the paperwork that I handed in on my own are sufficient scientific matter according
to their content Moreover, I reveal some issues (to be implemented in Bengkulu) as
292

follows: (1) community participation in relation to the seismic matter... (2) creation of
permanent disaster management organisation (3) well organised distribution of aid during
disaster...”. The NGO in Bengkulu said: “ what I can offer to this situation is, besides
dissemination through formal education as the teacher said before, to hold dissemination
through informal public education ”.
Another highlighted area was government political commitment. Discussed four times in
Yogyakarta’s workshop and three times in Bengkulu, this issue is relevant with both
Statement Number 12 and the map of the agents of change. In Yogyakarta’s workshop,
researcher A said: “ therefore, who should begin to the concrete action? Government.
Because, people see that government is the central figure...” and government staff B stated:
“ perhaps political will in accordance with the permit issuance should be very very
strict...”. Researcher C in Bengkulu’s workshop also stressed: “ perhaps, first, there
should be government will to achieve this risk management...”.
The issue of existence of ‘seismic codes’ also emerged frequently, four times in
Yogyakarta’s workshop and three times in Bengkulu. This seismic code is closely related to
Statement Number 15. The feedback below was that codes were already written and
presented in common language, and the substitution of steel reinforcement with bamboo
could be implemented in the low-rise houses. Government staff A (Yogyakarta’s workshop)
said: ...’’There are procedures on how to connect steel reinforcement, how to make sloof,
how to make ring balk, how to make stirrups, connections. All are available. People just need
to copy it....”. In Bengkulu’s workshop, researcher B described: “ ....but, I am very keen and
very eager to give my contribution to Bengkulu.... they are not able to build seismic resistant
houses because of one essential problem...that is poverty. They are not able to buy the steel
bars...I have carried out research about bamboo to substitute the common use of steel
bars...”. The contractor also stated: “....the mechanism to build a seismic resistant structure is
not difficult from contractors point of view. From an engineering perspective, I don’t think it
is a big deal...”. This finding confirms that key stakeholders should disseminate and
communicate on how to construct house safely using local materials and using low cost
seismic resistant building technology, then low-income people have to learn and practice it.
The fourth highly agreed area was the rigorous ‘building construction permit’, as mentioned
in Statement Number 17. Community leader A in Yogyakarta’s workshop stated: “ and
again, the ‘building construction permit’ is very important....The houses which were built in
accordance with the correct ‘building construction permit’ requirements would be able to
survive. The damage was very little......”. In Bengkulu’s workshop, the community leader
293

said: “ it is necessary to know whether the existing buildings in Bengkulu built by the
government or private sector have complied with the concept of seismic resistant houses....
and that regulation of the ‘building construction permit’ should be implemented through the
whole province...”. Researcher B also commented: “ therefore, in the future, we hope that
high rise buildings in Bengkulu will be equipped with the ‘building construction permit,’
which is regulated with any recommendation from a competent expert...”. Moreover,
government staff B described: “ but, on the other hand, the public awareness to take care
of proper the ‘building construction permit’ is still low...”. This confirms that the building
construction permit process exists in municipal areas, but there is no way it could control the
actual building production mechanism because of the lack of necessary resources, such as
well-trained building inspectors.
The clear agreement to Statement Number 37 about school curricula was also mentioned by
the teacher in Bengkulu’s workshop as follows: “ after reading the invitation bundle,
particularly the core area of ‘education’, we agree very much that the matter of seismic risk
reduction should be included in the school curricula and also the existence of the related
subject...”. Also researcher C said about the strong institutional basis for implementation or
disaster management organisation (Statement Number 22): “....without good organisation (in
disaster management), the product is nothing...”. In relation to the multidisciplinary
involvement, as described in the three important factors of effective seismic risk
management of non-engineered buildings, government staff A said: “....Board of
meteorology and geophysics can not work alone, without any involvement of the other
parties.... we don’t have any power to enforce development planning to comply with the
seismic map. Our duty is just to give suggestions...”.
Table 10.3 and 10.4 present the distribution of feedback and comments as agreements from
the participants in relation to the 63 pairs of characteristic-indicators. Besides the above
agreements, some feedback mentioned four additional ideas in relation to the 63 pairs
(statements) of characteristic-indicators, which are presented in Table 10.5. These
improvements then were added to the final framework, as attached in Appendix-5.
294

Tabl
e 10
.3 D
istrib
utio
n of
feed
back
co
llect
ed
in ac
cord
ance
wi
th 63
pairs
of
char
acte
ristic
-indi
cato
rs
oCO
V-iO£
_co"c3t ;acs>%W>£
£9 ja q u in N luoiuajE jg ~7> ■> (N
29 ja q u in N lu au ia im s
19 joqum fsj juou io ic ig
09 ja q u in N juauiajEJS > -0$ ja q u in N ju au ia ic jg
85 ja q u m jq ju au ia jc jg
25 ja q u n q q juouiajE ig I95 jaq iu n jq luo iu a icig 155 jaq u m tq luau ia in jg -a-l -t?5 Jaq u in N lu au ia ic jg | i
£5 jo q u in tq ju au ia jm s | •
25 ja q u in N lu a u ia jc js |[ 5 ja q u in jq lu au ia jc jg
05 jaq u itijq juau ia jE is
6(> aaq iun jq juauiajEJS
2 f jaq iu n fq ju au ia jc jg
I f jo q u m N ju au ia jc jg i
9(7 jaq u itifq ju au in p n s i
5(> ja q u in N ju au ia jc jg i
f f jaq u in tq lu au ia jc jg
I f jaq u m fq juauiajEJS
2(> jo q iu n jq juouioii’i s
If. jaq iu rq q ju a iu a ic ig
0 t> j a q u in ^ juaiuaiE jg ~> > <N
6 Z Jaq u in N lu au ia jn is ■>1 -
8£ ja q u in N ju a u ia m s ■> -2£ Ja q iu n N ju au ia jc jg T > >
9£ ja q u n q q ju au ia ic ig '5£ aaq iun iq juauiaiE ig *(-£ jaq iu n jq luauiajE ig -££ jaq iu n jq juaiuajE jg *
Z £ iaq tu n jq lu a u ia jc js > > oc
1 £ ja q u in N juau ia jtrjs CN
0£ Jaquinjsi ju au ia jc jg l62 Joqum /q juauiajEJS l
82 Jaq iu n N ju au ia jc jg 1
22 Jaq u in N ju au ia jc jg i92 jaq iu n jq ju au ia jc jg i52 iaq a in jq ju au ia jc jg if Z jaq u m jq ju au ia jc jg i
£2 jaquiDM ju au ia jc jg I
22 Ja q u in N ju au ia jc jg > -
12 Jaq u in N ju au ia jc jg •
02 Jaq iu n N lu au ia jc jg -
61 Jaq iu n N ju au ia jc jg i > "V <N
8 1 Jaq u in N Juau iajcjg i 121 Jaq u in N ju au ia jc jg h ” ■> > ro
9J ja q u in N lu au ia jc jg 1 ■
51 ja q u in N ju au ia jc jg > 'T
H Jaq iu n N ju au ia jc jg '
£1 ja q u in N lu au ia jc jg
21 ja q u in N luo iua icjg "V i rt-11 jaq u in N ju au ia jc jg '
01 Jaq u in N ju au ia jc jg •6 Jaq u in N ju au ia jc jg •
8 ja q u in N juauiajE jg > -2 Jaq iu n N juauiajEJS > -9 ja q u in N lu au ia jc jg
5 ja q u in N ju au ia jc jg
f ja q u in N ju au ia ic jg
£ ja q u in N ju au ia jc jg
2 J aq u in N ju au ia jc jg
1 ja q u in N lu au ia jc jg > -
Wor
ksho
p
part
icip
ants
1 R
esea
rc-A
I R
esea
rc-B
I R
esea
rc-C
Con
trac
tor
Gov
crm
n-A
Gov
erm
n-B
Bus
inss
mn
Edu
cato
rN
GO
-AN
GO
-BC
omL
ead-
AC
omL
cad-
BR
epor
ter
Num
ber
of
com
men
ts
e •£
E ■£ c £j~ c § c
CJo a
295

Tabl
e 10
.4 D
istrib
utio
n of
feed
back
co
llect
ed
in ac
cord
ance
wi
th 63
pairs
of
char
acte
ristic
-indi
cato
rs
O hO
■8o£173
*0
b£>a<u
PQa
£9 jo q u in jq ju au ia jE is *■?- -
3 9 jaq u m jq ju am a jm s "> -
19 jaq u in tq ju au io jn js 1
0 9 jaq u m jq ju a iu a jn js 1
6 5 jaq iu n fq ju au ia jE is
85 jaq iu n tq ju a v u a m s
35 jaq iu n jq juauiajEJS 1
9 5 jaq u m fq juau ia jE is 1
55 jaq u in tq juauiajEJS > -
f 5 jaq u m fq ju au ia jE is ~7” -
£5 jaq iu n jq ju au ia jE is
£5 jaq u m fq juauiajE jg
j 5 jaq iu n jq juauiajE jg
0 5 jaq u m fq juauiajEJS 16 f jaq iu n jq ju aiu a jE is |
8 f Jaq iu n N ju aiu a iE is |I P jaq u m fq juau ia jE is 19 f jaq u m jq ju au ia jE is I5 f jaq iu n jq ju a u ia p n s
f f jaq iu n tq juaiu a jE is 11
£ f jaq iu n jq juaiua iE is | 1
ZP jaq iu n jq ju aiu a jE is > > <N
I f jaq iu n tq ju aiu a iE is 1O f jaq u in tq ]iiau ia )cis 1 —
6£ Jaqu in tq ju au ia im s | t
8£ jaq u in tq juau ia jn ig | t
££ jaq u m tq ju a iu a u n s -?•
9 £ jaq u m fq juau ia jE is i
5£ jaq iu n tq juaiu a jE is t
f £ jaq u in tq ju a iu a im s > <N
££ Jaquin tq lu a iu a jm s i
££ jaq u in tq lu au ia im s T -?■
I £ jaq iu n tq juauiajE jg
0 £ jaq iu n fq juauiajE jg
6 c Jaq tu n jq juauiajEJS > -
83 jaq iu n tq tu a iu a jc js
LZ Jaqum jq ju aiu a jE is i
9 3 jaq u in tq juaiuajE jg i
53 jaq u m jq ju aiu a jE is i
f 3 jaq u in tq ju a u ia ic js
£3 jaq u m fq lu a u ia u n s -
33 jaq iu n tq ju au ia jE is > >
13 jaq iu n jq tu a iu a jc is •
03 jaquinqq ju aiu a iE is “V > fN
6 i jaq u m tq ju au ia jE is -?■ ~v (N
81 jaqum fq ju au ia m js •
L \ jaq u in tq ju au ia jtn s -?• >
91 jaq u m fq luauiaiEJS *
51 jaq iu n fq ju aiu a jE is rn
f 1 jaq u m jq juaiua iE is *£1 jaq iu n jq juauiaiE ig > -
31 jaq iu n tq ju aiu a jE is > > 1
II jaq u in tq lu au ia iE is 1 »
01 jaq u m tq juauiajEJS I i
6 jaq u in tq ju aiu a iE is 1 i
8 jaq u in tq ju au ia jE is 1 i
Z jaq u in N maiuajBJS 1 i
9 jaq u in tq ju au ia jtn s 1 •
5 jaq u m tq ju au ia jE is 1
f jaq u in tq ju am a jn js >
£ jaq u m jq ju au ia jn js
3 jaq u m jq luauiajnjc;
I jaq u m tq ju ou m jejs -
Wor
ksho
p
part
icip
ants
| R
esea
rc-A
|
eaa
oiBS
0
1o
&
| R
esea
rc-D
|
| C
ontr
acto
r |
| Fo
rem
an
|
| G
over
mn-
A
|
| G
over
mn-
B
|
\ G
ovem
n-C
|
| E
duca
tor
|
82
| C
omL
cade
r |
Num
ber
of
com
men
ts
"3 •§* 1 c cI fio g.a . “ ■ E Jfe Eso <3
• s i ro _g
£c .£
I S g Io £ oo ub g
E £
£ £5r i t*i
296

Table 10.5 Four additional ideas in relation to the 63 statements
No Some additional ideas Exploratory analysis
1 Core areas: ResearchCharacteristic: Local, National, and International co-operation in research: science, technology development, social, and culture*
As NGO A in Yogyakarta’s workshop said:“.....So, I am also pleased that there were many comments, whichwere more or less similar with what I thought beforehand. Withinthe characteristic-indicators...... there were many participants whomentioned the importance o f social and culture. I see this core area o f research is lacking in this......”
This additional idea o f ’social and culture' was added further to the relevant characteristic in the core area: Research
2 Core areas: Education and trainingCharacteristic: Local, National, and International training program Indicator: Existence o f training for development authorities,
Community Organization, NGOs, group o f foreman, private sectors: real-estate firms, builders, small-medium contractors in safe-building practices and retrofitting techniques, through various methods such as: elucidation, workshop, and learning by doing in real construction*.
As researcher A in Yogyakarta’s workshop suggested:“......When we taught them (traditional foremen and artisans), theydidn’t understand exactly. But, when we challenged them to do the skills in real house construction ...they can develop very fast....They feel that they are not being lectured by the young skilled trainer..”
This additional idea o f ’various m ethods o f tra in ing ’ was added further to Statement Number 40.
3Core area: Organizational StructureCharacteristic: Civil society, NGOs, private sector and community
participationIndicator: Existence o f a group or an individual that have
incorporated earthquake risk reduction as a permanent or significant part o f their operations and commitment, for example the existence of one permanent facilitator team graduated from civil engineering to take care of the dissemination to the certain community*
As researcher D in Bengkulu’s workshop stated:......If they (all civil engineering study programs in Indonesia) areable to supply just 50 students (who accomplish their study), in one year thus there are about 8000 civil engineering alumnae....Is it possible i f we propose one permanent facilitator team graduated from civil engineering to take care o f (the dissemination) for a certain com m unity?....... ”
This additional idea o f 'one perm anent
fac ilita to r * was added further to Statement Number 25.
4Core area: Information Management and Communication Characteristic: Information and dissemination programmes and
channelsIndicator: Existence o f documentation, databases, and an
information system * on seismic risk
As researcher A in Yogyakarta’s workshop urged: “...the short term program is to build an information system...”
This additional idea o f an ’information system ’ was added further to Statement Number 31.
*) The additional ideas improved or refined the final framework (written in bold and italic letter)
297

During the discussion, only two participants criticized the content of ‘the final framework’
from their point of view. The criticisms were as follows.
a. Criticism about the future implementation of the framework, as government staff A in
Bengkulu’s workshop stated so doubtfully: “...the big question is whether we can apply
the framework, as it should be...”.
b. Criticism about the other stakeholders involved in the framework and the breakdown of
the stakeholders responsibilities. As researcher C in Yogyakarta’s workshop said
critically: “ when I read the introduction chapter, I see something missing There
are still many essential parties which need to be included in the context of stakeholders.
There were no ‘homeowners’, there were no ‘tukang’ (mason and carpenter), for
example...and also it needs to be broken down into ‘who should do what’, for example
the teacher should do what,....”
The author, as workshop facilitator, did not respond directly to those criticisms during the
workshop events, because the answer needed a comprehensive understanding in relation to
the whole thesis. It is important to note that only the copy of the framework was given out
for these events, not the whole thesis. The author gave feedback by talking to the participants
directly soon after the end of the workshop. It is true that the full implementation and
utilisation of the framework needs the comprehensive involvement of all government, non
government, and civil society organisations, as well as all individuals in Indonesia. It is not
about achieving an overnight success. Therefore the answer to the above question: “Can we
apply the framework successfully?” is ‘Yes, we can’. As long as the involvement,
commitment, and dedication from all parties exists for this long-term process. Still,
integration of multidisciplinary stakeholders in seismic risk reduction is a complex process,
and successful implementation may be achieved through incorporating the three factors:
multidisciplinary stakeholder involvement, strengthening of local capacities, and poverty
consideration.
The important stakeholders who were involved in the implementation of the framework are
to be adopted into the framework as much as possible. Individuals, organisations,
communities, agencies, and governments should be able to recognise their roles and
responsibilities explicitly or implicitly somewhere in the framework. Each organisation or
individual may adopt the content of the framework according to its own requirements, size,
flexibility, and complexity. For example, the house owner roles and responsibilities can be
seen implicitly in Statement Numbers 10, 25, 32, 45, 46, 57, 60, and 63. Also, the role of
mason and carpenter can be identified implicitly in Statement Numbers 40, 45, 46, 57, 61,
62, and 63.
298

In this framework, the house owners were represented by community leaders, because the
community leader, such as the head o f neighbourhood administrative organisations, is the
central figure in the Indonesian local community. Also, the mason and carpenter were
represented by foremen, since the foremen were their superior in real construction.
Explicitly, the role o f community leader (also representing house owners) and the foremen
(also representing masons and carpenters) appears in the Complement C (called a picture of
agents o f change) o f the final framework (see the final framework in Appendix-5).
Indeed, some general assessments have proved that no single research project can encompass
all the issues surrounding integrated and effective seismic risk management in that the
content o f the framework did not mention a breakdown o f roles and responsibilities for each
organisation or individual involved in the process o f the seismic risk management o f non-
engineered buildings. This framework presents only the global and common conventions,
issues, or areas, which need to be highlighted in accordance with guiding and monitoring
seismic risk reduction o f non-engineered buildings with reference to Indonesian cities. It is
only a stepping stone for better and safer non-engineered buildings in Indonesia. Thus, it is
suggested that future research work could identify in detail many o f the stakeholders’ roles
and responsibilities for concrete action.
Figure 10.1 presents the distribution o f participant’s feedback with the assistance o f NVivo
software:
u » m w m m m m m n m i 9 1 1 i H M M i ■ o a
m • 8 | aBrowse Properties Attributes | Doclinks Nodel.fnkr,
Nodes Nodes in /Agreements to the framework
4 Statem ent Number 62 A Title No. Passages Created Modified
4 Statem ent Number 63 4 Statement Number 39 20 1 11/06/20. . 12/06/20...
4 Three factors of effective seism ic r 4 Statement Number 40 21 4 11/06/20. , 12/06/20...
4 A picture of agents of change 4 Statement Number 42 22 2 11/06/20. . 12/06/20...
j - £ Additional ideas 4 Statement Number 54 23 1 11/06/20. . 12/06/20...
4 Social and culture research 4 Statement Number 55 24 2 11/06/20. . 12/06/20...
4 Various m ethods of training 4 Statement Number 60 25 1 11/06/20. . 12/06/20...
4 One permanent facilitator 4 Statement Number 62 26 1 11/06/20. . 12/06/20...
4 Information system 4 Statement Number 63 27 4 11/06/20. , 12/06/20...
i - £ Criticism 4 Three factors of effective seismic r 28 1 12/06/20. , 12/06/20...
4 Future implementation 4 A picture of agents of change 29 2 12/06/20. , 12/06/20...
4 The other stakeholdersV
4 Breakdown of roles and responsibilit v
1 1
Figure 10.1 NVivo screen display of the nodes created from the two workshop events
299

10.3 Summation of the Framework Validation
Two brainstorming workshop events were successfully conducted in order to validate and
obtain some improvements to ‘the final framework’. Important people, representing key
stakeholders from two Indonesian cities, Yogyakarta and Bengkulu, located in high seismic
areas, participated in workshop events of around three hours each. Thirteen key people
participated in Yogyakarta’s workshop and twelve in Bengkulu’s workshop. Although the
issue of the systematic seismic risk management of non-engineered buildings was a
relatively new initiative, through these huge efforts, positive and encouraging feedback has
been collected from the participants, who are decision makers at a city wide level. Generally,
all participants highly appreciated the content of ‘the final framework’; however, there were
four additional ideas, which were added to the refinement of the final framework, and two
participants criticised the content of ‘the framework’. The above evidence of the validation
process and results has given a comprehensive picture that ‘the final framework’ is truly
robust.
In essence, the validation of the findings of the research project was achieved from the series
of primary data collections. Looking back at the sequence of the primary data collection, the
findings of the postal questionnaire survey and selected interviews conformed and also
validated the review of the literature and the existing frameworks. The previous workshop
also agreed with and authenticated the findings of the questionnaire survey and interview. In
this section, the two workshop events validated the final framework. Most of the findings to
emerge so far conformed to and strengthened the previous findings. Therefore, every step in
this research process validated the previous findings, and also the overall research process in
this project was completely interwoven from the beginning to the end.
10.4 Summary
This chapter reported the validation for the framework for guiding and monitoring the
seismic risk reduction of non-engineered buildings, which was developed in the previous
chapter. The beginning of the chapter presented the rationale for the validation, and the
justification of the chosen workshop event and the workshop structure were elaborated. Two
workshop events in Yogyakarta City and Bengkulu City were carried out; many stakeholders
in each city participated in these events, as they were actually included in the framework
users.
300

Every workshop participant was asked to answer the question or give comment on: “How to
reduce seismic risk comprehensively on non-engineered buildings particularly on residential
houses, from the participant’s point of view, with respect to their city-wide needs in relation
to the content of ‘the final framework’ ’’.Workshop participants were only concerned with
certain items which suited their interest. In relation to the 63 pairs of characteristic-
indicators, their feedback was distributed mainly in four areas: dissemination, government
political commitment, seismic codes, and ‘building construction permit’ regulation.
Although there were four improvements or refinements and two criticisms, in general, all
participants’ comments were relevant or validated the content of ‘the framework’. The
summation section confirmed that the evidence of the validation process and the result has
given a comprehensive picture that ‘the final framework’ is truly robust. In essence, looking
at the series of research steps, every step in this research process validated the previous
findings; this was also evidence that the overall research process in this project was highly
interwoven from the beginning to the end. The next chapter concludes the thesis, presenting
the conclusions of this research work.
301

Chapter XI C o n c l u s i o n s
The critical evaluation of literature and the existing frameworks, the primary data collection
as well as the validation process have been completely conducted. This chapter is the final
section of the thesis. Primarily, it reports the conclusions drawn from this research work,
which are closely tied to the introduction chapter. These conclusions include what has been
achieved from the research aim and each research objective; they cover all the main research
phases, including the review of literature and the existing frameworks, the postal
questionnaire survey, selected interviews, and workshop events. These conclusions
demonstrate the contribution to knowledge.
Based on the literature, the integrated seismic risk management of non-engineered buildings
is a vast, comprehensive, and relatively new research area in Indonesia. Some evidence in
this thesis has proved that no single research project can encompass all the issues
surrounding integrated and effective seismic risk management, particularly in developing
countries, for example Indonesia. Therefore, the limitations of this research work are
explained. Continuing from the limitations, the chapter also identifies areas in the seismic
risk management of non-engineered buildings where future research work is recommended.
11.1 Main Conclusions
The research project was aimed at developing a novel framework for guiding and monitoring
seismic risk reduction of non-engineered buildings in Indonesian cities. This was achieved
by employing five practical and theoretically sound main data sources. Firstly, a
comprehensive literature review was conducted, as presented in Chapters II, III, and IV.
Secondly, the review moved to examine the three existing frameworks as case studies in
Chapter V. These two phases produced ‘the first draft of the proposed framework’. Based on
302

analysis of the literature review and the existing frameworks, and after developing a strong
research methodology (in Chapter VI), field pilot studies were conducted to validate the
previous findings, to authenticate the relevance and practicality of the research methods early
in the research, and to identify any further issues, as given in Chapter VII. The pilot studies
provided guidance for the following primary data collection. Thirdly, 875 questionnaires
were sent out to obtain data from a large number of respondents, as representing various
stakeholders involved in the decision making of seismic risk management of non
engineering buildings in Indonesia, and 305 healthy responses came back, or about 34.9%.
Fourthly, the selected interviews were carried out to achieve a deeper understanding and
factual story, according to the questions which emerged from questionnaire survey. As
presented in Chapter VIII, the findings of the questionnaire survey and interview refined ‘the
first draft of the framework’ into ‘the second draft of the framework’. Fifthly, a workshop
event was conducted by inviting various stakeholders to a forum as a complementary
method; the stakeholders shared and argued their opinions and positions directly and openly,
and also considered the ideas of others. This was aimed at developing ‘the final framework’
as described in Chapter IX. The validation process (in Chapter X), by conducting two
workshop events in Yogyakarta City and Bengkulu City, constituted the final phase of the
research project. Generally, all the research phases conformed to and strengthened the
previous findings, and also confirmed that the overall research process in this project was
highly interwoven from the beginning to the end.
In fact, the major finding and contribution of the research project is the novel framework
itself (Appendix-5), i.e. a framework for guiding and monitoring, the seismic risk reduction
of non-engineered buildings in Indonesian cities via a risk management approach. The
structure of the framework embraces 3 steps of seismic risk management, i.e. seismic hazard
analysis, seismic risk assessment, and seismic risk response. Within those steps, there are 63
pairs of characteristic-indicators, complemented by (A) three important factors of effective
seismic risk management of non-engineered buildings, (B) three guiding principles for
sustainable and effective dissemination to the grass root communities, and (C) a map of
agents of change. Furthermore, among the 63 pairs, there are 19 technical interventions and
44 non-technical interventions in relation to an action-oriented impact and likelihood of
sustainability. The framework was carefully identified from the thorough analysis of all the
data. In all, the novel framework as the principal research finding is fully significant in that it
originally contributes to the wider knowledge in the domain of the seismic risk management
of non-engineered buildings that bridge disciplines, scientific, and indigenous sources of
knowledge. The framework may be seen as a living document to be modified as issues
303

emerge, knowledge expands and capacities change. In addition to the framework and in
relation to the research objectives, some of the research contributions as main conclusions
leading to new understanding which was probably neglected or under-researched in the past
are outlined as follows:
a. Earthquakes have long been feared as one of nature’s most terrifying and devastating
events. Although an earthquake cannot be prevented, modem science and engineering
provides tools that can be used to reduce their effects based on the fact that much of the
damage in earthquakes is predictable and preventable. The infamous earthquake and
tsunami in the Indian Ocean in 2004 caused more than 150,000 Indonesian deaths and
the Yogyakarta earthquake in 2006 claimed more than 5.700 deaths, which demonstrated
that most of the Indonesian region is located in high or very high seismic areas.
b. The main concern of an earthquake is the number of deaths and injuries from the
collapse of buildings which are poor in design and construction, in both developing and
developed countries, namely non-engineered buildings. Conversely, the few buildings
that were constructed according to the modem building code were able to survive the
earthquakes.
c. A non-engineered building is an unsystematically designed, built, and supervised
building. Non-engineered buildings are usually built by traditional builders and/or
building owners, using common traditional approaches without intervention by qualified
architects and engineers in their design and construction. In Indonesia, non-engineered
buildings dominate most residential buildings constructed with heavy materials, such as
masonry or multi-storey reinforced concrete, up to two stories and are still being built
within medium-low-income populations to cope with the greater need for housing for a
growing population. As a result, the number of non-engineered buildings built with non-
seismic resistance has enormously expanded, and they will remain the single greatest
source of existing seismic risk for the foreseeable future.
d. Seismic codes help to improve the behaviour of structures so that they may withstand
earthquake effects at the appropriate levels of ground motion. Seismic codes exist in
most countries with high seismic areas. In Indonesia, the seismic codes for practical
implementation in residential houses have been developed since 1978. The newest
formal seismic code for ordinary buildings (SNI-1726-2002) was launched in 2002. The
seismic codes comprise many aspects of seismic features in both masonry and RC
304

buildings, which describes elements such as: a simple structural configuration, the
influence of openings, vertical reinforcement, the necessity of horizontal bands in
masonry buildings, openings in walls, the roles of floor slabs and masonry walls,
strength hierarchy in RC, beam and column design strategies, beam-column joints,
vulnerability of open-ground storeys, and short columns. Although almost the entire
seismic feature checklist mentioned in Table 3.3 is in line with Boen (1978) and SNI-
1726-2002 (2002), the checklist provides a systematic way to have a look seismic
features element by element, and this can be used as a complement for the existing
seismic codes in Indonesia.
e. There is still wide gap between massive death tolls and the existence of seismic codes.
On the one hand earthquakes continue to cause tragic events with high death tolls. On
the other hand, seismic codes clearly exist in countries to save lives and human
suffering. Many of the deaths could have been reduced, even avoided, if understanding
and implementation of seismic codes had been employed properly. The application of
the proposed framework could help to make implementation of seismic codes more
functional and relevant and would ensure successful disaster reduction.
f. Since seismic risk is simply a real fact for many Indonesian people, it is not a wise
solution to force them to leave their beloved but hostile areas; therefore the people
should be able to live harmoniously with the seismic risk, as an inconvenient truth. One
of the strategic solutions to live harmoniously with seismic risk and to bridge the above
gap is to cany out mitigation actions aimed at reducing losses through the
implementation of seismic codes on existing and new non-engineered buildings.
g. The implementation of seismic codes on non-engineered buildings is not only related to
physical measures, but also to other issues, such as financial, educational, and
administrative. This comprehensive perspective of seismic risk reduction and also
disaster risk as a whole should be systematically integrated into development planning
completely in order to meet the challenges ahead. Based on best practice in other
countries, there are three suggested important factors for effective seismic risk
management of non-engineered buildings in developing countries, i.e. involvement of
multidisciplinary stakeholders to share risk and responsibility, strengthening of local
capacities, and poverty consideration, as mutually supportive objectives. These findings
are closely related with the elements in the overall disaster reduction mentioned by
UNDP (2004) and UN-ISDR (2002).
305

h. The concept of the two senses, i.e. (1) a sense of place, where all community members
become attached to their own home and should live harmoniously and side-by-side with
the existing seismic risk and (2) a sense of responsibility, by which all community
members should collectively bear responsibility to reduce seismic risk on a daily basis,
appears to be a potentially useful mechanism to frame community sustainability projects.
i. Currently, disaster management programs in Indonesia are mostly oriented to provide
response actions during disasters, hardly ever to conduct mitigation actions, and,
furthermore, are not connected with the integral paradigm of sustainable development.
The central challenge of the promising new agency, as approved by the House of
Representatives on 29th March 2007, in disaster management organisation is to ensure
that government decentralisation becomes a positive driving force: to promote disaster
management as a key issue on the local agenda, to develop an integrated program for
disaster activities, and to increase the local budget allocation for disaster reduction.
j. The existing frameworks provided evidence that all had a primary concern with reducing
disaster risk with cross-cutting issues; however, they demonstrated their specific area of
interest. There was still considerable variation in the density of the frameworks in terms
of the number of specific features of indicators that were included for appraisal. Most of
their principles comprised many aspects of both structural measures (for example:
damage assessment, implementation of seismic codes, and retrofitting of important
buildings) and non-structural measures (for example: public awareness, institution
building, organizational structure).
k. Most of the content of the proposed framework in this research project, after it was
validated and refined by thorough analysis during the questionnaire survey, interview,
and workshop event, was in line with and relevant to the referred existing frameworks
(ISDR, 2003; ADPC, 2000; and MHA, 2004) and ensured more systematic actions to
address the seismic risk of non-engineered buildings in the context of development
planning. The areas of important concern of SRRNEB to be carried out in Indonesia
include: government political commitment, earthquake occurrence data dissemination,
existence of information for pro-poor strategies, resource mobilization for expert staffing
allocation, existence of deterministic and probabilistic earthquake scenario, existence of
regulation of builders, existence of seismic codes with simple language, existence of
seismic risk map using Geographic Information System, continuity of dissemination
306

channels, good examples in real constructions, existence of inventory data: soil profiles
and buildings, existence of seismic risk reduction as a policy priority, availability and
accessibility of information in introducing seismic features of buildings. The findings
concerning the high importance of government political commitment is similar to the
UN-ISDR (2002).
1. For all people and organisations, a high awareness of seismic risk with a better
understanding of earthquake data: their history, spatial distribution, characteristics,
impacts, and the existing fault line, underlies every initiative to reduce seismic risk
before introducing the importance of seismic codes.
m. A better combination of technical and non-technical measures is a substantial
contribution towards the successful implementation of seismic codes through voluntary
initiatives or through stringent regulation enforcement. Government political
commitment should be first, followed by the involvement of many technical and non
technical actors, such as researchers, scientists, contractors, foremen, masons, carpenters,
businessmen, educators, NGOs, community leaders, reporters, and others. This needs
wider recognition that building a culture of disaster prevention should become
everybody’s duty of care on a daily basis to ensure sustainability.
n. It is imperative for decision-makers at local government levels, who are responsible for
land use planning and construction planning arid control, to consistently develop deeper
dialogues with grass root communities about the changes they need to make. To achieve
successful dialogues and dissemination, the disseminator, for example, government
officials or scientists, should visit the community group and attend existing social
meetings. Innovative initiatives, new synergies, and networks are easily absorbed over
those already established. This will fit into the existing community structures without
any friction and also value every person’s unique contribution. This process breaks
powerful psychological barriers, continues to build up trust amongst the community and
also emphasises the importance of sustainability.
o. In relation to the message of dissemination, if people rationalise that the implementation
of seismic features in their own house is the most effective strategy for reducing or
avoiding losses, and at the same time they perceive it is practically possible and
achievable and they can control it, this strategy will have a tremendous effect on how
well they can cope with the process. If people have a sense of control and are clever
307

enough to implement seismic features properly, then they can also achieve a sense of
ownership, building upon a community’s collective strength and skills. This sense of
ownership enables people to generate a culture of prevention and also to make
community members feel part of the effort. The implementation of the above principles
can bridge the gap between scientific expertise and a concerned public, particularly lay
people. This is far beyond the issue of technical capacity and these principles were
probably neglected in the past.
p. Non-engineered construction practice is often driven by the local notion of social
cohesion and spirit. Small-medium contractors, foremen, masons, and carpenters as the
main actors in non-engineered construction practices usually use the vernacular method,
local resources, and labour intensive methods, even unwritten rules without any formal
contract or arrangement. In certain cases, the homeowner sometimes has full control
over the overall house construction process, and the builders have no bargaining power
. to implement a new approach. They are often less educated, have had less training, less
access to information, and less attention from modem science and technology. They
leam construction practice naturally by doing and watching the neighbourhood practice.
In fact, they are ultimately the major factor in governing whether the seismic features are
implemented in the construction of non-engineered structures. Unfortunately, researchers
tend to focus on research in engineered buildings and are less enthusiastic about studying
the common practice of non-engineered building. Moreover, poor and vulnerable
communities, who usually occupy non-engineered buildings, are often ignored by key
decision-makers whose role is not to be on the side of the poor people; perhaps there
may be no clear political and financial benefit for them to arrange this matter.
q. To achieve continuous change in a government body, there are three levels that should
be revitalised. The first is revitalisation of the systems level, i.e. the regulatory
framework and policies, the second is revitalisation of the institutional level, i.e. the
structure of organizations, and the third is revitalisation of the individual level, i.e.
individual skills, qualifications, and knowledge. This finding is synonomous with the
improving capacity of government bodies in relation to the government decentralisation
process, as mentioned by Turner et al (2003).
r. Meanwhile, to achieve change among non-engineered construction actors by introducing
a new concept of seismic resistance, they should be equipped with a better fit between
the steady flow of dissemination and communication of local seismic risk and the
308

importance of seismic features and their continuous individual skill improvement. This
finding tends to complement what CEEDEDS (2004) and Hausler (2006) have achieved
in their seismic feature training for local builders as the main actors in the construction
of non-engineered structures.
s. It is very hard, even impossible, to change common construction practice without an
improvement of seismic risk awareness of government officials, construction actors, and
community members. For grass root communities, understanding their beliefs and needs,
social cohesion and spirit constitutes the foundation to achieve change continuously.
Wide ranging reform in this construction practice should be a locally-adapted technique,
culturally accepted and compatible, based on local resources, flexible, not burdensome,
less bureaucratic, not too regimented, not too authoritative, moral and ethics based, and
more innovative and improvised in intervention mechanisms. It is like engineering
beyond the engineer. The purpose is to provide non-engineered construction actors and
homeowners with a proper understanding of seismic risk and the simple implementation
of seismic codes and then they are capable of implementing the codes by themselves.
t. Dynamic audio-visual media such as films, shows, movies, and clips, can be utilised to
encourage people to implement seismic codes rather than using static media such as
posters and brochures as an education tool for people in the domain of non-engineered
construction practices, including those who self-build their homes.
u. The proposed framework is just a tool. The next important thing is to build popularity for
mainstreaming seismic risk reduction by actively marketing the proposed framework as
a clear, unambiguous tool for achieving incremental improvements.
v. Finally, the most challenging part in the successful seismic risk management of non-
engineered buildings is not finding the tools, but realising and accepting that seismic
events are simply a real fact for all people who are living in seismic prone areas. Since
this event is unpredictable and unavoidable, it is better to grasp it rather than denying or
ignoring it. As a result, conducting integrated seismic risk management of non-
engineered buildings continues to be the biggest challenge for the global community
today.
The above findings clearly demonstrate the successful achievement of the aims and
objectives of the research. Moreover, the research represents a major contribution to
knowledge of the subject area, and the novel framework developed provides the opportunity,
309

through its utilisation, to radically improve current procedures and practice. In addition to the
above contributions to wider knowledge, it needs to be highlighted that the ultimate goal of
this framework is to save lives and human suffering against future strong earthquakes.
11.2 Limitations of the Research
Although the framework of the research was developed through rigorous data collection and
analysis, some limitations still emerged throughout the research process, which hindered the
researcher in achieving the high quality of the framework. Some limitations applicable to
this research work are as follows:
a. This study was confined to the Indonesian environment, where existing social aspects
and culture are enormously influential. In fact, the stakeholders who were approached
and who participated in the research process did not cover all Indonesian regions. Due to
the constraint of time and resources, the information or data from people who lived in
the eastern and northern high seismic risk regions of Indonesia, such as Papua, Maluku,
and Sulawesi, were not included in the data. For example, the workshop in Yogyakarta
City and Bengkulu City only represented a small part of the central and western region
of Indonesia. More could have been done to obtain a larger pool of data for the
investigation.
b. The study was about seismic risk management activities, in which pro-active measures
should be applied to the issues before the seismic event to prepare better and safer non-
engineered buildings in the future. On the other hand, some evidence has shown that
such seismic risk reduction, mitigation, and preparedness before the disaster was a
relatively new concept to the common Indonesian people and government. Some
respondent’s comments concerned how to undertake disaster response rather than how to
reduce seismic risk before the disaster comes. The difficulties emerged when the author
had to explain in detail first ‘what is the definition of seismic risk management’ to the
respondents before embarking on the interview and workshop data collection. Indeed, it
was time consuming, particularly during the selected interview phase and the initial
discussion activity prior to the workshop event. It is possible that the lack of the
respondents’ views about the exact meaning of seismic risk management might lead to
relatively low quality in the framework achieved.
310

c. The research topic was closely related to disaster management. The non-existence of a
permanent disaster management organisation in Indonesia meant that there was no
permanent institution to take care of the gigantic problem of disaster risk management.
The difficulty appeared because government departments or bodies needed to be
approached one-by-one to find the correct key government officials to participate in the
research. Again, it needed great patience and plenty of time, just to follow the
complicated bureaucratic procedure and also for initial discussions with many
government staff before deciding on the appropriate key staff who were able and had the
capacity to get involved in the data collection. Due to time and resource constraints,
some government officials and also other stakeholders who participated in this research,
might have a low capacity or knowledge about the seismic risk management of non-
engineered buildings. Thus, this situation might lead to the development of a relatively
less perfect framework.
11.3 Suggestions for Further Research Work
As mentioned earlier in the thesis, the research topic about the seismic risk management of
non-engineered buildings in Indonesia was very wide and a relatively new research field.
The limited scope of this research project could not entirely embrace the integrated seismic
risk management systems of non-engineered buildings from all facets within a single strand
of research. Overall, further research should have the ultimate goal of reducing unnecessary
high loss of life from earthquakes as the most important challenge facing the global
community. Hence, further research in the following areas is suggested:
a. A wider study to develop an integrated framework of the seismic risk management of
non-engineered buildings for common local initiatives in Indonesia with balanced data
from all Indonesian regions, to produced a new form of solidarity respecting cultural
differences. This research will work smoothly and be streamlined if the research
initiative comes from central government, which has the power to ask each local
government to accomplish it.
b. A collaborative study initiated by central and/or certain local governments to identify the
most urgent activities of the seismic risk management of non-engineered buildings to be
carried out immediately to fit into specific city wide needs. Because this proposed
research would be instituted by the government, and therefore, through the existing
311

government network, the bureaucracy barrier is not a big deal, and very senior positions
of appropriate government key staff and other stakeholders can be decided to be
included in the data collection. It is widely agreed that the result will be considerable
because the participants are well known and prominent among the decision-makers.
c. Developing a framework that links between common local seismic risk management
activities and a national program of seismic risk management to maintain the same
language to reduce seismic risk.
d. A best practice local government political system of commitment, for the
implementation of integrated seismic risk management, to promote collaboration and
information sharing.
e. A best practice seismic resistant house model with cost effective considerations in many
areas for the encouragement of others, in order to include more reward for the research
of inadequately engineered construction, higher emphasis on unique local efforts, and a
greater emphasis on advocacy. It is well believed that requiring seismic design and
construction of new buildings may increase costs but far less than many people think.
Furthermore, practice makes perfect builders, and there is a need to raise the profile of
the successes of seismic resistant houses.
f. Development of dynamic audio-visual media of the implementation of seismic features
as a wider dissemination tool in a movie format, built using local language and local
resources. The purpose is to provide an interactive dissemination tool that everybody can
use to learn to implement seismic features. This dissemination method has many
advantages, such as: it uses less resources than conducting face-to-face training, the
users can easily understand the local language employed in the film, the users will have a
sense of control because the content of the film uses affordable local resources and
conforms to their social cohesion, the users can easily adjust their schedules to see the
film, and the film can be copied cheaply for wider circulation.
g: Earthquake loss estimation study (damage assessment) for the area that lies along what is
well known in the scientific arena as ‘the seismic gap’, i.e. the area that is highly prone
to earthquakes, but that has not had an earthquake recently. In fact, the existing
framework from Nepal (ADPC, 2000) mentioned that this loss estimation study in Nepal
constituted the first activity to encourage more initiatives.
312

REFERENCES
Adams, B., Huyck, C., Mio, M., Cho, S., Ghosh, S., Chung, HC., Eguchi, R., Houshmand,B., Shinozuka, M., Mansouri, B., (2004). The Bam (Iran) Earthquake of December 26, 2003: Preliminary Reconnaissance Using Remotely Sensed Data and the VIEWS (Visualizing the Impacts of Earthquakes with Satellite Images) System, in http://www.iiees.ac.ir/English/bank/Bam/Bam_report_english.html
ADPC/Asian Disaster Preparedness Center (2000). Kathmandu Valley Earthquake Risk Management Project, ADPC Publication, Bangkok.
Andrews, J. (2004). Development and Implementation of an Outreach Program to Promote Public Awareness of Seismic Hazards and Encourage Risk Mitigation in Vulnerability Communities, at http://www.scec.org/news/00news/feature000424c.html; accessed on 5 May 2005
Arnold, C. (2004). Country: United States of America, Housing type: Wood Frame Single Family House, World Housing Encyclopedia Report.
Arya, AS. (1994). Disaster Risk Reduction, Structural Measures, World Conference on Natural Disaster Reduction, Yokohama.
BAPPENAS/National Development Planning Agency. (2005a). Indonesia: Preliminary Damage and Loss Assessment: The December 26, 2004 Natural Disaster, The Consultative Group on Indonesia Jakarta, January 19-20, 2005.
BAPPENAS/National Development Planning Agency, (2005b). Indonesia Note on Reconstruction: The December 26, 2004 Natural Disaster, The Consultative Group on Indonesia Jakarta, January 19-20,2005.
BAPPENAS/National Development Planning Agency, (2006). Preliminary Damage and Loss Assessment: Yogyakarta and Central Java Natural Disaster, The Consultative Group on Indonesia Jakarta, June 14,2006.
Belazougui, M. (2003). Seismic Risk Reduction and Disaster Management in Algeria, at http://www.eaee.boun.edu.tr/bulletins/vl6nl/algiers.html; accessed on 19 December 2004.
Berg, B.L. (1998). Qualitative Research Methods for the Social Sciences, 3rd Edition, Allyn and Bacon, London.
Blaxter, L., Hughes, C., and Tight, M. (1996). How to Research, Open University Press, Buchingham.
BPS/Badan Pusat Statistik (2003). Demographic Year Book, Statistics Divisions-United Nation, Reporting Country: Indonesia, Reporting Year: 2003
313

Blondet, M., Garcia, G.V., and Brzev, S. (2003). Earthquake-Resistant Construction of Adobe Building: A Tutorial, EERI/IAEE World Housing Encyclopaedia.
Boen, T. (1978). Detailer’s Manual for Small Buildings in Earthquake Areas (Manual Bangunan Tahan Gempa (Rumah Tinggal)), Yayasan Lembaga Penyelidikan Masalah Bangunan, Bandung, Indonesia.
Boen, T. (2006a). Building A Safer Aceh, Reconstruction Houses, One Year after the Dec 26, 2004 Tsunami, Conference proceeding; Answering the challenges in Today’s Civil Engineering. Trisakti University, Jakarta, Indonesia
Boen, T. (2006b). Yogya Earthquake 27 May 2006, Structural Damage Report, www.eeri.com, accessed on 5 July 2006.
Bruneau, M., and Tsai, KC. (2003). Building Damage, at www.icjonline.com; accessed on 13 Nov 2004
Bruneau, M., Chang, SE., Eguchi, RT., Lee, G., O’Rourke, T., Reinhom, AM., Shinozuka, M., Tierney, K., Wallace, WA., and Winterfeldt, D.V. (2004). A Frameworks to Quantitatively Assess and Enhance the Seismic Resilience of Communities, World Conference on Earthquake Engineering, Vancouver.
B.SSC/Building Seismic Safety Council (1995). Seismic Considerations for Communities at Risk, BSSC & FEMA Publication, Washington DC.
Bum, R.B. (2000). Introduction to Research Method, Sage Publication, London.
Cassel, C. and Symon, G. (editors) (1994). Qualitative Method in Organisational Research: A Practical Guide, Sage publications, London.
Chandra, F., Wangsi, N., Surya, Y., and Agustin, Y. (2004). Usaha Manusia di Daerah Pemukiman Sub-Urban Terhadap Gempa, Final Project-Unpublished, Mine Engineering. Department, Universitas Pembangunan Nasional ‘Veteran’, Yogyakarta.
CEEDEDS/The Center for Earthquake Engineering, Dynamic Effect, and Disaster Studies (2004). The Manual of Earthquake Resistant Building; Project Report Between CEEDEDS and Japan Government, Yogyakarta.
Charette, R.N. (2002). Risk Management, Encyclopedia o f Software Engineering, John Wiley & Sons, Inc, New York.
Chen, WF. and Scawthom, C. (2003). Earthquake Handbook, CRC Press, Washington
Comartin, C., Brzev, S., Naeim, F., Greene, M., Blondet, M., Cherry, S., D’Ayala, D., Farsi, M., Jain, S, K., Pantelic, J., Samant, L., Sassu, M. (2004). A Challenge to Earthquake Engineering Professionals, Earthquake Spectra, Volume 20, No 4, November 2004. Earthquake Engineering Research Institute.
Comfort, L.K. (1999). Shared Risk: Complex Systems in Seismic Response, Pergamon Elsevier Science Ltd., Netherlands.
Comfort L.K. (2002). Information Technology and Efficiency in Disaster Response: the Bhuj, Gujarat Earthquake of 26 Januari 2001, International Conference on Earthquake Loss Estimation and Risk Reduction. Bucharest, Romania.
314

Comfort L, K. and Sungu, Y. (2001). Organizational Learning From Seismic Risk: The 1999 Marmara And Duzce, Turkey Earthquakes, in Uriel Rosenthal, L.K. Comfort, and Arjen Boin, Editors. From Crises to Contingencies: A Global Perspective. Chicago: Charles C. Springer, Inc.
Corpuz, A. (1990). Some Implications of the July 16, 1990 Earthquake on Urban and Regional Planning in the Philippines, School of Urban and Regional Planning, University of the Philippines, Philippines at http://www.phivolcs.dost.gov.ph/Earthquake/ 1990LuzonEQ_Monograph/pp287/pp290_291.html; accessed on 14 Oct 2004.
Covenry, I., and Dutson, T. (2006). Sense of Place in Northern England, International Journal of Biodiversity Science and Management, pp 213-217
Dan, M.B. and Sandu, I. (2004). Country: Romania, Housing type: A Single-Family, Ttwo- Storey House with Brick Walls and Timber Floors, World Housing Encyclopedia Report.
Dan, M.B. and Sandu, I. (2004). Country: Romania, Housing type: One Family One Storey House, also Called "Wagon House", World Housing Encyclopedia Report.
Denzin, N.K. and Lincoln, Y.S. (editors) (1994). Handbook of Qualitative Research, Sage Publications, London.
Denzin, N.K. and Lincoln, Y.S. (editors) (1998). Strategies of Qualitative Inquiry, Sage Publications, London.
DFID/UK Department for International Development (2004). Disaster Risk Reduction: A Development Concern, School of Development Studies, University of East Anglia, Norwich.
DGURD/Directorate General of Urban and Rural Development (2003). Urban Sector Development Reform Program, Ministry of Settlements and Regional Infrastructure, Indonesia
Dixit, A.M. (2003). The Community Based Program of NSET for Earthquake Disaster Mitigation, The International Conference on Total Disaster Risk Management, Nepal.
DPU/Public Work Department, Indonesia (2002). SNI-1726-2002, DPU Publication, Jakarta.
EERI/Earthquake Engineering Research Institute (1999). Lesson Learned Over Time, EERI Publication, California USA.
Ellul, F. and D’ayala, D. (2004). On the Vulnerability of Modem Low Technology Engineered Residential Construction, 13th World Conference on Earthquake Engineering, Vancouver Canada.
Erer, S. (2005). Istanbul Seismic Risk Mitigation and Emergency Preparedness Project, Final Report, Prime Minister Publication, Turkey.
GREAT/Gujarat Relief Engineering Advice Team (2001). Repair and Strengthening Guide for Earthquake Damaged Low-Rise Domestic Buildings in Gujarat,'India, GREAT Publication, India.
FEMA/Federal Emergency Management Agency (2001). HAZUS 99 SR-2: Earthquake Loss Estimation Methodology, FEMA Publication, Washington DC.
315

FEMA/Federal Emergency Management Agency (2004). at http://www.fema.gov/hazards/earthquakes/quake.shtm; accessed on 5 Dec 2004.
Falangan, R. and Norman, G. (1996). Risk Management and Construction, Blackwell Science, London.
Gandica, A.C. and Almansa, F.L. (2004). Country: Venezuela, Housing type: Urban Non- Engineered Popular Housing on Flat Terrain, World Housing Encyclopedia Report.
Gilgun, J.F. (2004). Some Guidelines for the Design o f Qualitative Research with Emphasis on Dissertation Research, First Brazilian International Conference on Qualitative Research, Minnesota.
GRDC/Geological Research and Development Center (2001). Earthquake Hazard Map of Indonesia, Bandung.
GRDC/Geological Research and Development Center (1998). Seismotectonic Map of Indonesia, Bandung.
Gould, N.C. (2003). Understanding the Language o f Seismic Risk Analysis, at http://www.irmi.eom/Expert/Articles/2003/Gould07.aspx; accessed on 23 Oct 2004.
Gould, N.C. (2004). Will Adoption of the International Building Code Reduce Seismic Risk?, at http://www.irmi.com/Expert/Articles/2004/Gould01.aspx; accessed on 23 Oct 2004.
Hausler, E. (2006). Post Earthquake Housing Reconstruction in Indonesia, at www.buildchange.org accessed on 4 March 2006.
Hays, W. (2001). Building Technical and Political Capacity for Seismic Risk Reduction, International Workshop on Disaster Reduction, North Carolina.
IDEA/Instituto de Estudios Ambientales (2005). Indicators o f Disaster risk and Risk Management: Program for Latin America and the Caribbean, Summary Report for World Conference on Disaster Reduction, Colombia.
IITK-BMTPC (2002). Earthquake Tip 1-10, Indian Institute o f Technology Kanpur and Building Materials and Technology Promotion Council, New Delhi.
IITK-BMTPC (2003). Earthquake Tip 11-21, Indian Institute o f Technology Kanpur and Building Materials and Technology Promotion Council, New Delhi.
IITK-BMTPC (2004). Earthquake Tip 22-24, Indian Institute of Technology Kanpur and Building Materials and Technology Promotion Council, New Delhi.
ISDR/Intemational Strategy for Disaster Reduction (2003). Rationale Paper on the Framework for Guidance and Monitoring o f Disaster Risk Reduction, Inter-Agency Task Force Meeting, Eighth Meeting, Geneva (available online at www.unisdr.org, accessed on 12/12/2004).
IUDMP/Indonesian Urban Disaster Mitigation Project (2001). Increasing the Safety o f Indonesian Cities from Earthquake Disaster Threat, Asian Disaster Preparedness Center.
316

IUDMP/Indonesian Urban Disaster Mitigation Project (2000). Report o f Visit to Bengkulu Earthquake Stricken Area 10-13 June 2000, Institut Teknologi Bandung and Asian Disaster Preparedness Center.
Jain, S.K. (1998). Lesson from Recent Indian Earthquakes, Editorial in Indian Concrete Journal Vol 72, No 11, India,
Kassum, J., Steer, A., Kharas, H., and Hofman, B. (2003). Decentralizing Indonesia, World Bank Publication, Report No. 26191-IND.
Kunreuther, H. (2000). Public-Private Partnership for Reducing Seismic Response, Second Euro Conference on Global Change and Catastrophe Risk Management, Austria.
Lee, G. and Loh, C.H. (2003). Human and Institutional Perspective o f the 921 Earthquake in Taiwan: Lessons Learned, at http://mceer.buffalo.edu/publications/reports/docs/00-0003; accessed on 29 Oct 2004.
Lustig, T. (1997). Sustainable Management o f Natural Disaster in Developing Countries (in Fundamental Risk Analysis and Risk Management edited by Vlosta Molak), Lewis Publisher, USA.
Lutman, M. and Tomazevic, M. (2004). Country: Slovenia, Housing type: Rubble-Stone Masonry House, World Housing Encyclopedia Report.
Lynas, M. (2007). A Better Way to Live, EcoLife, The Independent, 7 July 2007.
Maki, N. and Tanaka, S. (2004). Country: Japan, Housing type: Single-Family Wooden House, World Housing Encyclopedia Report.
Mansouri, B. Aghda, F. and Safari (2002). Preliminary Earthquake Reconnaissance Report on the June 22, 2002 Changureh (Avaj), Iran Earthquake, athttp: //www.iiees.ac.ir/Englisli/Publication/eng_publicationJournal_12.html; accessed on 8 Nov 2004.
Marrow, J. (1999). Wineries Can Reduce Risk o f Loss Through Risk Management, Managing Earthquake Hazards, Wine Business Monthly, athttp://www.eresonant.com/pages/publications/wbml999.html; accessed on 15 Jan 2005.
Marshall, C. and Rossman, G.B. (1999). Designing Qualitative Research, 3rd Edition, Sage Publication, London.
Mehrain, M. and Naeim, F. (2004). Country: Iran, Housing type: Adobe House, World Housing Encyclopedia Report.
MHA/The Ministry o f Home Affairs India (2004). GOI-UNDP Disaster Risk Management Programme: Urban Earthquake Vulnerability Reduction Project, at www.undp.org, accessed on 15 Jan 2005.
Mitchell, T. (2003). An Operational Framework for Mainstreaming Disaster Reduction, Disaster Studies Working Paper 8, University College London, London.
Moroni, O. and Gomez, C. (2004). Country: Chile, Housing type: Concrete Shear Wall Buildings, World Housing Encyclopedia Report.
317

Moroni, O., Gomez, C., and Astroza, M. (2004). Country: Chile, Housing type: Reinforced Clay/Concrete Block Masonry Building, World Housing Encyclopedia Report.
Moroni, O., Gomez, C., and Astroza, M. (2004). Country: Chile, Housing type: Buildings With Hybrid Masonry Walls, World Housing Encyclopedia Report.
Nachmias, C.F. and Nachmias, D. (1996). Research Methods in the Social Sciences, 5th Edition, Arnold, London.
Naoum, S.G. (1998). Dissertation Research and Writing for Construction Students,Butterworth Heinemann, Oxford.
NDMD/National Disaster Management Division, India (2004a). National Programme for Capacity Building o f Architects in Earthquake Risk Management, India, Ministry o f Home Affairs, India, at www.dsdm.nic.in; accessed on 15 Jan 2005.
NDMD/National Disaster Management Division, India (2004b). Disaster Management in India - A Status Report, Ministry o f Home Affairs, India, at www.dsdm.nic.in; accessed on 15 Jan 2005
Ngoedijo, W. (2003). An Overview o f Disaster Mitigation in Local Planning and Programming in Decentralized Indonesia, Asian Regional Conference on Urban Infrastructure Financing and Disaster Mitigation, Sri Langka
NICEE/National Information Center o f Earthquake Engineering, India (2004). Guidelines for Earthquake Resistant Non-Engineered Construction, The Associated Cement Companies Limited, India.
Pao, J. and Brzev, S. (2004). Country: Canada, Housing type: Concrete Shear Wall High- Rise Buildings, World Housing Encyclopedia Report.
Petak, W. (2002). Managing Risk in a Complex Environment with Competing Worldviews, Extreme Events Workshop, California.
PLN Enjineering (2003). Seismic Hazard Assessment LNG Storage Tank Terminal Teluk Banten, PLN Enjineering Final Report, Indonesia.
RMSI/Risk Management Software India (2003). Radius: A Simplified Tool for Earthquake Risk Assessment at http://www.gisdevelopment.net/application/natural_hazards; accessed on 5 Jan 2005.
Rodriguez, V.I., Yacante, M.I., and Reiloba, S. (2004). Country: Argentina, Housing type: Traditional Adobe House Without Seismic Features, World Housing Encyclopedia Report.
Sarwidi and Winamo, S. (2006). Study on 27 May 2006 Earthquake Economic Loss on Residential Houses in Yogyakarta City, a Comparison between the Estimation and the Actual Loss (Kajian Perbandingan Kerugian Bencana Gempa 27 Mei 2006 Pada Sektor Rumah Tinggal Di Kota Yogyakarta Antara Kerugian Hasil Estimasi Dan Kerugian Aktual), Research Institute, Islamic University o f Indonesia.
Sarwidi (2001). Reconnaissance Team CEEDEDS, The Center for Earthquake Engineering, Dynamic Effect, and Disaster Studies, Yogyakarta.
318

Sassu, M. and Ngoma, I. (2004). Country: Malawi, Housing type: Unburat Brick Wall Building with Pitched Roof (Nyumba ya Zidina), World Housing Encyclopedia Report.
Sassu, M. and Ngoma, I.'(2004). Country: Malawi, Housing type: Rammed Earth House with Pitched Rroof (Nyumba yo Dinda OR Nyumba ya Mdindo), World Housing Encyclopedia Report.
SCEC/Southem California Earthquake Center (2002). Earthquake as Extreme Events, Extreme Events Workshop, California.
Shah, H.C. (2002). Earthquake Risk Management: A Crucial Ingredient in Reducing Death, Injury, and Economic Disruption, Risk Management Solutions, India
Spencer, L., Ritchie, J., Lewis, J., and Dillon, D. (2003). Quality in Qualitative Evaluation:A Framework for Assessing Research Evidence, National Centre for Social Research, Government Chief Social Researcher’s Office, London.
StatPac (2005). Stratified Sampling, Bloomington, available at http://www.statpac.com/surveys/sampling.htm accessed on 15 March 2006
Tantala, M.W., Nordenson, G.J.P., and Deodatis, G. (2001). Earthquake Loss Estimation Study for the New York City Area, Multi Disciplinary Centre for Earthquake Research, Buffalo.
TBCS/Treasury Board o f Canada Secretariat (2001). Integrated Risk Management Framework, Treasury Board Publication, Canada, at www.tbs-sct.gc.ca, accessed on 21 February 2005
Telford, T. (1998). Risk Analysis and Management for Project, Institution o f Civil Engineers and the Faculty and Institute o f Actuaries. USA.
Timmer, P. (2004). Operationalising Pro-Poor Growth: A Country Case Study on Indonesia, at www.gtz.de; accessed on 3 March 2005.
Turner, M., Podger, O., Sumardjono, M., and Tirthayasa W.K. (2003). Decentralisation in Indonesia, Asia Pacific Press at the Australian National University, Australia.
UNCRD/United Nations Centre for Regional Development (2003). Sustainability in Grass- Roots Initiatives, United Nations Centre for Regional Development and Disaster Management Planning Hyogo Office, Japan.
UNDP/United Nations Development Programme (1994). Human Development Report. New York.
UNDP/United Nations Development Programme (2004). Reducing Disaster Risk, a Challenge for Development, Bureau for Crisis Prevention and Recovery, New York.
UN-ISDR/The United Nations-Intemational Strategy for Disaster Reduction (2002). Living with Risk: A Global Review o f Disaster Reduction Initiatives, The United Nations Publication, New York.
USGS/The United Sates Geology Survey (2004a). at http://earthquake.usgs.gov/image_glossary; accessed on 28 Oct 2004.
319

USGS/The United Sates Geology Survey (2004b). at http://earthquake.usgs.gov/bytopic; accessed on 28 Oct 2004.
USGS/The United Sates Geology Survey (2004c). athttp://neic.usgs.gov/neis/general/seismicity/world.html; accessed on 5 June 2006.
USGS/The United Sates Geology Survey (2004d). Earthquake Facts and Statistics at http://neic.usgs.gov/neis/eqlists/eqstats.html; accessed on 14 Dec 2004.
USGS/The United Sates Geology Survey (2004e). athttp://neic.usgs.gov/neis/general/seismicity/australia.html; accessed on 14 Dec 2004.
USGS/The United Sates Geology Survey (2004f). Magnitude 5.1 Earthquake Strikes Near Plattsburgh, New York Shaking Felt Throughout New York State and Northeast, at http://neic.usgs.gov/neis/bulletin; accessed on 2 Nov 2004.
Vickridge, I.G. (1996). Project Management in Developing Countries: in Smith, NJ. (1996) Engineering Project Management, Blackwell Science Ltd, Oxford.
Wenzel, F. (2006). Earthquake Risk Reduction - Obstacles and Opportunities, Cambridge Journals, European Review, Vol 14 No 2. 221. 231, Academia Europaea, United Kingdom
Whittaker, B. and Wight, H. (2004). Earthquake Damage Distribution, at http://mceer.buffalo.edu/publications/reports/docs; accessed on 11 Nov 2004.
Wideman, R.M. (1992). Risk Management, A Publication of the Project Management Institute. USA
Wijayanto, S. (2004). Country: Indonesia, Housing type: Unreinforced Clay Brick Masonry House, World Housing Encyclopedia Report.
Yin, R.K., (1994). Case Study Research, Design and Method, 2nd Edition, Sage Publication, London.
Y^dmani, S. (2003). Disaster Risk Management and Vulnerability: Protecting the Poor, The Asia and Pacific Forum on Poverty, Bangkok.
Zhou, F.L., Xu, Z.G., and Liu, W.G. (2004). Country: China, Housing type: Multistory Base- Isolated Brick Masonry Building with Reinforced Concrete Floors and Roof, World Housing Encyclopedia Report.
320

Appendix-1:Critical value o f p (rho) at various levels o f probability (Spearman rank correlation coefficient) (Naoum, 1998)
For any N, the observed value o f p is significant at a given level of significance if it is equal or larger than the critical values shown in the table.
N(n um ber o f
subjects)
Level o f significance for one-tailed test
.05 .025 .01 .005
Level o f significance for tw o-tailed test
.10 .05 .02 .01
5 .900 1.000 1.000 ._6 .829 .886 .943 1.0007 .714 .786 .893 .9298 .643 .738 .833 .8819 .600 .683 .783 .833
10 .564 .648 .746 .79412 .506 .591 .712 .77714 .456 .544 .645 .71516 .425 .506 .601 .66518 .399 .475 .564 .62520 .377 .450 .534 .59122 .359 .428 .508 .56224 .343 .409 .485 - .53726 .329 .392 .465 .51528 .317 .377 .448 .49630 .306 .364 .432 .478
Note: W hen there is no exact n um ber o f subjects use the next lowest num ber.
Appendix page -1

From
yo
ur
expe
rienc
e, p
lease
ex
pres
s yo
ur o
pini
on
on how
im
port
ant
to ea
chst
atcm
ent
to be
carri
ed
out
in In
done
sian
ci
ties
by tic
king
(V) t
he r
elev
ant
box
(and
by wr
iting
add
ition
al s
tate
men
t in
the s
pace
pr
ovid
ed
if ne
cess
ary)
.
Appendix-2:Survey questionnaire
<r.; o
'P ££ JB
•4*’
I .B
&f
C3JZU
y~T. s f (! 5 H
| | | "'S ^In8 |3 -Jj
s.C o *o S..aV <« tsI f g JTg 8s j i
3■8j :gO'
c0cc •£ 1 2 £ 3
£ 301 ? 8.3IO 3
*3 S § 10 c.1 ag-22 ,pC
8 8| gu i
CoEa&-S•a:
C/3c
as
s l-h
4! "s *^ p
s *M
hH1
!
> p-.5
Indi
cato
rs
Geo
logy
/soil
prof
iles
and
build
ings
inv
entoi
y da
ta re
cord
ed,
map
ped,
and
up
-date
d reg
ularl
y as
nece
ssar
y, p
artic
ular
ly
in or
der
to ca
lculat
e tlx
: qu
antit
ativ
e nu
mbe
r of
non-
engi
neer
ed
build
ings
and
the
ir sp
atia
l di
strib
utio
n
«?3•aIs-,p
o•5!2-a0 n1 V, f3
"5a
■s
3Sl
'5.£ex..£12’3C2 Ex
isten
ce
of sy
stem
atic
dama
ge
asse
ssm
ent
of the
po
ssib
le ec
onom
ic im
pact
to
build
ings
usin
g se
ismic
risk
scen
ario
both
deter
min
istic
and
prob
abili
stic
appr
oach
.
Char
acte
ristic
s
1. In
vent
ors'd
ata:
ge
olog
y/so
il pr
ofile
s and
bu
ildin
gs
sc3e
5.
tt■S125
«n
5£viU£Bf;S3ena
•
Appendix page - 2
) Pl
ease
w
rite
addi
tion
al s
tate
men
t i f
nece
ssar
y

Tabic
C.
l: Ch
arac
teris
tics
and
indi
cato
rs to
‘poli
cy
and
plan
ning
1
F ZZc2 JS
■ as*r !
- IM
c .E
i
sra5
■3 53> so ^ e u ,= -5fe ££ cS -2v . 75"2 E« c e LZ0 V,E -2E 8E oC U is a® c C2 c
“ -82 -S
Ca; £ .2
1 i ?a X_ 8 8 45
2 e.
■2 C2
* z■s §
'd V*. o Cp1 2
g 8
l l
Po '"O 3 p
“ ■S fo «£ J o r, >
J 1 •g g■s.-g« 8c
c .2a u »i 2 C .5! 8 ' « £
= •1 EL
X
a8fu
•ac«
Ora
, o•5c
* acrt
y
H&
J =U
fNuyJ2,rat—
M £ * Q -2
43 -k £n
2 I•Gs33
I" f
Indi
cato
rs
Seism
ic co
des
(socia
lly
acce
ptab
le,
writt
en
in sim
ple
lang
uage
, an
d ec
onom
ically
fe
asib
le)
arc
exist
ed
and
upda
ted
Exist
ence
of
adm
inist
rativ
e and
in
stitu
tiona
l m
echa
nism
fram
ewor
k fo
r im
plem
entat
ion
of se
ismic
code
s1.
Exist
ence
of
regu
latio
n of
build
ers
and
real
estat
e de
velo
pers
fo
r cr
eatio
n of
seism
ic re
sista
nt b
uild
ings
2. Ex
isten
ce
of re
gulat
ion
of Fi
nanc
ial
Insti
tutio
n for
en
surin
g se
ismic
re
sista
nt f
eatu
res
in new
and
ex
tensio
n of
exist
ing
cons
truct
ions
w
hile
giv
ing
loans
and
insu
ranc
e3.
Exist
ence
of
syste
ms
to co
ntro
l co
mpl
iance
and
en
forc
emen
t in
actu
al
prac
tices
Exist
ence
of
com
pulso
ry
certi
ficat
ion
system
for
eng
inee
rs,
arch
itect
s, an
d fo
rem
an
£32ClCi©2o2u©oao
Cha
ract
eris
tics
1. Se
ismic
code
s
2. La
ws a
nd
regu
latio
ns
3. Co
mpl
iance
and
en
forc
emen
t
4. Ce
rtific
atio
n sy
stem
for e
ngin
eers
, ar
chite
cts,
and
fore
man
1 5.
Resp
onsib
ility
and
ac
coun
tabi
lity
1
•
Appendix page - 3
*) Pl
ease
ut
ile
addi
tion
al s
tate
men
l if
nece
ssar
y

Tabl
e C.
3: C
hara
cter
istic
s an
d in
dica
tors
to
‘org
aniz
atio
nal
stru
ctur
es’
*C 5d J•fc*5 ? i1 i
-B2 S.
.g»<502
1.E
- i
Indi
cato
rs
Exist
ence
of
an ad
min
istra
tive
stru
ctur
e re
spon
sibl
e fo
r di
sast
er
redu
ctio
n |
Exist
ence
of
sect
oral
pro
gram
mes
in
line
min
istr
ies
1. Ex
isten
ce
of co
nsul
tatio
n, a
nd
role
forc
ivil
soci
ety,
NCi
Os,
priv
ate
sect
or a
nd
the
com
mun
ities
to
redu
ce
seism
ic ris
k2.
Exist
ence
of
grou
p or
indi
vidu
al t
hat
have
in
corp
orat
ed
earth
quak
e ris
k re
duct
ion
as a
perm
anen
t or
sign
ifica
nt p
art
of th
eir o
pera
tions
an
d co
mm
itmen
t
Cha
ract
eris
tics
1 1.
Impl
emen
ting
and
co-c
oord
inat
ina
bodi
es
I
*2cT>c»* XA•a £
! g
£:§ * •S .£■ £ •s a -5^ig 3 5 £ t Jj= i =cj 3.
Civi
l so
ciet
y, N
GO
s, pr
ivat
e se
ctor
and
co
mm
unity
pa
rtic
ipat
ion
• C3u*5c
"OcC3\r.o
XX
JZu
Uj j
*C £d J
i i
51
I TIE
&
v2P3
•JC
U
W u
tljcTa
.2 g'S0 « 2 c £ “ « a n ■B "3 •- c •»-* c,2 S «l ' | 12 S 2“ “ w %AO OH .2 .£a t» -gS a wo c 2
Appendix page - 4

Table
C.
5: Ch
arac
teris
tics
and
indi
cato
rs to
‘info
rmat
ion
man
agem
ent
and
com
mun
icat
ion’
‘2 i J ? ** £ J2
3 ? fJS c & < . c
5
1
?&•
•S
s - i
* *
In
dic
ato
rs
O.tS
_ c
f i=3C
■5
c. 2
1
1- oV*cd
at jX*’J?UJ
0
1 c c 1/1 V. £ 3
• 8
■gr jc
. 2Hc
g
• uV
o
gHiTa
*55U J
r i
* sf3
5 ^? c u C T 3
T ti Qe ^
*S ^
. i ^* On
: 0
I l• o - 2S ,r:f t - r j
J 2 E 2 c5 c
1 1
1 1. 1 »p •■=
§ §. £ p
2 E | S
3 E U . = V - 2= £ t s o f i E
( J exj c .
U!. g
. 2
vi
'5
1p
5
5• sc
T js s3tr.
2
c .
1■S" 3
’i 1 8 1v. 2
* 9U? c
U
£
c
1p5 ■
£
yP3
eoc
8c
. 2
£• 5V . r2
° Sk o
PS ^ 1 & u i E
e -i
er.
E81s
&cas1t0<2.tst/t
£8&Xd
ubc
1d
2'5?Ui
.£
du*ssrg
<2
.2o2c .
J* r c c .2
•C 33 a <* GO L.
. P s>— * 3
H'2C faC.«S
V » TS° u§ i 3 2* 2 ui 2n
Cha
ract
eris
tics
c.2
1 1 ’
.2 1 -5 wy V 5 aI I1 ic SP£ s
.= c.
2. Ne
twor
ks
for s
eism
ic ris
k m
anag
emen
t (s
cien
tific
, te
chni
cal,
and
appl
ied
info
rmat
ion,
tra
ditio
nal/i
ndig
enou
s kn
owle
dge)
•
"5 5
t'J2.!12!
|jr|"i
Indi
cato
rs
Exist
axre
of
appr
opria
te cu
rricu
la in
seism
ic risk
re
ducti
on
at all
lev
els o
f cd
ucat
bn
Exist
ence
of
the
role
of tea
cher
to
diss
emin
ate
and
apply
se
ismic
code
s in
the
rea
l pr
actic
e tli
roug
h the
ir stu
dent
acti
vitie
s (in
cludi
ng
colla
bora
tion
with
ot
her
parti
es)
Exist
ence
of
TOT
for c
omm
unity
lea
ders
perio
dica
lly1.
Exist
ence
of
traini
ng
for d
evel
opm
ent
auth
oriti
es,
Com
mun
ity
Org
aniz
atio
n, N
GOs,
group
of
fore
man
, pr
ivate
se
ctor
s: re
al-c
stat
c fir
ms,
build
ers,
small
-med
ium
co
ntra
ctors
in
safe
-bui
ldin
g pr
actic
es a
nd
retro
fittin
g te
chni
ques
2. Ex
isten
ce
of ap
pren
tice
prog
ram
mes
in
seism
ic risk
m
anag
emen
t fo
r go
vern
men
t di
saste
r m
anag
emen
t st
aff
Char
acte
ristic
s
1. In
clusio
n of
seism
ic ris
k re
ducti
on
at al
l lev
els o
f ed
ucati
on
(cur
ricul
a, e
duca
tiona
l m
ater
ial)
2. Th
e rol
e of
teach
ers
throu
gh
scho
ol
activ
ities
3. Tr
ainin
g of
train
ers
(TOT
) pr
ogra
mm
es4.
Loca
l, N
atio
nal,a
nd
Inte
rnat
iona
l tra
ining
pr
ogra
m
•
Appendix page
') Pl
ease
w
rite
addi
tiona
l st
atem
ent
if ne
cess
ary

Table
C.
7: C
hara
cter
istic
s an
d in
dica
tors
to
‘pub
lic a
war
enes
s’
'C *6 M
4S ■*% S t i .
1 ■£
■* I2 S..e
& £
c;'§
t3 ^S a
uT5J —» - 8vtC E aC. . a vi
j / K p9 cd 322 . £ Es = *2 *3 a
83S u* 2 8 - &
CD
.2 • ” a .S gn jJ«2 « c > —
c 3c J£ ‘3_ JZ.
. n o
r £ 3 _
vi t£ —
8 .2 .E O J! f 3 r - -
~ 2. c g=c l cl) cl~ § 5
3‘-~1 1.5 t/"- “ C* y
,-a i- cp g jo1£ §"*32.— X P = v- 3 J1 3•* o £ ° ^< ^ c ■ S i
P *V —; V; S N U
2 i 1is v ^E g
C f r i ls e -22 y si l l
c3 .=s "J 55 3 ^2 •§ •=ac « 3
S •«’c § § e *6 £2 8 0*1 g Jcj c
l iuj a
-ocl).221 aE c
3■= J 5
*8 c2.2 2 ^ 3
Sc3
8-6 p. 1/5c e
I I.a u,x5 2 UJ CJ
ijO! *Sz J5fr“oO .1*2* S^ 5v; g o ^
sr ^
H' 31 I“ SI.
ua 23J
v. J 3
5S c.■ §■ a3 3(J • - CJ V. — CJ
f 1S ° | 1
II*= C c j P
« Pu. .ao t;3 o2 c.3 Vi| £2 Oc g » « 8 -c * S J*R .3-3 3dll I
U)2r3JC
C J
.2
1
. s s
g CD
■S '5uj.2 | |
= ! i
11c S 0s
J 1 >a l i ig 5 ■= 2p ~ . 2 3•a *2 ■§ .a Q g I K
Appendix page - 6

Tabi
c C.
8: C
hara
cter
istic
s an
d in
dica
tors
to
‘res
earc
h’
% s £ &
4r« t; J y 5k e c.
1 .£■e
£ *2 CL.6
i*us
H
B-£
4" i
Indi
cato
rs
Exist
ence
of
cost
-eff
ectiv
e ne
ss
rese
arch
in
appl
icat
ion
of se
ismic
fe
atur
es
both
for
new
and
exist
ing
build
ings
(r
etro
fitti
ng)
Exist
ence
of
redu
cing
se
ismic
ris
k th
roug
h In
terd
isci
plin
ary
rese
arch
be
twee
n sc
ienc
e an
d po
licv
(evi
denc
e-ba
sed
polic
s ) c
ompr
ehen
sive
lyIn
dica
tors
, st
anda
rds
and
met
hodo
logi
es
esta
blish
ed
for s
eism
ic
haza
rd
anal
ysis
and
asse
ssm
ent,
uniq
ue
to th
eir
loca
l ne
eds
1. Pr
ovid
ing
tech
nica
l su
ppor
t, tra
inin
g, a
nd pe
riodi
c as
sess
men
ts o
n ea
rthqu
ake
vuln
erab
ility
th
roug
h the
re
sear
ch/k
now
ledg
e at
all
com
mun
ity
leve
ls.
2. Ex
isten
ce
of lo
cal
acad
emic
in
stitu
tions
as
Key
Reso
urce
I n
stitu
tions
fo
r ea
rthqu
ake
risk
man
agem
ent.
<uex.J0 X tl3
.21 L.0 £ "Sa1 ■1
z0*3c8co
.aXUJ
Cha
ract
eris
tics
1. C
ost-e
ffec
tiven
ess
rese
arch
in
ap
plic
atio
n of
seism
ic
feat
ures
2. In
terd
isci
plin
ary
rese
arch
be
twee
n sc
ienc
e an
d po
licy
3. Ev
alua
tions
and
fe
edba
ck
4. Lo
cal,
Nat
iona
l, arid
In
tern
atio
nal
co
oper
atio
n in
rese
arch
, sc
ienc
e an
d te
chno
logy
de
velo
pmen
t
•
*c *B J
I c g-< .5
* -B 2 i
c.E
a.5 o 2 £| 8.5 cii
T3 S & g.£ O£ *o .55 -=<u EPV. 3c« PC ±3
i f 1 1. £ o — *o3 3
~ -C
C C .
«2 . §
£*8* 2 5 8 ? £ uJ 2
w
o2C3JC
U
■89"5>
JD3•aS
*3a
V*.
8 &CD
c . o
1 Gw
.3*
u.
Appendix page - 7
') Ple
ase
wile
addi
tiona
l sta
tem
ent
i f ne
cess
ary

Tabl
e C.
10:
Cha
ract
eris
tics
and
indi
cato
rs
to ‘p
hysi
cal
mea
sure
s’
'c 5
-fc' r $ ? *
£ 1..6
hH332
J
Indi
cato
rs
C/35£5>■C/3c.21E<2c1"E.E«8Cer.'553C.n
OE.5wV.V.CO2V.2ui Co
mplia
nce
of pu
blic
and p
rivate
buil
dings
with
seism
ic co
des
and
stand
ards
1. Ex
isten
ce o
f retr
ofittin
g pro
gram
for p
ublic
buil
dings
(he
alth
facil
ities
, sc
hools
, lif
eline
s, etc
) at
high
seism
ic ar
ea
V!a3l1/5
5u.a1u.5
oO
eoE*HEu.C33Cl£Cmcogow:’xUJ
3. Ex
isten
ce o
f the
numb
er of
mode
l ho
uses
with
seism
ic fea
tures
, low
- co
st, a
nd sim
ple a
s we
ll as
ready
to
rep!ic
atc i
n oth
er ar
eas
Cha
ract
eris
tics
V*,
.21C3OS3■g2
■g©>ScS*8u0 p— er .12 c <y 13V, *3er> 'g.3 J231 -51 er i
V.C,©
11/5501
ic.HS3■g,2Wrn
•
Appendix page - 8

Appendix-3:C opy o f som e questionnaire circulation perm its from organisations and/or agencies
PEMERINTAH PROPINSI DAERAH ISTIMEWA YOGYAKARTADINAS PERMUKIMAN DAN PRASARANA WILAYAH
(DISKIMPRASWIL)J ALAN BUMI J O NOMOR : 5 T E L E P O N . 5 6 5 2 6 0 , 5 1 4 1 7 8 . 5 8 9 0 9 1
YOGYAKARTA
SURAT KETKKANGAN No: . . .8 1 4 .2 /1 0 1 /C ..........
Menunjuk Surat dari Sdr. Setya Winarno tanggal 17 Nopember 2005 tentang permohonan ijin penelitian,
bersama ini dapat diberikan ijin untuk melakukan penelitian kepada
Nama : Setya Winarno
Pekerjaan : Dosen Tetap Jur. Teknik Sipil FTSP U1I Yogyakarta
Pendidikan : Sedang studi lanjut Ph.D. (S-3) di Sheffield Hallam University, England
sebagai bagian dari penelitian Program Ph.D. di England, dengan judul: Seism ic R isk M anagem ent of
N on-Engineered Buildings.
Untuk itu kepada staf-staf teknik di lingkungan BidangCipta Kar\a, Diskimpraswil Propinsi D1Y dan para
kontraktor bangunan gedung (mitra kerja Bidang Cipta Karya, Diskimpraswil Propinsi DIY) untuk dapat
ikut berpartisipasi dalam pengisian kuesioner dalam penelitian tersebut.
Demikian Surat Keterangan ini dibuat untuk dapat digunakan sebagaimana mestinya.
T to b u ea n kop ad a Y th i
1 . B pk . JCa D Ifia s K ir a p r a sv il P r o p . DIY
( eobagtwi la p o r a n )
2 , A r a i p .
Yogyakarta, D esem ber2005
^>An. Kepala ia),BKking Cipta Karya
! * d iskim prasw ilI r M N u teasuki, MM
020 171
Appendix page - 9

PEMERINTAH PR O PIN SI DAERAH ISTIM EW A YOGYAKARTASATIAN KOORDINASI PELAKSANA PENANGGUIANGAN BENCANA DAN PENANGANAN PENGLNGSI
(SATKORLAK PBP)k om plek k ep a lih a ii O am ircjan Telepon ((1274) 563231 . 562811 psw.230 Fax. ((1274) 5 1‘>441
YOG YAK A R T A -55213
SURAT KETERANGANNom or ■ Z / 3 O/2 <>4 t
Bersama surat ini kami, Sekretaris Pelaksana Harian SATKORLAK PBP Propinsi DIY mendukung dan
memberikun ijin kepada :
Nama : Setyo Winarno
Pekerjaan : Dosen Tetap Jurusan leknik Sipil FTSP Ull Yogyakarta
Pendidikan : Sedang studi lanjut Ph.D. (S-3) di Sheffield Hallam University, England.
untuk melakukan penelitian, sebagai hagian dari penelitian Program Ph.Ddi England, dengan judul :
Seismic Risk Management of Non-Engineered Buildings.
(Kajian Faktor-faktor Kritis Dalam Penerapan Fitur-fitur Rumah/Gedung Tahan Gempa)
Untuk itu, perkenankanlah kami motion kepada Bapak/Ibu/Sdr Kepala Dinas/Instansi terkait
SATKORLAK PBP Propinsi DIY dan SATLAK PBP se Propinsi DIY untuk dapat ikut berpartisipasi
dalam pengisian kuesioner dalam penelitian tersebut.
Demikian Surat Keterangan ini dibuat untuk dapat dipergunakan sebagaimana mestinya.
Yogyakarta, Nopem ber 2005
Kepala Dinas Ketentraman dan Ketertiban Untum Propinsi DIY'Selaku
sana Harian SAT
fotrscriM , m miP : 010105316
Appendix page -

PEMERINTAH PROPINSIDAERAHISTIMEWA YOGYAKARTABADANINFORMASI DAERAH
(BID)Jl. Brigjen Katamso, Komplek THR, Telp. (0274) 373444,562811 pes 189,520424
Fax. (0274)374022, e-mail: [email protected]; SMS: 081328444382 YOGYAKARTA
KodePos 55152
Yogyakarta, ^ ' Nopember2005
KepadaYth. Sdr. Wartawan Unit Pemprop Di Kepatihan Danurejan Yogyakarta
Dengan hormat,
Bersama ini kami beritahukan bahwa berdasarkan permohonan dari:Nama : Setya WinamoPekerjaan : Dosen Tetap Jurusan Teknik Sipil FTSP UII YogyakartaMahasiswa : Program S-3 Sheffield Hallam University EnglandJudul Penelitian: Seismic Management of Non Engineered Buildings
tanggal 17 Nopember 2005, Badan Informasi Daerah mempersilakan kepada Sdr. tersebut di atas untuk melakukan penelitian dengan responden Wartawan Unit Pemerintah Propinsi Daerah Istimewa Yogyakarta, sesuai dengan izin yang dikeluarkan Pemerintah Propinsi Cq. Badan Perencanaan Daerah.
Sehubungan dengan hal tersebut, maka mohon bantuan kepada Rekan-rekan Wartawan untuk mengisi kuesener yang diberikan Sdr. Setya Winamo, serta memberikan jawaban / keterangan yang dibutuhkan.
Demikianlah pemberitahuan ini, atas kerja samanya diucapkan terima kasih.
Mart, 'swoto
Nomor: Q2t>Lamp. : 1 (satu) berkas Hal • : Penelitian
Appendix page -11
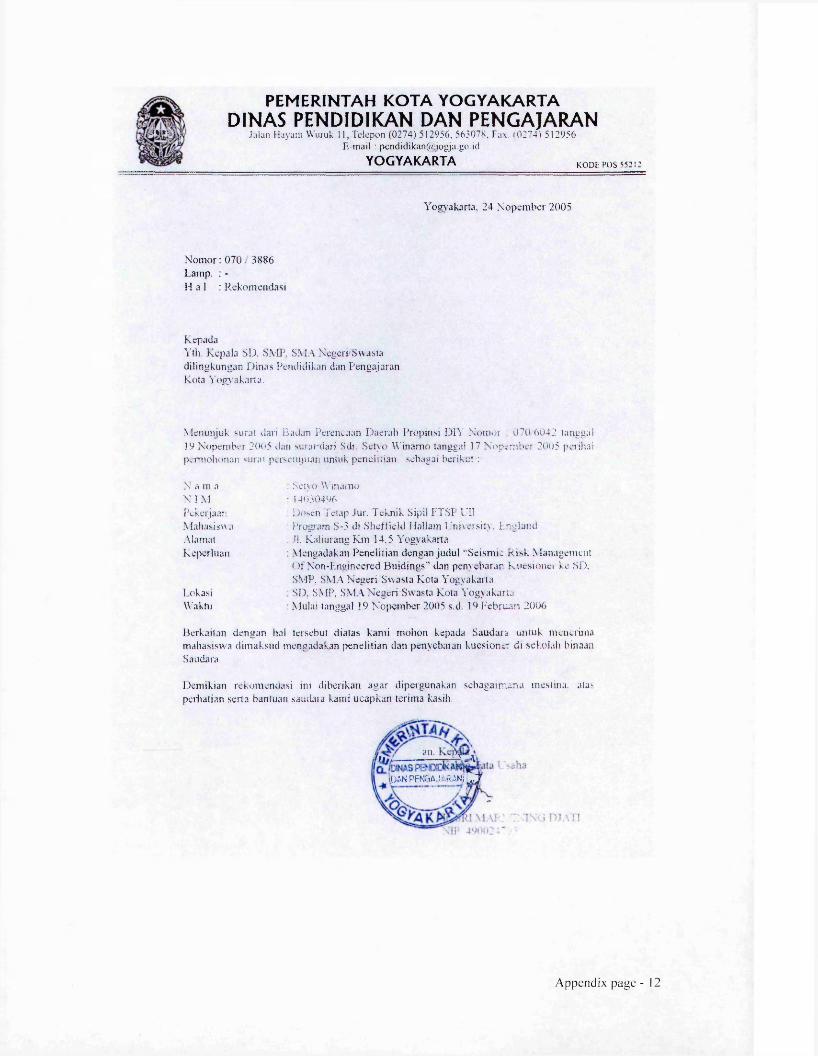
, m » V .
PEMERINTAH KOTA YOGYAKARTADINAS PENDIDIKAN DAN PENGAJARAN
Jalan Hayam Wuruk II, Tclepon (0274) 512956, 563078. F av <02'?4> 512956 H-mail : pcndidikan@ jogja.go.id
YOGYAKARTA KODC POS 552!2
Yogyakarta, 24 Nopember 2005
Nom or: 070 3886 Lamp. : -H a 1 : Rekomendasi
KepadaYth. Kepala SD. SMP. SMA Negeri Swasia dilingkungan Dinas Pendidikan dan Pengajaran Kota Yogyakarta.
Menunjuk surat dan Badan Perencaan Daerah Propinsi DIY Nomor 070 6042 tanggal 19 Nopember 2005 dan surat dari Sdr. Setyo Winamo tanggal 17 Nopember 2005 perihai pennohonan sural perseiujuan untuk penelitian sebagai berikut :
N a m a Setyo WinamoN I M • 140304%Pckerjaar: Dosen i clap Jur. Teknik Sipil FTS1 I'llMahasiswa Program S-3 di Sheffield Hallam University. EnglandAlainat .!!. Kaliurang Km 14.5 YogyakartaKeperluan : Mengadakan Penelitian dengan judul "Seismi- Risk Management
< )t Non-Engineered Buidings” dan penyebaran Kucsionei ke SD. SMP. SMA Negeri Swasta Kota Yogyakarta.
I.okasi SD. SMP. SMA Negeri Swasta Kota YogyakartaWaktu : Mulai tanggal 19 Nopember 2005 s.d 19 Februari 2006
Bcrkaitan dengan hal tersebut diatas kami mohon kepada Saudara lintuk mencrima mahasiswa dimaksud mengadakan penelitian dan penyebaran kucsioner di sekolah binaan Saudara.
Demikian rekomendasi ini diberikan agar dipergunakan sebagairruna mestina. ata> perhatian serta bantuan saudara kami ucapkan terima kasih.
Itj s an' 'Ov V'
IpANPEN&A JAPAN/ J J
Appendix page - 12

P E M E RINTAH KOTA YOGYAK ARTA BADAN PERENCANAAN PEMBANGUNAN DAERAH
Komplek Balaikota Jalan Kenari No. 56 Telepon 515207, 515865'515866 Psw. 153, 154
SURAT KETJRANGAN HJJN070/2033*
Mem baca Surat : Dari Rektor - Ull Yogyakarta
Nornor : 1817/Rek/20/BPSDM/;X/2C(Tanggal: 28/09/2005Mengingat : 1. Keputusan W alikotamadya Kepala Daerah Tingkat II Yogyakarta
Nomor 072/KD/1986 tanggal 6 Met 1986 tentang Petunjuk Pelaksanaan Keputusan Kepala Daerah Istimewa Yogyakarta, Ncmor 33/KPT/1906
tentang : Tatalaksana Pemberian izin bagi setiap Ir.stansi Pemerintah maupun non Pemerintah yang melakukkan Pend3taan / Penelitian
2 Keputusan Gubernur Daerah Istimewa Ycgyakaria N om or: 38/I 2/2004 Tentang : Pemberian izin / Rekom endasi Penelitian/Penda'aan/Survei/KKN /PKL di Daerah Istimewa v ogyakarta
Diijinkan Kepada Nama SETYA WINARNG NO MHS / NIMPekerjaan : D osen FTSP - Uil Yogyakarta
Alamat J| Kaliumng KM 14,5 YogvakartaPenanggungjawab Prof.Dr. Alan GriffithKeperluan Melakukan penelitian dongan judul : KAJIAN ESTIMASI
KERUSAKAN RUMAH DAN GEDUNG AKIBAT SKEN4RIO GEMPA DI KOTA YOGYAKARTA
Lokasi/Responden : Kota YogyakartaWaktu 08/10/2005 Sam pai 08/01/2006Lampiran Proposal dan Daftar Pertanyaan
Dengan Ketentuan 1 Wajib Memberi Laporan hasil Penelitian kepada Walikota Yogyakarta
(Cq. Badan Perencanaan Pem bangunan Daerah Kota Yogyakarta)2. Wajib Menjaga Tata teitib dan mentaatai ketentuan-ketentuan yang berlaku setem pat3. Ijin ini tidak dislahgunakan untuk tujuan teitentu yang dapat m engganggu kesetabilan
Pemerintah dan hanya dipeilukan untuk keperluan ilmiah4. Surat ijin ini sewaktu-waktu dapat dibatalkan apabda tidak dipenuhinya
ketentuan -ketentuan tersebut diatas
Kemudian diharap para Pejabat Pemerintah Setem pat dapat memberibantuan seperlunya
Tand;|tanqan P em eeang Izin
Dikeluarkan di Pada Tanggal
v ogyakrta08/10/2005
Sf^TYA 1$ 1/INARNO
Tembusan Kepada Yth :1 Walikota Yogyakarta
Ka. BAPEDA Prop. DIYKa. Kantor Kesbang dan Linmas Kota YogyaKarta
Ka. DTKB Kota Yogyakarta Camat se- Kota Yogyakarta (14)Ka BPS Kota Yogyakarta Rektor - Ull Yogyakarta Arsip.
Walikota Yogyakarta Bappeda
Penelitian & KAD
ni PR.
0027328
Appendix page - 13

PEMERINTAH PROPINSI DAERAH ISTIMEWA YOGYAKARTADINAS SOSIAL
,11. Janti, Banguntapan Telepon / Fax (0274) 514932,563510 Y O G Y A K A R T A
SURATPENGANTAR f Nomor : 0 ^ ^ < S o ® (/J ? I ^
Bersama surat ini kami. Dinas Sosial Propinsi Daerah Istimewa Yogyakarta mendukung dan memberikan ijin kepada :
N a m a : Setyo WinamoPekcrjaan : Dosen tetap jur. Teknik Sipil Ull YogyakartaPendidikan : Sedang studi lanjut Ph.D ( S.3 ) di Sheffeld Universitas, England
Untuk melakukan penelitian. sebagai bagian dari penelitian Program Ph.D. di England, dengan ju d u l:
Seismic Risk Management of Non - Engineered Buildings.
Untuk itu. perkenankanlah kami mohon kepada pihak - pihak yang berkaitan dengan Lembaga Swadaya Masyarakat dan Kelompok kelompok Masyarakat yang telah mendapat ijin operasional sebagai lembaga Organisasi Sosial yang menangani UKS di lingkungan Propinsi Daerah Istimewa Yogyakarta untuk dapat ikut berpartisipasi dalam pengisian kuesioner dalam penelitian tersebut.
Demikian surat keterangan ini dibuat untuk dapat digunakan sebagaimana mestinya.
Yogyakarta, Desember 2005
Kepala
Rnswanto / IP. 470 009 719
M g W o r d Ijin P S A A
Appendix page -

v - Phonpi+62 274 895042,'896440,’Fax! +62274895330E-m ail:[email protected] epage:www.uii.ac.id
Menunjuk surat permohonan dari Sdr Setya Winamo tertanggal 3 Desember 2005, bersama
surat ini kami, Direktur CEEDEDS mendukung dan memberikan ijin kepada
Pekerjaan : Dosen Tetap Jur. Teknik Sipil FTSP UII Yogyakarta
Pendidikan : Sedang studi lanjut Ph.D. (S-3) di Sheffield Hallam University, England
dengan judul:
Seismic Risk Management of Non-Engineered Buildings.
Untuk itu, perkenankanlah kami mohon kepada Bapak/Sdr Mandor-Mandor Bangunan di lingkungan DIY dan sekitamya (yang pemah berpartisipasi di kegiatan CEEDEDS) untuk
dapat ikut berpartisipasi dalam pengisian kuesioner dalam penelitian tersebut.
Demikian Surat Keterangan ini dibuat untuk dapat digunakan sebagaimana mestinya.
* i
SURAT KETERANGAN No: 02 / A / CEEDEDS / XIJ / 2005
Nama : Setya Winamo
untuk melakukan penelitian, sebagai bagian dari penelitian Program Ph.D. di England,
i , MSCE. Ph.
Yogyakarta, 6 Desember 2005 Direktur CEEDEDS UII Yogyakarta
i , MSCE. Ph.D., IPU)
Appendix page -1 5

PE R SA TU A N
PE R U SA H A A NR eal E stat In d o n e s ia
D PD P R O P IN S I DA ERA H ISTIM EW A YOGYAKARTA
Nomor : 068/REI/DIY/XI/2005 Lamp. : ! (satu) BendeiPerihal: Permohonan Partisipasi dalam Penelitian
Kepada YthSegenap AnggotaDPD REI Prop. D.I.Yogyakartadi Yogyakarta
Dengan hormat,
Memperhatikan surat dari Ull Yogyakarta, 2028/Rek/20/BPSDM/XI/2005/, perihal permohonan permohonan partisipasi dalam penelitian dengan judul Seismic Risk Management of Non - Engineered Buildings penelitian ini bertujuan untuk membuat kerangka kerja yang berguna bagi pihak pemerintah,swasta, dan seluruh komponen masyarakat yang lain dalam rangka untuk mengurangi resiko gempa secara komprehensif akibat kerutuhan rumah/gedung non-teknis (non-engineered buildings) dengan pendekatan “ risk management".
Maka Bersama ini DPD Persatuan Perusahaan Realestat Indonesia (REI) Propinsi Daerah Istimewa Yogyakarta mengharapkan kepada segenap anggota untuk dapat membantu memberikan informasi berkaitan dengan hal tersebut, kepada :
Nama : Setya WinarnoPekerjaan : Dosen Tetap Jur.Tenik Sipil FTSP Ull YogyakartaPendidikan : Sedang studi lanjut Ph.D (S-3) di Sheffield Hallam
University, England
Salah satu metode pengumpulan data yang akan ditempuh adalah menggunakan metode kuesioner yang akan sisebarkan kepada anggota DPD REI DIY.
Demikian Surat Keterangan ini, untuk dapat digunakan sebagaimana perlunya, atas perhatian dan kerjasamanya kami ucapkan terima kasih.
Yogyakarta, 24 November 2005 DPD REI Prop. D.I.Yogyakarta
lr. Hennv Leksmana Ketua
9ou& / lr. Remigius Edv Waluyo Sekretaris
JL TIMOHO II NO. 28 MUJA-MUJU YOGYAKARTA 5 5 165 TELP. (0274) 514181 , 542867 . 542868 FAX. (0274) 542868
Appendix page - 16

PERSATUAN WARTAWAN INDONESIA Pengurus Cobang Yogyakarta
Y ogyakarta B ranch E x ecu tiv e B oard IN D O N E S IA N JO U RN A LISTS A SSO C IA TIO N
ALAMAT : JALAN GAMBIRAN 45 YOGYAKARTA 55161 TELP. (0274) 380266
S U R A T K E T E R A N G A N
Nomor : 31 6 /P W I-Y k /S k /X I/2 0 0 5
Pengurus PWI Cabang Yogyakarta menerangkan, bahwa :
N a m a : SETYA WINARNOPekerjaan : Oosen Tetap di Jurusan Teknik Sipil
FTSP Universitas Islam Indonesia Di Yogyakarta
Pendidikan : Sedang studi lanjut Ph.D (S 3) diSheffield Hallam University, England
mengadakan penelitian sebagai bagian dari penelitian Program Ph.D di England, dengan judul :
'Seism ic Risk M anagement of Non-Engineered Buildings'
Peneliti akan meminta masukan dan peran serta secara teknis dan non- teknis kepada berbagai pihak, termasuk wartawan.
PWI Cabang Yogyakarta memohon bantuan para wartawan di Yogyakarta dan sekitarnya, dapat ikut berpartisipasi dalam pengisian kuesioner dalam penelitian tersebut.
Surat Keterangan ini dibuat untuk bisa dipergunakan sebagaimana mestinya.
Drs Octo Lampito
Ketua
Yogyakarta, 25 November 2005
Pengurus PWI Cabang Yogyakarta
Rakiman Sh BA
Sekretaris
Appendix page - 17

m m m i
UNIVERSITAS ISL A M INDONESIAKampus Universitas Islam Indonesia, Gedung Rektorat, Jl. Kaliurang Km. 14 ,5 , Yogyakarta 5 5 5 8 4
Telp. (0 2 7 4 ) 8 9 8 4 4 4 (Hunting); Fax. (02 7 4 ) 8 9 8 4 5 9 ; Http://www.uii.ac.ld; E-mail: [email protected]
N om or: /Rek/20/BPSDM /XI/2005Lamp. : 1 (satu) bendelH a l : Permohonan partisipasi dalam Penelitian
Kepada Yth.
Assalamu 'alaikum u’.vr.
Bersama surat ini. Rektor Universitas Islam Indonesia (UII) Yogyakarta menerangkan bahwa salah seorang Dosen Tetap Jurusan Teknik Sipil a.n. Setya Winamo sedang menempuh studi lanjut S-3 di Sheffield Hallam University. Saat ini yang bersangkulan sedang melaksanakan penelitian S-3 dengan judul: Seismic Risk M anagem ent of Non-Engineered Buildings.
Penelitian ini bertujuan untuk membuat sebuah kerangka kerja yang berguna bagi pihak pemerintah, swasta dan seluruh komponen masyarakat yang lain dalam rangka untuk mengurangi risiko gempa secara komprehensif akibat keruntuhan rumali/gedung non-teknis (non-engineered buildings), dengan pendekatan “risk management Pengumpulan data yang akan ditempuh adalah menggunakan metode kuesioner, wawancara terseleksi, dan workshop.
Untuk itu, perkenankanlah kami mohon kepada Bapak/Ibu untuk dapat berpartisipasi dalam pengumpulan data tersebut, baik melalui pengisian kuesioner, kesediaan untuk w'awancara, dan/atau hadir di acara workshop.
Demikian atas kerjasamanya diucapkan terima kasih.
Wassalamu ’alaikum w.w.
Yogyakarta, / a November 2005^Rektor,
Dr. lr. Luthfi Hasan, MS i
Appendix page - 18

Tabl
e 1
Raw
Dat
a of
Res
earc
hers
/Sci
enti
sts'
Opi
nion
to
Seis
mic
Ri
sk
Man
agem
ent
Sta
tem
ents
Appendix-4:Raw data o f questionnaire survey
£ loqum^ juoiuoicjj
9c joqum,^ luouiojtns
gg joqum.s* nioiuoiuis
t-g wquinjq iuooicuris
ni£g jaqumjq lumiieis^g i?qumfq iuoiudiri$
ig jDqtuniumeisOg jaqumjq juoujoibjs
joqumjq juoiuoieis
wquinjq ju3uw]Bis
Lb wqumjq juauiJicjs
9joqumiu3iuoiRJSgwqmnjqiuoTOCisfb joqunijq jwuwjbislb Joqiunjq iirauwuris’b wqum 1U3U131RJ5Ifrjaqum juouwieisOj- ioquinjq juoiuoicis
6£ j3qumjqiu3ia?jBisKtfqiunM juoLUOii’iSLI wqumjq juouiOMS
9gwquin iunuw)Rts 8 9 f £g£ joqtunfs? juouiojujs
tL L 'it£ joqumjq jtrauiaicis
H jaqumjq jiwuwieisH jjqumjq jikhuojcjs
I£ wqainjq iu3ui3in s
0£ joqumjq juouioiujs
61 joqurnj ju?uio;ris
%Z ioqwn luomoieisL Z J3qum\ iu3iu?icis
i)Z joquinjq luatuajeis
SZ jaqumjq juduiojuis
bz Joqum iudiu3icisIZ ioquin\r juoinoiuis;
ZZ wqumjq juduwjbis
l jaquinft lunuiajBisOc ioqiunjq juoiuojBjtg61 jsqiunjq 1U3U13JRISK1 iOquinjq 1U3U131BISL\ j?qumjq 1U3UI3]R]$
91 i3quin{q JU3UM1B1Sgi joqumjq juotuoicis
b\ wquinjq ltrauwieitj
£| J3qwn4NJ JU3UI31BJS£| jDquinjq juDuiajBis11 joquinj )03Ui3|Bis0 | jsquinjq iuoui3)Ri$
6 joqunvq juouioms
8 joqiunsj jiuHuajRJS
L Joqum«q itrauwims
9 joquin»q iu3ui3iuj$
C jaqumjq iu3ui3iEis
b Joquinjq juouidjbis
£ joqumjq iiraiuows
Z J3qum?q luoatoms
I i?quin JW31U3JBJS
Appendix page - 19
stat
emen
ts
is 4.
132
(bet
wee
n im
port
ant
and
very
im
port
ant)

Table
2
Raw
Data
of Sm
all-M
ediu
m
Cont
ract
ors'
Opin
ion
to Se
ismic
Risk
M
anag
emen
t St
atem
ents
L S J o q u m N lu o iu o p n s Of w-i > J- > *o v *0 *0 *0 >3* 'o- '*1* >3- >r WO Of Of Of Of Of Of Of Of Of
9 g jc tq tu n ^ ju o u io in ig Of w-> *0 > **> > > > > •n >r *0 •o > ■*3* > > > o wo Of Of Of *0 Of Of Of Of
g g ja q iu n jq Of • n V*, i/-t -i ■*7- •''i *0 *o > WO wo wo Of Of Of wo wo fo Of Of W, Of
%-g j o q t u n ^ l u o u t ^ i o s Of w-> **> 3- n >3- >3- > ' r WO > WO Of Of Of Of Of .y, Of
g g JoquinfvT ju o tu o p n s Of *o *0 U-i > , ‘ > •o >3* ** •O •o 3* V WO "O* wo Of Of Of Of Of wo Of Of Of •o Of
i g i o q i u n ^ ju o u io p u s <N <N > •O *+k >3- > *0 *o > V > WO Of wo Of Of Of ‘■n Of Of W-J Of
[ g j o q t u n x lu o u to p u s w-i >r <N "T- <N > <N , - U-, »o *n wo wo Wf > Of Of Of *0 *o *00 <N Of Of ly, Of
Og j o q i u n ^ u io iu o jt i i s W~> w~> ia. *o *o >3- > > > lr, >T > •o > > wo Wo wo Of Of Of *0 "»0 Of Of Of Of W% Of
6 t* J o q tu n \f ju n u io ^ n is Of •O > > > ir, rn >3- > •O "o > WO ly. W3* WO *00 WO Of o> wo wo Of rn W-i Of
X f r J a q t u n ^ H w i u w i s Of •o *N *0 *0 >3- -*■ WO <Wi c fn WO WO Of Of Of WO Of ly, Of
L\> jo q u u i jq ju o iu o iu js Of *o n- > > V *0 -* >3- *o w-k 'n > V •*0 o Of Of Of Of WO Of •n Of
9t? io q u in ^ r l u o iu o p n s Of >J- r-"i > ■Th p’~i •o * i ■* > > *Wi > Of Of Of WO WO Of Of Of
gj7 i o q t u n ^ ju o u io p ijs Of •y-i V > > * 3 ir, > WO W-. , * WO ^o ■*f Of Of Of ly, wo Of •W» Of Of
p p j a q u t n 1NT lu o u io p u s Of >7- >r > >h 'T *> > 'r3‘ *o * l > WO wo 'O- wo Of Of Of Of Of wo wo Of Of Of
g ^ ia q iu n ^ q ju o iu a tm s > *0 > > * i *0 •n 'n WO WO iy4 > Of wo WO Of Of Of Of Of rn Of
Z p io q u m fst lu a tu o in j s > '*»■ •o fN o 'o '*3- ■n > *0 *o > *0 WO WO WO Of Of **\ Of
It* j o q t u n ^ u io iu d jc jS "V rj- > ' r Cr*, *0 <N >j- >3* > 3“ >3- 'n »o *r, '<3- > " r Of Of *o Of Of Of Of Of Of *W> Of
0 f> J o q u m N ju o iu o p ^ S V i/-, > •o > > «o n > > 'n ■*3* > V ‘o 'n ‘o 'O *n *+i >3* V WO > Of Of Of Of Of Of Of Of Of Of Of
6 g jo q u in j^ ju o u io ju jg Of •o > > > «% 3- •o > ■*3- 3- 3- °~i ly, 'n WO wo WO 'nf Of vf Of wo wo *0 Of Of Of «W%Of
g g w q u in M lu o iu o jm s Of *0 •*3- *N >r *0 > >3“ >f WO wo Of Of Of Of Of wo Of Of W% Of
i £ j o q i u n ^ u io u io jD S Of 'T »o > ''T > *o *N >3* ‘O lr, > W, <w-> Of " f Of Of Of Of Of Of Of Of Of
9 £ ja q iu n \T ju o iu o jin s ~f *+i > n '‘n n <N ■*> ^'i > ■* >h >3“ > *n '*3- *N > y* '“O wo Of Of Of Of Of Of Of Of Of
g g i o q i u n ^ ju ^ iu o jc jg Of > <N ' t ■*3" •o ty, *0 > > ^3 WO ■*7* n <00 •o WO Of Of Of Of Of Of •o Of
t>g ia q u iu js i lu o u io in j^ Of *o > -* n- *o iyj *0 3- ^3 '*3- >7- o^ Of Of Of Of Of Of Of Of Of Of
g g jo q m n j\r ju o iu o iu js Of *o >i- > > 'n , - *N > > •o •n 'n >3- (V) *0 Of Of Of Of Of Of Of Of r'ri <07 Of
Z £ ja q tu n jq j u o u n u n s Of ■o •o •o •O n * v ^h n > fN ■*7- > - •o •o > > * 0 <N *w> wo Of Of Of Of Of Of Of Of Of
j g .loquin jsj ju o iu o ic jg Of V 3- >0 >3- >»• ’*3- **% *n WO WO ly, n •^0 Of Of Of Of Of Of Of ly, Of
Og J o q t u n ^ ju o iu a jc t s Of tr( 'T >r <N *1 *o > >r ly, >r lr, *0 *0 Of WO ly, •o-J > Of ly, Wo Of Of Of Of Of Of
6 c jo q u m js j \ u z m o m s Of l'_. Th > •*7- > 'j- •n > *0 > •O * 1 'n > WO wo WO > ‘‘O Of Of Of Of wo WO Of Of Of Of
X3 j o q i u n ^ m o iU D jo s Of **% ‘O * 1 > ^r <*n **% ■> > > •> »o > •O ‘O ly, 'n WO wo wo wo •O-J Of Of WO Wo WO Of Of Of Of Of
Z Z J o q u m jq ju o iu o im s V V >1* 'O *o V *0 >3- *0 3* iTj *0 *0 ‘o WO Wo wo wo Of Of Of Wo Wo Of Of Of Of Of Of
9 3 j o q i u n ^ ju o u io jc js of > > > v7- >7- > > *o 'T > v-, "O >3- > WO W“, WO Of WO Of Of Of ly. Of Of Of Of
g i ja q u in js j ju o u io p n s of ^r J- > n n <N > *n •o 3- WO WO > Of wo WO •«o wo Of Of Of Of Of Of
P Z J o q iu n N lu a tu a jn i s Of *o v\ •o M- *•> >3- > ■j- ^3 »n V wo >3* 'T Of Of Of Of Of Of Of <0-1 Of Of
g 3 jo q u m * ^ n io u io n n s ■f o •o > > > •n > ‘O > wo wo >3* WO ' f Of ' n WO wo wo Of Of Of Of
3 3 j o q t u n ^ ju ^ tu o in js Of > •o •n >3- 'O ty, *o ''‘I •*o 'O* > WO Of Of Of Of Of Of Of Of Of Of
13 ioqum fvj ju o iu a jn js Of ‘O > •o u-i > 'T- *+i > *o ‘O *•*3 WO M- f'O Of <N wo WO Of wo *W» 'n Of
0 3 J o q u m N ju ^ iu o in is Of > "» >7- fV *N >3' >3- <3 <N *o <N >3- > *oo <N *0 Of Of '■’0 Of Of Of Of Of
61 j o q i u n ^ ju o u io p u s Of 'T- - - >7- *o <N 'n wo > '■’O ' * ^o ^f <00 Of Of ’' f Of Of Of Of Of
XI i? q u m js j ju a u to jn js •o*j •<% > n > "i- r- <N •n > ' * ir, r-j * > *o V '0" '*3- > WO wo Of Of Of Of •*0 " I Of <0“>*0“>
31 J ? q u m > i ju o u m jc jg Of *o ■** •** <N > «N > "*3* > (V( *0 >3- •o *o >3- wo Wo ly, WO Of Of Of Of Of Of Of <“n Of Of *n
91 j o q i u n ^ ju o iu o ic ts Of > **1- > v> > *0 **> •*3- > > 'O •n 'n <s"l WO > ^o Of Of Of Of Of *0 Of Of Of Of Of
g i a o q iu n ^ i j u o u io jc i s W-( > n •o <N > •N > -* ' 3- > > WO 3- WO WO Of WO WO WO wo Of Of Of W-> «W%Of
t»I jo q iu n ^ j lu o iu o p n s 'n > •n > •o 3- > ** >3- *n '7- *o > WO V Of Of Of Of Of Of Of Of Of Of Of
g j jo q tm q q ju o u io p u s *w» > > *r\ > > frj > 3- V, *r 3- •o ■*3* > > wo > •W) «N Of Of Of Of Of Of Of Of
31 jo q u in fs j ju o iu o u n s fr, T- >3- *o >3- *o *0 *o 7- >r WO WO «0 Of iy, WO WO Of wo Of Of Of Of
11 j a q iu n jq j u a u ia jm s Of *o > *o > n- > V **> 'O ^3 V > '7* ^f > '■O Of Of Of Of WO WO Of Of Of Of
0 1 a o q tu n ^ ju o iu o jn is Of *o > > ir, >3* vj- y* ir, *"3 WO V WO WO WO WO Of Of wo WO Of Of W~i Of
6 J o q u n iN lu ^ tu o iu i s Of o > v7‘ •O > *o | m* <r, *o *o ly, 'n Wo >3- +n '“O Of Of Of Of Of Of Of Of Of Of Of
g jn q u m tq lu o u ic n m s Of o 'o > ' r > ,n* >3- *o > •rj ty, •o 'O , - wo Wf y* w* WO Of Of wo WO Of Of Of Of Of Of
3 jo q u m js i lu o iu a n n g Of O > t<*i > > > > > ■*3- *1 > * i V 3“ > ly, ly, 'T ‘o WO 'o- > Wf wo > Of Of Of wo Of Of Of Of Of
9 j a q tu n t\ [ ju o u w u n s Of •o > > *o 'T* •o >3“ lyl > > Wo > Of wo Of Of Of wo WO Of Of *o-J Of
g ja q u in fq lu a iu o jn j s Of ^r > 'T > 'n *0 <"n > WO > Of Of wo Of Of Of wo Of Of Of Of
p j n q t u n ^ lu a u u i ju j s Of *o > *o J- *o >»• *-* *■> *0 3“ 'T WO > WO V Of Of Of Of Of WO WO Of Of Of Of
g JDqunifs[ l t io iu o jc js Of *o lr% *o n- >3- >7- > > > 3y. •O > WO w-, Wo Of Of Of Wo WO WO W-J Of Of W~l
3 JD q tu n jq ju a iu D im s Of tr, »o > > > •n- v% O ■3 t-. 3“ WO > WO WO Of Of Of Of Of WO wo W~i Of W-J W
1 jo q u in js j H io tu o in s Of *0 •o >3- > *-> > > •o *'-i ir, •o lr, •O 'o ly, >3- •o Wo > ly, Wo Of Wo WO ‘*0 WO wo WO W-J *o W-, W~>
Res
pond
ent
Nu
mb
er
- (N r , 'T v© r- 00 o 2 =fS ro *n N© oc Ov O
<N nfS(N
1 tz
1 1 24
|
wo<N
<o<N
1 27
|
OC<N
Cn<N
1 30
|
CO
1 32
|1
33 |
r r
1 St-
1 1 36
|
r-C*~i
ocm
1 6£
1
o•*r
Appendix page - 20

Table
2
Raw
Data
of Sm
all-M
ediu
m
Con
trac
tors
’ Opi
nion
to
Seism
ic Ri
sk
Man
agem
ent
Stat
emen
ts(C
ontin
ued)
V s " f ' f 'ts S* VS ^ r S9VP 81> S f > S f > VS 88T-fr PZ
St- S t v s VS 06t-> S'i> '** 's - S f VS i e
>3- > St- V s S f S f V S v s S S if 5*6VS VS > <N " S S t VS v s r*S 868’£ 8frlA, v s > +*s > 'S- S f VS > 9i8*e S*£SVS V s St- > V S VS V s VS 6 t r p 51* '* ' t - St- S f v s r*S ttZ ’t ZZ
> > > St- (Vj *+1 VS > SL8'£ 6P>3- St- > VS > L9VP 9Z
'*1' T * s ' e> v s OOO't’ \P> > ^h > S f <N V s (N-i 190*1’ 8£
r*s S f ?s VS S9Tt 81VS > > 'S ' S f v s s n ’t- Oc>*• **■» *s V s o s re 951- '<1* ■*> *s * s * s VS 8i6*e 9^> >3- **s > S f S f VS "S rso’t 9£
>3- > > S f S f **s VS n z ' t ZZ"S* VS r st- ''T v s v s v s Lt i'P 9*11> M- s t S f VS ' f 000*f \P*** 's - > S t > **s ' f 9I8’£ S'£S> ' f > 'S - rn * S VS VS £9T‘t’ 8c
> S f v s L£8*e cS* s 'n - ^ s * S VS **■> IS8*£ s*os
> > > > **\ v s > 816*£ 9 P
>5‘ > > S f • n v s Z80*t’ 9 £
’T ** *r S f rs ' f 6£6*£ S£PVS VS > M- S f VS v s v s 90£*t’ S'p}l*S V s > S f S f V s VS S9Z't 81VS 'S ' v s v s S f S f v s v s LZi't £ 1
v s > v s > '*> S f ir-t V s VS 8 8 £ ’ f^ 9 * 6
VS V VS n - s t S f S f 'S ' ' f PZZ’P ZZ> Si- > ir-. S f S f v s i w r 6 £
> > S f M* v s S f w*( VS V 't 96£*f L
''T- 'T n - S f V s n - v s 'S ' z s o * ^ 9 1
> S f St- V s tfS V s z o r t ’ Pi> > st- <VS St > v s V Z6S*£ L 9
>r ■*r VT ' s VS > r Z,S8'£ 9 ’0 S
> > > ' s VS v s 6£6*£ S'£PS t V S **s * t 000*1’ \ P
VS > * s <N ' ' f SSi*£ s s
v s • o VS ^ 3* >1- v s > 98Z*t 91v s v s VS M- v s > v s A K ' t ’ S’Ul r , v s VS >»■ v s > ^ 3- VS £ 9 I * t ’ 8£v - t V~t VS M- v s > V s o o r t - r e
VS VS ' f ' r v s £ f l * t ’ l £
V ) v s VS v s v s > VS ISS’f c
V S > f St- r*S S f > v s v s 8 I 6 * £ 9 ^
v s >J- * f 'S - 'S- V S v s £9l‘P 8cv s > > S f S* > v s £PVP I £
v s > v s t-rt S t V s V s PSVP SZv s > v s * S ' S V s V s ZZVP ££v s >J- v s s t St > V s VS 90£*t’ S’P\O V S 'f fr». 's V S v s 96£*t’ L
v s v s > s r VS VS 96£*t7 L
v s v s VS st- v s v s v s v s P\L’P I
TT
ZP mrt rst ir>st
1 9fr
1LP
1 48
I 1
6P
Ave
rage
to
each
st
atem
ent*
Ran
ks
p — -3 • —• o • -•o a ir. £ S cv> o
S 8 P
§ *g °2 °o g-t HfS 5 8 8■— r i m _
Appendix page - 21

Tabl
e 3
Raw
Dat
a of
Fore
men
's O
pini
on
to Se
ism
ic
Risk
M
anag
emen
t St
atem
ents
1 $ jnqiun.M tuautajcis 9f > > > ■> •n n *0 > *o|^. > k*, > ■*> > k 99 99 > k-, k-> 99 m r t cl
<9£ jaqiunN jiratuoiuts "I* > 1 'n- <N > *n ■*r > *o ,*r *n j*% •o > > > >9 *-. 99 99 99 99 99 k-> 99 99 U 6T s i t -
5C Jdqumjq tucuuojcis k“i > > I > >» ■*r > •o ■*9 o >9 >9 >9 *9 99 99 -* k-> k-> >9 99 c o r t1 91
Pf jaqumjq ittduidiet$ > | > > > V >'•■h > 9 >9 *9 99 k*i > 99 9» 99 > 99 <N 6Z0*fr S’9£
jpqum^j tuMUMOS 99 > j > > > "> >T- > •o > *n > > k% -• 99 99 k-j 99 k“> 99 *0 O a i t o r
joquinjq juauiatms 99 r, > > 'n > >9* > >9 > >9 ~9 > >9 k~i -• 99 O k-i -• 606'C 8t-
1 $ jaqumjq juauiMms *9 ‘o > > •*> r.( •n > > > •^j^. >9 > n •9 > 99 99 "9 99 O 99 99 OCO’f t-c
OS JDqumjq luaiucqos •o > > •oj^. •o •o ■o *0 '■*’1 rr > *o •o •o 9 > •O k-v 99 99 99 k“> 99 •O c k% 99 S P S ' t £
6^ jaqtunjq juaiuaicis V V *> > ‘O ‘O 9- , - V > k-> 99 *9 >9 k% 99 ‘O k% 99 99 OflS’t f
gpjaqoiniq juaiucqnis *o > > > ** > > > *-v| > > ■*9 'n 9 •*9 99 99 > *N 99 r» ess*t’ OS
l_p joqtunjq juomonns •o > V“> > **% *n| 9 •o > •o >9 > >9 k"» 99 "T k*> 99 -• 99 t t V P SI
9p jnqtunjsj tuauiams 99 > V >r O **% *N - > 'r l >9 - >9 >9 >9 >9 >9 99 *+l 99 9> 99 99 O s s r c L S
$ p jaquinjq luauioins k-, > > )> a ' t <N > > j > - > > > +*% 9 •k%k-. >9 >9 99 99 99 > r< a r e bS
p p jaqumK juauiamig *9 r, > ■*T I > *n «N "T > *"1 *“> ’*9- > > > > 99 99 99 k-i 99 99 6zo*r S'9£
Z p joqutn^ lu^uioieis k-i > ^|>j- > >»• 'r > >9 «0 >* >9 > »9 >9 k*i *k. >9 99 k-> k-> •> k-> 99 sez*t- £ Z
Z p joqumjyj fupuiajrns *-i > V •> 'n! > > <N »• > T V >|»n *n 'r, >9 >9 <N > r i •n > •n >9 99 99 •n **“> O 909*f 9 5
| p jpquinN iuaui?itns >9 '*r| >r •o >r >»• V v l ^ *n •O V •o > >9 > >9 99 k*l 99 99 > 99 99 99 -1 L t V t 6 Z
Op jaqtunjq jtiDiuojuis 99 V 1 >i- >» > > 9 o V > >9 99 >9 99 •> 99 99 0i6’C t-b
OC Jaqtunjq woiuoiets k"> ,»7- •> >> -> -• ^ j > > > 9 >9 *9 99 99 9> > k", « i IT6*£ S'9b
8C jaqtunjq i«3itwj«)s 99 > > ,r | ,T' > *o •*> •O *> *T •^1*0 •o > •o > "> k% > "n "r k% •O 99 99 99 <1 t*6Z't S’i l
L Z jaqmnjsj ittauioims 9* -> •> > |> > > >9- > > •O > >9 o > 99 > >9 99 99 »N 99 'N 000* S'6£
9£ joqum^ luaiuoicis -* •> > > > »n > > > > 9 > > «n > 99 99 > 99 99 99 > Z16*C /.b
SC Jnqumjsi luautaims > > > > > >o > >1^. •O *o 9 *o "9 99 99 •o 99 k-> •O 99 6SS*t Z
P Z jaqutnjq tuouiaims *9 > -> > •O > •o o ri o > r-» > > *9 > 99 > 99 > 'n C 99 *N 908T £S
ZZ jeqtunjq tuatuanns **> **r "n •o >!• »N •O > 9 99 99 9r 99 99 99 O *k> 0 L 6 ' i t-t-
Z Z Jaqtunjq luaiuaic)^ > 'n >»• 'n v > 4 4 V% >9 *0 >9 > >9 > ■*9 *9* k~) k*) > 99 99 w r t 9£
IZ jaqiunjq juaurcitns > > *> "> >> •o rh •o ^ •'1 ‘O > k*, '■> k-> >9 99 > > 99 9> > k*i 99 L t V t 6c
Of joqiunjsi juaiuapns 9 ,T *o -r V% •o ■*r ^ *o *-l > *N k*> > 99 "T k-i *0 k-i 99 k-, Zl f p S'6
63 joqtunjq maiuaiejs 9* *T > > V% > > >i-J > •*9 r« >9 > 9 99 99 -• 99 k% 99 ri K8*c cS
83 joqtunyj juoiuoms 99 >1* > > > *o TT > »o > > > *o| % *T »o »N >9 > •*9 99 V 99 k-i 99 **k 6Z0*t S’9£
i^jnqtun^iuoutamis k“i > > > •o *y •o > •O > >9" *o *N >9 k% > > 99 99 99 k-l 99 i t r t - S‘9
93 jaqutnN luoutaiEjg 9j- >r > *o >* > "t- ■*> > •O 9 <N >9 >9 "*9 > 99 99 k% 99 99 99 «N » i r t 1£
93 jaqutnjq uiMuains 99 > •o > >r >r > > 4_
4 > > <*N > > 99 99 99 k-i •O 99 99 99 •*> o««*r S'6£
P Z jaqutnN jiouirqins •n > >>■ > > > > >r > V •o ’’r >1*0 •*n •O *o > 9 V k“J > •n 9f k~l 99 V k-> z i r t SY.
C3 jaqumjq juauianns k-i > > > >> > , - k% k% > > >9 k'j k-i k“l 99 > 8I9T 1
33 joqumjq juaiuapns >9 M- > w-i »n •o > 9 '■'I *9 >9 k-> 99 > 99 99 99 > 99 99 880*r ££
13 jaqiunjq juauttiuiS > •O > ■n- > > 'n > -> •o >9 <N k*> 99 > 99 k •O 99 k-i 99 k-> n v t t-l
03 Joqtuufsl Utaiuotcts >9 > ■> •> > *> *% •> *9* *** *9 *"» 99 99 *k> 9> c *9 99 Z69C SS
61 JaqtunfsIUPtuojuis 99 > 'r > > -r > > *0 V, "T > •O ■»9 >9 99 99 •n 99 99 99 99 99 *9% U 6T S’lt-
81 jnqumjq tuauiains 99 > ■r > > > > > V-> •O •O >9 9 99 99 'T 99 99 >9 99 Z88’C 6t-
l \ jaqutnjq luauiains *9 *n ■*> > *o > > > •o •o v% w-> n *9 > k% 99 99 99 *o k-i 99 i r r r S'9
9( jcvqum^ pjouiotns > > > >r ■'j- > > 'n «N ■O > *N 'r > 9 •n «N «9*» 99 *9 99 99 *■> n n IS
91 jaqumjq juautainis k*i > V ' y v-, •o > >r r, >»• >9 >9 •O -T >9 99 99 99 k-i k") 99 k-i 99 9 L V t 9£
PI joqumjq juouiaitns •o V > > > C > > > >r v% ‘O >9 9 ■*9 99 > ki 99 k-> >0 99 k*i k-i 99 w r r II
C| joqtunjq waiuows •n > > > > •n > >» *T V k-> > ■*9 rs k*> > •O 99 99 >9 99 k-, 99 99 t t r t 6 c
31 joqtunjq jttatuaiuis *o V •o *0 k"> V >9 V 99 k*> 99 k-» •o 99 k-< 99 a r t S
11 joqtunjq juaiuajtMS k% > •n >»• > > •n > "> •o '*9 >9 C >9 >9 •*9 99 99 T >9 99 99 99 99 <N 016T bb
01 jaqtun*q hiouioiujs > V *o > v% V > V-, >9 > >9 > >9 "n *9 C k% kn »o k~. 99 k-i k% n r * 8
6 aaqiunjsi jitnutajuis •o V > •n «N > > v* •n •o ■O ■> ■*9 k% >9 k“. 99 *-> 99 >9 99 99 •O 99 «N 6s*o*r ££
8 jaquniM juautaieis > *r > •O - > •o -9- >r •o •o 9 > >9 k“V99 •N 99 99 99 k-| •n 99 99 S 9 V P CC
I j?qutn,M juhikhris 'r > •o •n •"n n > > '•r > > 9" > >9 *n > >9 >9 >9 > k-i 99 99 •n k-, k-. k% k-i 99 k-i wz*r ST. 1
9 jsqumjsl ;u?tuMtns k% *r > > > >T > > ,*T rn > •*-> *9 >9 o >9 ♦n k, 99 99 99 99 k-. 9r k-> 99 99 zsrt- b£
9 joqiun^ jupuicheis 'n >> > ’*»• > > > 'T V , - >9 >9 k% 9N >9 99 99 99 >9 99 99 99 99 6Z0’t S'9£
p jaqumjq iu?uiaims >»■ > > > >»■ > ■*> 9- *n >r. •o "9 > •*9 > > >9 99 k-> k-> <N k-> k-> *N 9 L V T 9 Z
Z J^qutnM juouicnnis *9 F»-i »o > «o ■> o > > 'r >9 >9 >9 >9 > k-> 99 99 k~i »o 99 99 99 > u v r O Z
3 jaqutn^ iuc»UJeiiTis *9 V V *o > V O J- •o >»• > •o *o > V >9 > > > k-i > > 9r k-t •O 99 k-t V «N a r t O Z
1 jaquinM luouttios *-> V V > > •n •O *n o •n •o *o •o •-> > > > k*i > > 99 99 >9 99 99 k-i «N c c r t £1
Resp
ondent
Num
ber
- rt r*i •O OC a= 2
ro rr wn se r»2
O
1 20
|
r»
1 ZZ
1
fN rt r ijq
1 27
|
ocCA
O'M
Cm
<N «kifki
Ave
rage
to
each
stat
emen
t*
Ran
ks
Appendix page - 22
Not
e:
k ’Di
e sta
tem
ent
num
bers
cor
resp
ond
to the
or
der
of the
qu
estio
nnai
re2.
Resp
onde
nts
were
aske
d to
rate
57se
ismic
risk
man
agem
ent
state
men
ts th
ey'co
nst J
er im
porta
nt to
be
catri
edou
t in
Indo
nesia
n cit
ies l
ocate
d in
high
seism
ic ha
zard
5-v
.iirp
ort*
it;4*
tnip
ortan
t;3«i
ior;2
-moi
imp
ortan
t; I "a
bsolu
tely
not
impn
rtanr
iO-d
ml
know
)3.
1.19%
of
resp
onse
s sta
ted
*0’ (d
on’t
know
)*)
The
mean
sc
ore
of all
sta
tem
ents
is 4.1
37
(bet
ween
im
porta
nt a
nd
very
impo
rtant
)

Table
4 Ra
w Da
ta of
Gove
rnm
ent
Offic
ials'
Opini
on
to Se
ismic
Risk
Man
agem
ent
Stat
emen
ts
ja q iu n jq lu au io itn s 33 '*3- > *o '^3 ^3 33 <r, 33 33 33 33 <0 33 *o 33 33 33 33 ir , <3% 33 c c r r 91
9g jo q u in p j ju a iu a in js 33 3- •o ’ 3 'O 33 *n ir% <N 33 33 33 33 33 ‘0 33 33 ir, 33 > 33 33 *n 33 <3) o o r r S ' L t
gg jaq u m tq ju a iu o jc js rr) > '*3- *n 33 *0 >3 *n '0 33 33 3333 ir) 33 33 33 33 33 »o 33 33 OOPT f ’8
pg jaq u in jq )uauK »m s 33 > > 33 *0 33 33 33 33*o 33 *3) 3333 »0) 33 *o 33 33 33 3333 !T) 33 e e r r ?*0€
gg jd q u m tq jikhuoiris > 33 irj *n 33 33 33 W“) 33 ir) 3333 *o 33 lr) 33 33 33 33 33 >0 /.9P ’fr £*f
Z $ aaqutn iq iiw u w ib js 33 <N ' 3* *n 33 *0 33 33 33 33 <N 3333 *0*3-) 'n «3) 33 33 IT) *o L H ' i 9S
lg jaq u m jq juouk»]rjs 33 <N fy, 33 *0 3333 <N •O 33 33 3333 IT) 33 •3) <V) 33 <N IT) ,<r) <3) 006*€ 6P
Og jn q u m p j lu a u w ic js 3* > 33 3333 33 33 33 33 33 >3 ir , > 33 ‘r ) *n o o r t 61
6P jo q u m jq lu au io u n s irj > > ‘n *0 > 33 V ' 33 33 > 33 'n 33 *033 •*n ir) <3) 33 3333 33 33 33 33 33 L 9 V I 9Z
8P joq iunp i ltto u ta jin s * ) > >3- V *3 *0 *0 33 33 33 *o *+i >3 Pr* *3) IV) 33 * 1 *V) 33 33 33 33 i 9 8 ’£ Z $
Joqumfsj juaiucm ns 33 ‘'"l >3- >3 33 *0 33 33 33 33 3333 »r) 33 *3) *0) 33 33 33 3333 33 e c r p £ '0£
9P jo q u m jq ju au io n n s > *o 33 *o 33 33 33 33 *0 33 33 *3) 33 3333 33 33 ir , 33 iL90'P s i r
gp jaq u in jq juoura im s ir) > > > 33 <N 33 33 33 ir , 3333 33 33 33 •O <N 33 33 33 33 33 *N 33 33 0 0 6 '£ 6P
p p jaq u m p j luo iuo jtns 33 >3- >3 33 *o 33 33 33 *o *0 3333 >o 33 33»o *3) 33 3333 33 •3) 33 33 o o r t S7.S
gp jd q iu n jq lu o u ra ju is 33 3* > PO *n V 33 IV) 33 33 3333 *o 33 *3) U-) 33 33 33 33 33 33 *0 33 c e r t S‘0£
gp jctqiunjq; juo u io iu is *3) rn >3 33 »o 33 33 33 33 IT) 33 <V) *0) <N >3 33 33 33 £ 9 8 T z s
[p joqun ijq juaiuojR is > * n 33 *3-) 33 33 *n <3-1 33 *n *3) *r, <N 33 33 33 33 *o 33 i90*t- s i r
Op Jaqum pj juaiuojRJS 33 o > 33 *0 33 33 33 33 3333 <3) *0 >3 *0) 33 IV) 33 33 •r) e o r p r e
(,g jo q tu n jq ju au iau n g 33 > > > »n 33 •n 33 33 33 33 3333 33 33 33 33 33 c e r t s 'o e
#g Joqum pi ju o u ia jc js 33 V *o >3- > *o ^3 33 *o »n 33 33 33 33 3333 *3) 33 ir, 33 IV) 33 33 £ 9 r r - Z Z
gg jaq u m p i jucuuoirjs ' n > >3 ^3 >3 33 3333 33*3) >3 33 <3) 33 33 33*o 33 •3) ‘O 33 PCO‘t s e r
9g joq u tn tq ju a tu o iu is O rrj 33 33 3333 33 33 *o 3333 33 33 PO «V) 33 33 33 *0 99 6 ‘C s r
gg jaq iu n fq ju au io ic is 3* •o > 33 33*o <N 33 '0 33 33 *3) 33 «n 33 <V) 33 33 ‘T) eC6’£ s ’9 r
pg jaq u m jq juo u io itn s > > V rO 33 33 '•o <N 33 <V) *o 3333 IV) 33 33 3333 <3) •o 33 006'C 6 r
gg jnqum jq jum uaiB is 33 'n- > > > 33 33 *033 33 33 33•o 33 33 IT) 33 ir) <3) 0033 33 33 o o r t ’ S 'Ligg joq u m jq luou io im s 33 1- ^3- *N >3 33 33 »o 3333 3333•r, *0333333 33 •o 33*o *-1 'V) 33 33 ir) o o r t s x e
Ig joquu ih j n iou to tu ts iv) > V ^3 33 33 33<N 33 333333 33 3333 •3) 33 33 **"> 3333 33 !V) Z.98T z s
Og .rcqiunjq lu au io jtn s fv) fy»> > >3- >3- 33 33 33^•l 33 333333 33333333 33 *0) 33 33 <3) 33 33 33 e w e s s
Og jaq iu n jq luauK w us *0 >*• 3- *o \3 33 ' n ‘r , 33 33 33 3333<V) <3) 33 33 33 <3) 33 *o *3) 33 *3) o o r t SYC
gg jaq iu n iq luoum iRis 33 >3- > 'n > 33 *o 33 33 3333 33 333333 33 33 33 33 33 33 33 33 33 m * t - ZZI Z jo q tunp j lu o u w jtn s *o ‘O > *0 3333 33 •o 3333 *0) 33 *V) ir) >o * ) lr) L 9 r t Z19g ioqum jsj ju o u ia jc is >3- *o 33 *o *0 33 3333 33 ir) 333333 33 *o) *n 'O 33 3333 *033 ir) 33 L 9 r r s rgg joqutnfq juaiuoiR ts > > > > 33 33*0 3333 33 tyj 3333 <3) 33*n 33 3333 ir) 33 *0 33 L 9 V r Zlpg jaq iu n jq lu a u w u n s 33 >3 33 *0 3333 33 33 3333 33 3333 33 33 33 33 o o r r 9 ' L igg ja q u m jq ju o u io p n s •r, >3* *0 ^3 33 tr , *n 3333 3333 *o 333333 33 *0 33 3333 33 *0 33 33 e c r t - 91
Z Z J^q tunjq juou to iu js > > > > *0 33 *0 3333 3333 33 *0 333333 *3) 33 <N >333 33 33 <N c c r t s*oeI Z joqu tn tq juauiojR is 33 3- *o >3* >3 *n 33 *0 3333 <3* 33 *o 333333 *3) *0) >3 •n 33 33 33 33 <3) t c r p so eOg w q u m N lu a u w ie js 33 > *>%33 33 ir, 33 *3* 33 33 *3) O lr , O < ) 33 « ) 33 33 *0 o s r c iS
61 jaq u m jq iu s u m ib is 33 °n ^3 ■*3 33 *N 33 *31 33 33 33 *0) *N ir) 33 33 33 33 33 33 eC 6T s*9rg j w qu inM luatuajR ts > >3- 33 *o 3333 33 33*0 <Tl 33*3- 33 *0) •O O orj 33 33 °n 33 33 fCOT s*erZ\ .taqum tq juouioiris *o >3 •O *o 33 33 33IT) ir) 3333 33 33 *033 33 or) 33 33 3333 <“*) OOZ'P sz91 jaquinjq juoujoiris ■> >3- M- > 33 33 33 33*3") 33*3} <N *o 33 0 *3) 33 33 *0 33 fV) 33 3333 • 3 Z 9 X i r sg i joq iun jq ju o u ia iu is >3* 33 33 33 333333 33 <V) *3) 33 33 'o 33 33 33 lr) *0 33 Z.9Z'P ZZp i joqu in tq iikuuoibjs '*3- O 33 33 *n 333333 33 IT) 33*3) 33 IT) *3) ir) 33 ir) 33 *3) ‘r) IT) S f r r r w
g i joqum jq juauioiB is >3- O 33 <0 *o 3333 33 lr, <N *o 33 *o *o *3) ir) O 33 3333 °n 33 o sz* t rzZ \ jaq u m jq juatunjR is 33 *0 3333 33 ir) 33 33 lr) 33 ir) 33 33 i r , OOS't e
1 1 Joqutn jq ju o tu o je js *o ■> O 33 33 *o *o 33 3333 *n O 33>3 33*o *3) *0 33 33 3333 *3) »o 33 i > r t LZ01 Jaqtunjsi itioutopns ■> fyj *o 33 *o *o •o 33 33 •0 33 3333 33 33 *o 33 33 IT) 33 / .9 r t - Zl6 Jdquinjq luatuaiciS 33 > > >3 33 *n '•o 33 33 »o 33 3333 33 'O O 33 3333 *0 33 6 i € ’P 01
8 joquin.sj tu d iu aiu is >3- *o > >3 V * r \ *-3 33 V 33 *0 >3 3333 *3) 33 33 33 3333 33 <o 33 o o r r 61
Z jaqtun^ lu au ta itn s >3 *0 33 <o 33 33 '0 O 33 IV) 33 33 *0 33 IT) 33 *0 33 *o s r r r S'99 joq iun iq juou io ttn s *n > 3* *n 33 33 33 rv) *o *"» 33 33 33 33 33 33 33 *0 33 *-■) 33 ee e* r 91g a o q u tn ^ u ia tu a ic is *n > 3- > ^3 33 *0 33 •o 33 33 33 33 *o 33 33 33 33 •n 33 33 33 33 33 33 33 o o r r 61p joq tu n p j luoiuaiR js 3* > V 33 > *0 33 331*0 33 33 33 33 *o 33 *0) 33 33 3333 IV) IT) o o r r S'8g jaq iu n p i itioutniRjc; ‘O 33333333 33 IT) 33 33 O 33 33 33 33 O *0) 33 9cs*r ZZ jaqnm jsj luou io ic is > >3- 3333 *0 3333 |33 »n 33 33 33 *3) 33 33 33 33 O *0 s r r r S'9I jo q u m N ju a iu a ie is M- *o ‘T) 33 i r , 33 V ) *3) 33 33 33 *n 33 ir , <o *o) <o *T) i r , ooi*r I
Res
pond
ent
Num
ber
- <N nC 3* oc C3 O=
fN r j n* *Ti s o r> OC C\ cON r-i ON ri ON
sr.ON ON
h-ON
oc01 OSON
OrnB \ W) S 8 1
Ran
ks
Appendix page - 23
No
te:
1 • Th
e st
atem
ent
num
bers
co
rres
pond
to
the
orde
r of
the
ques
tionn
aire
2. R
espo
nden
ts
were
aske
d to
rate
57se
ism
ic
risk
man
agem
ent
stat
emen
ts the
y co
nsid
er i
mpo
rtant
ro
be ca
rried
ou
t in
Indo
nesia
n cit
ies
loca
ted
in hig
h se
ismic
ha
7iird
5-v.
impo
rtant
;4-im
poru
nt;3
-nor
;2-n
ot i
mpo
rt^;
i -ab
solu
tely
not
impo
rtant
.*)-d
on't
know
)3.
0.99%
of
resp
onse
s sta
ted
*{Y (d
on't
know
)*)
The
mean
sc
ore
of all
sta
tem
ents
is 4.1
70
(bet
wee
n im
porta
nt a
nd
very
impo
rtant
)

Table
5 Ra
w Da
ta of
Buss
ines
men
’s Op
inion
to
Seism
ic Ris
k M
anag
emen
t St
atem
ents
I S joq iunj\[ lu o u ia n n s 'r , *n •O > > <01 *0 | ir. 99 99 99 99 9999 99vr, 99 99vr, 99 vr. vr, vr, 99 vr,|ir, 99 c , e i€ * 9 S I lqg ioqunifsi ju a iu a ic j^ > > ^9 ir> 1 ir, j lr, 99 99 99 99 999999 99Vr, 99 99 99 99 99 rr, Vr. 99 vr,) 99 99 99 s z r t - i ' i zgg ia q u m N jucnuanns t , u-1 M- ^9 Vr j Vr, S l r , 99 99 99 99vr, 99 >9vr, 99 99 99 vr, 99 'r , ■> vr. 99 vr, 99 99 vr, 9 0 ^ 9 6
P5 aaqiunfq ju a iu a in js > > iO 1- 99 j 99 j Vr 99 99 99 99 > 99 99 99 99 99 99 99 99 99 99 rr, 99 99 vr, 99vr, 99 C 9 0 9 S 'l t :
jnqiunjsl n ia iu a iin s 'n- > >9 99 | j IT) Vr, 99 99 99vr, 99 99 99 99 99 vr. 99 99 99 Vr, >9 vr, vr, vr, 99 C I C 9 S ’l lt5 Ja q iu n > i n ia tu a n n s M- > *0 > >9 *rj | ir, j *r> 99 99 >9 *N vr, vr, vr, 99 •r. vr, *9% 99 Vr, vr, vr, 99 99 19, <N 0 0 0 9 S ’9 £15 iaqum jsj jUDtuaieig >*- > > lr, > > **% | *o j 99 99 99 99 99 "O ir, <N 99 vr, vr, 99 99 cm c , 99 I H L ' i I S
05 -inqtunpj; juou io ttn s ' r vr, •o ‘O 9- > •-1 99 99 vr, vv-i vr. vr, vr, vr, Vr, vr, vr, vr, Vr, Vr, > vr. 99 vr. 99 99 i e s 9 X
6P M qum jq jua tuo im s c , vr, *n ‘O tri|ir^ |irv 99 "*9 99 vr, ^r, vr, >9 99 vr, 99 99 99 Vr, 99 vr, rr, 99 99 vr, 99 v*r. S I 1 9 S ’S I8P joqm njsi lu a u ia jc is o-. *0 j Vrj j ir, 'n 99 99 vr, vr, 99 99 99 99 99 99 99 * 1 rr, rr, > 99 vr, 99 99 9 9 8 * e 6 Xi t Joqiunjst tu a iu a ju ts v > j 9}- j ir, lr, 99 99 vr, vr, 99 99 99 99 99 99 99 *9 99 99 99 99 vr. 99 99 c*, I £ 0 9 S 9 £9P aaqutnM ju a iu a in js *0 99(91- jrv, 99 *9 99 99 99 99 99 vr, 99 99 99 'r , 99 rr, rr, 99 99 vr, 99 99 o s r c S ’SS5P jaquin]s[ n ia u ta n n s *>% > > 991 *n j > <N 99 99 *r. vr, T, 99 vr, 99 99 fr, rr. rr, >9 99 vr, *9% 99 C| 6 i r e L Spp jaq tu n jq lu a w a ju is T * ' n > 99 9999 99 99 99 99 vr, 99 99 T, *>■> 99 vr. rr. vr, 99 vr, Vr, 99 99 £ 9 0 9 S I ££P Joqiunjq tuo tuaic j$ > 'O > > >|<brij|r l > 99 > vr, vr. Vr, <9-, V9-, 99 Vr, > 99 99 99 99 99 Cl 9 0 6 * £Z t a a q iu n ^ ju a tu a in js 'O ^9 > ^ ( * 9 |*^ 99 *9 99 vr, vr, 99 99 99 99 99 lr. 99 IN-, *9% 99 99 99 fr. »N 99 8 £ 6 T z xIt? ioqutnfq ju a iu a n n s 'q- 'n- > i r j j ^ j l r i 99 99 99 vr, *n * 1 99 99vr. 99 99 99 rr. vr. *9 99 99 99 99 8 £ 6 T z xOp Jaqtunjq n to u ta ju is c-, > > 99 j 99 | *Tj 99 99 99 99 99 99 99 99 99 99 *9% 99 rr, 99 99 vr, >9 vr, 99 6 16C Jaqiutijsi u o tu a jc i s cr, > > > ^ |9 9 |* 0 99 99 99 99 'f9 * n **•> vr, <9% *9> *9, *9, 99 rr, rr, vr, 99 vr, 99c-, 99 9 9 8 * £ 6 18£ jnqturifq u iauxaie js (o > lr, >9 ^9 | 99 j •r. lr; 99 9999 vr, >9 <9-, 'r , *9-, 99 99 99 rr, 99 vr. 99 vr, rn > 0 0 0 9 S '9CI S jaquin jsj lu a iu a iu is *r, ■n- > 'O 99(^1*^. 99 99 99 99 rn 99 vr, 99 99 rr, 99 vr, 99 99 99*9-, 99 S Z .8 T 9 1
95 jaq m n p j ju ^u ia ttn s 'O lr. •O | | 99 99 > 99 99 9999*0 99 99 99 99 vr, rr, 99 99 vr, *9% 99 > 6 9 6 '£ S '8 £55 jaq tu n iq u iau u m n s *n ir» |iri | ,r l >9 99 99 99 ^9 99 fr. <T, Vr, *9, 99 vr. 99 vr, 99 vr> 99 99 99 S I I 9 S ' S Zp£ jaq u m tq ju a iu a im s *>■> > > ■*1- ‘O ’O | 99 (iri 99 99 99 999999 99 99 *9*1 99 99 vr, 99 99 99 99 «N 99 99 6 9 6 " £ S ‘8 £S £ jaq u in jq ju a iu a ie ig c* > > ■*9- *0 *n | 99 (•*% 99 99 99 vr, 99 rn 99 "<% 'n rr, 99 99 99 > 99 99 99 99 S i 8 ’£ 91^ fja q m n is f u ta u ta n u s C, > > •n tr, *01991 »o 99 99 99 lr, •r, *9, > vr, V9% 99 99 vr, 99 *"9 99 99 <N-, vc. 99 8£6*£ t lI £ jn q u m p j in a u to iu is "n > > *> > tr j j io ] lr. 99 99 99 99 ■r, >999 99 99 99 •9-, 99 99 Vr, 99 99 99 vr. 99 99 t’6 0 9 S’8 t0£ Joqm nfq juo iu ain ts C, - - ^9 ^9 99|99|*^( > 99 *9 *91 99 vr, vr, 99 vr, vr. *9, 99 vr, vr, vr, 99 99 vr. <N 99 c . SZ.8‘£ 916 Z aoqiunjq juaiuojEJS 'T > V *n ’*9 >9 *0 j ^ j 99 99 99 99 99 vr, vr, vr, vr, vr, vr, vr, 99 99 99 99 99 vr, vr, 99 99 S i £ 9 S O I
jaq u in iq lu o iu an n s V >r 'n ■*9 > iO | irt j u--, *0 99 > 99 •r, •n vr, vr, vr, 99 vr, 99 rr, 99 99 99 vr. vr, 'V-l 99 1 8 1 9 S ' l lI Z Jaq iun jq u ia iu a jtn s O', 'O > >9 irv | ir, | irv >9 >9 99 f' n 99 vr, •r, vr, vr, > 99 *9, Vr, vr, vr. 99 vr, 99 99 99 8 C ^ 9 Li ) Z Jaqutnfq ju a tu a ic ts 'O > >9 ir> j 10 | U“i vr> 99 99 >9 99 >9 99 99 99 99] 99 > 99 *9, vr. vr, > 99 vr, vr, vr, 99 S i £ 9 S O IS Z inqum pj tu a u ia ic is >r >1* lr-, >9 >9 irj j iri j lr, vr, 99 >9 Vr, 99 *r> v^ 99 tN-jjf*-! >9 99 99 l^, 99 99 vr, Vr, vr, 99 6 1 1 9 S'91t z aoqm npj iuau iouu$ >r > •O "9 99 j 99 j lr* Vr, *r> vr, vr, *0 vr, vr, Vr, vr, vr, vr. vr, vr. 99 rr. 99 vr. 99 vr. 99 99 99 8 £ l-9 LC ^jaqm nM ju au io u n s >r 99 *01 *0 j v i *r, vr. VO 99 99 vr, 99|99 vr, vr, 99 99 99 vr, 99 vr, vr, vr, 99 8 £ t 9 LZ Z Joq tuniq juam aje jsj > 'T 'O 'l- 99 99 j 99 | »r, 99 *0 vr, <N 99 99 vr. 9 9 |> 99 vn V9, <N 99 vr, 99 vr, *9, vr. 99 I £ 0 9 S 9 £\ z Jaquin{sj lu o tu o n n s * n *o >9 99(99(99 ir. vr. vr, 99 99 99 99|99 *9, 99 •9% r , rr. vr, 99 vr, Vr, vr, £ 9 0 9 s i e03 -iaquinN juouiairtjs o*, <N O 99 | 99 | lr, 99 99 99 *0 -V-, 'r , Vr, Vr, 99 Vr, (Vr, <9, V9) *9, rr, rr. 99 99 <N 99 XLU £ S £ S0[ Jaq tun jq luaurajuiS o% *N •o 99 99 99 99 Vr, vr, vr, vr, T, vr, vr, j *r. 99 99 rr. rr. 99 •9-, 9999 V9*, £ 9 0 9 S 'I £
jaqiun^q ju a iu a in ts > > > 99 f ^ | ^ j i r i 99 99 99 99 99 99 99 99|99 99 99 99 rr, rr, O vr, 99 99 XLL'i S'ES11 ja q iu n ^ ju a tu a ie ig *•9- 99 99 ( 99| *0 99 99 >9 99 99 vr, vr, vr, vr,j*r. 99 99 9 , vr, 99 99 <*r> vr, 9999 99 6 1 1 9 S'919 [ joq u in p j jucnuaiEis ‘n 'O ! 99 | *r. 99 99 99 vr, 99 *r, 99 99 99 991 99 IV, V9-, rr, rr, 99 *9% 99 vr, ■*9 <N O S iT sss5 ( aaqtunjq ju au ia itn s >9- >> *-1 *■> ir^jlr, 99 ■*9 99 vr, 9r Vr, vr. Vr. vr, vr>|'r. <9, 99 99 vr, > 99 99 C) Vr, 99 9 S I 9 Z Zp i jaq iu n p j uiom a)Ej$ o-, >9- > >9 99U"» >9 |*o >9 99 99 99 99 > >9 99 99 99! 99 99 99 99 rr, 99 vr, rr , |ir , 9999 99 t ’6 0 9 S '83£ \ iaqutnjsi R iotuainis •“o > > *o lr, > 99 ir, * rj|1 99 99 99 99 >9 99 99 99 vr. 99(99 99 **■) 99 •r, rr, vr. vr. vr, 99 >9 8 8 1 9 61Z I jaquinM ju a iu a tn is •V, > lr-, >9 99 'r , 9 9 |^ •r, 99 99 ir, 99 Vr, 99 99 99 99|99 99 99 *1 rr. rr. vr, ^r, vr. vr, 99 99 9 S 1 9 Z Z( ( jaq iu n jv p u am aju is o-, > * n •*9 99 *ri|tr^ 99 99 99 vr, 99 ■r, >9 99 99 99)99 Vr, 99 99 rr, vr, vr, > 99 ■<9 9 S 1 9 Z Z01 Joqiunjq u ia iu m cis >r '-n *9 99vn •'-•I*'--. Vr, > 99 Vr, >9 Vr, 99 99 vr, 99|99 Vr, 99 vr. rr. rr, vr, vr, vr. vr, 699*1- s6 jaq u in tq ju a iu a ie is ’*r > '!■ lr, ^9 99 *0 | 99 99 99 99 vr, vr, Vr, vr,| lr, >9 99 vr. vr, 99 99 vr, vr, S I 1 9 S 'Sc8 joq iun jq liiou ia ju is V *n o O *n 1 *N 99 «N vr, vr, 99 vr, j ir, 99 vr, <9, 99 99 'r , vr, *9, > > £ £ 8 '£ ISI jaqiun*si )iroutaiEt<; o-, > r i o O •o *(99 99 *N vr. 99vr, vr, vr, vr, (vr, 99 99 99 r ) 99 vr, v*r, vr, 99 Vr. > i 9 6 '£ 0 19 jaq u tn N lu a u ia ie js o-, >9- > >9 999999(9 99 99 99 vr. 99 vr, vr, vr, vr. Vr, | *r, 99 99 vr, 99 > vr, 99 vr, *n 99 8 8 1 9 615 joquinjsj tu au to u n s o*, > > *0 Vo 9999(99 99 99 >9 vr, vr, 'r> >9 99 99 99|99 99 99 V 99 99 vr. 99 vr. ^r, 99 8 8 1 9 61p jo q iu n jq juau to itn s > V > *o 9999 j Vr, ir. 99 99 vr, vr. vr, 99 99 99 99|99 99 99 99 vr, 99 vr. 99 vr, vr, 1 8 1 9 S ' l l£ jaqum jsj lu a u ia ic is •'I- > > o 0 •o lri|9 9 Vr, 'O vr. lr, 99 vr, vr, vr, vr, vr, (*r, 99 99 *9 Vr, vr, vr, 99 vr, 99 99 >* Z.9S9 S TZ jaq u tn jq lu au ia in is >9 >1- **9- o 0 - , |9 9 Vr, •n vr, vr, 99 vr, vr, vr, Vr, j ir. 99 99 99 Vr, vr. Vr, 99 vr, vr. 99 > Z.9S9 S Tt aaqiunbi ju o u ta te is > > lr, 'o Vr, vr, v-*i vr, vr, vr, vr. vr. vr, vr, | vr, 99 vr. 99 vr, lr. vr. 99 vr, Vr, Vr, £ 1 8 9 I
Res
pond
ent
Num
ber
- n rO ’T ‘O vo r^ oc Cv O=
<N m ^r ir, VO OC O Or i CN
<NCN
rr,r-i CM
ir,CM
VO C-l
C-CM
00C|
CbCM
Orr, CC <N
Ave
rage
to
each
st
atem
ent*
Ran
ks
Appendix page - 24
Not
e:
1. Th
e st
atem
ent
num
bers
co
rres
pond
to
the
orde
r of
the
ques
tionn
aire
2. R
espo
nden
ts
were
as
ked
to rat
e 57
scism
ie
risk
man
agem
ent
stat
emen
ts t
hey
cons
ider
im
porta
nt t
o be
carri
ed
out
in In
done
sian
citie
s lo
cated
in
high
seism
ic
haza
rd^v
.imiM
xian
tJ-im
porta
nt^t
^nor
^^no
t im
poita
nU^a
bsol
utcI
y no
t im
pona
nt.O
Mlo
n't k
now
) 3.
0.55
%
of re
spon
ses
stated
tY
(don
't kn
ow)
*)Th
c m
ean
scor
e of
all s
tate
men
ts
is 4.
109
(bet
wee
n im
porta
nt a
nd
very
impo
rtan
t)

Table
6
Raw
Data
of Ed
ucat
ors'
Opini
on
to Se
ismic
Risk
Man
agem
ent
Stat
emen
ts
35 joqiun* juomwts > *o *o *o Sf > -- *o *o > ■M- >a- a aj a a a a a a a a a Xl a95 joqiunfvj juouioicjg > > Sf > M- •o ■'» > ■> a a X-l a a a a a a Ol a Xl aJoqurn|si |uoiudju}$ *o rr) uj Sf ■l >»• > ,a- a a X~l a a a a a a Ol a XI a
t-5 joqiun juouiojpis IT) Sf Xh <0 '■» ■'J- a- a a a SO a «i a a a Ol a a a55 joqum juoiuojujs *o > »o Sf >1- ■'J- ■o >5- > "a- a >a a a a x-1 a a a a XI a a35 Joqtun?sj iusukupis ‘o Sf V *n •n ,- > > > a- a a a a a x-1 a a oi •N Ol Xl a15 joqumjq lucuuonns Sf > *o > ‘o *n Sf *o O > <N >9- > 'a- a 0-1 <N a a X-l a a oi <N o-l Xl a05 joqumjst lunuuupis IT) Sf *n ‘o *o > 'j* O •O >5- >a->a- a a a ■o a X-l a a a o-l Xl Xl Xl6t» Joqiun juouiojpjs o *o > •o Sf ‘'1 > > <0 >5- > a a a a a x-1 a a a <N a a Xl%P joqum(\T luoiuDims *o fT) > V Sf >o v M- ,- a o-v o-i a a a a a Ol oi Ol a aIt joqumsj lUdUKtms Sf ■* Sf >1- U-, > a a a a a x-1 a a a Ol a a ai)t jaquin juoiuojpjs Crj > V) Sf > 'r- 'n > ”-i X~1 a a a a a a a Ol Ol a a aSt joqum juouiojujs <N Sf > ^1 •o •n > ■a a a a a a a a Ol Ol a a aft Joqumjq juiuoipjs rr; > *n Sf > >»■ '9- 'n >»• ■"a- X-| a a a oi a Ol oi Ol Ol a a a£t joquinjq juouiojpjs Sf > 'n- *o Sf >}- 'O ■o > 'a- a a a a a a a a a a a a oiIt JoquinN luoiuojins Sf > •o Sf >o •o >»• > >o > > a a 0-1 a a a a a Ol Ol Xl a Ol\t Joqiun juoutoieis Sf > *0 »o Sf '5- •o O -'a- a 0-1 0-1 a a a a a Ol <N a a OlOt- ioquinjsj juoiuoiuts Sf > > Sf > > > > a 0-1 a Ol a a a a Ol fN a a a65 joqiun juouiomg Sf »o Sf ■st- "O <o "O > 'a- "a- a a 0-1 0-1 a a a a Ol o-i Xl a a85 joqiun juouioins sr- M- > > •o Sf > •o >!• x-1 -■a- a a a a a a a a Ol O a a a35 Joqumt\i ju iuomis •o > > > >*• > Sf V 'o ■n > >a- 'a- a a a a a a a a a Ol a a| a95 joqiunq juouioins ‘o o Sf ■*i- •o o "a- -a- a o-i o-i o-l a a a a a Ol Ol a| a55 joqum luoiuoiujg > Sf ■o < 1 ■'•'l > 'a- a a Ol a a a a a a Ol Ol a| at£ Joquini iuduuhpis m* *N >}• Sf > •o > •n a- -a- a a a a a a a a Ol Ol Ol a| oi55 jaqunifsl juouiojris <V) <N Sf <N M- -a- ■a- a a o-i Ol a a a a Ol Ol a a a35 joqiunjsj juuioipis Sf <o > lr| > ■O 'T- -a- a a o-i a Ol a oi Ol a a a a a15 joquinst juoiuojtns j* Sf •n ■m- >}■ -a- ■a- a a a a a a a a Ol O Xl a Xl05 joqtun juouiojcjs <V) t- »o Sf > 't- >o •o o-l ■a- a a a a a X-l a a Ol O a oi XI63 joqiun juaiuauns *o M- Sf >»• V ■o *o >)• 'a- a- a X-l a a a a a a o © a Xl Xl83 jnqiunjsr juouiwts 'n > *o Sf > *o 'S- > ■a- a X-l a a a a a a a a a a a33 joquin jikuuchpjs > lo ‘o Sf |sf > > > "o > a- a •o a a a a a a a a a a i/i93 jaqiun]sj juouioiejs ir> > > ‘o Sf | Sf ■o •o 0-1 > a- a X-> a a a •o a a a a Xl a a53 jaqiun luouicuris > Sf | >o <o <o 0-1 a a X-! a a a x-l a a a Ol XI a atz JoquniN uioiunn'rjs O > ln > > Sf Sf | »o > •'1 '<- -- V >*• a ■a a a a a •o x-l x-l a a XI a Xl53 joqtun juoiuoing > *o V *o Sf Sf I ,- •o > X-l *o a •a a a 'O a x-i a a a a a a Xl33 jnquuiM juoiuojujs U-J > > >f ■'J- 1 *o > •o V 'n > >a- a 'a a a a a *o a a a a a Ol a[3 JDqiunjsi juouiojcis 'o > > •o Sf > ■'* •o > ■o 'n- >a- a •a a 0-1 a a a a a a a a Ol '<i03 JoquinM uioiuoiujs <V) > *n M- 'o V •o V V a a a <N oi a •o a a oi Ol a Ol a61 Joqumjq luouicnins > •o >o "o M- a a a a a a Cs a a a a a a ajsqumjq luoiuojins > > *o IT) > >r- •o > >o 'n > a a a O-I a a a x-l X-l a a a oi a
31 joquinjq juouioiPis *o > > IT) >»■ > > > X-> a a a Ol a a X-l a a oi <N a Ol Xl91 joqum juoiuojejs **> •o o •1 «o 0-1 >a- a a a a a X-l X-l x-l x-l a a a a a51 jaqiun juoiuoicis rrj 'n "q- >o > 0-1 X-> a a a a a x-1 *o ■o x-l a a X-l Xl at\ joqiun iuoiuoims •o -- *1 >r- X-) 'a- > a a a 0-1 a x-1 x-1 X-l x-l a Ol Xl a a51 JoqumN juchuojpis *o ^ 1 > •o > >o •o x~i -<j- X-> a a a <N a a X-l x-l X-l Ol Ol Xl a a31 joqtun luouioicjs •o 1 ■o •o *'1 x-i 'a- a a a oi a a x-1 a a a Ol XI O Xl1 [ joqumjq luoiuoims "S* ‘O o •o ■o •o > •o ,- ■a- a a a a a a X-l a a a Ol a a Ol01 joqiunfsi juouioicis > > *~1 •o •o 'n > > >a- >a- a a a a a a x-1 a a oi Ol a a a6 jaqiuniq juouioikis > >J- *o n- *0 > ■o > h ,- > a a a Ol a a x-1 x-1 O Ol 0-1 Xl a a8 joqunijsj juchuoipjs >»* *o n- ‘o V O > a a a a a a X-l a a Ol 0-1 a a a3 joqumjs[ iuoiudws > > *0 > *o > •o o ■'a- X-> a a a o-i a a a a a a a a '<! a9 joqiunr juourojcjs > 'n > •o ■o J- ■'a- X-> a a a o-l a a x-1 a a Ol Ol a 'oi ‘<i5 j?qutn\T juotuoinis ^ | *0 \h *n >i- »N >»■ > x-1 X-) a a a a a a X-> a a Ol 0-1 a Xl at> Joqiunjsj lUDurojGis ‘O *0 > > <N ‘o X-» x-> a a a a a a X-l a a Ol o-l Xl '<1 a5 jc>quinT juoiuoiuig |>5- 'M' > »n > > > *o o X-> a a a x-l x-1 a o a a a >oi Xl Xl a3 joqiuniq judukubiS ^ | > Kn 'Sf ‘o > > >T- •o '<1 X-l a a a O a a *o a a a a a '<1 i/i1 joqumj juDuiajos *0 >3- ■h >o ><~1 x-1 X-> a a X-l x-l x-1 a X-l a a X-1 '<1 Xl Xl a
Res
pond
ent
Number - (N m Tf »r> VO r oc Ov o - fN ,- >n so a oc Os o<N <N <NCN Olor ars XI(N so<N r-C-J COCM C sfN 001
Appendix page - 25

Tabl
e 6
Raw
Data
of
Edu
cato
rs'
Opi
nion
to
Seism
ic
Risk
M
anag
emen
t St
atem
ents
(Con
tinu
ed)
>o 3 f 33- 33- *o c e r t * 6
33- 3 f 3s- 3s- r 6 r r s'iz33- 33- 3* •o '<N o s r t ^ S'9\fN 33- 3s- 3j- 3- o o o *r
3j- *o 3s- N- •n 9 o r r S O I
3 f 3J- 3j- f fj SZO ’ t7 ZP3s- N- f*3 9 8 8 X cs
■O 3t- 33- 3s- *f'i ILZ'V s
N- N- 3s- 3s- Nf- n v v S TC
*c-i <N 33- 33- •o > £ € 8 *e t’S
?3- ?3- 33- 33- >3- £ 8 0 ’ ^ 8C
fN 33- 3s- o o o 'r St?
<N 33- N- Z A 6 ‘ £ SmLP*0 3s- '3- >f3 '3- ZL6'£ Q'LP33- 33- f> N- <o *31 6 £ V f I €
o fO N- £ ^ 6 '£ OS
N- N- O N- fo r Z 8 ’ £ ss
3 f 3f 33- N- *3-) Z ,I6 " £ IS
cr- N- 33- N- 3- S Z O 't7 ZPN- > 3s- N- •o 33- o o r f r S'OZf*1 •o 3s- N- N- u r r P£33- f 'l N- N- V n 6 * £ cS
33- 3 f 3s- N- •o 33- £ 8 0 '^ 8C
33- 33- 3s- N- ‘O o o o ’r St?
•O 3s- N- > N- 9 0 8 *£ 9S
fN <N 3s- •o ffi 8 Z . r £ L9fo 3s- Nt- N- 33- \LV* 9ZfN <N 3J- N- >3- £ .s o 'r OP3 f N- '3- M- 33- S9V\> t-l
3h 33- 33- N- *n *f% zz v t 81
33- •'O 33- N - 33- L9YV LZN - 33- 33- N - fo r 6 r r S’Cc
■o 33- N - ff) 8 LZ'P S t I
*o > 3s- N- 'T j •o o o r t ^ t?
> o * 0 > o N- *o 33- OOS’t- zIr-J 3s- N- 33- 90£‘t7 S O I
* o *f3 i / “( N - 33- 8 LZ'P S 'Z I
<C3 33- 33- >3- <3-> m ' £ 6t?
3s- 33- 3- 33- n v p STC
*o •f! 33- N- >o '<N ZZZ’P 81
•o •o 3j- N- 'n 33- ZZVP 81
fN 3s- 33- N- *o ff) ipyp S '6£
*n I<0 3*- N - • o ffl LIP’P C
33- <N N- ' o 33- r e r r S’Cc
fN > > N- > o •o osz*r S S I
<N > 3J- 3* * o 8
3t- * 0 N- 33- oort? S’03
fN 3s- N- »o 33- £80 8C
«N •o Pr( o 'o 33- 880't? SC
33- 3s- ff) N- •n 980’t? 9C
fN 3s- ff> O <0 33- LPVP 8 t
33- 'r-> 31- 'N' > >f% P6VP S’CC
fN N- 3s- > 3 f 8Z0*t? zt?
N- fo 3t- N- ‘o Nf £t?rt? 9’6Z•o 3s- *o ■>3- *o 33- £££ 't? S'9
o 3s- •o N- >o 33- £S£'f S'9trj *n ‘‘O N- *0 33- 9SS’t? I
c o<NCO
COc o
'-rr~>«o OCO
Ave
rage
to
each
st
atem
ent*
Ran
ks
£ H
*5 * £5 ° ^-S.se0 *o *“t H ^ r r
■S a -2 | 2 gp £ I> I 2G. wa
1 | iI I sr** vrt i .
Appendix page - 26

Tabl
e 7
Raw
Data
of
Non
-Gov
emm
ent
Org
aniz
atio
ns’ O
pini
on
to Se
ismic
Ri
sk
Man
agem
ent
Stat
emen
ts
i 5 «qiun|SJ s > in in N- in in in N- N* N- n N- in N- in in in in •n n n N* N* in n *n95 joquinfq s fn > >5- V in N- in N- N- > n N- m N in in > in n in N- *n > N-55 joqumN s fn N fn •n N- N- in N- N- in fn n ff* *n *n n n •n n N* fn N* N- N* •nt>5 jsqiunfsj s fn N- in N' in N- in N- N- *n n in *n in in N- n in N* ♦n *n n in55 joqiunjq s N- N- in N- *n N- N- o in n n in "n N- in n *n *n N- N- N- N* N* *n n n55 JDqiuniq s in > > > in N' in N- N“ «N n in in > in fn > in N > N* N- <N N- n N*15 jaquinjq s N- N- <N *n N- in N' N- *n in N’ in n N* N- n n •n fn > n N*05 JoquinN s N- in in > *n ‘n > in > N- > in in in fn in in n N* in n in m > in in
JnquinM s N- N- in fn N* in N- in in N* N- n N- in N- n in N- n N- n N- N* n •n inasquint s N- > N* in > in N* > N in N* n in N N n N- > in -> >
it- J.iqumjq s N N* N- N- in •n N- N- N- n- n N- in N n N* > n N- n N* > > •n in9f Joqtun[q s *n N- <n > fn > N- n fn N- N* n N- N- N- n N- *n > N in5f jnqiuirfsj s N **Tin •n N- •n in > *n N- N- in N" > in N* n N- n* > •n inf f joqiunfi s N- N- <n in fn in N- N- > •n > in N- in N- N- in N- *n •n fn N N* n inf f joquinM s n- tv>, in in N* N- in N- n > in N- in N- n > > N* fn N* n ir, n
Joquiniq s > **n > > N- in fn in fn in ff. n fn in N in fn > *n fn N- in N fn N N nIf joqumfi s >* > in fn in fn > fn in fn in N- in fn > n N* •n in «n fn in n inOf Joqiunjq s N* N* *o *n fn in N- N- n O N > in N- N- in N* n *n fn N- N- n N*6e .i.iqumK s N N- > N- in > *n > > n - N- N- in fn > n N *n fn N N- > n >s>5 joqiunf; s > N- ‘o > *n <n in N- in N- in fn in n in N- N- in N- •n *n N- > n n Ni f jaqiunfi s N > •> > in fn > > N- N* n > N- n *n fn > fn N n > > > N* n in95 jnqiunjq s fn > V o > in <n in > fn N* n fn in <Nin N- N- n N- N in N* in N n in55 anqiun(q s fn in •o in in *n in fn n N- n N in > in > n n n N- n n n- n in inf 5 jaqiunjq s *n n- o 'n N- in fn in N- in N- •n fn in N- in •n n in N- •n in N- N- O n n55 jciqtunjq s > N- >h > N- (n > in N- V fn in «N N n in •n > in > in in N* fn N- N- in55 jsqiunjq s N" >3- in in N- in N- in fn n N- N- in n *n in in N- *n in n fn N* n N*15 joqiuntst s N > N- in *n in N* > N- in - n in m N > in V in in >r > > in >05 Joqmnjq s •o N* in in N- N~ in N- N* n in in in in N- *n n N* *n N* n N- in N* N-65 aoqiuniq s N- N- > 'l- N* in N- in N- > N- n fn n in n > > 'n in n in N > N* •n in85 joquinjq s N- N* > N- in *n in N* N* N* in n in n in > > N- n n N* > N- > *ni5 ioqiunfi s 1/-J > tr, in in fn in N- N* N- •n > in N- in N- N- > N- n •n n N- n n95 joqumfT s N- N- 7- N- *n N- in n- N- N- n N- n n in N- n N- N- n n T N- n *n55 loquinN s fn N > V N* fn in N* fn N* *n fn in in in N N n N* n in N' N- N- n inf5 jnquin i s N- in in in fn in N* in N* n fn in N- n fn N* in in n in in > N- in in55 joqiuntq s l/-t > *o fn in N- in in in n in > N- in in N- in N- in (n fn in n ln in55 jaquinfj s N- fn > > in *n in > > in n n in n •n N in in fn > ln N in > in[5ioqiuntq s N- fn in in <n *n N- N* N* n n n n n n in in fn N- n in N' N- N- N*05 .inqumjq s >T > > •n in N- - N- > N- n f'l n > n > N in > > - fn > •n >61 Joqiuns! s > > N- <n in N- N- N- N* N* n Qs n N- in N- N n N n N fn N- n n fn8 [ wqumN s N* N > > in fn <n N- N* n n iN in N- in N- N- in n- n fn n N* ni l joqumiq s I/-, N- > V *n N* *n fn N* N- N- ITj n n in N- n in N- n N- n N* N- •n N- n n9 [ jnqiunfi s > N- > in fn in *n N* n <n in in N in N- N N* N in in N* n f l n fn51 joqiunfi s > *n N- in N* in N* N- n n n N* N- in n n fn n n N N- in N- *n nf [ .inquiry s N > o N“ •n N- in o in > n > in n n N' N in N- n N- N- > > n fn51 joqiunfj s N > > > in N- in in in N- *n > in in in N > in N- n in N N N n N-5 [ JcqiunN s N N- N- *n N- *n O in N* n n in in in N- in in •n *n in N- N- n n n1 j joqiunfi s *n N- > > > in fn in in O > in *n in n in N- N- in in n in N* > n n01 joqumjq s N- > > in fn in in in in N- in n in > > in > n ln N > in > n6 joquinjq i s (n n- N* N* in N* N- in in in N* n n n •n N- n n- N- N- N n n- N in8 joqumfi i s in > N- N- V in N* in in n n N* n in in in > in > in N- n N in ini j.iqiunsq j s in *f%fN N in N- in N* in n •n *n in in in fn n n n n n N- n n n n9 asquint j s in in N* in N- in in in N* n N* in in in N- N* in in n in N- > N- n N-5 jaqiunN j s i/*; N* (TJ u-%> in > fn in in N- n in m n n N N* in > in fn N N- > in N*f joqiunjq j s ■n N- *0 N- in in N- in in n in N- in n in in N- n N- •n !n N* in n n in5 joqum^ s o in > N- in > in > o in n *n n n in in V N* in N N- in N N- N N-5 jaqiunfsj j s o >T N- *n V in N- *n n *n •n n- •n n n •n in N- N- N- N- in N- N* N- N-I joqiuntq j s N* N* »n *n in in in in n n *n n in n in N N in > *n in in n in n
Resp
onde
ntNu
mbe
r
- fN in nO r~* 0© o . o = <Nm rr in o r- C©ON ©<N ri <NrnCN
......
...24
......
...
m<N
......
...?6
.......
LZr
...sr.....|
Appendix page - 27

Table
8
Raw
Data
of Co
mm
unity
Le
ader
s' Op
inion
to
Seism
ic Ri
sk
Man
agem
ent
Stat
emen
ts
i55 joqumft luctuiajins95 jn q tu n ^ ju^iununs
55 joquinjsr juouiDjins
f 5 joqumisi juouiojujsS'L55 joqum )uouo)B)S
£ 5 Joqum*q juoiuojcjs15 ioqiun»q juoiunims05 JoqumK juDUicqujs
Joqunqq; juouioicjs
gf Joqunijsj judurciosLP ioqum luoiuouns( ) p jo q u ia jq lu a u ia iw s
g p joqmnjq juouiojtns
p p j o q iu n x lu a u ia jc js
£P Joqumfq luotucqcisZ p ja q u u q q ju o u io p n s
I p j ^ q u m ^ urciuo)U )s
Qp joqmn\r luauiajuis65 ioqiunt\T moiuwts
re85 jnqiim*q juoiuouns£5 joqumjsf juouiDnns95 joquin\r juduidjuis
55 joquinjsi juouiojutg
t?5 Joqiun.Nj juoiuojos
55 ja q iu n ^ juaiuouns
55 joqurn juoiuouns[ 5 jdqumjs! juaurajuis05 Joqum 4sj ju o u io io s
65 Joqumjq luoiuojws8 5 Jo q u m tsj lu a u ia u n s
oorrIZ Joquinjq luaiuaitns95 jaqum/q juouiojctg55 jo q iu n ^ juouiojcis
PZ joqum4*q luoiunjtns
55 joqum*^ ju d iu o w s55 jaq u u it\r juouiopns
15 jnqiun.M ludiurqcic;05 i qtun tu?iuo)tns61 joquin iuou)D|t’is81 jo q u m \r juouioieis
i \ Jo q u n iN tu o u io ie iS
91 joqiun* juoiuoiuig
p i jo q u m jq u ia iu a i tn s
51 joquinx juouioibis
i51 joqumx juouioids[ f a qum UKHUcwns 1
20( ioqiunjq luoiuouns
6 JoqumM utouioicts8 Joquinjq luatuopnsI joqumjsi luouionns9 .pqiunN luoiuouns5 jnqiunfq luauiaios
£'£p joqiunjq ju^iuoiuis
5 j quin i luouioims5 jnqmnjq juouisms1 j quinM iuouiwis
Appendix page - 28

Table
9
Raw
Data
of R
epor
ters
’ Opi
nion
to
Seism
ic Ri
sk
Man
agem
ent
Stat
emen
ts
L<Z joqmnfsf juauiaieis000't*9 5 oaqumfsj ju a iu a ie is
55 jaqumjq luauiannsf 5 jaqiunfsj luauuwnv;£5 jaq u m jq tuouiD pns
£5 jaqumjsj imtucqcis
5 5915 joqiunfsj HiouiDpns05 jaqumjq juoiucnEJS
O f Joqum jq lu au io im s
g f jn q u in ^ juoiuojcjc;
£f jaqiunfq luauiojins5*559f joqumfq jiuuuojbis
5f joqumjq uioiuaitnsf f joquinfsj luoiuaiBJS£f jaquinfq juoiuojbisIt joqtun]Nj juaiuonnsIf jaqitmjq tuauiDungO f Joqiunjq iiiouiojtns0£ jaqum iimuaws8 £ jaqtun^q juotucncjs
/.£jaquinM juoiuojBis
5*559£ jaqtunjq itiauunms
5*52f £ jaqiunjq tuauiduns££ joqumfsJ lu a iu o u q s
l£ joqumfq uioiuaitnsl£ ooqiuniq luniuoiejs0 £ jaqiuniq lunuiainis
S*Z$ 1 ja q u m N lucauaw ns
S’Z8c joqiunjq wauiaunsI X jaq iuuM lu o iu o p n s
V Z jo q u m N juo tuo ju is
5 £ joquin{q juoiucnos
£ Z ja q iu n x iu a u w itD S
ZZ Jaqiunjq juouiopnsZIZ'PZ jaq iu n tq iiia u ia itn s
0z iaquin luoiuouqs61 JoqutuM juoiuoitnsg[ jaqiunjsi iuaiuc»iBisL\ iaqumjqluautaims91 joqtunjsi juauiaicig51 jaqunifsi juoutoitnsf I laqiunfq juaiuajcjs
5*55£1 iaqumtq juaiuaiuis
5*52Zl Joqtunfq juoiuoibj|j Jaquinfsi juaiuoicjs01 jaquinfq juauiaitns6 jaquinjq lumurqcis
5*51-8 aaquin^ luaiuoiuisI jo q u m N )u:nuniB)s
9 joquinfq jikhucoejs
5 joqiunjq uiouioii
82zwtf joqumjq liouuquis
£ jo q u m ft tu au ia jriS
Z Joquinjq juaiucucjs IML| jo q tun^r juou io im s
Appendix page - 29
is 4.
308
(bet
wee
n im
porta
nt a
nd
very

Appendix-5:The final fram ew ork for guiding and m onitoring seism ic risk reduction o f non-engineered buildings in Indonesia
The final framework
Sixty three pairs of characteristic-indicators----------------------------------,
A. Seismic hazard ana lysis^CORE AREA OE SEISMIC HAZARD ANALYSIS
1. Earthquake occurrence data...........im 2. Earthquake scenario data..................... r$
3 .....................................................................1
B . Seismic risk assessment^CORE AREA OF SEISMIC RISK ASSESSMENT
.fc. 4. Inventory d a ta ....................................5. Building fragility curves....................6..........................................
i\ i
\ i
C. Seismic risk response ^
1/ i
------------------------------------------------- S 1
CORE AREA OF POLICY AND PLANNING12. Reducing seismic risk.....................13. Integration of reducing SRNEB .
V 14...................
CORE AREA OF ............................
63. Good examples in real...................
£Complement AThree important factors of effe m anagem ent of non-engineere
1 Direct .involvement of Mullidis<2 Strengthening of Local Capac
• developing local leader• conducting participator;• increasing public seism
3 Poverty Consideration
Complement BThree guiding principles of sustai of seism ic features in the grass rc1. The government role is the backb
dissemination initiative2. A dissemination channel through
is imperative3. The m essage should convince pe . control over the implementation a
Complement CP il in g muiikliactfcfinary stakeholders together as agents of change to share the seismic nsk of non-engtnnered boikitngs
Oovcj wivm i ii ».1u4<nfiKj IrgiO.n . • oHJOCtl) ;
RevtwcHcrt 1
amaiMtwdiwh wwthweh'ir#»Rtl I rwricKfi U»k1u4j«» It«Wi»n anO cwpttpiei
njiprvwmt <»w>KJfv£ i
mtg m s & H s . \i*t> omcmnwstt
■"» ;; Ofgafh/ationv. Kvpt- Jtuv^-w-icTi. jh.l < >ito
ThWmvy^r » tap Otwn ao{*wrf>' on he*and nsU *vf o'
; 'fvVHf * #** 4i fn* **?«*>« p«X»V» >V w-vnr rIV tficw/ taa* ft terffcHvup n__ K 'rxVcsf * *•--------
tn«nAufti«enl i*_> Tftfsj fiUtfoW 'f
■i «**f «*npjft>6tnw*. «cK«vr tiM iWrogwiiW* attorn
The follow ing explanation describes the above fra m e w o rk ------------- A
A ppendix page - 30

‘The final proposed framework’, consisting of sixty three pairs of characteristic-indicator
Seismic Hazard Analysis
Characteristics Indicators
Core area: Seismic Hazard Analysis1. Earthquake occurrence data: their
history, spatial distribution, characteristics, impacts, and the existing fault line *
Data recorded, mapped, up-dated, disseminated and communicated regularly
2. Earthquake scenario data * Existence of earthquake data to conduct deterministic earthquake scenario
3. Earthquake scenario data * Existence of systematic analysis of return period of earthquake occurrence to conduct probabilistic earthquake scenario
Seismic Risk Assessment
Core area: Seismic Risk Assessment4. Inventory data: geology/soil profiles
and buildings *Geology/soil profiles and buildings inventory data are recorded, mapped, and up-dated regularly as necessary, particularly in order to calculate the quantitative number of non-engineered buildings and their spatial distribution
5. Building fragility curves * Existence of building fragility curves: up-dated regularly and associated with the newest data
6. Damage assessment * Existence of systematic damage assessment of the possible economic impact to buildings using a seismic risk scenario both the deterministic and probabilistic approaches
7. Land use applications * Existence of seismic risk map using Geographic Information System (GIS)
8. Land use application * Existence of followed-up program of damage assessment in relation to the city spatial planning under ‘the city spatial planning board’
9. Land use application * Existence of balanced information between a ‘geographic seismic risk map’ and a ‘geographic city economic development map’ for a better understanding for public and investors
10. Land use application * Community members and many stakeholders become involved in seismic risk map dissemination and communication
11. Building interior layout * Existence of information about a seismic resistant interior layout: disseminated and communicated to the public
Appendix page - 31

Seismic Risk Response
Core area: Policy and Planning12. Seismic risk reduction of non-engineered
buildings (SRRNEB) as a policy priority
Existence of SRRNEB commitment and strategy on a city level (including collaboration with donor agencies, in relation to the context of decentralization)
13. Integration of SRRNEB indevelopment planning and sectoral policies (including poverty eradication)
Established or revised policies to facilitate action, regulation, enforcement, and/or incentives
14. Responsibilities of SRRNEB Map out institutions with responsibilities of SRRNEB
Core area: Legal and Regulatory Framework15. Seismic codes * Seismic codes (socially acceptable, written in
simple language, easy to implement, and economically feasible) are in existence and updated
16. Laws and regulations Existence of an administrative and institutional mechanism framework for the implementation of seismic codes
17. Compliance and enforcement Existence of regulation of builders and real estate developers for the creation of seismic resistant buildings
18. Compliance and enforcement Existence of rigorous regulation of the issuance of a ‘building construction permit’ for builders and the issuance of the formal ‘fit for sale certificate’ for every house as a product of real estate firms for widespread creation of seismic resistant buildings
19. Compliance and enforcement Existence of systems to control compliance and enforcement in actual practices under the ’city construction control committee’
20. Certification system for engineers, architects, and foreman
Existence of compulsory certification system for engineers, architects, and foremen
21. Responsibility and accountability | Existence of watchdog groups
Core area: Organizational Structure22. Implementing and co-coordinating
bodiesExistence of a city-wide administrative structure responsible for disaster reduction
23. Intra and inter-ministerial,multidisciplinary & multisectoral mechanisms
Existence of sectoral programmes in line ministries
24. Civil society, NGOs, private sector and community participation
Existence of consultation, and role for civil society, NGOs, private sector and the communities to reduce seismic risk
25. Civil society, NGOs, private sector and community participation
Existence of a group or an individual that have incorporated earthquake risk reduction as a permanent or significant part of their operations and commitment, for example the existence of one permanent facilitator team graduated from civil engineering to take care of the dissemination to the certain community
Appendix page - 32

Core area: Resources26. Resource mobilization and
allocation: financial (innovative and alternative funding), incentives, human, technical, material
Existence of disaster management office
27. Resource mobilization andallocation: financial (innovative and alternative funding, incentives), human, technical, material
Evidence of permanent budgetary allocation
28. Resource mobilization andallocation: financial (innovative and alternative funding, incentives), human, technical, material
Expert staffing allocation
29. Resource mobilization andallocation: financial (innovative and alternative funding, incentives), human, technical, material
Existence of established link with donor organizations
Core area: Information Management and Communication
'
30. Information and dissemination programmes and channels
Existence of dissemination media through websites
31. Information and dissemination programmes and channels
Existence of documentation, databases, and information system on seismic risk
32. Information and dissemination programmes and channels
Continuity of dissemination channels and participation down through grass-root communities and use of traditional/indigenous knowledge and practice
33. Networks for seismic riskmanagement (scientific, technical, and applied information, traditional/indigenous knowledge),
Existence of multidisciplinary stakeholder networks in seismic risk management
34. Networks for seismic riskmanagement (scientific, technical, and applied information, traditional/indigenous knowledge),
Existence of information centers and networks in seismic risk management
35. Networks for seismic riskmanagement (scientific, technical, and applied information, traditional/indigenous knowledge),
Existence of inter-city exposure visits for city managers for mutual learning
36. Networks for seismic riskmanagement (scientific, technical, and applied information, traditional/indigenous knowledge),
Existence of pro-active sharing of best practices for earthquake risk management for wider circulation
Core area: Education and Training37. Inclusion of seismic risk reduction at
all levels of education (curricula, educational material)
Existence of appropriate curricula in seismic risk reduction at all levels of education
38. The role of teachers through school activities
Existence of the role of teacher to disseminate and apply seismic codes in real practice through their student activities (including collaboration with other parties)
39. Training of trainer (TOT) programmes
Existence of TOT for community leaders periodically
Appendix page - 33

40. Local, National, and International training programmes
Existence of training for development authorities, Community Organization, NGOs, group of foreman, private sectors: real-estate firms, builders, small-medium contractors in safe- building practices and retrofitting techniques, through various methods such as: elucidation, workshop, and learning by doing in real construction.
41. Local, National, and International training programmes
Existence of apprentice programmes in seismic risk management for government disaster management staff
Core area: Public Awareness42. Public awareness policy,
programmes, and materialExistence of city-wide specific awareness campaigns and strategies in seismic risk.
43. Dissemination and use oftraditional/indigenous knowledge through media involvement in communicating seismic risk
Availability and accessibility of information (handbook, poster, newspaper, exhibition, talks show, short TV program, audiovisual program, etc) in introducing seismic features of buildings with simple technical approaches understandable to the laypersons, including the existence of model houses with seismic features, low-cost, and simple in neighbouring areas
44. Dissemination and use oftraditional/indigenous knowledge through media involvement in communicating seismic risk
Existence of tradesman involvement in producing and circulating the seismic features information
45. Dissemination and use oftraditional/indigenous knowledge through media involvement in communicating seismic risk
Existence of a mechanism to monitor the increasing number of aware and informed community members such as students and teachers, key government functionaries, construction actors and engineering institutions, policy makers etc.
46. Dissemination and use oftraditional/indigenous knowledge through media involvement in communicating seismic risk
Existence of community-based informal meetings discussing good practices in seismic features of buildings
47. Dissemination and use oftraditional/indigenous knowledge through media involvement in communicating seismic risk
Existence of artist involvement in communicating seismic features
48. Earthquake Safety Day Visibility of Earthquake Safety Day through: school activities, audio-visual programmes, competitions, mock drills, etc
49. Documentation Existence of documents of the appropriate cost of effective retrofitting techniques and sharing of best practices, conference proceedings and articles in popular magazines
50. Monument of tragic earthquake event Existence of monument to commemorate the tragic event of an earthquake
Core area: Research51. Cost-effectiveness research on the
. application of seismic features *Existence of cost-effectiveness research in the application of seismic features both for new and existing buildings (retrofitting)
52. Interdisciplinary research between science and policy *
Existence of reducing . seismic risk through interdisciplinary research between science and policy (evidence-based policy) comprehensively
Appendix page - 34

53. Evaluation and feedback * Existence of indicators, standards and methodologies for seismic hazard analysis and assessment, unique to their local needs
54. Local, National, and International cooperation in research: science and technology development, social and culture
Providing technical support, training, and periodic assessments on earthquake vulnerability through research/knowledge at all community levels.
55. Local, National, and International cooperation in research: science and technology development
Existence of local academic institutions as Key Resource Institutions for earthquake risk management
56. Local, National, and International cooperation in research: science and technology development
Existence of Local, National, and International exchange
Core area: Social and Economic Development Practices57. Pro-poor and sustainable livelihood
strategiesEarthquake occurrence data: their historical, spatial distribution, characteristics, impacts, and the existing fault line.
58. Financial instruments Existence o f an incentive strategy for new buildings with seismic features
59. Financial instruments Existence of earthquake insurance initiative
Core area: Physical Measures60. Introducing seismic codes in new and
existing buildings *Compliance of public and private buildings with seismic codes and standards
61. Good examples of real constructions* Existence of a retrofitting program for public buildings (health facilities, schools, lifelines, etc) at high seismic risk
62. Good examples of real constructions* Existence of regular maintenance of seismic features in structures
63. Good examples of real constructions* Existence o f a number of model houses with seismic features, low-cost, and simple as well as ready to be replicated in other areas. For example: a number of houses made of different materials, extendable houses, and a post patrol (’gardu ronda’) in the neighbourhood area
*) The pairs are close to the technical intervention
Complement A
Three im portant factors of effective seismic risk management of non-engineered buildings:
1. Direct Involvem ent of Multidisciplinary S takeho lders c S c engthening of Local C apacities
• de veloping local leadership• conducting participatory ap p roach es• ir e a s in g public se ism ic a w a ren ess
3 P overty C o n s id era tio n
Appendix page - 35

C o m p l n m o n t H
p t r e * g u id in g p r in c ip le s o f s u s t a in a b le n .o f H o o m u o f i o i h i r # » H t o { j r a « H r o o t c o m m u n i t y
■ »=i: th e fe ickbon© of m t ■|||
6 $ ^ g s^ p $ fw w o n channel through the *.o«;i.»i f« «n.iEl
f h e i n f ; , •..-..jt- , h - . h i © oovfnce p e o p le th a t th e y c u eL a n in ■! w v i f I h i im p lw u * p ' . r t s ■! im ic m d f iH
Government (including the legislative council)
Researchersand
Scientists
-'"’Community Leaders (T hey \ also represent house owners)/ *,
Educators, Non-Government Organizations. Reporters,
.. Businessmen, and O thers^
Complement C
Note:This arrow represents 'a top-down approach’ on how government
j v disseminates and communicates seismic risk and cost-effectiveness of ^ implementation seismic features, at the same time enforcing seismic codes
rigorously through effective regulation
This arrow describes ‘a bottom-up approach’ where many stakeholders **!>• participate and have a say to the decision process of seismic risk
management related issues
-> This arrow outlines 'a mutual horizontal relationship’ among stakeholders for better and comprehensive seismic risk management system
Putting multidisciplinary stakeholders together as agents of change to share the seismic risk of non-engineered buildings
Small-medium contractors and Foremen (including masons and carpenters)
Appendix page - 36

Appendix-6:Copy o f Indonesian newspaper article
Indonesian newspaper articleThe title: Seismic Risk Management: Yogyakarta please be ready to earthquake!
(Manajemen Risiko Gempa:Yogyakarta Bersiaplah)Name of newspaper: Kedaulatan RakyatThe purpose: Encouraging Yogyakarta people to be ready to earthquake
following tragic seismic event in Aceh 26 December 2004 Date: 10 January 2005 Authors: Setya Winarno and Prof. Dr. Sarwidi
Manajemen Risiko Gempa: Yogyakarta BersiaplahIlENCANA gempa di bumi Indonosia sudah bcrtubi-tubi. Semua pen- y . I i ! Y P . pa adanya mitigasi (ter- dat, aset yang berupa bangunan dan infrastruk-
tidak asing lagi rnuncul ke permulcaan karcna duduk.-telah menyadari I V , ' T. „ , < ‘V » masukperingatun dini), turnilatnyacukup bcsar dana 3 e ttfrsebuttidaksecara geologi wilayah Indonesia merupakan sepenuhnyu bahwa gem- L ~ , v ’V *7. V „ V V S j risiko bencana gempa tahan gempa.tenipat bertemunya beberapalempeng tektonik pa itu tidak membunuh W j n a r p O '& S S r w if l iB id moigadi sangat bcsar Yogyakartuyangditandai dengan warns me-penyebab gempa. Gempa dengan kekuatan 9 orang, tapi yang mem-. ...... t f sAmet seperti di Acehsaat ini. rahdipeta mempunyai penduduk terpadat(se-skala Richer di pantai sclatan Aceh tanggal 26 bunuh odalah bangunan yang dibangun socara liai ini bcrimbas dengan proses rekonstruksi ter- kitar 12069 orang/km2; BPS 2003) dibandingkan Desember 2004 menduduki rangkingke 6 gempa sembarangan dan infrastruktur (tormasuk un- hadap bangunan, infrastruktur, psikologi ma- dengan 11 ibukota propinsi di atas. Selain terpa- terbesordi dunia (sejak 1900) setelah 1960 Chile tuk peringutan dini) yang tidakmemadai. syarakat, dan tata pemerintahan mcmakan dat penduduknya, aset yang dimiliki Kota Yogycskaia 922; 1954 Prince William Alaska akala 9,1; Mestinya gempa Aceh tidak sedahsyat ini, waktu sampai bertahun-tahun. Tcrlebih lagi ba- nilainya cukup sigriiikan (hotel, gedung perkan 1957 Andrean of Island Alaska skala 9,1; 1952 apabila sejak awal sudah ada upaya mitigasi ter- gi Bangsa Indonesia yang sedang mombangun toran, pertokcan, sckolah, bangunan kuno, be- Kamchatka skala 9. Jumlah korban meninggal masuk pcringatan dini. Dr Laura SL Kong, Di- dimana koudisi ekonomi belum membaik, bon- serta segcnap infrastruktumya) dan sampai saat yang mencapai 126.000 orang, terscbar di 12 no- rektur Intel-national Tsunami Information Cen- cana gempa di Aceh menyebabkan kondisi ma- ini belum ada ukuran yang pasti berapa level gara (korban terbanyak di Indonesia yang men- ter di Ilawai, telah menginformasikan pdanya syarakat dan lingkungan keipbali ke beberapa kerentanan aset tersebut terhadap goncangan • capai 80.000 orang) merupakan rangkingke 4 di-gprakangelombang: yang luhrbiasase'gera setc- tahtrnsllam. ' gempa. Di sisi Iain, Yogyakarta adalah stuahdunia -setelah Xining China 1927-dengan lahkejadian gompa di pantai'Sumatra'kepada'- Kontribusi dari negara-negara rr.aju untuk satu ibukota propinsi di Jawa yang tarlctak di200.000 meninggal; 1920 Gansu China dengan - 26 negara di -kawa3aiiSekitar'Pasifik,-terina4uk’ upaya manajemen risiko'gempa barangkali ha- sisi selatan Pulau Jawa berdekatan dengan sum-200.000 meninggal;' 1923 Kanto~Jepang 'dengan Indonesia. Nainun yang teijadi, informasi tidak nya sebatas menyalurkan iimu pengetahuan ber gempa di Samudera Indonesia yang berpelu143.000 meninggal (sumber. wwu/.earthquake. dapat sampai ke daorah bcncana karcna koti- dan peralatan gempa dengan segala aspeknya. ang teijadi gempa 8,2 skala Ilichter (Finnan usgsjov). daksiapan aparat pemerintah seticmpat. A’oA-.... tidak akan bisa memandu secara detail proses syah, Irsyani, Ecr'apaH, 1999).
Gempa yang bcrpusat di lepaa pantai selatan terjadilah malapetaka yang aungguh tragis di manajemen gemna sepenuhnya kerena berkai- Sxmgguh, Yogyakarta yang bcrpenduduk yang Aceh dengan yang diakibatkannya mengingat- Acch. tan dengan kompiekaitaa inasalah eosial, politik, padat, beraset yang sigmfikan, dekat dengan pu*Vuin kembali kepada masyarakat di dunia ter- Manajemen Risiko Gempa ekonomi dan seoagainya. Pada kenyataarmya sat gempa merupakan daerah sangat tinggi risi-hadap pcntingnva perencanaan dan pcrsiapan , , kan.But aJoiak yar.g teijadi adalah adanya jur&iig pemisah an- konya terhadap bahaya gempa. Berkaca aari be
V H f ada « * * * malapetaka gempa yang tetjadi Indo-
sangat kurang, sehingga kejadian tragis itu ter- >'">» &t*DS> »ntOTa lain Aceh betul-betul sedang meninggli untuk tetja- dirinya unSLk tahan tyi terhadap bahaya gempa.t- '• 1- I • J- • J- di logi. Mestinya setiaphomumtas bemsaha me- Sudah saatnya semua elemen masyarakat di
m ^ u t t a n tet“ ? b f ^ B d a ^ I P®> d™ kesadaran hidup di dacrah gempa. Hal p0Ir-isa‘1 tersebut denpan mengi- Yogyakarta dibekali mitigasi bahaya gempa is -3 yang^^ditimbdkm." negwa2 U n g so- I™ dapat dicapai mclalui anak didtk sekolah, d«tnincasi altnyangpahng lemah sebag^ tahap ngan manajemen rntko gempa Alangkah bang-dangbcrkembrmmKrdadiangenumtai rnolfputi yang melaUh itesigapanaiswa apabila teriadl ^syangtithanujtbmhaya ganya apabdakomumtasdiwtlayahYogyakarta°001 di India 20 000 monineeal 2002diAfeha gempa, yang pada akltimya dapat disampailcan pa dengan manajemen nsiko gempa. I eng- dan sekite.rnja. masyarakat, perm-rm.al-., a.ka-
kepada orang tuanya masing-masingapayang ^ 1 ' ^ bjsnis,dan instansii yanglain,jnc-om'iron iv«)di tn .n 9 A<wi>n<.ntn<.. tdali luereka oelaiari tontani: cemua di sckolah. depan_dengan upaya mitigas. npabda gompa nyandang predikat kota pendidikan dan kota
a me- tahan gempa (seperti di California'. Gempa scbe-ues 2 0 0 4 a. seiatan p a n t a T S ^ m 000 m‘e°- konpa ysn7dic'JtaTdan disebHrkaTdl daeTah ^ p o n sn y a setelah adanya malapetaka. baik sar 8,2 atau lebih di pantai selatan Jawa (sebe- ninggal P tersebut; Apa yang harus dilakukan pada diri, n>'awa ^ bcnda- «adar1? menunggu untuk menghentak
is , rr i, t i" keluarga, rumoh, dan pcrabotan Bcbcfum, scla- Risiko Gempa di Yogyakarta \\ilayah Yogyakarta dan sckitaruya.Yogj’akar-homunitas Tahan Ujl ma dan sesudah teijadi gempa. (b). Penegakan Wilayah Pulau Jawa bairian selatan terma- u ^ ers.laFla , dengan ntanajemen nsuko gem-
Tantangan yang dihadapi penduduk dunia peraturan terhadap rumah tidian gempa dan in- suk Yo-wakarta dalam 'Peta Kilnvnh Rnnmn P nuJ'ifW^Cr$lS .US jC ■adalah mengimplementasikan ibnu kegempaan frasluktur yang ada dengan desain dan pemba- Bencana Gtmoa Indonesia' vam> dt«.»nn nl .b Jr’"-} !1,1*?!™,? T ) / - isecara teknis ojwrasional serta efek yang ditim- ngunan secara tepat, yang meliputi standar ko- *bulkan pada semua aspek komunitas-. masyara- amanan, material, tenoga kerja, metode koija, p , rponn tnrmnsnlr uiinv-nt, v..-. -5 ? ’ Sarvndi, PhD, Du’ehlur CEEDEDS dankat, pemerintah, akademisi, dunia bisnia, dan dll. ■ Dosen Teinik Sipi! UII)instansi yang lain baik dari sisi tingkat kewaspa- (c). Beberapa fasilitos yang esonsial yang tctap . . j ?1 P " w'ilavah ini I-------------------------------------------------------------------------------daan, kctahanan bangunan, dan lingkungan harus mcryalankan fungsinya apabila teijadi s'; m „ L m Ihidup yang mergamin adanya keselamatan. Pa- gempa harus dide3ain dan dibangun dengan tanah samnai dencan intensfta’s da akhimya sisi sosiai, pohtik, dan ekonomi ha- stnndar ketahanan gempa yang lebih tinggi. y j . y j j spP|a , . y j Wilavah rus bekerja-secara bersama-sama untuk me- Misalnya: rumah sakit, pemadam kebakaran, i^mcjuanj, terj-idi intens'-a-ujudkan komunitas baik di perkotaan inaupun kantor polls! dan sckolah. (d). Pemerintah secara ja3 lebih dari skala VI5LM1 di" di pedesaan tahan tyi terliadap bencana gempa tegas harus mengatur tatamma lalian pada dae- tandai dengan wam a merah" serta efek yang ditimbulkan. radi-daerali yang rawan efek lain dan bencana a!
Sebagai contoh komunitas yang tahan uji ter- gempa. misol longsor, likuifaksi bahkan Tsu- T i i ,1,..,.. ,n hadap bahaya gempa adalah di California naim, (e). Pemerintah harus menyediakan infor- merah Hd .l-ih Yniv-iitinerikn Serikat Ccrita tentangCalifornia tidak masi dan bantuan untuk stxategi-strategi miti- " v illt.,ram Tinndn Aceh"lepas dan cataton sejarah gempa yangsiguffika., easi pra-gempa dan juga respons yang harus di-yang borulang kali menerpa wilayan mi. Sejak ambil sev.l.h gempa toriadi. (0. Pengadaan "lal^ llo' ^ rontalo, Bengsulu, gempa San Francisco di tahun 1905, hampir 100 tanggungjawabkorponuii untuk mendptakan ^ P ^ .P sd a u g .T e m a tc , Pa.u, tahunyanglalu,berbagaiupayamitigasi/pencc- lingkungankeijayangamanbagisemuapokeria AinbondanJayapura. gahan, riset, dan pengombangan telah dilaku- mclalui pombelajaran manajemen risiko paaa r 0 Eempa yang berupakan guna mcwujudkim komunitas yang tahan bisnia. (g). Pengadaan asuransi gempa untuk f^ncangan timah (tanpa meng- uji gempa. Sekarang, koselamatan terhadap rumah tinggal dan bisnia komersial wutseitakan 1 sunami) di suatugempa sudah diimplementasikan di semua as- Meskipun bencana gempa yang cukup besar “d dipengarulu oleh (a) pe- pek perencanaan, pembangunan. bisnis dan memHiki probabilitas yangkeol tetapi efek gem- a goncan^n permukaan lingkungan hidup yang berkesinambungan di pa mempunyai konsekuensi kerugian yang sa- r 1 ( - jumlah penduduk, (c).California. Sehingga masyarakat dunia saat ini fn gat tinggi. Tapi gempa yang slgnifikan tidakjarang sekali mendengar adanya korban gempa ................... ... ‘...........................................di daerah California meskipun di daerah itugempa sampai level menengah datang secara masyarakat, dunia bisnis dan pemerintah. Tan* goncm^kota berjxm dudStpa
Appendix page -31

Appendix-7:Copy o f poster publication
Co
■43OJo
JQ3CLL.CD
OCL
ooCM0C13
—3OCM
0COQ
CM
03TO00
f e l l£ to CD C/3
<4—C "O O C
o CO ~ > , c .-fe0 C/3E 0 c >
I Ic: c
LU cp
0 £ JX O ~ "O "O 0
£CO QCD > 03 > CO O
03 h; C/3
^ 0
o CD ~> 3 0 +2
<4— 'O W 0 — E toCO o
Z I
c0>
LU03
JZL_o
CO =3
I &E 2O 0O ^0 0 "O 0 0
. 0 0
o —jO r ~CM C 5>, § s5 ® 3^ m-O W
0 —
E 0TO TO OQ Z I
03
0
*— f—<S T3 .5C r
i pMENT^ < £# v II
r i&
uj < Q f /
i l l l f ctr oc | g £§
Z g r : : ^ S 'U - ' r
m * ui0 CL ( /) ot
K UJ & 0 Ss W W O R 3§9 N horf§ 1 U i g |
C, > ( - U J LU *5 5 —j hioc o £
^>, o Q £•°S/o uinw
— H am W i - LL 00 UJ O < Q
0 y< 2 .0 0 2< < UJ oo > S Z Z o CL jX5 g g o ■=* X -J1 UJ > O LU IjO > > LLi r o i d u jCL < Q CC
y V;1 ' i o>
4' ; Z 0 O
clq c O
uC H- <f Oi LUa. uJo 00»wpgD-n <L - r r l l !ruj0 Z m w/ U l ^ h Ca:w
iiugox O l ub - O h -
a: uj£\W «.-V- LU UJ
C/D < UJ aM ZC3
Q ?L L > - >
0f_zU J < <
c r z za LULU
N Ol—l-
« d 5x z Ok < o
LULU X
h C L l
Appendix page - 38
746689

Appendix-8:M iscellaneous
Sheffield Hallam University
11 July 2005
To Whom It May Concern:
Name:Student ID: Programme:Title of Research:
Commencement:Nationality:
Setya WINARNO 14030496PhD Research Programme (Full-time)Seismic Risk Management of Non-Engineered Buildings 1 October 2004 Indonesia
PROGRESS REPORT
I can confirm that Mr Winarno, registered PhD candidate with Sheffield Hallam University, has made 'excellent' progress in the first phase of his research programme. Phase 1 research has involved the development of research aims and objectives, outline research methodology and the draft of a comprehensive literature review. All of these aspects have been completed to a very high standard.
Phase 2 of the research is to carry out a pilot study to develop the research methodological approach in detail and to gather quantitative and qualitative data using a questionnaire survey, interviews and workshops. This will take place over the next six to eight months.
At this time, we are well satisfied with progress made and the planning for the next phase of the research programme.
Yours sincerely
Professor Dr. Alan Griffith Research Director of Studies.
Centre for the Built Environment School of Environment and DevelopmentUnit 9 Science Park City Campus Howard Street Sheffield SI 1WB UK Telephone +44 (0)114 225 4225 Fax +44 (0)114 225 3206 E-mail [email protected] This Centre is part-financed by the European Regional Development f und
Appendix page -

SheffieldH a llam U niversity
Faculty o f Developm ent and Society
Sheffield Hallam University Howard Street Sheffield SI 1 YvB UK
Telephone +44 (0)114 22.5 5555
www.sbu.ac.uk
To whom it may concern
Mr Setya WINARNOPhD R esearch Student Programme
PROGRESS REPORT
I am writing to confirm the current progress of PhD research being conducted by Mr Setya Winarno.
Mr W inarno has completed the critical evaluation of literature in connection with his studies. He has also completed the pilot study associated with his primary data collection. Both of these stages have been carried out to a very high standard of investigation and written presentation.
The next stage of the research is to collect primary data which is being undertaken during mid 2006 in Indonesia. The underpinning research methodology for this stage is clearly in place and it is expected that the data gathered will be of a high standard to facilitate the final stages of the research.
W e would take this opportunity to confirm that the overall progress o f Mr W inarno's PhD studies has been excellent and that all stages have been conducted most effectively and to a very high standard.
Should you require any further information then please do not hesitate to contact me.
Yours sincerely
Prof Man GriffithRese; yf Studies
Appendix page -

Sheffield Hallam University
11 July 2005
To Whom It May Concern:
Name:Student ID: Programme:Title of Research:
Commencement:Nationality:
Setya WINARNO 14030496PhD Research Programme (Full-time)Seismic Risk Management of Non-Engineered Buildings 1 October 2004 Indonesia
DATA COLLECTION
I can confirm that Mr Winarno, registered PhD candidate with Sheffield Hallam University, is currently conducting the data collection phase of his research programme.
Mr Winarno will be collecting information using a questionnaire survey, selected interviews and a number of workshop events.
Your assistance in connection with the research programme is kindly requested.
Yours sincerely
% Professor Dr. Alan Griffith Research Director of Studies.
Centre fo r the Built Environment School o f Environm ent and DevelopmentUnit 9 Science Park City Campus Howard Street Sheffield SI 1WB UK Telephone +44 (0)114 225 4225 Fax +44 (0)114 225 3206 E-mail [email protected] This Centre is part-financed by the European Regional Development Fund
Appendix page -

\ SheffieldH allam UniversityFaculty of Development and Society
Sheffield 1 lallam University Howard Street Sheffield S I 1 VC'It i K
Telephone +44 (0 )1 1 4 225 5555
www.shu.ac.uk
To whom it may concern
Mr Setya WINARNOPhD Research Student Programme
Mr Winarno's programme of PhD research is examining Seismic Risk Management o f Non- Engineered Buildings. He is currently at the stage of gathering data for his studies which will take place during mid-2006 in Indonesia.
Sheffield Hallam University would welcome your involvement in assisting Mr W inarno with this important stage of his PhD research. It is a programme of research which we believe will have considerable impact and usefulness to the future of building work in Indonesia.
We thank you for your kind interest and help in this research programme.
Yours sincerely
Professor Dr. Alan GriffithResearch Director of Studies
Appendix page -

heritage futuresG L A S G O WC A L E D O N I A NU N I V E R S I T Y
Ms Setya Winarno Owen Building Room 946 Sheffield Hallam University Howard Street Sheffield SI IWB
5 March 2007
Dear Setya
Thank you for your interest in the ‘Heritage and the Environment' conference to be held at Sabhal Mor Ostaig in the Isle of Skye, 19-23 June 2007. I am happy to confirm that your poster presentation has been accepted for the conference.
1 look forward to meeting you in Skye.
Kind regards
Professor Piona McLean
Appendix page - 43

Summary of activities in relation to the research project
1. Indonesian new spaper articleThe title: Seismic Risk Management: Yogyakarta please be ready to earthquake!
(Manajemen Risiko Gempa:Yogyakarta Bersiaplah)Name of newspaper: Kedaulatan RakyatThe purpose: Encouraging Yogyakarta people to be ready to earthquake
following tragic seismic event in Aceh 26 December 2004 Date: 10 January 2005Authors: Setya Winarno and Professor Dr Sarwidi
2. R esearch w orkThe title: Study on 27 May 2006 Earthquake Economic Loss on Residential
Houses in Yogyakarta City, a Comparison between the Estimation and the Actual Loss(Kajian Perbandingan Kerugian Bencana Gempa 27 Mei 2006 pada Sektor Rumah Tinggal Di Kota Yogyakarta Antara Kerugian Hasil Estimasi dan Kerugian Aktual)
Institution: Research Institute, Islamic University of Indonesia Authors: Professor Dr Sarwidi and Setya Winarno
3. Poster publicationa. The title: Framework for Guiding and Monitoring Seismic Risk Reduction o f
Non Engineered Buildings Name of event: Poster Competition and Networking Event Host institution: Leeds Metropolitan University Date: 9 May 2007
b. The title: Framework for Guiding and Monitoring Seismic Risk Reduction ofNon Engineered Buildings
Name of event: Conference of ‘Heritage and Environment’Host institution: Glasgow Caledonian University Date: 20 June 2007
4. There w ere two papers for journals
Appendix page - 44