seismic design of rc structures: a critical assessment in the framework of multi-objective...
TRANSCRIPT
1
SEISMIC DESIGN OF RC STRUCTURES: A CRITICAL ASSESSMENT IN
THE FRAMEWORK OF MULTI-OBJECTIVE OPTIMIZATION
NIKOS D. LAGAROS
Institute of Structural Analysis & Seismic Research, National Technical University of Athens,
9, Iroon Polytechniou Str., Zografou Campus, 157 80 Athens, Greece e-mail: [email protected]
SUMMARY
The assessment of seismic design codes has been the subject of intensive research work in an effort to
reveal weak points that originated from the limitations in predicting with acceptable precision the response
of the structures under moderate or severe earthquakes. The objective of this work is to evaluate the
European seismic design code, in particular the Eurocode 8 (EC8), when used for the design of 3D
reinforced concrete buildings, versus a Performance Based Design (PBD) procedure, in the framework of a
multi-objective optimization concept. The initial construction cost and the maximum interstorey drift for
the 10/50 hazard level are the two objectives considered for the formulation of the multi-objective
optimization problem. The solution of such optimization problems is represented by the Pareto front curve
which is the geometric locus of all Pareto optimum solutions. Limit-state fragility curves for selected
designs, obtained from the pareto front curves of the EC8 and PBD formulations, are developed for
assessing the two seismic design procedures. It was found that a linear analysis in conjuction with the
behavioural factor q of EC8 cannot capture the nonlinear behaviour of an RC structure. Consequently the
corrected EC8 Pareto front curve, using a nonlinear static procedure, differs significantly with regard to the
corresponding Pareto front obtained according to EC8. Furthermore, similar designs, with respect to the
initial construction cost, obtained through the EC8 and PBD formulations were found to exhibit different
maximum interstorey drifts and limit state fragility curves.
KEY WORDS: prescriptive design procedures, performance-based design, limit state fragility,
multi-objective optimization, reinforced concrete buildings.
2
1. INTRODUCTION
In the past, the requirements and provisions of the seismic design codes for buildings
have been based on experience and experimental observations and they were periodically
revised after disastrous earthquakes. Most of the current seismic design codes define a
single design earthquake that is used for assessing the structural performance against
earthquake hazard. As a consequence, these codes have many inherent assumptions built
in the design procedure regarding the behaviour of the structure against earthquake
loading. Severe damages caused by recent earthquakes made the engineering community
to question the reliability of the current seismic design codes [1,2]. Given that the
primary goal of contemporary seismic design is the protection of human life in
connection to economic design, it is evident that additional performance targets and
earthquake intensities should be considered in order to assess the structural performance
in many hazard levels. In the last decade the concept of performance-based structural
design (PBD), subjected to seismic loading conditions, was introduced [3-5]. In PBD
more accurate analysis procedures are implemented based on nonlinear structural
response. Most of the current seismic design codes belong to the category of the
prescriptive design procedures (or limit state design procedures), where if a number of
checks, expressed in terms of forces, are satisfied, then the structure is considered safe
and no collapse will occur. A typical limit state based design can be viewed as one (i.e.
ultimate strength) or two (i.e. serviceability and ultimate strength) limit state approach.
All contemporary seismic design procedures are based on the concept that a structure will
avoid collapse if it is designed to absorb and dissipate the kinetic energy that is induced in
it during the seismic excitation. Most of these seismic codes assume the capability of the
structure to absorb energy, through inelastic deformation by allowing a reduction of
external forces by the behaviour factor q.
3
ATC-40 [3] and FEMA-273 [4] were the first guidelines for performance-based
seismic rehabilitation of existing buildings, while in the report Vision 2000 [5] these
ideas were extended to the design process of new buildings. The main objective of this
kind of design procedures is to achieve more predictable and reliable levels of safety and
operability against natural hazards. According to PBD procedures, the structures should
be able to resist earthquakes in a quantifiable manner and to present target performance
levels of possible damages. PBD procedures are multi-level design approaches where
various levels of structural performance are considered. FEMA-356 [6] suggests, for
example, the following performance levels: operational level, immediate occupancy, life
safety and collapse prevention. For assessing the structural performance the guidelines
reccomend the use of various types of analysis methods: linear static, nonlinear static,
linear dynamic and nonlinear dynamic. The most commonly used approach is the
nonlinear static procedure (NSP). NSP allows for the direct evaluation of the
performance of the structure at each limit state as opposed to the prescriptive design
procedures of Eurocode 8 (EC8) [7], where the structure is designed for the ultimate
strength limit state implementing a linear analysis procedure.
The main objective of this study is to perform a critical assessment of the EC8
prescriptive design code versus a performance-based seismic design procedure in the
framework of a two-objective optimization concept. The proposed PBD procedure
employs three performance objectives leading to Pareto type optimization. The two
design procedures are compared with respect to the limit-state fragilities corresponding
to selected designs obtained from the two respective Pareto front curves.
4
2. PROGRESS ON STRUCTURAL DESIGN OPTIMIZATION OF RC
STRUCTURES
A number of studies have been published in the past dealing with structural optimization
of RC structures. One of the earliest studies on this subject is the work by Frangopol [8]
where the general formulation of the deterministic optimization problem is reviewed and
some of the main features of two general purpose deterministic optimization programs
are presented in developing the reliability-based optimization approach for the design of
both steel and RC framed structures. In a work by Kanagasundaram and Karihaloo [9] it
is demonstrated how the design process can be simulated mathematically to achieve
designs of RC structures which conform to the requirements of the Australian Standard
AS3600-1988 minimizing the construction cost. In the work by Moharrami and Grierson
[10], a computer-based method for the optimal design of RC buildings is presented,
where the width, depth and longitudinal reinforcement of member sections are
considered as design variables.
The optimization of 3D RC frames is discussed by Balling and Yao [11], where the
validity of the assumption that optimum concrete-section dimensions are insensitive to
the number, diameter, and longitudinal topology of reinforcing bars is studied. In a work
by Koskisto and Ellingwood [12] a decision model is presented for minimizing the
life-cycle cost of prefabricated concrete elements and structures. The decision model
utilizes principles of engineering economic analysis under uncertainty in considering
costs and benefits of construction, maintenance, repair, and consequences of failure. A
review of papers on cost optimization of concrete structures can be found in [13], where it
was concluded that there is a need to perform research on cost optimization of realistic
three-dimensional structures, especially large structures with hundreds of members
where optimization can result in substantial savings.
5
Performance-based optimum design of reinforced concrete buildings is a relatively
new field of research. The performance criteria are imposed as constraints that affect the
initial construction cost that has to be minimized. Based on this approach Ganzerli et al.
[14] proposed an optimization methodology for seismic design considering performance
based constraints. Lagaros et al. [15] proposed an automated procedure for the
minimization of the eccentricity between the mass center and the rigidity center.
Furthermore, in the work by Li and Cheng [16], the optimal decision model of the target
value of performance-based structural system reliability of RC frames is established
according to the cost-effectiveness criterion.
Chan and Wang [17] presented a numerical approach based on a nonlinear cracking
analysis methods in the framework of an optimization algorithm for the stiffness-based
optimum design of tall RC buildings. A general approach to the multiobjective
reliability-based optimum designs of prestressed concrete beams is presented in the work
by Barakat et. al [18], where all behavior and side constraints specified by the American
Concrete Institute code for prestressed concrete are incorporated. In the work by Chan
and Zou [19] an optimization technique is presented for the elastic and inelastic drift
performance-based design of reinforced concrete buildings.
3. SEISMIC DESIGN PROCEDURES
The majority of the seismic design codes follow the standard procedure of site selection
and establishement of conceptual, preliminary and final design stages. According to a
prescriptive design code the strength of the structure is evaluated against earthquake
hazard at one limit state between, life-safety and near collapse, using a response spectrum
corresponding to one design earthquake [7]. In addition, serviceability limit state is
usually checked in order to ensure that the structure will not deflect or vibrate excessively
during its lifetime. On the other hand, PBD follows a different design concept which
takes into consideration, apart from the seismic characteristics of the site selection and
the establishement of the design stages, the construction process and the maintenance of
the building, in order to achieve a more reliable and predictable seismic performance over
its life.
3.1. Prescriptive seismic design procedures
According to the European design codes a number of checks must be considered in order
to ensure that the structure will meet the code requirements. Each candidate design is
assessed with respect to these constraints. All Eurocode 2 (EC2) [20] checks must be
satisfied for the gravity loads using the following load combination
6
kiiQ
kiiQ
1.35 " "1.50d kjjS G= +∑ ∑ (1)
where “+” implies “to be combined with”, the summation symbol “Σ” implies “the
combined effect of”, Gkj denotes the characteristic value “k” of the permanent action j and
Qki refers to the characteristic value “k” of the variable action i. If all required constraints
are satisfied for the gravity loads, a multi-modal response spectrum analysis is performed
and earthquake loading is considered using the following load combination
2" " " "d kj d ijS G E ψ= + +∑ ∑ (2)
where Ed is the design value of the seismic action for the two components (longitudinal
and transverse), respectively and ψ2i is the combination coefficient for the
quasi-permanent action i, here taken equal to 0.30.
3.2. Performance-based design procedure
Performance-based seismic design has the following distinctive features with respect to
the prescriptive design codes: (i) Allows the owner, and structural engineer to choose
both the appropriate level of seismic hazard and the corresponding performance level of

7
the structure. (ii) The structure is designed to meet a series of combinations of hazard
levels in conjunction with corresponding performance levels. In PBD performance
targets are incorporated in the conceptual design process, consequently performance
assessment becomes more of a verification process of an efficient design rather than a
design improvement process that may require radical changes of the initial design
concept [21].
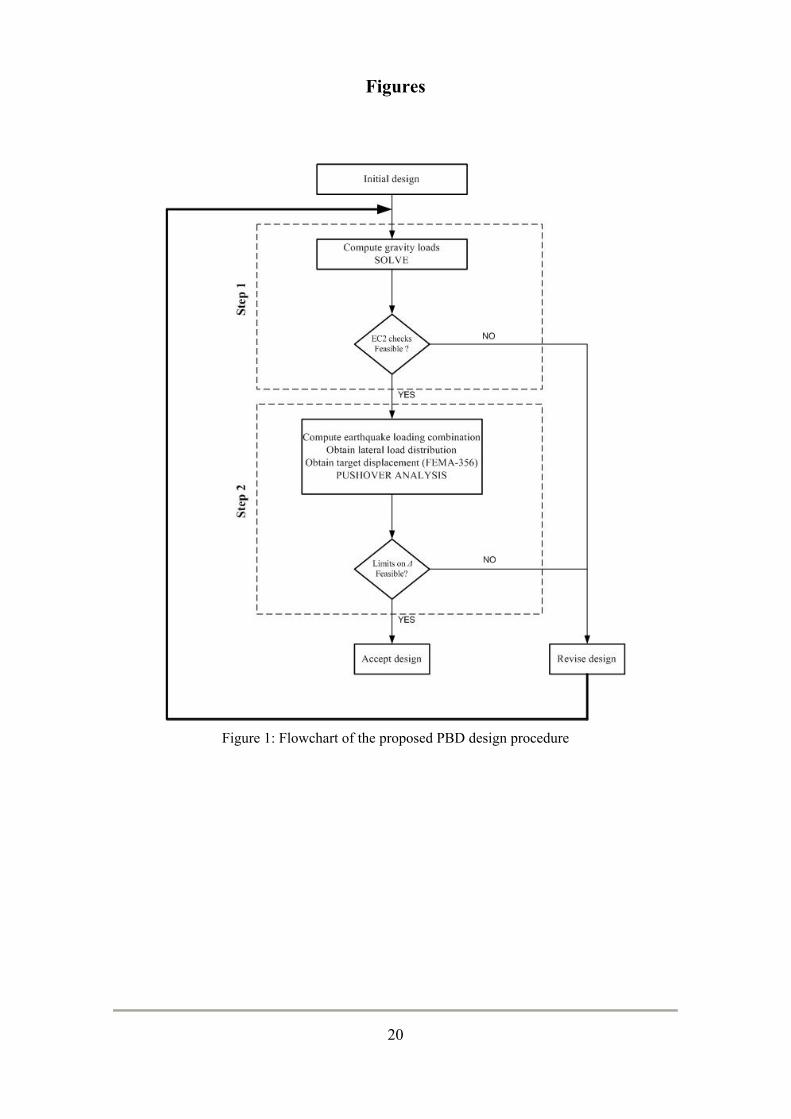
The applied PBD concept [22] is a displacement-based design procedure where the
design criteria and the capacity demand levels are expressed in terms of displacements
rather than forces [23,24]. The main part in a performance-based seismic design
procedure is the definition of the performance objectives that will be used. The
implemented in this work PBD process can be described with the following two steps:
1) Proportioning of the longitudinal and transverse steel reinforcement of all
members on the basis of the serviceability limit state.
2) Use of the NSP in order to estimate the structural capacities of the structure in the
different intensity levels employed. Revise the steel reinforcement and the
dimension of the members cross-section so that the capacities exceed the seismic
demands [24].
The completion of Step 1 is prerequisite for Step 2 as the structural capacity depends both
on steel reinforcement and the dimensions of members cross-section.
The constraints considered for Step 2 of the PBD procedure are related to the
maximum interstorey drift limits θ, which is the largest value of the height-wise peak
interstorey drift ratios for each hazard level. This is a commonly used measure of both
structural and non-structural damage because of its close relationship to plastic rotation
demands on individual beam-column connection assemblies.
In this study three performance objectives are considered corresponding to hazard
levels 50, 10 and 2 percent probabilities of exceedance in 50 years. The drift limits θ, for
the three performance objectives considered, are equal to 0.4, 1.8 and 3.0 percent,
respectively, according to Ghobarah [25]. The θ values obtained at the three hazard levels
are also used for the calculation of the limit state cost, as will be described in a following
section. The flowchart of the PBD procedure applied in this study is shown schematically
in Figure 1.
4. MULTI-OBJECTIVE OPTIMIZATION
In practical applications of sizing optimization problems, the material weight itself rarely
gives a representative measure of the performance of the structure. In fact, several
conflicting and usually incommensurable criteria usually exist in real-life design
problems that have to be dealt with simultaneously. This situation forces the designer to
look for a good compromise among the conflicting requirements. Problems of this kind
constitute multi-objective optimization problems. In general, a multi-objective
optimization problem can be stated as follows:
8
s
Tmax,10 /50
8
min [ ( ), ( )]where ( ) ( ) ( ) ( )
subject to ( ) 0 =1,...,
or ( ) 0 =1,...,
IN
IN b sl cl
ECj
PBDj
CC C C C
g j k
g j k
θ∈
= + +
≤
≤
s s ss s s
s
s
F
(4)
where s represents the design vector, F is the feasible region where all the constraint
functions gEC8 or gPBD are satisfied for the EC8 and the PBD formulations, respectively.
The objective functions considered are the initial construction cost CIN and the maximum
interstorey drift for the 10% in 50 years hazard level θmax,10/50. CIN(s) refers of the total
initial construction cost for the structure, while Cb(s), Csl(s) and Ccl(s) refer of the total
initial construction cost for the beams, the slabs and the columns respectively. The term
initial cost of a new structure refers to the cost during its construction stage. The initial
cost is related to the material and the labour cost for the construction of the building
which includes concrete, steel reinforcement, labour cost and the non-structural
components cost.
Several methods have been proposed for treating structural multi-objective
optimization problems [26,27]. In this work, the Nondominated Sorting Evolution
Strategies II (NSES-II) algorithm, proposed by Lagaros and Papadrakakis [28], is used in
order to handle the two-objective optimization problem at hand. This algorithm is
denoted as NSES-II(μ+λ) or NSES-II(μ,λ), depending on the selection operator, as will be
discussed in a following paragraph.
When the ES algorithm is used for the solution of a mixed (having both continuous
and discrete design variables) single-objective structural optimization problem, each
candidate design is termed as ‘an individual’ and is equipped with a set of parameters:
9
c
γd
c σ
d c d
nnd
n n nc
[( , , ( , , )] (Ι ,Ι )
Ι =D R
Ι =R R [ π,π]+
+
= ) ∈
×
× × − a
p s γ s σ α
(5)
where sd and sc are the vectors of discrete and continuous design variables, respectively.
Vectors γ, σ and α are distribution parameter vectors. Vector γ corresponds to the
variances of the Poisson distribution used for the mutation operator of the discrete
variables, vector corresponds to the standard deviations (1 ≤ nσ ≤ nc) of the
normal distribution used for the mutation operator of the continuous variables, while the
vector corresponds to the inclination angles (nα = (nc-nσ/2)(nσ-1)) defining
linearly correlated mutations of the continuous design variables sc. A more detailed
description of the ES algorithm can be found in the study of Lagaros et. al [29].
σnR +∈σ
n[ π,π] a∈ −α
Let ( )1 μp { , , }= …B g p p denote a parent population of individuals pi that belong to
the g-th generation. If μ and λ denote the number of parents and offspring of a population,
respectively, the three genetic operators used in this mixed ES method can be described
by the following mappings:
d c d c
d c d c
d c d c
rec : (Ι ,Ι ) (Ι ,Ι ) recombination operatormut : (Ι ,Ι ) (Ι ,Ι ) mutation operatorsel : (Ι ,Ι ) (Ι ,Ι ) selection operator, { or }
μ λ
λ λ
k k μμ k λ μ+ λ
→→→ ∈
(6)
In the selection operator when the (μ+λ) selection scheme is adopted, the parents of the
next generation are chosen from a population that consists of the μ parents and the λ
offspring of the current generation (k=μ+λ), while when the (μ, λ) selection scheme is
adopted the parents of the next generation are the best μ offspring of the current
generation (k=λ). Based on Eq. (6) a single iteration of the mixed discrete ES, which is a
step from the parent population ( )gpB to the next generation parent population ( )1g
p+B is
defined by the mapping:
μES d c d copt : (Ι ,Ι ) (Ι ,Ι )→ μ (7)
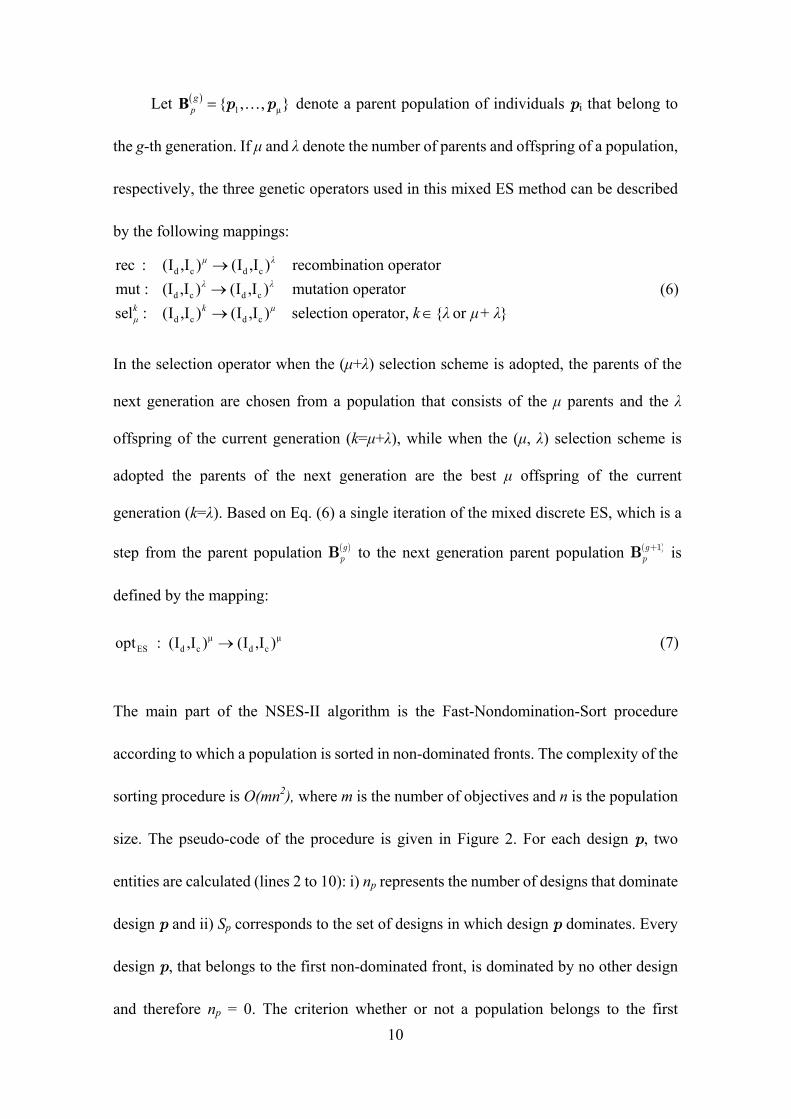
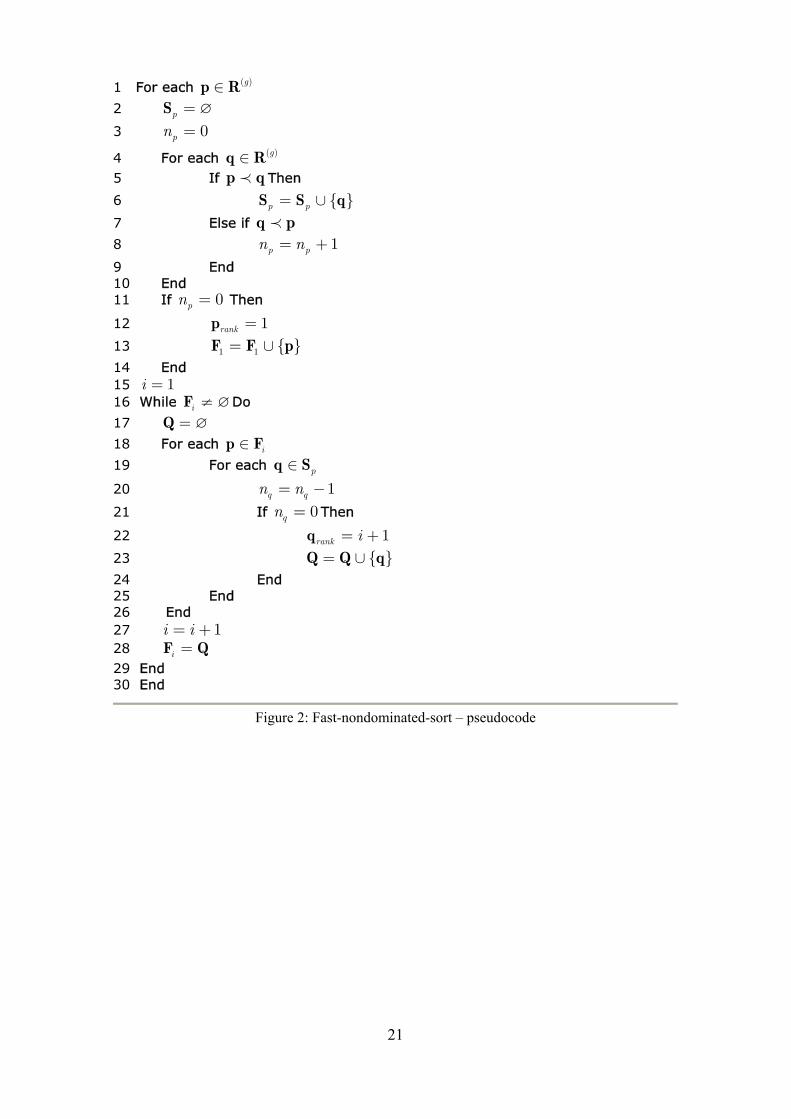
The main part of the NSES-II algorithm is the Fast-Nondomination-Sort procedure
according to which a population is sorted in non-dominated fronts. The complexity of the
sorting procedure is O(mn2), where m is the number of objectives and n is the population
size. The pseudo-code of the procedure is given in Figure 2. For each design p, two
entities are calculated (lines 2 to 10): i) np represents the number of designs that dominate
design p and ii) Sp corresponds to the set of designs in which design p dominates. Every
design p, that belongs to the first non-dominated front, is dominated by no other design
and therefore np = 0. The criterion whether or not a population belongs to the first 10

nondominated front is given in lines 11-14 of the pseudocode, while in lines 17-28 the
remaining fronts are created.
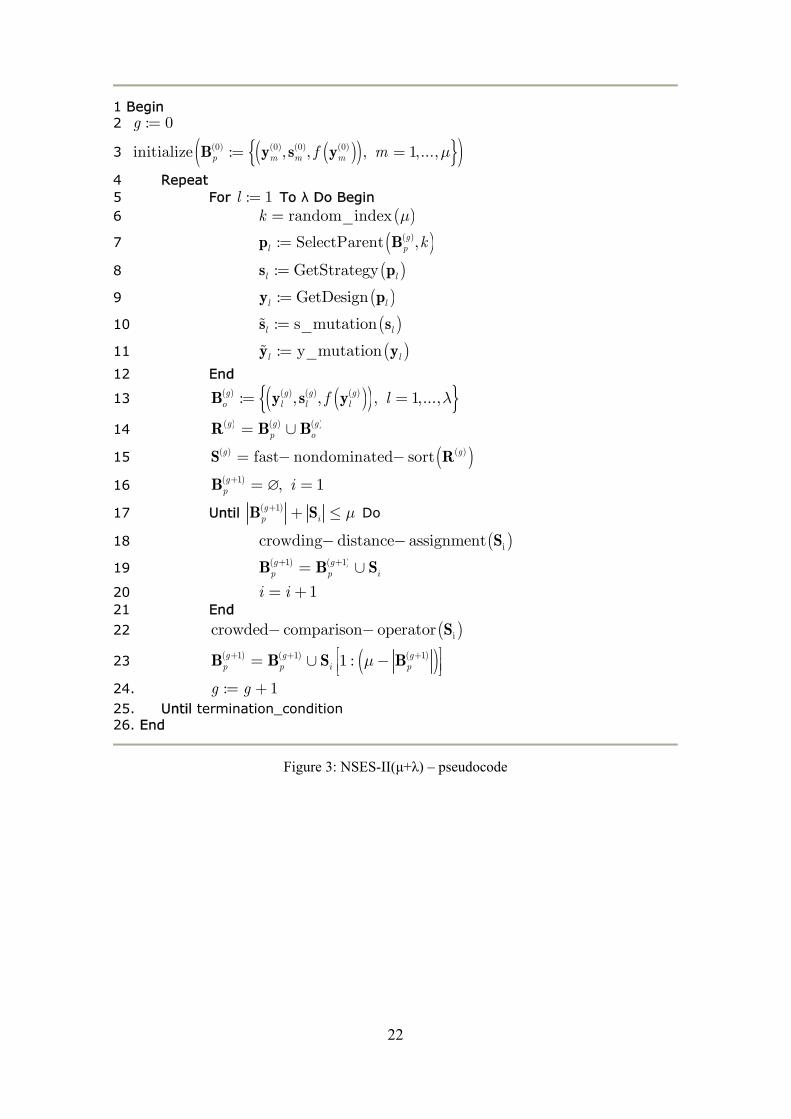
The pseudo code of the NSES-II(μ+λ) algorithm is shown in Figure 3. The first
twelve lines correspond to the ES(μ+λ) part of the algorithm. The next twelve lines
correspond to the NSES-II part of the algorithm. After the offspring population is created
(line 13), the combined parent and offspring population is sorted by the
Fast-Nondomination-Sort (line 15). After the sorting is complete, the first nondominated
front F1 will contain the nondominated designs. If the amount of designs contained in F1
is less than μ, then all the designs are copied to the parent population ( )1gp+B of the next
generation. If the number of nondominated designs in ( )1gp+B is less than μ, then ( )1g
p+B is
populated from the designs of the second nondominated front, the third nondomination
front and so on. The process continues until the number of designs in ( )1gp+B is equal to or
greater than μ (lines 17 to 21). If the number of designs in ( )1gp+B is equal to μ, the
algorithm continues with the next generation. Usually, ( )1gp+B will contain more than μ
solutions, so we must chose which of the designs of the last nondominated front that
entered ( )1gp+B , will be kept. This procedure takes place in lines 22 to 23, where the last
front is sorted according to the crowded comparison operator and then an appropriate
number of the least crowded designs are chosen so that the size of population ( )1gp+B is
exactly μ.
5. NUMERICAL STUDY
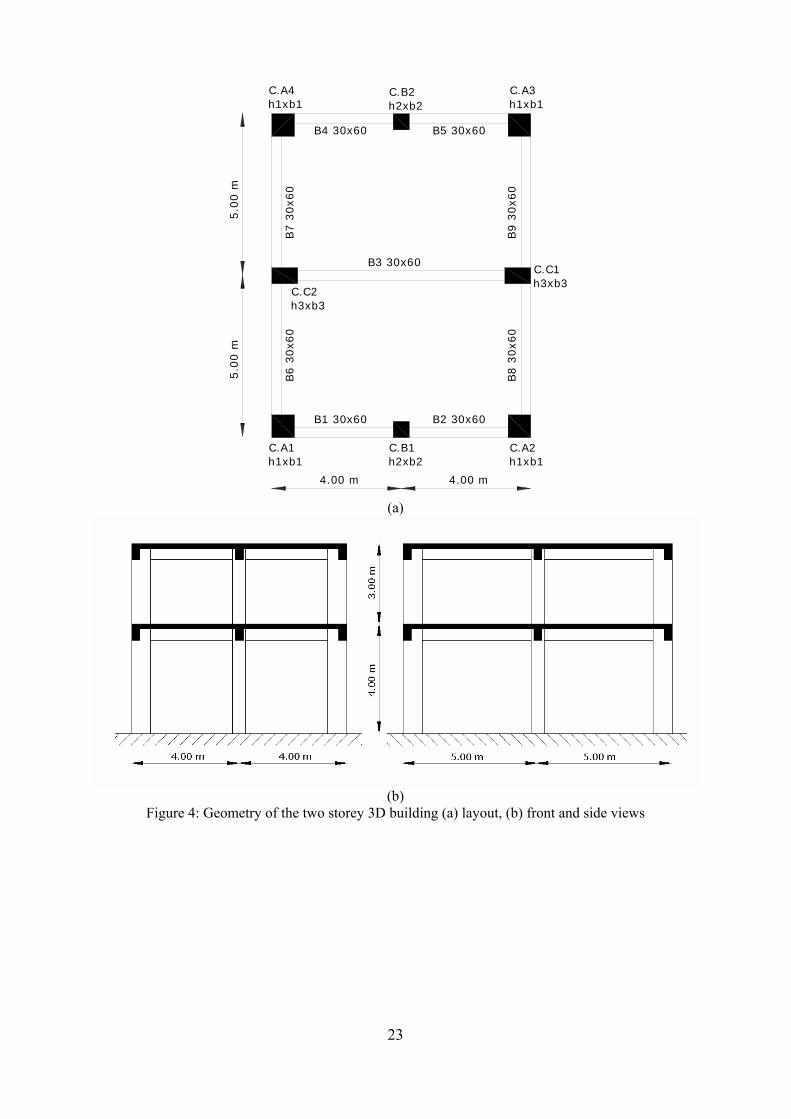
The two storey 3D RC building, shown in Figure 4, has been considered in order to
perform the critical assessment of the seismic design procedures. In the framework of this
11
12
study, the RC building has been optimaly designed to meet the Eurocode (EC2 and EC8)
or the PBD requirements. The Pareto fronts obtained, following these two formulations,
have been used for this assessment. In the case of the EC8 the lateral forces were derived
from the design response spectrum (5%-damped elastic spectrum divided by the
behaviour factor q=3.0) at the fundamental period of the building. Concrete of class
C16/20 (nominal cylindrical strength of 16MPa) and class S500 steel (nominal yield
stress of 500MPa) are assumed. The base shear is obtained from the response spectrum
for soil type B (stiff soil θ = 1.0, with characteristic periods Τ1 = 0.15sec and Τ2 =
0.60sec) and a PGA of 0.31 g. Moreover, the importance factor γI was taken equal to 1.0,
while damping correction factor is equal to 1.0, since a damping ratio of 5% has been
considered. The elastic response spectra corresponding to the three hazard levels, with
50, 10 and 2 percent probability of exceedance in 50 years are derived from the PGA
values obtained from hazard curves given by Papazachos et al. [30] (Table 1).
The slab thickness is equal to 15 cm and is considered to contribute to the moment
of inertia of the beams with an effective flange width. In addition to the self weight of the
beams and the slab, a distributed dead load of 2 kN/m2, due to floor finishing and
partitions and imposed live load with nominal value of 1.5 kN/m2, is considered, in the
combination with gravity loads (“persistent design situation”). Nominal dead and live
loads are multiplied by load factors of 1.35 and 1.5, respectively (Eq. 1). Following EC8,
in the seismic design combination, dead loads are considered with their nominal value,
while live loads with 30% of their nominal value (Eq. 2).
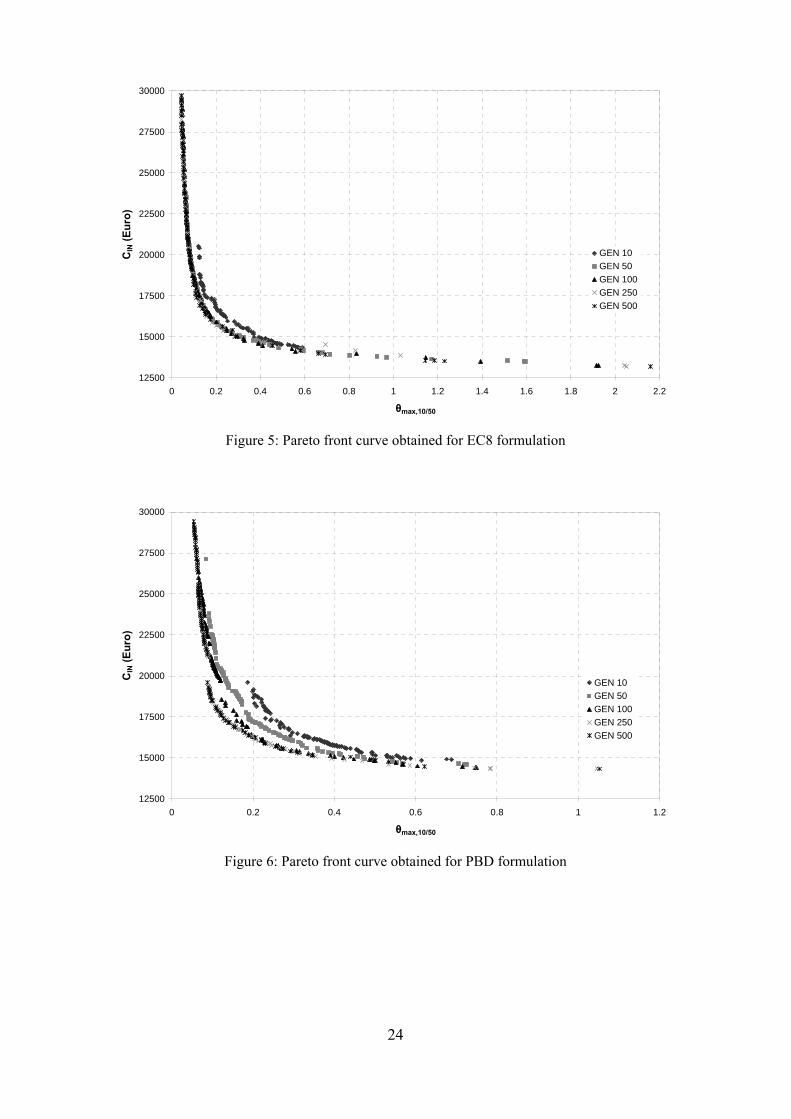
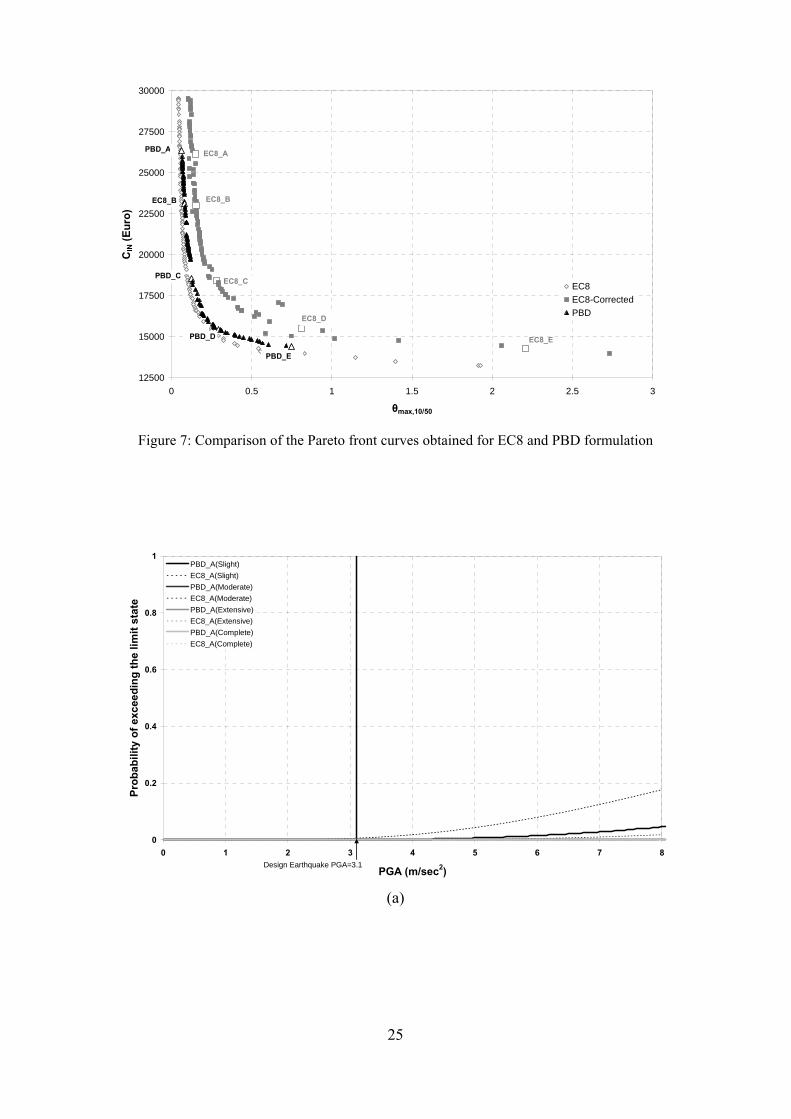
5.1. Solving the multi-objective optimization problem
In the first part of this study the two-criteria design optimization problem is considered,
and the efficiency of the NSES-II(μ+λ) algorithm is examined. The initial construction
cost CIN and the maximum interstorey drift for the 10/50 hazard level θmax,10/50 constitute
13
the two criteria. For all test cases examined, a NSES-II(100+100) optimization scheme is
employed. The Pareto front curves obtained after 10, 50, 100, 250 and 500 generations
based on EC8 and PBD formulations are shown in Figures 5 and 6, respectively. As can
be seen, 100 generations are sufficient to obtain a good quality Pareto front curve. For
this reason the two Pareto front curves obtained after 100 generations are used for the
comparative part of this study.
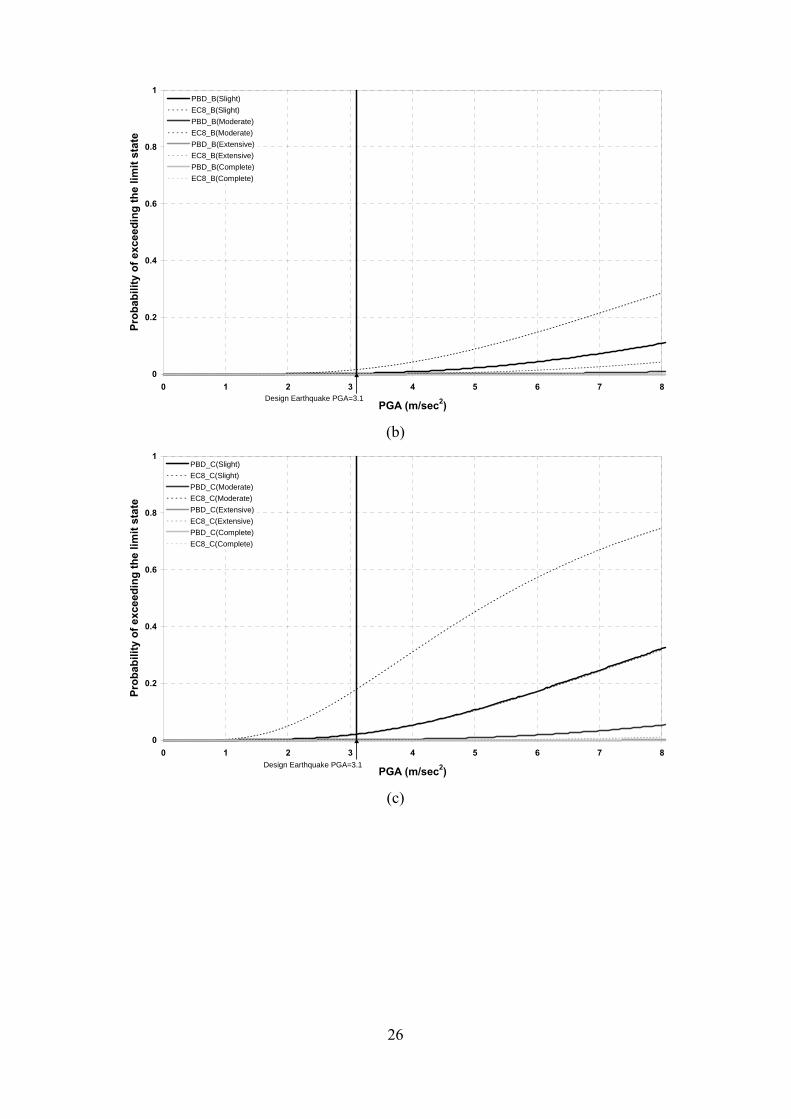
5.2. Assessment of design based on EC8 and PBD
In the second part of this work the difference between EC8 and PBD formulations is
demonstrated in terms of the Pareto front curves and limit state fragilities of selected
designs. The EC8 formulation implements a linear analysis procedure where the
behavioural factor q is used to take into account the inelastic behaviour of the structure.
Most of the contemporary seismic design codes rely to the ability of the structure to
absorb energy through inelastic deformation using the reduction or behaviour factor q.
The capacity of a structure to resist seismic actions in the nonlinear range generally
permits the design seismic loads to be smaller than the loads corresponding to a linear
elastic response. Thus, the seismic loads are reduced by the behaviour factor q. The
numerical validation of the behavior factor has become a subject of research [31,32] in
order to check the validity of design assumptions and to make structural performance
more predictable from engineering point of view. According to EC8 the nonlinear
deformation of the structure is equal to q times the corresponding deformation of the
linear analysis. In order to make equivalent the Pareto front curves, obtained through the
EC8 and PBD formulations, the EC8 Pareto front curve is corrected with respect to the
maximum interstorey drifts obtained by the NSP used for the calculation of the structural
response in the case of PBD. All three Pareto front curves, i.e. the EC8, PBD and
EC8_Corrected Pareto front curves, are depicted in Figure 7. Alhtough the EC8 and EC8
14
Pareto front curves almost coincide, the EC8_Corrected Pareto front curve is much
different than the original one since the nonlinear behaviour is not accounted reliably
through the behavioural factor q.
In the second part of this assessment five designs are selected distributed along the
EC8_Corrected and the PBD Pareto front curves, in order to compare them with respect
to the limit state fragility curves. Two of the designs, i.e. designs A and E, correspond to
the two extreme ends of the two Pareto front curves. Designs PBD_E and EC8_E
correspond to the optima, where the initial construction cost (CIN) is the dominant
criterion. Furthermore, designs PBD_A and EC8_A correspond to the optimum designs
obtained if the maximum interstorey drift (θmax,10/50) is the dominant criterion. The other
three designs are distributed along the Pareto front curves and have been selected with
respect to their initial construction cost. The cross sections of the designs A to E obtained
for the EC8 and the PBD formulations, along with the initial construction cost and the
maximum interstorey drift for the 10/50 hazard level, are given in Tables 2 and 3,
respectively. As can be seen in Table 2 there are two values for the maximum interstorey
drift for the designs of the EC8 formulation. Those obtained through the linear design
procedure and the corrected ones obtained using a NSP. Comparing the corresponding
designs of EC8 and PBD formulations, it can be seen that, although they correspond to
similar values of the initial construction cost, the corresponding maximum interstorey
drift values of the EC8 designs are two times larger than those of the PBD formulation.
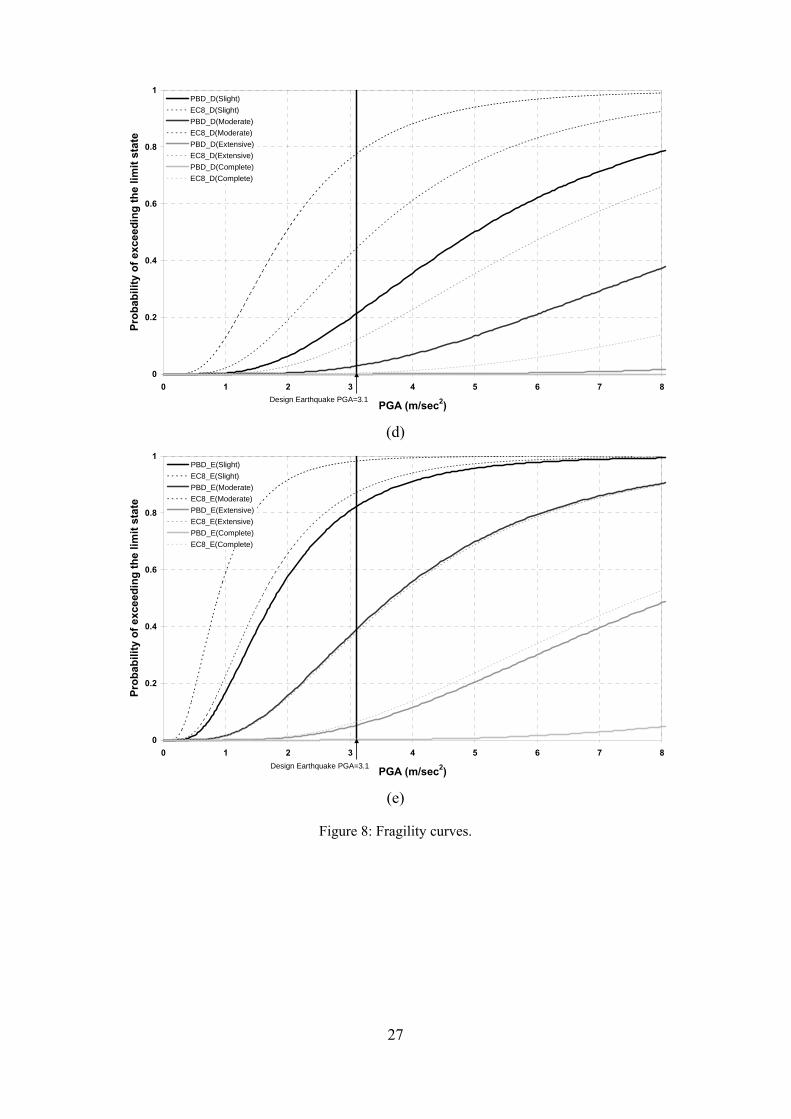
Figures 8a to 8e depict the limit state fragility curves for low-rise RC buildings for
the High Code Design Level of the earthquake loss estimation methodology (HAZUS)
[33] for the Slight, Moderate, Extensive and Complete structural damage states. The
damage states, defined with respect to the drift limits according to HAZUS for this type
of structure, are equal to 0.5%, 1.0%, 3.0% and 8.0% for Slight, Moderate, Extensive and
Complete structural damage states, respectively. In these Figures, the PGA value for the
15
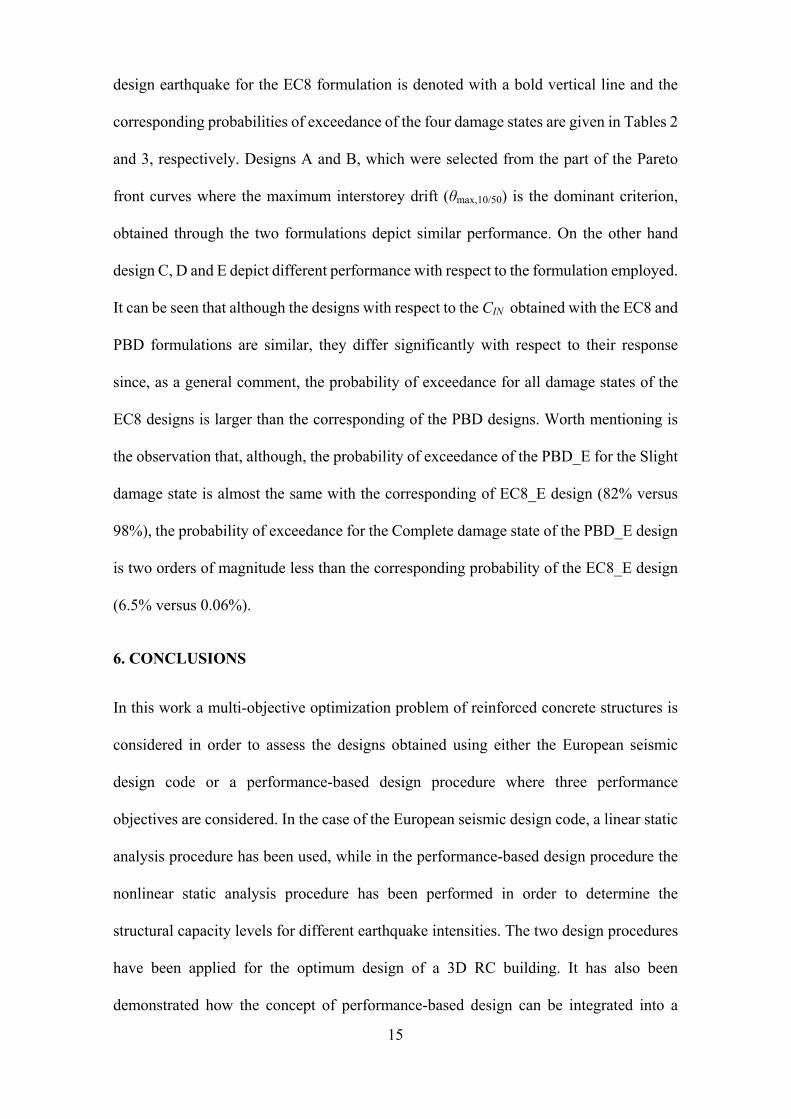
design earthquake for the EC8 formulation is denoted with a bold vertical line and the
corresponding probabilities of exceedance of the four damage states are given in Tables 2
and 3, respectively. Designs A and B, which were selected from the part of the Pareto
front curves where the maximum interstorey drift (θmax,10/50) is the dominant criterion,
obtained through the two formulations depict similar performance. On the other hand
design C, D and E depict different performance with respect to the formulation employed.
It can be seen that although the designs with respect to the CIN obtained with the EC8 and
PBD formulations are similar, they differ significantly with respect to their response
since, as a general comment, the probability of exceedance for all damage states of the
EC8 designs is larger than the corresponding of the PBD designs. Worth mentioning is
the observation that, although, the probability of exceedance of the PBD_E for the Slight
damage state is almost the same with the corresponding of EC8_E design (82% versus
98%), the probability of exceedance for the Complete damage state of the PBD_E design
is two orders of magnitude less than the corresponding probability of the EC8_E design
(6.5% versus 0.06%).
6. CONCLUSIONS
In this work a multi-objective optimization problem of reinforced concrete structures is
considered in order to assess the designs obtained using either the European seismic
design code or a performance-based design procedure where three performance
objectives are considered. In the case of the European seismic design code, a linear static
analysis procedure has been used, while in the performance-based design procedure the
nonlinear static analysis procedure has been performed in order to determine the
structural capacity levels for different earthquake intensities. The two design procedures
have been applied for the optimum design of a 3D RC building. It has also been
demonstrated how the concept of performance-based design can be integrated into a
16
structural optimum design procedure in order to obtain optimum designs that fulfill the
provisions of a contemporary framework for seismic design of RC structures, like the
three performance objectives employed in this study.
Two are the most significant findings of this study:
(i) The corrected Pareto front curve, with respect to the maximum interstorey drift, for
the 10 percent in 50 years hazard level implementing a nonlinear static procedure
obtained through the Eurocode 8 formulation, is much different than the
corresponding Pareto front obtained with a linear analysis procedure. The
numerical tests revealed specific weakness in using the behaviour factor q adopted
by the Eurocode 8. This was revealed by the inability of the hebavioural factor q,
recommended by Eurocode 8, to reliably represent the nonlineat behaviour of the
structure.
(ii) Furthermore, for the test example considered it has been shown that similar
designs, in terms of initial construction cost, designed in accordance to the
European seismic design code, are more vulnerable to future earthquakes compared
to the corresponding designs obtained with the performance-based design
procedure. This vulnerability increases for designs selected from the part of the
Pareto front curves where the initial construction cost is the dominant criterion.
Even though these conclusions cannot be generalized, they provide an indication of
the quality of the designs obtained according to a prescriptive design code and to a
performance-based design procedure.
REFERENCES
1. Browning, J., Proportioning earthquake-resistant RC frames in central/eastern U.S., Earthquake Engineering & Structural Dynamics 2002; 31(6): 1267-1280.
2. Qiang Xue., Need of performance-based earthquake engineering in Taiwan: a lesson from the Chichi earthquake, Earthquake Engineering & Structural Dynamics 2000; 29(11): 1609-1627.
17
3. Applied Technology Council (ATC), Methodology for evaluation and upgrade of reinforced concrete buildings, Report N. ATC-40, California Seismic Safety Commission, Sacramento, California, 1996.
4. Applied Technology Council (ATC), NEHRP Guidelines for seismic rehabilitation of buildings, Report No. FEMA-273, Federal Emergency Management Agency, Washington, DC, 1997.
5. Structural Engineers Association of California (SEAOC), Vision 2000 a framework for performance-based seismic engineering, Structural Engineers Association of California, Sacramento, California, 1995.
6. American Society of Civil Engineers. Prestandard and Commentary for the Seismic Rehabilitation of Buildings, FEMA-356, Federal Emergency Management Agency, Washington, DC, 2000.
7. Eurocode 8. Design provisions for earthquake resistance of structures. ENV1998, CEN European Committee for standardization, Brussels, 1996.
8. Frangopol, D.M., Computer-automated design of structural systems under reliability-based performance constraints, Engineering Computations 1986; 3(2): 109-115.
9. Kanagasundaram, S., Karihaloo, B.L., (1990) Minimum cost design of reinforced concrete structures, Computers & Structures 1991; 41(6), Pages 1357-1364.
10. Moharrami, H.., Grierson, D.E., Computer-automated design of reinforced concrete frameworks, Journal of Structural Engineering 1993; 119(7): 2036-2058.
11. Balling, R.J., Yao, X., Optimization of reinforced concrete frames, Journal of Structural Engineering 1997; 123(2): 193-202.
12. Koskisto, O.J., Ellingwood, B.R., Reliability-based optimization of plant precast concrete structures, Journal of Structural Engineering 1997; 123(3): 298-304.
13. Sarma, K.C., Adeli, H., Cost optimization of concrete structures, Journal of Structural Engineering 1998; 124(5): 570-578.
14. Ganzerli, S., Pantelides, C.P., Reaveley, L.D. Performance-based design using structural optimization. Earthquake Engineering Structural Dynamics 2000; 29(11): 1677-1690.
15. Lagaros, N.D., Papadrakakis, M., Bakas, N., Earthquake resistant optimum design of 3D reinforced concrete structures, Earthquake Engineering 2006; 10(4): 533-564.
16. Li, G., Cheng, G., Optimal decision for the target value of performance-based structural system reliability, Structural and Multidisciplinary Optimization 2001; 22(4): 261-267.
17. Chan, C.-M., Wang, Q., Nonlinear stiffness design optimization of tall reinforced concrete buildings under service loads, Journal of Structural Engineering 2006; 132(6): 978-990.
18. Barakat, S., Bani-Hani, K., Taha, M.Q., Multi-objective reliability-based optimization of prestressed concrete beams, Structural Safety 2004; 26(3): 311-342.
19. Chan, C.-M., Zou, X.-K., Elastic and inelastic drift performance optimization for reinforced concrete buildings under earthquake loads, Earthquake Engineering Structural Dynamics 2004; 33(8): 929-950.
20. European Committee for Standardization. Draft for Development of Eurocode 2: Design of concrete structures. ENV 1992-1-1, 1992.
21. Krawinkler, H., Zareian, F., Medina, R.A., Ibarra, L.F., Decision support for conceptual performance-based design, Earthquake Engineering Structural Dynamics 2006; 35(1), 115-133.
22. Lagaros N.D., Fotis A.D., Krikos S.A., Assessment of seismic design procedures based on the total cost, Earthquake Engineering Structural Dynamics 2006; 35(11): 1381-1401.
23. Sullivan, T.J., Calvi, G.M., Priestley, M.J.N., Kowalsky, M.J., The limitations and performances of different displacement based design methods, Journal of Earthquake Engineering, 2003; 7(1): 201-241
24. Panagiotakos, T.B., Fardis, M.N., A displacement-based seismic design procedure for RC buildings and comparison with EC8, Earthquake Engineering & Structural Dynamics 2001; 30, 1439-1462.
25. Ghobarah, A., On drift limits associated with different damage levels, International Workshop on Performance-Based Seismic Design, June 28-July 1, 2004.
26. Coello Coello C.A., An updated survey of GA-based multi-objective optimization techniques. ACM Computing Surveys 2000; 32(2): 109-143.
27. Marler R.T., Arora J.S., Survey of multi-objective optimization methods for engineering, Structural and Multidisciplinary Optimization 2004; 26(6): 369-395.
28. Lagaros, N.D., Papadrakakis, M., Robust seismic design optimization of steel structures, Structural and Multidisciplinary Optimization 2006; (in print).
29. Lagaros ND, Fragiadakis M, Papadrakakis M Optimum design of shell structures with stiffening beams. AIAA Journal 2004; 42(1): 175-184.

18
30. Papazachos, B.C., Papaioannou, Ch.A., Theodulidis, N.P., Regionalization of seismic hazard in Greece based on seismic sources, Natural Hazards 1993; 8(1): 1-18.
31. Fajfar, P., Towards nonlinear methods for the future seismic codes, In Seismic Design Practice into the Next Century, Booth (ed.), Balkema, 1998.
32. Mazzolani, F.M., Piluso, V., The theory and design of seismic resistant steel frames, E & FN Spon, 1996.
33. FEMA-National Institute of Building Sciences. HAZUS-MH MR1, Multi-hazard Loss Estimation Methodology Earthquake Model, Washington, DC, 2003
19
Tables
Table 1: Seismic hazard levels [30]
Event Recurrence Interval Probability of Exceedance PGA (g)
Frequent 21 years 90% in 50 years 0.06 Occasional 72 years 50% in 50 years 0.11
Rare 475 years 10% in 50 years 0.31 Very Rare 2475 years 2% in 50 years 0.78
Table 2: Selected designs from the Pareto front of the EC8 formulation.
Design EC8_A EC8_B EC8_C EC8_D EC8_E
h1 0.70 0.60 0.55 0.50 0.25 b1 1.20 1.05 0.65 0.30 0.25 h2 1.20 1.20 1.00 0.65 0.60 b2 0.55 0.35 0.25 0.25 0.25 h3 0.30 0.30 0.25 0.12 0.30 b3 1.20 1.20 1.20 1.00 0.65
CIN (€) 25875.75 23016.52 18434.22 15508.38 14271.22 θmax,10/50-Linear (%) 0.055 0.064 0.10 0.25 0.54 θmax,10/50-NSP (%) 0.11 0.15 0.28 0.81 2.21
Limit state Probability of exceeding the limit state (%)
Slight 0.60 1.58 17.87 77.60 98.29 Moderate 0.01 0.05 1.98 44.36 87.24 Extensive 0.00 0.00 0.00 12.03 37.94 Complete 0.00 0.00 0.00 00.38 6.48
Table 3: Selected designs from the Pareto front of the PBD formulation.
Design PBD_A PBD_B PBD_C PBD_D PBD_E
h1 0.55 0.50 0.25 0.25 0.25 b1 1.20 1.20 1.20 0.40 0.30 h2 0.70 0.65 0.90 0.75 0.55 b2 0.70 0.50 0.25 0.25 0.25 h3 0.75 0.50 0.45 0.25 0.25 b3 1.20 1.10 0.80 1.20 0.80
CIN (€) 26362.64 23107.72 18365.51 15474.84 14396.11 θmax,10/50 (%) 0.065 0.084 0.13 0.30 0.75
Limit state Probability of exceeding the limit state (%)
Slight 0.05 0.24 2.03 21.29 82.24 Moderate 0.00 0.00 0.07 2.83 39.00 Extensive 0.00 0.00 0.00 0.01 5.20 Complete 0.00 0.00 0.00 0.00 0.06
Figures
Figure 1: Flowchart of the proposed PBD design procedure
20
1 For each ( )g∈p R2 p = ∅S3 0pn =4 For each ( )g∈q R5 If Then ≺p q6 { }p p= ∪S S q7 Else if ≺q p8 1p pn n= +9 End 10 End 11 If Then 0pn =12 1rank =p13 { }1 1= ∪F F p14 End 15 1i =16 While Do i ≠ ∅F17 = ∅Q18 For each i∈p F19 For each p∈q S20 1q qn n= −21 If Then 0qn =22 1rank i= +q23 { }= ∪Q Q q24 End 25 End 26 End 27 1i i= +28 i =F Q29 End 30 End
Figure 2: Fast-nondominated-sort – pseudocode
21
1 Begin 2 : 0g =
3 ( ) ( ) ( ) ( )( )( ){ }( )0 0 0 0initialize : , , , 1,...,p m m mf m μ= =B y s y
4 Repeat 5 For To λ Do Begin : 1l =6 ( )random_indexk μ=
7 ( )( ): SelectParent ,gl p k=p B
8 ( ): GetStrategyl l=s p9 ( ): GetDesignl l=y p
10 ( ): s_mutationl l=s s11 ( ): y_mutationl l=y y12 End
13 ( ) ( ) ( ) ( )( )( ){ }: , , , 1,...,g g g go l l lf l λ= =B y s y
14 ( ) ( ) ( )g gp o= ∪R B B g
15 ( ) ( )( )fast nondominated sortg g= − −S R
16 ( )1 , 1gp i+ = ∅ =B
17 Until ( )1gp i μ+ + ≤B S Do
18 ( )icrowding distance assignment− − S19 ( ) ( )1 1g g
p p+ += ∪B B iS
20 1i i= +21 End
22 ( )icrowded comparison operator− − S
23 ( ) ( ) ( )( )1 1 1 :g g gp p i pμ+ + +1⎡ ⎤= ∪ −⎢ ⎥⎣ ⎦B B S B
24. : 1g g= +25. Until termination_condition 26. End
Figure 3: NSES-II(μ+λ) – pseudocode
22
B4 30x60
B1 30x60
C.A4 h1xb1
4.00 m
5.0
0 m
B6 3
0x6
0C.C2 h3xb3
C.A1 h1xb1
5.0
0 m
B7 3
0x6
0
C.B2 h2xb2
C.A3 h1xb1
4.00 m
C.C1 h3xb3
B2 30x60
C.B1 h2xb2
B8 3
0x6
0
C.A2 h1xb1
B5 30x60
B3 30x60
B9 3
0x6
0
(a)
(b)
Figure 4: Geometry of the two storey 3D building (a) layout, (b) front and side views
23
12500
15000
17500
20000
22500
25000
27500
30000
0 0.2 0.4 0.6 0.8 1 1.2 1.4 1.6 1.8 2 2.2
θmax,10/50
CIN
(Eur
o)
GEN 10GEN 50GEN 100GEN 250GEN 500
Figure 5: Pareto front curve obtained for EC8 formulation
12500
15000
17500
20000
22500
25000
27500
30000
0 0.2 0.4 0.6 0.8 1 1.2
θmax,10/50
CIN
(Eur
o)
GEN 10GEN 50GEN 100GEN 250GEN 500
Figure 6: Pareto front curve obtained for PBD formulation
24
12500
15000
17500
20000
22500
25000
27500
30000
0 0.5 1 1.5 2 2.5
θmax,10/50
CIN
(Eur
o)
3
EC8EC8-CorrectedPBD
EC8_A
EC8_C
EC8_D
EC8_E
PBD_E
PBD_D
PBD_C
EC8_BEC8_B
PBD_A
Figure 7: Comparison of the Pareto front curves obtained for EC8 and PBD formulation
0
0.2
0.4
0.6
0.8
1
0 1 2 3 4 5 6 7
PGA (m/sec2)
Prob
abili
ty o
f exc
eedi
ng th
e lim
it st
ate
8
PBD_A(Slight)EC8_A(Slight)PBD_A(Moderate)EC8_A(Moderate)PBD_A(Extensive)EC8_A(Extensive)PBD_A(Complete)EC8_A(Complete)
Design Earthquake PGA=3.1
(a)
25
0
0.2
0.4
0.6
0.8
1
0 1 2 3 4 5 6 7
PGA (m/sec2)
Prob
abili
ty o
f exc
eedi
ng th
e lim
it st
ate
8
PBD_B(Slight)EC8_B(Slight)PBD_B(Moderate)EC8_B(Moderate)PBD_B(Extensive)EC8_B(Extensive)PBD_B(Complete)EC8_B(Complete)
Design Earthquake PGA=3.1
(b)
0
0.2
0.4
0.6
0.8
1
0 1 2 3 4 5 6 7
PGA (m/sec2)
Prob
abili
ty o
f exc
eedi
ng th
e lim
it st
ate
8
PBD_C(Slight)EC8_C(Slight)PBD_C(Moderate)EC8_C(Moderate)PBD_C(Extensive)EC8_C(Extensive)PBD_C(Complete)EC8_C(Complete)
Design Earthquake PGA=3.1
(c)
26
0
0.2
0.4
0.6
0.8
1
0 1 2 3 4 5 6 7
PGA (m/sec2)
Prob
abili
ty o
f exc
eedi
ng th
e lim
it st
ate
8
PBD_D(Slight)EC8_D(Slight)PBD_D(Moderate)EC8_D(Moderate)PBD_D(Extensive)EC8_D(Extensive)PBD_D(Complete)EC8_D(Complete)
Design Earthquake PGA=3.1
(d)
0
0.2
0.4
0.6
0.8
1
0 1 2 3 4 5 6 7
PGA (m/sec2)
Prob
abili
ty o
f exc
eedi
ng th
e lim
it st
ate
8
PBD_E(Slight)EC8_E(Slight)PBD_E(Moderate)EC8_E(Moderate)PBD_E(Extensive)EC8_E(Extensive)PBD_E(Complete)EC8_E(Complete)
Design Earthquake PGA=3.1
(e)
Figure 8: Fragility curves.
27