see the new elizabeth arden - annualreports.com
TRANSCRIPT

Annual Repor t 2012
S ee t h e newEl i zabe t h Arden

See t h e newEl i zabe t h Arden

1
Fiscal 2012 marked another excellent year for ourCompany. We achieved strong financial resultsand improved operational metrics. We significantlyadvanced the repositioning of the Elizabeth Ardenbrand, while energizing both our retail partners andour organization behind this effort. We executed innovation with excellence, acquired several new fragrance licenses to increase our global market share of prestige fragrances and grew our key pillarbrands around the world.
From a financial performance perspective,
•We grew consolidated net sales by 5.3%, with international net sales growing by 9.8%;
• We increased gross margins (adjusted) and EBITDA (adjusted) margins by 230 basis points and by 180 basis points, respectively;
• We grew diluted EPS (adjusted) by 32.7% to a record $2.07 per share; and
• We increased return on invested capital (adjusted) by 130 basis points.
Consistent improvement in our operational metricscontinues to be driven by the building blocks of theGlobal Efficiency Re-engineering initiative that we substantially completed in fiscal 2011. Complementingthis effort, we completed a comprehensive realign-ment of our marketing and sales organizations to
improve our global brand management capabilitiesand execution, and to take advantage of the tremen-dous opportunities in the global beauty industry. We believe that we have created a scalable global operational platform that should help us continue to efficiently grow our business.
We look forward to fiscal 2013 as a transformationalyear for our Company. We are launching the repo-sitioned Elizabeth Arden brand, integrating several exciting acquisitions, and our innovation calendar has never been stronger. We expect strong sales,earnings and cash flow growth in fiscal 2013, and believe that this year will be pivotal in strengtheningour foundation for future growth.
D e a r F e l l o w S h a r e h o l d e r s :

Elizabeth Arden Brand Repositioning
The Elizabeth Arden brand is at an exciting point in its history. Our efforts to reposition this iconic brandglobally – to appeal anew to a broad range of womenby honoring the strong heritage of the brand whilemodernizing its presentation – progressed significantlythis past year. Over the past two years, we completedextensive consumer research and developed a marketing and communication strategy spanning allconsumer touch points of the brand, including theproduct, retail counters, advertising, public relations,packaging, training, and more. Our strategy has been focused on elevating the brand’s image and emphasizing the key elements of the Elizabeth Ardenbrand: the spirit of Ms. Elizabeth Arden herself, thebrand’s New York City roots, and the brand’s uniqueRed Door Spa heritage. Ms. Arden believed that “tobe beautiful is the birthright of every woman,” and we intend to return to the holistic approach to beautythat she pioneered over a century ago.
Specific elements of the brand’s repositioning includeimproved product formulations, packaging andcounter redesign, and SKU rationalization. Virtuallyevery element of the brand has been impacted. In addition to enhancing our core product pillars, Ceramide, Prevage, Eight Hour Cream and our colorcosmetic line, we introduced a new skin care line, Visible Difference, a daily skin care regimen intendedto attract a younger consumer through an entry price point.
We have also introduced communications and public relations that are designed to reflect and reinforce the brand’s revitalized, modern positioning. All communications, including print, in-store, digitaland social media, have been designed to reflect a consistent, equity-building, modern point of view to drive new relevance among women.
2
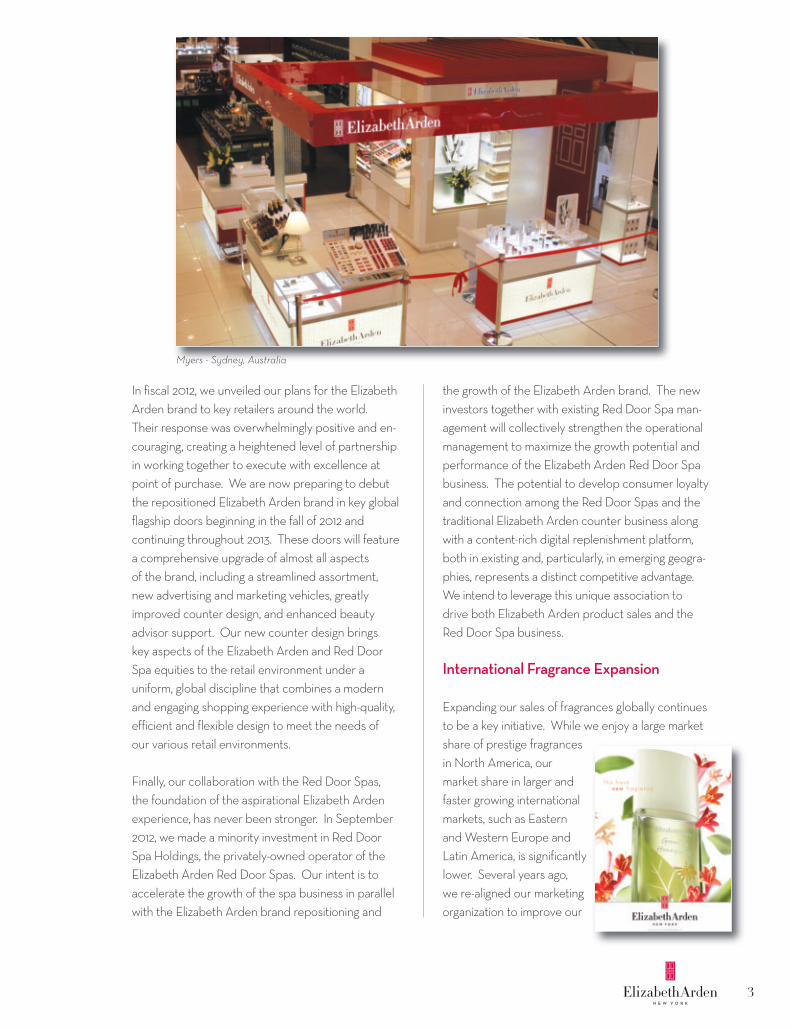
In fiscal 2012, we unveiled our plans for the ElizabethArden brand to key retailers around the world. Their response was overwhelmingly positive and en-couraging, creating a heightened level of partnershipin working together to execute with excellence atpoint of purchase. We are now preparing to debutthe repositioned Elizabeth Arden brand in key global flagship doors beginning in the fall of 2012 and continuing throughout 2013. These doors will featurea comprehensive upgrade of almost all aspects of the brand, including a streamlined assortment, new advertising and marketing vehicles, greatly improved counter design, and enhanced beauty advisor support. Our new counter design brings key aspects of the Elizabeth Arden and Red Door Spa equities to the retail environment under a uniform, global discipline that combines a modern and engaging shopping experience with high-quality,efficient and flexible design to meet the needs of our various retail environments.
Finally, our collaboration with the Red Door Spas, the foundation of the aspirational Elizabeth Arden experience, has never been stronger. In September2012, we made a minority investment in Red Door Spa Holdings, the privately-owned operator of theElizabeth Arden Red Door Spas. Our intent is to accelerate the growth of the spa business in parallelwith the Elizabeth Arden brand repositioning and
the growth of the Elizabeth Arden brand. The new investors together with existing Red Door Spa man-agement will collectively strengthen the operationalmanagement to maximize the growth potential andperformance of the Elizabeth Arden Red Door Spabusiness. The potential to develop consumer loyaltyand connection among the Red Door Spas and thetraditional Elizabeth Arden counter business alongwith a content-rich digital replenishment platform,both in existing and, particularly, in emerging geogra-phies, represents a distinct competitive advantage. We intend to leverage this unique association to drive both Elizabeth Arden product sales and the Red Door Spa business.
International Fragrance Expansion
Expanding our sales of fragrances globally continuesto be a key initiative. While we enjoy a large marketshare of prestige fragrances in North America, our market share in larger andfaster growing internationalmarkets, such as Eastern and Western Europe andLatin America, is significantlylower. Several years ago, we re-aligned our marketingorganization to improve our
3*Euromonitor Data 2010 and Company data.
Myers - Sydney, Australia

global brand management capabilities and execution.This has expanded the organic growth of our keybrands while allowing us to continue to executeimpactful innovation. This restructured marketing organization, along with the enhanced capabilities of our international sales groups, has allowed us to accelerate the growth of our fragrance sales globally.Over the last two fiscal years, we have increased fragrance sales in international markets by a com-pounded annual growth rate of 10%, well in excess ofindustry growth rates. In fiscal 2013, we are increasingour focus on fast growing markets, opening an affiliate office in Brazil and dedicating additional resources to the markets in Russia, the Middle East and Eastern Europe.
The key fragrance brand pillars of Viva la Juicy, John Varvatos, Britney Spears fantasy, and ElizabethArden Green Tea, Red Door, and 5th Avenue, all exhibited healthy growth in fiscal 2012 and repre-sent significant growth drivers of our international fragrance business.
Finally, our recent acquisitions of the Justin Bieber, Ed Hardy, Nicki Minaj, True Religion, and BCBG-MAXAZRIA fragrance brands bolster our portfolio of product offerings and allow us to strengthen our partnership with retailers.
Key Fragrance Brand Developments
Wonderstruck, our first fragrance with internationally-acclaimed music star Taylor Swift, was launched in the fall of 2011 and became the #2 women’s fragrance launch for 2011, according to NPD.
Wonderstruck is maintaining significant sales momentum as we enter fiscal 2013 as a result of expanded distribution in the U.S. and internationalmarkets, especially Europe, and we are launching a new Taylor Swift fragrance, Wonderstruck Enchanted Taylor Swift, in fall 2012.
The core fragrance franchises of Britney Spears andJuicy Couture saw a shift in innovation strategy duringfiscal 2012, as we moved away from lower volumeflankers to a more sustainable focus on the pillarbrands within each house. We are excited about theintroduction of a new product called Britney Spearsfantasy twist in October 2012, which is a uniquelypackaged duo fragrance containing both fantasy andmidnight fantasy, two of the most popular fragranceswithin the Britney Spears franchise. We believe this focus on the successful fragrances within the line will drive stronger, more predictable and sustainablegrowth for the brand.
4
*Source: ????
Similarly, we saw strong performance in Viva la Juicy,the pillar of the Juicy Couture fragrance franchise.Based on the strength of this pillar brand, we are introducing a new and permanent line extension tothe Viva line, Viva la Fleur. Viva la Fleur is a lighterversion of the highly successful Viva la Juicy fragrance,intended to broaden appeal for the Juicy Couture fragrance franchise as well as provide opportunity to re-promote the classic Viva la Juicy fragrance.
The Curve fragrance franchise, which we acquiredfrom Fifth & Pacific (formerly known as Liz Claiborne)in fiscal 2012, continues to grow. The Curve fragrancebrand, together with Elizabeth Taylor’s White Diamonds, are the #1 selling men’s and women’s fragrances in North America, respectively, at mass retailers. The Curve franchise achieved net salesgrowth of 12% for fiscal 2012, largely due to the uniquelaunch of Curve Appeal to targeted consumers at U.S. mass and mid-tier retail accounts.
The house of John Varvatoscontinues to perform well. The strength of the Collectionbrands, the launch of John Varvatos Star USA, and the ongoing expansion of the business into international markets and travel retail have contributed to the consistent significant growth of this franchise.
We are also pleased to report the addition of several recently acquired fragrance brands.
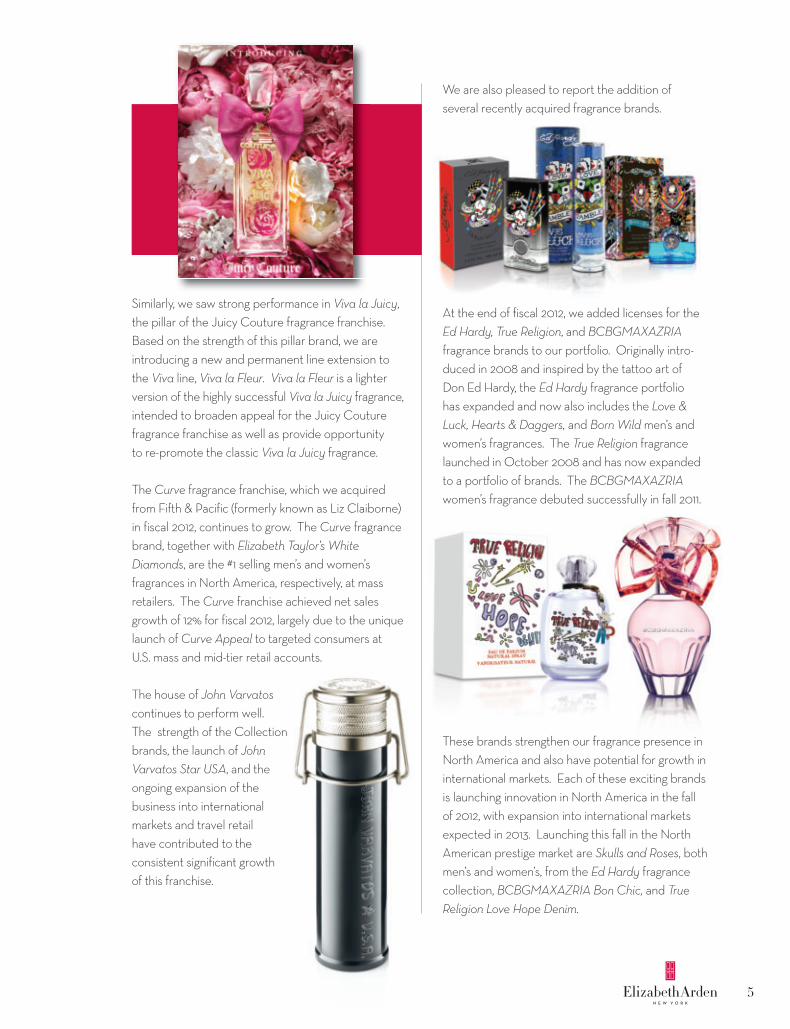
At the end of fiscal 2012, we added licenses for the Ed Hardy, True Religion, and BCBGMAXAZRIAfragrance brands to our portfolio. Originally intro-duced in 2008 and inspired by the tattoo art of Don Ed Hardy, the Ed Hardy fragrance portfolio has expanded and now also includes the Love & Luck, Hearts & Daggers, and Born Wild men’s andwomen’s fragrances. The True Religion fragrancelaunched in October 2008 and has now expanded to a portfolio of brands. The BCBGMAXAZRIAwomen’s fragrance debuted successfully in fall 2011.
These brands strengthen our fragrance presence inNorth America and also have potential for growth ininternational markets. Each of these exciting brands is launching innovation in North America in the fall of 2012, with expansion into international markets expected in 2013. Launching this fall in the NorthAmerican prestige market are Skulls and Roses, bothmen’s and women’s, from the Ed Hardy fragrancecollection, BCBGMAXAZRIA Bon Chic, and True Religion Love Hope Denim.
5
*Source: NPD.

We are also delighted toadd the Justin Bieber andNicki Minaj fragrancebrands to our portfolio.With the addition of thesetwo fragrance brands, Elizabeth Arden is now theleading celebrity fragrancecompany in the world.(1)
Internationally acclaimedsuperstar Justin Bieber debuted his first fragrance,Someday, in 2011, and it became the number one new fragrance launch in the U.S. for 2011. In fact, the combined sales of Justin Bieber’s Someday andTaylor Swift’s Wonderstruck accounted for over a quarterof the total growth of the women’s fragrance categoryin U.S. prestige accounts this past fall.(2) Justin Bieber’sSomeday is launching across expanded internationalmarkets in fiscal 2013. Meanwhile Justin’s newest fra-grance, Justin Bieber’s Girlfriend, is launching in NorthAmerican prestige retailers this fall.
We are also very pleased to welcome into our port-folio the fragrances from music phenomenon NickiMinaj. Breakthrough artist Nicki Minaj establishedherself on the music scene in 2010 and has won numerous BET, AMA and MTV awards. She wasvoted by Teen Choice as the Best R&B/Hip HopArtist in 2011 and has since become the first solo artistto have seven different songs on the Billboard Hot100 chart at the same time. This award-winning talentwith a fast growing fan base currently has 33 millionloyal followers in her active social media circle. In 2012 she released her second consecutive #1 albumand is experiencing a steep rise to fame as she
expands from hip hop tomainstream and joins the“American Idol” judgespanel. We are debutingher first fragrance, PinkFriday Nicki Minaj, ahighly creative executionthat typifies her talent and personality, in NorthAmerican prestige retailersin the fall of 2012.
E-Commerce Platform
In fiscal 2012, our e-commerce team led a transform-ation of our website, www.elizabetharden.com, that coincided with the repositioning of the ElizabethArden brand. The re-launch of our website enhancedthe website’s capability in delivering shopping excel-lence, as well as provided an interactive platform forconsumer engagement, and building brand equity andloyalty. We significantly upgraded the content of ourwebsite to better educate and engage our consumersby adding interactive educational and brand videos, a spa science Q&A to answer skin care questions, and providing the ability for consumers to obtain online consultations. We also enhanced the socialmedia aspects of the website, improving the ability for social sharing on sites and the ability for consu-mers to share product reviews.
We view the online channel to be the fastest and mostcost-effective method to increase brand penetrationinto new markets. This greatly enhanced site has improved our sales conversion rates and increasedour average order size. We look to leverage the suc-cessful U.S. re-launch of www.elizabetharden.comin Asia, Europe, and other global emerging markets.
6Source: (1) NPD, IRI, Euromonitor, (2) NPD
Toward a More Sustainable Future
As a corporate citizen of the world, Elizabeth Ardenrecognizes its obligation not only to enhance the livesof its customers, but also to improve, protect, and pre-serve the environment – local and global – whereverwe operate. Today, our Company and our partnersare working to develop a broad vision of sustainability,taking responsible actions in our business and in thecommunities where we live and work that will help ensure a better world.
We continue to support socially responsible and responsive initiatives while designing, developing, andexpanding programs to help sustain our environment.Our social responsibility efforts focus on two specificareas where we have already made a significant impact: causes that seek to benefit women, as well as programs that expand educational opportunities in public education for young people.
Elizabeth Arden is a longtimesupporter of Look Good…FeelBetter, a public service programpartnership of the PersonalCare Products Council and theAmerican Cancer Society. LookGood…Feel Better teachesbeauty techniques to cancer patients to help them managethe appearance-related side effects of cancer treatments.The worldwide organization isavailable to all women with cancer who are undergoingchemotherapy, radiation orother forms of treatment. Bothin the U.S. and internationally,we have participated in numerousevents to support this cause.
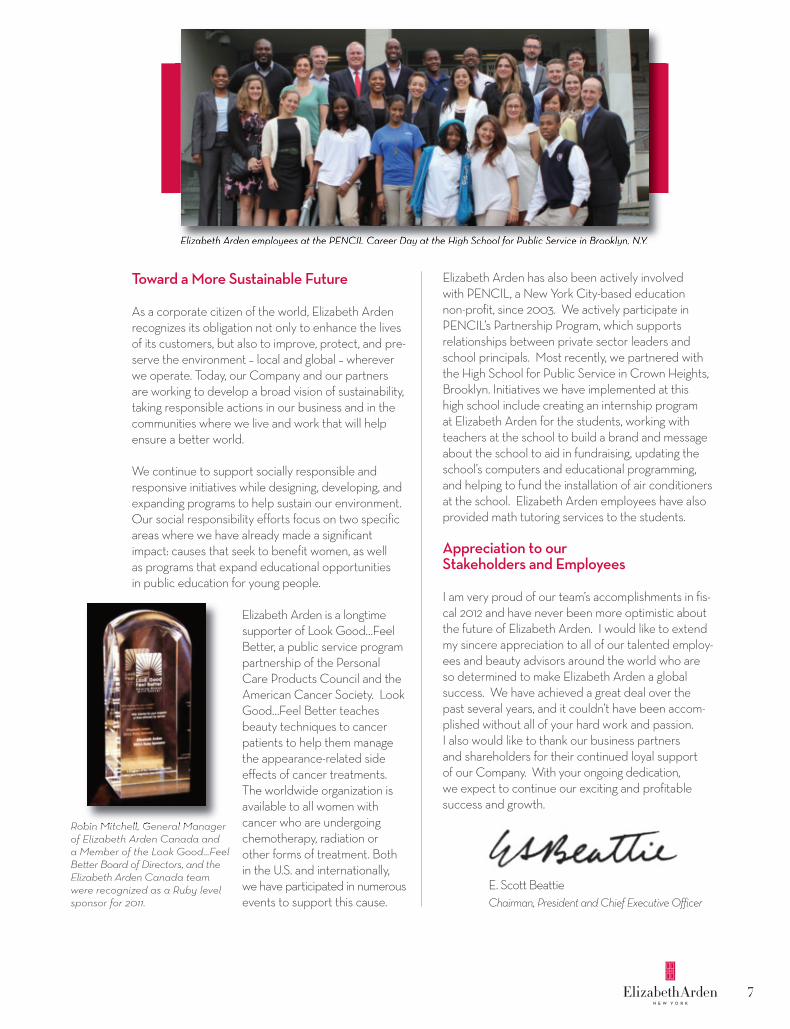
Elizabeth Arden has also been actively involved with PENCIL, a New York City-based education non-profit, since 2003. We actively participate inPENCIL’s Partnership Program, which supports relationships between private sector leaders andschool principals. Most recently, we partnered withthe High School for Public Service in Crown Heights, Brooklyn. Initiatives we have implemented at this high school include creating an internship program at Elizabeth Arden for the students, working withteachers at the school to build a brand and messageabout the school to aid in fundraising, updating theschool’s computers and educational programming,and helping to fund the installation of air conditionersat the school. Elizabeth Arden employees have also provided math tutoring services to the students.
Appreciation to our Stakeholders and Employees
I am very proud of our team’s accomplishments in fis-cal 2012 and have never been more optimistic aboutthe future of Elizabeth Arden. I would like to extendmy sincere appreciation to all of our talented employ-ees and beauty advisors around the world who are so determined to make Elizabeth Arden a global success. We have achieved a great deal over the past several years, and it couldn’t have been accom-plished without all of your hard work and passion. I also would like to thank our business partners and shareholders for their continued loyal support of our Company. With your ongoing dedication, we expect to continue our exciting and profitable success and growth.
E. Scott BeattieChairman, President and Chief Executive Officer
7
Elizabeth Arden employees at the PENCIL Career Day at the High School for Public Service in Brooklyn, N.Y.
Robin Mitchell, General Manager of Elizabeth Arden Canada and a Member of the Look Good...FeelBe�er Board of Directors, and theElizabeth Arden Canada team were recognized as a Ruby levelsponsor for 2011.
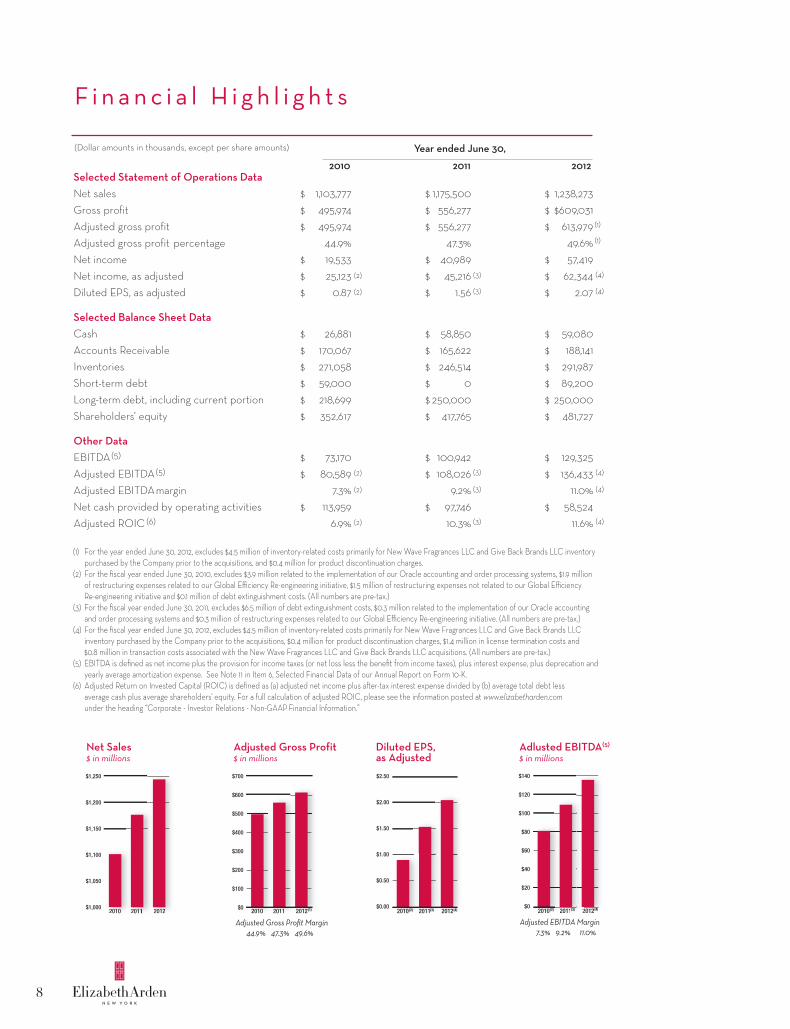
Selected Statement of Operations DataNet sales 1,103,777 1,175,500 1,238,273Gross profit 495,974 556,277 $609,031Adjusted gross profit 495,974 556,277 613,979Adjusted gross profit percentage 44.9% 47.3% 49.6%Net income 19,533 40,989 57,419Net income, as adjusted 25,123 45,216 62,344Diluted EPS, as adjusted 0.87 1.56 2.07
Selected Balance Sheet DataCash 26,881 58,850 59,080Accounts Receivable 170,067 165,622 188,141Inventories 271,058 246,514 291,987Short-term debt 59,000 0 89,200Long-term debt, including current portion 218,699 250,000 250,000Shareholders’ equity 352,617 417,765 481,727
Other DataEBITDA(5) 73,170 100,942 129,325Adjusted EBITDA(5) 80,589 108,026 136,433Adjusted EBITDAmargin 7.3% 9.2% 11.0%Net cash provided by operating activities 113,959 97,746 58,524Adjusted ROIC (6) 6.9% 10.3% 11.6%
8
F i n a n c i a l H i g h l i g h t s
(1) For the year ended June 30, 2012, excludes $4.5 million of inventory-related costs primarily for New Wave Fragrances LLC and Give Back Brands LLC inventory purchased by the Company prior to the acquisitions, and $0.4 million for product discontinuation charges.
(2) For the fiscal year ended June 30, 2010, excludes $3.9 million related to the implementation of our Oracle accounting and order processing systems, $1.9 millionof restructuring expenses related to our Global Efficiency Re-engineering initiative, $1.5 million of restructuring expenses not related to our Global Efficiency Re-engineering initiative and $0.1 million of debt extinguishment costs. (All numbers are pre-tax.)
(3) For the fiscal year ended June 30, 2011, excludes $6.5 million of debt extinguishment costs, $0.3 million related to the implementation of our Oracle accounting and order processing systems and $0.3 million of restructuring expenses related to our Global Efficiency Re-engineering initiative. (All numbers are pre-tax.)
(4) For the fiscal year ended June 30, 2012, excludes $4.5 million of inventory-related costs primarily for New Wave Fragrances LLC and Give Back Brands LLC inventory purchased by the Company prior to the acquisitions, $0.4 million for product discontinuation charges, $1.4 million in license termination costs and $0.8 million in transaction costs associated with the New Wave Fragrances LLC and Give Back Brands LLC acquisitions. (All numbers are pre-tax.)
(5) EBITDA is defined as net income plus the provision for income taxes (or net loss less the benefit from income taxes), plus interest expense, plus deprecation and yearly average amortization expense. See Note 11 in Item 6, Selected Financial Data of our Annual Report on Form 10-K.
(6) Adjusted Return on Invested Capital (ROIC) is defined as (a) adjusted net income plus a�er-tax interest expense divided by (b) average total debt less average cash plus average shareholders' equity. For a full calculation of adjusted ROIC, please see the information posted at www.elizabetharden.comunder the heading “Corporate - Investor Relations - Non-GAAP Financial Information.”
$$$
$$$
$$$$$$
$$
$
$$$
$$$
$$$$$$
$$
$
$$$
$$$
$$$$$$
$$
$
(Dollar amounts in thousands, except per share amounts)
2010 2011 2012
Year ended June 30,
(2)
(2)
(2)
(2)
(2) (3)
(3)
(3)
(3)
(3)
(4)
(1)
(1)
(4)
(4)
(4)
(4)
$1,250
$1,200
$1,150
$1,100
$1,050
$1,0002010 2011 20122010 20112 20122
$700
$600
$500
$400
$300
$200
$100
$02010 2011 2012(1)
$2.50
$2.00
$1.50
$1.00
$0.50
$0.002010 2011 2012(4)(3)(2)
$140
$120
$100
$80
$60
$40
$20
$02010 2011 2012(2) (3) (4)20112 (3) 2012(4)2
Diluted EPS, as Adjusted
Net Sales$ in millions
Adjusted Gross Profit$ in millions
Adjusted EBITDA Margin 7.3% 9.2% 11.0%
Adjusted Gross Profit Margin 44.9% 47.3% 49.6%
Adlusted EBITDA(5)
$ in millions
UNITED STATESSECURITIES AND EXCHANGE COMMISSION
Washington, D.C. 20549
FORM 10-KÈ ANNUAL REPORT PURSUANT TO SECTION 13 OR 15(d) OF THE
SECURITIES EXCHANGE ACT OF 1934For the fiscal year ended June 30, 2012
OR‘ TRANSITION REPORT PURSUANT TO SECTION 13 OR 15(d) OF THE
SECURITIES EXCHANGE ACT OF 1934For the transition period from to
Commission file number 1-6370
Elizabeth Arden, Inc.(Exact name of registrant as specified in its charter)
Florida 59-0914138(State or other jurisdiction of
incorporation or organization)(I.R.S. Employer
Identification No.)
2400 SW 145th Avenue,Miramar, Florida 33027
(Address of principal executive offices) (Zip Code)(954) 364-6900
(Registrant’s telephone number, including area code)Securities registered pursuant to Section 12(b) of the Act:
Title of Security Name of Exchange on Which RegisteredElizabeth Arden Common Stock, $.01 par value per share Nasdaq Global Select Market
Indicate by check mark if the registrant is a well-known seasoned issuer, as defined in Rule 405 of the SecuritiesAct. Yes ‘ No È
Indicate by check mark if the registrant is not required to file reports pursuant to Section 13 or Section 15(d) ofthe Act. Yes ‘ No È
Indicate by check mark whether the registrant (1) has filed all reports required to be filed by Section 13 or 15(d)of the Securities Exchange Act of 1934 during the preceding 12 months (or for such shorter period that the registrantwas required to file such reports), and (2) has been subject to such filing requirements for the past 90days. Yes È No ‘
Indicate by check mark whether the registrant has submitted electronically and posted on its corporate Web site,if any, every Interactive Data File required to be submitted and posted pursuant to Rule 405 of Regulation S-T(§232.405 of this chapter) during the preceding 12 months (or for such shorter period that the registrant was requiredto submit and post such files). Yes È No ‘
Indicate by check mark if disclosure of delinquent filers pursuant to Item 405 of Regulation S-K (§229.405 ofthis chapter) is not contained herein, and will not be contained, to the best of registrant’s knowledge, in definitiveproxy or information statements incorporated by reference in Part III of this Form 10-K or any amendment to thisForm 10-K ‘
Indicate by check mark whether the registrant is a large accelerated filer, an accelerated filer, a non-acceleratedfiler, or a smaller reporting company. See definitions of “large accelerated filer,” “accelerated filer,” “non-acceleratedfiler” and “smaller reporting company” in Rule 12b-2 of the Exchange Act. (Check one):Large accelerated filer È Accelerated filer ‘ Non-accelerated filer ‘ Smaller reporting company ‘
Indicate by check mark whether the registrant is a shell company (as defined in rule 12b-2 of theAct). Yes ‘ No È
The aggregate market value of voting Common Stock held by non-affiliates of the registrant was approximately$787 million based on the closing price of the Common Stock on the NASDAQ Global Select Market of $37.35 pershare on December 31, 2011, the last business day of the registrant’s most recently completed second fiscal quarter,based on the number of shares outstanding on that date less the number of shares held by the registrant’s directors,executive officers and holders of at least 10% of the outstanding shares of Common Stock.
As of August 10, 2012, the registrant had 29,436,521 shares of Common Stock outstanding.
Documents Incorporated by ReferencePortions of the Registrant’s definitive proxy statement relating to its 2012 Annual Meeting of Shareholders, to be
filed no later than 120 days after the end of the Registrant’s fiscal year ended June 30, 2012, are hereby incorporatedby reference in Part III of this Annual Report on Form 10-K.
9
ELIZABETH ARDEN, INC.
TABLE OF CONTENTS
Page
Part I
Item 1. Business . . . . . . . . . . . . . . . . . . . . . . . . . . . . . . . . . . . . . . . . . . . . . . . . . . . . . . . . . . 11
Item 1A. Risk Factors . . . . . . . . . . . . . . . . . . . . . . . . . . . . . . . . . . . . . . . . . . . . . . . . . . . . . . 22
Item 1B. Unresolved Staff Comments . . . . . . . . . . . . . . . . . . . . . . . . . . . . . . . . . . . . . . . . . . 30
Item 2. Properties . . . . . . . . . . . . . . . . . . . . . . . . . . . . . . . . . . . . . . . . . . . . . . . . . . . . . . . . 30
Item 3. Legal Proceedings . . . . . . . . . . . . . . . . . . . . . . . . . . . . . . . . . . . . . . . . . . . . . . . . . . 31
Item 4. Mine Safety Disclosures . . . . . . . . . . . . . . . . . . . . . . . . . . . . . . . . . . . . . . . . . . . . . 31
Part II
Item 5. Market For Registrant’s Common Equity, Related Stockholder Matters andIssuer Purchases of Equity Securities . . . . . . . . . . . . . . . . . . . . . . . . . . . . . . . . . 32
Item 6. Selected Financial Data . . . . . . . . . . . . . . . . . . . . . . . . . . . . . . . . . . . . . . . . . . . . . 34
Item 7. Management’s Discussion and Analysis of Financial Condition and Results ofOperations . . . . . . . . . . . . . . . . . . . . . . . . . . . . . . . . . . . . . . . . . . . . . . . . . . . . . . 37
Item 7A. Quantitative and Qualitative Disclosures About Market Risk . . . . . . . . . . . . . . . . 58
Item 8. Financial Statements and Supplementary Data . . . . . . . . . . . . . . . . . . . . . . . . . . . 60
Item 9. Changes in and Disagreements with Accountants on Accounting and FinancialDisclosure . . . . . . . . . . . . . . . . . . . . . . . . . . . . . . . . . . . . . . . . . . . . . . . . . . . . . . 100
Item 9A. Controls and Procedures . . . . . . . . . . . . . . . . . . . . . . . . . . . . . . . . . . . . . . . . . . . . . 100
Item 9B. Other Information . . . . . . . . . . . . . . . . . . . . . . . . . . . . . . . . . . . . . . . . . . . . . . . . . . 100
Part III
Item 10. Directors, Executive Officers and Corporate Governance . . . . . . . . . . . . . . . . . . . 101
Item 11. Executive Compensation . . . . . . . . . . . . . . . . . . . . . . . . . . . . . . . . . . . . . . . . . . . . . 101
Item 12. Security Ownership of Certain Beneficial Owners and Management and RelatedStockholder Matters . . . . . . . . . . . . . . . . . . . . . . . . . . . . . . . . . . . . . . . . . . . . . . 101
Item 13. Certain Relationships and Related Transactions, and Director Independence . . . 101
Item 14. Principal Accounting Fees and Services . . . . . . . . . . . . . . . . . . . . . . . . . . . . . . . . . 101
Part IV
Item 15. Exhibits, Financial Statement Schedules . . . . . . . . . . . . . . . . . . . . . . . . . . . . . . . 101
Signatures . . . . . . . . . . . . . . . . . . . . . . . . . . . . . . . . . . . . . . . . . . . . . . . . . . . . . . . . . . . . . . . . . . .
10
PART I
ITEM 1. BUSINESS
General
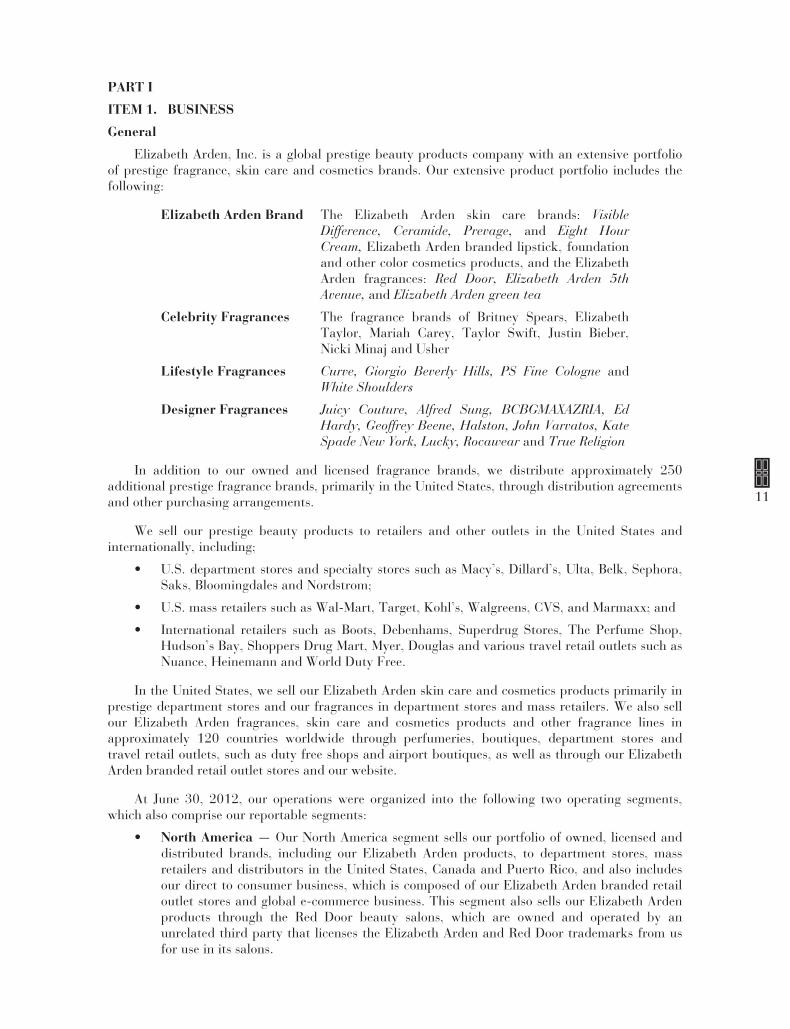
Elizabeth Arden, Inc. is a global prestige beauty products company with an extensive portfolioof prestige fragrance, skin care and cosmetics brands. Our extensive product portfolio includes thefollowing:
Elizabeth Arden Brand The Elizabeth Arden skin care brands: VisibleDifference, Ceramide, Prevage, and Eight HourCream, Elizabeth Arden branded lipstick, foundationand other color cosmetics products, and the ElizabethArden fragrances: Red Door, Elizabeth Arden 5thAvenue, and Elizabeth Arden green tea
Celebrity Fragrances The fragrance brands of Britney Spears, ElizabethTaylor, Mariah Carey, Taylor Swift, Justin Bieber,Nicki Minaj and Usher
Lifestyle Fragrances Curve, Giorgio Beverly Hills, PS Fine Cologne andWhite Shoulders
Designer Fragrances Juicy Couture, Alfred Sung, BCBGMAXAZRIA, EdHardy, Geoffrey Beene, Halston, John Varvatos, KateSpade New York, Lucky, Rocawear and True Religion
In addition to our owned and licensed fragrance brands, we distribute approximately 250additional prestige fragrance brands, primarily in the United States, through distribution agreementsand other purchasing arrangements.
We sell our prestige beauty products to retailers and other outlets in the United States andinternationally, including;
• U.S. department stores and specialty stores such as Macy’s, Dillard’s, Ulta, Belk, Sephora,Saks, Bloomingdales and Nordstrom;
• U.S. mass retailers such as Wal-Mart, Target, Kohl’s, Walgreens, CVS, and Marmaxx; and
• International retailers such as Boots, Debenhams, Superdrug Stores, The Perfume Shop,Hudson’s Bay, Shoppers Drug Mart, Myer, Douglas and various travel retail outlets such asNuance, Heinemann and World Duty Free.
In the United States, we sell our Elizabeth Arden skin care and cosmetics products primarily inprestige department stores and our fragrances in department stores and mass retailers. We also sellour Elizabeth Arden fragrances, skin care and cosmetics products and other fragrance lines inapproximately 120 countries worldwide through perfumeries, boutiques, department stores andtravel retail outlets, such as duty free shops and airport boutiques, as well as through our ElizabethArden branded retail outlet stores and our website.
At June 30, 2012, our operations were organized into the following two operating segments,which also comprise our reportable segments:
• North America — Our North America segment sells our portfolio of owned, licensed anddistributed brands, including our Elizabeth Arden products, to department stores, massretailers and distributors in the United States, Canada and Puerto Rico, and also includesour direct to consumer business, which is composed of our Elizabeth Arden branded retailoutlet stores and global e-commerce business. This segment also sells our Elizabeth Ardenproducts through the Red Door beauty salons, which are owned and operated by anunrelated third party that licenses the Elizabeth Arden and Red Door trademarks from usfor use in its salons.
11
• International — Our International segment sells our portfolio of owned and licensedbrands, including our Elizabeth Arden products, in approximately 120 countries outside ofNorth America to perfumeries, boutiques, department stores, travel retail outlets anddistributors.
In light of the repositioning of the Elizabeth Arden brand and our early October 2012 target forcompleting the initial roll-out of the repositioning, commencing with the first quarter of fiscal 2013,we will disclose financial information relating to the following product categories: the ElizabethArden Brand (skin care, cosmetics and fragrances) and Celebrity, Lifestyle, Designer and OtherFragrances, in addition to our current segment reporting.
Financial information relating to our reportable segments is included in Note 18 to the Notes toConsolidated Financial Statements.
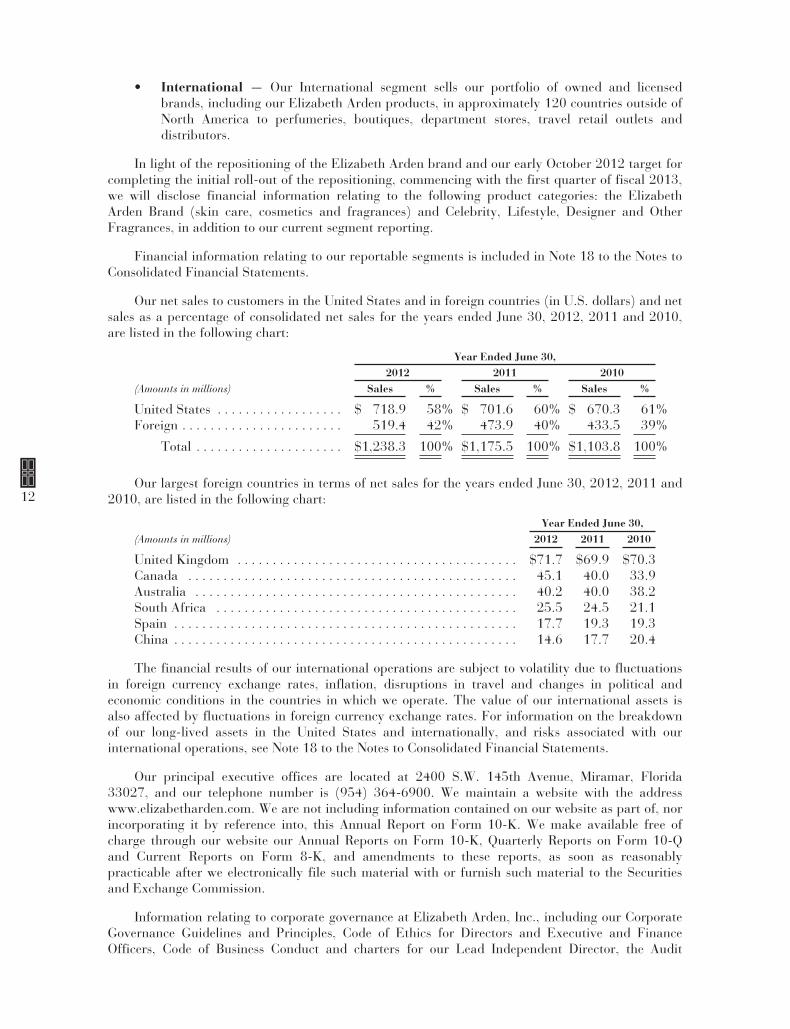
Our net sales to customers in the United States and in foreign countries (in U.S. dollars) and netsales as a percentage of consolidated net sales for the years ended June 30, 2012, 2011 and 2010,are listed in the following chart:
Year Ended June 30,2012 2011 2010
(Amounts in millions) Sales % Sales % Sales %
United States . . . . . . . . . . . . . . . . . . $ 718.9 58% $ 701.6 60% $ 670.3 61%Foreign . . . . . . . . . . . . . . . . . . . . . . . 519.4 42% 473.9 40% 433.5 39%
Total . . . . . . . . . . . . . . . . . . . . . $1,238.3 100% $1,175.5 100% $1,103.8 100%
Our largest foreign countries in terms of net sales for the years ended June 30, 2012, 2011 and2010, are listed in the following chart:
Year Ended June 30,(Amounts in millions) 2012 2011 2010
United Kingdom . . . . . . . . . . . . . . . . . . . . . . . . . . . . . . . . . . . . . . . . $71.7 $69.9 $70.3Canada . . . . . . . . . . . . . . . . . . . . . . . . . . . . . . . . . . . . . . . . . . . . . . . 45.1 40.0 33.9Australia . . . . . . . . . . . . . . . . . . . . . . . . . . . . . . . . . . . . . . . . . . . . . . 40.2 40.0 38.2South Africa . . . . . . . . . . . . . . . . . . . . . . . . . . . . . . . . . . . . . . . . . . . 25.5 24.5 21.1Spain . . . . . . . . . . . . . . . . . . . . . . . . . . . . . . . . . . . . . . . . . . . . . . . . . 17.7 19.3 19.3China . . . . . . . . . . . . . . . . . . . . . . . . . . . . . . . . . . . . . . . . . . . . . . . . . 14.6 17.7 20.4
The financial results of our international operations are subject to volatility due to fluctuationsin foreign currency exchange rates, inflation, disruptions in travel and changes in political andeconomic conditions in the countries in which we operate. The value of our international assets isalso affected by fluctuations in foreign currency exchange rates. For information on the breakdownof our long-lived assets in the United States and internationally, and risks associated with ourinternational operations, see Note 18 to the Notes to Consolidated Financial Statements.
Our principal executive offices are located at 2400 S.W. 145th Avenue, Miramar, Florida33027, and our telephone number is (954) 364-6900. We maintain a website with the addresswww.elizabetharden.com. We are not including information contained on our website as part of, norincorporating it by reference into, this Annual Report on Form 10-K. We make available free ofcharge through our website our Annual Reports on Form 10-K, Quarterly Reports on Form 10-Qand Current Reports on Form 8-K, and amendments to these reports, as soon as reasonablypracticable after we electronically file such material with or furnish such material to the Securitiesand Exchange Commission.
Information relating to corporate governance at Elizabeth Arden, Inc., including our CorporateGovernance Guidelines and Principles, Code of Ethics for Directors and Executive and FinanceOfficers, Code of Business Conduct and charters for our Lead Independent Director, the Audit
12
Committee, the Compensation Committee and the Nominating and Corporate GovernanceCommittee, is available on our website under the section “Corporate-Investor Relations — CorporateGovernance.” We will provide the foregoing information without charge upon written request toSecretary, Elizabeth Arden, Inc., 2400 S.W. 145th Avenue, Miramar, FL 33027.
Business Strategy
Our business strategy is currently focused on two primary initiatives: the global repositioning ofthe Elizabeth Arden brand and expanding the market penetration of our prestige fragrance portfolioin international markets, especially in the large European fragrance market. We also intend tocontinue to expand the prestige fragrance category at mass retail customers in North America. Weexpect these initiatives to contribute to increases in net sales, operating margins and earnings as wellas working capital efficiency and return on invested capital. We believe that our focus on organicgrowth opportunities for our existing brands, new licensing opportunities and acquisitions, and newproduct innovation will assist us in achieving these goals.
We believe the Elizabeth Arden brand is one of the most widely recognized beauty brands in theworld. Over the last 18 months, we have been engaged in a repositioning of the Elizabeth Ardenbrand that emphasizes the following critical attributes of the Elizabeth Arden brand: (i) theprogressive and innovative spirit of Elizabeth Arden herself, (ii) the brand’s New York City roots,and (iii) the brand’s Red Door Spa heritage. We recently commenced the roll-out of thiscomprehensive brand repositioning, which is designed to honor the heritage of the brand whilemodernizing the brand’s presentation. The brand repositioning includes improved productformulation, package redesign and counter redesign as well as SKU rationalization. We beganshipping the new product assortment to retailers in June 2012 and expect to replace certain high-priority retail counters with the new counters by early October 2012. The new counter design isintended to bring key aspects of the Elizabeth Arden and Red Door Spa brand equities to the retailenvironment to create a more uniform, modern and engaging shopping experience. The rollout willcontinue throughout fiscal year 2013 and beyond. As we proceed with the Elizabeth Arden brandrepositioning, we also intend to continue to invest behind and grow this brand on a global basis bycontinuing to (i) improve market share in existing developed markets, (ii) expand in high-growthmarkets, such as Asia, and in developing markets, and (iii) innovate in skin care and color cosmeticproducts based on new technologies.
During fiscal 2012, we also continued to implement our key initiative to expand our marketshare for fragrances in Western Europe. We believe the Western European fragrance market offersopportunities for us to expand the sales of our fragrance portfolio. We also believe many of ourfragrance brands, including our Elizabeth Arden fragrances and the Juicy Couture, Britney Spears,and John Varvatos fragrance brands, as well as certain of our recently acquired fragrance brandssuch as Justin Bieber and Ed Hardy, resonate well with retailers and consumers in those markets. Asignificant part of our focus during fiscal 2012 was in the German and UK markets. In fiscal 2013we will continue to work towards developing strong partnerships with leading retailers in thosecountries and focus on markets in some of the other European countries, as well as our travel retailand distributor markets.
During fiscal 2012, we again increased our already sizeable market share in the prestigefragrance category with mass retailers in North America. We continue to work closely with our massretail customers and nationally recognized merchandising and advertising companies to develop andimplement a variety of marketing and product merchandising initiatives intended to improve theshopping experience for mass retail fragrance shoppers and expand this category at these retailers.
During fiscal 2012, we also improved our gross margins by 190 basis points over fiscal 2011.The gross margin was impacted by $4.9 million, or 40 basis points, of inventory-related costsprimarily associated with our May and June 2012 acquisitions. See “Recent License Agreements andAcquisitions” and Note 1, under Item 6, “Selected Financial Data” for further information on
13
acquisitions. Moving into fiscal 2013, we expect our gross margins to improve an additional 85 to110 basis points over our fiscal 2012 gross margins. We also expect our gross margin in fiscal 2013will be impacted by approximately 130 basis points for costs associated with the Elizabeth Ardenbrand repositioning and the 2012 acquisitions, which represents a year over year anticipated netimpact on our gross margin of 90 basis points related to these costs. We continue to focus on(i) expanding gross margins through increased focus on product mix, improved pricing and reducedsales dilution, (ii) improving our sales and operations planning processes and our supply chain andlogistics efficiency and, (iii) leveraging our overhead structure by increasing sales of ourInternational segment.
Recent License Agreements and Acquisitions
During fiscal 2012, we amended our long-term license agreement with Liz Claiborne, Inc. andcertain of its affiliates to acquire all of the U.S. and international trademarks for the Curve fragrancebrands, as well as trademarks for certain other smaller fragrance brands. The amendmentestablished a lower effective royalty rate for the remaining licensed fragrance brands, including JuicyCouture and Lucky Brand fragrances, reduced the future minimum guaranteed royalties for theterm of the license, and required a pre-payment of royalties for the remainder of calendar 2011.
In May 2012, we acquired the global licenses and certain assets, including inventory, related tothe Ed Hardy, True Religion and BCBGMAXAZRIA fragrance brands from New Wave Fragrances,LLC. Prior to the acquisition, we had been acting as a distributor of the Ed Hardy, True Religionand BCBGMAXAZRIA fragrances to certain mid-tier and mass retailers in North America. Originallyintroduced in 2008 and inspired by the tattoo art of Don Ed Hardy, the Ed Hardy fragranceportfolio includes the Love & Luck, Hearts & Daggers and Ed Hardy Born Wild men’s and women’sfragrances. The True Religion fragrance launched in U.S. department stores in October 2008 andhas now expanded to a portfolio of brands, including Drifter and Hippie Chic, and theBCBGMAXAZRIA women’s fragrance recently launched in the fall of 2011 in U.S. departmentstores.
In June 2012, we also acquired the global licenses and certain assets related to the Justin Bieberand Nicki Minaj fragrance brands, including the inventory of the Justin Bieber fragrances, from GiveBack Brands LLC. Someday, the first fragrance from internationally acclaimed recording artistJustin Bieber, launched in Spring 2011 and became the number one women’s fragrance launch of2011 in U.S. department stores, according to the NPD Group. The second fragrance in this brandfranchise, Justin Bieber’s Girlfriend, is launching in U.S. department stores in the summer of 2012.The first fragrance from Nicki Minaj is scheduled to launch in U.S. department stores in the fall of2012.
For further information on the acquisitions, please see Note 11 to the Notes to ConsolidatedFinancial Statements.
Products
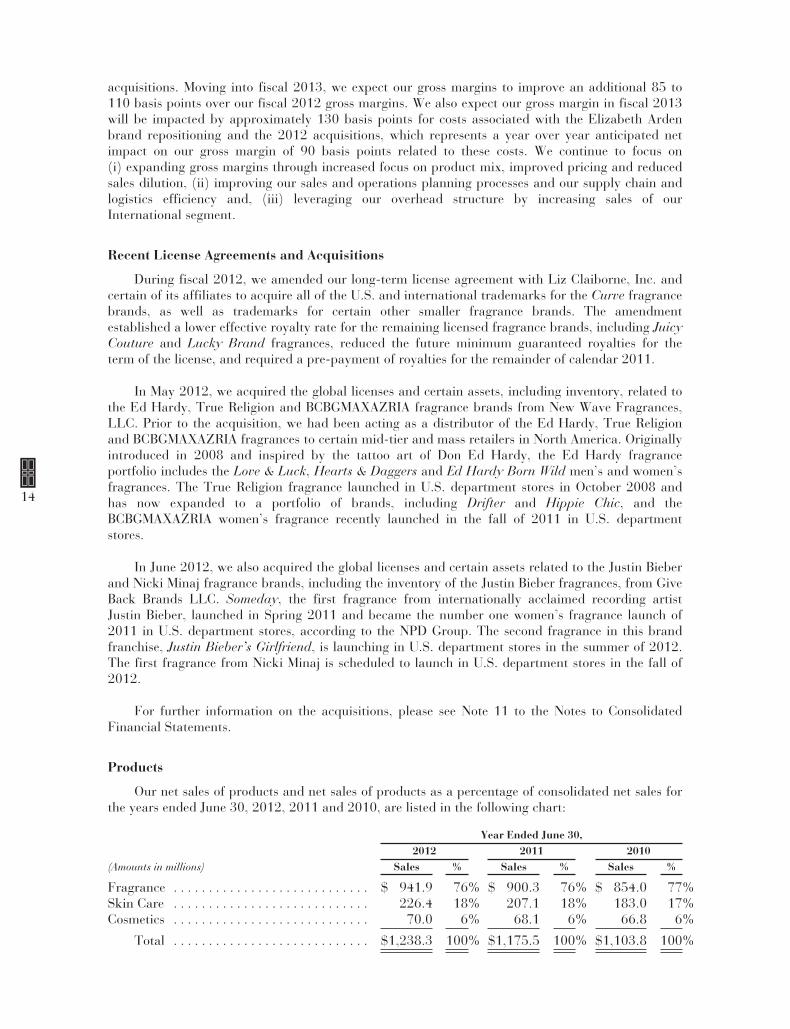
Our net sales of products and net sales of products as a percentage of consolidated net sales forthe years ended June 30, 2012, 2011 and 2010, are listed in the following chart:
Year Ended June 30,2012 2011 2010
(Amounts in millions) Sales % Sales % Sales %
Fragrance . . . . . . . . . . . . . . . . . . . . . . . . . . . . $ 941.9 76% $ 900.3 76% $ 854.0 77%Skin Care . . . . . . . . . . . . . . . . . . . . . . . . . . . . 226.4 18% 207.1 18% 183.0 17%Cosmetics . . . . . . . . . . . . . . . . . . . . . . . . . . . . 70.0 6% 68.1 6% 66.8 6%
Total . . . . . . . . . . . . . . . . . . . . . . . . . . . . $1,238.3 100% $1,175.5 100% $1,103.8 100%
14
Fragrance. We offer a wide variety of fragrance products for both men and women, includingperfume, colognes, eau de toilettes, eau de parfums, body sprays and gift sets. Our fragrances areclassified into the Elizabeth Arden branded fragrances, celebrity branded fragrances, designerbranded fragrances, and lifestyle fragrances. Each fragrance is sold in a variety of sizes andpackaging assortments. In addition, we sell bath and body products that are based on the particularfragrance to complement the fragrance lines, such as soaps, deodorants, body lotions, gels, creamsand dusting powders. We sell fragrance products worldwide, primarily to department stores, massretailers, perfumeries, boutiques, distributors and travel retail outlets. We tailor the size andpackaging of the fragrance to suit the particular target customer.
Skin Care. Our skin care lines are sold under the Elizabeth Arden name and include productssuch as moisturizers, creams, lotions and cleansers. Our core Elizabeth Arden branded productsinclude the Visible Difference, Ceramide, Prevage, and Eight Hour Cream lines. In connection withour Elizabeth Arden brand repositioning, we have introduced a complete line of essential skin careproducts under the Visible Difference brand, which serves as our entry price point line for theElizabeth Arden skin care products. Our Ceramide skin care line targets women who are 40 andover. Prevage is our premium cosmeceutical skin care line. Our Eight Hour Cream franchise has astrong international following. We sell skin care products worldwide, primarily in prestigedepartment and specialty stores, perfumeries and travel retail outlets.
Cosmetics. We offer a variety of cosmetics under the Elizabeth Arden name, includingfoundations, lipsticks, mascaras, eye shadows and powders. We offer these products in a wide arrayof shades and colors. The largest component of our cosmetics business is foundations, which wemarket in conjunction with our skin care products. As part of the Elizabeth Arden brandrepositioning, our entire line of cosmetics has been repackaged to emphasize the modernization andluxury of the brand. We sell our cosmetics internationally and in the United States, primarily inprestige department and specialty stores, perfumeries and travel retail outlets.
Trademarks, Licenses, Patents and Other Intellectual Properties
We own or have rights to use the trademarks and other intellectual properties necessary for themanufacturing, marketing, distribution and sale of numerous fragrance, cosmetic and skin carebrands, including Elizabeth Arden’s Red Door, Elizabeth Arden 5th Avenue, Elizabeth Arden VisibleDifference, and Prevage among others. These trademarks are registered or have pending applicationsin the United States and in certain of the countries in which we sell these product lines. We considerthe protection of our trademarks to be important to our business.
We are the exclusive worldwide trademark licensee for a number of fragrance brands including:
• the Britney Spears fragrances curious Britney Spears, fantasy Britney Spears, midnightfantasy Britney Spears, Britney Spears believe, radiance Britney Spears and cosmicradiance Britney Spears;
• the Elizabeth Taylor fragrances White Diamond, Elizabeth Taylor’s Passion and VioletEyes Elizabeth Taylor;
• the Mariah Carey fragrances M by Mariah Carey, Luscious Pink, Forever, Lollipop Blingand Lollipop Splash;
• the Usher fragrances He, She, UR for Men, UR for Women and Usher VIP;
• the Lucky fragrances;
• the Juicy Couture fragrances Juicy Couture, Viva la Juicy, Couture Couture, and Peace,Love & Juicy Couture;
• the Giorgio fragrances Giorgio Beverly Hills and Giorgio Red;
• the Taylor Swift fragrance Wonderstruck;
15
• the Justin Bieber fragrances Someday and Justin Bieber’s Girlfriend;
• the Ed Hardy fragrances Ed Hardy, Ed Hardy Hearts & Daggers and Ed Hardy Love &Luck;
• the John Varvatos fragrances John Varvatos, John Varvatos Vintage, John Varvatos Artisanand John Varvatos Star USA; and
• the designer fragrance brands of Alfred Sung, BCBGMAXAZRIA, Geoffrey Beene, KateSpade New York and True Religion,
The Elizabeth Taylor license agreement terminates in October 2022 and is renewable by us, atour sole option, for unlimited 20-year periods. The Britney Spears license terminates in December2014 and is renewable at our option for another five-year term if certain sales targets are achieved.The license agreement with Liz Claiborne Inc. and its affiliates relating to the Liz Claiborne andJuicy Couture fragrances terminates in December 2017 and is renewable by us for two additionalfive-year terms, provided specified conditions, including certain sales targets, are met. Our otherlicense agreements have terms with expirations ranging from 2012 to 2031, and, typically, haverenewal terms dependent on sales targets being achieved. Many of our license agreements are subjectto our obligation to make required minimum royalty payments, minimum advertising andpromotional expenditures and/or, in some cases, meet minimum sales requirements.
We also have the right under various exclusive distributor and license agreements and otherarrangements to distribute other fragrances in various territories and to use the trademarks of thirdparties in connection with the sale of these products.
Certain of our skin care and cosmetic products, including the Prevage skin care line,incorporate patented or patent-pending formulations. In addition, several of our packaging methods,packages, components and products are covered by design patents, patent applications andcopyrights. Substantially all of our trademarks and patents are held by us or by one of our wholly-owned United States subsidiaries.
Sales and Distribution
We sell our prestige beauty products to retailers in the United States, including departmentstores such as Macy’s, Dillard’s, Saks, Belk, Bloomingdales and Nordstrom; specialty stores such asUlta and Sephora; and mass retailers such as Wal-Mart, Target, Kohl’s, Walgreens, CVS andMarmaxx; and to international retailers such as Boots, Debenhams, Superdrug Stores, The PerfumeShop, Hudson’s Bay, Shoppers Drug Mart, Myer, Douglas and various travel retail outlets such asNuance, Heinemann and World Duty Free. We also sell products to independent fragrance,cosmetic, gift and other stores. We currently sell our skin care and cosmetics products in NorthAmerica primarily in prestige department and specialty stores. We also sell our fragrances, skin careand cosmetic products in approximately 120 other countries worldwide primarily throughdepartment stores, perfumeries, pharmacies, specialty retailers, and other retail shops and “dutyfree” and travel retail locations. In certain countries, we maintain a dedicated sales force that solicitsorders and provides customer service. In other countries and jurisdictions, we sell our productsthrough local distributors or sales representatives under contractual arrangements. We manage ouroperations outside of North America from our offices in Geneva, Switzerland.
We also sell our Elizabeth Arden products in a number of outlet stores throughout the UnitedStates in which we also sell several of our other products. Our owned products are also marketedand sold through our e-commerce site at www.elizabetharden.com. In addition, our Elizabeth Ardenproducts are sold in Red Door beauty salons, which are owned and operated by an unrelated thirdparty. In addition to the sales price of our products sold to the operator of these salons, we receive aroyalty based on the net sales from each of the salons for the use of the “Elizabeth Arden” and “RedDoor” trademarks.
16
Our sales personnel are organized by geographic market and by customer account. In addition,in North America, we have sales personnel who routinely visit prestige retailers to assist in themerchandising, layout and stocking of selling areas. For many of our mass retailers in the UnitedStates and Canada, we sell basic products in customized packaging designed to deter theft andpermit the products to be sold in open displays. Our fulfillment capabilities enable us to reliablyprocess, assemble and ship small orders, as well as large orders, on a timely basis. In the UnitedStates and Canada, we use this ability to assist our customers in their retail distribution by shippingin multiple formats including “cross dock shipping” where we pack by store and ship to thecustomer’s distribution center, bulk shipment directly to distribution centers and direct-to-storeshipment.
As is customary in the beauty industry, sales to customers are generally made pursuant topurchase orders, and we do not have long-term or exclusive contracts with any of our retailcustomers. We believe that our continuing relationships with our customers are based upon ourability to provide a wide selection and reliable source of prestige beauty products, our expertise inmarketing and new product introduction, and our ability to provide value-added services, includingour category management services, to U.S. mass retailers.
Our ten largest customers accounted for approximately 36% of net sales for the year endedJune 30, 2012. The only customer that accounted for more than 10% of our net sales during thatperiod was Wal-Mart (including Sam’s Club), which accounted for approximately 13% of ourconsolidated net sales and approximately 20% of our North America segment net sales. The loss of,or a significant adverse change in our relationship with, any of our largest customers could have amaterial adverse effect on our business, prospects, results of operations, financial condition or cashflows.
The industry practice for businesses that market beauty products has been to grant certainretailers (primarily North American prestige department stores and specialty beauty stores), subjectto our authorization and approval, the right to either return merchandise or to receive a markdownallowance for certain products. We establish estimated return reserves and markdown allowances atthe time of sale based upon our level of sales, historical and projected experience with productreturns and markdowns in each of our business segments and with respect to each of our producttypes, current economic trends and changes in customer demand and customer mix. Our returnreserves and markdown allowances are reviewed and updated as needed during the year, andadditions to these reserves and allowances may be required. Additions to these reserves andallowances may have a negative impact on our financial results.
Marketing
Our marketing approach is focused on generating strong demand across our key brands. Weemphasize competitive positioning for each brand and ensure that our brand positioning is carriedthrough all consumer touch points. We employ traditional consumer reach vehicles, such astelevision and magazine print advertising, and are increasingly leveraging new media such as socialnetworking, mobile, and digital applications so that we are able to engage with our consumersthrough their preferred technologies. As part of the Elizabeth Arden brand repositioning, ourcommunications have been designed to reflect a consistent, equity-building, modern point of view todrive new relevance among women.
We have developed global growth strategies for our key brands that we believe are designed todeliver sales, margin, and market share improvements. Our Elizabeth Arden brand repositioningefforts are focused on modernizing the brand and leveraging our unique Red Door Spa heritage togenerate both organic and innovation-driven growth. We believe that our newly repackaged andreformulated Elizabeth Arden brand products, including our new line of Visible Difference skin careessentials, will help us to achieve organic growth of the brand. We also believe that innovation iscritical in the beauty category, and we intend to focus our innovation resources on what we believeare the most significant opportunities for growth, while also emphasizing profitability.
17
We believe that our marketing function is structured to meet the changing needs of the globalbeauty marketplace. We maintain a global marketing group in New York, which is accountable forglobal strategic planning and the development needs of most of our brands. We also maintainregional marketing teams responsible for translating and customizing global marketing strategies tothe needs of the local markets. We believe this organizational structure supports our growthstrategies and is consistent with best practices in the industry. We also work with the Red Door Spaorganization to co-leverage its unique association with the Elizabeth Arden brand.
Our marketing programs are also integrated with significant cooperative advertising programsthat we plan and execute with our retailers, often linked with new product innovation andpromotions. In our department store and perfumery accounts, we periodically promote our brandswith “gift with purchase” and “purchase with purchase” programs. At in-store counters, salesrepresentatives offer personal demonstrations to market individual products. We also engage inextensive sampling programs.
During fiscal 2012, we introduced several new products across the Elizabeth Arden skincare,fragrance, and color categories, as well as for several of our fragrance brands, including BritneySpears, Juicy Couture, Curve, Rocawear and John Varvatos. We also debuted the first fragranceunder our license agreement with Taylor Swift. In fiscal 2013, we plan to launch the new VisibleDifference entry level skin care regimen, Prevage Anti-Aging + Intensive Repair Daily Serum, severalnew Ceramide skin care products, and a new Red Door fragrance, Red Door Aura. We also plan tolaunch several fragrances, including our second fragrance for Taylor Swift, Justin Beiber’sGirlfriend, the first fragrance for Nicki Minaj, and new fragrances for Britney Spears, Juicy Couture,Lucky and John Varvatos.
Seasonality
Our operations have historically been seasonal, with higher sales generally occurring in the firsthalf of our fiscal year as a result of increased demand by retailers in anticipation of and during theholiday season. For the year ended June 30, 2012, approximately 59% of our net sales were madeduring the first half of our fiscal year. Due to product innovations and new product launches, thesize and timing of certain orders from our customers, and additions or losses of brand distributionrights, sales, results of operations, working capital requirements and cash flows can varysignificantly between quarters of the same and different years. As a result, we expect to experiencevariability in net sales, operating margin, net income, working capital requirements and cash flowson a quarterly basis. Increased sales of skin care and cosmetic products relative to fragrances mayreduce the seasonality of our business.
We experience seasonality in our working capital, with peak inventory levels normally from Julyto October and peak receivable balances normally from September to December. Our workingcapital borrowings are also seasonal and are normally highest in the months of September, Octoberand November. During the months of December, January and February of each year, cash isnormally generated as customer payments on holiday season orders are received.
Manufacturing, Supply Chain and Logistics
We use third-party suppliers and contract manufacturers in the United States and Europe toobtain substantially all of our raw materials, components and packaging products and tomanufacture substantially all of our finished products relating to our owned and licensed brands.Our fragrance and skin care products have primarily been manufactured by Cosmetic Essence LLC(CEI), an unrelated third party, in plants located in New Jersey and Roanoke, Virginia, though wealso use other third parties in the United States to manufacture our fragrance and cosmetic products.In fiscal 2012, we shifted the manufacturing of many of our skin care products to additional thirdparties. Third parties in Europe also manufacture certain of our fragrance and cosmetic products,and we also have a small manufacturing facility in South Africa primarily to manufacture localrequirements of our products.
18
We primarily use a “turnkey” manufacturing model with the majority of our contractmanufacturers in the United States and Europe, including CEI. Under the “turnkey” manufacturingmodel, our contract manufacturers assume administrative responsibility for planning andpurchasing raw materials and components, while we continue to direct strategic sourcing and pricingwith important raw materials and components vendors. Any supply chain disruptions may adverselyaffect our business, prospects, results of operations, financial condition or cash flows.
As is customary in our industry, historically we have not had long-term or exclusive agreementswith contract manufacturers of our owned and licensed brands or with fragrance manufacturers orsuppliers of our distributed brands and have generally made purchases through purchase orders. Wedo, however, enter into supply agreements for finished goods with our most significant “turnkey”manufacturers of our owned and licensed brands. We believe that we have good relationships withmanufacturers of our owned and licensed brands and that there are alternative sources should one ormore of these manufacturers become unavailable. We receive our distributed brands in finishedgoods form directly from fragrance manufacturers, as well as from other sources. Sales of fragrancebrands that we distribute on a non-exclusive basis accounted for approximately 13% of our net salesfor fiscal 2012. The loss of, or a significant adverse change in our relationship with, any of our keymanufacturers for our owned and licensed brands, such as CEI, or suppliers of our distributedfragrance brands, could have a material adverse effect on our business, prospects, results ofoperations, financial condition or cash flows.
Our fulfillment operations for the United States and certain other areas of the world areconducted out of a leased distribution facility in Roanoke, Virginia. The 400,000 square-footRoanoke facility accommodates our distribution activities and houses a large portion of ourinventory. We also lease 274,000 square feet in a warehouse facility in Salem, Virginia, primarilydedicated to assembly of our promotional gift sets. Our fulfillment operations for Europe areconducted under a logistics services agreement by CEPL, an unrelated third party, at CEPL’sfacility in Beville, France. The CEPL agreement expires in June 2013. While we insure our inventoryand the Roanoke facility, the loss of any of these facilities or the inventory stored in those facilities,would require us to find replacement facilities or inventory and could have a material adverse effecton our business, prospects, results of operations, financial condition or cash flows.
Government Regulation
We and our products are subject to regulation by the Food and Drug Administration, theFederal Trade Commission and state regulatory authorities in the United States, as well as byvarious other federal, local and international regulatory authorities in the countries in which ourproducts are produced or sold. Such regulations principally relate to the ingredients, manufacturing,labeling, packaging and marketing of our products. We believe that we are in substantial compliancewith such regulations, as well as with applicable federal, state, local and international rules andregulations governing the discharge of materials hazardous to the environment. Changes in suchregulations, or in the manner in which such regulations are interpreted, applied, or enforced, couldhave a material adverse effect on our business, prospects, results of operations, financial condition orcash flows.
Management Information Systems
Our primary information technology systems discussed below provide a complete portfolio ofbusiness systems, business intelligence systems, and information technology infrastructure servicesto support our global operations:
• Logistics and supply chain systems, including purchasing, materials management,manufacturing, inventory management, order management, customer service, pricing,demand planning, warehouse management and shipping;
• Financial and administrative systems, including general ledger, payables, receivables,personnel, payroll, tax, treasury and asset management;
19
• Electronic data interchange systems to enable electronic exchange of order, status, invoice,and financial information with our customers, financial service providers and our partnerswithin the extended supply chain;
• Business intelligence and business analysis systems to enable management’s informationalneeds as they conduct business operations and perform business decision making; and
• Information technology infrastructure services to enable seamless integration of our globalbusiness operations through Wide Area Networks (WAN), personal computingtechnologies, electronic mail, and service agreements providing outsourced computingoperations.
These management information systems and infrastructure provide on-line business processsupport for our global business operations. Further, many of these capabilities have been extendedinto the operations of certain of our U.S. customers and third party service providers to enhancethese arrangements, with examples such as vendor managed inventory, third party distribution,third party manufacturing, inventory replenishment, customer billing, retail sales analysis, productavailability, pricing information and transportation management.
We outsource substantially all of our data center operations to IBM, a leading globalinformation services and technology provider. Substantially all of our data center operations arelocated in a facility in Raleigh, North Carolina. IBM also provides us with certain backup capabilitiesto enhance the reliability of our management information systems, which are designed to continue tooperate if our primary computer systems should fail. We use service level agreements and operatingmetrics to help us monitor and assess the performance of our outsourced data center operations. Wealso have business interruption insurance to cover a portion of lost income or additional expensesassociated with disruptions to our business, including our management information systems,resulting from certain casualties. Our business, results of operations, financial condition or cash flowmay, however, be adversely affected if our outsourced data center operations facilities are damagedor otherwise fail and/or our backup capabilities do not or cannot perform as intended.
Competition
The beauty industry is highly competitive and can change rapidly due to consumer preferencesand industry trends. Competition in the beauty industry is based on brand strength, pricing andassortment of products, in store presence and visibility, innovation, perceived value, productavailability, order fulfillment, service to the customer, promotional activities, advertising, specialevents, new product introductions, e-commerce and mobile commerce initiatives, and otheractivities.
We believe that we compete primarily on the basis of brand recognition, quality, productefficacy, price, and our emphasis on providing value-added customer services, including categorymanagement services, to certain retailers. There are products that are better-known and morepopular than the products manufactured or supplied by us. Many of our competitors aresubstantially larger and more diversified, and have substantially greater financial and marketingresources than we do, as well as greater name recognition and the ability to develop and marketproducts similar to, and competitive with, those manufactured by us.
Employees
As of August 10, 2012, we had approximately 2,357 full-time employees and approximately432 part-time employees in the United States and 17 foreign countries. None of our employees arecovered by a collective bargaining agreement. We believe that our relationship with our employees issatisfactory.
20
Executive Officers of the Company
The following sets forth the names and ages of each of our executive officers as of August 10,2012 and the positions they hold:
Name Age Position with the Company
E. Scott Beattie . . . . . . . . . . . . 53 Chairman, President and Chief Executive OfficerStephen J. Smith . . . . . . . . . . 52 Executive Vice President and Chief Financial OfficerJoel B. Ronkin . . . . . . . . . . . . 44 Executive Vice President, General Manager — North AmericaPierre Pirard . . . . . . . . . . . . . . 44 Executive Vice President — Product Innovation and Global
Supply ChainKathy Widmer . . . . . . . . . . . . 50 Executive Vice President and Chief Marketing OfficerOscar E. Marina . . . . . . . . . . . 53 Executive Vice President, General Counsel and SecretaryL. Hoy Heise . . . . . . . . . . . . . 66 Executive Vice President and Chief Information OfficerDirk Trappmann . . . . . . . . . . 51 Executive Vice President, General Manager — International
Each of our executive officers holds office for such term as may be determined by our board ofdirectors. Set forth below is a brief description of the business experience of each of our executiveofficers.
E. Scott Beattie has served as Chairman of our Board of Directors since April 2000, as ourChief Executive Officer since March 1998, and as one of our directors since January 1995.Mr. Beattie also has served as our President since August 2006, a position he also held from April1997 to March 2003. In addition, Mr. Beattie served as our Chief Operating Officer from April 1997to March 1998, and as Vice Chairman of the Board of Directors from November 1995 to April 1997.Mr. Beattie is also Chairman of the board of directors of the Personal Care Products Council, theU.S. trade association for the global cosmetic and personal care products industry, a member of theadvisory board of the Ivey Business School, and a member of the board of directors and the auditand finance committee of the board of directors of PENCIL, a not-for-profit organization thatbenefits New York City public schools.
Stephen J. Smith has served as our Executive Vice President and Chief Financial Officer sinceMay 2001. Previously, Mr. Smith was with PricewaterhouseCoopers LLP, an internationalprofessional services firm, as partner from October 1993 until May 2001, and as manager from July1987 until October 1993.
Joel B. Ronkin has served as our Executive Vice President, General Manager — North Americasince July 2010, as our Executive Vice President, General Manager — North America Fragrancesfrom July 2006 to July 2010, as our Executive Vice President and Chief Administrative Officer fromApril 2004 to June 2006, as our Senior Vice President and Chief Administrative Officer fromFebruary 2001 through March 2004, and as our Vice President, Associate General Counsel andAssistant Secretary from March 1999 through January 2001. From June 1997 through March 1999,Mr. Ronkin served as the Vice President, Secretary and General Counsel of National Auto FinanceCompany, Inc., an automobile finance company. From May 1992 to June 1997, Mr. Ronkin was anattorney with the law firm of Steel Hector & Davis L.L.P. in Miami, Florida.
Pierre Pirard has served as our Executive Vice President, Product Innovation and GlobalSupply Chain since February 2010. From November 2007 until February 2010, he served as ourSenior Vice President, Global Supply Chain. Prior to joining us, Mr. Pirard spent 15 years atJohnson & Johnson where he held numerous positions, including serving as Regional Director,External Manufacturing North America — Consumer Sector, from 2005 until 2007; as RegionalDirector — Supply Chain Planning North America — Consumer Sector from 2001 to 2005; and invarious positions in the finance, project management, supply and logistics groups for Johnson &Johnson Canada from 1992 to 2000.
21
Kathy Widmer has served as our Executive Vice President and Chief Marketing Officer sinceNovember 2009. Prior to joining us, Ms. Widmer was with Johnson & Johnson for 21 years whereshe held numerous positions, including, most recently, serving as Vice President, Marketing, McNeilConsumer Healthcare from May 2008 until November 2009. Prior to May 2008, Ms. Widmer servedas Franchise Director and Product Director for various Johnson and Johnson consumer products,including Tylenol, Motrin, Reach Oral Care, and Pepcid from August 1996 until April 2008.
Oscar E. Marina has served as our Executive Vice President, General Counsel and Secretarysince April 2004, as our Senior Vice President, General Counsel and Secretary from March 2000 toMarch 2004, and as our Vice President, General Counsel and Secretary from March 1996 to March2000. From October 1988 to March 1996, Mr. Marina was an attorney with the law firm of SteelHector & Davis L.L.P. in Miami, Florida, becoming a partner of the firm in January 1995.
L. Hoy Heise has served as our Executive Vice President and Chief Information Officer sinceNovember 2007, as our Executive Vice President, Chief Information Officer and OperationsPlanning from March 2006 to November 2007, and as our Senior Vice President and ChiefInformation Officer from May 2004 to February 2006. From February 2003 to April 2004,Mr. Heise was the founder and principal of his own technology consulting firm. From June 1999until May 2001, Mr. Heise was Senior Vice President of Gartner, an information technology researchfirm. Prior to that time, Mr. Heise worked in various management and consulting capacities forRenaissance Worldwide, a global provider of business process improvement and informationtechnology consulting services.
Dirk Trappman has served as our Executive Vice President, General Manager — Internationalsince October 2010. Prior to joining us, Mr. Trappmann was with La Prairie Group, where he heldthe position of President and Chief Executive Officer for over five years. Before his position at LaPrairie Group, Mr. Trappmann spent thirteen years with Beiersdorf AG in numerous managementpositions, including Managing Director Thailand/Indochina and International MarketingDirector. Mr. Trappmann currently serves on the board of directors of Cosmetics Europe, theEuropean cosmetic trade association.
ITEM 1A. RISK FACTORS
The risk factors in this section describe the major risks to our business, prospects, results ofoperations, financial condition and cash flows, and should be considered carefully. In addition, thesefactors constitute our cautionary statements under the Private Securities Litigation Reform Act of1995 and could cause our actual results to differ materially from those projected in any forward-looking statements (as defined in such act) made in this Annual Report on Form 10-K. Investorsshould not place undue reliance on any such forward-looking statements. Any statements that arenot historical facts and that express, or involve discussions as to, expectations, beliefs, plans,objectives, assumptions or future events or performance (often, but not always, through the use ofwords or phrases such as “will likely result,” “are expected to,” “will continue,” “is anticipated,”“estimated,” “intends,” “plans,” “believes” and “projects”) may be forward-looking and mayinvolve estimates and uncertainties which could cause actual results to differ materially from thoseexpressed in the forward-looking statements.
Further, any forward-looking statement speaks only as of the date on which such statement ismade, and we undertake no obligation to update any forward-looking statement to reflect events orcircumstances after the date on which such statement is made or to reflect the occurrence ofanticipated or unanticipated events or circumstances. New factors emerge from time to time, and itis not possible for us to predict all of such factors. Further, we cannot assess the impact of each suchfactor on our results of operations or the extent to which any factor, or combination of factors, maycause actual results to differ materially from those contained in any forward-looking statements.
22
We may be adversely affected by factors affecting our customers’ businesses.
Factors that adversely impact our customers’ businesses may also have an adverse effect on ourbusiness, prospects, results of operations, financial condition or cash flows. These factors mayinclude:
• any reduction in consumer traffic and demand as a result of economic downturns likedomestic and global recessions;
• any credit risks associated with the financial condition of our customers;
• the effect of consolidation or weakness in the retail industry, including the closure ofcustomer doors and the uncertainty resulting therefrom; and
• inventory reduction initiatives and other factors affecting customer buying patterns,including any reduction in retail space commitment to fragrances and cosmetics andretailer practices used to control inventory shrinkage.
Fluctuations in foreign exchange rates could adversely affect our results of operations andcash flows.
We sell our products in approximately 120 countries around the world. During each of the yearsended June 30, 2012 and 2011, we derived approximately 42% and 40%, respectively of our netsales from our international operations. We conduct our international operations in a variety ofdifferent countries and derive our sales in various currencies including the Euro, British pound,Swiss franc, Canadian dollar and Australian dollar, as well as the U.S. dollar. Most of our skin careand cosmetic products are produced in third-party manufacturing facilities located in the U.S. Ouroperations may be subject to volatility because of currency changes, inflation changes and changesin political and economic conditions in the countries in which we operate. With respect tointernational operations, our sales, cost of goods sold and expenses are typically denominated in acombination of local currency and the U.S. dollar. Our results of operations are reported in U.S.dollars. Fluctuations in currency rates can affect our reported sales, margins, operating costs and theanticipated settlement of our foreign denominated receivables and payables. A weakening of theforeign currencies in which we generate sales relative to the currencies in which our costs aredenominated, which is primarily the U.S. dollar, could adversely affect our business, prospects,results of operations, financial condition or cash flows. Our competitors may or may not be subjectto the same fluctuations in currency rates, and our competitive position could be affected by thesechanges.
We do not have contracts with customers or with suppliers of our distributed brands, so ifwe cannot maintain and develop relationships with such customers and suppliers ourbusiness, prospects, results of operations, financial condition or cash flows may bematerially adversely affected.
We do not have long-term or exclusive contracts with any of our customers and generally do nothave long-term or exclusive contracts with our suppliers of distributed brands. Our ten largestcustomers accounted for approximately 36% of our net sales in the year ended June 30, 2012. Ouronly customer who accounted for more than 10% of our net sales in the year ended June 30, 2012was Wal-Mart (including Sam’s Club), who accounted for approximately 13% of our consolidatednet sales and approximately 20% of our North America segment net sales. In addition, our suppliersof distributed brands, which represented approximately 13% of our net sales for fiscal 2012,generally can, at any time, elect to supply products to our customers directly or through anotherdistributor. Our suppliers of distributed brands may also choose to reduce or eliminate the volume oftheir products distributed by us. The loss of any of our key suppliers or customers, or a change inour relationship with any one of them, could have a material adverse effect on our business,prospects, results of operations, financial condition or cash flows.
23
We depend on various licenses for a significant portion of our sales, and the loss of one ormore licenses or agreements could have a material adverse effect on us.
Our rights to market and sell certain of our prestige fragrance brands are derived from licensesfrom unaffiliated third parties and our business is dependent upon the continuation and renewal ofsuch licenses on terms favorable to us. Each license is for a specific term and may have optionalrenewal terms. In addition, such licenses may be subject to us making required minimum royaltypayments, minimum advertising and promotional expenditures and meeting minimum salesrequirements. Just as the loss of a license or other significant agreement may have a material adverseeffect on us, a renewal on less favorable terms could have a material adverse effect on our business,prospects, results of operations, financial condition or cash flows.
We rely on third-party manufacturers and component suppliers for substantially all of ourowned and licensed products.
We do not own or operate any significant manufacturing facilities. We use third-partymanufacturers and component suppliers to manufacture substantially all of our owned and licensedproducts. Over the past few years, we have reduced the number of third-party manufacturers andcomponent and materials suppliers that we use, and have implemented a “turnkey” manufacturingprocess for substantially all of our products in which we now rely on our third-party manufacturersfor certain supply chain functions that we previously handled ourselves, such as component andmaterials planning, purchasing and warehousing. Our business, prospects, results of operations,financial condition or cash flows could be materially adversely affected if we experience any supplychain disruptions caused by our implementation of this “turnkey” manufacturing process or othersupply chain projects, or if our manufacturers or component suppliers were to experience problemswith product quality, credit or liquidity issues, or disruptions or delays in the manufacturing processor delivery of the finished products or the raw materials or components used to make such products.
The loss of or disruption in our distribution facilities may have a material adverse effect onour business.
We currently have one distribution facility and one promotional set assembly facility in theUnited States and use a third-party fulfillment center in France primarily for European distribution.These facilities house a large portion of our inventory. Although we insure our inventory, any loss,damage or disruption of these facilities, or loss or damage of the inventory stored in them, couldadversely affect our business, prospects, results of operations, financial condition or cash flows.
Our business is subject to regulation in the United States and internationally.
The manufacturing, distribution, formulation, packaging and advertising of our products andthose we distribute for others are subject to numerous federal, state and foreign governmentalregulations. The number of laws and regulations that are being enacted or proposed by state, federaland international governments and governmental authorities are increasing. Compliance with theseregulations is difficult and expensive and may require reformulation, repackaging, relabeling ordiscontinuation of certain of our products. If we fail to adhere, or are alleged to have failed toadhere, to any applicable federal, state or foreign laws or regulations, or if such laws or regulationsnegatively affect sales of our products, our business, prospects, results of operation, financialcondition or cash flows may be adversely affected. In addition, our future results could be adverselyaffected by changes in applicable federal, state and foreign laws and regulations, or theinterpretation or enforcement thereof, including those relating to products or ingredients, productliability, trade rules and customs regulations, intellectual property, consumer laws, privacy laws, aswell as accounting standards and taxation requirements (including tax-rate changes, new tax lawsand revised tax law interpretations).
24
Adverse U.S. or international economic conditions could negatively impact our business,prospects, results of operations, financial condition or cash flows.
We believe that consumer spending on beauty products is influenced by general economicconditions and the availability of discretionary income. Adverse U.S. or international economicconditions, such as global recessions, including the current economic environment in Europe, orperiods of inflation or high energy prices can contribute to higher unemployment levels, decreasedconsumer spending, reduced credit availability and declining consumer confidence and demand,each of which poses risks to our business. A decrease in consumer spending and/or in retailer andconsumer confidence and demand for our products could significantly negatively impact our netsales and profitability, including our operating margins and return on invested capital. Sucheconomic conditions could cause some of our customers or suppliers to experience cash flow and/orcredit problems and impair their financial condition, which could disrupt our business and adverselyaffect product orders, payment patterns and default rates and increase our bad debt expense.Adverse economic conditions could also adversely affect our access to the capital necessary for ourbusiness and our ability to remain in compliance with the financial covenant in our revolving creditfacility that applies only in the event that we do not have the requisite average borrowing basecapacity as set forth in our credit facility. If the recent adverse U.S. and global economic conditionspersist or deteriorate further, our business, prospects, results of operations, financial condition orcash flows could be negatively impacted.
We may be adversely affected by domestic and international events that impact consumerconfidence and demand.
Sudden disruptions in business conditions due to events such as terrorist attacks, diseases ornatural disasters may have a short-term, or sometimes long-term, adverse impact on consumerconfidence and spending. In addition, any reductions in travel or increases in restrictions ontravelers’ ability to transport our products on airplanes due to general economic downturns,diseases, increased security levels, acts of war or terrorism could result in a material decline in thenet sales and profitability of our travel retail business.
The beauty industry is highly competitive and if we cannot effectively compete our businessand results of operations will suffer.
The beauty industry is highly competitive and can change rapidly due to consumer preferencesand industry trends. Competition in the beauty industry is based on brand strength, pricing andassortment of products, in-store presence and visibility, innovation, perceived value, productavailability and order fulfillment, service to the consumer, promotional activities, advertising,special events, new product introductions, e-commerce and mobile commerce initiatives and otheractivities. The trend toward consolidation in the retail trade has resulted in us becoming increasinglydependent on key retailers, including large-format retailers, who have increased their bargainingstrength. This trend has also resulted in an increased risk related to the concentration of ourcustomers. We compete primarily with global prestige beauty companies and multinationalconsumer product companies, some of whom have greater resources than we have and brands withgreater name recognition and consumer loyalty than our brands. Our success depends on ourproducts’ appeal to a broad range of consumers whose preferences cannot be predicted withcertainty and are subject to change, and on our ability to anticipate and respond in a timely andcost-effective manner to market trends through product innovations, product line extensions andmarketing and promotional activities. This issue is compounded by the rapidly increasing use andproliferation of social and digital media by consumers, and the speed with which information andopinions are shared. We may incur expenses in connection with product innovation anddevelopment, marketing and advertising that are not subsequently supported by a sufficient level ofsales, which could negatively affect our results of operations. These competitive factors, as well asnew product risks, could have an adverse effect on our business, prospects, results of operations,financial condition or cash flows.
25
Our business strategy depends upon our ability to increase sales of the Elizabeth Ardenbrand and our prestige fragrance portfolio, as well as our ability to acquire or licenseadditional brands or secure additional distribution arrangements and obtain the requiredfinancing for these agreements and arrangements.
Our business strategy contemplates the continued growth of our portfolio of owned, licensedand distributed brands. Increasing sales of the Elizabeth Arden brand and our prestige fragranceportfolio may require investments that may result in short-term costs without any current revenue.In addition, our future expansion through acquisitions, new product licenses or new productdistribution arrangements, if any, will depend upon our ability to identify suitable brands to acquire,license or distribute and our ability to obtain the required financing for these acquisitions, licensesor distribution arrangements, and thus depends on the capital resources and working capitalavailable to us. We may not be able to identify, negotiate, finance or consummate such acquisitions,licenses or arrangements, or the associated working capital requirements, on terms acceptable to us,or at all, which could hinder our ability to increase revenues and build our business.
The success of our business depends, in part, on the demand for celebrity and designerfragrance products.
We have license agreements to manufacture, market and distribute a number of celebrity anddesigner fragrance products, including those of Elizabeth Taylor, Britney Spears, Taylor Swift,Justin Bieber, Juicy Couture, John Varvatos, Ed Hardy and True Religion. In fiscal 2012, we derivedapproximately 38% of our net sales from celebrity and designer fragrance brands. The demand forthese products is, to some extent, dependent on the appeal to consumers of the particular celebrity ordesigner and the celebrity’s or designer’s reputation. To the extent that the celebrity/designerfragrance category or a particular celebrity or designer ceases to be appealing to consumers or acelebrity’s reputation is adversely affected, sales of the related products and the value of the brandscan decrease materially. In addition, under certain circumstances, lower net sales may shorten theduration of the applicable license agreement.
We may not be able to successfully and cost-effectively integrate acquired businesses or newbrands.
Acquisitions entail numerous integration risks and impose costs on us that could materially andadversely affect our business, prospects, results of operations, financial condition or cash flows,including:
• difficulties in assimilating acquired operations, products or brands, including disruptions toour operations or the unavailability of key employees from acquired businesses;
• diversion of management’s attention from our core business;
• adverse effects on existing business relationships with suppliers and customers;
• incurrence or assumption of additional debt and liabilities, as well as the potential forincreased claims and litigation; and
• incurrence of significant amortization expenses related to intangible assets and thepotential impairment of acquired assets.
Our business could be adversely affected if we are unable to successfully protect ourintellectual property rights.
The market for our products depends to a significant extent upon the value associated with thetrademarks and patents that we own or license. We own, or have licenses or other rights to use, thematerial trademarks and patents used in connection with the ingredients, packaging, marketing anddistribution of our major owned and licensed products both in the U.S. and in other countries wheresuch products are principally sold.
26
Although most of our brand names are registered in the U.S. and in certain foreign countries inwhich we operate, we may not be successful in asserting trademark protection. In addition, the lawsof certain foreign countries may not protect our intellectual property rights to the same extent as thelaws of the U.S. The costs required to protect our trademarks and patents may be substantial. Wealso cannot assure that the owners of the trademarks that we license can or will successfullymaintain their intellectual property rights.
If other parties infringe on our intellectual property rights or the intellectual property rightsthat we license, the value of our brands in the marketplace may be diluted. In addition, anyinfringement of our intellectual property rights would also likely result in a commitment of our timeand resources to protect these rights through litigation or otherwise. We may infringe on others’intellectual property rights, which may result in a reduction in sales or profitability and acommitment of our time and resources to defend through litigation or otherwise. One or moreadverse judgments with respect to these intellectual property rights could negatively impact ourability to compete and could materially adversely affect our business, prospects, results ofoperations, financial condition or cash flows.
If our intangible assets, such as trademarks, patents and goodwill, become impaired, wemay be required to record a significant non-cash charge to earnings which would negativelyimpact our results of operations.
Exclusive brand licenses, trademarks and intangibles comprise a material portion of our totalconsolidated assets. Completed acquisitions, like the recent acquisitions of the licenses for the EdHardy, True Religion, BCBGMAXAZRIA, Justin Bieber and Nicki Minaj fragrance brands, typicallyresult in an increase in other intangibles on our balance sheet. Under accounting principles generallyaccepted in the United States, we review our intangible assets, including our trademarks, patents,licenses and goodwill, for impairment annually, or more frequently if events or changes incircumstances indicate the carrying value of our intangible assets may not be fully recoverable. Thecarrying value of our intangible assets may not be recoverable due to factors such as a decline in ourstock price and market capitalization, reduced estimates of future cash flows, including thoseassociated with the specific brands to which intangibles relate, or slower growth rates in ourindustry. Estimates of future cash flows are based on a long-term financial outlook of our operationsand the specific brands to which the intangible assets relate. However, actual performance in thenear-term or long-term could be materially different from these forecasts, which could impact futureestimates and the recorded value of the intangibles. For example, a significant sustained decline inour stock price and market capitalization may result in impairment of certain of our intangibleassets, including goodwill, and a significant charge to earnings in our financial statements during theperiod in which an impairment is determined to exist. Any such impairment charge could materiallyreduce our results of operations.
We are subject to risks related to our international operations.
We operate on a global basis, with sales in approximately 120 countries. Approximately 42% ofour fiscal 2012 net sales were generated outside of the United States. Our international operationscould be adversely affected by:
• import and export license requirements;
• trade restrictions;
• changes in tariffs and taxes;
• restrictions on repatriating foreign profits back to the United States;
• changes in, or our unfamiliarity with, foreign laws and regulations, including those relatedto product registration, ingredients and labeling, including changes in the interpretation orenforcement of such laws and regulations;
27
• difficulties in staffing and managing international operations; and
• changes in social, political, legal, economic and other conditions.
Unanticipated changes in our tax provisions, the adoption of new tax legislation or exposureto additional tax liabilities could affect our profitability and cash flows.
We are subject to income and other taxes in the United States and numerous foreignjurisdictions. Our effective tax rate in the future could be adversely affected by changes to ouroperating structure, changes in the mix of earnings in countries with differing statutory tax rates,changes in the valuation of deferred tax assets and liabilities, changes in tax laws and the discoveryof new information in the course of our tax return preparation process. In particular, the carryingvalue of deferred tax assets, which are predominantly in the United States, is dependent on ourability to generate future taxable income in the United States. From time to time, tax proposals areintroduced or considered by the United States Congress or the legislative bodies in foreignjurisdictions that could also affect our tax rate, the carrying value of our deferred tax assets, or ourother tax liabilities. Our tax liabilities are also affected by the amounts we charge for inventory,services, licenses, funding and other items in intercompany transactions. We are subject to ongoingtax audits in various jurisdictions, and tax authorities may disagree with our intercompany charges,cross-jurisdictional transfer pricing or other matters and assess additional taxes. We regularly assessthe likely outcomes of these audits in order to determine the appropriateness of our tax provision.However, there can be no assurance that we will accurately predict the outcomes of these audits, andthe amounts ultimately paid upon resolution of audits could be materially different from theamounts previously included in our income tax expense. As a result, the ultimate resolution of thesetax audits, changes in tax laws or tax rates, and the ability to utilize our deferred tax assets couldmaterially affect our tax provision, net income and cash flows in future periods.
Our quarterly results of operations fluctuate due to seasonality and other factors, and wemay not have sufficient liquidity to meet our seasonal working capital requirements.
We generate a significant portion of our net income in the first half of our fiscal year as a resultof higher sales in anticipation of the holiday season. Similarly, our working capital needs are greaterduring the first half of the fiscal year. We may experience variability in net sales and net income ona quarterly basis as a result of a variety of factors, including new product innovations and launches,the size and timing of customer orders and additions or losses of brand distribution rights. If wewere to experience a significant shortfall in sales or internally generated funds, we may not havesufficient liquidity to fund our business.
Our level of debt and debt service obligations, and the restrictive covenants in our revolvingcredit facility and our indenture for our 73⁄8% senior notes, may reduce our operating andfinancial flexibility and could adversely affect our business and growth prospects.
At June 30, 2012, we had total debt of approximately $339 million which includes $250 millionin aggregate principal amount outstanding of our 73⁄8% senior notes and $89 million outstandingunder our revolving bank credit facility, both of which have requirements that may limit ouroperating and financial flexibility. Our indebtedness could adversely impact our business, prospects,results of operations, financial condition or cash flows by increasing our vulnerability to generaladverse economic and industry conditions and restricting our ability to consummate acquisitions orfund working capital, capital expenditures and other general corporate requirements.
Specifically, our revolving credit facility and our indenture for our 73⁄8% senior notes limit orotherwise affect our ability to, among other things:
• incur additional debt;
• pay dividends or make other restricted payments;
28
• create or permit certain liens, other than customary and ordinary liens;
• sell assets other than in the ordinary course of our business;
• invest in other entities or businesses; and
• consolidate or merge with or into other companies or sell all or substantially all of ourassets.
These restrictions could limit our ability to finance our future operations or capital needs, makeacquisitions or pursue available business opportunities. Our revolving credit facility also requires usto maintain specified amounts of borrowing capacity or maintain a debt service coverage ratio. Ourability to meet these conditions and our ability to service our debt obligations will depend upon ourfuture operating performance, which can be affected by general economic, financial, competitive,legislative, regulatory, business and other factors beyond our control. If our actual results deviatesignificantly from our projections, we may not be able to service our debt or remain in compliancewith the conditions contained in our revolving credit facility, and we would not be allowed to borrowunder the revolving credit facility. If we were not able to borrow under our revolving credit facility,we would be required to develop an alternative source of liquidity. We cannot assure you that wecould obtain replacement financing on favorable terms or at all.
A default under our revolving credit facility could also result in a default under our indenturefor our 73⁄8% senior notes. Upon the occurrence of an event of default under our indenture, allamounts outstanding under our other indebtedness may be declared to be immediately due andpayable. If we were unable to repay amounts due on our revolving credit facility, the lenders wouldhave the right to proceed against the collateral granted to them to secure that debt.
Our success depends, in part, on the quality, efficacy and safety of our products.
Our success depends, in part, on the quality, efficacy and safety of our products. If our productsare found to be defective or unsafe, or if they otherwise fail to meet customer or consumerstandards, our relationships with customers or consumers could suffer, the appeal of one or more ofour brands could be diminished, and we could lose sales and/or become subject to liability claims,any of which could have a material adverse effect on our business, prospects, results of operations,financial condition or cash flows.
Our success depends upon the retention and availability of key personnel and the successionof senior management.
Our success largely depends on the performance of our management team and other keypersonnel. Our future operations could be harmed if we are unable to attract and retain talented,highly qualified senior executives and other key personnel. In addition, if we are unable to effectivelyprovide for the succession of senior management, including our chief executive officer, our business,prospects, results of operations, financial condition or cash flows may be materially adverselyaffected.
The market price of our common stock may fluctuate as a result of a variety of factors.
The market price of our common stock could fluctuate significantly in response to variousfactors, many of which are beyond our control, including:
• volatility in the financial markets;
• actual or anticipated variations in our quarterly or annual financial results;
• announcements or significant developments with respect to beauty products or the beautyindustry in general;
• general economic and political conditions;
29
• governmental policies and regulations; and
• financial analyst and rating agency actions.
Our global information systems are subject to outages, hacking and other risks and thefailure to adequately maintain the security of our electronic and confidential informationcould materially adversely affect our financial condition and results of operations.
We have information systems that support our business processes, including supply chain,marketing, sales, order processing, distribution, finance and intracompany communicationsthroughout the world. All of our global information systems are susceptible to outages due to fire,floods, tornadoes, hurricanes, power loss, telecommunications failures, security breaches and similarevents. Despite the implementation of network security measures, our systems may also bevulnerable to computer viruses, “hacking” and similar disruptions from unauthorized tampering.Our business, prospects, results of operations, financial condition or cash flows may be adverselyaffected by the occurrence of these or other events that could disrupt or damage our informationsystems, and/or any failure to properly maintain or upgrade our information systems.
In addition, as part of our normal business activities, we collect and store certain confidentialinformation, including personal information with respect to customers and employees. In addition,the success of our e-commerce operations depends on the secure transmission of confidential andpersonal data over public networks, including the use of cashless payments. Any failure on the partof us or our vendors to properly maintain the security of our confidential data and our employees’and customers’ personal information could result in business disruption, damage to our reputation,financial obligations to third parties, fines, penalties, regulatory proceedings and private litigationwith potentially large costs and other competitive disadvantages, and could accordingly have amaterial adverse impact on our business, financial condition and results of operations.
We outsource certain functions, making us dependent on the entities and facilitiesperforming those functions.
We are continually looking for opportunities to secure essential business services in a more cost-effective manner, without impacting the quality of the service rendered. In some cases, this requiresthe outsourcing of functions or parts of functions that can be performed more effectively by externalservice providers. These include certain information systems functions such as informationtechnology operations, certain human resource functions such as payroll processing and employeebenefit plan administration, and our European logistics management. We believe that we conductappropriate due diligence before entering into agreements with the outsourcing entity, and we useservice level agreements and operating metrics to monitor and assess performance. We believe thefailure of one or more entities to properly provide the expected services without disruption, providethem on a timely basis or to provide them at the prices we expect may have a material adverse effecton our results of operations or financial condition. In addition, substantially all of our data centeroperations are located in a facility in Raleigh, North Carolina, and any loss of or damage to thefacility could have a material adverse effect on our business, results of operations, prospects,financial condition or cash flows.
ITEM 1B. UNRESOLVED STAFF COMMENTS
Not applicable.
ITEM 2. PROPERTIES
United States. Our corporate headquarters are located in Miramar, Florida, where we leaseapproximately 32,000 square feet of general office space under a lease that expires in June 2016.Our U.S. fulfillment operations are conducted in our Roanoke, Virginia distribution facility thatconsists of approximately 400,000 square feet and is leased through September 2023. We also lease
30
(i) a 76,000-square foot warehouse in Roanoke to coordinate returns processing that is leasedthrough December 2015, and (ii) a 274,000-square foot warehouse in Salem, Virginia that is leasedthrough March 2016. From time to time, we also lease additional temporary warehouse facilities tohandle inventory overflow. We lease 50,000 square feet of general office space for our supply chain,information systems and finance operations in Stamford, Connecticut under a lease that expiresOctober 2021. We lease approximately 49,500 square feet of general offices primarily for ourmarketing operations in New York City under a lease that expires in October 2017. We also leasesmall offices in Bentonville, Arkansas and Minneapolis, Minnesota, and have retail outlet stores thatare located in Florida, New York, Texas, and Georgia for which we lease approximately 1,000 to2,000 square feet, depending on the location.
International. Our international operations are headquartered in offices in Geneva,Switzerland that are leased through 2017. We also lease sales offices in Australia, Canada, China,Denmark, France, Italy, Korea, New Zealand, Puerto Rico, Singapore, South Africa, Spain, Taiwan,and the United Kingdom. We own a small manufacturing and distribution facility in South Africaprimarily to manufacture and distribute local requirements of our products.
We believe that additional office, warehouse and retail space suitable for our needs isreasonably available in the markets in which we operate.
ITEM 3. LEGAL PROCEEDINGS
We are a party to a number of legal actions, proceedings, claims and disputes, arising in theordinary course of business, including those with current and former customers over amounts owed.While any action, proceeding or claim contains an element of uncertainty and it is possible that ourcash flows and results of operations in a particular quarter or year could be materially affected bythe impact of such actions, proceedings, claims and disputes, based on current facts andcircumstances our management believes that the outcome of such actions, proceedings, claims anddisputes will not have a material adverse effect on our business, prospects, results of operations,financial condition or cash flows.
ITEM 4. MINE SAFETY DISCLOSURES
Not applicable.
31
PART II
ITEM 5. MARKET FOR REGISTRANT’S COMMON EQUITY, RELATED STOCKHOLDERMATTERS AND ISSUER PURCHASES OF EQUITY SECURITIES
Market Information. Our common stock, $.01 par value per share, has been traded on theNASDAQ Global Select Market under the symbol “RDEN” since January 25, 2001. The followingtable sets forth the high and low sales prices for our common stock, as reported by NASDAQ foreach of our fiscal quarters from July 1, 2010 through June 30, 2012.
Quarter Ended High Low
6/30/12 . . . . . . . . . . . . . . . . . . . . . . . . . . . . . . . . . . . . . . . . . . . . . . . . . . . $40.19 $32.733/31/12 . . . . . . . . . . . . . . . . . . . . . . . . . . . . . . . . . . . . . . . . . . . . . . . . . . . $39.96 $30.9612/31/11 . . . . . . . . . . . . . . . . . . . . . . . . . . . . . . . . . . . . . . . . . . . . . . . . . . $37.94 $28.039/30/11 . . . . . . . . . . . . . . . . . . . . . . . . . . . . . . . . . . . . . . . . . . . . . . . . . . . $34.62 $25.866/30/11 . . . . . . . . . . . . . . . . . . . . . . . . . . . . . . . . . . . . . . . . . . . . . . . . . . . $31.84 $26.503/31/11 . . . . . . . . . . . . . . . . . . . . . . . . . . . . . . . . . . . . . . . . . . . . . . . . . . . $31.00 $22.9312/31/10 . . . . . . . . . . . . . . . . . . . . . . . . . . . . . . . . . . . . . . . . . . . . . . . . . . $24.00 $18.889/30/10 . . . . . . . . . . . . . . . . . . . . . . . . . . . . . . . . . . . . . . . . . . . . . . . . . . . $20.00 $13.69
Holders. As of August 8, 2012, there were 351 record holders of our common stock. Thenumber of record holders does not include beneficial owners of common stock whose shares are heldin the names of banks, brokers, nominees or other fiduciaries.
Dividends. We have not declared any cash dividends on our common stock since we became abeauty products company in 1995, and we currently have no plans to declare dividends on ourcommon stock in the foreseeable future. Any future determination by our board of directors to paydividends on our common stock will be made only after considering our financial condition, resultsof operations, capital requirements and other relevant factors. Additionally, our revolving creditfacility and the indenture relating to our 73⁄8% senior notes due 2021 restrict our ability to pay cashdividends based upon our ability to satisfy certain financial covenants, including having a certainamount of borrowing capacity and satisfying a fixed charge coverage ratio after the payment of thedividends. See Notes 8 and 9 to the Notes to Consolidated Financial Statements.
Performance Graph. The following performance graph data and table compare the cumulativetotal shareholder returns, including the reinvestment of dividends, on our common stock with theRussell 2000 Index and a market-weighted index of publicly traded peer companies for the fivefiscal years from July 1, 2007 through June 30, 2012.
The publicly traded companies in our peer group are The Estee Lauder Companies Inc.,International Flavors and Fragrances, Inc., Inter Parfums, Inc., Physicians Formula Holdings, Inc.,and Revlon, Inc. We believe that our peer group is a good representation of beauty companies withsimilar market capitalizations, channels of distribution and/or products as our company. The graphand table assume that $100 was invested on June 30, 2007 in each of the Russell 2000 Index, thepeer group, and our common stock, and that all dividends were reinvested.
[Remainder of page intentionally left blank.]
32
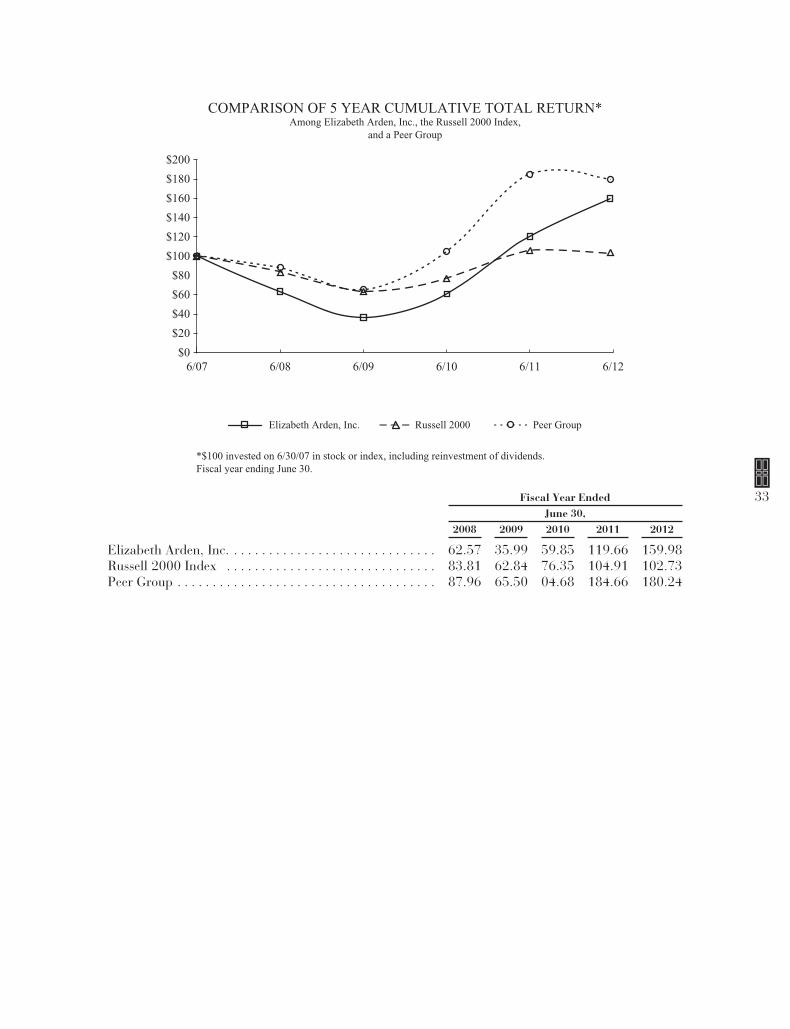
6/07 6/08
*$100 invested on 6/30/07 in stock or index, including reinvestment of dividends.Fiscal year ending June 30.
6/09 6/10 6/11 6/12
COMPARISON OF 5 YEAR CUMULATIVE TOTAL RETURN*Among Elizabeth Arden, Inc., the Russell 2000 Index,
and a Peer Group
Elizabeth Arden, Inc. Russell 2000 Peer Group
$0
$20
$40
$60
$80
$120
$100
$200
$140
$160
$180
Fiscal Year EndedJune 30,
2008 2009 2010 2011 2012
Elizabeth Arden, Inc. . . . . . . . . . . . . . . . . . . . . . . . . . . . . . 62.57 35.99 59.85 119.66 159.98Russell 2000 Index . . . . . . . . . . . . . . . . . . . . . . . . . . . . . . 83.81 62.84 76.35 104.91 102.73Peer Group . . . . . . . . . . . . . . . . . . . . . . . . . . . . . . . . . . . . . 87.96 65.50 04.68 184.66 180.24
33
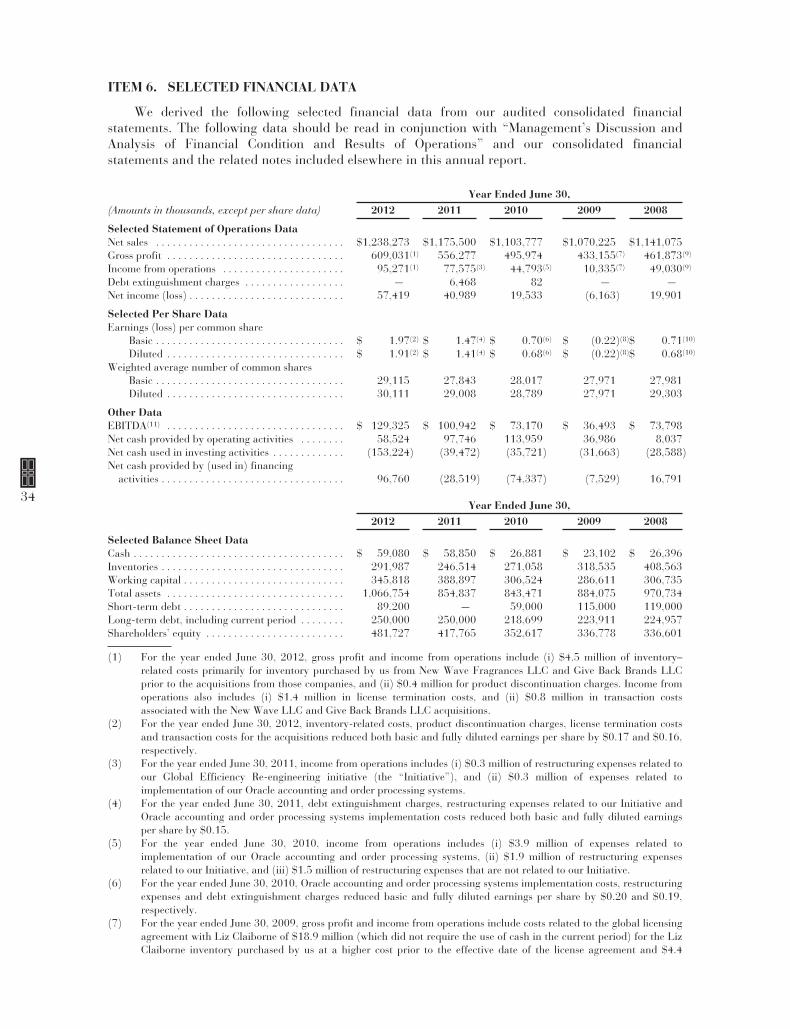
ITEM 6. SELECTED FINANCIAL DATA
We derived the following selected financial data from our audited consolidated financialstatements. The following data should be read in conjunction with “Management’s Discussion andAnalysis of Financial Condition and Results of Operations” and our consolidated financialstatements and the related notes included elsewhere in this annual report.
Year Ended June 30,(Amounts in thousands, except per share data) 2012 2011 2010 2009 2008
Selected Statement of Operations DataNet sales . . . . . . . . . . . . . . . . . . . . . . . . . . . . . . . . . . $1,238,273 $1,175,500 $1,103,777 $1,070,225 $1,141,075Gross profit . . . . . . . . . . . . . . . . . . . . . . . . . . . . . . . . 609,031(1) 556,277 495,974 433,155(7) 461,873(9)
Income from operations . . . . . . . . . . . . . . . . . . . . . . 95,271(1) 77,575(3) 44,793(5) 10,335(7) 49,030(9)
Debt extinguishment charges . . . . . . . . . . . . . . . . . . — 6,468 82 — —Net income (loss) . . . . . . . . . . . . . . . . . . . . . . . . . . . . 57,419 40,989 19,533 (6,163) 19,901
Selected Per Share DataEarnings (loss) per common share
Basic . . . . . . . . . . . . . . . . . . . . . . . . . . . . . . . . . . $ 1.97(2) $ 1.47(4) $ 0.70(6) $ (0.22)(8)$ 0.71(10)
Diluted . . . . . . . . . . . . . . . . . . . . . . . . . . . . . . . . $ 1.91(2) $ 1.41(4) $ 0.68(6) $ (0.22)(8)$ 0.68(10)
Weighted average number of common sharesBasic . . . . . . . . . . . . . . . . . . . . . . . . . . . . . . . . . . 29,115 27,843 28,017 27,971 27,981Diluted . . . . . . . . . . . . . . . . . . . . . . . . . . . . . . . . 30,111 29,008 28,789 27,971 29,303
Other DataEBITDA(11) . . . . . . . . . . . . . . . . . . . . . . . . . . . . . . . . $ 129,325 $ 100,942 $ 73,170 $ 36,493 $ 73,798Net cash provided by operating activities . . . . . . . . 58,524 97,746 113,959 36,986 8,037Net cash used in investing activities . . . . . . . . . . . . . (153,224) (39,472) (35,721) (31,663) (28,588)Net cash provided by (used in) financing
activities . . . . . . . . . . . . . . . . . . . . . . . . . . . . . . . . . 96,760 (28,519) (74,337) (7,529) 16,791
Year Ended June 30,2012 2011 2010 2009 2008
Selected Balance Sheet DataCash . . . . . . . . . . . . . . . . . . . . . . . . . . . . . . . . . . . . . . $ 59,080 $ 58,850 $ 26,881 $ 23,102 $ 26,396Inventories . . . . . . . . . . . . . . . . . . . . . . . . . . . . . . . . . 291,987 246,514 271,058 318,535 408,563Working capital . . . . . . . . . . . . . . . . . . . . . . . . . . . . . 345,818 388,897 306,524 286,611 306,735Total assets . . . . . . . . . . . . . . . . . . . . . . . . . . . . . . . . 1,066,754 854,837 843,471 884,075 970,734Short-term debt . . . . . . . . . . . . . . . . . . . . . . . . . . . . . 89,200 — 59,000 115,000 119,000Long-term debt, including current period . . . . . . . . 250,000 250,000 218,699 223,911 224,957Shareholders’ equity . . . . . . . . . . . . . . . . . . . . . . . . . 481,727 417,765 352,617 336,778 336,601
(1) For the year ended June 30, 2012, gross profit and income from operations include (i) $4.5 million of inventory–related costs primarily for inventory purchased by us from New Wave Fragrances LLC and Give Back Brands LLCprior to the acquisitions from those companies, and (ii) $0.4 million for product discontinuation charges. Income fromoperations also includes (i) $1.4 million in license termination costs, and (ii) $0.8 million in transaction costsassociated with the New Wave LLC and Give Back Brands LLC acquisitions.
(2) For the year ended June 30, 2012, inventory-related costs, product discontinuation charges, license termination costsand transaction costs for the acquisitions reduced both basic and fully diluted earnings per share by $0.17 and $0.16,respectively.
(3) For the year ended June 30, 2011, income from operations includes (i) $0.3 million of restructuring expenses related toour Global Efficiency Re-engineering initiative (the “Initiative”), and (ii) $0.3 million of expenses related toimplementation of our Oracle accounting and order processing systems.
(4) For the year ended June 30, 2011, debt extinguishment charges, restructuring expenses related to our Initiative andOracle accounting and order processing systems implementation costs reduced both basic and fully diluted earningsper share by $0.15.
(5) For the year ended June 30, 2010, income from operations includes (i) $3.9 million of expenses related toimplementation of our Oracle accounting and order processing systems, (ii) $1.9 million of restructuring expensesrelated to our Initiative, and (iii) $1.5 million of restructuring expenses that are not related to our Initiative.
(6) For the year ended June 30, 2010, Oracle accounting and order processing systems implementation costs, restructuringexpenses and debt extinguishment charges reduced basic and fully diluted earnings per share by $0.20 and $0.19,respectively.
(7) For the year ended June 30, 2009, gross profit and income from operations include costs related to the global licensingagreement with Liz Claiborne of $18.9 million (which did not require the use of cash in the current period) for the LizClaiborne inventory purchased by us at a higher cost prior to the effective date of the license agreement and $4.4
34
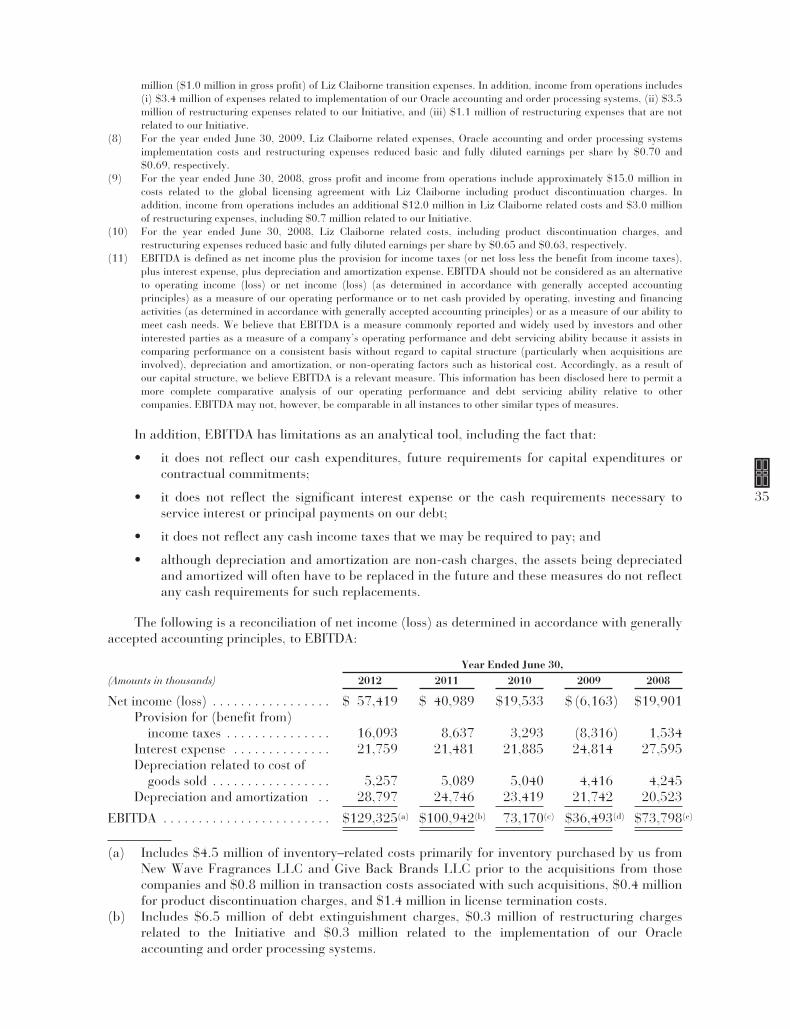
million ($1.0 million in gross profit) of Liz Claiborne transition expenses. In addition, income from operations includes(i) $3.4 million of expenses related to implementation of our Oracle accounting and order processing systems, (ii) $3.5million of restructuring expenses related to our Initiative, and (iii) $1.1 million of restructuring expenses that are notrelated to our Initiative.
(8) For the year ended June 30, 2009, Liz Claiborne related expenses, Oracle accounting and order processing systemsimplementation costs and restructuring expenses reduced basic and fully diluted earnings per share by $0.70 and$0.69, respectively.
(9) For the year ended June 30, 2008, gross profit and income from operations include approximately $15.0 million incosts related to the global licensing agreement with Liz Claiborne including product discontinuation charges. Inaddition, income from operations includes an additional $12.0 million in Liz Claiborne related costs and $3.0 millionof restructuring expenses, including $0.7 million related to our Initiative.
(10) For the year ended June 30, 2008, Liz Claiborne related costs, including product discontinuation charges, andrestructuring expenses reduced basic and fully diluted earnings per share by $0.65 and $0.63, respectively.
(11) EBITDA is defined as net income plus the provision for income taxes (or net loss less the benefit from income taxes),plus interest expense, plus depreciation and amortization expense. EBITDA should not be considered as an alternativeto operating income (loss) or net income (loss) (as determined in accordance with generally accepted accountingprinciples) as a measure of our operating performance or to net cash provided by operating, investing and financingactivities (as determined in accordance with generally accepted accounting principles) or as a measure of our ability tomeet cash needs. We believe that EBITDA is a measure commonly reported and widely used by investors and otherinterested parties as a measure of a company’s operating performance and debt servicing ability because it assists incomparing performance on a consistent basis without regard to capital structure (particularly when acquisitions areinvolved), depreciation and amortization, or non-operating factors such as historical cost. Accordingly, as a result ofour capital structure, we believe EBITDA is a relevant measure. This information has been disclosed here to permit amore complete comparative analysis of our operating performance and debt servicing ability relative to othercompanies. EBITDA may not, however, be comparable in all instances to other similar types of measures.
In addition, EBITDA has limitations as an analytical tool, including the fact that:
• it does not reflect our cash expenditures, future requirements for capital expenditures orcontractual commitments;
• it does not reflect the significant interest expense or the cash requirements necessary toservice interest or principal payments on our debt;
• it does not reflect any cash income taxes that we may be required to pay; and
• although depreciation and amortization are non-cash charges, the assets being depreciatedand amortized will often have to be replaced in the future and these measures do not reflectany cash requirements for such replacements.
The following is a reconciliation of net income (loss) as determined in accordance with generallyaccepted accounting principles, to EBITDA:
Year Ended June 30,(Amounts in thousands) 2012 2011 2010 2009 2008
Net income (loss) . . . . . . . . . . . . . . . . . $ 57,419 $ 40,989 $19,533 $ (6,163) $19,901Provision for (benefit from)
income taxes . . . . . . . . . . . . . . . 16,093 8,637 3,293 (8,316) 1,534Interest expense . . . . . . . . . . . . . . 21,759 21,481 21,885 24,814 27,595Depreciation related to cost of
goods sold . . . . . . . . . . . . . . . . . 5,257 5,089 5,040 4,416 4,245Depreciation and amortization . . 28,797 24,746 23,419 21,742 20,523
EBITDA . . . . . . . . . . . . . . . . . . . . . . . . $129,325(a) $100,942(b) 73,170(c) $36,493(d) $73,798(e)
(a) Includes $4.5 million of inventory–related costs primarily for inventory purchased by us fromNew Wave Fragrances LLC and Give Back Brands LLC prior to the acquisitions from thosecompanies and $0.8 million in transaction costs associated with such acquisitions, $0.4 millionfor product discontinuation charges, and $1.4 million in license termination costs.
(b) Includes $6.5 million of debt extinguishment charges, $0.3 million of restructuring chargesrelated to the Initiative and $0.3 million related to the implementation of our Oracleaccounting and order processing systems.
35

(c) Includes $3.9 million related to the implementation of our Oracle accounting and orderprocessing systems, $3.4 million of restructuring charges and $0.1 million of debtextinguishment charges.
(d) Includes $23.3 million of costs related to the global licensing agreement with Liz Claiborne($18.9 million of which did not require the use of cash in the current period), $4.6 million ofrestructuring charges and $3.4 million related to the implementation of our Oracle accountingand order processing systems.
(e) Includes $27.0 million of costs related to the global licensing agreement with Liz Claiborneand $3.0 million of restructuring charges.
36
ITEM 7. MANAGEMENT’S DISCUSSION AND ANALYSIS OF FINANCIAL CONDITION ANDRESULTS OF OPERATIONS
The following discussion and analysis should be read in conjunction with the consolidatedfinancial statements and the accompanying notes which appear elsewhere in this document.
Overview
We are a global prestige beauty products company with an extensive portfolio of prestigefragrance, skin care and cosmetics brands. Our extensive product portfolio includes the following:
Elizabeth ArdenBrand
The Elizabeth Arden skin care brands: VisibleDifference, Ceramide, Prevage, and Eight Hour Cream,Elizabeth Arden branded lipstick, foundation and othercolor cosmetics products, and the Elizabeth Ardenfragrances: Red Door, Elizabeth Arden 5th Avenue, andElizabeth Arden green tea
Celebrity Fragrances The fragrance brands of Britney Spears, ElizabethTaylor, Mariah Carey, Taylor Swift, Justin Bieber, NickiMinaj and Usher
Lifestyle Fragrances Curve, Giorgio Beverly Hills, PS Fine Cologne and WhiteShoulders
Designer Fragrances Juicy Couture, Alfred Sung, BCBGMAXAZRIA, EdHardy, Geoffrey Beene, Halston, John Varvatos, KateSpade New York, Lucky, Rocawear and True Religion
In addition to our owned and licensed fragrance brands, we distribute approximately 250additional prestige fragrance brands, primarily in the United States, through distribution agreementsand other purchasing arrangements. In August 2011, we amended our long-term license agreementwith Liz Claiborne, Inc. and certain of its affiliates and acquired all of the U.S. and internationaltrademarks for the Curve fragrance brands as well as trademarks for certain other smaller fragrancebrands. The amendment established a lower effective royalty rate for the remaining licensedfragrance brands, including Juicy Couture and Lucky Brand fragrances, reduced the futureminimum guaranteed royalties for the term of the license, and required a pre-payment of royaltiesfor the remainder of calendar 2011. We paid Liz Claiborne, Inc. and its affiliates $58.4 million incash in connection with this transaction. We capitalized $43.9 million of the $58.4 million cash paidas exclusive brand trademarks and the balance was recorded as a prepaid asset associated with thesettlement of royalties for the remainder of calendar year 2011 and the buy-down of future royalties.
In May 2012, we acquired the global licenses and certain related assets, including inventory, forthe Ed Hardy, True Religion and BCBGMAXAZRIA fragrance brands from New Wave Fragrances,LLC. Prior to the acquisition, we had been acting as a distributor of the Ed Hardy, True Religionand BCBGMAXAZRIA fragrances to certain mid-tier and mass retailers in the North America.Originally introduced in 2008 and inspired by the tattoo art of Don Ed Hardy, the Ed Hardyfragrance portfolio includes the Love & Luck, Hearts & Daggers and Ed Hardy Born Wild men’s andwomen’s fragrances. The True Religion fragrance brand launched in U.S. department stores inOctober 2008 and has now expanded to a portfolio of brands, including Drifter and Hippie Chic,and the BCBGMAXAZRIA women’s fragrance recently launched in the fall of 2011 in U.S.department stores. The total cost of the acquisition was $60.1 million, including amounts paid forinventory of $19.8 million, of which $58.1 million has been paid in cash and up to an additional $2million may be due on January 31, 2013, subject to certain post-closing adjustments. Thistransaction was accounted for as a business combination. See Note 11 to the Notes to ConsolidatedFinancial Statements for further information on the acquisition and allocation of the purchase price.
37
In June 2012, we also acquired the global licenses and certain assets related to the Justin Bieberand Nicki Minaj fragrance brands, including inventory of the Justin Bieber fragrances, from GiveBack Brands LLC. Someday, the first fragrance from internationally acclaimed recording artistJustin Bieber, launched in Spring 2011 and became the number one women’s fragrance launch of2011 in U.S. department stores, according to NPD. The second fragrance in this brand franchise,Justin Bieber’s Girlfriend, is launching in U.S. department stores in the summer of 2012. The firstfragrance from Nicki Minaj is scheduled to launch in U.S. department stores in the fall of 2012. Inconnection with the acquisition, we paid Give Back Brands LLC $26.5 million, including $3.4million for inventory. In addition, we have issued to Give Back Brands LLC a subordinated note inthe principal amount of $28 million, payable upon the achievement of specified net sales targets forthe acquired brands over the three-year period from July 1, 2012 through June 30, 2015. Thistransaction was accounted for as a business combination. See Note 11 to the Notes to ConsolidatedFinancial Statements for further information on the acquisition and allocation of the purchase price.
In fiscal 2013, we expect to incur pre-tax transition and other expenses related to the NewWave Fragrances LLC and Give Back Brands LLC acquisitions of $11.7 million, of which $6.4million will not require the use of cash. Such expenses are expected to be incurred substantially inthe first fiscal quarter ending September 30, 2012. These expenses primarily result from inventorypurchased by us at a higher cost prior to the 2012 acquisitions, and other non-recurring expenses.
For ease of reference in this Form 10-K, the acquisitions from New Wave Fragrances LLC andGive Back Brands LLC are referred to herein on a collective basis as the 2012 acquisitions.
During fiscal 2012, we introduced several new products across the Elizabeth Arden skincare,fragrance, and color cosmetic categories, as well as for several of our fragrance brands, includingBritney Spears, Juicy Couture, Curve, Rocawear and John Varvatos. We also debuted the firstfragrance under our license agreement with Taylor Swift.
Our business strategy is currently focused on two important initiatives: the global repositioningof the Elizabeth Arden brand and expanding the market penetration of our prestige fragranceportfolio in international markets, especially in the large European fragrance market. We also intendto continue to increase net sales, operating margins and earnings by continuing to expand theprestige fragrance category at mass retail customers in North America and continuing to expandoperating margins, working capital efficiency and return on invested capital. We believe that ourfocus on organic growth opportunities for our existing brands, new licensing opportunities andacquisitions, and new product innovation will assist us in achieving these goals.
We recently commenced the roll-out of a comprehensive brand repositioning for the ElizabethArden brand, which is designed to honor the heritage of the brand while modernizing the brand’spresentation and increasing its relevance among target consumers. The brand repositioning includesimproved product formulation, package redesign and counter redesign as well as SKU rationalization.The initial roll-out will be to a limited number of retail doors and is targeted for completion by earlyOctober 2012. We began shipping the new product assortment to retailers in June 2012 and expect toreplace high-priority retail counters with the new counters by early October 2012. The new counterdesign is intended to bring key aspects of the Elizabeth Arden and Red Door Spa brand equities to theretail environment to create a more uniform, modern and engaging shopping experience. The rolloutwill continue throughout fiscal year 2013 and beyond. Based on the results of the initial roll-out andplans for a more broad-based global roll-out, we may incur costs, expenses and capital expenditures infuture periods that could be material to those periods. The specific facts and circumstances of theglobal roll-out will impact the timing and amount of any such costs, expenses and capital expenditures.In fiscal 2013, we expect to incur pre-tax non-recurring charges of approximately $8 millionassociated with the Elizabeth Arden brand repositioning resulting from product assortment changes.
In fiscal 2013, we plan to launch the new Visible Difference entry level skin care regimen as partof the repositioning of the Elizabeth Arden brands, Prevage Anti-Aging + Intensive Repair DailySerum, several new Ceramide skin care products, and a new Red Door fragrance, Red Door Aura.
38
We also plan to launch several fragrances, including our second fragrance for Taylor Swift, a newfragrance for Justin Beiber’s, Girlfriend, the first fragrance for Nicki Minaj, and new fragrances forBritney Spears, Juicy Couture, Lucky and John Varvatos.
During fiscal 2012, we also improved our gross margins by 190 basis points over fiscal 2011.The gross margin was impacted by $4.9 million, or 40 basis points, of inventory-related costsprimarily associated with our May and June 2012 acquisitions. See “Recent License Agreements andAcquisitions” and Note 1, under Item 6, “Selected Financial Data” for further information onacquisitions. Moving into fiscal 2013, we expect our gross margins to improve an additional 85 to110 basis points over our fiscal 2012 gross margins. We also expect our gross margin in fiscal 2013will be impacted by approximately 130 basis points for costs associated with the Elizabeth Ardenbrand repositioning and the 2012 acquisitions, which represents a year over year anticipated netimpact on our gross margin of 90 basis points related to these costs. We continue to focus on(i) expanding gross margins through increased focus on product mix, improved pricing and reducedsales dilution, (ii) improving our sales and operations planning processes and our supply chain andlogistics efficiency and, (iii) leveraging our overhead structure by increasing sales of ourInternational segment.
We manage our business by evaluating net sales, gross margins, EBITDA (as defined in Note 11under Item 6 “Selected Financial Data”), EBITDA margin, segment profit and working capitalutilization (including monitoring our levels of inventory, accounts receivable, operating cash flowand return on invested capital). We encounter a variety of challenges that may affect our businessand should be considered as described in Item 1A “Risk Factors” and in the section “Management’sDiscussion and Analysis of Financial Condition and Results of Operations — Forward-LookingInformation and Factors That May Affect Future Results.”
Critical Accounting Policies and Estimates
The preparation of our consolidated financial statements in conformity with U.S. generallyaccepted accounting principles requires us to make estimates and assumptions that affect theamounts of assets, liabilities, revenues and expenses reported in those consolidated financialstatements. We base our estimates on historical experience and other factors that we believe aremost likely to occur. Changes in facts and circumstances may result in revised estimates, which arerecorded in the period in which they become known. Actual results could differ from those estimates.If these changes result in a material impact to the consolidated financial statements, their impact isdisclosed in “Management’s Discussion and Analysis of Financial Condition and Results ofOperations” and/or in the “Notes to the Consolidated Financial Statements.” The disclosures belowalso note situations in which it is reasonably likely that future financial results could be affected bychanges in these estimates and assumptions. The term “reasonably likely” refers to an occurrencethat is more than remote but less than probable in the judgment of management.
Our most critical accounting policies and estimates are described in detail below. See Note 1 tothe Notes to Consolidated Financial Statements — “General Information and Summary ofSignificant Accounting Policies,” for a discussion of these and other accounting policies.
Accounting for Acquisitions and Intangible Assets. Under the accounting for businesscombinations, consideration paid in an acquisition is allocated to the underlying assets andliabilities, based on their respective estimated fair values. The excess of the consideration paid at theacquisition date over the fair values of the identifiable assets acquired or liabilities assumed isrecorded as goodwill.
The judgments made in determining the estimated fair value and expected useful lives assignedto each class of assets and liabilities acquired can significantly affect net income. For example,different classes of assets will have useful lives that differ, and the useful life of property, plant, andequipment acquired will differ substantially from the useful life of brand licenses and trademarks.Consequently, to the extent a longer-lived asset is ascribed greater value under the purchase methodthan a shorter-lived asset, net income in a given period may be higher.
39
Determining the fair value of certain assets and liabilities acquired is judgmental in nature andoften involves the use of significant estimates and assumptions. One area that requires morejudgment is determining the fair value and useful lives of intangible assets. Because the fair valueand the estimated useful life of an intangible asset is a subjective estimate, it is reasonably likely thatcircumstances may cause the estimate to change. For example, if we discontinue or experience adecline in the profitability of one or more of our brands, the value of the intangible assets associatedwith those brands or their useful lives may decline, or, certain intangible assets such as the ElizabethArden brand trademarks, may no longer be classified as an indefinite-lived asset, which could resultin additional charges to net income.
Our intangible assets consist of exclusive brand licenses, trademarks, patents and otherintellectual property, customer relationships and lists, non-compete agreements and goodwill. Thevalue of these assets is exposed to future adverse changes if we experience declines in operatingresults or experience significant negative industry or economic trends. We have determined that theElizabeth Arden trademarks have indefinite useful lives as cash flows from the use of the trademarksare expected to be generated indefinitely. Goodwill and intangible assets with indefinite lives such asour Elizabeth Arden trademarks, are not amortized, but rather assessed for impairment at leastannually. We typically perform our annual impairment assessment during the fourth quarter of ourfiscal year or more frequently if events or changes in circumstances indicate the carrying value ofgoodwill may not fully be recoverable. During the quarter ended June 30, 2012, we adopted theupdated guidance to Topic 350, Intangibles- Goodwill and Other, issued by Financial AccountingStandards Board (“FASB”), which simplifies how an entity assesses goodwill for impairment. Theamendments allow an entity to first assess qualitative factors to determine whether it is necessary toperform the two-step quantitative goodwill impairment assessment. An entity no longer will berequired to calculate the fair value of a reporting unit unless the entity determines, based on aqualitative assessment, that it is more likely than not that its fair value is less than its carryingamount. Should a goodwill impairment assessment be necessary, there is a two step process forimpairment assessing of goodwill. The first step used to identify potential impairment compares thefair value of a reporting unit with its carrying amount, including goodwill. The second step, ifnecessary, measures the amount of the impairment by comparing the estimated fair value of thegoodwill and intangible assets to their respective carrying values. If an impairment is identified, thecarrying value of the asset is adjusted to estimated fair value. See Note 1 to the Notes toConsolidated Financial Statements.
During the quarter ended June 30, 2012, we completed our annual impairment assessment ofthe Elizabeth Arden trademarks, with the assistance of a third party valuation firm. In assessing thefair value of these trademarks, we considered the income approach. Under the income approach, thefair value is based on the present value of estimated future cash flows. The analysis and assessmentsof these assets and goodwill indicated that no impairment adjustment was required as the estimatedfair value exceeded the recorded carrying value. A hypothetical 10% decrease to the fair value of ourElizabeth Arden trademarks or a hypothetical 1% increase in the discount rate used to estimate fairvalue would not result in an impairment of our Elizabeth Arden trademarks. During the quarterended June 30, 2012, we also completed our annual impairment assessment of goodwill using thequalitative assessment under the updated guidance to Topic 350. The analysis indicated that noimpairment adjustment was required. A hypothetical 10% decrease in the fair value of our NorthAmerica reporting unit would not result in an impairment of our goodwill.
Due to the ongoing uncertainty in capital market conditions, we will continue to monitor andevaluate the expected future cash flows of our reporting units and the long-term trends of ourmarket capitalization for the purposes of assessing the carrying value of our goodwill and indefinite-lived Elizabeth Arden trademarks, other trademarks and intangible assets. If market and economicconditions deteriorate, this could increase the likelihood of future material non-cash impairmentcharges to our results of operations related to our goodwill, indefinite-lived Elizabeth Ardentrademarks, or other trademarks and intangible assets.
40
Depreciation and Amortization. Depreciation and amortization is provided over the estimateduseful lives of the assets using the straight line method. Periodically, we review the lives assigned toour long-lived assets and adjust the lives, as circumstances dictate. Because estimated useful life is asubjective estimate, it is reasonably likely that circumstances may cause the estimate to change. Forexample, if we experience significant declines in net sales in certain channels of distribution, it couldaffect the estimated useful life of certain of our long-lived assets, such as counters or trade fixtures,which could result in additional charges to net income.
Long-Lived Assets. We review for the impairment of long-lived assets to be held and usedwhenever events or changes in circumstances indicate that the carrying amount of such assets maynot be fully recoverable. Measurement of an impairment loss is based on the fair value of the assetcompared to its carrying value. An impairment loss is recognized to the extent the carrying amountof the asset exceeds its estimated fair value. Because the fair value is a subjective estimate, it isreasonably likely that circumstances may cause the estimate to change. The same circumstances thatcould affect the estimated useful life of a long-lived asset, as discussed above, could cause us tochange our estimate of the fair value of that asset, which could result in additional charges to netincome. We did not record any adjustments to our long-lived assets in fiscal 2012, 2011 and 2010.Long-lived assets to be disposed of are reported at the lower of carrying amount or fair value lesscosts to sell.
Revenue Recognition. Sales are recognized when title and risk of loss transfers to the customer,the sales price is fixed or determinable and collectability of the resulting receivable is probable. Salesare recorded net of estimated returns, markdowns and other allowances. The provision for salesreturns and markdowns represents management’s estimate of future returns and markdowns basedon historical experience and considering current external factors and market conditions.
Allowances for Sales Returns and Markdowns. As is customary in the prestige beauty business,we grant certain of our customers (primarily North American prestige department stores andspecialty beauty stores), subject to our authorization and approval, the right to either return productfor credit against amounts previously billed or to receive a markdown allowance. Upon sale to suchcustomers, we record a provision for product returns and markdowns estimated based on our level ofsales, historical and projected experience with product returns and markdowns in each of ourbusiness segments and with respect to each of our product types, current economic trends andchanges in customer demand and customer mix. We make detailed estimates at the segment,product and customer level, which are then aggregated to arrive at a consolidated provision forproduct returns and markdowns and are reviewed periodically as facts and circumstances warrant.Such provisions and markdown allowances are recorded as a reduction of net sales. Because there isconsiderable judgment used in evaluating the allowance for returns and markdowns, it is reasonablylikely that actual experience will differ from our estimates. If, for example, customer demand for ourproducts is lower than estimated or a proportionately greater amount of sales is made to prestigedepartment stores and/or specialty beauty stores, additional provisions for returns or markdownsmay be required resulting in a charge to income in the period in which the determination was made.Similarly, if customer demand for our products is higher than estimated, a reduction of ourprovision for returns or markdowns may be required resulting in an increase to income in the periodin which the determination was made. As a percentage of gross sales, our expense for returns andmarkdowns was 7.3%, 8.3% and 9.2% for the fiscal years ending June 30, 2012, 2011 and 2010,respectively. A hypothetical 5% change in the value of our allowance for sales returns andmarkdowns as of June 30, 2012 would result in a $0.9 million change to net income.
Allowances for Doubtful Accounts Receivable. We maintain allowances for doubtful accountsto cover uncollectible accounts receivable, and we evaluate our accounts receivable to determine ifthey will ultimately be collected. This evaluation includes significant judgments and estimates,including an analysis of receivables aging and a customer-by-customer review for large accounts. Itis reasonably likely that actual experience will differ from our estimates, which may result in anincrease or decrease in the allowance for doubtful accounts. If, for example, the financial condition
41
of our customers deteriorates resulting in an impairment of their ability to pay, additionalallowances may be required, resulting in a charge to income in the period in which thedetermination was made. A hypothetical 5% change in the value of our allowance for doubtfulaccounts receivable as of June 30, 2012 would result in a $0.2 million change to net income.
Provisions for Inventory Obsolescence. We record a provision for estimated obsolescence andshrinkage of inventory. Our estimates consider the cost of inventory, forecasted demand, theestimated market value, the shelf life of the inventory and our historical experience. Because of thesubjective nature of this estimate, it is reasonably likely that circumstances may cause the estimateto change. If, for example, demand for our products declines, or if we decide to discontinue certainproducts, we may need to increase our provision for inventory obsolescence which would result inadditional charges to net income. A hypothetical 5% change in the value of our provision forinventory obsolescence as of June 30, 2012 would result in a $0.9 million change to net income.
Hedge Contracts. We have designated each qualifying foreign currency contract we haveentered into as a cash flow hedge. Unrealized gains or losses, net of taxes, associated with thesecontracts are included in accumulated other comprehensive income on the balance sheet. Gains andlosses will only be recognized in earnings in the period in which the forecasted transaction affectsearnings or the transactions are no longer probable of occurring.
Share-Based Compensation. All share-based payments to employees, including the grants ofemployee stock options, are recognized in the consolidated financial statements based on their fairvalues, but only to the extent that vesting is considered probable. Compensation cost for awards thatvest will not be reversed if the awards expire without being exercised. The fair value of stock optionsis determined using the Black-Scholes option-pricing model. The fair value of restricted stock andrestricted stock unit awards is based on the closing price of our common stock on the date of grant.Compensation costs for awards are amortized using the straight-line method. Option pricing modelinput assumptions such as expected term, expected volatility and risk-free interest rate impact thefair value estimate. Further, the forfeiture rate impacts the amount of aggregate compensation.These assumptions are subjective and generally require significant analysis and judgment to develop.When estimating fair value, some of the assumptions are based on or determined from external dataand other assumptions may be derived from our historical experience with share-basedarrangements. The appropriate weight to place on historical experience is a matter of judgment,based on relevant facts and circumstances.
We rely on our historical experience and post-vested termination activity to provide data forestimating our expected term for use in determining the fair value of our stock options. We currentlyestimate our stock volatility by considering our historical stock volatility experience and other keyfactors. The risk-free interest rate is the implied yield currently available on U.S. Treasury zero-coupon issues with a remaining term equal to the expected term used as the input to the Black-Scholes model. We estimate forfeitures using our historical experience. Our estimates of forfeitureswill be adjusted over the requisite service period based on the extent to which actual forfeituresdiffer, or are expected to differ, from their estimates. Because of the significant amount of judgmentused in these calculations, it is reasonably likely that circumstances may cause the estimate tochange. If, for example, actual forfeitures are lower than our estimate, additional charges to netincome may be required.
Income Taxes and Valuation Reserves. A valuation allowance may be required to reducedeferred tax assets to the amount that is more likely than not to be realized. We consider projectedfuture taxable income and ongoing tax planning strategies in assessing a potential valuationallowance. In the event we determine that we may not be able to realize all or part of our deferredtax asset in the future, or that new estimates indicate that a previously recorded valuation allowanceis no longer required, an adjustment to the deferred tax asset would likely be charged or credited tonet income in the period in which such determination was made.
42
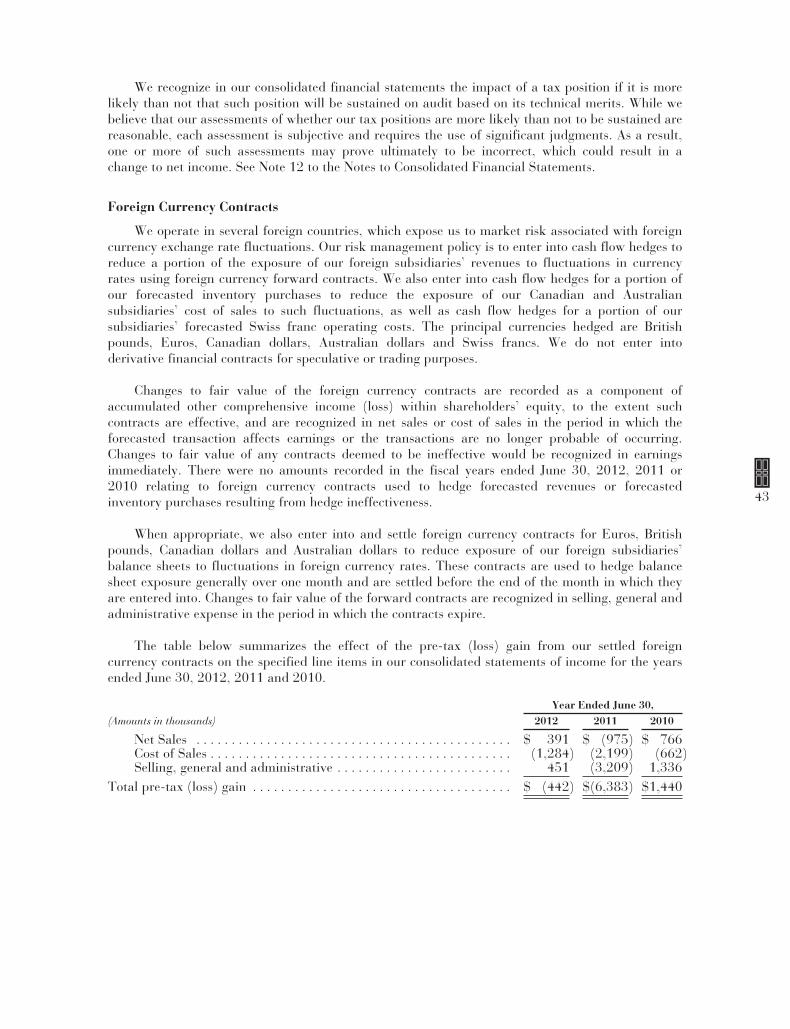
We recognize in our consolidated financial statements the impact of a tax position if it is morelikely than not that such position will be sustained on audit based on its technical merits. While webelieve that our assessments of whether our tax positions are more likely than not to be sustained arereasonable, each assessment is subjective and requires the use of significant judgments. As a result,one or more of such assessments may prove ultimately to be incorrect, which could result in achange to net income. See Note 12 to the Notes to Consolidated Financial Statements.
Foreign Currency Contracts
We operate in several foreign countries, which expose us to market risk associated with foreigncurrency exchange rate fluctuations. Our risk management policy is to enter into cash flow hedges toreduce a portion of the exposure of our foreign subsidiaries’ revenues to fluctuations in currencyrates using foreign currency forward contracts. We also enter into cash flow hedges for a portion ofour forecasted inventory purchases to reduce the exposure of our Canadian and Australiansubsidiaries’ cost of sales to such fluctuations, as well as cash flow hedges for a portion of oursubsidiaries’ forecasted Swiss franc operating costs. The principal currencies hedged are Britishpounds, Euros, Canadian dollars, Australian dollars and Swiss francs. We do not enter intoderivative financial contracts for speculative or trading purposes.
Changes to fair value of the foreign currency contracts are recorded as a component ofaccumulated other comprehensive income (loss) within shareholders’ equity, to the extent suchcontracts are effective, and are recognized in net sales or cost of sales in the period in which theforecasted transaction affects earnings or the transactions are no longer probable of occurring.Changes to fair value of any contracts deemed to be ineffective would be recognized in earningsimmediately. There were no amounts recorded in the fiscal years ended June 30, 2012, 2011 or2010 relating to foreign currency contracts used to hedge forecasted revenues or forecastedinventory purchases resulting from hedge ineffectiveness.
When appropriate, we also enter into and settle foreign currency contracts for Euros, Britishpounds, Canadian dollars and Australian dollars to reduce exposure of our foreign subsidiaries’balance sheets to fluctuations in foreign currency rates. These contracts are used to hedge balancesheet exposure generally over one month and are settled before the end of the month in which theyare entered into. Changes to fair value of the forward contracts are recognized in selling, general andadministrative expense in the period in which the contracts expire.
The table below summarizes the effect of the pre-tax (loss) gain from our settled foreigncurrency contracts on the specified line items in our consolidated statements of income for the yearsended June 30, 2012, 2011 and 2010.
Year Ended June 30,(Amounts in thousands) 2012 2011 2010
Net Sales . . . . . . . . . . . . . . . . . . . . . . . . . . . . . . . . . . . . . . . . . . . . . $ 391 $ (975) $ 766Cost of Sales . . . . . . . . . . . . . . . . . . . . . . . . . . . . . . . . . . . . . . . . . . . (1,284) (2,199) (662)Selling, general and administrative . . . . . . . . . . . . . . . . . . . . . . . . . 451 (3,209) 1,336
Total pre-tax (loss) gain . . . . . . . . . . . . . . . . . . . . . . . . . . . . . . . . . . . . . $ (442) $(6,383) $1,440
43
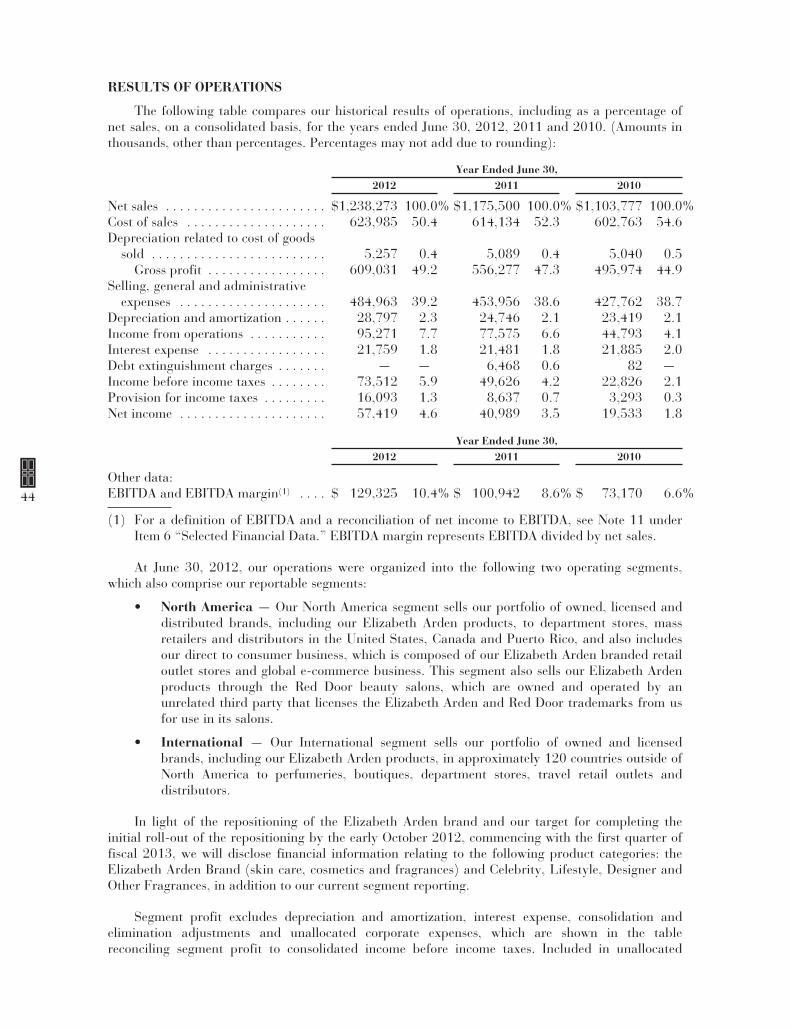
RESULTS OF OPERATIONS
The following table compares our historical results of operations, including as a percentage ofnet sales, on a consolidated basis, for the years ended June 30, 2012, 2011 and 2010. (Amounts inthousands, other than percentages. Percentages may not add due to rounding):
Year Ended June 30,2012 2011 2010
Net sales . . . . . . . . . . . . . . . . . . . . . . . $1,238,273 100.0% $1,175,500 100.0% $1,103,777 100.0%Cost of sales . . . . . . . . . . . . . . . . . . . . 623,985 50.4 614,134 52.3 602,763 54.6Depreciation related to cost of goods
sold . . . . . . . . . . . . . . . . . . . . . . . . . 5,257 0.4 5,089 0.4 5,040 0.5Gross profit . . . . . . . . . . . . . . . . . 609,031 49.2 556,277 47.3 495,974 44.9
Selling, general and administrativeexpenses . . . . . . . . . . . . . . . . . . . . . 484,963 39.2 453,956 38.6 427,762 38.7
Depreciation and amortization . . . . . . 28,797 2.3 24,746 2.1 23,419 2.1Income from operations . . . . . . . . . . . 95,271 7.7 77,575 6.6 44,793 4.1Interest expense . . . . . . . . . . . . . . . . . 21,759 1.8 21,481 1.8 21,885 2.0Debt extinguishment charges . . . . . . . — — 6,468 0.6 82 —Income before income taxes . . . . . . . . 73,512 5.9 49,626 4.2 22,826 2.1Provision for income taxes . . . . . . . . . 16,093 1.3 8,637 0.7 3,293 0.3Net income . . . . . . . . . . . . . . . . . . . . . 57,419 4.6 40,989 3.5 19,533 1.8
Year Ended June 30,2012 2011 2010
Other data:EBITDA and EBITDA margin(1) . . . . $ 129,325 10.4% $ 100,942 8.6% $ 73,170 6.6%
(1) For a definition of EBITDA and a reconciliation of net income to EBITDA, see Note 11 underItem 6 “Selected Financial Data.” EBITDA margin represents EBITDA divided by net sales.
At June 30, 2012, our operations were organized into the following two operating segments,which also comprise our reportable segments:
• North America — Our North America segment sells our portfolio of owned, licensed anddistributed brands, including our Elizabeth Arden products, to department stores, massretailers and distributors in the United States, Canada and Puerto Rico, and also includesour direct to consumer business, which is composed of our Elizabeth Arden branded retailoutlet stores and global e-commerce business. This segment also sells our Elizabeth Ardenproducts through the Red Door beauty salons, which are owned and operated by anunrelated third party that licenses the Elizabeth Arden and Red Door trademarks from usfor use in its salons.
• International — Our International segment sells our portfolio of owned and licensedbrands, including our Elizabeth Arden products, in approximately 120 countries outside ofNorth America to perfumeries, boutiques, department stores, travel retail outlets anddistributors.
In light of the repositioning of the Elizabeth Arden brand and our target for completing theinitial roll-out of the repositioning by the early October 2012, commencing with the first quarter offiscal 2013, we will disclose financial information relating to the following product categories: theElizabeth Arden Brand (skin care, cosmetics and fragrances) and Celebrity, Lifestyle, Designer andOther Fragrances, in addition to our current segment reporting.
Segment profit excludes depreciation and amortization, interest expense, consolidation andelimination adjustments and unallocated corporate expenses, which are shown in the tablereconciling segment profit to consolidated income before income taxes. Included in unallocated
44
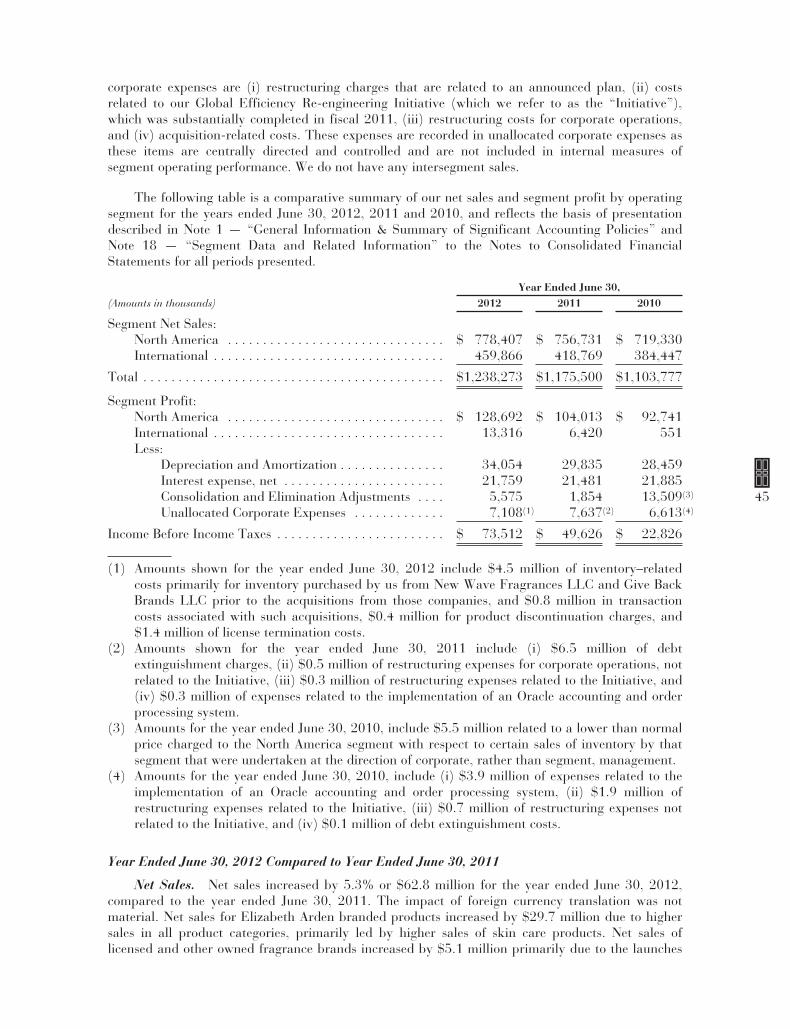
corporate expenses are (i) restructuring charges that are related to an announced plan, (ii) costsrelated to our Global Efficiency Re-engineering Initiative (which we refer to as the “Initiative”),which was substantially completed in fiscal 2011, (iii) restructuring costs for corporate operations,and (iv) acquisition-related costs. These expenses are recorded in unallocated corporate expenses asthese items are centrally directed and controlled and are not included in internal measures ofsegment operating performance. We do not have any intersegment sales.
The following table is a comparative summary of our net sales and segment profit by operatingsegment for the years ended June 30, 2012, 2011 and 2010, and reflects the basis of presentationdescribed in Note 1 — “General Information & Summary of Significant Accounting Policies” andNote 18 — “Segment Data and Related Information” to the Notes to Consolidated FinancialStatements for all periods presented.
Year Ended June 30,(Amounts in thousands) 2012 2011 2010
Segment Net Sales:North America . . . . . . . . . . . . . . . . . . . . . . . . . . . . . . . $ 778,407 $ 756,731 $ 719,330International . . . . . . . . . . . . . . . . . . . . . . . . . . . . . . . . . 459,866 418,769 384,447
Total . . . . . . . . . . . . . . . . . . . . . . . . . . . . . . . . . . . . . . . . . . . $1,238,273 $1,175,500 $1,103,777
Segment Profit:North America . . . . . . . . . . . . . . . . . . . . . . . . . . . . . . . $ 128,692 $ 104,013 $ 92,741International . . . . . . . . . . . . . . . . . . . . . . . . . . . . . . . . . 13,316 6,420 551Less:
Depreciation and Amortization . . . . . . . . . . . . . . . 34,054 29,835 28,459Interest expense, net . . . . . . . . . . . . . . . . . . . . . . . 21,759 21,481 21,885Consolidation and Elimination Adjustments . . . . 5,575 1,854 13,509(3)
Unallocated Corporate Expenses . . . . . . . . . . . . . 7,108(1) 7,637(2) 6,613(4)
Income Before Income Taxes . . . . . . . . . . . . . . . . . . . . . . . . $ 73,512 $ 49,626 $ 22,826
(1) Amounts shown for the year ended June 30, 2012 include $4.5 million of inventory–relatedcosts primarily for inventory purchased by us from New Wave Fragrances LLC and Give BackBrands LLC prior to the acquisitions from those companies, and $0.8 million in transactioncosts associated with such acquisitions, $0.4 million for product discontinuation charges, and$1.4 million of license termination costs.
(2) Amounts shown for the year ended June 30, 2011 include (i) $6.5 million of debtextinguishment charges, (ii) $0.5 million of restructuring expenses for corporate operations, notrelated to the Initiative, (iii) $0.3 million of restructuring expenses related to the Initiative, and(iv) $0.3 million of expenses related to the implementation of an Oracle accounting and orderprocessing system.
(3) Amounts for the year ended June 30, 2010, include $5.5 million related to a lower than normalprice charged to the North America segment with respect to certain sales of inventory by thatsegment that were undertaken at the direction of corporate, rather than segment, management.
(4) Amounts for the year ended June 30, 2010, include (i) $3.9 million of expenses related to theimplementation of an Oracle accounting and order processing system, (ii) $1.9 million ofrestructuring expenses related to the Initiative, (iii) $0.7 million of restructuring expenses notrelated to the Initiative, and (iv) $0.1 million of debt extinguishment costs.
Year Ended June 30, 2012 Compared to Year Ended June 30, 2011
Net Sales. Net sales increased by 5.3% or $62.8 million for the year ended June 30, 2012,compared to the year ended June 30, 2011. The impact of foreign currency translation was notmaterial. Net sales for Elizabeth Arden branded products increased by $29.7 million due to highersales in all product categories, primarily led by higher sales of skin care products. Net sales oflicensed and other owned fragrance brands increased by $5.1 million primarily due to the launches
45
of the Taylor Swift fragrance Wonderstruck and the John Varvatos fragrance Star USA, as well ashigher sales of Viva La Juicy and Curve fragrances. Partially offsetting these increases were lowersales of Mariah Carey, Britney Spears and Usher fragrances, as well as lower sales of other JuicyCouture fragrances due in part to the prior year launch of Peace, Love & Juicy Couture. Net sales ofdistributed brands sold under licenses recently acquired in the 2012 Acquisitions and net sales ofother distributed brands increased by $17.0 million and $10.7 million, respectively, as compared tothe prior year. Pricing changes had an immaterial effect on net sales.
North America
Net sales increased by 2.9% or $21.7 million. The impact of foreign currency translationwas not material. Net sales of Elizabeth Arden branded products were flat. Net sales of licensedand other owned fragrance brands decreased by $5.3 million due to lower sales of JuicyCouture, Mariah Carey, Usher and Britney Spears fragrances. Partially offsetting thesedecreases were higher sales from the launch of the Taylor Swift fragrance Wonderstruck as wellas higher sales of Curve and the John Varvatos fragrance Star USA. Net sales of distributedbrands sold under licenses recently acquired in the 2012 Acquisitions and net sales of otherdistributed brands increased by $16.7 million and $10.2 million, respectively, as compared tothe prior year. Higher sales to department store customers led our North America results.
International
Net sales increased by 9.8% or $41.1 million. The impact of foreign currency translationwas not material. Net sales of Elizabeth Arden branded products increased by $29.8 million dueto higher sales in all product categories, primarily led by higher sales of skin care products. Netsales of licensed and other owned fragrance brands increased by $10.4 million primarily due tohigher sales of Viva La Juicy and John Varvatos fragrances, and the launch of the Taylor Swiftfragrance Wonderstruck in select markets primarily in Australia and New Zealand. Ourinternational results were led by higher sales of $21.3 million in Europe and $12.0 million intravel retail and distributor markets.
Gross Margin. For the years ended June 30, 2012 and 2011, gross margins were 49.2% and47.3%, respectively. Gross margin in the current year period benefited from a higher proportion ofsales of Elizabeth Arden products, primarily skin care products which have higher gross margins, aswell as improved operating efficiencies, including lower freight and distribution costs. Partiallyoffsetting these benefits were $4.9 million, or 40 basis points, of inventory–related costs primarilyfor inventory purchased by us from New Wave Fragrances LLC and Give Back Brands LLC prior tothe acquisitions.
SG&A. Selling, general and administrative expenses increased 6.8%, or $31.0 million, for theyear ended June 30, 2012, compared to the year ended June 30, 2011. The increase was due tohigher marketing and sales expenses of $24.4 million and higher general and administrativeexpenses of $6.6 million. The increase in marketing and sales expenses was primarily due to higheradvertising, sales promotion, and direct selling and development expenses of $24.3 million. Theincrease in general and administrative expenses was principally due to (i) higher payroll relatedcosts, net of lower incentive compensation, of $2.2 million, and (ii) the unfavorable impact offoreign currency translation of certain of our affiliates’ balance sheets as the current year includedlosses of $4.2 million compared to losses of $0.9 million in the prior year. For the year endedJune 30, 2012, general and administrative expenses also included a total of $2.2 million of licensetermination costs and transaction costs for the 2012 Acquisitions. For the year ended June 30, 2011,total restructuring and Initiative-related one-time costs totaled $1.4 million.
46
Segment Profit
North America
Segment profit increased 23.7% or $24.7 million. The increase in segment profit was dueto higher net sales and gross profit, partially offset by higher selling, general and administrativeexpenses as further described above.
International
Segment profit increased 107.4% or $6.9 million. The increase in segment profit was dueto higher net sales and gross profit, partially offset by higher selling, general and administrativeexpenses as further described above.
Depreciation and Amortization Expense. Depreciation and amortization expense increasedby 16.3% or $4.1 million, for the year ended June 30, 2012, compared to the year ended June 30,2011, primarily due to higher amortization expense related to the amended licensing agreement withLiz Claiborne, Inc. and the 2012 Acquisitions, as well as higher depreciation for leaseholdimprovements and IT equipment.
Interest Expense. Interest expense, net of interest income, increased 1.3%, or $0.3 million, forthe year ended June 30, 2012, compared to the year ended June 30, 2011. The increase wasprimarily due to higher long-term debt in the current year as a result of the higher aggregateprincipal amount of our 73⁄8% senior notes issued in January 2011, as compared to the 73⁄4% seniorsubordinated notes that were outstanding during the first half of the prior year. See Notes 8 and 9 tothe Notes to Consolidated Financial Statements.
Debt Extinguishment Charges. For the year ended June 30, 2011, we recorded $6.5 millionin debt extinguishment charges related to the purchase and redemption of our previouslyoutstanding 73⁄4% senior subordinated notes and the amendment of our revolving bank creditfacility. See Notes 8 and 9 to the Notes to Consolidated Financial Statements.
Provision for Income Taxes. The pre-tax income from our domestic and internationaloperations consisted of the following for the years ended June 30, 2012 and 2011:
Year Ended
(Amounts in thousands)June 30,
2012June 30,
2011
Domestic pre-tax income . . . . . . . . . . . . . . . . . . . . . . . . . . . . $16,964 $ 5,887Foreign pre-tax income . . . . . . . . . . . . . . . . . . . . . . . . . . . . . . 56,548 43,739
Total income before income taxes . . . . . . . . . . . . . . . . . . . . . $73,512 $49,626
Effective tax rate . . . . . . . . . . . . . . . . . . . . . . . . . . . . . . . . . . . 21.9% 17.4%
The increase in the effective tax rate in the current year period as compared to the prior yearperiod was mainly due to (i) higher earnings contributions from our domestic operations in thecurrent year as compared to the prior year, and (ii) a shift in the ratio of earnings contributionsbetween jurisdictions that have different tax rates. Our domestic operations are tax-effected at ahigher rate than our foreign operations. The impact of discrete tax adjustments in the current year,were not material to the effective tax rate. The prior year effective tax rate included a net tax benefitof $1.4 million, of which (i) $0.9 million related to the closure of foreign tax audits and wasrecorded in the fourth quarter, (ii) $0.3 million related to the reversal of valuation allowancesassociated with net operating losses previously recorded by certain international subsidiaries thatbecame realizable, and (iii) $0.2 million related to tax benefits due to changes in estimates forcertain entities. Also included in the prior year effective tax rates was a tax benefit of $0.6 millionrelated to research and development and foreign tax credits. See Note 12 to the Notes toConsolidated Financial Statements.
47
A substantial portion of our consolidated taxable income is typically generated in Switzerland,where our international operations are headquartered and managed, and is taxed at a significantlylower effective tax rate than our domestic taxable income. As a result, any material shift in therelative proportion of our consolidated taxable income that is generated between the United Statesand Switzerland could have a material effect on our consolidated effective tax rate.
Net Income. Net income for the year ended June 30, 2012, was $57.4 million compared to$41.0 million for the year ended June 30, 2011. The increase in net income was primarily the resultof higher net income from operations, partially offset by a higher effective tax rate in the currentyear period.
EBITDA. EBITDA (net income plus the provision for income taxes (or net loss less the benefitfrom income taxes), plus interest expense, plus depreciation and amortization expense) of $129.3million for the year ended June 30, 2012, includes $7.1 million of costs comprised of (i) $4.5 millionof inventory–related costs primarily for inventory purchased by us from New Wave Fragrances LLCand Give Back Brands LLC prior to the asset acquisitions from those companies, (ii) $0.8 million intransaction costs associated with such acquisitions. (iii) $0.4 million for product discontinuationcharges, and (iv) $1.4 million of license termination costs. EBITDA for the year ended June 30,2011 was $100.9 million and included $6.5 million in debt extinguishment charges andrestructuring and Initiative-related one-time costs of $0.6 million. The increase in EBITDA in thecurrent year of approximately $28.4 million compared to the prior year was primarily the result ofhigher income from operations as discussed above. For a discussion of EBITDA and a reconciliationof net income to EBITDA for the years ended June 30, 2012 and 2011, see Note 11 under Item 6,“Selected Financial Data.”
Year Ended June 30, 2011 Compared to Year Ended June 30, 2010
Net Sales. Net sales increased by 6.5% or $71.7 million for the year ended June 30, 2011,compared to the year ended June 30, 2010. Excluding the favorable impact of foreign currencytranslation, net sales increased by 5.9% or $64.9 million. Net sales of Elizabeth Arden brandedproducts increased by $32.8 million, led primarily by higher sales of skin care products andfragrances. Net sales of licensed and other owned products increased by $37.5 million, primarily dueto higher sales of (i) the Juicy Couture fragrances, (ii) the recently licensed fragrance brands of JohnVarvatos and Kate Spade, and (iii) Britney Spears fragrances due to the launch of radiance BritneySpears. Partially offsetting these net sales increases were lower sales of Rocawear, Usher and AlbertaFerretti fragrances. Sales of distributed brands were $3.4 million higher than the prior year. Pricingchanges had an immaterial effect on net sales.
North America
Net sales increased by 5.2% or $37.4 million. Excluding the favorable impact of foreigncurrency translation, net sales increased by 4.9% or $35.2 million. Net sales of Elizabeth Ardenbranded products increased by $18.4 million as higher sales of skin care and color cosmeticproducts were slightly offset by lower sales of fragrances. Net sales of licensed and other ownedproducts increased by $15.0 million primarily due to higher sales of Juicy Couture fragrancesand the recently licensed fragrance brands of John Varvatos and Kate Spade, partially offset bylower sales of Britney Spears and Rocawear fragrances. Sales of distributed brands increased by$3.5 million over the prior year. Net sales to mass retail customers increased by $36.9 million.
International
Net sales increased by 8.9% or $34.3 million. Excluding the favorable impact of foreigncurrency translation, net sales increased by 7.7 % or $29.7 million. Net sales of Elizabeth Ardenbranded products increased by $14.4 million, led by higher sales of fragrances and skin careproducts. Net sales of licensed and other owned products also increased by $22.5 million,
48
primarily due to higher sales of (i) the Juicy Couture fragrances, due primarily to the launch ofPeace Love & Juicy Couture, and (ii) Britney Spears fragrances, due primarily to the launch ofradiance Britney Spears, and (iii) the recently licensed John Varvatos fragrances, slightly offsetby lower sales of Alberta Ferretti fragrances. Our results were led by higher net sales of $20.8million for travel retail and distributor markets and higher net sales of $7.3 million in Europe,primarily in the United Kingdom.
Gross Margin. For the years ended June 30, 2011 and 2010, gross margins were 47.3% and44.9%, respectively. Gross margin in the current year period benefited from a higher proportion ofbasic sales of Elizabeth Arden products and licensed brands, which reflect higher gross margins ascompared to distributed brands and promotional product sales, as well as improved operatingefficiencies due to the Initiative.
SG&A. Selling, general and administrative expenses increased 6.1%, or $26.2 million, for theyear ended June 30, 2011, compared to the year ended June 30, 2010. The increase was due tohigher marketing and sales expenses of $15.9 million and higher general and administrativeexpenses of $10.3 million. The increase in marketing and sales expenses was primarily due to(i) higher media expenses of $7.4 million, (ii) higher marketing and sales overhead expenses of $5.2million, and (iii) higher royalty expenses of $3.4 million due to higher sales of licensed brands. Theincrease in general and administrative expenses was principally due to higher payroll and incentivecompensation costs of $15.0 million, and higher professional services costs, partially offset by lowerrestructuring expenses and Initiative-related one-time costs and $3.1 million of higher losses in theprior year period related to the impact of foreign currency translation of our affiliates’ balancesheets. For the year ended June 30, 2011, total restructuring and Initiative-related one-time coststotaled $1.4 million as compared to $7.3 million for the year ended June 30, 2010.
Segment Profit
North America
Segment profit increased 12.2% or $11.3 million. The increase in segment profit was dueto higher net sales and gross profit, partially offset by higher selling, general and administrativeexpenses as further described above.
International
Segment profit increased 1,065.2% or $5.9 million. The increase in segment profit was dueto higher net sales and gross profit, partially offset by higher selling, general and administrativeexpenses as further described above.
Interest Expense. Interest expense, net of interest income, decreased 1.8%, or $0.4 million,for the year ended June 30, 2011, compared to the year ended June 30, 2010. The decrease was dueto lower average borrowings under our revolving bank credit facility, partially offset by higher long-term debt during the second half of fiscal 2011 as a result of the higher aggregate principal amountof our 73⁄8% senior notes issued in January 2011, as compared to the 73⁄4% senior subordinatednotes that were outstanding during the prior year period. See Note 8 and Note 9 to the Notes toConsolidated Financial Statements.
Debt Extinguishment Charges. For the year ended June 30, 2011, we recorded $6.5 millionin debt extinguishment charges related to the purchase and redemption of our previouslyoutstanding 73⁄4% senior subordinated notes and the amendment of our revolving bank creditfacility. See Note 8 and Note 9 to the Notes to Consolidated Financial Statements. For the yearended June 30, 2010, we recorded $0.1 million in debt extinguishment charges related to therepurchase of $5.0 million of our 73⁄4% senior subordinated notes.
49
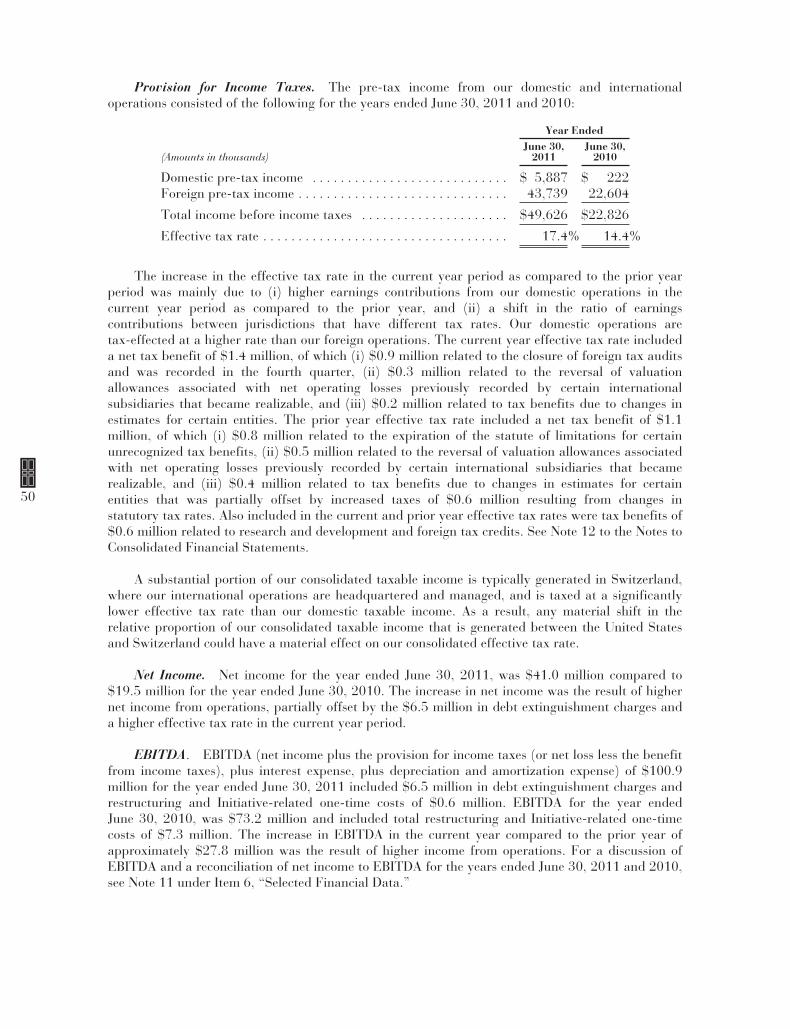
Provision for Income Taxes. The pre-tax income from our domestic and internationaloperations consisted of the following for the years ended June 30, 2011 and 2010:
Year Ended
(Amounts in thousands)June 30,
2011June 30,
2010
Domestic pre-tax income . . . . . . . . . . . . . . . . . . . . . . . . . . . . $ 5,887 $ 222Foreign pre-tax income . . . . . . . . . . . . . . . . . . . . . . . . . . . . . . 43,739 22,604
Total income before income taxes . . . . . . . . . . . . . . . . . . . . . $49,626 $22,826
Effective tax rate . . . . . . . . . . . . . . . . . . . . . . . . . . . . . . . . . . . 17.4% 14.4%
The increase in the effective tax rate in the current year period as compared to the prior yearperiod was mainly due to (i) higher earnings contributions from our domestic operations in thecurrent year period as compared to the prior year, and (ii) a shift in the ratio of earningscontributions between jurisdictions that have different tax rates. Our domestic operations aretax-effected at a higher rate than our foreign operations. The current year effective tax rate includeda net tax benefit of $1.4 million, of which (i) $0.9 million related to the closure of foreign tax auditsand was recorded in the fourth quarter, (ii) $0.3 million related to the reversal of valuationallowances associated with net operating losses previously recorded by certain internationalsubsidiaries that became realizable, and (iii) $0.2 million related to tax benefits due to changes inestimates for certain entities. The prior year effective tax rate included a net tax benefit of $1.1million, of which (i) $0.8 million related to the expiration of the statute of limitations for certainunrecognized tax benefits, (ii) $0.5 million related to the reversal of valuation allowances associatedwith net operating losses previously recorded by certain international subsidiaries that becamerealizable, and (iii) $0.4 million related to tax benefits due to changes in estimates for certainentities that was partially offset by increased taxes of $0.6 million resulting from changes instatutory tax rates. Also included in the current and prior year effective tax rates were tax benefits of$0.6 million related to research and development and foreign tax credits. See Note 12 to the Notes toConsolidated Financial Statements.
A substantial portion of our consolidated taxable income is typically generated in Switzerland,where our international operations are headquartered and managed, and is taxed at a significantlylower effective tax rate than our domestic taxable income. As a result, any material shift in therelative proportion of our consolidated taxable income that is generated between the United Statesand Switzerland could have a material effect on our consolidated effective tax rate.
Net Income. Net income for the year ended June 30, 2011, was $41.0 million compared to$19.5 million for the year ended June 30, 2010. The increase in net income was the result of highernet income from operations, partially offset by the $6.5 million in debt extinguishment charges anda higher effective tax rate in the current year period.
EBITDA. EBITDA (net income plus the provision for income taxes (or net loss less the benefitfrom income taxes), plus interest expense, plus depreciation and amortization expense) of $100.9million for the year ended June 30, 2011 included $6.5 million in debt extinguishment charges andrestructuring and Initiative-related one-time costs of $0.6 million. EBITDA for the year endedJune 30, 2010, was $73.2 million and included total restructuring and Initiative-related one-timecosts of $7.3 million. The increase in EBITDA in the current year compared to the prior year ofapproximately $27.8 million was the result of higher income from operations. For a discussion ofEBITDA and a reconciliation of net income to EBITDA for the years ended June 30, 2011 and 2010,see Note 11 under Item 6, “Selected Financial Data.”
50
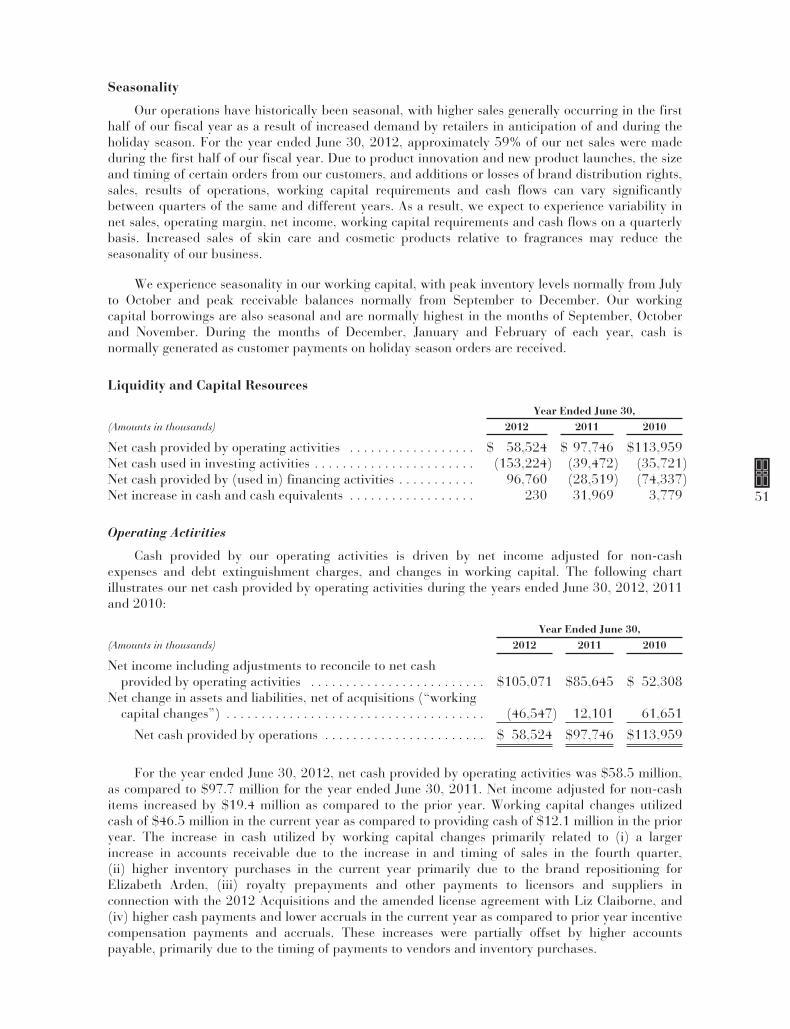
Seasonality
Our operations have historically been seasonal, with higher sales generally occurring in the firsthalf of our fiscal year as a result of increased demand by retailers in anticipation of and during theholiday season. For the year ended June 30, 2012, approximately 59% of our net sales were madeduring the first half of our fiscal year. Due to product innovation and new product launches, the sizeand timing of certain orders from our customers, and additions or losses of brand distribution rights,sales, results of operations, working capital requirements and cash flows can vary significantlybetween quarters of the same and different years. As a result, we expect to experience variability innet sales, operating margin, net income, working capital requirements and cash flows on a quarterlybasis. Increased sales of skin care and cosmetic products relative to fragrances may reduce theseasonality of our business.
We experience seasonality in our working capital, with peak inventory levels normally from Julyto October and peak receivable balances normally from September to December. Our workingcapital borrowings are also seasonal and are normally highest in the months of September, Octoberand November. During the months of December, January and February of each year, cash isnormally generated as customer payments on holiday season orders are received.
Liquidity and Capital Resources
Year Ended June 30,(Amounts in thousands) 2012 2011 2010
Net cash provided by operating activities . . . . . . . . . . . . . . . . . . $ 58,524 $ 97,746 $113,959Net cash used in investing activities . . . . . . . . . . . . . . . . . . . . . . . (153,224) (39,472) (35,721)Net cash provided by (used in) financing activities . . . . . . . . . . . 96,760 (28,519) (74,337)Net increase in cash and cash equivalents . . . . . . . . . . . . . . . . . . 230 31,969 3,779
Operating Activities
Cash provided by our operating activities is driven by net income adjusted for non-cashexpenses and debt extinguishment charges, and changes in working capital. The following chartillustrates our net cash provided by operating activities during the years ended June 30, 2012, 2011and 2010:
Year Ended June 30,(Amounts in thousands) 2012 2011 2010
Net income including adjustments to reconcile to net cashprovided by operating activities . . . . . . . . . . . . . . . . . . . . . . . . . $105,071 $85,645 $ 52,308
Net change in assets and liabilities, net of acquisitions (“workingcapital changes”) . . . . . . . . . . . . . . . . . . . . . . . . . . . . . . . . . . . . . (46,547) 12,101 61,651
Net cash provided by operations . . . . . . . . . . . . . . . . . . . . . . . $ 58,524 $97,746 $113,959
For the year ended June 30, 2012, net cash provided by operating activities was $58.5 million,as compared to $97.7 million for the year ended June 30, 2011. Net income adjusted for non-cashitems increased by $19.4 million as compared to the prior year. Working capital changes utilizedcash of $46.5 million in the current year as compared to providing cash of $12.1 million in the prioryear. The increase in cash utilized by working capital changes primarily related to (i) a largerincrease in accounts receivable due to the increase in and timing of sales in the fourth quarter,(ii) higher inventory purchases in the current year primarily due to the brand repositioning forElizabeth Arden, (iii) royalty prepayments and other payments to licensors and suppliers inconnection with the 2012 Acquisitions and the amended license agreement with Liz Claiborne, and(iv) higher cash payments and lower accruals in the current year as compared to prior year incentivecompensation payments and accruals. These increases were partially offset by higher accountspayable, primarily due to the timing of payments to vendors and inventory purchases.
51
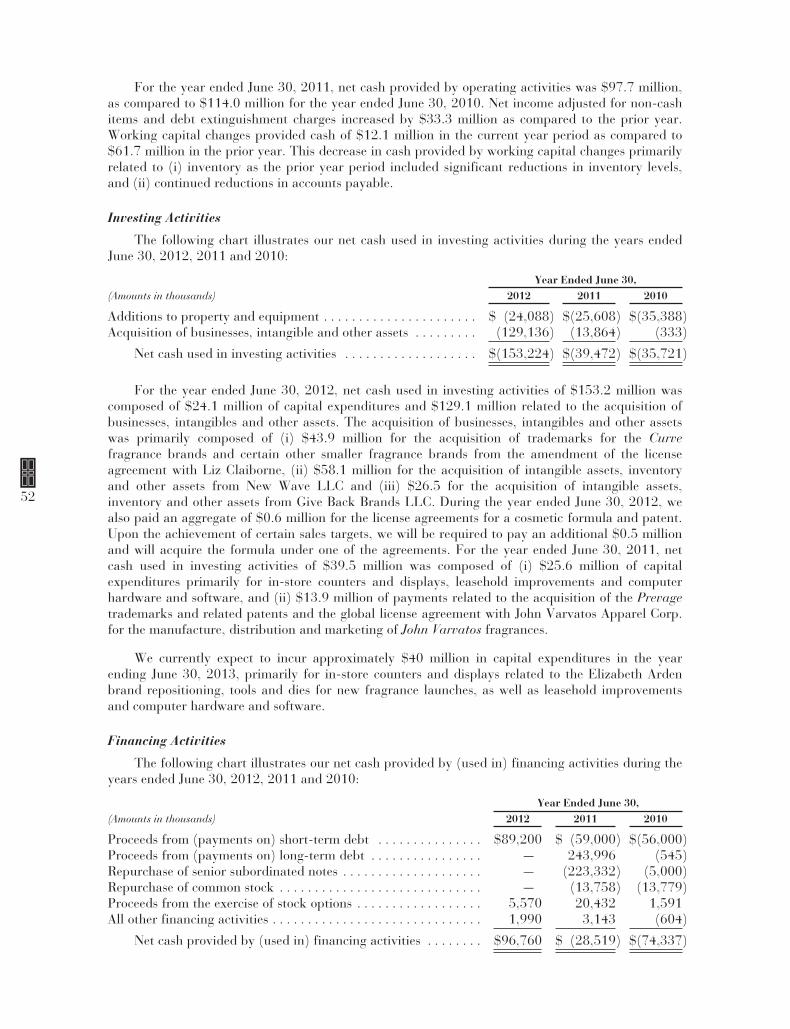
For the year ended June 30, 2011, net cash provided by operating activities was $97.7 million,as compared to $114.0 million for the year ended June 30, 2010. Net income adjusted for non-cashitems and debt extinguishment charges increased by $33.3 million as compared to the prior year.Working capital changes provided cash of $12.1 million in the current year period as compared to$61.7 million in the prior year. This decrease in cash provided by working capital changes primarilyrelated to (i) inventory as the prior year period included significant reductions in inventory levels,and (ii) continued reductions in accounts payable.
Investing Activities
The following chart illustrates our net cash used in investing activities during the years endedJune 30, 2012, 2011 and 2010:
Year Ended June 30,(Amounts in thousands) 2012 2011 2010
Additions to property and equipment . . . . . . . . . . . . . . . . . . . . . . $ (24,088) $(25,608) $(35,388)Acquisition of businesses, intangible and other assets . . . . . . . . . (129,136) (13,864) (333)
Net cash used in investing activities . . . . . . . . . . . . . . . . . . . $(153,224) $(39,472) $(35,721)
For the year ended June 30, 2012, net cash used in investing activities of $153.2 million wascomposed of $24.1 million of capital expenditures and $129.1 million related to the acquisition ofbusinesses, intangibles and other assets. The acquisition of businesses, intangibles and other assetswas primarily composed of (i) $43.9 million for the acquisition of trademarks for the Curvefragrance brands and certain other smaller fragrance brands from the amendment of the licenseagreement with Liz Claiborne, (ii) $58.1 million for the acquisition of intangible assets, inventoryand other assets from New Wave LLC and (iii) $26.5 for the acquisition of intangible assets,inventory and other assets from Give Back Brands LLC. During the year ended June 30, 2012, wealso paid an aggregate of $0.6 million for the license agreements for a cosmetic formula and patent.Upon the achievement of certain sales targets, we will be required to pay an additional $0.5 millionand will acquire the formula under one of the agreements. For the year ended June 30, 2011, netcash used in investing activities of $39.5 million was composed of (i) $25.6 million of capitalexpenditures primarily for in-store counters and displays, leasehold improvements and computerhardware and software, and (ii) $13.9 million of payments related to the acquisition of the Prevagetrademarks and related patents and the global license agreement with John Varvatos Apparel Corp.for the manufacture, distribution and marketing of John Varvatos fragrances.
We currently expect to incur approximately $40 million in capital expenditures in the yearending June 30, 2013, primarily for in-store counters and displays related to the Elizabeth Ardenbrand repositioning, tools and dies for new fragrance launches, as well as leasehold improvementsand computer hardware and software.
Financing Activities
The following chart illustrates our net cash provided by (used in) financing activities during theyears ended June 30, 2012, 2011 and 2010:
Year Ended June 30,(Amounts in thousands) 2012 2011 2010
Proceeds from (payments on) short-term debt . . . . . . . . . . . . . . . $89,200 $ (59,000) $(56,000)Proceeds from (payments on) long-term debt . . . . . . . . . . . . . . . . — 243,996 (545)Repurchase of senior subordinated notes . . . . . . . . . . . . . . . . . . . . — (223,332) (5,000)Repurchase of common stock . . . . . . . . . . . . . . . . . . . . . . . . . . . . . — (13,758) (13,779)Proceeds from the exercise of stock options . . . . . . . . . . . . . . . . . . 5,570 20,432 1,591All other financing activities . . . . . . . . . . . . . . . . . . . . . . . . . . . . . . 1,990 3,143 (604)
Net cash provided by (used in) financing activities . . . . . . . . $96,760 $ (28,519) $(74,337)
52
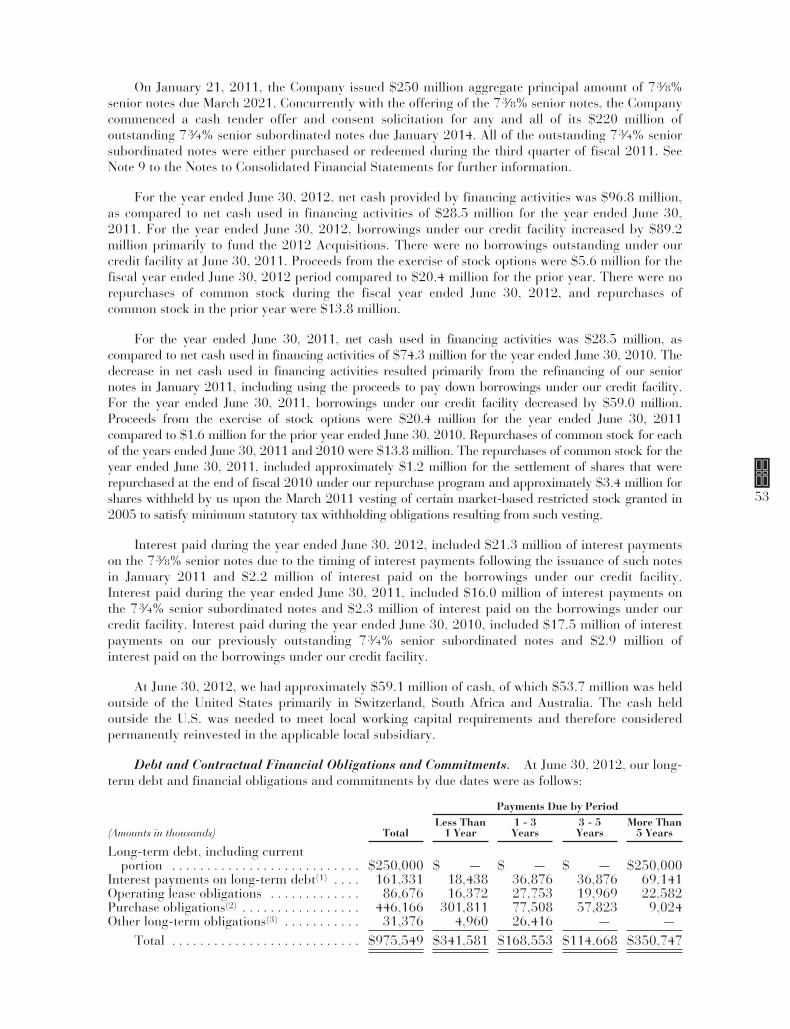
On January 21, 2011, the Company issued $250 million aggregate principal amount of 73⁄8%senior notes due March 2021. Concurrently with the offering of the 73⁄8% senior notes, the Companycommenced a cash tender offer and consent solicitation for any and all of its $220 million ofoutstanding 73⁄4% senior subordinated notes due January 2014. All of the outstanding 73⁄4% seniorsubordinated notes were either purchased or redeemed during the third quarter of fiscal 2011. SeeNote 9 to the Notes to Consolidated Financial Statements for further information.
For the year ended June 30, 2012, net cash provided by financing activities was $96.8 million,as compared to net cash used in financing activities of $28.5 million for the year ended June 30,2011. For the year ended June 30, 2012, borrowings under our credit facility increased by $89.2million primarily to fund the 2012 Acquisitions. There were no borrowings outstanding under ourcredit facility at June 30, 2011. Proceeds from the exercise of stock options were $5.6 million for thefiscal year ended June 30, 2012 period compared to $20.4 million for the prior year. There were norepurchases of common stock during the fiscal year ended June 30, 2012, and repurchases ofcommon stock in the prior year were $13.8 million.
For the year ended June 30, 2011, net cash used in financing activities was $28.5 million, ascompared to net cash used in financing activities of $74.3 million for the year ended June 30, 2010. Thedecrease in net cash used in financing activities resulted primarily from the refinancing of our seniornotes in January 2011, including using the proceeds to pay down borrowings under our credit facility.For the year ended June 30, 2011, borrowings under our credit facility decreased by $59.0 million.Proceeds from the exercise of stock options were $20.4 million for the year ended June 30, 2011compared to $1.6 million for the prior year ended June 30, 2010. Repurchases of common stock for eachof the years ended June 30, 2011 and 2010 were $13.8 million. The repurchases of common stock for theyear ended June 30, 2011, included approximately $1.2 million for the settlement of shares that wererepurchased at the end of fiscal 2010 under our repurchase program and approximately $3.4 million forshares withheld by us upon the March 2011 vesting of certain market-based restricted stock granted in2005 to satisfy minimum statutory tax withholding obligations resulting from such vesting.
Interest paid during the year ended June 30, 2012, included $21.3 million of interest paymentson the 73⁄8% senior notes due to the timing of interest payments following the issuance of such notesin January 2011 and $2.2 million of interest paid on the borrowings under our credit facility.Interest paid during the year ended June 30, 2011, included $16.0 million of interest payments onthe 73⁄4% senior subordinated notes and $2.3 million of interest paid on the borrowings under ourcredit facility. Interest paid during the year ended June 30, 2010, included $17.5 million of interestpayments on our previously outstanding 73⁄4% senior subordinated notes and $2.9 million ofinterest paid on the borrowings under our credit facility.
At June 30, 2012, we had approximately $59.1 million of cash, of which $53.7 million was heldoutside of the United States primarily in Switzerland, South Africa and Australia. The cash heldoutside the U.S. was needed to meet local working capital requirements and therefore consideredpermanently reinvested in the applicable local subsidiary.
Debt and Contractual Financial Obligations and Commitments. At June 30, 2012, our long-term debt and financial obligations and commitments by due dates were as follows:
Payments Due by Period
(Amounts in thousands) TotalLess Than
1 Year1 - 3Years
3 - 5Years
More Than5 Years
Long-term debt, including currentportion . . . . . . . . . . . . . . . . . . . . . . . . . . . $250,000 $ — $ — $ — $250,000
Interest payments on long-term debt(1) . . . . 161,331 18,438 36,876 36,876 69,141Operating lease obligations . . . . . . . . . . . . . 86,676 16,372 27,753 19,969 22,582Purchase obligations(2) . . . . . . . . . . . . . . . . . 446,166 301,811 77,508 57,823 9,024Other long-term obligations(3) . . . . . . . . . . . 31,376 4,960 26,416 — —
Total . . . . . . . . . . . . . . . . . . . . . . . . . . . $975,549 $341,581 $168,553 $114,668 $350,747
53
(1) Consists of interest at the rate of 73⁄8% per annum on the $250 million aggregate principalamount of 73⁄8% senior notes. See Note 9 to the Notes to Consolidated Financial Statements.
(2) Consists of obligations incurred in the ordinary course of business related to purchasecommitments for finished goods, raw materials, components, advertising, promotional items,minimum royalty guarantees, insurance, services pursuant to legally binding obligations,including fixed or minimum obligations, and estimates of such obligations subject to variableprice provisions.
(3) Includes: (i) the contingent consideration which may become payable to Give Back Brands LLCif certain sales targets are met, but (ii) excludes $4.9 million of gross unrecognized tax benefitsthat, if not realized, would result in cash payments. We cannot currently estimate when, or if,any of the gross unrecognized tax benefits, will be due. See Notes 11 and 12 to the Notes toConsolidated Financial Statements.
Future Liquidity and Capital Needs. Our principal future uses of funds are for workingcapital requirements, including brand and product development and marketing expenses, newproduct launches, additional brand acquisitions or product licensing and distribution arrangements,capital expenditures and debt service. In addition, we may use funds to repurchase material amountsof our common stock and senior notes through open market purchases, privately negotiatedtransactions or otherwise, depending upon prevailing market conditions, our liquidity requirements,contractual restrictions and other factors. We have historically financed our working capital needsprimarily through internally generated funds, our credit facility and external financing. We collectcash from our customers based on our sales to them and their respective payment terms.
We have a $300 million revolving bank credit facility with a syndicate of banks, for whichJPMorgan Chase Bank is the administrative agent, which generally provides for borrowings on arevolving basis, with a sub-limit of $25 million for letters of credit. See Note 8 to the Notes toConsolidated Financial Statements. Under the terms of the credit facility, we may, at any time,increase the size of the credit facility up to $375 million without entering into a formal amendmentrequiring the consent of all of the banks, subject to our satisfaction of certain conditions. The creditfacility was amended in June 2012 to allow for the contingent consideration that may becomepayable with respect to the acquisition of certain assets of Give Back Brands LLC and to allow forthe term loan further discussed below. The credit facility expires in January 2016.
The credit facility is guaranteed by all of our U.S. subsidiaries and is collateralized by a firstpriority lien on all of our U.S. accounts receivable and inventory. Borrowings under the new creditfacility are limited to 85% of eligible accounts receivable and 85% of the appraised net liquidationvalue of our inventory, as determined pursuant to the terms of the credit facility; provided, however,that from August 15 to October 31 of each year, our borrowing base may be temporarily increasedby up to $25 million.
The credit facility has only one financial maintenance covenant, which is a debt servicecoverage ratio that must be maintained at not less than 1.1 to 1 if average borrowing base capacitydeclines to less than $25 million ($35 million from September 1 through January 31). Our averageborrowing base capacity for each of the quarters during fiscal 2012 did not fall below the applicablethresholds noted above. Accordingly, the debt service coverage ratio did not apply during the yearended June 30, 2012. We were in compliance with all applicable covenants under the credit facilityfor the quarter and year ended June 30, 2012.
Under the terms of the credit facility, we may pay dividends or repurchase common stock if wemaintain borrowing base capacity of at least $25 million from February 1 to August 31, and at least$35 million from September 1 to January 31, after making the applicable payment. The creditfacility restricts us from incurring additional non-trade indebtedness (other than refinancings andcertain small amounts of indebtedness).
54
Borrowings under the credit portion of the credit facility bear interest at a floating rate based onan “Applicable Margin” which is determined by reference to a debt service coverage ratio. At ouroption, the Applicable Margin may be applied to either the London InterBank Offered Rate (LIBOR)or the base rate. The Applicable Margin charged on LIBOR loans ranges from 1.75% to 2.50% andranges from 0.25% to 1.0% for base rate loans, except that the Applicable Margin on the first $25million of borrowings from August 15 to October 31 of each year, while the temporary increase inour borrowing base is in effect, is 1.0% higher. We are required to pay an unused commitment feeranging from 0.375% to 0.50% based on the quarterly average unused portion of the credit facility.The interest rates payable by us on our 73⁄8% senior notes and on borrowings under our revolvingcredit facility are not impacted by credit rating agency actions.
At June 30, 2012, the Applicable Margin was 1.75% for LIBOR loans and 0.25% for prime rateloans. The commitment fee on the unused portion of the credit facility at June 30, 2012 was 0.50%.For both the years ended June 30, 2012 and 2011, the weighted average annual interest rate onborrowings under our credit facility was 2.2%.
At June 30, 2012, we had $89.2 million in borrowings and $4.4 million in letters of creditoutstanding under the credit facility. At June 30, 2012, based on eligible accounts receivable andinventory available as collateral, an additional $51.5 million could be borrowed under our creditfacility. In connection with the 2012 Acquisitions and to take advantage of favorable interest ratesand provide us with additional financial flexibility, on June 12, 2012, we entered into a second liencredit agreement with JPMorgan Chase Bank, N.A. providing us with the ability to borrow up to $30million on or prior to July 2, 2012. On July 2, 2012 we borrowed $30 million under this term loanand used the proceeds to repay amounts under our credit facility. The term loan is collateralized bya second priority lien on all of our U.S. accounts receivable and inventories, and the interest onborrowings charged under the term loan is either LIBOR plus an applicable margin of 3.75% or thebase rate specified in the term loan (which is comparable to prime rates) plus a margin of 2.75%.The term loan matures on July 2, 2014, but we have the option to prepay all or a portion of the termloan anytime on or after February 1, 2013, provided our borrowing availability under the creditfacility is in excess of $35 million after giving effect to the applicable prepayment each day for the30 day period ending on the date of the prepayment.
At June 30, 2012, we had outstanding $250 million aggregate principal amount of 73⁄8% seniornotes due March 2021. Interest on the 73⁄8% senior notes accrues at a rate of 7.375% per annumand is payable semi-annually on March 15 and September 15 of every year. The 73⁄8% senior notesrank pari passu in right of payment to indebtedness under our credit facility and any other seniordebt, and will rank senior to any future subordinated indebtedness; provided, however, that the73⁄8% senior notes are effectively subordinated to the credit facility and the term loan to the extentof the collateral securing the credit facility and term loan. The indenture applicable to the 73⁄8%senior notes generally permits us (subject to the satisfaction of a fixed charge coverage ratio and, incertain cases, also a net income test) to incur additional indebtedness, pay dividends, purchase orredeem our common stock or redeem subordinated indebtedness. The indenture generally limits ourability to create liens, merge or transfer or sell assets. The indenture also provides that the holders ofthe 73⁄8% senior notes have the option to require us to repurchase their notes in the event of achange of control involving us (as defined in the indenture). The 73⁄8% senior notes initially will notbe guaranteed by any of our subsidiaries but could become guaranteed in the future by any domesticsubsidiary of ours that guarantees or incurs certain indebtedness in excess of $10 million.
Based upon our internal projections, we believe that existing cash and cash equivalents,internally generated funds and borrowings under our credit facility will be sufficient to cover debtservice, working capital requirements and capital expenditures for the next twelve months, otherthan additional working capital requirements that may result from further expansion of ouroperations through acquisitions of additional brands or licensing or distribution arrangements. Adeterioration in the economic and retail environment, however, could cause us to fail to satisfy the
55
financial maintenance covenant under our credit facility that applies only in the event we do nothave the requisite average borrowing base capacity as set forth under the credit facility. In such anevent, we would not be allowed to borrow under the credit facility and may not have access to thecapital necessary for our business. In addition, a default under our credit facility or term loan thatcauses acceleration of the debt under this facility could trigger a default under our outstanding73⁄8% senior notes. In the event we are not able to borrow under either borrowing facility, we wouldbe required to develop an alternative source of liquidity. There is no assurance that we could obtainreplacement financing or what the terms of such financing, if available, would be.
We have discussions from time to time with manufacturers and owners of prestige fragrancebrands regarding our possible acquisition of additional exclusive licensing and/or distribution rights.We currently have no material agreements or commitments with respect to any such acquisition,although we periodically execute routine agreements to maintain the confidentiality of informationobtained during the course of discussions with such manufacturers and brand owners. There is noassurance that we will be able to negotiate successfully for any such future acquisitions or that wewill be able to obtain acquisition financing or additional working capital financing on satisfactoryterms for further expansion of our operations.
Repurchases of Common Stock. On November 2, 2010, our board of directors authorized therepurchase of an additional $40 million of our common stock under the terms of an existing $80million common stock repurchase program and extended the term of the stock repurchase programfrom November 30, 2010 to November 30, 2012. On August 7, 2012, our board of directorsapproved an extension of the stock repurchase program through November 30, 2014.
As of June 30, 2012, we had repurchased 4,029,201 shares of common stock on the openmarket under the stock repurchase program since its inception in November 2005, at an averageprice of $16.63 per share and at a cost of approximately $67.0 million, including sales commissions,leaving approximately $53.0 million available for additional repurchases under the program. For thefiscal year ended June 30, 2012, there were no share repurchases. See Note 13 to Notes toConsolidated Financial Statements.
Forward-Looking Information and Factors That May Affect Future Results
The Securities and Exchange Commission encourages companies to disclose forward-lookinginformation so that investors can better understand a company’s future prospects and makeinformed investment decisions. This Annual Report on Form 10-K and other written and oralstatements that we make from time to time contain such forward-looking statements that set outanticipated results based on management’s plans and assumptions regarding future events orperformance. We have tried, wherever possible, to identify such statements by using words such as“anticipate,” “estimate,” “expect,” “project,” “intend,” “plan,” “believe,” “will” and similarexpressions in connection with any discussion of future operating or financial performance. Inparticular, these include statements relating to future actions, prospective products, futureperformance or results of current and anticipated products, sales efforts, expenses and/or costsavings, interest rates, foreign exchange rates, the outcome of contingencies, such as legalproceedings, and financial results. A list of factors that could cause our actual results of operationsand financial condition to differ materially from our forward-looking statements is set forth below,and most of these factors are discussed in greater detail under Item 1A — “Risk Factors” of thisAnnual Report on Form 10-K:
• factors affecting our relationships with our customers or our customers’ businesses,including the absence of contracts with customers, our customers’ financial condition, andchanges in the retail, fragrance and cosmetic industries, such as the consolidation ofretailers and the associated closing of retail doors as well as retailer inventory controlpractices, including, but not limited to, levels of inventory carried at point of sale andpractices used to control inventory shrinkage;
56
• risks of international operations, including foreign currency fluctuations, hedging activities,economic and political consequences of terrorist attacks, disruptions in travel, unfavorablechanges in U.S. or international laws or regulations, diseases and pandemics, and politicalinstability in certain regions of the world;
• our reliance on license agreements with third parties for the rights to sell many of ourprestige fragrance brands;
• our reliance on third-party manufacturers for substantially all of our owned and licensedproducts and our absence of contracts with suppliers of distributed brands and componentsfor manufacturing of owned and licensed brands;
• delays in shipments, inventory shortages and higher costs of production due to the loss ofor disruption in our distribution facilities or at key third party manufacturing or fulfillmentfacilities that manufacture or provide logistic services for our products;
• our ability to respond in a timely manner to changing consumer preferences andpurchasing patterns and other international and domestic conditions and events thatimpact retailer and/or consumer confidence and demand, such as domestic or globalrecessions or economic uncertainty;
• our ability to protect our intellectual property rights;
• the success, or changes in the timing or scope, of our new product launches, advertisingand merchandising programs;
• the quality, safety and efficacy of our products;
• the impact of competitive products and pricing;
• our ability to (i) implement our growth strategy and acquire or license additional brands orsecure additional distribution arrangements, (ii) successfully and cost-effectively integrateacquired businesses or new brands, and (iii) finance our growth strategy and our workingcapital requirements;
• our level of indebtedness, our ability to realize sufficient cash flows from operations tomeet our debt service obligations and working capital requirements, and restrictivecovenants in our revolving credit facility, term loan and the indenture for our 73⁄8% seniornotes;
• changes in product mix to less profitable products;
• the retention and availability of key personnel;
• changes in the legal, regulatory and political environment that impact, or will impact, ourbusiness, including changes to customs or trade regulations, laws or regulations relating toingredients or other chemicals or raw materials contained in products or packaging, oraccounting standards or critical accounting estimates;
• the success of our Elizabeth Arden brand repositioning efforts;
• the impact of tax audits, including the ultimate outcome of the pending Internal RevenueService examination of our U.S. federal tax returns for the fiscal years ended June 30, 2008and June 30, 2009, changes in tax laws or tax rates, and our ability to utilize our deferredtax assets;
• our ability to effectively implement, manage and maintain our global information systemsand maintain the security of our confidential data and our employees’ and customers’personal information;
• our reliance on certain third parties for certain outsourced business services, includinginformation technology operations, logistics management and employee benefit planadministration;
57
• the potential for significant impairment charges relating to our trademarks, goodwill orother intangible assets that could result from a number of factors, including downwardpressure on our stock price; and
• other unanticipated risks and uncertainties.
We caution that the factors described herein and other factors could cause our actual results ofoperations and financial condition to differ materially from those expressed in any forward-lookingstatements we make and that investors should not place undue reliance on any such forward-lookingstatements. Further, any forward-looking statement speaks only as of the date on which suchstatement is made, and we undertake no obligation to update any forward-looking statement toreflect events or circumstances after the date on which such statement is made or to reflect theoccurrence of anticipated or unanticipated events or circumstances. New factors emerge from time totime, and it is not possible for us to predict all of such factors. Further, we cannot assess the impactof each such factor on our results of operations or the extent to which any factor, or combination offactors, may cause actual results to differ materially from those contained in any forward-lookingstatements.
ITEM 7A. QUANTITATIVE AND QUALITATIVE DISCLOSURES ABOUT MARKET RISK
Interest Rate Risk
As of June 30, 2012, we had $89.2 million in borrowings and $4.4 million in letters of creditoutstanding under our revolving credit facility. Borrowings under our revolving credit facility areseasonal, with peak borrowings typically in the months of September, October and November.Borrowings under the credit facility and our term loan are subject to variable rates and, accordingly,our earnings and cash flow will be affected by changes in interest rates. Based upon our averageborrowings under our revolving credit facility during the year ended June 30, 2012, and assumingthere had been a two percentage point (200 basis points) change in the average interest rate forthese borrowings, it is estimated that our interest expense for the year ended June 30, 2012 wouldhave increased or decreased by approximately $1.0 million. See Note 8 to the Notes to ConsolidatedFinancial Statements.
Foreign Currency Risk
We sell our products in approximately 120 countries around the world. During the fiscal yearended June 30, 2012, we derived approximately 42% of our net sales from our internationaloperations. We conduct our international operations in a variety of different countries and derive oursales in various currencies including the Euro, British pound, Swiss franc, Canadian dollar andAustralian dollar, as well as the U.S. dollar. Most of our skin care and cosmetic products areproduced in third-party manufacturing facilities located in the U.S. Our operations may be subjectto volatility because of currency changes, inflation and changes in political and economic conditionsin the countries in which we operate. With respect to international operations, our sales, cost ofgoods sold and expenses are typically denominated in a combination of local currency and the U.S.dollar. Our results of operations are reported in U.S. dollars. Fluctuations in currency rates canaffect our reported sales, margins, operating costs and the anticipated settlement of our foreigndenominated receivables and payables. A weakening of the foreign currencies in which we generatesales relative to the currencies in which our costs are denominated, which is primarily the U.S.dollar, may adversely affect our ability to meet our obligations and could adversely affect ourbusiness, prospects, results of operations, financial condition or cash flows. Our competitors may ormay not be subject to the same fluctuations in currency rates, and our competitive position could beaffected by these changes.
As of June 30, 2012, our subsidiaries outside the United States held 35.0% of our total assets.The cumulative effect of translating balance sheet accounts from the functional currency of oursubsidiaries into the U.S. dollar at current exchange rates is included in accumulated othercomprehensive income in our consolidated balance sheets.
58
As of June 30, 2012, we had notional amounts of 13.1 million British pounds and 6.0 millionEuros under open foreign currency contracts that expire between July 31, 2012 and May 31, 2013to reduce the exposure of our foreign subsidiary revenues to fluctuations in currency rates. As ofJune 30, 2012, the Company had notional amounts under foreign currency contracts of(i) 10.7 million Canadian dollars and 12.1 million Australian dollars used to hedge forecasted costof sales, and (ii) 18.2 million Swiss francs to hedge forecasted operating costs that expire betweenJuly 31, 2012 and May 31, 2013.
We have designated each qualifying foreign currency contract as a cash flow hedge. The gainsand losses of these contracts will only be recognized in earnings in the period in which the forecastedtransaction affects earnings or the transactions are no longer probable of occurring. The realizedloss, net of taxes, recognized during the year ended June 30, 2012 from settled contracts wasapproximately $0.5 million. At June 30, 2012, the unrealized gain, net of taxes, associated withthese open contracts of approximately $0.2 million is included in accumulated other comprehensiveincome in our consolidated balance sheet. See Note 16 to the Notes to Consolidated FinancialStatements.
When appropriate, we also enter into and settle foreign currency contracts for Euros, Britishpounds, Canadian dollars and Australian dollars to reduce the exposure of our foreign subsidiaries’balance sheets to fluctuations in foreign currency rates. As of June 30, 2012, there were no suchforeign currency contracts outstanding. The realized gain, net of taxes, recognized during the yearended June 30, 2012, was $0.4 million.
We do not utilize foreign exchange contracts for trading or speculative purposes. There can beno assurance that our hedging operations or other exchange rate practices, if any, will eliminate orsubstantially reduce risks associated with fluctuating exchange rates.
59
ITEM 8. FINANCIAL STATEMENTS AND SUPPLEMENTARY DATA
INDEX TO FINANCIAL STATEMENTS
Page
Report of Management . . . . . . . . . . . . . . . . . . . . . . . . . . . . . . . . . . . . . . . . . . . . . . . . . . . . . . . . . 61
Report of Independent Registered Public Accounting Firm . . . . . . . . . . . . . . . . . . . . . . . . . . . . . 62
Consolidated Balance Sheets as of June 30, 2012 and June 30, 2011 . . . . . . . . . . . . . . . . . . . . . 63
Consolidated Statements of Income for the Years Ended June 30, 2012, 2011 and 2010 . . . . . 64
Consolidated Statements of Shareholders’ Equity for the Years Ended June 30, 2012, 2011and 2010 . . . . . . . . . . . . . . . . . . . . . . . . . . . . . . . . . . . . . . . . . . . . . . . . . . . . . . . . . . . . . . . . . . 65
Consolidated Statements of Cash Flows for the Years Ended June 30, 2012, 2011 and2010 . . . . . . . . . . . . . . . . . . . . . . . . . . . . . . . . . . . . . . . . . . . . . . . . . . . . . . . . . . . . . . . . . . . . . . 68
Notes to Consolidated Financial Statements . . . . . . . . . . . . . . . . . . . . . . . . . . . . . . . . . . . . . . . . . 69
60
Report of ManagementElizabeth Arden, Inc. and Subsidiaries
Report on Consolidated Financial Statements
We prepared and are responsible for the consolidated financial statements that appear in theAnnual Report on Form 10-K for the year ended June 30, 2012 of Elizabeth Arden, Inc. (the“Company”). These consolidated financial statements are in conformity with accounting principlesgenerally accepted in the United States of America, and therefore, include amounts based oninformed judgments and estimates. We also accept responsibility for the preparation of the otherfinancial information that is included in the Company’s Annual Report on Form 10-K.
Report on Internal Control Over Financial Reporting
The management of the Company is responsible for establishing and maintaining adequateinternal control over financial reporting as defined in Rules 13a-15(f) and 15d-15(f) under theSecurities Exchange Act of 1934. The Company’s internal control over financial reporting isdesigned to provide reasonable assurance regarding the reliability of financial reporting and thepreparation of financial statements for external purposes in accordance with generally acceptedaccounting principles in the United States of America. The Company’s internal control over financialreporting includes those policies and procedures that: (i) pertain to the maintenance of records that,in reasonable detail, accurately and fairly reflect the transactions and dispositions of the assets of theCompany; (ii) provide reasonable assurance that transactions are recorded as necessary to permitpreparation of financial statements in accordance with generally accepted accounting principles, andthat receipts and expenditures of the Company are being made only in accordance withauthorizations of management and directors of the Company; and (iii) provide reasonable assuranceregarding prevention or timely detection of unauthorized acquisition, use or disposition of theCompany’s assets that could have a material effect on the consolidated financial statements.
Because of its inherent limitations, internal control over financial reporting may not prevent ordetect misstatements. Also, projections of any evaluation of effectiveness to future periods aresubject to the risk that controls may become inadequate because of changes in conditions, or that thedegree of compliance with the policies or procedures may deteriorate. Management of the Companyassessed the effectiveness of the Company’s internal control over financial reporting as of June 30,2012. In making this assessment, management used the criteria set forth by the Committee ofSponsoring Organizations of the Treadway Commission (COSO) in Internal Control-IntegratedFramework. Based on our assessment using those criteria, management concluded that the Companymaintained effective internal control over financial reporting as of June 30, 2012.
The Company’s independent registered public accounting firm, PricewaterhouseCoopers LLP,has audited the effectiveness of the Company’s internal control over financial reporting for the yearended June 30, 2012, and has expressed an unqualified opinion in their report, which is includedherein.
/s/ E. Scott Beattie /s/ Stephen J. SmithE. Scott BeattieChairman, President and Chief ExecutiveOfficer
Stephen J. SmithExecutive Vice President and Chief FinancialOfficer
August 10, 2012
61
Report of Independent Registered Public Accounting Firm
To the Board of Directors and Shareholders ofElizabeth Arden, Inc.:
In our opinion, the consolidated financial statements listed in the accompanying index present fairly,in all material respects, the financial position of Elizabeth Arden, Inc. and its subsidiaries atJune 30, 2012 and June 30, 2011, and the results of their operations and their cash flows for each ofthe three years in the period ended June 30, 2012 in conformity with accounting principles generallyaccepted in the United States of America. Also in our opinion, the Company maintained, in allmaterial respects, effective internal control over financial reporting as of June 30, 2012, based oncriteria established in Internal Control — Integrated Framework issued by the Committee ofSponsoring Organizations of the Treadway Commission (COSO). The Company’s management isresponsible for these financial statements, for maintaining effective internal control over financialreporting and for its assessment of the effectiveness of internal control over financial reporting,included in the accompanying Report of Management appearing under Item 8. Our responsibility isto express opinions on these financial statements and on the Company’s internal control overfinancial reporting based on our integrated audits. We conducted our audits in accordance with thestandards of the Public Company Accounting Oversight Board (United States). Those standardsrequire that we plan and perform the audits to obtain reasonable assurance about whether thefinancial statements are free of material misstatement and whether effective internal control overfinancial reporting was maintained in all material respects. Our audits of the financial statementsincluded examining, on a test basis, evidence supporting the amounts and disclosures in the financialstatements, assessing the accounting principles used and significant estimates made by management,and evaluating the overall financial statement presentation. Our audit of internal control overfinancial reporting included obtaining an understanding of internal control over financial reporting,assessing the risk that a material weakness exists, and testing and evaluating the design andoperating effectiveness of internal control based on the assessed risk. Our audits also includedperforming such other procedures as we considered necessary in the circumstances. We believe thatour audits provide a reasonable basis for our opinions.
A company’s internal control over financial reporting is a process designed to provide reasonableassurance regarding the reliability of financial reporting and the preparation of financial statementsfor external purposes in accordance with generally accepted accounting principles. A company’sinternal control over financial reporting includes those policies and procedures that (i) pertain to themaintenance of records that, in reasonable detail, accurately and fairly reflect the transactions anddispositions of the assets of the company; (ii) provide reasonable assurance that transactions arerecorded as necessary to permit preparation of financial statements in accordance with generallyaccepted accounting principles, and that receipts and expenditures of the company are being madeonly in accordance with authorizations of management and directors of the company; and(iii) provide reasonable assurance regarding prevention or timely detection of unauthorizedacquisition, use, or disposition of the company’s assets that could have a material effect on thefinancial statements.
Because of its inherent limitations, internal control over financial reporting may not prevent ordetect misstatements. Also, projections of any evaluation of effectiveness to future periods aresubject to the risk that controls may become inadequate because of changes in conditions, or that thedegree of compliance with the policies or procedures may deteriorate.
/s/ PricewaterhouseCoopers LLPNew York, New YorkAugust 10, 2012
62
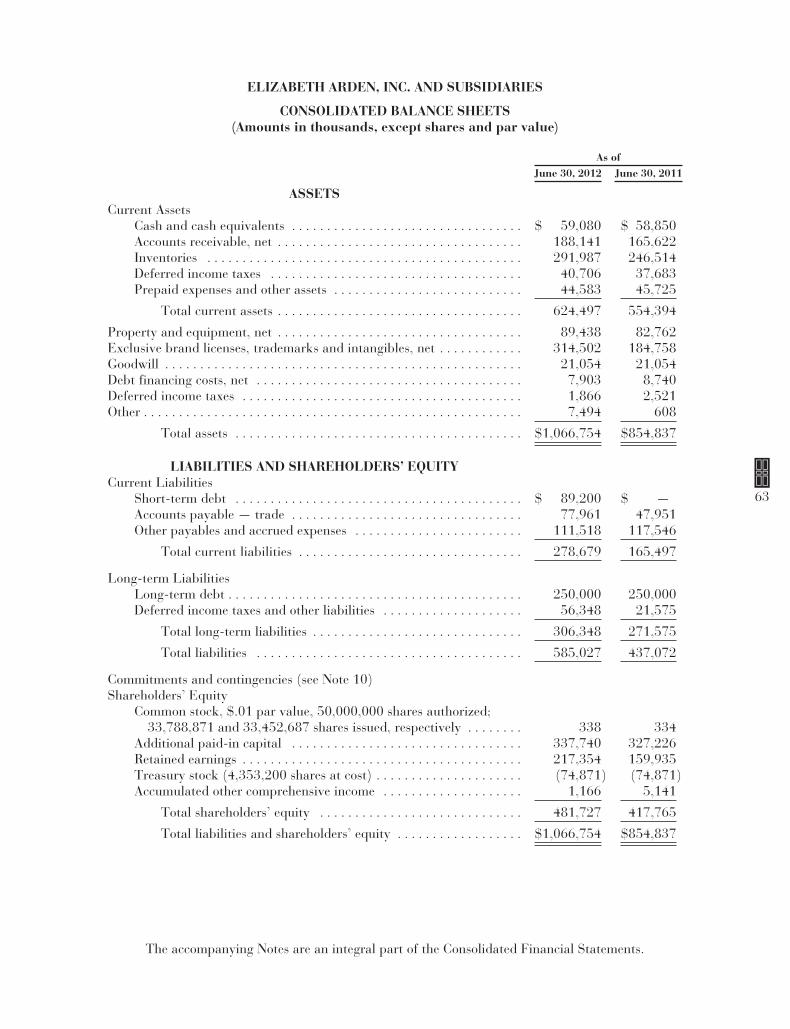
ELIZABETH ARDEN, INC. AND SUBSIDIARIES
CONSOLIDATED BALANCE SHEETS(Amounts in thousands, except shares and par value)
As ofJune 30, 2012 June 30, 2011
ASSETSCurrent Assets
Cash and cash equivalents . . . . . . . . . . . . . . . . . . . . . . . . . . . . . . . . . $ 59,080 $ 58,850Accounts receivable, net . . . . . . . . . . . . . . . . . . . . . . . . . . . . . . . . . . . 188,141 165,622Inventories . . . . . . . . . . . . . . . . . . . . . . . . . . . . . . . . . . . . . . . . . . . . . 291,987 246,514Deferred income taxes . . . . . . . . . . . . . . . . . . . . . . . . . . . . . . . . . . . . 40,706 37,683Prepaid expenses and other assets . . . . . . . . . . . . . . . . . . . . . . . . . . . 44,583 45,725
Total current assets . . . . . . . . . . . . . . . . . . . . . . . . . . . . . . . . . . . 624,497 554,394
Property and equipment, net . . . . . . . . . . . . . . . . . . . . . . . . . . . . . . . . . . . 89,438 82,762Exclusive brand licenses, trademarks and intangibles, net . . . . . . . . . . . . 314,502 184,758Goodwill . . . . . . . . . . . . . . . . . . . . . . . . . . . . . . . . . . . . . . . . . . . . . . . . . . . 21,054 21,054Debt financing costs, net . . . . . . . . . . . . . . . . . . . . . . . . . . . . . . . . . . . . . . 7,903 8,740Deferred income taxes . . . . . . . . . . . . . . . . . . . . . . . . . . . . . . . . . . . . . . . . 1,866 2,521Other . . . . . . . . . . . . . . . . . . . . . . . . . . . . . . . . . . . . . . . . . . . . . . . . . . . . . . 7,494 608
Total assets . . . . . . . . . . . . . . . . . . . . . . . . . . . . . . . . . . . . . . . . . $1,066,754 $854,837
LIABILITIES AND SHAREHOLDERS’ EQUITYCurrent Liabilities
Short-term debt . . . . . . . . . . . . . . . . . . . . . . . . . . . . . . . . . . . . . . . . . $ 89,200 $ —Accounts payable — trade . . . . . . . . . . . . . . . . . . . . . . . . . . . . . . . . . 77,961 47,951Other payables and accrued expenses . . . . . . . . . . . . . . . . . . . . . . . . 111,518 117,546
Total current liabilities . . . . . . . . . . . . . . . . . . . . . . . . . . . . . . . . 278,679 165,497
Long-term LiabilitiesLong-term debt . . . . . . . . . . . . . . . . . . . . . . . . . . . . . . . . . . . . . . . . . . 250,000 250,000Deferred income taxes and other liabilities . . . . . . . . . . . . . . . . . . . . 56,348 21,575
Total long-term liabilities . . . . . . . . . . . . . . . . . . . . . . . . . . . . . . 306,348 271,575
Total liabilities . . . . . . . . . . . . . . . . . . . . . . . . . . . . . . . . . . . . . . 585,027 437,072
Commitments and contingencies (see Note 10)Shareholders’ Equity
Common stock, $.01 par value, 50,000,000 shares authorized;33,788,871 and 33,452,687 shares issued, respectively . . . . . . . . 338 334
Additional paid-in capital . . . . . . . . . . . . . . . . . . . . . . . . . . . . . . . . . 337,740 327,226Retained earnings . . . . . . . . . . . . . . . . . . . . . . . . . . . . . . . . . . . . . . . . 217,354 159,935Treasury stock (4,353,200 shares at cost) . . . . . . . . . . . . . . . . . . . . . (74,871) (74,871)Accumulated other comprehensive income . . . . . . . . . . . . . . . . . . . . 1,166 5,141
Total shareholders’ equity . . . . . . . . . . . . . . . . . . . . . . . . . . . . . 481,727 417,765
Total liabilities and shareholders’ equity . . . . . . . . . . . . . . . . . . $1,066,754 $854,837
The accompanying Notes are an integral part of the Consolidated Financial Statements.
63
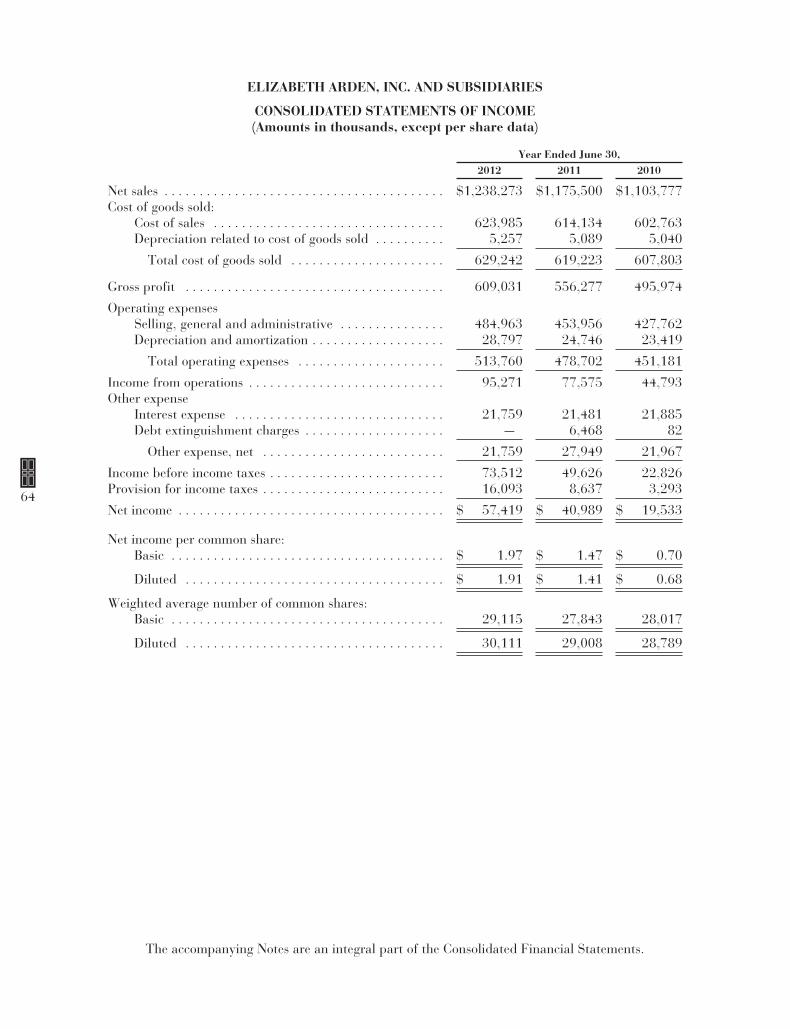
ELIZABETH ARDEN, INC. AND SUBSIDIARIES
CONSOLIDATED STATEMENTS OF INCOME(Amounts in thousands, except per share data)
Year Ended June 30,2012 2011 2010
Net sales . . . . . . . . . . . . . . . . . . . . . . . . . . . . . . . . . . . . . . . . $1,238,273 $1,175,500 $1,103,777Cost of goods sold:
Cost of sales . . . . . . . . . . . . . . . . . . . . . . . . . . . . . . . . . 623,985 614,134 602,763Depreciation related to cost of goods sold . . . . . . . . . . 5,257 5,089 5,040
Total cost of goods sold . . . . . . . . . . . . . . . . . . . . . . 629,242 619,223 607,803
Gross profit . . . . . . . . . . . . . . . . . . . . . . . . . . . . . . . . . . . . . 609,031 556,277 495,974
Operating expensesSelling, general and administrative . . . . . . . . . . . . . . . 484,963 453,956 427,762Depreciation and amortization . . . . . . . . . . . . . . . . . . . 28,797 24,746 23,419
Total operating expenses . . . . . . . . . . . . . . . . . . . . . 513,760 478,702 451,181
Income from operations . . . . . . . . . . . . . . . . . . . . . . . . . . . . 95,271 77,575 44,793Other expense
Interest expense . . . . . . . . . . . . . . . . . . . . . . . . . . . . . . 21,759 21,481 21,885Debt extinguishment charges . . . . . . . . . . . . . . . . . . . . — 6,468 82
Other expense, net . . . . . . . . . . . . . . . . . . . . . . . . . . 21,759 27,949 21,967
Income before income taxes . . . . . . . . . . . . . . . . . . . . . . . . . 73,512 49,626 22,826Provision for income taxes . . . . . . . . . . . . . . . . . . . . . . . . . . 16,093 8,637 3,293
Net income . . . . . . . . . . . . . . . . . . . . . . . . . . . . . . . . . . . . . . $ 57,419 $ 40,989 $ 19,533
Net income per common share:Basic . . . . . . . . . . . . . . . . . . . . . . . . . . . . . . . . . . . . . . . $ 1.97 $ 1.47 $ 0.70
Diluted . . . . . . . . . . . . . . . . . . . . . . . . . . . . . . . . . . . . . $ 1.91 $ 1.41 $ 0.68
Weighted average number of common shares:Basic . . . . . . . . . . . . . . . . . . . . . . . . . . . . . . . . . . . . . . . 29,115 27,843 28,017
Diluted . . . . . . . . . . . . . . . . . . . . . . . . . . . . . . . . . . . . . 30,111 29,008 28,789
The accompanying Notes are an integral part of the Consolidated Financial Statements.
64
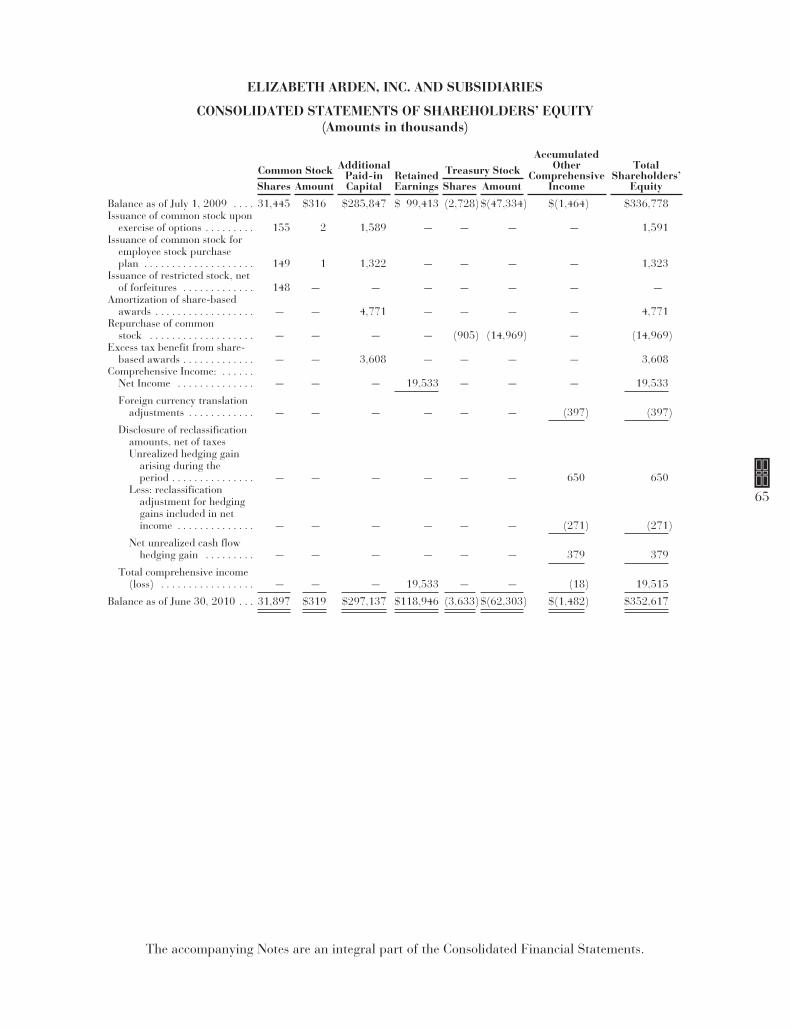
ELIZABETH ARDEN, INC. AND SUBSIDIARIES
CONSOLIDATED STATEMENTS OF SHAREHOLDERS’ EQUITY(Amounts in thousands)
Common Stock AdditionalPaid-inCapital
RetainedEarnings
Treasury StockAccumulated
OtherComprehensive
Income
TotalShareholders’
EquityShares Amount Shares Amount
Balance as of July 1, 2009 . . . . 31,445 $316 $285,847 $ 99,413 (2,728)$(47,334) $(1,464) $336,778Issuance of common stock upon
exercise of options . . . . . . . . . 155 2 1,589 — — — — 1,591Issuance of common stock for
employee stock purchaseplan . . . . . . . . . . . . . . . . . . . . 149 1 1,322 — — — — 1,323
Issuance of restricted stock, netof forfeitures . . . . . . . . . . . . . 148 — — — — — — —
Amortization of share-basedawards . . . . . . . . . . . . . . . . . . — — 4,771 — — — — 4,771
Repurchase of commonstock . . . . . . . . . . . . . . . . . . . — — — — (905) (14,969) — (14,969)
Excess tax benefit from share-based awards . . . . . . . . . . . . . — — 3,608 — — — — 3,608
Comprehensive Income: . . . . . .Net Income . . . . . . . . . . . . . . — — — 19,533 — — — 19,533
Foreign currency translationadjustments . . . . . . . . . . . . — — — — — — (397) (397)
Disclosure of reclassificationamounts, net of taxesUnrealized hedging gain
arising during theperiod . . . . . . . . . . . . . . . — — — — — — 650 650
Less: reclassificationadjustment for hedginggains included in netincome . . . . . . . . . . . . . . — — — — — — (271) (271)
Net unrealized cash flowhedging gain . . . . . . . . . — — — — — — 379 379
Total comprehensive income(loss) . . . . . . . . . . . . . . . . . — — — 19,533 — — (18) 19,515
Balance as of June 30, 2010 . . . 31,897 $319 $297,137 $118,946 (3,633)$(62,303) $(1,482) $352,617
The accompanying Notes are an integral part of the Consolidated Financial Statements.
65
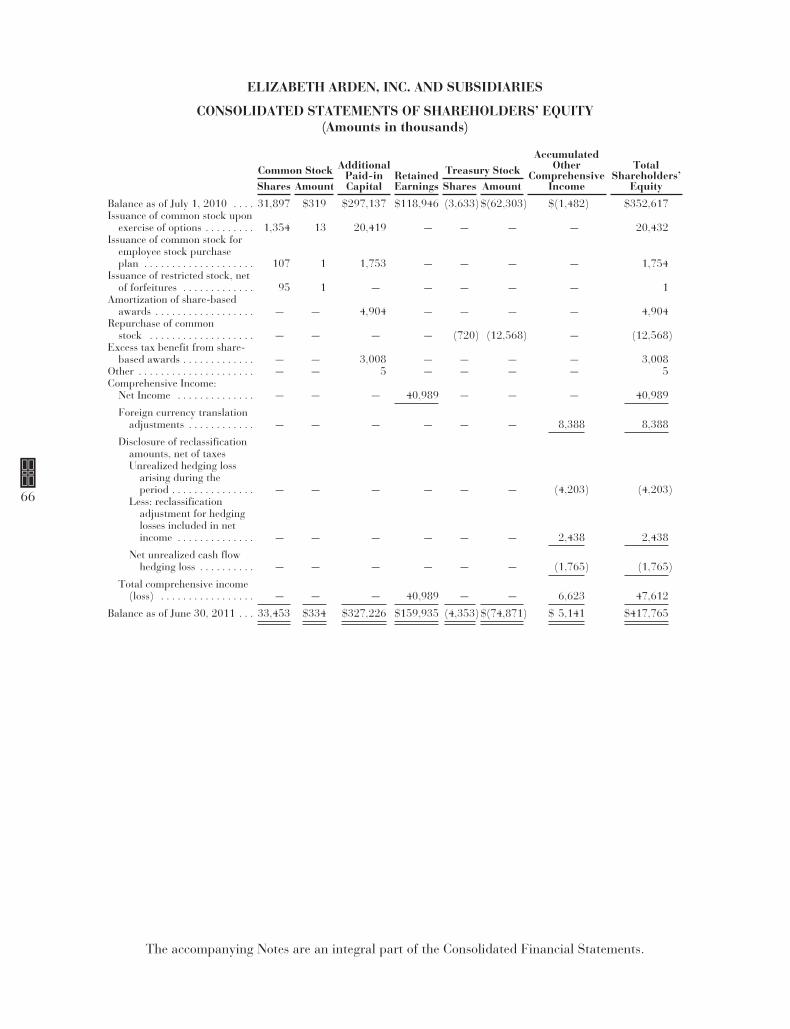
ELIZABETH ARDEN, INC. AND SUBSIDIARIES
CONSOLIDATED STATEMENTS OF SHAREHOLDERS’ EQUITY(Amounts in thousands)
Common Stock AdditionalPaid-inCapital
RetainedEarnings
Treasury StockAccumulated
OtherComprehensive
Income
TotalShareholders’
EquityShares Amount Shares Amount
Balance as of July 1, 2010 . . . . 31,897 $319 $297,137 $118,946 (3,633)$(62,303) $(1,482) $352,617Issuance of common stock upon
exercise of options . . . . . . . . . 1,354 13 20,419 — — — — 20,432Issuance of common stock for
employee stock purchaseplan . . . . . . . . . . . . . . . . . . . . 107 1 1,753 — — — — 1,754
Issuance of restricted stock, netof forfeitures . . . . . . . . . . . . . 95 1 — — — — — 1
Amortization of share-basedawards . . . . . . . . . . . . . . . . . . — — 4,904 — — — — 4,904
Repurchase of commonstock . . . . . . . . . . . . . . . . . . . — — — — (720) (12,568) — (12,568)
Excess tax benefit from share-based awards . . . . . . . . . . . . . — — 3,008 — — — — 3,008
Other . . . . . . . . . . . . . . . . . . . . . — — 5 — — — — 5Comprehensive Income:
Net Income . . . . . . . . . . . . . . — — — 40,989 — — — 40,989
Foreign currency translationadjustments . . . . . . . . . . . . — — — — — — 8,388 8,388
Disclosure of reclassificationamounts, net of taxesUnrealized hedging loss
arising during theperiod . . . . . . . . . . . . . . . — — — — — — (4,203) (4,203)
Less: reclassificationadjustment for hedginglosses included in netincome . . . . . . . . . . . . . . — — — — — — 2,438 2,438
Net unrealized cash flowhedging loss . . . . . . . . . . — — — — — — (1,765) (1,765)
Total comprehensive income(loss) . . . . . . . . . . . . . . . . . — — — 40,989 — — 6,623 47,612
Balance as of June 30, 2011 . . . 33,453 $334 $327,226 $159,935 (4,353)$(74,871) $ 5,141 $417,765
The accompanying Notes are an integral part of the Consolidated Financial Statements.
66
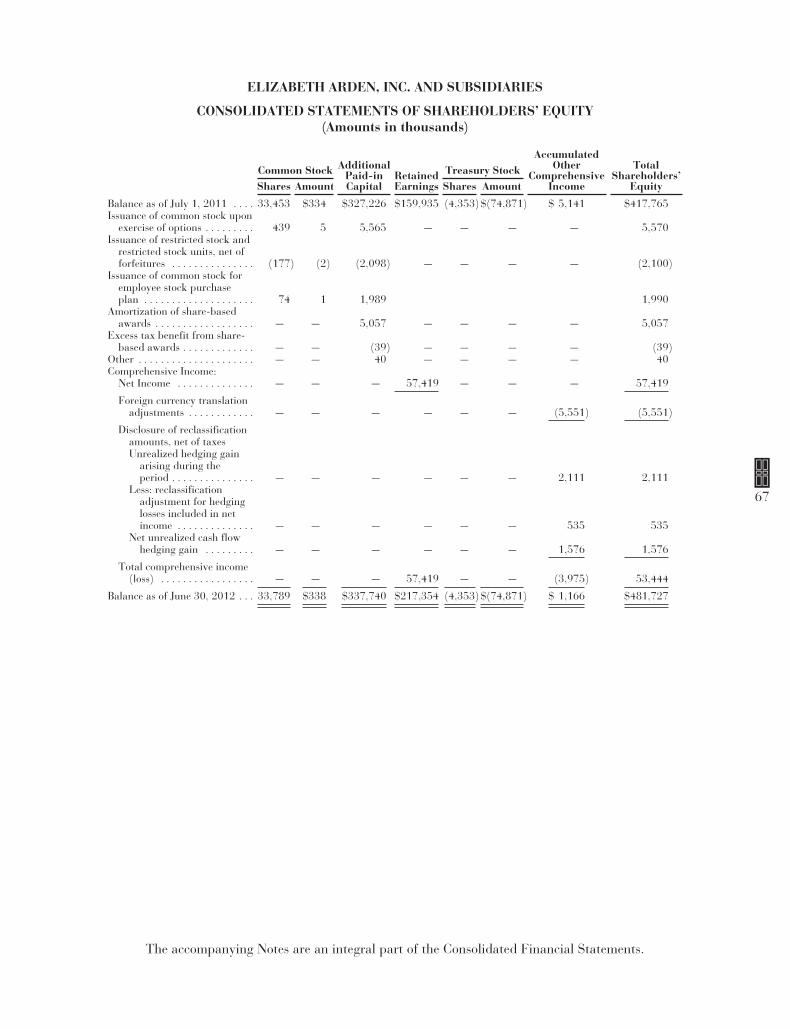
ELIZABETH ARDEN, INC. AND SUBSIDIARIES
CONSOLIDATED STATEMENTS OF SHAREHOLDERS’ EQUITY(Amounts in thousands)
Common Stock AdditionalPaid-inCapital
RetainedEarnings
Treasury StockAccumulated
OtherComprehensive
Income
TotalShareholders’
EquityShares Amount Shares Amount
Balance as of July 1, 2011 . . . . 33,453 $334 $327,226 $159,935 (4,353)$(74,871) $ 5,141 $417,765Issuance of common stock upon
exercise of options . . . . . . . . . 439 5 5,565 — — — — 5,570Issuance of restricted stock and
restricted stock units, net offorfeitures . . . . . . . . . . . . . . . (177) (2) (2,098) — — — — (2,100)
Issuance of common stock foremployee stock purchaseplan . . . . . . . . . . . . . . . . . . . . 74 1 1,989 1,990
Amortization of share-basedawards . . . . . . . . . . . . . . . . . . — — 5,057 — — — — 5,057
Excess tax benefit from share-based awards . . . . . . . . . . . . . — — (39) — — — — (39)
Other . . . . . . . . . . . . . . . . . . . . . — — 40 — — — — 40Comprehensive Income:
Net Income . . . . . . . . . . . . . . — — — 57,419 — — — 57,419
Foreign currency translationadjustments . . . . . . . . . . . . — — — — — — (5,551) (5,551)
Disclosure of reclassificationamounts, net of taxesUnrealized hedging gain
arising during theperiod . . . . . . . . . . . . . . . — — — — — — 2,111 2,111
Less: reclassificationadjustment for hedginglosses included in netincome . . . . . . . . . . . . . . — — — — — — 535 535
Net unrealized cash flowhedging gain . . . . . . . . . — — — — — — 1,576 1,576
Total comprehensive income(loss) . . . . . . . . . . . . . . . . . — — — 57,419 — — (3,975) 53,444
Balance as of June 30, 2012 . . . 33,789 $338 $337,740 $217,354 (4,353)$(74,871) $ 1,166 $481,727
The accompanying Notes are an integral part of the Consolidated Financial Statements.
67
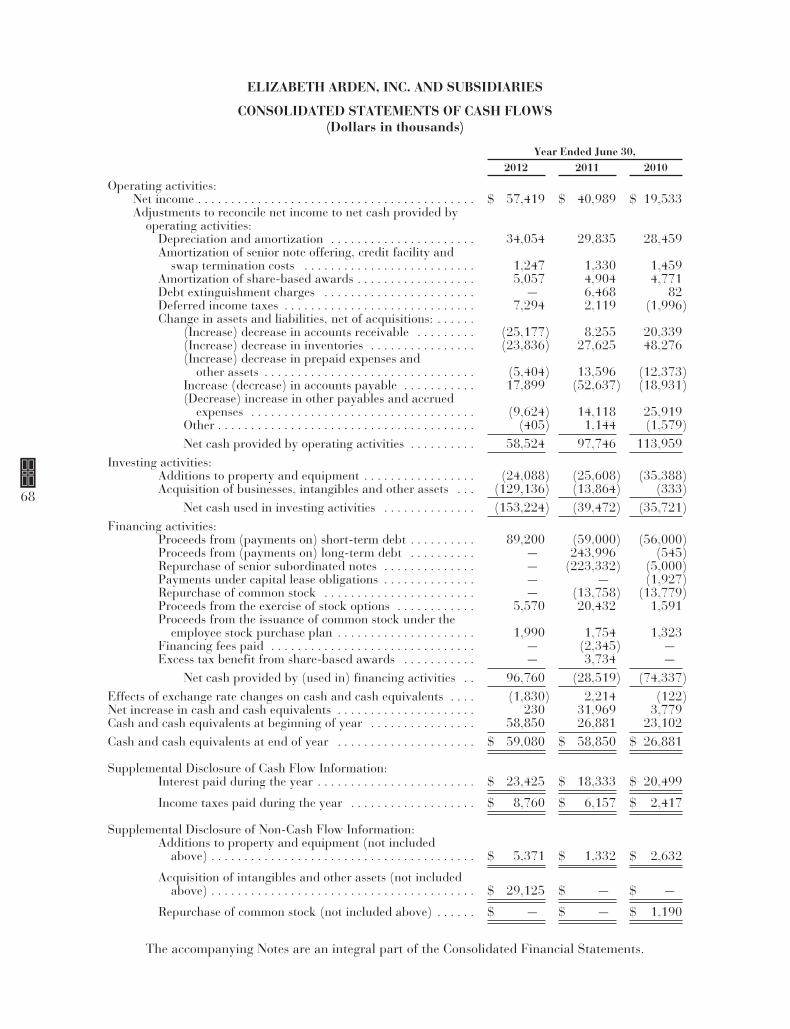
ELIZABETH ARDEN, INC. AND SUBSIDIARIES
CONSOLIDATED STATEMENTS OF CASH FLOWS(Dollars in thousands)
Year Ended June 30,2012 2011 2010
Operating activities:Net income . . . . . . . . . . . . . . . . . . . . . . . . . . . . . . . . . . . . . . . . . . $ 57,419 $ 40,989 $ 19,533Adjustments to reconcile net income to net cash provided by
operating activities:Depreciation and amortization . . . . . . . . . . . . . . . . . . . . . . 34,054 29,835 28,459Amortization of senior note offering, credit facility and
swap termination costs . . . . . . . . . . . . . . . . . . . . . . . . . . 1,247 1,330 1,459Amortization of share-based awards . . . . . . . . . . . . . . . . . . 5,057 4,904 4,771Debt extinguishment charges . . . . . . . . . . . . . . . . . . . . . . . — 6,468 82Deferred income taxes . . . . . . . . . . . . . . . . . . . . . . . . . . . . . 7,294 2,119 (1,996)Change in assets and liabilities, net of acquisitions: . . . . . .
(Increase) decrease in accounts receivable . . . . . . . . . (25,177) 8,255 20,339(Increase) decrease in inventories . . . . . . . . . . . . . . . . (23,836) 27,625 48,276(Increase) decrease in prepaid expenses and
other assets . . . . . . . . . . . . . . . . . . . . . . . . . . . . . . . . (5,404) 13,596 (12,373)Increase (decrease) in accounts payable . . . . . . . . . . . 17,899 (52,637) (18,931)(Decrease) increase in other payables and accrued
expenses . . . . . . . . . . . . . . . . . . . . . . . . . . . . . . . . . . (9,624) 14,118 25,919Other . . . . . . . . . . . . . . . . . . . . . . . . . . . . . . . . . . . . . . . (405) 1,144 (1,579)Net cash provided by operating activities . . . . . . . . . . 58,524 97,746 113,959
Investing activities:Additions to property and equipment . . . . . . . . . . . . . . . . . (24,088) (25,608) (35,388)Acquisition of businesses, intangibles and other assets . . . (129,136) (13,864) (333)
Net cash used in investing activities . . . . . . . . . . . . . . (153,224) (39,472) (35,721)Financing activities:
Proceeds from (payments on) short-term debt . . . . . . . . . . 89,200 (59,000) (56,000)Proceeds from (payments on) long-term debt . . . . . . . . . . — 243,996 (545)Repurchase of senior subordinated notes . . . . . . . . . . . . . . — (223,332) (5,000)Payments under capital lease obligations . . . . . . . . . . . . . . — — (1,927)Repurchase of common stock . . . . . . . . . . . . . . . . . . . . . . . — (13,758) (13,779)Proceeds from the exercise of stock options . . . . . . . . . . . . 5,570 20,432 1,591Proceeds from the issuance of common stock under the
employee stock purchase plan . . . . . . . . . . . . . . . . . . . . . 1,990 1,754 1,323Financing fees paid . . . . . . . . . . . . . . . . . . . . . . . . . . . . . . . — (2,345) —Excess tax benefit from share-based awards . . . . . . . . . . . — 3,734 —
Net cash provided by (used in) financing activities . . 96,760 (28,519) (74,337)Effects of exchange rate changes on cash and cash equivalents . . . . (1,830) 2,214 (122)Net increase in cash and cash equivalents . . . . . . . . . . . . . . . . . . . . . 230 31,969 3,779Cash and cash equivalents at beginning of year . . . . . . . . . . . . . . . . 58,850 26,881 23,102Cash and cash equivalents at end of year . . . . . . . . . . . . . . . . . . . . . $ 59,080 $ 58,850 $ 26,881
Supplemental Disclosure of Cash Flow Information:Interest paid during the year . . . . . . . . . . . . . . . . . . . . . . . . $ 23,425 $ 18,333 $ 20,499
Income taxes paid during the year . . . . . . . . . . . . . . . . . . . $ 8,760 $ 6,157 $ 2,417
Supplemental Disclosure of Non-Cash Flow Information:Additions to property and equipment (not included
above) . . . . . . . . . . . . . . . . . . . . . . . . . . . . . . . . . . . . . . . . $ 5,371 $ 1,332 $ 2,632
Acquisition of intangibles and other assets (not includedabove) . . . . . . . . . . . . . . . . . . . . . . . . . . . . . . . . . . . . . . . . $ 29,125 $ — $ —
Repurchase of common stock (not included above) . . . . . . $ — $ — $ 1,190
The accompanying Notes are an integral part of the Consolidated Financial Statements.
68
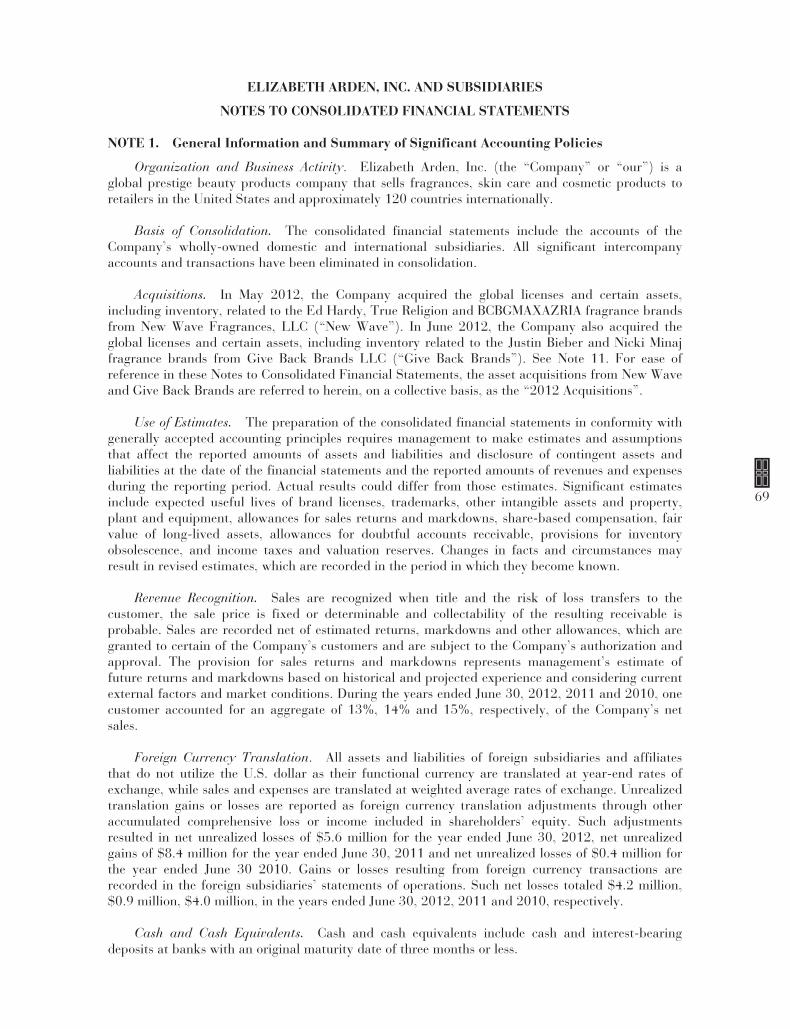
ELIZABETH ARDEN, INC. AND SUBSIDIARIES
NOTES TO CONSOLIDATED FINANCIAL STATEMENTS
NOTE 1. General Information and Summary of Significant Accounting Policies
Organization and Business Activity. Elizabeth Arden, Inc. (the “Company” or “our”) is aglobal prestige beauty products company that sells fragrances, skin care and cosmetic products toretailers in the United States and approximately 120 countries internationally.
Basis of Consolidation. The consolidated financial statements include the accounts of theCompany’s wholly-owned domestic and international subsidiaries. All significant intercompanyaccounts and transactions have been eliminated in consolidation.
Acquisitions. In May 2012, the Company acquired the global licenses and certain assets,including inventory, related to the Ed Hardy, True Religion and BCBGMAXAZRIA fragrance brandsfrom New Wave Fragrances, LLC (“New Wave”). In June 2012, the Company also acquired theglobal licenses and certain assets, including inventory related to the Justin Bieber and Nicki Minajfragrance brands from Give Back Brands LLC (“Give Back Brands”). See Note 11. For ease ofreference in these Notes to Consolidated Financial Statements, the asset acquisitions from New Waveand Give Back Brands are referred to herein, on a collective basis, as the “2012 Acquisitions”.
Use of Estimates. The preparation of the consolidated financial statements in conformity withgenerally accepted accounting principles requires management to make estimates and assumptionsthat affect the reported amounts of assets and liabilities and disclosure of contingent assets andliabilities at the date of the financial statements and the reported amounts of revenues and expensesduring the reporting period. Actual results could differ from those estimates. Significant estimatesinclude expected useful lives of brand licenses, trademarks, other intangible assets and property,plant and equipment, allowances for sales returns and markdowns, share-based compensation, fairvalue of long-lived assets, allowances for doubtful accounts receivable, provisions for inventoryobsolescence, and income taxes and valuation reserves. Changes in facts and circumstances mayresult in revised estimates, which are recorded in the period in which they become known.
Revenue Recognition. Sales are recognized when title and the risk of loss transfers to thecustomer, the sale price is fixed or determinable and collectability of the resulting receivable isprobable. Sales are recorded net of estimated returns, markdowns and other allowances, which aregranted to certain of the Company’s customers and are subject to the Company’s authorization andapproval. The provision for sales returns and markdowns represents management’s estimate offuture returns and markdowns based on historical and projected experience and considering currentexternal factors and market conditions. During the years ended June 30, 2012, 2011 and 2010, onecustomer accounted for an aggregate of 13%, 14% and 15%, respectively, of the Company’s netsales.
Foreign Currency Translation. All assets and liabilities of foreign subsidiaries and affiliatesthat do not utilize the U.S. dollar as their functional currency are translated at year-end rates ofexchange, while sales and expenses are translated at weighted average rates of exchange. Unrealizedtranslation gains or losses are reported as foreign currency translation adjustments through otheraccumulated comprehensive loss or income included in shareholders’ equity. Such adjustmentsresulted in net unrealized losses of $5.6 million for the year ended June 30, 2012, net unrealizedgains of $8.4 million for the year ended June 30, 2011 and net unrealized losses of $0.4 million forthe year ended June 30 2010. Gains or losses resulting from foreign currency transactions arerecorded in the foreign subsidiaries’ statements of operations. Such net losses totaled $4.2 million,$0.9 million, $4.0 million, in the years ended June 30, 2012, 2011 and 2010, respectively.
Cash and Cash Equivalents. Cash and cash equivalents include cash and interest-bearingdeposits at banks with an original maturity date of three months or less.
69
ELIZABETH ARDEN, INC. AND SUBSIDIARIES
NOTES TO CONSOLIDATED FINANCIAL STATEMENTS—(CONTINUED)
Allowances for Doubtful Accounts Receivable. The Company maintains allowances fordoubtful accounts to cover uncollectible accounts receivable and evaluates its accounts receivable todetermine if they will ultimately be collected. This evaluation includes significant judgments andestimates, including an analysis of receivables aging and a customer-by-customer review for largeaccounts. If, for example, the financial condition of the Company’s customers deteriorates resultingin an impairment of their ability to pay, additional allowances may be required, resulting in acharge to income in the period in which the determination was made.
Inventories. Inventories are stated at the lower of cost or market. Cost is determined using theweighted average method. See Note 5.
Property and Equipment, and Depreciation. Property and equipment are stated at cost.Expenditures for major improvements and additions are recorded to the asset accounts, whilereplacements, maintenance and repairs, which do not improve or extend the lives of the respectiveassets, are charged to expense. Depreciation is provided over the estimated useful lives of the assetsusing the straight-line method. When fixed assets are sold or otherwise disposed of, the accounts arerelieved of the original cost of the assets and the related accumulated depreciation and any resultingprofit or loss is credited or charged to income. See Note 6.
Exclusive Brand Licenses, Trademarks, and Intangibles. Exclusive of intangible assets thathave indefinite useful lives and are not being amortized, the Company’s intangible assets are beingamortized using the straight-line method over their estimated useful lives. See Note 7.
Indefinite-Lived and Long-Lived Assets. Goodwill and intangible assets with indefinite livesare not amortized, but rather assessed for impairment at least annually. An annual impairmentassessment is performed during the Company’s fourth fiscal quarter or more frequently if events orchanges in circumstances indicate the carrying value of goodwill and indefinite-lived intangibleassets may not fully be recoverable. The Company adopted the updated guidance to Topic 350,Intangibles- Goodwill and Other, issued by the Financial Accounting Standards Board (“FASB”), forits annual impairment assessment that was performed during the fourth quarter of fiscal year 2012.The updated guidance simplifies how an entity assesses goodwill for impairment. The amendmentsallow an entity to first assess qualitative factors to determine whether it is necessary to perform thetwo-step quantitative goodwill impairment assessment. An entity no longer will be required tocalculate the fair value of a reporting unit unless the entity determines, based on a qualitativeassessment, that it is more likely than not that its fair value is less than its carrying amount.Adoption of the updated guidance did not have a material impact on the Company’s consolidatedfinancial statements or disclosures. Should a goodwill impairment assessment be necessary, there isa two step process for impairment assessing of goodwill. The first step, used to identify potentialimpairment, compares the fair value of a reporting unit with its carrying amount, includinggoodwill. The second step, if necessary, measures the amount of the impairment by comparing theestimated fair value of the goodwill and intangible assets to their respective carrying values. If animpairment is identified, the carrying value of the asset is adjusted to estimated fair value. SeeNote 7.
Long-lived assets are reviewed for impairment upon the occurrence of specific triggering events.The impairment assessment is based on a comparison of the carrying value of such assets against theundiscounted future cash flows expected to be generated by such assets. If an impairment isidentified, the carrying value of the asset is adjusted to estimated fair value. No such adjustmentswere recorded for the years ended June 30, 2012, 2011 and 2010. See Note 7.
Leases. The Company leases distribution equipment, office and computer equipment, andvehicles. The Company reviews all of its leases to determine whether they qualify as operating orcapital leases. Leasehold improvements are capitalized and amortized over the lesser of the useful
70
ELIZABETH ARDEN, INC. AND SUBSIDIARIES
NOTES TO CONSOLIDATED FINANCIAL STATEMENTS—(CONTINUED)
life of the asset or current lease term. The Company accounts for free rent periods and scheduledrent increases on a straight-line basis over the lease term. Landlord allowances and incentives arerecorded as deferred rent and are amortized as a reduction to rent expense over the lease term.
Debt Issuance Costs. Debt issuance costs and transaction fees, which are associated with theissuance of senior notes, the revolving credit facility and term loan (see Note 8), are being amortizedand charged to interest expense over the term of the related notes or the term of the credit facility orterm loan. In any period in which the senior notes are redeemed, the unamortized debt issuancecosts and transaction fees relating to the notes being redeemed are expensed. In addition,termination costs related to interest rate swaps are amortized to interest expense over the remaininglife of the related notes. See Note 9.
Cost of Sales. Included in cost of sales are the cost of products sold, the cost of gift withpurchase items provided to customers, royalty costs related to patented technology or formulations,warehousing, distribution and supply chain costs. The major components of warehousing,distribution and supply chain costs include salary and related benefit costs for employees in thewarehousing, distribution and supply chain areas and facility related costs in these areas.
Selling, General and Administrative Costs. Included in selling, general and administrativeexpenses are advertising, creative development and promotion costs not paid directly to theCompany’s customers, royalty costs related to trademarks, salary and related benefit costs of theCompany’s employees in the finance, human resources, information technology, legal, sales andmarketing areas, facility related costs of the Company’s administrative functions, and costs paid toconsultants and third party providers for related services.
Advertising and Promotional Costs. Advertising and promotional costs paid directly tocustomers for goods and services provided (primarily co-op advertising and certain direct sellingcosts) are expensed as incurred and are recorded as a reduction of sales. Advertising andpromotional costs not paid directly to the Company’s customers are expensed as incurred andrecorded as a component of cost of goods sold (in the case of free goods given to customers) orselling, general and administrative expenses. Advertising and promotional costs include promotions,direct selling, co-op advertising and media placement. Advertising and promotional costs for theyears ended June 30, 2012, 2011 and 2010 were as follows:
Year Ended June 30,(Amounts in millions) 2012 2011 2010
Advertising and promotional costs . . . . . . . . . . . . . . . . . . . . . . . . . . . . . . $353.1 $332.8 $324.1
Income Taxes. The provision for income taxes is the tax payable or refundable for the periodplus or minus the change during the period in deferred tax assets and liabilities and certain otheradjustments. The Company provides for deferred taxes under the liability method. Under suchmethod, deferred taxes are adjusted for tax rate changes as they occur. Deferred income tax assetsand liabilities are computed annually for differences between the financial statement and tax basesof assets and liabilities that will result in taxable or deductible amounts in the future based onenacted tax laws and rates applicable to the periods in which the differences are expected to affecttaxable income. A valuation allowance is provided for deferred tax assets if it is more likely than notthat these items will either expire before the Company is able to realize their benefit, or, that futuredeductibility is uncertain.
The Company recognizes in its consolidated financial statements the impact of a tax position ifit is more likely than not that such position will be sustained on audit based on its technical merits.While the Company believes that its assessments of whether its tax positions are more likely than not
71
ELIZABETH ARDEN, INC. AND SUBSIDIARIES
NOTES TO CONSOLIDATED FINANCIAL STATEMENTS—(CONTINUED)
to be sustained are reasonable, each assessment is subjective and requires the use of significantjudgments. As a result, one or more of such assessments may prove ultimately to be incorrect, whichcould result in a change to net income.
Hedge Contracts. The Company has designated each foreign currency contract entered into asof June 30, 2012, as a cash flow hedge. Unrealized gains or losses, net of taxes, associated with thesecontracts are included in accumulated other comprehensive income on the consolidated balancesheet. Gains and losses will only be recognized in earnings in the period in which the forecastedtransaction affects earnings or the transactions are no longer probable of occurring.
Other Payables and Accrued Expenses. A summary of the Company’s other payables andaccrued expenses as of June 30, 2012 and 2011, is as follows:
(Amounts in thousands)June 30,
2012June 30,
2011
Accrued employee-related benefits . . . . . . . . . . . . . . . . . . . . . . . . . . . . . . . . . . $ 28,288 $ 34,379Accrued advertising, promotion and royalties . . . . . . . . . . . . . . . . . . . . . . . . . 27,774 33,718Accrued interest . . . . . . . . . . . . . . . . . . . . . . . . . . . . . . . . . . . . . . . . . . . . . . . . 5,819 8,528Other accruals . . . . . . . . . . . . . . . . . . . . . . . . . . . . . . . . . . . . . . . . . . . . . . . . . . 49,637 40,921
Total other payables and accrued expenses . . . . . . . . . . . . . . . . . . . . . . . . . . . $111,518 $117,546
Accumulated Other Comprehensive Income (Loss)/Comprehensive Income. Accumulated othercomprehensive income (loss) includes, in addition to net income or net loss, unrealized gains andlosses excluded from the consolidated statements of operations and recorded directly into a separatesection of shareholders’ equity on the consolidated balance sheet. These unrealized gains and lossesare referred to as other comprehensive income (loss) items. The Company’s accumulated othercomprehensive income (loss) shown on the consolidated balance sheets at June 30, 2012 andJune 30, 2011, consists of foreign currency translation adjustments, which are not adjusted forincome taxes since they relate to indefinite investments in non-U.S. subsidiaries, and the unrealizedgains (losses), net of taxes, related to the Company’s foreign currency contracts, respectively.
The components of accumulated other comprehensive income (loss) as of June 30, 2012, 2011and 2010, were as follows:
Year Ended June 30,(Amounts in thousands) 2012 2011 2010
Cumulative foreign currency translation adjustments . . . . . . . . . . . . . . $ 997 $ 6,548 $(1,839)Unrealized hedging gain (loss), net of taxes . . . . . . . . . . . . . . . . . . . . . . 169 (1,407) 357
Accumulated other comprehensive income (loss) . . . . . . . . . . . . . . . . . . $1,166 $ 5,141 $(1,482)
The Company’s comprehensive income consists of net income, foreign currency translationadjustments, which are not adjusted for income taxes since they relate to indefinite investments innon-U.S. subsidiaries, and the unrealized gains (losses), net of taxes, related to the Company’sforeign currency contracts.
72
ELIZABETH ARDEN, INC. AND SUBSIDIARIES
NOTES TO CONSOLIDATED FINANCIAL STATEMENTS—(CONTINUED)
The components of comprehensive income for the years ended June 30, 2012, 2011 and 2010,were as follows:
Year Ended June 30,(Amounts in thousands) 2012 2011 2010
Net income . . . . . . . . . . . . . . . . . . . . . . . . . . . . . . . . . . . . . . . . . . . . . . $57,419 $40,989 $19,533Foreign currency translation adjustments . . . . . . . . . . . . . . . . . . . . . . (5,551) 8,388 (397)Unrealized hedging gain (loss), net of taxes . . . . . . . . . . . . . . . . . . . . 1,576 (1,765) 379
Total comprehensive income . . . . . . . . . . . . . . . . . . . . . . . . . . . . . . . . $53,444 $47,612 $19,515
Fair Value of Financial Instruments. The Company’s financial instruments include accountsreceivable, accounts payable, currency forward contracts, short-term debt and long-term debt. OnJanuary 1, 2012, the Company adopted the new FASB and the International Accounting StandardsBoard (“IASB”) guidance on fair value measurement and disclosure requirements. This updatesupersedes most of the guidance in Topic 820, Fair Value Measurements and Disclosures and manyof the changes are clarifications of existing guidance or wording changes to align with InternationalFinancial Reporting Standards. The changes to Topic 820 did not have a material impact on theCompany’s consolidated financial statements or disclosures. The fair value of the Company’s seniornotes and all other financial instruments was not materially different than their carrying value as ofJune 30, 2012, and June 30, 2011. See Note 15.
Share-Based Compensation. All share-based payments to employees, including the grants ofemployee stock options, are recognized in the consolidated financial statements based on their fairvalues, but only to the extent that vesting is considered probable. Compensation cost for awards thatvest will not be reversed if the awards expire without being exercised. The fair value of stock optionsis determined using the Black-Scholes option-pricing model and the fair value of restricted stock andrestricted stock unit awards is based on the closing price of the Company’s common stock, $.01 parvalue (“Common Stock”) on the date of grant. Compensation costs for awards are amortized usingthe straight-line method. Option pricing model input assumptions such as expected term, expectedvolatility and risk-free interest rate impact the fair value estimate. Further, the forfeiture rateimpacts the amount of aggregate compensation. These assumptions are subjective and generallyrequire significant analysis and judgment to develop. When estimating fair value, some of theassumptions are based on or determined from external data and other assumptions may be derivedfrom the Company’s historical experience with share-based arrangements. The appropriate weight toplace on historical experience is a matter of judgment, based on relevant facts and circumstances.
The Company relies on its historical experience and post-vested termination activity to providedata for estimating expected term for use in determining the fair value of its stock options. TheCompany currently estimates its stock volatility by considering historical stock volatility experienceand other key factors. The risk-free interest rate is the implied yield currently available on U.S.Treasury zero-coupon issues with a remaining term equal to the expected term used as the input tothe Black-Scholes model. The Company estimates forfeitures using its historical experience, whichwill be adjusted over the requisite service period based on the extent to which actual forfeituresdiffer, or are expected to differ, from such estimates. Because of the significant amount of judgmentused in these calculations, it is reasonably likely that circumstances may cause the estimate tochange. If, for example, actual forfeitures are lower than the Company’s estimate, additional chargesto net income may be required.
Out-Of-Period Adjustments. During the year ended June 30, 2010, the Company recordedout-of-period adjustments which related to fiscal years 2001 to 2009. Net sales and gross profit for
73
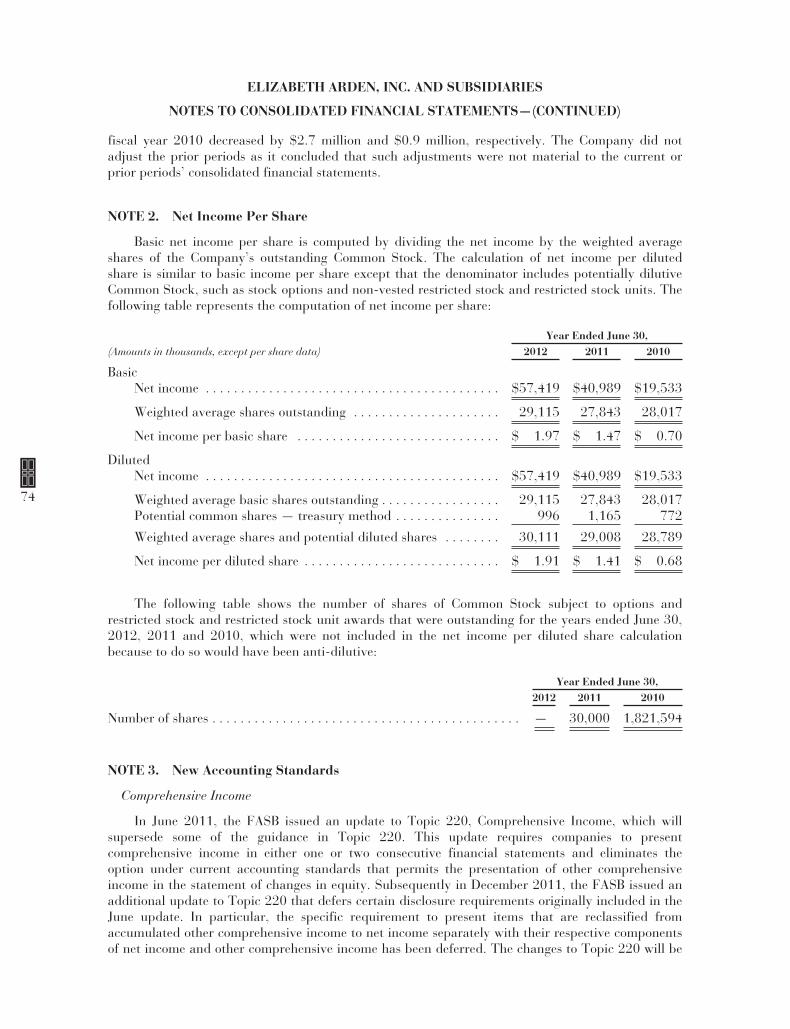
ELIZABETH ARDEN, INC. AND SUBSIDIARIES
NOTES TO CONSOLIDATED FINANCIAL STATEMENTS—(CONTINUED)
fiscal year 2010 decreased by $2.7 million and $0.9 million, respectively. The Company did notadjust the prior periods as it concluded that such adjustments were not material to the current orprior periods’ consolidated financial statements.
NOTE 2. Net Income Per Share
Basic net income per share is computed by dividing the net income by the weighted averageshares of the Company’s outstanding Common Stock. The calculation of net income per dilutedshare is similar to basic income per share except that the denominator includes potentially dilutiveCommon Stock, such as stock options and non-vested restricted stock and restricted stock units. Thefollowing table represents the computation of net income per share:
Year Ended June 30,(Amounts in thousands, except per share data) 2012 2011 2010
BasicNet income . . . . . . . . . . . . . . . . . . . . . . . . . . . . . . . . . . . . . . . . . . $57,419 $40,989 $19,533
Weighted average shares outstanding . . . . . . . . . . . . . . . . . . . . . 29,115 27,843 28,017
Net income per basic share . . . . . . . . . . . . . . . . . . . . . . . . . . . . . $ 1.97 $ 1.47 $ 0.70
DilutedNet income . . . . . . . . . . . . . . . . . . . . . . . . . . . . . . . . . . . . . . . . . . $57,419 $40,989 $19,533
Weighted average basic shares outstanding . . . . . . . . . . . . . . . . . 29,115 27,843 28,017Potential common shares — treasury method . . . . . . . . . . . . . . . 996 1,165 772
Weighted average shares and potential diluted shares . . . . . . . . 30,111 29,008 28,789
Net income per diluted share . . . . . . . . . . . . . . . . . . . . . . . . . . . . $ 1.91 $ 1.41 $ 0.68
The following table shows the number of shares of Common Stock subject to options andrestricted stock and restricted stock unit awards that were outstanding for the years ended June 30,2012, 2011 and 2010, which were not included in the net income per diluted share calculationbecause to do so would have been anti-dilutive:
Year Ended June 30,2012 2011 2010
Number of shares . . . . . . . . . . . . . . . . . . . . . . . . . . . . . . . . . . . . . . . . . . . . — 30,000 1,821,594
NOTE 3. New Accounting Standards
Comprehensive Income
In June 2011, the FASB issued an update to Topic 220, Comprehensive Income, which willsupersede some of the guidance in Topic 220. This update requires companies to presentcomprehensive income in either one or two consecutive financial statements and eliminates theoption under current accounting standards that permits the presentation of other comprehensiveincome in the statement of changes in equity. Subsequently in December 2011, the FASB issued anadditional update to Topic 220 that defers certain disclosure requirements originally included in theJune update. In particular, the specific requirement to present items that are reclassified fromaccumulated other comprehensive income to net income separately with their respective componentsof net income and other comprehensive income has been deferred. The changes to Topic 220 will be
74
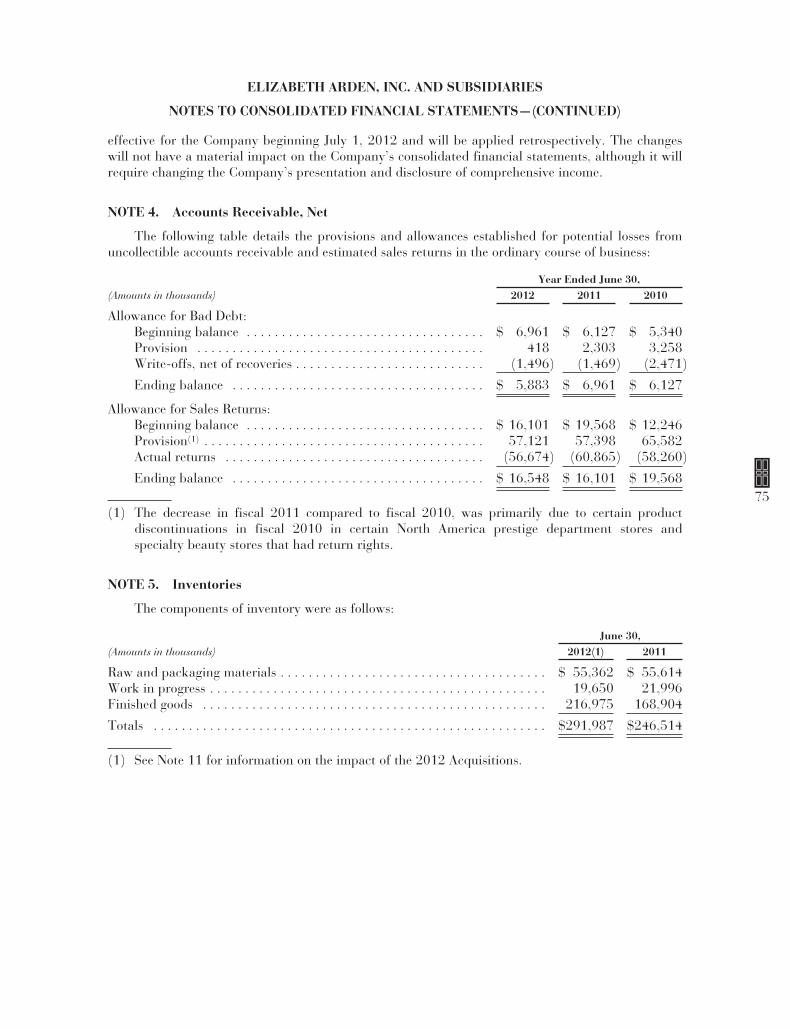
ELIZABETH ARDEN, INC. AND SUBSIDIARIES
NOTES TO CONSOLIDATED FINANCIAL STATEMENTS—(CONTINUED)
effective for the Company beginning July 1, 2012 and will be applied retrospectively. The changeswill not have a material impact on the Company’s consolidated financial statements, although it willrequire changing the Company’s presentation and disclosure of comprehensive income.
NOTE 4. Accounts Receivable, Net
The following table details the provisions and allowances established for potential losses fromuncollectible accounts receivable and estimated sales returns in the ordinary course of business:
Year Ended June 30,(Amounts in thousands) 2012 2011 2010
Allowance for Bad Debt:Beginning balance . . . . . . . . . . . . . . . . . . . . . . . . . . . . . . . . . . $ 6,961 $ 6,127 $ 5,340Provision . . . . . . . . . . . . . . . . . . . . . . . . . . . . . . . . . . . . . . . . . 418 2,303 3,258Write-offs, net of recoveries . . . . . . . . . . . . . . . . . . . . . . . . . . . (1,496) (1,469) (2,471)
Ending balance . . . . . . . . . . . . . . . . . . . . . . . . . . . . . . . . . . . . $ 5,883 $ 6,961 $ 6,127
Allowance for Sales Returns:Beginning balance . . . . . . . . . . . . . . . . . . . . . . . . . . . . . . . . . . $ 16,101 $ 19,568 $ 12,246Provision(1) . . . . . . . . . . . . . . . . . . . . . . . . . . . . . . . . . . . . . . . . 57,121 57,398 65,582Actual returns . . . . . . . . . . . . . . . . . . . . . . . . . . . . . . . . . . . . . (56,674) (60,865) (58,260)
Ending balance . . . . . . . . . . . . . . . . . . . . . . . . . . . . . . . . . . . . $ 16,548 $ 16,101 $ 19,568
(1) The decrease in fiscal 2011 compared to fiscal 2010, was primarily due to certain productdiscontinuations in fiscal 2010 in certain North America prestige department stores andspecialty beauty stores that had return rights.
NOTE 5. Inventories
The components of inventory were as follows:
June 30,(Amounts in thousands) 2012(1) 2011
Raw and packaging materials . . . . . . . . . . . . . . . . . . . . . . . . . . . . . . . . . . . . . . $ 55,362 $ 55,614Work in progress . . . . . . . . . . . . . . . . . . . . . . . . . . . . . . . . . . . . . . . . . . . . . . . . 19,650 21,996Finished goods . . . . . . . . . . . . . . . . . . . . . . . . . . . . . . . . . . . . . . . . . . . . . . . . . 216,975 168,904
Totals . . . . . . . . . . . . . . . . . . . . . . . . . . . . . . . . . . . . . . . . . . . . . . . . . . . . . . . . $291,987 $246,514
(1) See Note 11 for information on the impact of the 2012 Acquisitions.
75
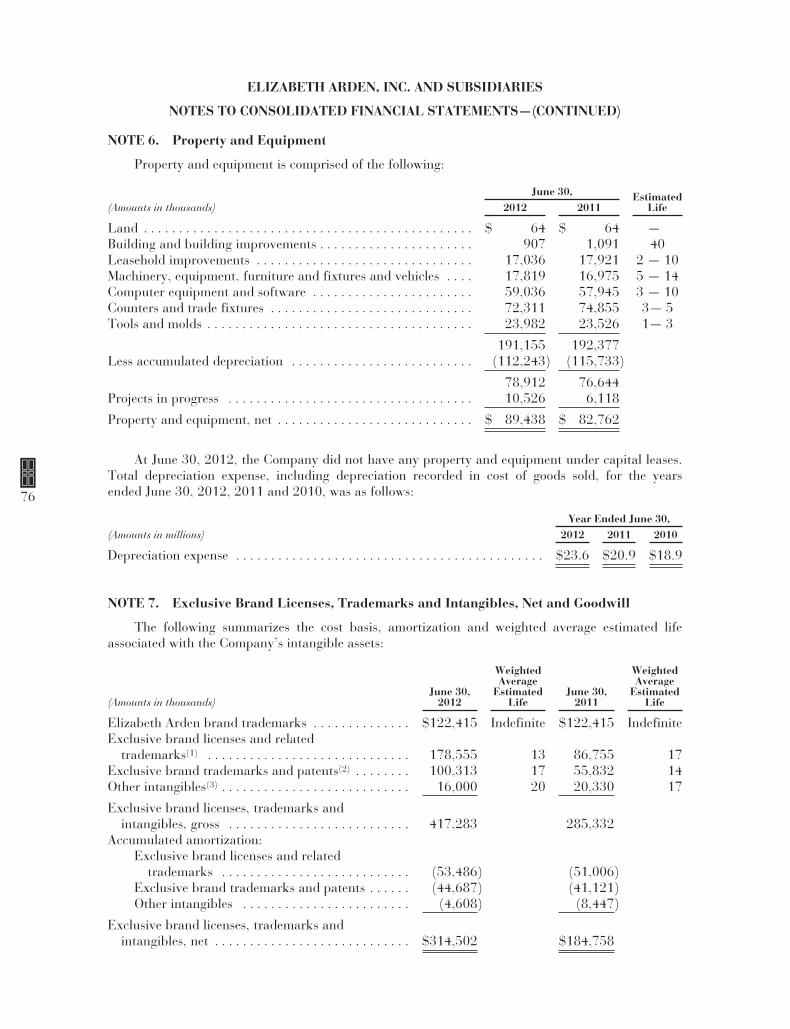
ELIZABETH ARDEN, INC. AND SUBSIDIARIES
NOTES TO CONSOLIDATED FINANCIAL STATEMENTS—(CONTINUED)
NOTE 6. Property and Equipment
Property and equipment is comprised of the following:
June 30, EstimatedLife(Amounts in thousands) 2012 2011
Land . . . . . . . . . . . . . . . . . . . . . . . . . . . . . . . . . . . . . . . . . . . . . . . $ 64 $ 64 —Building and building improvements . . . . . . . . . . . . . . . . . . . . . . 907 1,091 40Leasehold improvements . . . . . . . . . . . . . . . . . . . . . . . . . . . . . . . 17,036 17,921 2 — 10Machinery, equipment, furniture and fixtures and vehicles . . . . 17,819 16,975 5 — 14Computer equipment and software . . . . . . . . . . . . . . . . . . . . . . . 59,036 57,945 3 — 10Counters and trade fixtures . . . . . . . . . . . . . . . . . . . . . . . . . . . . . 72,311 74,855 3— 5Tools and molds . . . . . . . . . . . . . . . . . . . . . . . . . . . . . . . . . . . . . . 23,982 23,526 1— 3
191,155 192,377Less accumulated depreciation . . . . . . . . . . . . . . . . . . . . . . . . . . (112,243) (115,733)
78,912 76,644Projects in progress . . . . . . . . . . . . . . . . . . . . . . . . . . . . . . . . . . . 10,526 6,118
Property and equipment, net . . . . . . . . . . . . . . . . . . . . . . . . . . . . $ 89,438 $ 82,762
At June 30, 2012, the Company did not have any property and equipment under capital leases.Total depreciation expense, including depreciation recorded in cost of goods sold, for the yearsended June 30, 2012, 2011 and 2010, was as follows:
Year Ended June 30,(Amounts in millions) 2012 2011 2010
Depreciation expense . . . . . . . . . . . . . . . . . . . . . . . . . . . . . . . . . . . . . . . . . . . . $23.6 $20.9 $18.9
NOTE 7. Exclusive Brand Licenses, Trademarks and Intangibles, Net and Goodwill
The following summarizes the cost basis, amortization and weighted average estimated lifeassociated with the Company’s intangible assets:
(Amounts in thousands)June 30,
2012
WeightedAverage
EstimatedLife
June 30,2011
WeightedAverage
EstimatedLife
Elizabeth Arden brand trademarks . . . . . . . . . . . . . . $122,415 Indefinite $122,415 IndefiniteExclusive brand licenses and related
trademarks(1) . . . . . . . . . . . . . . . . . . . . . . . . . . . . . 178,555 13 86,755 17Exclusive brand trademarks and patents(2) . . . . . . . . 100,313 17 55,832 14Other intangibles(3) . . . . . . . . . . . . . . . . . . . . . . . . . . . 16,000 20 20,330 17
Exclusive brand licenses, trademarks andintangibles, gross . . . . . . . . . . . . . . . . . . . . . . . . . . 417,283 285,332
Accumulated amortization:Exclusive brand licenses and related
trademarks . . . . . . . . . . . . . . . . . . . . . . . . . . . (53,486) (51,006)Exclusive brand trademarks and patents . . . . . . (44,687) (41,121)Other intangibles . . . . . . . . . . . . . . . . . . . . . . . . (4,608) (8,447)
Exclusive brand licenses, trademarks andintangibles, net . . . . . . . . . . . . . . . . . . . . . . . . . . . . $314,502 $184,758
76
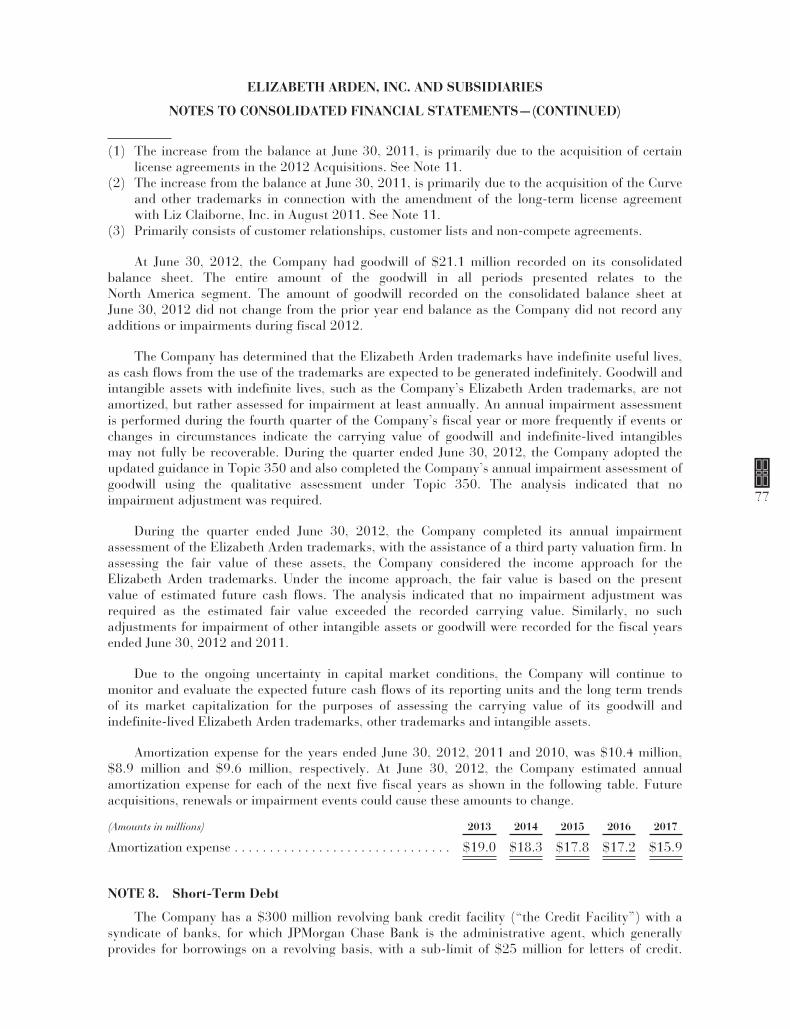
ELIZABETH ARDEN, INC. AND SUBSIDIARIES
NOTES TO CONSOLIDATED FINANCIAL STATEMENTS—(CONTINUED)
(1) The increase from the balance at June 30, 2011, is primarily due to the acquisition of certainlicense agreements in the 2012 Acquisitions. See Note 11.
(2) The increase from the balance at June 30, 2011, is primarily due to the acquisition of the Curveand other trademarks in connection with the amendment of the long-term license agreementwith Liz Claiborne, Inc. in August 2011. See Note 11.
(3) Primarily consists of customer relationships, customer lists and non-compete agreements.
At June 30, 2012, the Company had goodwill of $21.1 million recorded on its consolidatedbalance sheet. The entire amount of the goodwill in all periods presented relates to theNorth America segment. The amount of goodwill recorded on the consolidated balance sheet atJune 30, 2012 did not change from the prior year end balance as the Company did not record anyadditions or impairments during fiscal 2012.
The Company has determined that the Elizabeth Arden trademarks have indefinite useful lives,as cash flows from the use of the trademarks are expected to be generated indefinitely. Goodwill andintangible assets with indefinite lives, such as the Company’s Elizabeth Arden trademarks, are notamortized, but rather assessed for impairment at least annually. An annual impairment assessmentis performed during the fourth quarter of the Company’s fiscal year or more frequently if events orchanges in circumstances indicate the carrying value of goodwill and indefinite-lived intangiblesmay not fully be recoverable. During the quarter ended June 30, 2012, the Company adopted theupdated guidance in Topic 350 and also completed the Company’s annual impairment assessment ofgoodwill using the qualitative assessment under Topic 350. The analysis indicated that noimpairment adjustment was required.
During the quarter ended June 30, 2012, the Company completed its annual impairmentassessment of the Elizabeth Arden trademarks, with the assistance of a third party valuation firm. Inassessing the fair value of these assets, the Company considered the income approach for theElizabeth Arden trademarks. Under the income approach, the fair value is based on the presentvalue of estimated future cash flows. The analysis indicated that no impairment adjustment wasrequired as the estimated fair value exceeded the recorded carrying value. Similarly, no suchadjustments for impairment of other intangible assets or goodwill were recorded for the fiscal yearsended June 30, 2012 and 2011.
Due to the ongoing uncertainty in capital market conditions, the Company will continue tomonitor and evaluate the expected future cash flows of its reporting units and the long term trendsof its market capitalization for the purposes of assessing the carrying value of its goodwill andindefinite-lived Elizabeth Arden trademarks, other trademarks and intangible assets.
Amortization expense for the years ended June 30, 2012, 2011 and 2010, was $10.4 million,$8.9 million and $9.6 million, respectively. At June 30, 2012, the Company estimated annualamortization expense for each of the next five fiscal years as shown in the following table. Futureacquisitions, renewals or impairment events could cause these amounts to change.
(Amounts in millions) 2013 2014 2015 2016 2017
Amortization expense . . . . . . . . . . . . . . . . . . . . . . . . . . . . . . . $19.0 $18.3 $17.8 $17.2 $15.9
NOTE 8. Short-Term Debt
The Company has a $300 million revolving bank credit facility (“the Credit Facility”) with asyndicate of banks, for which JPMorgan Chase Bank is the administrative agent, which generallyprovides for borrowings on a revolving basis, with a sub-limit of $25 million for letters of credit.
77
ELIZABETH ARDEN, INC. AND SUBSIDIARIES
NOTES TO CONSOLIDATED FINANCIAL STATEMENTS—(CONTINUED)
Under the terms of the Credit Facility, the Company may, at any time, increase the size of the CreditFacility up to $375 million without entering into a formal amendment requiring the consent of all ofthe banks, subject to the Company’s satisfaction of certain conditions. In connection with theamendment of the Credit Facility in January 2011, the Company recorded a $0.1 million debtextinguishment charge in fiscal 2011 and incurred and capitalized approximately $2.3 million ofbank related costs in debt financing costs, net, on the consolidated balance sheet, which are beingamortized over the life of the Credit Facility. The Credit Facility was further amended in June 2012to allow for the contingent consideration that may become payable with respect to the acquisition ofcertain assets of Give Back Brands and to allow for the second lien term loan further describedbelow. See Note 11. The Credit Facility expires in January 2016.
The Credit Facility is guaranteed by all of the Company’s U.S. subsidiaries and is collateralizedby a first priority lien on all of the Company’s U.S. accounts receivable and inventory. Borrowingsunder the Credit Facility are limited to 85% of eligible accounts receivable and 85% of theappraised net liquidation value of the Company’s inventory, as determined pursuant to the terms ofthe Credit Facility; provided, however, that from August 15 to October 31 of each year theCompany’s borrowing base may be temporarily increased by up to $25 million.
The Credit Facility has only one financial maintenance covenant, which is a debt servicecoverage ratio that must be maintained at not less than 1.1 to 1 if average borrowing base capacitydeclines to less than $25 million ($35 million from September 1 through January 31). TheCompany’s average borrowing base capacity for each of the quarters during fiscal 2012 did not fallbelow the applicable thresholds noted above. Accordingly, the debt service coverage ratio did notapply during the year ended June 30, 2012.
Under the terms of the Credit Facility, the Company may pay dividends or repurchase CommonStock if it maintains borrowing base capacity of at least $25 million from February 1 to August 31,and at least $35 million from September 1 to January 31, after making the applicable payment. TheCredit Facility restricts the Company from incurring additional non-trade indebtedness (other thanrefinancings and certain small amounts of indebtedness).
Borrowings under the credit portion of the Credit Facility bear interest at a floating rate basedon an “Applicable Margin” which is determined by reference to a debt service coverage ratio. At theCompany’s option, the Applicable Margin may be applied to either the London InterBank OfferedRate (“LIBOR”) or the base rate. The Applicable Margin charged on LIBOR loans ranges from1.75% to 2.50% and ranges from 0.25% to 1.0% for base rate loans, except that the ApplicableMargin on the first $25 million of borrowings from August 15 to October 31 of each year, while thetemporary increase in the Company’s borrowing base is in effect, is 1.0% higher. The Company isrequired to pay an unused commitment fee ranging from 0.375% to 0.50% based on the quarterlyaverage unused portion of the Credit Facility.
At June 30, 2012, the Applicable Margin was 1.75% for LIBOR loans and 0.25% for prime rateloans. For both the fiscal years ended June 30, 2012 and 2011, the weighted average annual interestrate on borrowings under the Credit Facility was 2.2%.
At June 30, 2012, the Company had $89.2 million in borrowings and $4.4 million in letters ofcredit outstanding under the Credit Facility, compared with no outstanding borrowings under theCredit Facility at June 30, 2011. At June 30, 2012, based on eligible accounts receivable andinventory available as collateral, an additional $51.5 million could be borrowed under the CreditFacility.
In connection with the 2012 Acquisitions, and to take advantage of favorable interest rates andprovide the Company with additional financial flexibility, on June 12, 2012, the Company entered
78
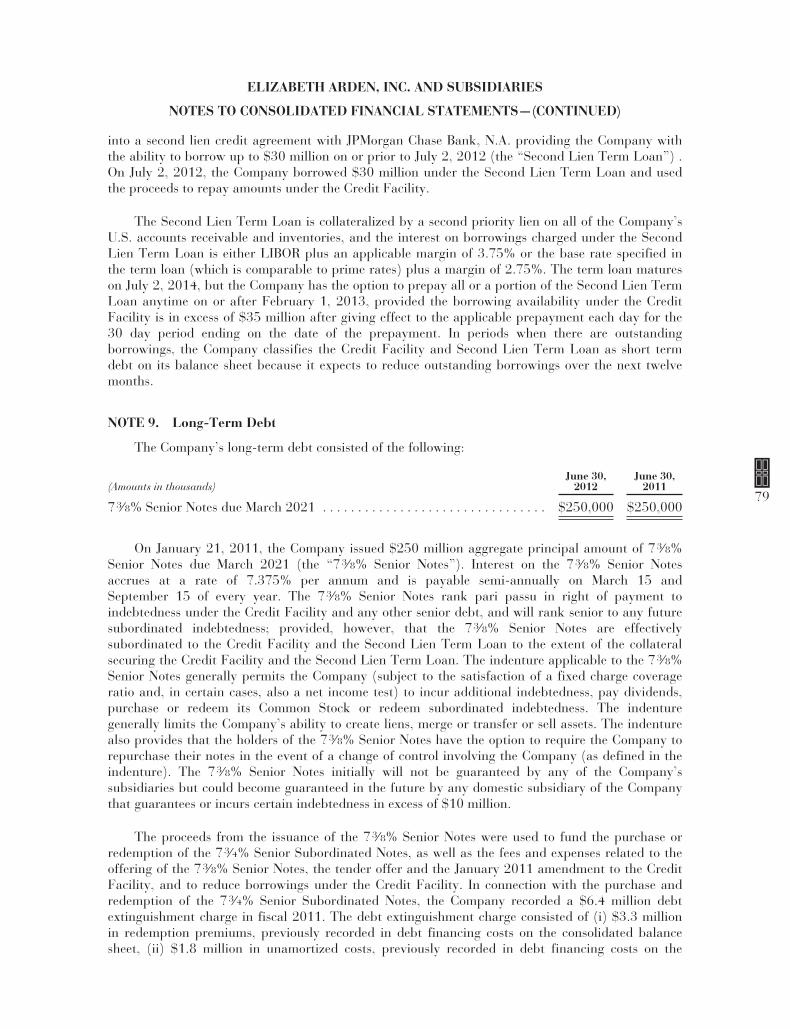
ELIZABETH ARDEN, INC. AND SUBSIDIARIES
NOTES TO CONSOLIDATED FINANCIAL STATEMENTS—(CONTINUED)
into a second lien credit agreement with JPMorgan Chase Bank, N.A. providing the Company withthe ability to borrow up to $30 million on or prior to July 2, 2012 (the “Second Lien Term Loan”) .On July 2, 2012, the Company borrowed $30 million under the Second Lien Term Loan and usedthe proceeds to repay amounts under the Credit Facility.
The Second Lien Term Loan is collateralized by a second priority lien on all of the Company’sU.S. accounts receivable and inventories, and the interest on borrowings charged under the SecondLien Term Loan is either LIBOR plus an applicable margin of 3.75% or the base rate specified inthe term loan (which is comparable to prime rates) plus a margin of 2.75%. The term loan matureson July 2, 2014, but the Company has the option to prepay all or a portion of the Second Lien TermLoan anytime on or after February 1, 2013, provided the borrowing availability under the CreditFacility is in excess of $35 million after giving effect to the applicable prepayment each day for the30 day period ending on the date of the prepayment. In periods when there are outstandingborrowings, the Company classifies the Credit Facility and Second Lien Term Loan as short termdebt on its balance sheet because it expects to reduce outstanding borrowings over the next twelvemonths.
NOTE 9. Long-Term Debt
The Company’s long-term debt consisted of the following:
(Amounts in thousands)June 30,
2012June 30,
2011
73⁄8% Senior Notes due March 2021 . . . . . . . . . . . . . . . . . . . . . . . . . . . . . . . . $250,000 $250,000
On January 21, 2011, the Company issued $250 million aggregate principal amount of 73⁄8%Senior Notes due March 2021 (the “73⁄8% Senior Notes”). Interest on the 73⁄8% Senior Notesaccrues at a rate of 7.375% per annum and is payable semi-annually on March 15 andSeptember 15 of every year. The 73⁄8% Senior Notes rank pari passu in right of payment toindebtedness under the Credit Facility and any other senior debt, and will rank senior to any futuresubordinated indebtedness; provided, however, that the 73⁄8% Senior Notes are effectivelysubordinated to the Credit Facility and the Second Lien Term Loan to the extent of the collateralsecuring the Credit Facility and the Second Lien Term Loan. The indenture applicable to the 73⁄8%Senior Notes generally permits the Company (subject to the satisfaction of a fixed charge coverageratio and, in certain cases, also a net income test) to incur additional indebtedness, pay dividends,purchase or redeem its Common Stock or redeem subordinated indebtedness. The indenturegenerally limits the Company’s ability to create liens, merge or transfer or sell assets. The indenturealso provides that the holders of the 73⁄8% Senior Notes have the option to require the Company torepurchase their notes in the event of a change of control involving the Company (as defined in theindenture). The 73⁄8% Senior Notes initially will not be guaranteed by any of the Company’ssubsidiaries but could become guaranteed in the future by any domestic subsidiary of the Companythat guarantees or incurs certain indebtedness in excess of $10 million.
The proceeds from the issuance of the 73⁄8% Senior Notes were used to fund the purchase orredemption of the 73⁄4% Senior Subordinated Notes, as well as the fees and expenses related to theoffering of the 73⁄8% Senior Notes, the tender offer and the January 2011 amendment to the CreditFacility, and to reduce borrowings under the Credit Facility. In connection with the purchase andredemption of the 73⁄4% Senior Subordinated Notes, the Company recorded a $6.4 million debtextinguishment charge in fiscal 2011. The debt extinguishment charge consisted of (i) $3.3 millionin redemption premiums, previously recorded in debt financing costs on the consolidated balancesheet, (ii) $1.8 million in unamortized costs, previously recorded in debt financing costs on the
79
ELIZABETH ARDEN, INC. AND SUBSIDIARIES
NOTES TO CONSOLIDATED FINANCIAL STATEMENTS—(CONTINUED)
consolidated balance sheet, (iii) $1.1 million in unamortized swap termination costs, previouslyrecorded in long-term debt on the consolidated balance sheet, and (iv) $0.2 million of other costs. Inaddition, as part of the offering of the 73⁄8% Senior Notes, the Company incurred and capitalizedapproximately $6.0 million of related costs in debt financing costs, net, on the consolidated balancesheet, which will be amortized over the life of the 73⁄8% Senior Notes.
The scheduled maturities and redemptions of long-term debt at June 30, 2012 were as follows:
(Amounts in thousands)Year Ended June 30, Amount
2013 through 2020 . . . . . . . . . . . . . . . . . . . . . . . . . . . . . . . . . . . . . . . . . . . . . . . . $ —2021 . . . . . . . . . . . . . . . . . . . . . . . . . . . . . . . . . . . . . . . . . . . . . . . . . . . . . . . . . . . . 250,000After 2021 . . . . . . . . . . . . . . . . . . . . . . . . . . . . . . . . . . . . . . . . . . . . . . . . . . . . . . . —
Total . . . . . . . . . . . . . . . . . . . . . . . . . . . . . . . . . . . . . . . . . . . . . . . . . . . . . . . . . . . $250,000
NOTE 10. Commitments and Contingencies
The Company has lease agreements for all of the real property it uses, and owns a smallmanufacturing facility in South Africa. The Company’s leased office facilities are located inMiramar, Florida, Stamford, Connecticut, Bentonville, Arkansas, Minneapolis, Minnesota and NewYork, New York in the United States, and in Australia, Canada, China, Denmark, France, Italy, NewZealand Puerto Rico, Singapore, South Africa, South Korea, Spain, Switzerland, Taiwan and theUnited Kingdom. As of June 30, 2012, the Company has operating leases, but does not have anycapital lease arrangements. The Company has a leased distribution facility in Roanoke, Virginia anda leased warehouse facility in Salem, Virginia. The Company’s rent expense for operating leases forthe years ended June 30, 2012, 2011 and 2010, was as follows:
Year Ended June 30,(Amounts in millions) 2012 2011 2010
Rent expense . . . . . . . . . . . . . . . . . . . . . . . . . . . . . . . . . . . . . . . . . . . . . . . . . . . $22.3 $20.6 $20.2
The Company’s aggregate minimum lease payments under its operating leases and other long-term liabilities (other than long-term debt) at June 30, 2012, were as follows:
(Amounts in thousands)Operating
Leases
OtherLong-term
Obligations(1) Total
2013 . . . . . . . . . . . . . . . . . . . . . . . . . . . . . . . . . . . . . . . . . . . . . . . $16,372 $ 4,960 $ 21,3322014 . . . . . . . . . . . . . . . . . . . . . . . . . . . . . . . . . . . . . . . . . . . . . . . 14,849 13,208 28,0572015 . . . . . . . . . . . . . . . . . . . . . . . . . . . . . . . . . . . . . . . . . . . . . . . 12,904 13,208 26,1122016 . . . . . . . . . . . . . . . . . . . . . . . . . . . . . . . . . . . . . . . . . . . . . . . 11,357 — 11,3572017 . . . . . . . . . . . . . . . . . . . . . . . . . . . . . . . . . . . . . . . . . . . . . . . 8,612 — 8,612and thereafter . . . . . . . . . . . . . . . . . . . . . . . . . . . . . . . . . . . . . . . 22,582 — 22,582
Total . . . . . . . . . . . . . . . . . . . . . . . . . . . . . . . . . . . . . . . . . . . . . . . $86,676 $31,376 $118,052
(1) Includes: (i) the contingent consideration which may become payable to Give Back Brands ifcertain sales targets are met (see Note 11), but (ii) excludes $4.9 million of gross unrecognizedtax benefits that, if not realized, would result in cash payments. The Company cannot currentlyestimate when, or if, any of the gross unrecognized tax benefits, will be due.
80
ELIZABETH ARDEN, INC. AND SUBSIDIARIES
NOTES TO CONSOLIDATED FINANCIAL STATEMENTS—(CONTINUED)
The Company is a party to a number of legal actions, proceedings, audits, tax audits, claimsand disputes, arising in the ordinary course of business, including those with current and formercustomers over amounts owed. While any action, proceeding, audit or claim contains an element ofuncertainty and may materially affect the Company’s cash flows and results of operations in aparticular quarter or year, based on current facts and circumstances, the Company’s managementbelieves that the outcome of such actions, proceedings, audits, claims and disputes will not have amaterial adverse effect on the Company’s business, prospects, results of operations, financialcondition or cash flows.
NOTE 11. Acquisitions
On August 10, 2011, the Company amended its long-term license agreement with LizClaiborne, Inc. and certain of its affiliates and acquired all of the U.S. and international trademarksfor the Curve fragrance brands as well as trademarks for certain other smaller fragrance brands. Theamendment also established a lower effective royalty rate for the remaining licensed fragrancebrands, including Juicy Couture and Lucky Brand fragrances, reduced the future minimumguaranteed royalties for the term of the license, and required a pre-payment of royalties for theremainder of calendar 2011. The Company paid Liz Claiborne, Inc. and its affiliates $58.4 millionin cash in connection with this transaction. The Company capitalized $43.9 million of the $58.4million cash paid as exclusive brand trademarks and the balance was recorded as a prepaid assetassociated with the settlement of royalties for the remainder of calendar year 2011 and thebuy-down of future royalties.
In May 2012, the Company acquired the global licenses and certain assets, including inventory,related to the Ed Hardy, True Religion and BCBGMAXAZRIA fragrance brands from New Wave.Prior to the acquisition, the Company had been acting as a distributor of the Ed Hardy, TrueReligion and BCBGMAXAZRIA fragrances to certain mid-tier and mass retailers in North America.The total cost of the acquisition was $60.1 million, including $19.8 million for the purchase ofinventory, of which $58.1 million has been paid in cash and up to an additional $2 million may bedue on January 31, 2013, subject to certain post-closing adjustments. This transaction wasaccounted for as a business combination.
The table below summarizes the allocation of the purchase price to the assets acquired:
(Amounts in thousands)Assets Acquired/Liabilities Assumed Amount
Intangible assets(1) . . . . . . . . . . . . . . . . . . . . . . . . . . . . . . . . . . . . . . . . . . . . . . . . . . $40,000Inventory . . . . . . . . . . . . . . . . . . . . . . . . . . . . . . . . . . . . . . . . . . . . . . . . . . . . . . . . . 19,847Other assets . . . . . . . . . . . . . . . . . . . . . . . . . . . . . . . . . . . . . . . . . . . . . . . . . . . . . . . 263
Total consideration allocated(2) . . . . . . . . . . . . . . . . . . . . . . . . . . . . . . . . . . . . . . . . $60,110
(1) The intangible assets represent the exclusive brand licenses for the Ed Hardy, True Religion andBCBGMAXAZRIA fragrance brands and will be amortized over a useful life of approximately11 years, 6 years and 91⁄2 years, respectively.
(2) Amount includes $2 million of cash that may be due on January 31, 2013, subject to certainpost-closing adjustments.
In June 2012, the Company also acquired the global licenses and certain assets related to theJustin Bieber and Nicki Minaj fragrance brands, including inventory of the Justin Bieber fragrances,from Give Back Brands. In connection with the acquisition, the Company paid Give Back Brands$26.5 million in cash, including $3.6 million for inventory. In addition, the Company agreed to pay
81
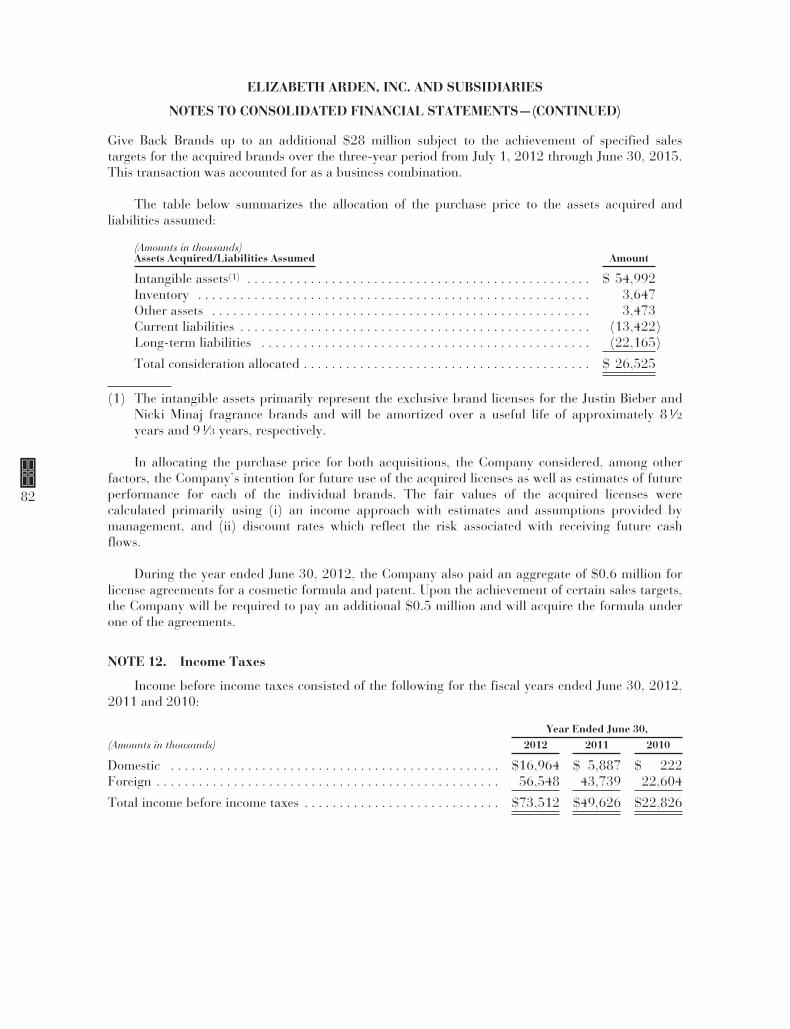
ELIZABETH ARDEN, INC. AND SUBSIDIARIES
NOTES TO CONSOLIDATED FINANCIAL STATEMENTS—(CONTINUED)
Give Back Brands up to an additional $28 million subject to the achievement of specified salestargets for the acquired brands over the three-year period from July 1, 2012 through June 30, 2015.This transaction was accounted for as a business combination.
The table below summarizes the allocation of the purchase price to the assets acquired andliabilities assumed:
(Amounts in thousands)Assets Acquired/Liabilities Assumed Amount
Intangible assets(1) . . . . . . . . . . . . . . . . . . . . . . . . . . . . . . . . . . . . . . . . . . . . . . . . . $ 54,992Inventory . . . . . . . . . . . . . . . . . . . . . . . . . . . . . . . . . . . . . . . . . . . . . . . . . . . . . . . . 3,647Other assets . . . . . . . . . . . . . . . . . . . . . . . . . . . . . . . . . . . . . . . . . . . . . . . . . . . . . . 3,473Current liabilities . . . . . . . . . . . . . . . . . . . . . . . . . . . . . . . . . . . . . . . . . . . . . . . . . . (13,422)Long-term liabilities . . . . . . . . . . . . . . . . . . . . . . . . . . . . . . . . . . . . . . . . . . . . . . . (22,165)
Total consideration allocated . . . . . . . . . . . . . . . . . . . . . . . . . . . . . . . . . . . . . . . . . $ 26,525
(1) The intangible assets primarily represent the exclusive brand licenses for the Justin Bieber andNicki Minaj fragrance brands and will be amortized over a useful life of approximately 81⁄2years and 91⁄3 years, respectively.
In allocating the purchase price for both acquisitions, the Company considered, among otherfactors, the Company’s intention for future use of the acquired licenses as well as estimates of futureperformance for each of the individual brands. The fair values of the acquired licenses werecalculated primarily using (i) an income approach with estimates and assumptions provided bymanagement, and (ii) discount rates which reflect the risk associated with receiving future cashflows.
During the year ended June 30, 2012, the Company also paid an aggregate of $0.6 million forlicense agreements for a cosmetic formula and patent. Upon the achievement of certain sales targets,the Company will be required to pay an additional $0.5 million and will acquire the formula underone of the agreements.
NOTE 12. Income Taxes
Income before income taxes consisted of the following for the fiscal years ended June 30, 2012,2011 and 2010:
Year Ended June 30,(Amounts in thousands) 2012 2011 2010
Domestic . . . . . . . . . . . . . . . . . . . . . . . . . . . . . . . . . . . . . . . . . . . . . . . $16,964 $ 5,887 $ 222Foreign . . . . . . . . . . . . . . . . . . . . . . . . . . . . . . . . . . . . . . . . . . . . . . . . . 56,548 43,739 22,604
Total income before income taxes . . . . . . . . . . . . . . . . . . . . . . . . . . . . $73,512 $49,626 $22,826
82
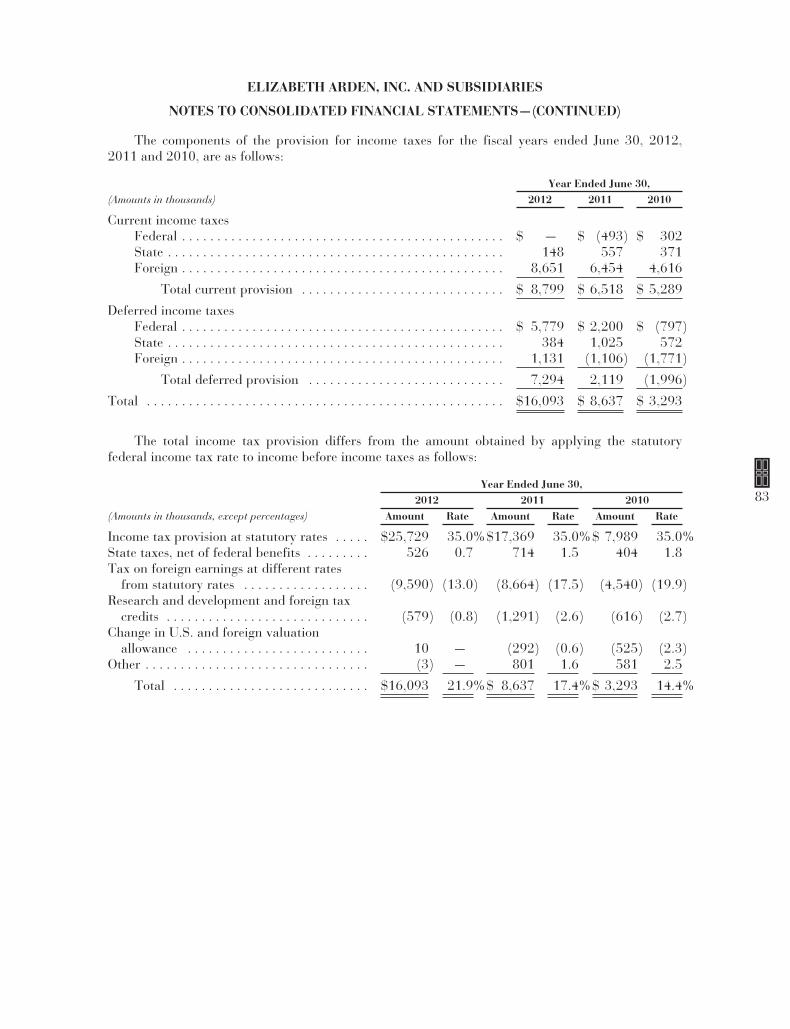
ELIZABETH ARDEN, INC. AND SUBSIDIARIES
NOTES TO CONSOLIDATED FINANCIAL STATEMENTS—(CONTINUED)
The components of the provision for income taxes for the fiscal years ended June 30, 2012,2011 and 2010, are as follows:
Year Ended June 30,(Amounts in thousands) 2012 2011 2010
Current income taxesFederal . . . . . . . . . . . . . . . . . . . . . . . . . . . . . . . . . . . . . . . . . . . . . . $ — $ (493) $ 302State . . . . . . . . . . . . . . . . . . . . . . . . . . . . . . . . . . . . . . . . . . . . . . . . 148 557 371Foreign . . . . . . . . . . . . . . . . . . . . . . . . . . . . . . . . . . . . . . . . . . . . . . 8,651 6,454 4,616
Total current provision . . . . . . . . . . . . . . . . . . . . . . . . . . . . . $ 8,799 $ 6,518 $ 5,289
Deferred income taxesFederal . . . . . . . . . . . . . . . . . . . . . . . . . . . . . . . . . . . . . . . . . . . . . . $ 5,779 $ 2,200 $ (797)State . . . . . . . . . . . . . . . . . . . . . . . . . . . . . . . . . . . . . . . . . . . . . . . . 384 1,025 572Foreign . . . . . . . . . . . . . . . . . . . . . . . . . . . . . . . . . . . . . . . . . . . . . . 1,131 (1,106) (1,771)
Total deferred provision . . . . . . . . . . . . . . . . . . . . . . . . . . . . 7,294 2,119 (1,996)
Total . . . . . . . . . . . . . . . . . . . . . . . . . . . . . . . . . . . . . . . . . . . . . . . . . . . $16,093 $ 8,637 $ 3,293
The total income tax provision differs from the amount obtained by applying the statutoryfederal income tax rate to income before income taxes as follows:
Year Ended June 30,2012 2011 2010
(Amounts in thousands, except percentages) Amount Rate Amount Rate Amount Rate
Income tax provision at statutory rates . . . . . $25,729 35.0%$17,369 35.0%$ 7,989 35.0%State taxes, net of federal benefits . . . . . . . . . 526 0.7 714 1.5 404 1.8Tax on foreign earnings at different rates
from statutory rates . . . . . . . . . . . . . . . . . . (9,590) (13.0) (8,664) (17.5) (4,540) (19.9)Research and development and foreign tax
credits . . . . . . . . . . . . . . . . . . . . . . . . . . . . . (579) (0.8) (1,291) (2.6) (616) (2.7)Change in U.S. and foreign valuation
allowance . . . . . . . . . . . . . . . . . . . . . . . . . . 10 — (292) (0.6) (525) (2.3)Other . . . . . . . . . . . . . . . . . . . . . . . . . . . . . . . . (3) — 801 1.6 581 2.5
Total . . . . . . . . . . . . . . . . . . . . . . . . . . . . $16,093 21.9%$ 8,637 17.4%$ 3,293 14.4%
83
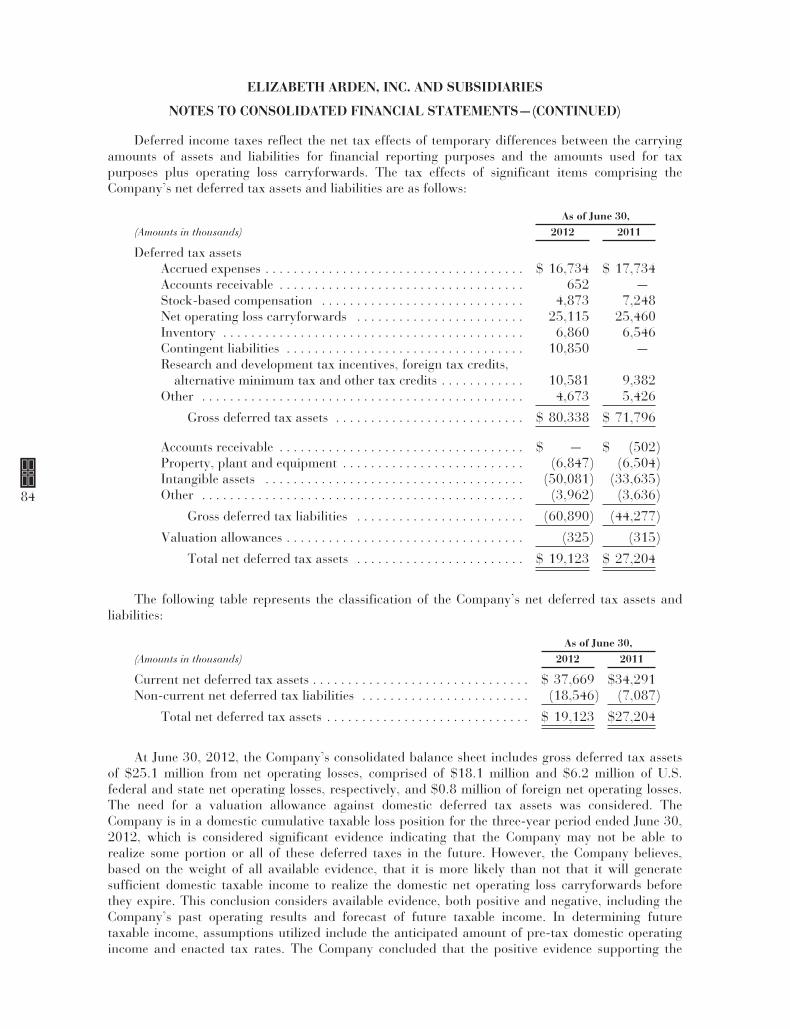
ELIZABETH ARDEN, INC. AND SUBSIDIARIES
NOTES TO CONSOLIDATED FINANCIAL STATEMENTS—(CONTINUED)
Deferred income taxes reflect the net tax effects of temporary differences between the carryingamounts of assets and liabilities for financial reporting purposes and the amounts used for taxpurposes plus operating loss carryforwards. The tax effects of significant items comprising theCompany’s net deferred tax assets and liabilities are as follows:
As of June 30,(Amounts in thousands) 2012 2011
Deferred tax assetsAccrued expenses . . . . . . . . . . . . . . . . . . . . . . . . . . . . . . . . . . . . . $ 16,734 $ 17,734Accounts receivable . . . . . . . . . . . . . . . . . . . . . . . . . . . . . . . . . . . 652 —Stock-based compensation . . . . . . . . . . . . . . . . . . . . . . . . . . . . . 4,873 7,248Net operating loss carryforwards . . . . . . . . . . . . . . . . . . . . . . . . 25,115 25,460Inventory . . . . . . . . . . . . . . . . . . . . . . . . . . . . . . . . . . . . . . . . . . . 6,860 6,546Contingent liabilities . . . . . . . . . . . . . . . . . . . . . . . . . . . . . . . . . . 10,850 —Research and development tax incentives, foreign tax credits,
alternative minimum tax and other tax credits . . . . . . . . . . . . 10,581 9,382Other . . . . . . . . . . . . . . . . . . . . . . . . . . . . . . . . . . . . . . . . . . . . . . 4,673 5,426
Gross deferred tax assets . . . . . . . . . . . . . . . . . . . . . . . . . . . $ 80,338 $ 71,796
Accounts receivable . . . . . . . . . . . . . . . . . . . . . . . . . . . . . . . . . . . $ — $ (502)Property, plant and equipment . . . . . . . . . . . . . . . . . . . . . . . . . . (6,847) (6,504)Intangible assets . . . . . . . . . . . . . . . . . . . . . . . . . . . . . . . . . . . . . (50,081) (33,635)Other . . . . . . . . . . . . . . . . . . . . . . . . . . . . . . . . . . . . . . . . . . . . . . (3,962) (3,636)
Gross deferred tax liabilities . . . . . . . . . . . . . . . . . . . . . . . . (60,890) (44,277)
Valuation allowances . . . . . . . . . . . . . . . . . . . . . . . . . . . . . . . . . . (325) (315)
Total net deferred tax assets . . . . . . . . . . . . . . . . . . . . . . . . $ 19,123 $ 27,204
The following table represents the classification of the Company’s net deferred tax assets andliabilities:
As of June 30,(Amounts in thousands) 2012 2011
Current net deferred tax assets . . . . . . . . . . . . . . . . . . . . . . . . . . . . . . . $ 37,669 $34,291Non-current net deferred tax liabilities . . . . . . . . . . . . . . . . . . . . . . . . (18,546) (7,087)
Total net deferred tax assets . . . . . . . . . . . . . . . . . . . . . . . . . . . . . $ 19,123 $27,204
At June 30, 2012, the Company’s consolidated balance sheet includes gross deferred tax assetsof $25.1 million from net operating losses, comprised of $18.1 million and $6.2 million of U.S.federal and state net operating losses, respectively, and $0.8 million of foreign net operating losses.The need for a valuation allowance against domestic deferred tax assets was considered. TheCompany is in a domestic cumulative taxable loss position for the three-year period ended June 30,2012, which is considered significant evidence indicating that the Company may not be able torealize some portion or all of these deferred taxes in the future. However, the Company believes,based on the weight of all available evidence, that it is more likely than not that it will generatesufficient domestic taxable income to realize the domestic net operating loss carryforwards beforethey expire. This conclusion considers available evidence, both positive and negative, including theCompany’s past operating results and forecast of future taxable income. In determining futuretaxable income, assumptions utilized include the anticipated amount of pre-tax domestic operatingincome and enacted tax rates. The Company concluded that the positive evidence supporting the
84
ELIZABETH ARDEN, INC. AND SUBSIDIARIES
NOTES TO CONSOLIDATED FINANCIAL STATEMENTS—(CONTINUED)
realizability of the domestic deferred tax assets was sufficient, without having to assume the use ofpotentially available feasible and prudent tax planning strategies. The assumptions utilized inforecasting pre-tax income are based on historical data and expected business cycles. The domesticlosses were generated in fiscal years 2008 and 2009 and were mainly attributable to expensesassociated with the original Liz Claiborne license agreement and charges related to the Company’sGlobal Efficiency Re-engineering initiative (“Initiative”), and are not considered to be reflective ofthe core historical earnings of the business. In fiscal 2009, the retail and consumer markets wereseverely impacted by one of the worst holiday seasons in recent history. The markets have begun torecover, and the Company believes this positive recovery trend will continue and that it will generatepre-tax profits as markets improve. For the year ended June 30, 2012, domestic pre-tax bookincome was $17 million, which included $4.9 million of inventory-related costs associated with the2012 Acquisitions. Additionally, the Company has a strong domestic earnings history, includingdomestic pre-tax book income in fiscal years 2005 through 2007 and 2010 through 2011 rangingfrom $7.6 million to $28.8 million and $0.2 million to $5.9 million, respectively. These earningswere based on a consistent business model of selling fragrances and cosmetics with strong brandrecognition. The Company also anticipates that improved pre-tax operating income will continue toresult from improved gross margins due to its ongoing strategic and operating initiatives.
At June 30, 2012, the Company had U. S. federal operating loss carryforwards of $71 millionthat will begin to expire on June 30, 2024. The Company had state and local net operating losscarryforwards of $101.3 million that will expire as follows: approximately $0.2 million at June 30,2013, $1.4 million at June 30, 2014, $12.8 million during the period from 2015 to 2018, and $86.9million in 2019 and thereafter. An equivalent amount of federal and state taxable income wouldneed to be generated in order to fully realize the U. S. federal and state net deferred tax assets beforetheir expiration. In contrast to the U.S. Internal Revenue Code, many U.S. states do not allow thecarryback of a net operating loss in any significant amount or have suspended the utilization of netoperating losses for a specific period of time. As a result, in these states the Company’s net operatingloss carryforwards are significantly higher than the federal net operating loss carryforward. To theextent that the Company does not generate sufficient state taxable income within the statutorycarryforward periods to utilize the loss carryforwards in these states, the loss carryforwards willexpire unused. The state and local net operating loss carryforwards have an effective tax rate ofapproximately 5.0%. The Company believes that, based on its projections of future taxable incomein its domestic jurisdictions, it will realize these net operating losses before they expire.
At June 30, 2012, the Company had foreign net operating loss carryforwards of approximately$3.8 million that will begin to expire in fiscal year 2013. The Company’s ability to use foreign netoperating loss carryforwards is dependent on generating sufficient future taxable income prior totheir expiration. As a result, an equivalent amount of foreign taxable income would need to begenerated in order to fully realize the foreign net operating loss carryforwards. However, due to theuncertainty of achieving sufficient profits to utilize foreign net operating loss carryforwards incertain jurisdictions, and the near-term expiration of certain foreign net operating losscarryforwards, as of June 30, 2012, the Company has recorded a valuation allowance ofapproximately $0.3 million related to these foreign net operating loss carryforwards.
In evaluating the need for a valuation allowance, the Company estimates future taxable incomebased on management approved forecasts. This process requires significant judgment bymanagement about matters that are by their nature uncertain. If future events differ significantlyfrom the Company’s current forecasts, a valuation allowance may need to be established, whichcould have a material adverse effect on its results of operations and financial condition. TheCompany will continue to monitor and update its assumptions and forecasts of future taxableincome and assess the need for a valuation allowance.
85
ELIZABETH ARDEN, INC. AND SUBSIDIARIES
NOTES TO CONSOLIDATED FINANCIAL STATEMENTS—(CONTINUED)
The Company has not provided for taxes on approximately $270 million of undistributedearnings of foreign subsidiaries, as these earnings are deemed to be permanently reinvested. If in thefuture these earnings are repatriated to the United States, or if the Company determines suchearnings will be remitted in the foreseeable future, additional tax provisions may be required. Due tocomplexities in the tax laws and the assumptions that would have to be made, it is not practicable toestimate the amounts of income tax provisions that may be required.
Deferred tax assets relating to tax benefits of employee stock option awards have been reducedto reflect stock option exercises during the year ended June 30, 2012. Some exercises resulted in taxdeductions in excess of previously recorded benefits based on the option value at the time of grant(“windfalls”). Although the additional tax benefit for the windfalls is reflected in net operating losscarryforwards, the additional tax benefit associated with the windfalls is not recognized for financialstatement purposes until the deduction reduces taxes payable. Accordingly, windfall gross taxbenefits of $13.7 million are not reflected in deferred tax assets. The deferred tax assets will berecognized with an offset to additional paid-in capital as the windfall reduces current taxes payable.
At June 30, 2012, the total amount of gross unrecognized tax benefits was $6.6 million. Theseunrecognized tax benefits could favorably affect the effective tax rate in a future period, if and to theextent recognized. The Company does not expect changes in the amount of unrecognized tax benefitsto have a significant impact on its results of operations over the next 12 months.
A reconciliation of the beginning and ending amount of gross unrecognized tax benefits as ofJune 30, 2012, 2011 and 2010 was as follows:
Year Ended June 30,(Amounts in thousands) 2012 2011 2010
Beginning balance . . . . . . . . . . . . . . . . . . . . . . . . . . . . . . . . . . . . $4,837 $5,817 $6,725Additions based on tax positions related to the current
year . . . . . . . . . . . . . . . . . . . . . . . . . . . . . . . . . . . . . . . . . 1,654 92 106Additions for tax positions of prior years . . . . . . . . . . . . . . 70 27 —Reductions for tax positions of prior years . . . . . . . . . . . . . — (138) —Reductions due to closure of foreign tax audits . . . . . . . . . — (932) —Reductions due to lapse of applicable statute of
limitations . . . . . . . . . . . . . . . . . . . . . . . . . . . . . . . . . . . . — — (994)
Gross balance . . . . . . . . . . . . . . . . . . . . . . . . . . . . . . . . . . . . . . . 6,561 4,866 5,837Interest and penalties . . . . . . . . . . . . . . . . . . . . . . . . . . . . . . . . . — (29) (20)
Ending balance . . . . . . . . . . . . . . . . . . . . . . . . . . . . . . . . . . . . . . $6,561 $4,837 $5,817
The Company and its domestic subsidiaries file income tax returns with federal, state and localtax authorities within the United States. The Company also files tax returns for its internationalaffiliates in various foreign jurisdictions. The statute of limitations for the Company’s U.S. federaltax return years remains open for the year ended June 30, 2008 and subsequent fiscal years. TheInternal Revenue Service (“IRS”) began an examination of the Company’s U.S. federal tax returnsfor the years ended June 30, 2008 and June 30, 2009 during fiscal year 2011. The Company expectsthat it will likely receive a Notice of Proposed Adjustment from the IRS in the next 60 to 90 daysand that it will relate primarily to transfer pricing matters. The issues currently under discussionwith the IRS are similar to those that have resulted in material proposed assessments against othercompanies, and the IRS may propose an adjustment in an amount that may be material to theCompany’s consolidated statements of operations in the period in which resolved unless resolvedfavorably to the Company. While any IRS examination contains an element of uncertainty, based oncurrent facts and circumstances, the Company believes the ultimate outcome of the examination,
86
ELIZABETH ARDEN, INC. AND SUBSIDIARIES
NOTES TO CONSOLIDATED FINANCIAL STATEMENTS—(CONTINUED)
including any subsequent protest or appeals process, will not have a material adverse effect on theCompany’s business, prospects, financial condition or cash flows. The year ended June 30, 2004 andsubsequent fiscal years remain subject to examination for various state tax jurisdictions. In addition,the Company has subsidiaries in various foreign jurisdictions that have statutes of limitationsgenerally ranging from one to five years. The year ended June 30, 2006 and subsequent fiscal yearsremain subject to examination for various foreign jurisdictions.
The Company recognizes interest accrued related to unrecognized tax benefits in interestexpense and related penalties in the provision for income taxes in the consolidated statement ofoperations, which is consistent with the recognition of these items in prior reporting periods.
NOTE 13. Repurchases of Common Stock
On November 2, 2010, the Company’s board of directors authorized the repurchase of anadditional $40 million of Common Stock under the terms of an existing $80 million common stockrepurchase program and extended the term of the stock repurchase program from November 30,2010 to November 30, 2012. On August 7, 2012, the Company’s board of directors approved anextension of the stock repurchase program through November 30, 2014.
As of June 30, 2012, the Company had repurchased 4,029,201 shares of Common Stock on theopen market under the stock repurchase program, at an average price of $16.63 per share and at acost of approximately $67.0 million, including sales commissions, leaving approximately $53.0million available for additional repurchases under the program. For the fiscal year ended June 30,2012, there were no share repurchases.
During the first quarter of fiscal 2011, the Company paid approximately $1.2 million for thesettlement of shares of Common Stock that were repurchased at the end of fiscal 2010 under theabove discussed repurchased program.
In connection with the vesting of 343,800 shares of outstanding market-based restricted stockgranted in 2005, in March 2011 the Company withheld 121,908 shares of Common Stock at a fairmarket value of $28.08 per share, representing a cost of approximately $3.4 million, to satisfyminimum statutory tax withholding obligations resulting from such vesting. The acquisition of theseshares by the Company was accounted for under the treasury method.
NOTE 14. Stock Plans
At June 30, 2012, the Company had three active stock incentive plans, one for the benefit ofnon-employee directors of the Company’s Board of Directors (the “Board”), the 2004 Non-employeeDirector Stock Option Plan (the “2004 Director Plan”), and two for the benefit of eligible employeesand independent contractors (the 2004 Stock Incentive Plan and the 2010 Stock Award andIncentive Plan). In addition, as of June 30, 2012, stock options granted under the Company’s 1995Stock Option Plan, 1995 Non-Employee Director Plan and 2000 Stock Incentive Plan were stilloutstanding and restricted stock granted under the 2000 Stock Incentive Plan was still outstanding.The 1995 Stock Option Plan and the 2000 Stock Incentive Plan have expired by their terms and nofurther awards will be granted under the 1995 Stock Option Plan or the 2000 Stock Incentive Plan.The 2004 Director Plan replaced the 1995 Non-Employee Director Plan, and no further grants ofstock options will occur under the 1995 Non-Employee Director Plan. All six plans were adopted bythe Board and approved by the Company’s shareholders.
The 2004 Stock Incentive Plan (the “2004 Incentive Plan”) authorizes the Company to grantawards with respect to a total of 2,700,000 shares of Common Stock. The stock options awarded
87
ELIZABETH ARDEN, INC. AND SUBSIDIARIES
NOTES TO CONSOLIDATED FINANCIAL STATEMENTS—(CONTINUED)
under the 2004 Incentive Plan are exercisable at any time or in any installments as determined bythe compensation committee of the Board at the time of grant and may be either incentive ornon-qualified stock options under the Internal Revenue Code, as determined by the compensationcommittee. The exercise price for stock option grants is equal to the closing price of the CommonStock on the date of grant. At June 30, 2012, 19,735 shares of Common Stock remained availablefor grant under the 2004 Incentive Plan.
The 2004 Director Plan authorizes the Company to grant non-qualified stock options for up to350,000 shares of Common Stock to non-employee directors of the Company. Each year on the dateof the annual meeting of the shareholders and provided that a sufficient number of shares remainavailable under the 2004 Director Plan, there will automatically be granted to each eligible directoran option to purchase shares of Common Stock in such amount as the Board determines based on acompetitive review of comparable companies. Each option granted under the 2004 Director Plan onan annual shareholders meeting date will become exercisable three years from the date of grant ifsuch person has continued to serve as a director until that date, unless exercisability of the option isaccelerated due to death, disability or retirement in good standing at or after age 70. No option maybe exercisable after the expiration of ten years from the date of grant. The exercise price will equalthe closing price of the Common Stock on the date of grant. At June 30, 2012, 103,400 shares ofCommon Stock remained available for grant under the 2004 Director Plan.
The 2010 Stock Award and Incentive Plan (the “2010 Plan”) authorizes the Company to grantawards with respect to a total of 1,100,000 shares of Common Stock of which a maximum of550,000 shares may be awarded as full value awards. A full value award is any award other than astock option or stock appreciation right, which is settled by the issuance of shares. The stock optionsawarded under the 2010 Plan are exercisable at any time or in any installments as determined bythe compensation committee of the Board at the time of grant and may be either incentive ornon-qualified stock options under the Internal Revenue Code, as determined by the compensationcommittee. The exercise price for stock option grants is equal to the closing price of the CommonStock on the date of grant. At June 30, 2012, 1,008,900 shares of Common Stock remainedavailable for grant under the 2010 Plan, of which 523,500 shares can be issued as full value shares.
For the years ended June 30, 2012, 2011 and 2010, total share-based compensation expensecharged against income for all stock plans was as follows:
Year Ended June 30,(Amounts in millions) 2012 2011 2010
Stock options . . . . . . . . . . . . . . . . . . . . . . . . . . . . . . . . . . . . . . . . . . . . . . . . . . . . . $1.5 $1.8 $2.2Employee stock purchase plan . . . . . . . . . . . . . . . . . . . . . . . . . . . . . . . . . . . . . . . . 0.8 0.6 0.5Restricted stock/restricted stock units . . . . . . . . . . . . . . . . . . . . . . . . . . . . . . . . . . 2.8 2.5 2.1
Total share-based compensation expense . . . . . . . . . . . . . . . . . . . . . . . . . . . . . . . $5.1 $4.9 $4.8
The tax benefit related to the compensation cost charged to income for the years ended June 30,2012, 2011 and 2010, was approximately $1.1 million, $0.9 million and $0.7 million, respectively.
As of June 30, 2012, there were approximately $5.4 million of unrecognized compensation costsrelated to non-vested share-based arrangements granted under the Company’s share-basedcompensation plans. These costs are expected to be recognized over a weighted-average period ofapproximately three years.
88
ELIZABETH ARDEN, INC. AND SUBSIDIARIES
NOTES TO CONSOLIDATED FINANCIAL STATEMENTS—(CONTINUED)
Stock Options
On August 6, 2012, the compensation committee of the Board approved the grant to certainemployees of stock options to purchase shares of Common Stock. The stock options are due to vestin equal thirds over a three-year period on dates that are two business days after the Company’sfinancial results for each of the fiscal years ending June 30, 2013, 2014 and 2015, are publiclyannounced, but only if the person receiving the grant is still employed by the Company at the timeof vesting. The stock option grants are expected to be effective on August 13, 2012, the secondbusiness day after the Company’s financial results for the fiscal year ending June 30, 2012 arescheduled to be publicly announced (the “2012 Equity Grant Date”), and will have a total aggregatecompensation amount of approximately $1.5 million. The closing price of the common stock on theeffective date of grant will be used to establish (i) the exercise price, and (ii) the total number ofstock options to be granted based on the Black-Scholes option model.
Year Ended June 30, 2012. On August 15, 2011, the Board granted to employees stockoptions for 95,500 shares of Common Stock. The stock options are due to vest in equal thirds over athree-year period on dates that are two business days after the Company’s financial results for eachof the fiscal years ending June 30, 2012, 2013 and 2014, are publicly announced, but only if theperson receiving the grant is still employed by the Company at the time of vesting. The exerciseprice of those stock options is $31.78 per share, which was the closing price of the Common Stockon the effective date of grant. The weighted-average grant date fair value of options granted was$14.51 per share based on the Black-Scholes option pricing model. The options expire ten yearsfrom the date of grant.
On November 9, 2011, the date of the Company’s 2011 annual shareholders meeting, theCompany granted stock options for an aggregate of 24,000 shares of Common Stock to sixnon-employee directors under the Company’s 2004 Director Plan. All of the stock options grantedon November 9, 2011, are exercisable three years from the date of grant if such persons continue toserve as a director until that date. The exercise price of those stock options is $33.19 per share,which was the closing price of the Common Stock on the date of grant. The weighted-average grantdate fair value of options granted was $14.93 per share based on the Black-Scholes option pricingmodel. The options expire ten years from the date of grant.
Year Ended June 30, 2011. On August 16, 2010, the Board granted to employees stockoptions for 171,700 shares of Common Stock. The stock options are due to vest in equal thirds overa three-year period on dates that are two business days after the Company’s financial results foreach of the fiscal years ending June 30, 2011, 2012 and 2013, are publicly announced, but only ifthe person receiving the grant is still employed by the Company at the time of vesting. The exerciseprice of those stock options is $16.15 per share, which was the closing price of the Common Stockon the effective date of grant. The weighted-average grant date fair value of options granted was$7.22 per share based on the Black-Scholes option pricing model. The options expire ten years fromthe date of grant.
On November 1, 2010, the date of the Company’s 2010 annual shareholders meeting, theCompany granted stock options for an aggregate of 39,600 shares of Common Stock to sixnon-employee directors under the Company’s 2004 Director Plan. All of the stock options grantedon November 1, 2010, are exercisable three years from the date of grant if such persons continue toserve as a director until that date. The exercise price of those stock options is $20.69 per share,which was the closing price of the Common Stock on the date of grant. The weighted-average grantdate fair value of options granted was $9.13 per share based on the Black-Scholes option pricingmodel. The options expire ten years from the date of grant.
89
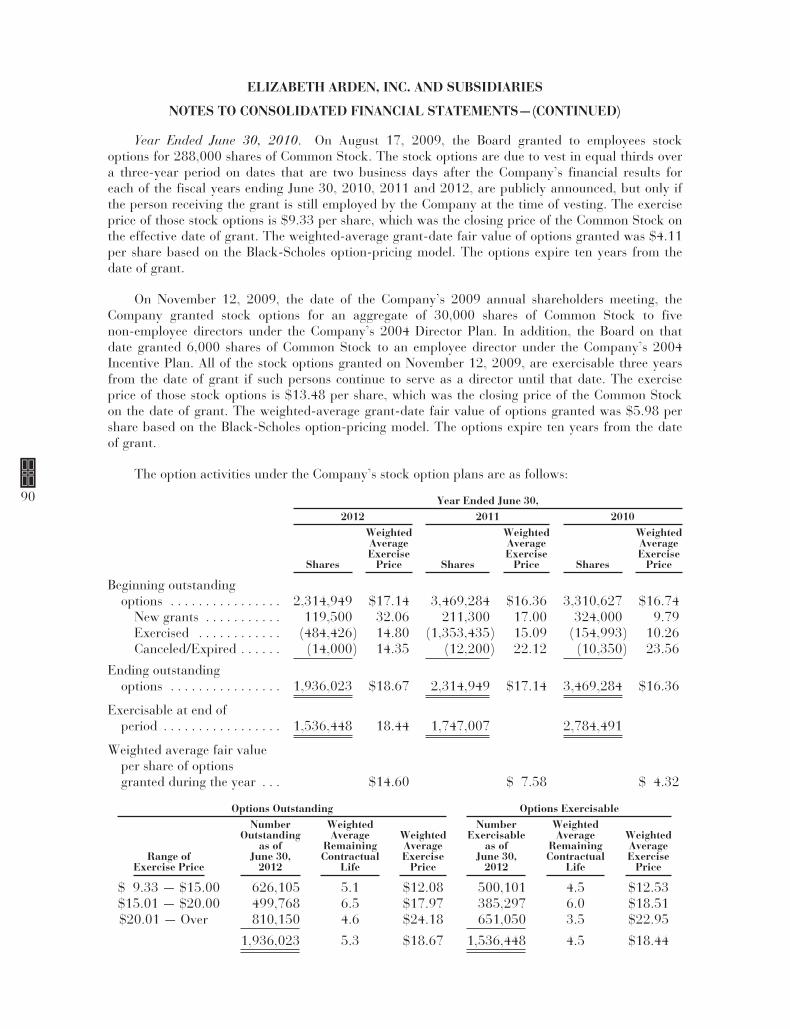
ELIZABETH ARDEN, INC. AND SUBSIDIARIES
NOTES TO CONSOLIDATED FINANCIAL STATEMENTS—(CONTINUED)
Year Ended June 30, 2010. On August 17, 2009, the Board granted to employees stockoptions for 288,000 shares of Common Stock. The stock options are due to vest in equal thirds overa three-year period on dates that are two business days after the Company’s financial results foreach of the fiscal years ending June 30, 2010, 2011 and 2012, are publicly announced, but only ifthe person receiving the grant is still employed by the Company at the time of vesting. The exerciseprice of those stock options is $9.33 per share, which was the closing price of the Common Stock onthe effective date of grant. The weighted-average grant-date fair value of options granted was $4.11per share based on the Black-Scholes option-pricing model. The options expire ten years from thedate of grant.
On November 12, 2009, the date of the Company’s 2009 annual shareholders meeting, theCompany granted stock options for an aggregate of 30,000 shares of Common Stock to fivenon-employee directors under the Company’s 2004 Director Plan. In addition, the Board on thatdate granted 6,000 shares of Common Stock to an employee director under the Company’s 2004Incentive Plan. All of the stock options granted on November 12, 2009, are exercisable three yearsfrom the date of grant if such persons continue to serve as a director until that date. The exerciseprice of those stock options is $13.48 per share, which was the closing price of the Common Stockon the date of grant. The weighted-average grant-date fair value of options granted was $5.98 pershare based on the Black-Scholes option-pricing model. The options expire ten years from the dateof grant.
The option activities under the Company’s stock option plans are as follows:
Year Ended June 30,2012 2011 2010
Shares
WeightedAverageExercise
Price Shares
WeightedAverageExercise
Price Shares
WeightedAverageExercise
Price
Beginning outstandingoptions . . . . . . . . . . . . . . . . 2,314,949 $17.14 3,469,284 $16.36 3,310,627 $16.74
New grants . . . . . . . . . . . 119,500 32.06 211,300 17.00 324,000 9.79Exercised . . . . . . . . . . . . (484,426) 14.80 (1,353,435) 15.09 (154,993) 10.26Canceled/Expired . . . . . . (14,000) 14.35 (12,200) 22.12 (10,350) 23.56
Ending outstandingoptions . . . . . . . . . . . . . . . . 1,936,023 $18.67 2,314,949 $17.14 3,469,284 $16.36
Exercisable at end ofperiod . . . . . . . . . . . . . . . . . 1,536,448 18.44 1,747,007 2,784,491
Weighted average fair valueper share of optionsgranted during the year . . . $14.60 $ 7.58 $ 4.32
Options Outstanding Options Exercisable
Range ofExercise Price
NumberOutstanding
as ofJune 30,
2012
WeightedAverage
RemainingContractual
Life
WeightedAverageExercise
Price
NumberExercisable
as ofJune 30,
2012
WeightedAverage
RemainingContractual
Life
WeightedAverageExercise
Price
$ 9.33 — $15.00 626,105 5.1 $12.08 500,101 4.5 $12.53$15.01 — $20.00 499,768 6.5 $17.97 385,297 6.0 $18.51$20.01 — Over 810,150 4.6 $24.18 651,050 3.5 $22.95
1,936,023 5.3 $18.67 1,536,448 4.5 $18.44
90
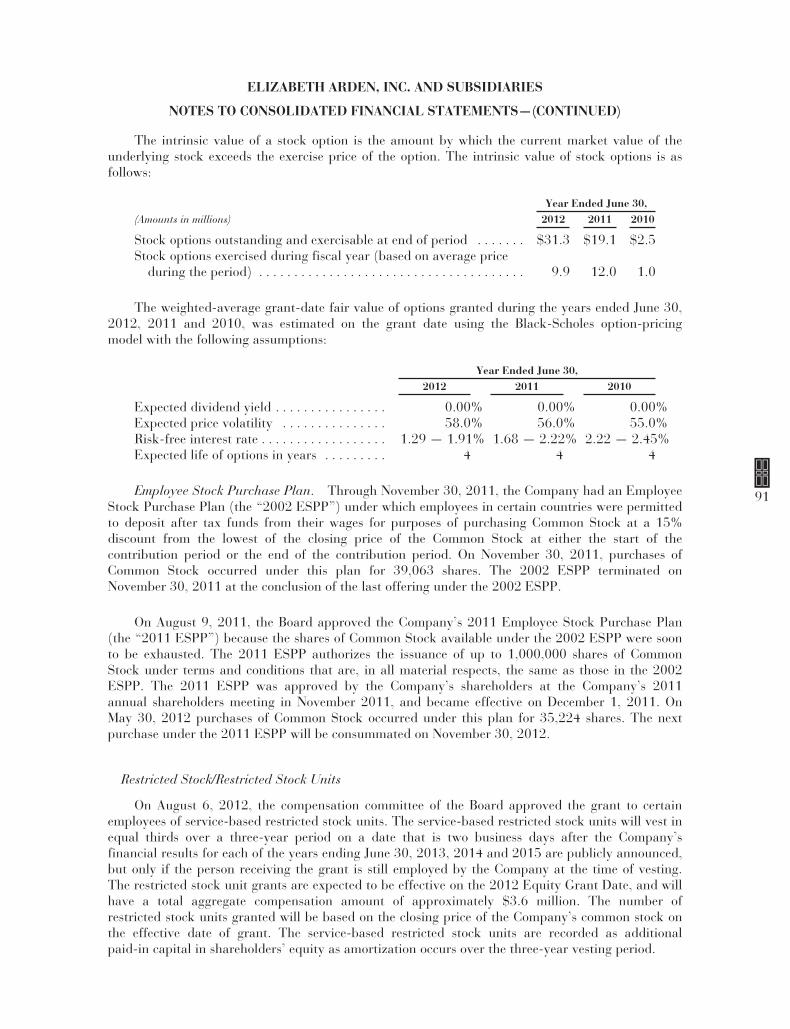
ELIZABETH ARDEN, INC. AND SUBSIDIARIES
NOTES TO CONSOLIDATED FINANCIAL STATEMENTS—(CONTINUED)
The intrinsic value of a stock option is the amount by which the current market value of theunderlying stock exceeds the exercise price of the option. The intrinsic value of stock options is asfollows:
Year Ended June 30,(Amounts in millions) 2012 2011 2010
Stock options outstanding and exercisable at end of period . . . . . . . $31.3 $19.1 $2.5Stock options exercised during fiscal year (based on average price
during the period) . . . . . . . . . . . . . . . . . . . . . . . . . . . . . . . . . . . . . . 9.9 12.0 1.0
The weighted-average grant-date fair value of options granted during the years ended June 30,2012, 2011 and 2010, was estimated on the grant date using the Black-Scholes option-pricingmodel with the following assumptions:
Year Ended June 30,2012 2011 2010
Expected dividend yield . . . . . . . . . . . . . . . . 0.00% 0.00% 0.00%Expected price volatility . . . . . . . . . . . . . . . 58.0% 56.0% 55.0%Risk-free interest rate . . . . . . . . . . . . . . . . . . 1.29 — 1.91% 1.68 — 2.22% 2.22 — 2.45%Expected life of options in years . . . . . . . . . 4 4 4
Employee Stock Purchase Plan. Through November 30, 2011, the Company had an EmployeeStock Purchase Plan (the “2002 ESPP”) under which employees in certain countries were permittedto deposit after tax funds from their wages for purposes of purchasing Common Stock at a 15%discount from the lowest of the closing price of the Common Stock at either the start of thecontribution period or the end of the contribution period. On November 30, 2011, purchases ofCommon Stock occurred under this plan for 39,063 shares. The 2002 ESPP terminated onNovember 30, 2011 at the conclusion of the last offering under the 2002 ESPP.
On August 9, 2011, the Board approved the Company’s 2011 Employee Stock Purchase Plan(the “2011 ESPP”) because the shares of Common Stock available under the 2002 ESPP were soonto be exhausted. The 2011 ESPP authorizes the issuance of up to 1,000,000 shares of CommonStock under terms and conditions that are, in all material respects, the same as those in the 2002ESPP. The 2011 ESPP was approved by the Company’s shareholders at the Company’s 2011annual shareholders meeting in November 2011, and became effective on December 1, 2011. OnMay 30, 2012 purchases of Common Stock occurred under this plan for 35,224 shares. The nextpurchase under the 2011 ESPP will be consummated on November 30, 2012.
Restricted Stock/Restricted Stock Units
On August 6, 2012, the compensation committee of the Board approved the grant to certainemployees of service-based restricted stock units. The service-based restricted stock units will vest inequal thirds over a three-year period on a date that is two business days after the Company’sfinancial results for each of the years ending June 30, 2013, 2014 and 2015 are publicly announced,but only if the person receiving the grant is still employed by the Company at the time of vesting.The restricted stock unit grants are expected to be effective on the 2012 Equity Grant Date, and willhave a total aggregate compensation amount of approximately $3.6 million. The number ofrestricted stock units granted will be based on the closing price of the Company’s common stock onthe effective date of grant. The service-based restricted stock units are recorded as additionalpaid-in capital in shareholders’ equity as amortization occurs over the three-year vesting period.
91
ELIZABETH ARDEN, INC. AND SUBSIDIARIES
NOTES TO CONSOLIDATED FINANCIAL STATEMENTS—(CONTINUED)
On August 6, 2012, the compensation committee of the Board also approved the grant ofperformance-based restricted stock units to the chief executive officer having a compensation valueof approximately $0.9 million, effective on the 2012 Equity Grant Date. The vesting of theseperformance-based restricted stock units is subject to both performance and service criteria. Theactual number of performance-based restricted stock units eligible for vesting will be determinedbased on the Company’s achievement of specified earnings per share and revenue targets for thefiscal year ending June 30, 2013. The number of performance-based restricted stock units that aredetermined to be eligible to vest based on the Company’s achievement of such performance criteriawill then vest in three equal installments on the date that is two business days after the Company’sfinancial results for each of the years ending June 30, 2013, June 30, 2014 and June 30, 2015 arepublicly announced, subject to the continued employment of the chief executive through theapplicable vesting date. The closing price of the common stock on the 2012 Equity Grant Date willbe used to establish the specific number of performance-based restricted stock units that will begranted to the chief executive officer.
Year Ended June 30, 2012. On August 15, 2011, the Board granted to employees 98,300service-based restricted stock units. The service-based restricted stock units vest in equal thirds overa three-year period on the date that is two business days after the Company’s financial results foreach of the years ending June 30, 2012, 2013 and 2014 are publicly announced, but only if theperson receiving the grant is still employed by the Company at the time of vesting. The fair value ofthe service-based restricted stock units granted was based on the closing price of the Company’scommon stock on the date of grant. The service-based restricted stock units are recorded asadditional paid-in capital in shareholders’ equity as amortization occurs over the three-year vestingperiod.
Year Ended June 30, 2011. On November 2, 2010, 26,500 shares of service-based restrictedstock were granted to employees of the Company. The grant of service-based restricted stock wasoriginally approved on August 9, 2010 by the compensation committee of the Board, subject toshareholder approval of the 2010 Plan at the November 1, 2010 annual shareholders meeting andfiling of a registration statement on Form S-8 relating to the Plan. The service-based restricted stockvests in equal thirds on the date that is two business days after the Company’s financial results foreach of the years ending June 30, 2011, 2012 and 2013 are publicly announced, but only if theperson receiving the grant is still employed by the Company at the time of vesting. The service-based restricted stock is recorded as additional paid-in capital in shareholders’ equity asamortization occurs over the vesting period.
On August 16, 2010, the Board granted to employees 146,400 shares of service-based restrictedstock. The service-based restricted stock vests in equal thirds over a three-year period on the datethat is two business days after the Company’s financial results for each of the years ending June 30,2011, 2012 and 2013 are publicly announced, but only if the person receiving the grant is stillemployed by the Company at the time of vesting. The fair value of the service-based restricted stockgranted was based on the closing price of the Company’s Common Stock on the date of grant. Theservice-based restricted stock is recorded as additional paid-in capital in shareholders’ equity asamortization occurs over the three-year vesting period.
Year Ended June 30, 2010. On August 17, 2009, the Board granted to employees 259,200shares of service-based restricted stock. The service-based restricted stock vests in equal thirds overa three-year period on the date that is two business days after the Company’s financial results foreach of the years ending June 30, 2010, 2011 and 2012 are publicly announced, but only if theperson receiving the grant is still employed by the Company at the time of vesting. The fair value ofthe service-based restricted stock granted was based on the closing price of the Company’s CommonStock on the date of grant. The service-based restricted stock is recorded as additional paid-incapital in shareholders’ equity as amortization occurs over the three-year vesting period.
92
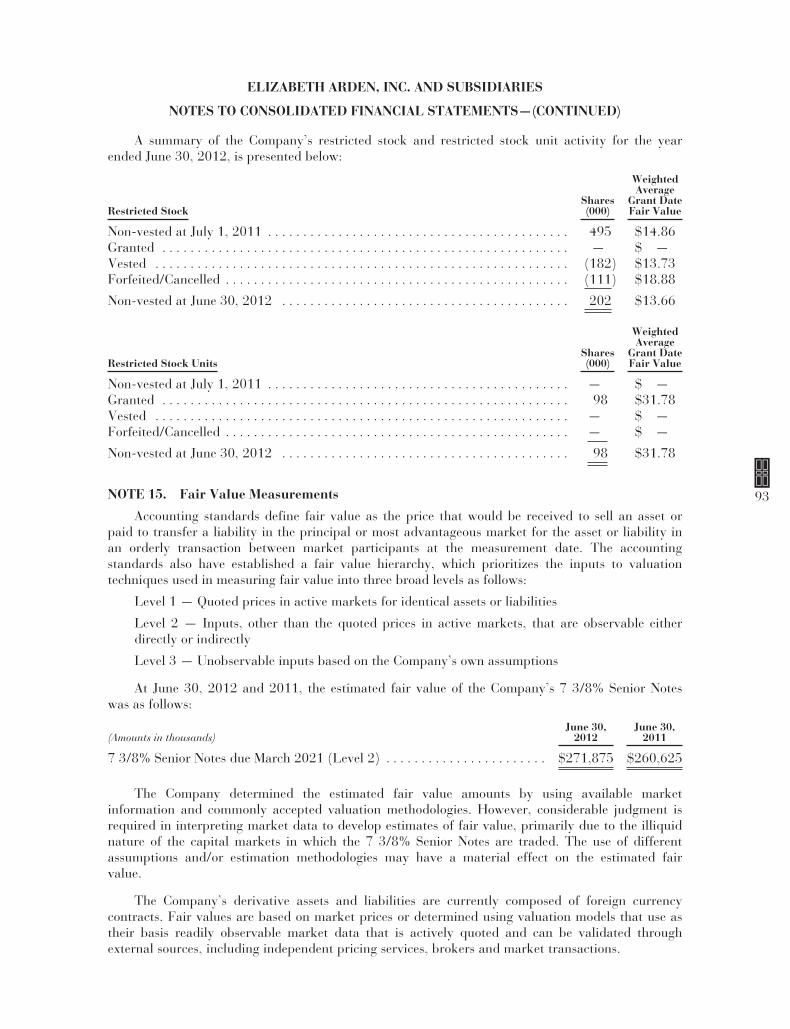
ELIZABETH ARDEN, INC. AND SUBSIDIARIES
NOTES TO CONSOLIDATED FINANCIAL STATEMENTS—(CONTINUED)
A summary of the Company’s restricted stock and restricted stock unit activity for the yearended June 30, 2012, is presented below:
Restricted StockShares(000)
WeightedAverage
Grant DateFair Value
Non-vested at July 1, 2011 . . . . . . . . . . . . . . . . . . . . . . . . . . . . . . . . . . . . . . . . . . . 495 $14.86Granted . . . . . . . . . . . . . . . . . . . . . . . . . . . . . . . . . . . . . . . . . . . . . . . . . . . . . . . . . . — $ —Vested . . . . . . . . . . . . . . . . . . . . . . . . . . . . . . . . . . . . . . . . . . . . . . . . . . . . . . . . . . . (182) $13.73Forfeited/Cancelled . . . . . . . . . . . . . . . . . . . . . . . . . . . . . . . . . . . . . . . . . . . . . . . . . (111) $18.88
Non-vested at June 30, 2012 . . . . . . . . . . . . . . . . . . . . . . . . . . . . . . . . . . . . . . . . . 202 $13.66
Restricted Stock UnitsShares(000)
WeightedAverage
Grant DateFair Value
Non-vested at July 1, 2011 . . . . . . . . . . . . . . . . . . . . . . . . . . . . . . . . . . . . . . . . . . . — $ —Granted . . . . . . . . . . . . . . . . . . . . . . . . . . . . . . . . . . . . . . . . . . . . . . . . . . . . . . . . . . 98 $31.78Vested . . . . . . . . . . . . . . . . . . . . . . . . . . . . . . . . . . . . . . . . . . . . . . . . . . . . . . . . . . . — $ —Forfeited/Cancelled . . . . . . . . . . . . . . . . . . . . . . . . . . . . . . . . . . . . . . . . . . . . . . . . . — $ —
Non-vested at June 30, 2012 . . . . . . . . . . . . . . . . . . . . . . . . . . . . . . . . . . . . . . . . . 98 $31.78
NOTE 15. Fair Value Measurements
Accounting standards define fair value as the price that would be received to sell an asset orpaid to transfer a liability in the principal or most advantageous market for the asset or liability inan orderly transaction between market participants at the measurement date. The accountingstandards also have established a fair value hierarchy, which prioritizes the inputs to valuationtechniques used in measuring fair value into three broad levels as follows:
Level 1 — Quoted prices in active markets for identical assets or liabilities
Level 2 — Inputs, other than the quoted prices in active markets, that are observable eitherdirectly or indirectly
Level 3 — Unobservable inputs based on the Company’s own assumptions
At June 30, 2012 and 2011, the estimated fair value of the Company’s 7 3/8% Senior Noteswas as follows:
(Amounts in thousands)June 30,
2012June 30,
2011
7 3/8% Senior Notes due March 2021 (Level 2) . . . . . . . . . . . . . . . . . . . . . . . $271,875 $260,625
The Company determined the estimated fair value amounts by using available marketinformation and commonly accepted valuation methodologies. However, considerable judgment isrequired in interpreting market data to develop estimates of fair value, primarily due to the illiquidnature of the capital markets in which the 7 3/8% Senior Notes are traded. The use of differentassumptions and/or estimation methodologies may have a material effect on the estimated fairvalue.
The Company’s derivative assets and liabilities are currently composed of foreign currencycontracts. Fair values are based on market prices or determined using valuation models that use astheir basis readily observable market data that is actively quoted and can be validated throughexternal sources, including independent pricing services, brokers and market transactions.
93
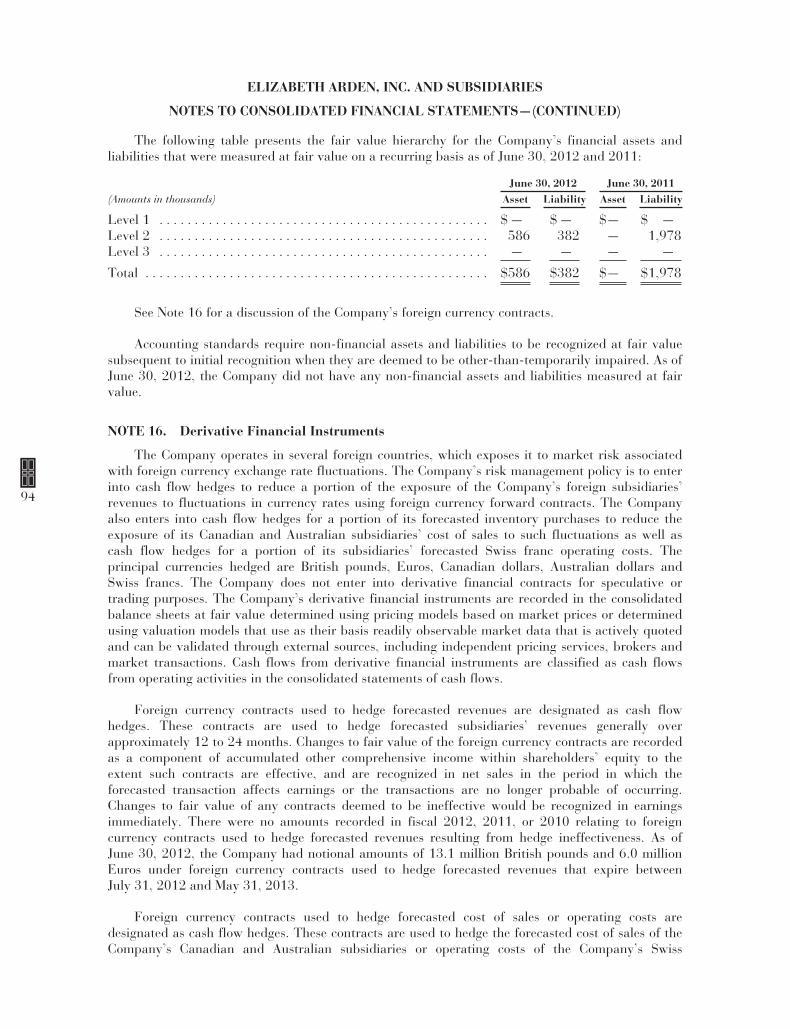
ELIZABETH ARDEN, INC. AND SUBSIDIARIES
NOTES TO CONSOLIDATED FINANCIAL STATEMENTS—(CONTINUED)
The following table presents the fair value hierarchy for the Company’s financial assets andliabilities that were measured at fair value on a recurring basis as of June 30, 2012 and 2011:
June 30, 2012 June 30, 2011(Amounts in thousands) Asset Liability Asset Liability
Level 1 . . . . . . . . . . . . . . . . . . . . . . . . . . . . . . . . . . . . . . . . . . . . . . . $ — $ — $— $ —Level 2 . . . . . . . . . . . . . . . . . . . . . . . . . . . . . . . . . . . . . . . . . . . . . . . 586 382 — 1,978Level 3 . . . . . . . . . . . . . . . . . . . . . . . . . . . . . . . . . . . . . . . . . . . . . . . — — — —
Total . . . . . . . . . . . . . . . . . . . . . . . . . . . . . . . . . . . . . . . . . . . . . . . . . $586 $382 $— $1,978
See Note 16 for a discussion of the Company’s foreign currency contracts.
Accounting standards require non-financial assets and liabilities to be recognized at fair valuesubsequent to initial recognition when they are deemed to be other-than-temporarily impaired. As ofJune 30, 2012, the Company did not have any non-financial assets and liabilities measured at fairvalue.
NOTE 16. Derivative Financial Instruments
The Company operates in several foreign countries, which exposes it to market risk associatedwith foreign currency exchange rate fluctuations. The Company’s risk management policy is to enterinto cash flow hedges to reduce a portion of the exposure of the Company’s foreign subsidiaries’revenues to fluctuations in currency rates using foreign currency forward contracts. The Companyalso enters into cash flow hedges for a portion of its forecasted inventory purchases to reduce theexposure of its Canadian and Australian subsidiaries’ cost of sales to such fluctuations as well ascash flow hedges for a portion of its subsidiaries’ forecasted Swiss franc operating costs. Theprincipal currencies hedged are British pounds, Euros, Canadian dollars, Australian dollars andSwiss francs. The Company does not enter into derivative financial contracts for speculative ortrading purposes. The Company’s derivative financial instruments are recorded in the consolidatedbalance sheets at fair value determined using pricing models based on market prices or determinedusing valuation models that use as their basis readily observable market data that is actively quotedand can be validated through external sources, including independent pricing services, brokers andmarket transactions. Cash flows from derivative financial instruments are classified as cash flowsfrom operating activities in the consolidated statements of cash flows.
Foreign currency contracts used to hedge forecasted revenues are designated as cash flowhedges. These contracts are used to hedge forecasted subsidiaries’ revenues generally overapproximately 12 to 24 months. Changes to fair value of the foreign currency contracts are recordedas a component of accumulated other comprehensive income within shareholders’ equity to theextent such contracts are effective, and are recognized in net sales in the period in which theforecasted transaction affects earnings or the transactions are no longer probable of occurring.Changes to fair value of any contracts deemed to be ineffective would be recognized in earningsimmediately. There were no amounts recorded in fiscal 2012, 2011, or 2010 relating to foreigncurrency contracts used to hedge forecasted revenues resulting from hedge ineffectiveness. As ofJune 30, 2012, the Company had notional amounts of 13.1 million British pounds and 6.0 millionEuros under foreign currency contracts used to hedge forecasted revenues that expire betweenJuly 31, 2012 and May 31, 2013.
Foreign currency contracts used to hedge forecasted cost of sales or operating costs aredesignated as cash flow hedges. These contracts are used to hedge the forecasted cost of sales of theCompany’s Canadian and Australian subsidiaries or operating costs of the Company’s Swiss
94
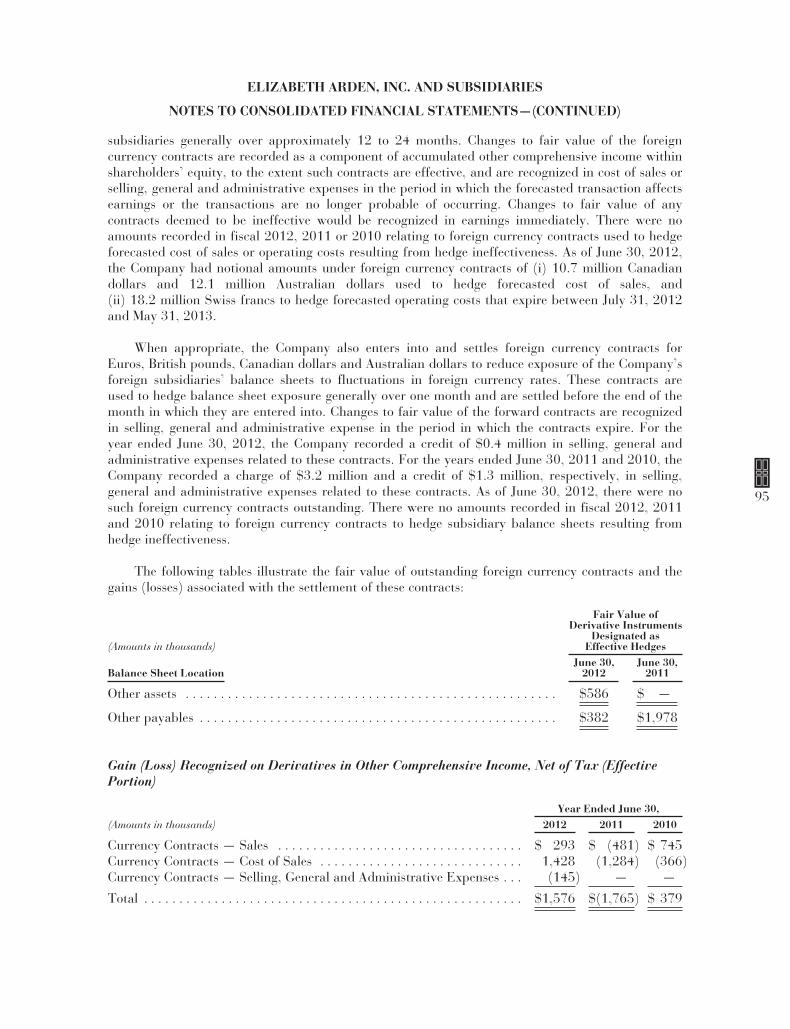
ELIZABETH ARDEN, INC. AND SUBSIDIARIES
NOTES TO CONSOLIDATED FINANCIAL STATEMENTS—(CONTINUED)
subsidiaries generally over approximately 12 to 24 months. Changes to fair value of the foreigncurrency contracts are recorded as a component of accumulated other comprehensive income withinshareholders’ equity, to the extent such contracts are effective, and are recognized in cost of sales orselling, general and administrative expenses in the period in which the forecasted transaction affectsearnings or the transactions are no longer probable of occurring. Changes to fair value of anycontracts deemed to be ineffective would be recognized in earnings immediately. There were noamounts recorded in fiscal 2012, 2011 or 2010 relating to foreign currency contracts used to hedgeforecasted cost of sales or operating costs resulting from hedge ineffectiveness. As of June 30, 2012,the Company had notional amounts under foreign currency contracts of (i) 10.7 million Canadiandollars and 12.1 million Australian dollars used to hedge forecasted cost of sales, and(ii) 18.2 million Swiss francs to hedge forecasted operating costs that expire between July 31, 2012and May 31, 2013.
When appropriate, the Company also enters into and settles foreign currency contracts forEuros, British pounds, Canadian dollars and Australian dollars to reduce exposure of the Company’sforeign subsidiaries’ balance sheets to fluctuations in foreign currency rates. These contracts areused to hedge balance sheet exposure generally over one month and are settled before the end of themonth in which they are entered into. Changes to fair value of the forward contracts are recognizedin selling, general and administrative expense in the period in which the contracts expire. For theyear ended June 30, 2012, the Company recorded a credit of $0.4 million in selling, general andadministrative expenses related to these contracts. For the years ended June 30, 2011 and 2010, theCompany recorded a charge of $3.2 million and a credit of $1.3 million, respectively, in selling,general and administrative expenses related to these contracts. As of June 30, 2012, there were nosuch foreign currency contracts outstanding. There were no amounts recorded in fiscal 2012, 2011and 2010 relating to foreign currency contracts to hedge subsidiary balance sheets resulting fromhedge ineffectiveness.
The following tables illustrate the fair value of outstanding foreign currency contracts and thegains (losses) associated with the settlement of these contracts:
(Amounts in thousands)
Fair Value ofDerivative Instruments
Designated asEffective Hedges
Balance Sheet LocationJune 30,
2012June 30,
2011
Other assets . . . . . . . . . . . . . . . . . . . . . . . . . . . . . . . . . . . . . . . . . . . . . . . . . . . . . $586 $ —
Other payables . . . . . . . . . . . . . . . . . . . . . . . . . . . . . . . . . . . . . . . . . . . . . . . . . . . $382 $1,978
Gain (Loss) Recognized on Derivatives in Other Comprehensive Income, Net of Tax (EffectivePortion)
Year Ended June 30,(Amounts in thousands) 2012 2011 2010
Currency Contracts — Sales . . . . . . . . . . . . . . . . . . . . . . . . . . . . . . . . . . . $ 293 $ (481) $ 745Currency Contracts — Cost of Sales . . . . . . . . . . . . . . . . . . . . . . . . . . . . . 1,428 (1,284) (366)Currency Contracts — Selling, General and Administrative Expenses . . . (145) — —
Total . . . . . . . . . . . . . . . . . . . . . . . . . . . . . . . . . . . . . . . . . . . . . . . . . . . . . . $1,576 $(1,765) $ 379
95
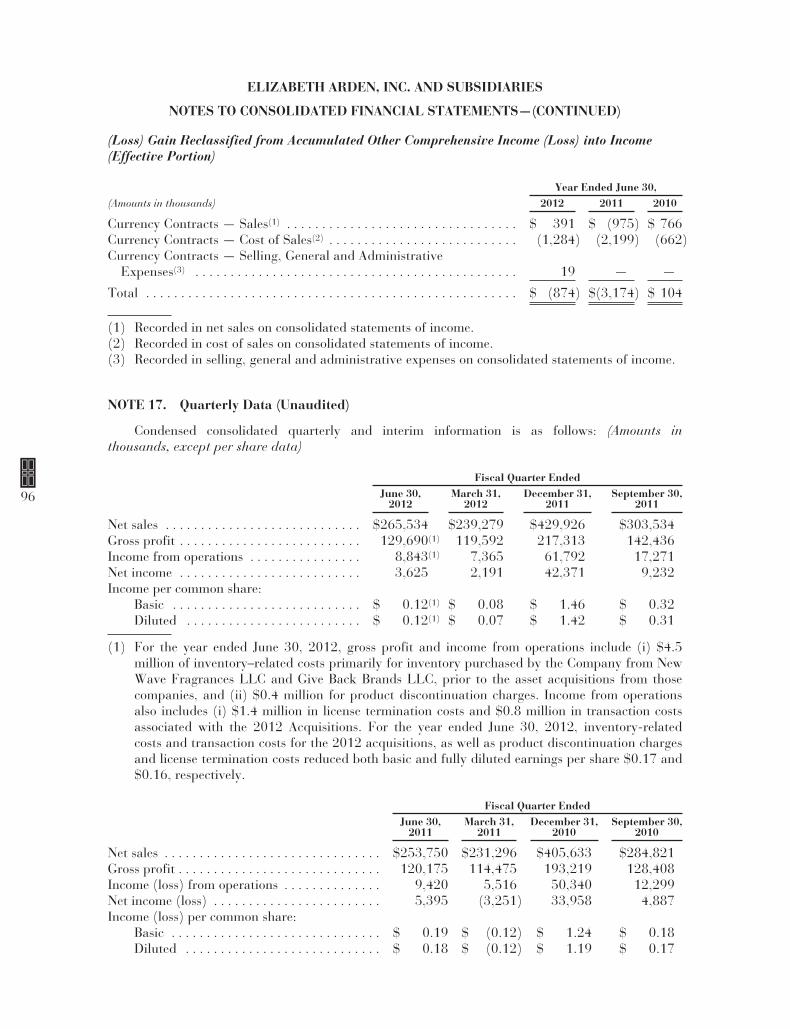
ELIZABETH ARDEN, INC. AND SUBSIDIARIES
NOTES TO CONSOLIDATED FINANCIAL STATEMENTS—(CONTINUED)
(Loss) Gain Reclassified from Accumulated Other Comprehensive Income (Loss) into Income(Effective Portion)
Year Ended June 30,(Amounts in thousands) 2012 2011 2010
Currency Contracts — Sales(1) . . . . . . . . . . . . . . . . . . . . . . . . . . . . . . . . . $ 391 $ (975) $ 766Currency Contracts — Cost of Sales(2) . . . . . . . . . . . . . . . . . . . . . . . . . . . (1,284) (2,199) (662)Currency Contracts — Selling, General and Administrative
Expenses(3) . . . . . . . . . . . . . . . . . . . . . . . . . . . . . . . . . . . . . . . . . . . . . . 19 — —
Total . . . . . . . . . . . . . . . . . . . . . . . . . . . . . . . . . . . . . . . . . . . . . . . . . . . . . $ (874) $(3,174) $ 104
(1) Recorded in net sales on consolidated statements of income.(2) Recorded in cost of sales on consolidated statements of income.(3) Recorded in selling, general and administrative expenses on consolidated statements of income.
NOTE 17. Quarterly Data (Unaudited)
Condensed consolidated quarterly and interim information is as follows: (Amounts inthousands, except per share data)
Fiscal Quarter EndedJune 30,
2012March 31,
2012December 31,
2011September 30,
2011
Net sales . . . . . . . . . . . . . . . . . . . . . . . . . . . . $265,534 $239,279 $429,926 $303,534Gross profit . . . . . . . . . . . . . . . . . . . . . . . . . . 129,690(1) 119,592 217,313 142,436Income from operations . . . . . . . . . . . . . . . . 8,843(1) 7,365 61,792 17,271Net income . . . . . . . . . . . . . . . . . . . . . . . . . . 3,625 2,191 42,371 9,232Income per common share:
Basic . . . . . . . . . . . . . . . . . . . . . . . . . . . $ 0.12(1) $ 0.08 $ 1.46 $ 0.32Diluted . . . . . . . . . . . . . . . . . . . . . . . . . $ 0.12(1) $ 0.07 $ 1.42 $ 0.31
(1) For the year ended June 30, 2012, gross profit and income from operations include (i) $4.5million of inventory–related costs primarily for inventory purchased by the Company from NewWave Fragrances LLC and Give Back Brands LLC, prior to the asset acquisitions from thosecompanies, and (ii) $0.4 million for product discontinuation charges. Income from operationsalso includes (i) $1.4 million in license termination costs and $0.8 million in transaction costsassociated with the 2012 Acquisitions. For the year ended June 30, 2012, inventory-relatedcosts and transaction costs for the 2012 acquisitions, as well as product discontinuation chargesand license termination costs reduced both basic and fully diluted earnings per share $0.17 and$0.16, respectively.
Fiscal Quarter EndedJune 30,
2011March 31,
2011December 31,
2010September 30,
2010
Net sales . . . . . . . . . . . . . . . . . . . . . . . . . . . . . . . $253,750 $231,296 $405,633 $284,821Gross profit . . . . . . . . . . . . . . . . . . . . . . . . . . . . . 120,175 114,475 193,219 128,408Income (loss) from operations . . . . . . . . . . . . . . 9,420 5,516 50,340 12,299Net income (loss) . . . . . . . . . . . . . . . . . . . . . . . . 5,395 (3,251) 33,958 4,887Income (loss) per common share:
Basic . . . . . . . . . . . . . . . . . . . . . . . . . . . . . . $ 0.19 $ (0.12) $ 1.24 $ 0.18Diluted . . . . . . . . . . . . . . . . . . . . . . . . . . . . $ 0.18 $ (0.12) $ 1.19 $ 0.17
96
ELIZABETH ARDEN, INC. AND SUBSIDIARIES
NOTES TO CONSOLIDATED FINANCIAL STATEMENTS—(CONTINUED)
NOTE 18. Segment Data And Related Information
Reportable operating segments, as defined by Codification Topic 280, Segment Reporting,include components of an enterprise about which separate financial information is available that isevaluated regularly by the chief operating decision maker (the “Chief Executive”) in deciding how toallocate resources and in assessing performance. As a result of the similarities in the procurement,marketing and distribution processes for all of the Company’s products, much of the informationprovided in the consolidated financial statements is similar to, or the same as, that reviewed on aregular basis by the Chief Executive.
At June 30, 2012, the Company’s operations are organized into the following two operatingsegments, which also comprise the Company’s reportable segments:
• North America — The North America segment sells the Company’s portfolio of owned,licensed and distributed brands, including the Elizabeth Arden products, to departmentstores, mass retailers and distributors in the United States, Canada and Puerto Rico, andalso includes the Company’s direct to consumer business, which is composed of theElizabeth Arden branded retail outlet stores and the Company’s global e-commercebusiness. This segment also sells the Elizabeth Arden products through the Red Doorbeauty salons, which are owned and operated by an unrelated third party that licenses theElizabeth Arden and Red Door trademarks from the Company for use in its salons.
• International — The International segment sells the Company’s portfolio of owned andlicensed brands, including the Elizabeth Arden products, in approximately 120 countriesoutside of North America to perfumeries, boutiques, department stores, travel retail outletsand distributors.
In light of the repositioning of the Elizabeth Arden brand and the target for completing theinitial roll-out of the repositioning by early October 2012, commencing with the first quarter offiscal 2013, the Company will disclose financial information relating to the following categories: theElizabeth Arden Brand (skin care, cosmetics and fragrances) and Celebrity, Lifestyle, Designer andOther Fragrances, in addition to its current segment reporting.
The Chief Executive evaluates segment profit based upon operating income, which representsearnings before income taxes, interest expense and depreciation and amortization charges. Theaccounting policies for each of the reportable segments are the same as those described in Note 1 —“General Information and Summary of Significant Accounting Policies.” The assets and liabilities ofthe Company are managed centrally and are reported internally in the same manner as theconsolidated financial statements; thus, no additional information regarding assets and liabilities ofthe Company’s operating segments is produced for the Chief Executive or included herein.
Segment profit excludes depreciation and amortization, interest expense, debt extinguishmentcharges, consolidation and elimination adjustments and unallocated corporate expenses, which areshown in the table reconciling segment profit to consolidated income before income taxes. Includedin unallocated corporate expenses are (i) restructuring charges that are related to an announcedplan, (ii) costs related to the Initiative, which was substantially completed in fiscal 2011,(iii) restructuring costs for corporate operations, and (iv) acquisition-related costs. These expensesare recorded in unallocated corporate expenses as these items are centrally directed and controlledand are not included in internal measures of segment operating performance. The Company does nothave any intersegment sales.
97
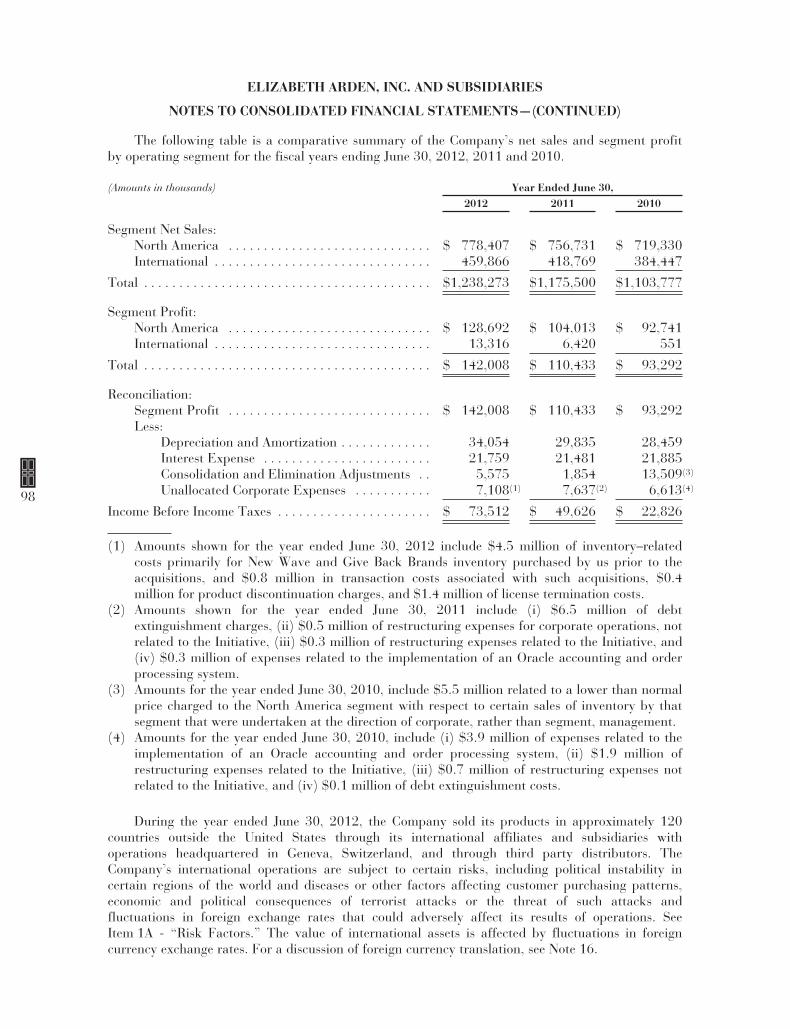
ELIZABETH ARDEN, INC. AND SUBSIDIARIES
NOTES TO CONSOLIDATED FINANCIAL STATEMENTS—(CONTINUED)
The following table is a comparative summary of the Company’s net sales and segment profitby operating segment for the fiscal years ending June 30, 2012, 2011 and 2010.
(Amounts in thousands) Year Ended June 30,2012 2011 2010
Segment Net Sales:North America . . . . . . . . . . . . . . . . . . . . . . . . . . . . . $ 778,407 $ 756,731 $ 719,330International . . . . . . . . . . . . . . . . . . . . . . . . . . . . . . . 459,866 418,769 384,447
Total . . . . . . . . . . . . . . . . . . . . . . . . . . . . . . . . . . . . . . . . . $1,238,273 $1,175,500 $1,103,777
Segment Profit:North America . . . . . . . . . . . . . . . . . . . . . . . . . . . . . $ 128,692 $ 104,013 $ 92,741International . . . . . . . . . . . . . . . . . . . . . . . . . . . . . . . 13,316 6,420 551
Total . . . . . . . . . . . . . . . . . . . . . . . . . . . . . . . . . . . . . . . . . $ 142,008 $ 110,433 $ 93,292
Reconciliation:Segment Profit . . . . . . . . . . . . . . . . . . . . . . . . . . . . . $ 142,008 $ 110,433 $ 93,292Less:
Depreciation and Amortization . . . . . . . . . . . . . 34,054 29,835 28,459Interest Expense . . . . . . . . . . . . . . . . . . . . . . . . 21,759 21,481 21,885Consolidation and Elimination Adjustments . . 5,575 1,854 13,509(3)
Unallocated Corporate Expenses . . . . . . . . . . . 7,108(1) 7,637(2) 6,613(4)
Income Before Income Taxes . . . . . . . . . . . . . . . . . . . . . . $ 73,512 $ 49,626 $ 22,826
(1) Amounts shown for the year ended June 30, 2012 include $4.5 million of inventory–relatedcosts primarily for New Wave and Give Back Brands inventory purchased by us prior to theacquisitions, and $0.8 million in transaction costs associated with such acquisitions, $0.4million for product discontinuation charges, and $1.4 million of license termination costs.
(2) Amounts shown for the year ended June 30, 2011 include (i) $6.5 million of debtextinguishment charges, (ii) $0.5 million of restructuring expenses for corporate operations, notrelated to the Initiative, (iii) $0.3 million of restructuring expenses related to the Initiative, and(iv) $0.3 million of expenses related to the implementation of an Oracle accounting and orderprocessing system.
(3) Amounts for the year ended June 30, 2010, include $5.5 million related to a lower than normalprice charged to the North America segment with respect to certain sales of inventory by thatsegment that were undertaken at the direction of corporate, rather than segment, management.
(4) Amounts for the year ended June 30, 2010, include (i) $3.9 million of expenses related to theimplementation of an Oracle accounting and order processing system, (ii) $1.9 million ofrestructuring expenses related to the Initiative, (iii) $0.7 million of restructuring expenses notrelated to the Initiative, and (iv) $0.1 million of debt extinguishment costs.
During the year ended June 30, 2012, the Company sold its products in approximately 120countries outside the United States through its international affiliates and subsidiaries withoperations headquartered in Geneva, Switzerland, and through third party distributors. TheCompany’s international operations are subject to certain risks, including political instability incertain regions of the world and diseases or other factors affecting customer purchasing patterns,economic and political consequences of terrorist attacks or the threat of such attacks andfluctuations in foreign exchange rates that could adversely affect its results of operations. SeeItem 1A - “Risk Factors.” The value of international assets is affected by fluctuations in foreigncurrency exchange rates. For a discussion of foreign currency translation, see Note 16.
98
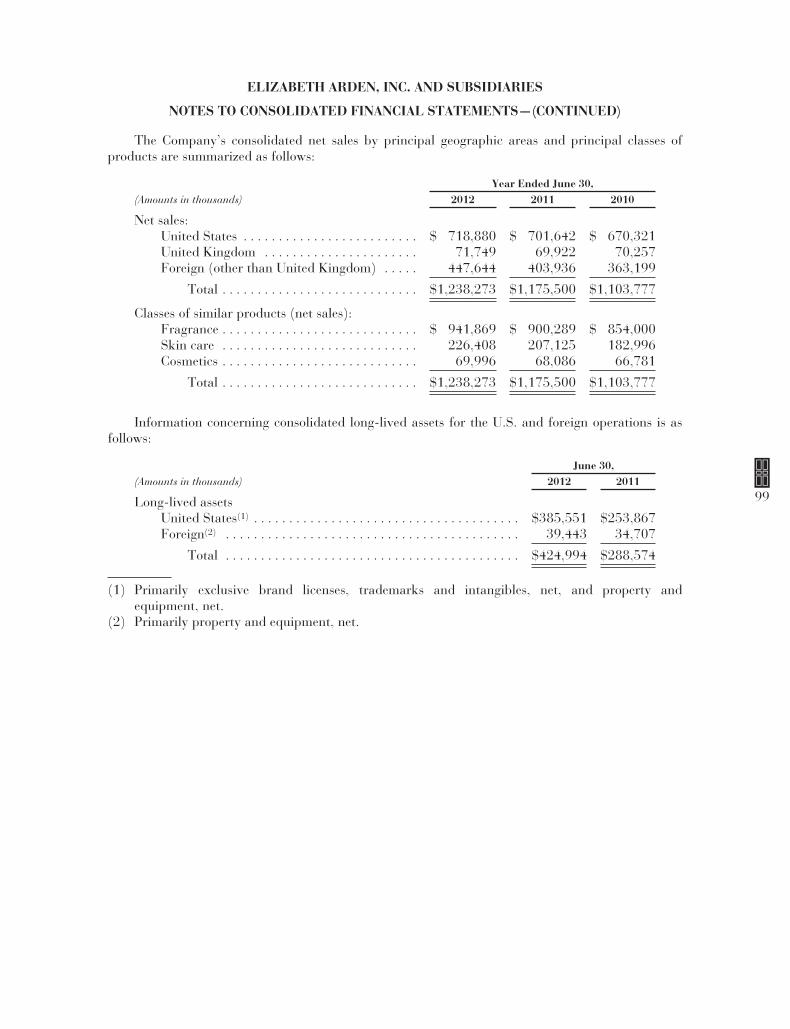
ELIZABETH ARDEN, INC. AND SUBSIDIARIES
NOTES TO CONSOLIDATED FINANCIAL STATEMENTS—(CONTINUED)
The Company’s consolidated net sales by principal geographic areas and principal classes ofproducts are summarized as follows:
Year Ended June 30,(Amounts in thousands) 2012 2011 2010
Net sales:United States . . . . . . . . . . . . . . . . . . . . . . . . . $ 718,880 $ 701,642 $ 670,321United Kingdom . . . . . . . . . . . . . . . . . . . . . . 71,749 69,922 70,257Foreign (other than United Kingdom) . . . . . 447,644 403,936 363,199
Total . . . . . . . . . . . . . . . . . . . . . . . . . . . . $1,238,273 $1,175,500 $1,103,777
Classes of similar products (net sales):Fragrance . . . . . . . . . . . . . . . . . . . . . . . . . . . . $ 941,869 $ 900,289 $ 854,000Skin care . . . . . . . . . . . . . . . . . . . . . . . . . . . . 226,408 207,125 182,996Cosmetics . . . . . . . . . . . . . . . . . . . . . . . . . . . . 69,996 68,086 66,781
Total . . . . . . . . . . . . . . . . . . . . . . . . . . . . $1,238,273 $1,175,500 $1,103,777
Information concerning consolidated long-lived assets for the U.S. and foreign operations is asfollows:
June 30,(Amounts in thousands) 2012 2011
Long-lived assetsUnited States(1) . . . . . . . . . . . . . . . . . . . . . . . . . . . . . . . . . . . . . . $385,551 $253,867Foreign(2) . . . . . . . . . . . . . . . . . . . . . . . . . . . . . . . . . . . . . . . . . . 39,443 34,707
Total . . . . . . . . . . . . . . . . . . . . . . . . . . . . . . . . . . . . . . . . . . $424,994 $288,574
(1) Primarily exclusive brand licenses, trademarks and intangibles, net, and property andequipment, net.
(2) Primarily property and equipment, net.
99
ITEM 9. CHANGES IN AND DISAGREEMENTS WITH ACCOUNTANTS ON ACCOUNTINGAND FINANCIAL DISCLOSURE
None.
ITEM 9A. CONTROLS AND PROCEDURES
Our Chairman, President and Chief Executive Officer, and our Executive Vice President andChief Financial Officer, who are the principal executive officer and principal financial officer,respectively, have evaluated the effectiveness and operation of our disclosure controls andprocedures (as defined in Rules 13a-15(e) and 15d-15(e) of the Securities Exchange Act of 1934, asamended), as of the end of the period covered by this annual report (the “Evaluation Date”). Basedupon such evaluation, they have concluded that, as of the Evaluation Date, our disclosure controlsand procedures are functioning effectively.
There have been no changes in our internal control over financial reporting during our mostrecent fiscal quarter that have materially affected, or are likely to materially affect, our internalcontrol over financial reporting.
Management’s report on our internal control over financial reporting (as such term is defined inRules 13a-15(f) and 15d-15(f) under the Exchange Act), is included in our Financial Statements inItem 8 under the heading Report of Management — Report on Internal Control Over FinancialReporting and is hereby incorporated by reference. The related report of our independent registeredpublic accounting firm is also included in our Financial Statements in Item 8 under the headingReport of Independent Registered Public Accounting Firm.
ITEM 9B. OTHER INFORMATION
Second Lien Term Loan
In connection with the 2012 Acquisitions and to take advantage of favorable interest rates andprovide us with additional financial flexibility, on June 12, 2012, we entered into a second liencredit agreement with JP Morgan Chase Bank, N.A. providing us with the ability to borrow up to$30 million on or prior to July 2, 2012.
On July 2, 2012, we borrowed $30 million under the second lien term loan and used theproceeds to repay amounts under the credit facility. The second lien term loan is collateralized by asecond priority lien on all of our U.S. accounts receivable and inventories, and the interest onborrowings charged under this second lien term loan is either LIBOR plus an applicable margin of3.75% or the base rate specified in the second lien term loan (which is comparable to prime rates)plus a margin of 2.75%. The second lien term loan matures on July 2, 2014, but we have the optionto prepay all or a portion of the term loan anytime on or after February 1, 2013, provided theborrowing availability under the credit facility is in excess of $35 million after giving effect to theapplicable prepayment each day for the 30 day period ending on the date of the prepayment. JPMorgan Chase Bank, N.A. is the administrative agent and a lender under our credit facility.
Extension of Common Stock Repurchase Program
On August 7, 2012, our board of directors approved an extension of our common stockrepurchase program through November 30, 2014. Our common stock repurchase program was set toexpire on November 30, 2012. Under the common stock repurchase program, we may, from time totime, purchase shares of our common stock, $.01 par value per share in the open market or inprivately negotiated transactions based on such factors as we deem appropriate, including anylimitations under our debt agreements. As of June 30, 2012, we had repurchased 4,029,201 sharesof common stock on the open market under the stock repurchase program since its inception inNovember 2005, at an average price of $16.63 per share and at a cost of approximately $67.0million, including sales commissions, leaving approximately $53.0 million available for additionalrepurchases under the program.
100
PART III
ITEM 10. DIRECTORS, EXECUTIVE OFFICERS AND CORPORATE GOVERNANCE
We have adopted a Supplemental Code of Ethics for the Directors and Executive and FinanceOfficers that applies to our directors, our chief executive officer, our chief financial officer, and ourother executive officers and finance officers. The full text of this Code of Ethics, as approved by ourboard of directors, is published on our website, at www.elizabetharden.com, under the section“Corporate-Investor Relations — Corporate Governance — Code of Ethics.” We intend to disclosefuture amendments to and waivers of the provisions of this Code of Ethics on our website.
The other information required by this item will be contained in the Company’s ProxyStatement relating to the 2012 Annual Meeting of Shareholders to be filed within 120 days after theend of our fiscal year ended June 30, 2012 (the proxy statement) and is incorporated herein by thisreference or is included in Part I under “Executive Officers of the Company.”
ITEM 11. EXECUTIVE COMPENSATION
The information required by this item will be contained in the proxy statement and isincorporated herein by this reference.
ITEM 12. SECURITY OWNERSHIP OF CERTAIN BENEFICIAL OWNERS ANDMANAGEMENT AND RELATED STOCKHOLDER MATTERS
The information required by this item will be contained in the proxy statement and isincorporated herein by this reference.
ITEM 13. CERTAIN RELATIONSHIPS AND RELATED TRANSACTIONS, AND DIRECTORINDEPENDENCE
The information required by this item will be contained in the proxy statement and isincorporated herein by this reference.
ITEM 14. PRINCIPAL ACCOUNTING FEES AND SERVICES
The information required by this item will be contained in the proxy statement and isincorporated herein by this reference.
PART IV
ITEM 15 EXHIBITS, FINANCIAL STATEMENT SCHEDULES
(a) 1. Financial Statements —
The consolidated financial statements, Report of Management and Report of IndependentRegistered Public Accounting Firm are listed in the “Index to Financial Statements andSchedules” on page 43 and included on pages 44 through 51.
2. Financial Statement Schedules —
All schedules for which provision is made in the applicable accounting regulations of theSecurities and Exchange Commission (the “Commission”) are either not required under therelated instructions, are not applicable (and therefore have been omitted), or the requireddisclosures are contained in the financial statements included herein.
3. Exhibits (including those incorporated by reference).
101
ExhibitNumber Description
3.1 Amended and Restated Articles of Incorporation of the Company dated November 17,2005 (incorporated herein by reference to Exhibit 3.1 filed as part of the Company’sForm 10-Q for the quarter ended December 31, 2005 (Commission File No. 1-6370)).
3.2 Amended and Restated By-laws of the Company (incorporated herein by reference toExhibit 3.1 filed as part of the Company’s Form 8-K dated October 27, 2009(Commission File No. 1-6370)).
4.1 Indenture, dated as of January 21, 2011, respecting Elizabeth Arden, Inc.’s 73⁄8%Senior Notes due 2021, among Elizabeth Arden, Inc. and U.S. Bank NationalAssociation, as trustee (incorporated herein by reference to Exhibit 4.1 to theCompany’s Form 8-K dated January 21, 2011 (Commission File No. 1-6370)).
10.1 Third Amended and Restated Credit Agreement, dated as of January 21, 2011, amongElizabeth Arden, Inc., as borrower, JPMorgan Chase Bank, N.A., as administrativeagent, Bank of America, N.A., as collateral agent and syndication agent, Wells FargoCapital Finance, LLC, HSBC Bank USA, N.A. and U.S. Bank National Association, asco-documentation agents, JPMorgan Chase Bank, N.A., and Bank of America, N.A. asjoint lead arrangers, and the other lenders party thereto (incorporated herein byreference to Exhibit 10.1 filed as part of the Company’s Form 8-K dated January 21,2011 (Commission File No. 1-6370)).
10.2 Amended and Restated Security Agreement dated as of January 29, 2001, made by theCompany and certain of its subsidiaries in favor of Fleet National Bank (n/k/a Bank ofAmerica, N.A.), as administrative agent (incorporated herein by reference to Exhibit4.5 filed as part of the Company’s Form 8-K dated January 23, 2001 (Commission FileNo. 1-6370)).
10.3* First Amendment to Third Amended and Restated Credit Agreement dated as ofJune 12, 2012, among Elizabeth Arden, Inc., as Borrower, JPMorgan Chase Bank,N.A., as the administrative agent, Bank of America, N.A., as the collateral agent, andthe other banks party thereto.
10.4* Credit Agreement (Second Lien) dated as of June 12, 2012, between Elizabeth Arden,Inc. and JPMorgan Chase Bank, N.A.
10.5 Amended and Restated Deed of Lease dated as of January 17, 2003, between theCompany and Liberty Property Limited Partnership (incorporated herein by referencedto Exhibit 10.5 filed as a part of the Company’s Form 10-Q for the quarter endedApril 26, 2003 (Commission File No. 1-6370)).
10.6* Amendment to the Amended and Restated Deed of Lease dated as of June 30, 2012,between the Company and Liberty Property Limited Partnership.
10.7+ 2004 Stock Incentive Plan, as amended and restated (incorporated herein by referenceto Exhibit 10.12 filed as part of the Company’s Form 10-Q for the quarter endedDecember 31, 2007 (Commission File No. 1-6370)).
10.8+ 2004 Non-Employee Director Stock Option Plan, as amended (incorporated herein byreference to Exhibit 10.2 filed as part of the Company’s Form 10-Q for the quarterended September 30, 2006 (Commission File No. 1-6370)).
10.9+ 2000 Stock Incentive Plan, as amended (incorporated herein by reference to Exhibit10.14 filed as part of the Company’s Form 10-Q for the quarter ended December 31,2007 (Commission File No. 1-6370)).
10.10+ 1995 Stock Option Plan, as amended (incorporated herein by reference to Exhibit 10.4filed as part of the Company’s Form 10-Q for the quarter ended September 30, 2006(Commission File No. 1-6370)).
102
ExhibitNumber Description
10.11+ 2011 Employee Stock Purchase Plan (incorporated herein by reference to Exhibit 4.3filed as part of the Company’s Form S-8, Registration No. 333-177839, datedNovember 9, 2011 (Commission File No. 1-6370)).
10.12+ Non-Employee Director Stock Option Plan, as amended (incorporated herein byreference to Exhibit 10.6 filed as part of the Company’s Form 10-Q for the quarterended September 30, 2006 (Commission File No. 1-6370)).
10.13+ Form of Nonqualified Stock Option Agreement for stock option awards under theCompany’s Non-Employee Director Stock Option Plan (incorporated herein byreference to Exhibit 10.8 filed as a part of the Company’s Form 10-Q for the quarterended March 31, 2005 (Commission File No. 1-6370)).
10.14+ Form of Incentive Stock Option Agreement for stock option awards under theCompany’s 1995 Stock Option Plan (incorporated herein by reference to Exhibit 10.9filed as a part of the Company’s Form 10-Q for the quarter ended March 31, 2005(Commission File No. 1-6370)).
10.15+ Form of Nonqualified Stock Option Agreement for stock option awards under theCompany’s 1995 Stock Option Plan (incorporated herein by reference to Exhibit 10.10filed as a part of the Company’s Form 10-Q for the quarter ended March 31, 2005(Commission File No. 1-6370)).
10.16+ Form of Stock Option Agreement for stock option awards under the Company’s 2000Stock Incentive Plan (incorporated herein by reference to Exhibit 10.11 filed as a partof the Company’s Form 10-Q for the quarter ended March 31, 2005 (Commission FileNo. 1-6370)).
10.17+ Form of Stock Option Agreement for stock option awards under the Company’s 2004Non-Employee Director Stock Option Plan (incorporated herein by reference to Exhibit10.14 filed as a part of the Company’s Form 10-Q for the quarter ended March 31,2005 (Commission File No. 1-6370)).
10.18+ Form of Stock Option Agreement for stock option awards under the Company’s 2004Stock Incentive Plan (incorporated herein by reference to Exhibit 10.19 filed as a partof the Company’s Form 10-K for the year ended June 30, 2005 (Commission File No.1-6370)).
10.19+ Form of Restricted Stock Agreement for the restricted stock awards under theCompany’s 2004 Stock Incentive Plan (incorporated herein by reference to Exhibit10.20 filed as a part of the Company’s Form 10-K for the year ended June 30, 2005(Commission File No. 1-6370)).
10.20+ Elizabeth Arden, Inc. Severance Policy, as amended and restated on May 4, 2010(incorporated herein by reference to Exhibit 10.31 filed as part of the Company’s Form10-Q for the quarter ended March 31, 2010 (Commission File No. 1-6370)).
10.21+ Form of Restricted Stock Agreement for service-based restricted stock awards (three-year vesting period) under the Company’s 2000 Stock Incentive Plan (incorporatedherein by reference to Exhibit 10.32 filed as part of the Company’s Form 10-K for theyear ended June 30, 2007 (Commission File No. 1-6370)).
10.22+ Form of Indemnification Agreement for Directors and Officers of Elizabeth Arden, Inc.(incorporated by reference to Exhibit 10.1 filed as part of the Company’s Form 8-Kdated August 11, 2009 (Commission File No. 1-6370)).
10.23+ Elizabeth Arden Inc. 2010 Stock Award and Incentive Plan (incorporated by referenceto Exhibit 4.3 filed as part of the Company’s Form S-8, Registration No. 333-170287,filed on November 2, 2010 (Commission File No. 1-6370)).
103
ExhibitNumber Description
10.24+ Form of Restricted Stock Agreement for service-based stock awards under theCompany’s 2010 Stock Award and Incentive Plan (incorporated herein by reference toExhibit 10.35 filed as part of the Company’s Form 10-Q for the quarter endedSeptember 30, 2010 (Commission File No. 1-6370)).
10.25+ Form of Restricted Stock Unit Agreement for restricted stock unit awards under theCompany’s 2010 Stock Award and Incentive Plan (incorporated herein by reference toExhibit 10.22 filed as part of the Company’s Form 10-Q for the quarter endedSeptember 30, 2011 (Commission File No. 1-6370)).
12.1* Ratio of earnings to fixed charges.
21.1* Subsidiaries of the Registrant.
23.1* Consent of PricewaterhouseCoopers LLP.
24.1* Power of Attorney (included as part of signature page).
31.1* Section 302 Certification of Chief Executive Officer.
31.2* Section 302 Certification of Chief Financial Officer.
32* Section 906 Certifications of the Chief Executive Officer and the Chief FinancialOfficer.
101.INS** XBRL Instance Document
101.SCH** XBRL Taxonomy Extension Schema Document
101.CAL** XBRL Taxonomy Extension Calculation Linkbase Document
101.DEF** XBRL Taxonomy Extension Definition Linkbase Document
101.LAB** XBRL Taxonomy Extension Label Linkbase Document
101.PRE** XBRL Taxonomy Extension Presentation Linkbase Document
+ Management contract or compensatory plan or arrangement.* Filed herewith.** Filed herewith as Exhibit 101 are the following documents formatted in XBRL (Extensible
Business Reporting Language): (i) audited consolidated balance sheets as of June 30, 2012 andJune 30, 2011, (ii) audited consolidated statements of income for the fiscal years endedJune 30, 2012, 2011 and 2010, respectively, (iii) audited consolidated statements of cash flowsfor the fiscal years ended June 30, 2012, 2011 and 2010, respectively and (iv) the notes to theaudited condensed consolidated financial statements. Pursuant to Rule 406T of Regulation S-T,these interactive data files are deemed not filed or part of a registration statement or prospectusfor purposes of Sections 11 or 12 of the Securities Act of 1933 or Section 18 of the SecuritiesExchange Act of 1934 and otherwise are not subject to liability.
The exhibits to this annual report are listed in the Exhibit Index located on pages 101 - 104.Elizabeth Arden, Inc. will furnish any or all of these exhibits upon the payment of $.10 per page($5.00 minimum). Any request for exhibits should be addressed to Investor Relations, ElizabethArden, Inc., 200 Park Avenue South, New York, NY 10003; should specify which exhibits aredesired; should state that the person making such request was a shareholder on September 12, 2012and should be accompanied by a remittance payable to Elizabeth Arden, Inc. in the minimumamount of $5.00. Elizabeth Arden, Inc. will bill for any additional charge.
104

CORPORATE AND INVESTOR INFORMATIONDIRECTORS
E. Scott BeattieChairman, President andChief Executive OfficerElizabeth Arden, Inc.
A. Salman Amin(2)
Executive Vice PresidentSales & MarketingPepsiCo
Fred Berens(1, Chairperson) (2, Chairperson)
Managing Director - InvestmentsWells Fargo Advisors LLC
Maura J. Clark(1,3)
President, Direct Energy BusinessDirect Energy Services, LLC
Richard C.W. Mauran(3, Chairperson)
Private Investor
William M. Tatham(1,2)
Chief Executive OfficerNexJ Systems, Inc.
J. W. Nevil Thomas(1,3)
President and Chief Executive OfficerNevcorp, Inc.
(1) Audit Committee(2) Compensation Committee(3) Nominating and Corporate Governance Committee
ANNUAL MEETINGOur annual meeting of shareholders will be held onNovember 7, 2012 at 10:00 a.m. local time at our Floridaoffices located at 2400 SW 145 Avenue, Miramar,Florida 33027.
CORPORATE OFFICES
2400 SW 145 AvenueMiramar, Florida 33027954-364-6900
200 Park Avenue SouthNew York, New York 10003212-261-1000
200 First Stamford PlaceStamford, Connecticut 06902203-462-5700
28, chemin de Joinville1216 Cointrin-Geneva41-22-791-8711
COMMON STOCK INFORMATIONOur common stock is traded on the Nasdaq GlobalSelect Market under the symbol “RDEN.”
INVESTOR RELATIONSFor investor information, including filings with theSecurities and Exchange Commission and otherfinancial literature, please visit our website atwww.elizabetharden.com or write to us at:Elizabeth Arden, Inc.Investor Relations200 Park Avenue SouthNew York, New York 10003
TRANSFER AGENT AND REGISTRARAmerican Stock Transfer and Trust Company6201 15th AvenueBrooklyn, New York 11219800-937-5449
INDEPENDENT REGISTERED PUBLICACCOUNTING FIRMPricewaterhouseCoopers LLP300 Madison AvenueNew York, New York 10017
105


See t h e newEl i zabe t h Arden