sediment transport and hydrodynamic parameters of tsunami waves recorded in onshore geoarchives
TRANSCRIPT

Sediment Transport and Hydrodynamic Parameters ofTsunami Waves Recorded in Onshore Geoarchives
Dominik Brill†*, Anna Pint†, Kruawun Jankaew‡, Peter Frenzel§, Klaus Schwarzer††,Andreas Vott‡‡, and Helmut Bruckner†
†Institute of GeographyUniversitat zu KolnD-50923 Koln, Germany
‡Department of GeologyFaculty of ScienceChulalongkorn University Bangkok10330 Thailand
§Institute of Earth SciencesFriedrich-Schiller-Universitat JenaD-07749 Jena, Germany
††Institute of GeosciencesCoastal and Continental Shelf ResearchChristian-Albrecht-Universitat zu KielD-24118 Kiel, Germany
‡‡Institute for GeographyJohannes Gutenberg-Universitat MainzD-55099 Mainz, Germany
ABSTRACT
Brill, D.; Pint, A.; Jankaew, K.; Frenzel, P.; Schwarzer, K.; Vott, A., and Bruckner, H., 0000. Sediment transport andhydrodynamic parameters of tsunami waves recorded in onshore geoarchives. Journal of Coastal Research, 00(0), 000–000. Coconut Creek (Florida), ISSN 0749-0208.
In regions with a short historical tsunami record, the assessment of long-term tsunami risk strongly depends ongeological evidence of prehistoric events. Whereas dating tsunami deposits is already well established, magnitudeassessment based on remaining sedimentary structures is still a major challenge. In this study, two approaches wereapplied to deduce transport processes and hydrodynamic parameters of tsunami events from onshore deposits found inthe coastal plain of Ban Bang Sak, SW Thailand: (1) The maximum offshore sediment source was determined usinggranulometry, geochemistry, mineralogy and foraminifera of the tsunamites, and reference samples from various marineand terrestrial environments, and (2) the onshore flow velocities and flow depths of associated tsunami waves wereestimated by means of sedimentation modelling. In the case of the Indian Ocean tsunami (IOT) of 2004, modelled flowvelocities of 3.7 to 4.9 m/s, modelled onshore flow depths of up to 5.5 m, and a sediment source from offshore areasshallower than a 45-m water depth—including littoral sediments transported as bedload and suspended load from theshallow subtidal zone—are in agreement with quotations based on survivor videos and posttsunami surveys. For a 500-to 700-year-old predecessor, comparable flow velocities and flow depths of 4.1 to 5.9 m/s and 4.0 to 7.5 m, respectively,were modelled, indicating a similar magnitude as the IOT 2004. Comparable values of maximum transport distance anddepth of wave erosion were also found. In the case of three older tsunami candidates, dated to 1180 to 2000 cal BP, thedeposits indicate partly similar source areas with water depths of less than 45 m and partly shallower source areasrestricted solely to the beach. Whereas the former tsunamis are interpreted as events similar to 2004, the latter are morelikely storms or tsunamis of a lower magnitude.
ADDITIONAL INDEX WORDS: Tsunami deposit, foraminifera, Holocene, Indian Ocean, extreme wave events, inversemodelling, Thailand.
INTRODUCTIONDue to the continuous recording of tide gauges and satellites,
the observations and videos of eye witnesses, and contemporary
posttsunami field surveys, modern tsunamis are excellently
documented in terms of their triggering events, chronological
sequence, wave parameters, and impact on coastal communi-
ties and infrastructure; this includes the Indian Ocean tsunami
(IOT) of 2004 (Liu et al., 2005). Considerably less information is
available for historical tsunamis, although at least the time of
impact (year, day, or both) is known and rough information
about wave heights and intensities exist (e.g., 1755 Lisbon
tsunami; Dawson et al., 1995). In the case of prehistoric
tsunami events, in contrast, all information has to be drawn
from the geological record.
Thus, the three main goals in studying prehistoric tsunami
deposits are (1) the confirmation of the tsunami origin, (2) the
dating and correlation of tsunami events, and (3) the
quantification of tsunami magnitudes (Sugawara, Minoura,
and Imamura, 2008). Although identification, especially the
discrimination from tempestites (e.g., Morton, Gelfenbaum,
and Jaffe, 2007; Peters and Jaffe, 2010; Switzer and Jones,
2008), and dating of tsunami deposits are still problematic in
many cases (e.g., Jankaew et al., 2008; Yawsangratt et al.,
2009), determination of event magnitudes is the topic least
understood. Even for modern tsunamis that have been
intensively studied, such as the IOT 2004, no clear picture of
the complex transport processes and onshore hydrodynamics
exists (e.g., Paris et al., 2009).
Using any quantitative parameter of tsunami size—even
relative ones that are influenced by site-specific factors, and
therefore are valid only at a single location (e.g., inundation
height, flow velocity, inundation distance, and run-up height)
as measures for the tsunami magnitude, and not only universal
ones such as the offshore wave height (Papadopoulos and
DOI: 10.2112/JCOASTRES-D-13-00206.1 received 20 November 2013;accepted in revision 23 November 2013; corrected proofs received17 April 2014; published pre-print online 30 May 2014.*Corresponding author: [email protected]� Coastal Education & Research Foundation 2014
Journal of Coastal Research 00 0 000–000 Coconut Creek, Florida Month 0000

Imamura, 2001)—several strategies have been applied to
deduce magnitudes from tsunami deposits. First, for boulder-
sized deposits, wave height and flow velocity have been
estimated from transport formulas that are mainly based on
weight, size, and lateral and vertical displacement of the
boulders (e.g., Engel and May, 2012; Goto, Okada, and
Imamura, 2010; Nott, 2003). In the case of sandy tsunamites,
the maximum inland extent, as an indicator for tsunami run-
up and inundation, has been used to estimate minimum wave
heights (e.g., Peterson et al., 2011; Pinegina and Bourgeois,
2001) or the geometry of ruptures that triggered the tsunamis
(Nanayama et al., 2003). Other studies employed the source of
tsunami sediments deduced from microfossils (e.g., Costa et al.,
2012; Davies et al., 2003; Nagendra et al., 2005) or mineralog-
ical aspects (Switzer et al., 2005), to assess amplitudes, periods,
or transport distances of prehistoric events (Uchida et al.,
2010). Lately, inverse sedimentation models have been used to
estimate hydrodynamic parameters including flow speed, flow
depth, and run-up height on the basis of onshore deposits (Jaffe
and Gelfenbaum, 2007; Moore, McAdoo, and Ruffman, 2007;
Smith et al., 2007; Soulsby, Smith, and Ruffman, 2007). Inverse
models can be accomplished by forward approaches that model
the deposit characteristics for different inundation scenarios
(Apotsos et al., 2009; Apotsos, Gelfenbaum, and Jaffe, 2012;
Pritchard and Dickinson, 2008).
This study combines the application of the inverse tsunami
sedimentation model (TsuSedMod; Jaffe and Gelfenbaum,
2007) and the sedimentology and microfauna-based recon-
struction of offshore sediment sources to deposits of the IOT
2004 and potential predecessors from the coastal plain of Ban
Bang Sak, Thailand (Brill et al., 2011). By evaluating the
approach for the modern analogue of 2004, for which rough
specifications regarding onshore flow depth, flow speed, and
sediment source exist, the magnitude of palaeoevents is
estimated. Whereas the boundary conditions at the time of
impact, such as tide level, sea level, and topography, are well
known for modern events, these parameters may have differed
significantly from present conditions for prehistoric tsunamis.
This and the potential effect of postdepositional changes have
to be considered for ancient tsunamites.
METHODSIn this section, a comprehensive description of all applied
methodological approaches is given before the location and
relevant physical characteristics of the study area are
introduced.
Applied MethodsThe new stratigraphical data presented in this paper were
obtained from closed vibracores, drilled with an Atlas Copco mk
1 corer, and from short push cores. To measure the position and
elevation of each coring site, a differential global positioning
system (Topcon HiPer Pro) was used. In the laboratory, a
tentative stratigraphy was established following Ad-hoc-
Arbeitsgruppe Boden (2005). Subsequently, each sedimentary
stratum was sampled for laboratory analyses, with a sampling
interval of 1 to 2 cm applied to potential tsunami layers.
Grain-size analyses were performed on the air-dried fine
fraction (,2 mm) after treatment with H2O2 to remove
organic matter using a laser particle sizer (Beckmann
Coulter LS13320 Mikro). For the calculation of grain-size
statistics after Folk and Ward (1957), the Gradistat software
was applied (Blott and Pye, 2001). The separation of different
grain-size components followed the approach of Moore,
McAdoo, and Ruffman (2007) using peak fitting software
(Seasolve PeakFit v. 4.12). Geochemical analyses included
loss on ignition, CaCO3 content (Scheibler method), and X-
ray fluorescence (XRF) on powder samples measured with a
handheld XRF spectrometer (Niton Xl3t 900 GOLDD); the
mineralogical composition was determined by X-ray diffrac-
tometry (XRD) performed on a Siemens D5000 (40 kV; 40 mA;
Cu Ka1¼ 1.54060 A, Ka2¼ 1.54443 A; 2H range of 28 to 808;
continuous scan; 0.028 steps for 1 s). Qualitative and
semiquantitative mineral composition were determined from
measured XRD spectra via search and match software (EVA
V13, Bruker AXS) using the International Centre for
Diffraction Data database. Samples for foraminifera analy-
ses were wet sieved to separate the fraction greater than 100
lm. The identification of foraminifera was done under a light
microscope, and systematics rely on Loeblich and Tappan
(1987, 1994) and the World Register of Marine Species
(WoRMS) database (WoRMS, 2012). To guarantee statistical
significance, at least 300 individuals per sample were
studied. Statistical processing of foraminifera, XRF, and
XRD data were performed via cluster analyses and principal
component analyses (PCAs) using the palaeontological
statistics (PAST) 2.14 software (Hammer, Harper, and Ryan,
2001) after exclusion of highly correlating parameters using
Spearman’s rank correlation coefficient and after omitting
rare taxa.
To estimate hydrodynamic parameters of tsunami inunda-
tion, the inverse model of Jaffe and Gelfenbaum (2007),
TsuSedMod, was applied. It has already been tested on
deposits of the 1998 Papua New Guinea tsunami (Jaffe and
Gelfenbaum, 2007), the IOT 2004 (Spiske et al., 2010), the
2009 Samoa tsunami (Jaffe et al., 2011), and the 2011 Tohoku-
oki tsunami (Jaffe et al., 2012). The model works with the
simplifying assumptions that (1) onshore tsunami flow is
steady and uniform, (2) transport and deposition of sediment
are dominated by suspension load (.90%), and (3) no erosion
is caused by following waves or backwash. The model is
considered to provide reliable values for onshore flow speed
only where these assumptions apply—ideally, in fairly
shallow and gently sloping coastal plains that are flooded by
long tsunami waves (Apotsos, Gelfenbaum, and Jaffe, 2012)—
by computing the shear velocities necessary to produce the
observed deposits (Jaffe and Gelfenbaum, 2007). Required
input data are the averaged grain-size distribution and the
thickness of those sections of the tsunamites, which are
considered to have been deposited from suspension during a
single inflow (according to Jaffe et al., 2011, these ‘‘suspen-
sion-graded’’ sections are characterised by normally graded,
unimodal grain-size distributions that successively become
finer, better sorted, and more positively skewed towards the
top), as well as the flow depth. Because the flow depth was
(mainly) unknown for the IOT 2004 and the palaeotsunamis at
the study site, minimum values were estimated via the Froude
number; they should be 0.7 to 1.0 in the subcritical onshore
Journal of Coastal Research, Vol. 00, No. 0, 0000
0 Brill et al.

flow of tsunamis (Nanayama and Shigeno, 2006; Spiske et al.,
2010). Other model parameters were kept constant for all
samples: The resuspension coefficient, eddy viscosity, and
settling velocity were adopted from Jaffe and Gelfenbaum
(2007) and a Manning’s n of 0.03 for bottom roughness was
adopted from Jaffe et al. (2011, 2012), whereas sediment
density (2.68 g/cm3), salinity (33%), and water temperature—
in the Andaman Sea, the uppermost 60 m show a constant
temperature of 258C (Osborne and Burch, 1980)—were
adapted to the local conditions.
Physical Setting of the Study AreaThe coastal plain of Ban Bang Sak is located at the west coast
of southern Thailand, which is part of the Malay–Thai
Peninsula (Figure 1a). Despite being located in the subhumid
tropics north of 58 N, SW Thailand has not been affected by the
landfall of tropical cyclones within the last 150 years (Murty
and Flather, 2004); rather, it was only exposed to normal
coastal dynamics controlled by moderate waves of less than 2 m
and maximum tides of 1.5 m (neaptide) to 3.0 m (springtide;
Choowong et al., 2008b). Tectonically, SW Thailand is part of
Figure 1. Overview of the study area. (a) Map of the Andaman Sea with rupture areas of historical earthquakes along the Andaman–Nicobar Segment of the
Sunda Arc (according to Bilham et al., 2005) and main tectonic structures of the area after Watkinson, Elders, and Hall (2008). KMF¼Klong Marui Fault, RF¼Ranong Fault. (b) The shelf offshore Ban Bang Sak with locations of offshore reference samples. (c) Morphological division of Ban Bang Sak coastal plain with
positions of transects A and B. (d) Cross section through the sediments of the coastal plain along transect A, including the positions of sediment drill cores (after
Brill et al., 2011).
Journal of Coastal Research, Vol. 00, No. 0, 0000
Sediment Transport and Hydrodynamics of Tsunami Waves in Onshore Geoarchives 0

the relatively stable Sunda Plate, with only minor tectonic
activity during the Holocene (Fenton and Sutiwanich, 2005).
The occurrence of strong earthquakes is restricted to the Sunda
Arc (Figure 1a), where the convergence of the Australian–
Indian Plate with the Sunda and Burma Microplates is a major
source of ruptures (Lay et al., 2005), which are capable of
producing tsunami waves strong enough to reach the Thai
coast (Okal and Synolakis, 2008).
The coastal geomorphology of the study area is characterised
by steep, rocky headlands that vary with intertidal flats and
sandy beach-ridge plains (Dheeradilok, 1995; Sinsakul, 1992).
The bathymetry to the west off Ban Bang Sak is gently sloping
with some nearshore irregularities (Di Geronimo, Choowong,
and Phantuwongraj, 2009; Feldens et al., 2009, 2012; Figures
1a and b). Generally, onshore Holocene coastal deposits are less
than 20 m thick and overlie alluvial Pleistocene sediments or
deeply weathered Tertiary bedrock (Dheeradilok, 1995). At
Ban Bang Sak, they form a 300- to 500-m-wide coastal plain
that is geomorphologically characterised by a succession of
coast-parallel foredune ridges and swales (Figures 1c, 1d, and
2). Its stratigraphy was described by Brill et al. (2011), as
shown in Figure 1d: The surface of the pre-Holocene terrestrial
deposits (unit 1) forms a gently dipping slope that is covered by
transgressive intertidal sand (unit 2). In the course of coastal
progradation, the tidal flat was topped by two generations of
foredune ridges (unit 3) and terrestrial deposits (peat, alluvial
deposits, and artificial material) that accumulated in the
depressions of the intervening swales (unit 4). The swales
proved to be an appropriate geoarchive for deposits of tsunami
events. Besides the sand sheet of the IOT 2004 (event A), a
second layer was found in the swale nearest the coast,
reflecting an older tsunami dated to 500 to 700 cal BP (event
B). Additional evidence of up to three extreme wave events,
either tsunami or storm and dated to 1180 to 2000 cal BP (C
events), occurs in the upper section of the terrestrial deposits at
the base (Brill et al., 2011).
On December 26, 2004, at 0759 local time, a moment
magnitude 9.1 to 9.3 earthquake struck the area 100 km west
of Sumatra, resulting from a 1300-km-long rupture of the
Sunda Arc subduction zone with maximum vertical slip of 20 m
(Lay et al., 2005; Subarya et al., 2006). The seafloor displace-
ment generated a tsunami that reached the Thai coast during
high tide in the form of a trough leading wave (Tsuji et al.,
2006). Whereas at Phuket the initial withdrawal of seawater
arrived at 0930 local time and the first wave crest followed at
1000 local time (Szczucinski et al., 2006), at the coastline of
Khao Lak the initial trough was recorded at 1000 local time and
the first wave crest arrived 30 minutes later (Bell et al., 2005;
Hawkes et al., 2007). Before the final withdrawal of the sea,
three major waves flooded the coastal plains of Phuket and
Phang-nga, with the first or second wave showing the largest
amplitude but the third wave, riding on the previous ones,
being the highest (Choowong et al., 2008a; Hori et al., 2007).
For the area of Khao Lak, based on posttsunami field surveys,
eyewitness accounts, and survivor videos, the magnitude of the
tsunami was partly documented: maximum inundation ex-
ceeded 1000 m, run-up reached 11 to 14 m above mean sea level
(a.s.l.), and the wave height was 6 to 13 m above tide level (a.t.l.;
Sumatra Earthquake Tsunami Field Survey Staff, 2005; Tsuji
et al., 2006). The most reliable estimates of onshore flow
velocities, inferred from survivor videos, are 6 to 8 m/s (Rosetto
et al., 2007). Although the impact on coastal communities and
infrastructure was disastrous, the long-term effect on coastal
geomorphology was remarkably low (Kelletat, Scheffers, and
Scheffers, 2007).
Although several historical earthquakes along the Sunda Arc
prior to 2004 have triggered tsunamis in the Andaman Sea
(Bilham et al., 2005; Figure 1a), none of them was strong
enough to leave a noticeable imprint at the coast of Thailand
(Okal and Synolakis, 2008). In contrast, for prehistoric times,
convergence rates at the Sunda Arc (Lvholt et al., 2006;
Subarya et al., 2006) and evidence of coseismic uplift and
subsidence along the rupture zone (Grand Pre et al., 2012;
Meltzner et al., 2010; Rajendran et al., 2008) point to possible
previous megathrust ruptures similar in magnitude to the
earthquake in 2004 that probably resulted in severe tsunamis.
In addition, sedimentary evidence of prehistoric tsunamis was
found at several locations in SW Thailand (e.g., Brill et al.,
2011, 2012a, b; Jankaew et al., 2008; Prendergast et al., 2012)
and other countries around the Indian Ocean (e.g., Malik et al.,
2011; Monecke et al., 2008; Rajendran et al., 2006). Whereas
this evidence documents the occurrence of palaeotsunamis
between 500 and 4000 cal BP, there is scarce information about
the magnitudes of these events.
RESULTSThe coastal stratigraphy of Ban Bang Sak, including
evidence of the IOT 2004 and potential predecessors, was
previously documented along a shore-normal cross section
(transect A, Figure 1c) by Brill et al. (2011). Due to
anthropogenic impact at the eastern end of transect A, the
sediments inside of swale I were strongly disturbed and the
occurrence of tsunami layers was restricted to the area west of
it (Figure 1d). To laterally extend the evidence of tsunami
layers, a second transect perpendicular to the shoreline and
consisting of four sediment cores (BBS 34–37), was established
400 m to the north (transect B, Figure 1c). Transect B starts
250 m east of the shoreline on ridge I, crosses swale I, and runs
eastward on the gently dipping alluvial plain of a small river to
its maximum inland position 430 m east of the shoreline and 4
m a.s.l. (Figures 2 and 3).
The General Stratigraphy of Transect BThe stratigraphy of coastal deposits described in transect B
relies on the sedimentology of cores BBS 34 to 37. The
stratigraphies for all four cores are first described and
subsequently interpreted in regards to the corresponding
depositional environments.
Description of Sediment CoresCore BBS 34 is located 360 m east of the shoreline in the
densely vegetated depression of swale I (Figure 3). Reaching a
depth of 3 m below surface (b.s.), the bottom section is composed
of stiff, yellowish clay devoid of carbonate and macro remains.
Above an erosive contact at 1.90 m b.s., grey, coarse sand with a
carbonate content of 10% follows. Subsequently, a 5-cm-thick
peat layer at 1.74 to 1.69 m b.s. is covered by decalcified,
greyish brown loam with alternating clayey and sandy
sections. At 1.02 m b.s., the uppermost clayey section is
Journal of Coastal Research, Vol. 00, No. 0, 0000
0 Brill et al.

overlain by a grey, multiple-graded, fine sand layer, 14 cm
thick, with a sharp contact, marine shells and rip-up clasts at
the base, and a high CaCO3 content (40–50%). From 0.88 to
0.24 m b.s., alternating strata of decalcified, greyish brown clay
and sandy loam follow. Again, a sharply bordered, fine sand
layer occurs between 0.24 and 0.13 m b.s. It is characterised by
a grey colour, basal shell fragments, and high carbonate
content (40–50%). The uppermost 13 cm are composed of brown
clay without carbonate.
Cores BBS 35 to 37, drilled on the alluvial terrace at
distances of 390, 400, and 430 m east of the shoreline,
respectively, reach depths of 1.40 to 1.60 m b.s. (Figure 3). All
three cores are composed of greyish brown, decalcified strata of
clay and loamy sand. The coarser sections contain rounded
quartz pebbles, whereas in the finer sections plant fragments
and wood are observed. While BBS 35 is entirely composed of
these deposits, in BBS 36 and 37 the clayey top section is
interrupted by sharply bordered layers of grey fine sand with
shell fragments at the base and high carbonate contents (40–
50%).
Interpretation of Depositional EnvironmentsAll deposits described in cores BBS 34 to 37 clearly
correspond to the stratigraphical record of transect A (Figure
1d) described by Brill et al. (2011): The yellowish clay at the
Figure 2. Coastal environments and geomorphology at the study location. Recent environments along transect A (a–c) and transect B (d–g) give an impression of
the investigated geoarchives and the inundation area of the IOT 2004. (a) View from the hills at the eastern end of transect A (compound of the Rajaprajanugroh
No. 35 School) in the western direction. (b) View from ridge I in the western direction. (c) Beach in transect A. (d) River channel in the gently dipping alluvial plain.
(e) Backwater of the river in swale II. (f) Incised river channel in the partly cemented sediments of ridge II. (g) River mouth with a shore-parallel sand barrier at its
seaward end.
Journal of Coastal Research, Vol. 00, No. 0, 0000
Sediment Transport and Hydrodynamics of Tsunami Waves in Onshore Geoarchives 0

base of BBS 34 is consistent with the weathered pre-Holocene
of unit 1 (totally kaolinised bedrock as a result of the humid-
tropical weathering). The grey coarse sand that follows in the
same core can be related to the intertidal sand of unit 2.
Although both units are restricted to core BBS 34, at least the
pre-Holocene bedrock must be present at locations BBS 35 to 37
as well, but it was not reached by drilling. The decalcified loam
and clay strata that compose most of cores BBS 35 to 37 and
dominate the upper 1.70 m in BBS 34 are equal to sediments of
unit 4 that were interpreted as alluvial deposits. Unit 4 forms
the fill of swale I and extends as a sheet of unknown thickness
towards the east. The CaCO3-rich fine sand layers at the top of
BBS 34, 36, and 37 represent the IOT 2004 deposit. It is
continuously present throughout transect B; its absence in core
BBS 35, directly next to the river, is due to fluvial erosion. The
fine sand layer at 1.02 to 0.88 m b.s. in BBS 34 corresponds to
event layer B and, within transect B, is spatially restricted to
swale I (Figure 3).
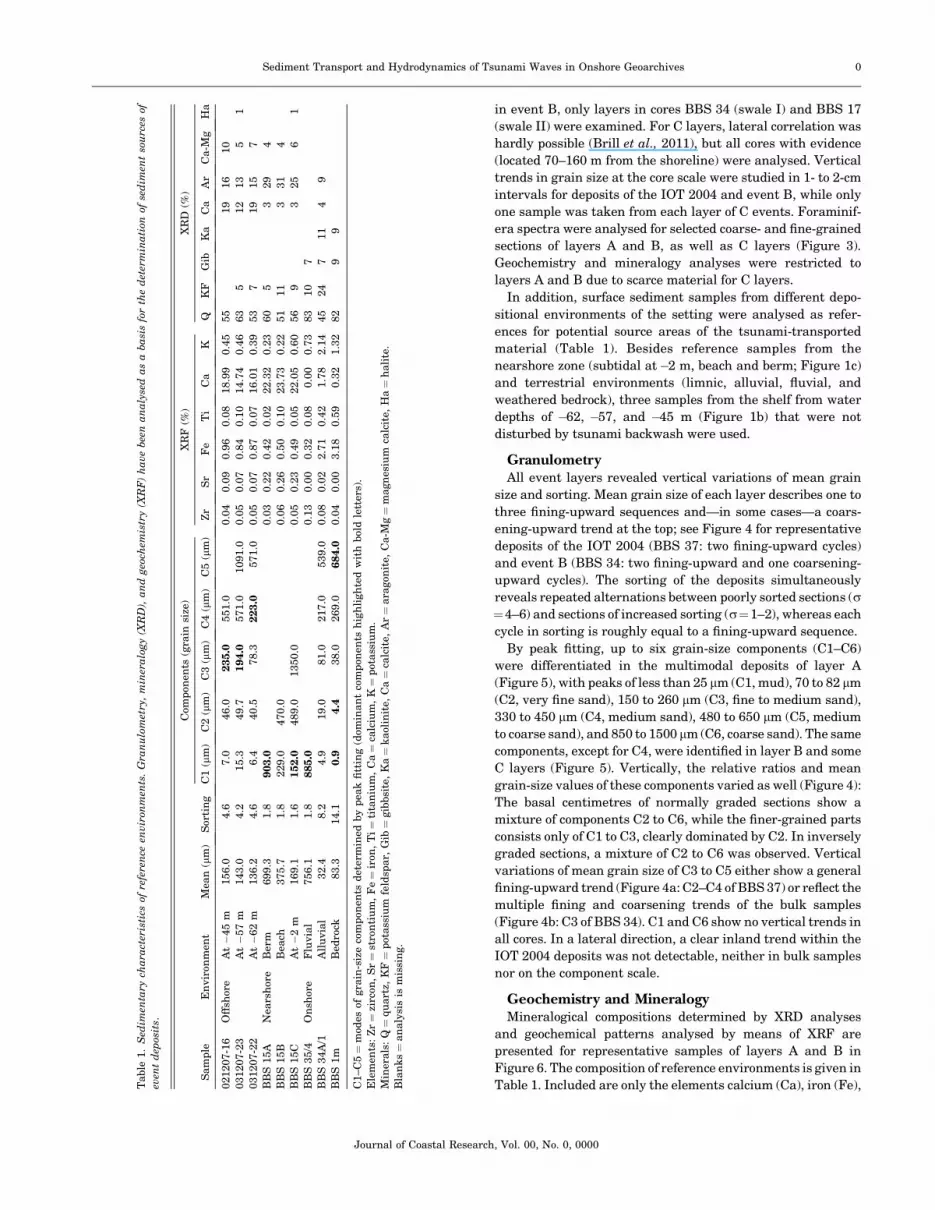
Sediment Characteristics of Event Layers andReference Samples
As a database for the estimation of event magnitudes,
detailed multiproxy analyses of the IOT 2004 sand sheet and
the palaeoevent layers were conducted. To study lateral trends
at the transect scale, the IOT deposit was analysed continu-
ously, involving the new data of transect B (BBS 34, 36, and 37)
and selected cores from transect A (BBS 14, 12, 9, 6, 17, 5, and
3; Figure 3). Because the extent of deposits was not continuous
Figure 3. Schematic cross sections of the coastal plain along transects A and B. The coastal sediment succession down to a depth of 5 m below sea level shows
sedimentary evidence of the IOT 2004 (layer A), as well as several palaeoevents (layers B and C). (a) For transect B, the complete stratigraphy of cores BBS 34 to
37 is presented. (b) In transect A, only the geometry and sedimentary structure of event layers A to C are documented, whereas the division into units is adopted
from Brill et al. (2011).
Journal of Coastal Research, Vol. 00, No. 0, 0000
0 Brill et al.
in event B, only layers in cores BBS 34 (swale I) and BBS 17
(swale II) were examined. For C layers, lateral correlation was
hardly possible (Brill et al., 2011), but all cores with evidence
(located 70–160 m from the shoreline) were analysed. Vertical
trends in grain size at the core scale were studied in 1- to 2-cm
intervals for deposits of the IOT 2004 and event B, while only
one sample was taken from each layer of C events. Foraminif-
era spectra were analysed for selected coarse- and fine-grained
sections of layers A and B, as well as C layers (Figure 3).
Geochemistry and mineralogy analyses were restricted to
layers A and B due to scarce material for C layers.
In addition, surface sediment samples from different depo-
sitional environments of the setting were analysed as refer-
ences for potential source areas of the tsunami-transported
material (Table 1). Besides reference samples from the
nearshore zone (subtidal at�2 m, beach and berm; Figure 1c)
and terrestrial environments (limnic, alluvial, fluvial, and
weathered bedrock), three samples from the shelf from water
depths of �62, �57, and �45 m (Figure 1b) that were not
disturbed by tsunami backwash were used.
GranulometryAll event layers revealed vertical variations of mean grain
size and sorting. Mean grain size of each layer describes one to
three fining-upward sequences and—in some cases—a coars-
ening-upward trend at the top; see Figure 4 for representative
deposits of the IOT 2004 (BBS 37: two fining-upward cycles)
and event B (BBS 34: two fining-upward and one coarsening-
upward cycles). The sorting of the deposits simultaneously
reveals repeated alternations between poorly sorted sections (r¼4–6) and sections of increased sorting (r¼1–2), whereas each
cycle in sorting is roughly equal to a fining-upward sequence.
By peak fitting, up to six grain-size components (C1–C6)
were differentiated in the multimodal deposits of layer A
(Figure 5), with peaks of less than 25 lm (C1, mud), 70 to 82 lm
(C2, very fine sand), 150 to 260 lm (C3, fine to medium sand),
330 to 450 lm (C4, medium sand), 480 to 650 lm (C5, medium
to coarse sand), and 850 to 1500 lm (C6, coarse sand). The same
components, except for C4, were identified in layer B and some
C layers (Figure 5). Vertically, the relative ratios and mean
grain-size values of these components varied as well (Figure 4):
The basal centimetres of normally graded sections show a
mixture of components C2 to C6, while the finer-grained parts
consists only of C1 to C3, clearly dominated by C2. In inversely
graded sections, a mixture of C2 to C6 was observed. Vertical
variations of mean grain size of C3 to C5 either show a general
fining-upward trend (Figure 4a: C2–C4 of BBS 37) or reflect the
multiple fining and coarsening trends of the bulk samples
(Figure 4b: C3 of BBS 34). C1 and C6 show no vertical trends in
all cores. In a lateral direction, a clear inland trend within the
IOT 2004 deposits was not detectable, neither in bulk samples
nor on the component scale.
Geochemistry and MineralogyMineralogical compositions determined by XRD analyses
and geochemical patterns analysed by means of XRF are
presented for representative samples of layers A and B in
Figure 6. The composition of reference environments is given in
Table 1. Included are only the elements calcium (Ca), iron (Fe),Table
1.
Sed
imen
tary
cha
ract
eris
tics
ofre
fere
nce
envir
onm
ents
.G
ran
ulo
met
ry,
min
era
logy
(XR
D),
an
dgeo
chem
istr
y(X
RF
)h
ave
bee
na
na
lyse
da
sa
ba
sis
for
the
det
erm
ina
tion
ofse
dim
ent
sou
rces
of
even
td
epos
its.
Sam
ple
En
vir
onm
ent
Mea
n(l
m)
Sor
tin
g
Com
pon
ents
(gra
insi
ze)
XR
F(%
)X
RD
(%)
C1
(lm
)C
2(l
m)
C3
(lm
)C
4(l
m)
C5
(lm
)Z
rS
rF
eT
iC
aK
QK
FG
ibK
aC
aA
rC
a-M
gH
a
021207-1
6O
ffsh
ore
At�
45
m156.0
4.6
7.0
46.0
235.0
551.0
0.0
40.0
90.9
60.0
818.9
90.4
555
19
16
10
031207-2
3A
t�
57
m143.0
4.2
15.3
49.7
194.0
571.0
1091.0
0.0
50.0
70.8
40.1
014.7
40.4
663
512
13
51
031207-2
2A
t�
62
m136.2
4.6
6.4
40.5
78.3
223.0
571.0
0.0
50.0
70.8
70.0
716.0
10.3
953
719
15
7
BB
S15A
Nea
rsh
ore
Ber
m699.3
1.8
903.0
0.0
30.2
20.4
20.0
222.3
20.2
360
53
29
4
BB
S15B
Bea
ch375.7
1.8
229.0
470.0
0.0
60.2
60.5
00.1
023.7
30.2
251
11
331
4
BB
S15C
At�
2m
169.1
1.6
152.0
489.0
1350.0
0.0
50.2
30.4
90.0
522.0
50.6
056
93
25
61
BB
S35/4
On
shor
eF
luvia
l756.1
1.8
885.0
0.1
30.0
00.3
20.0
80.0
00.7
383
10
7
BB
S34A
/1A
llu
via
l32.4
8.2
4.9
19.0
81.0
217.0
539.0
0.0
80.0
22.7
10.4
21.7
82.1
445
24
711
49
BB
S1m
Bed
rock
83.3
14.1
0.9
4.4
38.0
269.0
684.0
0.0
40.0
03.1
80.5
90.3
21.3
282
99
C1–C
5¼
mod
esof
gra
in-s
ize
com
pon
ents
det
erm
ined
by
pea
kfi
ttin
g(d
omin
an
tco
mp
onen
tsh
igh
ligh
ted
wit
hbol
dle
tter
s).
Ele
men
ts:
Zr¼
zirc
on,
Sr¼
stro
nti
um
,F
e¼
iron
,T
i¼
tita
niu
m,
Ca¼
calc
ium
,K¼
pot
ass
ium
.
Min
erals
:Q¼
qu
art
z,K
F¼
pot
ass
ium
feld
spar,
Gib¼
gib
bsi
te,
Ka¼
kaol
init
e,C
a¼
calc
ite,
Ar¼
ara
gon
ite,
Ca-M
g¼
magn
esiu
mca
lcit
e,H
a¼
hali
te.
Bla
nk
s¼
an
aly
sis
ism
issi
ng.
Journal of Coastal Research, Vol. 00, No. 0, 0000
Sediment Transport and Hydrodynamics of Tsunami Waves in Onshore Geoarchives 0

potassium (K), titanium (Ti), strontium (Sr), and zircon (Zr),
which have percentages of at least 0.1% in all samples.
By PCA, the XRF dataset was reduced to three principal
components (PCs) that describe 89% of the total variability
Figure 4. Vertical structure of the event layers. Vertical trends in grain-size composition and the abundance of grain-size components are presented for (a) the
IOT 2004 sand sheet in BBS 37 and (b) the deposit of event B in BBS 34. The granulometric data clearly document a differentiation of both sand sheets into several
normally and inversely graded subunits that reflect different hydrodynamic conditions (i.e. deposition by different waves or switchover between run-up and
backwash).
Figure 5. Grain-size components of the event deposits. The occurrence of characteristic grain-size components (C1–C6) in coarse- and fine-grained sections of the
IOT 2004, events B and C, is used as a proxy for transport processes and sediment sources of the deposits.
Journal of Coastal Research, Vol. 00, No. 0, 0000
0 Brill et al.
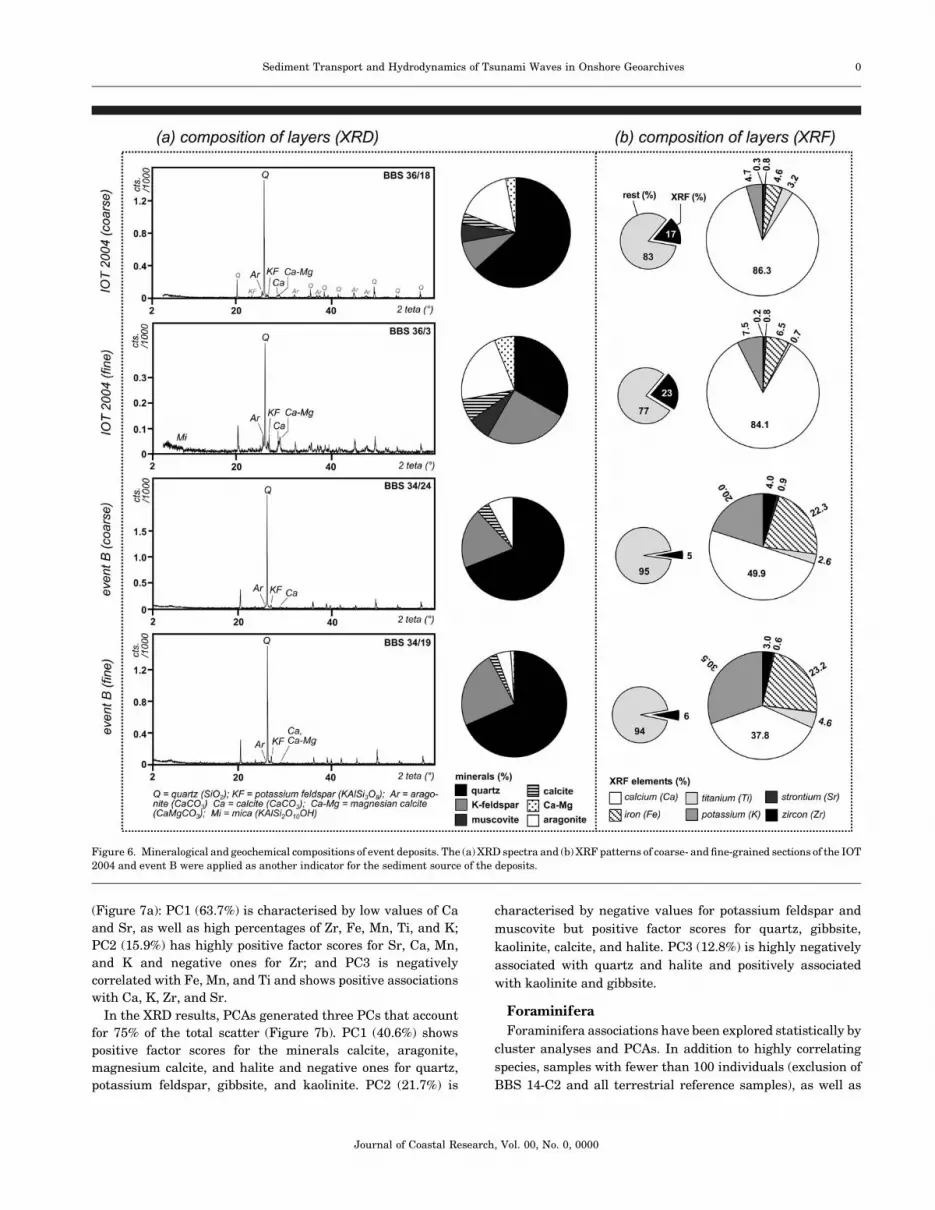
(Figure 7a): PC1 (63.7%) is characterised by low values of Ca
and Sr, as well as high percentages of Zr, Fe, Mn, Ti, and K;
PC2 (15.9%) has highly positive factor scores for Sr, Ca, Mn,
and K and negative ones for Zr; and PC3 is negatively
correlated with Fe, Mn, and Ti and shows positive associations
with Ca, K, Zr, and Sr.
In the XRD results, PCAs generated three PCs that account
for 75% of the total scatter (Figure 7b). PC1 (40.6%) shows
positive factor scores for the minerals calcite, aragonite,
magnesium calcite, and halite and negative ones for quartz,
potassium feldspar, gibbsite, and kaolinite. PC2 (21.7%) is
characterised by negative values for potassium feldspar and
muscovite but positive factor scores for quartz, gibbsite,
kaolinite, calcite, and halite. PC3 (12.8%) is highly negatively
associated with quartz and halite and positively associated
with kaolinite and gibbsite.
Foraminifera
Foraminifera associations have been explored statistically by
cluster analyses and PCAs. In addition to highly correlating
species, samples with fewer than 100 individuals (exclusion of
BBS 14-C2 and all terrestrial reference samples), as well as
Figure 6. Mineralogical and geochemical compositions of event deposits. The (a) XRD spectra and (b) XRF patterns of coarse- and fine-grained sections of the IOT
2004 and event B were applied as another indicator for the sediment source of the deposits.
Journal of Coastal Research, Vol. 00, No. 0, 0000
Sediment Transport and Hydrodynamics of Tsunami Waves in Onshore Geoarchives 0

foraminifera species that were present in less than three
samples and did not reach 5% dominance in at least one sample
(preclusion of 80 species), were excluded, whereas the percent-
ages of important foraminifera groups (agglutinated species,
Figure 7. PCAs for laboratory parameters of potential tsunamites and reference samples. The statistical processing allowed the establishment of characteristic
patterns for the reference environments and, by comparing the composition of event deposits with these patterns, the deduction of sediment sources for fine- and
coarse-grained sections of potential tsunamites. (a) PC1 versus PC2 of XRF data. (b) PC1 versus PC2 of mineral composition. (c) Plots of PC1 to PC3 on the basis of
foraminifera associations. (d) Synthesis of grain-size, foraminifera, and XRF data, with (d1) sample loadings of PC1 and PC2, (d2) parameter loadings of PC1 and
PC2, and (d3) vertical variations of PC1 and PC2 in the IOT 2004 and event B deposits.
Journal of Coastal Research, Vol. 00, No. 0, 0000
0 Brill et al.

hyaline species, porcelaneous species, trochamminids, and
larger foraminifera) and indices (Fisher alpha diversity and
planktonic–benthonic ratio) were incorporated in the analyses.
Cluster analyses revealed three principal groups of samples
(Figure 8): Cluster 1 is characterised by high abundances of
Globigerinella sp., Asterorotalia gaimardi, Cibicides praecinc-
tus, Cancris carinatus, and Textularia sp. Cluster 2 can be
further divided into clusters 2A and 2B and is dominated by
Pararotalia sp., Amphistegina spp., Asterorotalia spp., and
Alveolinella quoii. Cluster 3 shows subdivision into three
subclusters. Whereas cluster 3A contains intertidal species
such as Haynesina sp. and Haplophragmoides sp., clusters 3B
Figure 8. Cluster analyses for tsunami-laid sand and reference samples. Statistical grouping of event deposits and samples from reference environments on the
basis of their foraminifera associations revealed three main clusters that reflect different sediment sources. While the coarse sections of event deposits are similar
to the sediment from the littoral zone (cluster 2), the fine sections (cluster 3) match neither a littoral nor a shelf origin (cluster 1) and must have been derived from
the shallow subtidal zone between.
Journal of Coastal Research, Vol. 00, No. 0, 0000
Sediment Transport and Hydrodynamics of Tsunami Waves in Onshore Geoarchives 0

and 3C are characterised by high numbers of Cibicides spp.,
Elphidium advenum, Ammonia spp., Rosalina spp., Eponides
sp., Bulimina spp., and Quinqueloculina spp.
By PCA, the foraminifera data were reduced to three PCs
that account for 62% of the total variability: PC1 (25%) has high
positive factor scores for planktonic and agglutinated species
and negative ones for hyaline species and larger foraminifera,
PC2 (20.6%) is positively related to planktonic species and
larger foraminifera and negatively related to porcelaneous
species, and PC3 (16.5%) has high positive factor scores for
trochamminids and negative scores for porcelaneous species
(Figure 7b).
Synthesis of All Measured ParametersIn addition to analyses of single parameters, for all samples
with information about grain size, geochemistry, and micro-
fauna, PCA was performed on the complete dataset (Figure 7d).
PC1 (28.1%) is positively correlated with the mud fraction (silt
and clay), the elements Ti, Fe, Mn, and Zr, as well as
agglutinated foraminifera and trochamminids. It shows nega-
tive factor scores for the sand fraction, the elements Sr and Ca,
larger foraminifera, and planktonic species. PC2 (24.8%) has
highly positive loadings for hyaline foraminifera, larger
foraminifera, and skewness and negative ones for planktonic
and agglutinated foraminifera (Figure 7d2).
Modelling of Hydrodynamic ParametersInverse modelling of flow speed and flow depth was
conducted for all event deposits with suspension-graded
sections. Appropriate sections were found in all normally
graded sections of layers A and B except for BBS 6-2 and 5-3
(Figure 3). Due to the wide sampling interval, no suspension
grading was detected in C layers. TsuSedMod uses the bulk
grain size and the thickness of suspension-graded sections to
calculate flow velocities (Table 2). Because flow depth was
unknown, it was determined iteratively by using a Froude
number of 1. For the IOT 2004 deposits, onshore flow depths
between 2.5 and 5.5 m and flow velocities of 3.0 to 4.9 m/s were
derived. Layer B revealed slightly higher values of flow depth
(4.1–7.5 m) and flow velocity (4.0–5.9 m/s).
DISCUSSIONIn this section, the parameters described in the Results
section are interpreted with regard to possible implications for
the reconstruction of transport processes and magnitudes of
the identified extreme wave events. For this, based on the
internal structure of the event layers, sediment sources and
hydrodynamic parameters are deduced for each inundation
cycle of the modern and prehistoric flooding events.
Internal Structure of Event DepositsVertical variations of grain-size parameters revealed subdi-
vision into several subunits for layers A and B. Separation of
subunits was based on mean grain size by discriminating
successions of normally and inversely graded sections (e.g.,
Fujiwara and Kamataki, 2008; Naruse et al., 2010) and sorting,
using the reversal point within the vertical trend, where
sorting is the poorest as a border between subsequent subunits
(Srisutam and Wagner, 2010). Figure 3 summarises the
number of subunits for all studied event layers: Layer A
consists of one to three normally graded and not more than one
inversely graded subunit, which always forms the top of the
layers. In layer B, two to three subunits with normal grading
and up to one inversely graded subunit on top were distin-
guished. For C layers, discrimination of subunits was solely
based on visual criteria, revealing one to two normally graded
subunits in layers BBS 8-1 and 8-2 and a massive structure in
Table 2. Modelled hydrodynamic parameters. Input (thickness, mean, and density) and output parameters (flow depth and flow velocity) of the inverse model
TsuSedMod (Jaffe and Gelfenbaum, 2007) are presented for deposits of the IOT 2004 and event B as one estimate of the event magnitude.
Sample Subunit
Distance to
Shore (m)
Thickness*
(cm)
Mean*
(lm)
Density*
(g/cm3)
Min. Flow
Depth a.s. (m)
Min. Flow
Depth a.t.l. (m)
Flow
Velocity (m/s)
IOT 2004
BBS 9 3 129 8 78.4 2.68 2.5 3.5 3.3
2 16 81.9 5.0 6.0 4.6
1 13 84.7 5.5 6.5 4.9
BBS 17 2 146 12 84.6 2.68 4.0 4.9 4.2
1 12 85.6 3.5 4.4 3.9
BBS 6 1 154 18 81.9 2.68 4.5 5.4 4.4
BBS 5 2 162 18 80.6 2.68 4.0 5.1 4.1
1 16 81.3 4.0 5.1 4.3
BBS 3 2 194 8 76.4 2.68 2.5 4.2 3.3
1 10 80.1 3.5 5.2 3.8
BBS 34 1 260 3 72.8 2.68 4.0 5.0 4.2
BBS 36 2 6 70.4 2.68 2.2 3.5 3.0
1 4 94.3 3.5 4.8 3.9
BBS 37 2 12 75.4 2.68 3.5 6.0 3.9
1 5 94.5 3.0 5.5 3.7
Event B
BBS 17 3 146 3 61.3 2.68 6.0 3.9 /5.5 /7.1* 5.2
2 3 77.7 7.5 5.4 /7.0 /8.6* 5.9
1 4 88.5 7.5 5.4 /7.0 /8.6* 5.9
BBS 34 2 260 4 44.5 2.68 4.0 3.9 /5.5 /7.1* 3.9
1 3 93.2 4.0 3.9 /5.5 /7.1* 4.1
* Sedimentary input is derived from suspension-graded sections of the subunits only.
a.s. ¼ above surface, a.t.l. ¼ above tide level.
Journal of Coastal Research, Vol. 00, No. 0, 0000
0 Brill et al.

BBS 21-1 and 9-3. Due to the coring technique, the bedding in
all other C layers was disturbed and prohibited the discrimi-
nation of subunits.
Sources of Event DepositsThe sources of onshore event deposits are determined by
statistically analysing their granulometric, faunal, geochemi-
cal, and mineralogical characteristics.
GranulometryUsing the modes of grain-size components C1 to C6 (Figure 5)
and relating them to different reference samples, source areas
of the tsunami deposits were determined: C1 seems to have its
origin in the muddy pretsunami soils, C2 was probably derived
from the subtidal zone below 2 m but above 45 m in water depth
(�2 to�45 m), C3 and C4 are probably related to the beach, C5 is
related to the subaerial foredune system, and C6 represents
shell fragments from various marine environments. Tsunami
deposits of the IOT 2004 and event B are generally dominated
by marine material from the subtidal zone between�2 and�45
m (C2) in the fine section and by material from the beach and
foredune system (C3 and C5) in the coarse sections. In contrast,
the granulometry of C layers points either to the littoral zone
(beach and foredune) as the only sediment source (BBS 21-1) or
to a mixed sediment source from the littoral and a water depth
of �2 to �45 m. However, although most onshore tsunami
deposits have their origin at the beach and the zone between�2
and �45 m, the presence of a minor contribution from the
shallow shelf deeper than a 45-m water depth cannot be
excluded by means of granulometry, because C2 is also a minor
component of the shelf reference samples.
Geochemistry and MineralogyPlotting the PCs of the XRF values against one another
reveals distinct groups for the reference samples from the shelf,
the littoral zone, and alluvial and fluvial environments. The
IOT 2004 and event B deposits form separate groups but match
none of the reference patterns (Figure 7a). Similarly, by
plotting the PCs of XRD spectra, a distinct group for each
reference environment (shelf, littoral, and terrestrial) could be
separated, whereas the IOT 2004 and event B deposits form
distinct groups that match none of the reference patterns
(Figure 7b).
Although both event deposits have their own geochemical
and mineralogical signatures, the IOT 2004 deposits are most
closely related to the marine environments of the shelf and the
littoral zone in mineralogy (expressed by the marine minerals
calcite, aragonite, magnesium calcite, and halite) and geo-
chemistry (expressed by the marine elements Sr and Ca). The
differences are probably the result of postdepositional weath-
ering, which is known to affect easily leachable minerals and
elements after only a few years (Szczucinski, 2012). The
deposits of event B reveal less marine influence and a chemical
and mineralogical signature tending slightly more towards
terrestrial environments (expressed by the terrestrial elements
Zr, Fe, Mn, Ti, and K, as well as the terrestrial minerals
kaolinite and gibbsite), especially in the upper parts of the layer
(Figures 6 and 7). These differences point to more intensive
weathering of the event deposits due to their older age, rather
than to differences among the source areas. Thus, although the
chemical and mineralogical properties of the IOT 2004 and
event B point to marine source areas of the deposits, the effects
of postdepositional changes exclude the use for a further
differentiation of marine environments.
ForaminiferaThe cluster analysis divides the sample set into three
principal groups of deposits (Figure 8): (1) The reference
samples from the shelf (cluster 1); (2) the beach and nearshore
reference samples, as well as the coarse-grained sections of the
IOT 2004 and events B and C (cluster 2), which can be further
distinguished into cluster 2A (IOT 2004, as well as beach and
shallow subtidal reference samples) and cluster 2B (events B
and C, as well as foredune-ridge reference sample); and (3) the
fine-grained sections of the IOT 2004 and events B and C
(cluster 3), whereas the finest section of event layer B (cluster
3A) can be separated from the fine parts of the other tsunamites
(clusters 3B and 3C) due to the presence of intertidal species.
The same groups of samples are revealed by plotting the PCs of
the foraminifera against one another (Figure 7c): Group 1
contains the shelf reference samples and is equal to cluster 1,
group 2 (with subgroups 2A and 2B) summarises the littoral
reference samples and coarse-grained sections of all tsuna-
mites and thus is equal to cluster 2, and group 3 includes the
fine-grained sections of tsunami deposits, just like cluster 3,
and is further separated into the subgroups 3B and 3A, where
the latter is identical with cluster 3A.
Thus, PCAs and cluster analyses both reveal three main
groups or clusters of samples based on their foraminifera
associations. Clusters 1 and 2 can be related to offshore source
areas on the basis of reference samples within the clusters.
While cluster 1 represents material from the inner shelf (�45 to
�60 m), cluster 2 can be assigned to littoral and nearshore
deposits. This implies that the coarse-grained sections of the
tsunami deposits contained in cluster 2 were derived from the
beach and the shallow shoreface. Cluster 3 originates from
source areas not covered by reference samples. Because most
species characteristic for the inner shelf at a water depth of�45
to �60 m are absent, the samples inside cluster 3—the fine-
grained sections of tsunami deposits—are supposed to repre-
sent shallower water (i.e. the area between�2 and�45 m). The
incorporation of marsh fauna in cluster 3A (i.e. the top section
of event B) is probably the result of postdepositional processes
connected to the intertidal marsh that established subsequent
to event B. In conclusion, foraminifera associations of the IOT
2004, event B, and most layers of C events point to sediment
sources in the littoral zone for coarse-grained sections and in
the subtidal zone shallower than a 45-m water depth for fine-
grained parts. Although cluster analyses point to further
subdivision of sources between�2 and�45 m (clusters 3B and
3C), they cannot be quantified, because reference samples in
these water depths are missing. Different from that, some
layers of C events exclusively come from the littoral zone (BBS
21-1 and 9-C1).
SynthesisPlotting of PC1 against PC2 derived from the whole dataset
reveals the same sample groups as the foraminifera data
(Figure 7d), separating the shelf reference samples (group 1),
littoral deposits and coarse-grained tsunamites (group 2), and
Journal of Coastal Research, Vol. 00, No. 0, 0000
Sediment Transport and Hydrodynamics of Tsunami Waves in Onshore Geoarchives 0
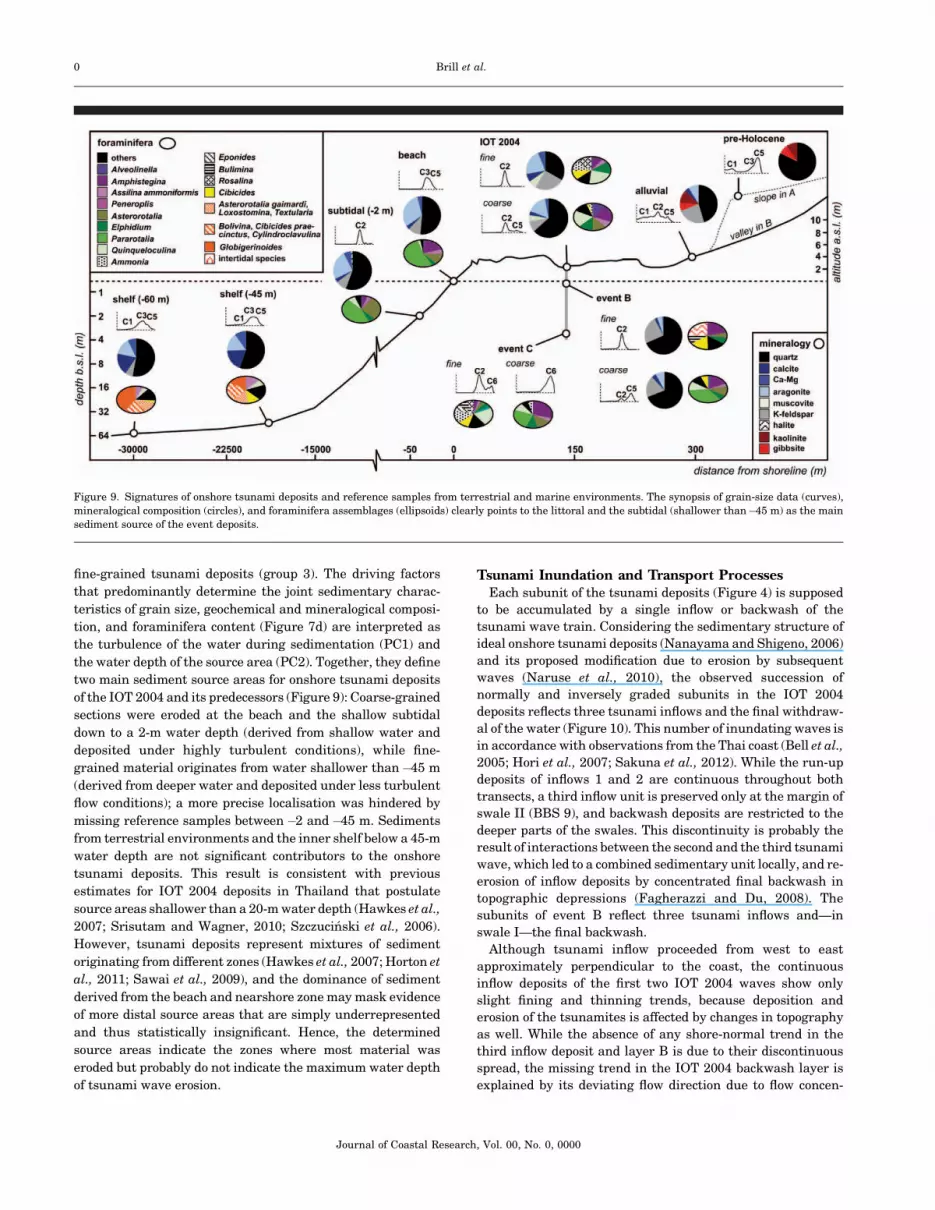
fine-grained tsunami deposits (group 3). The driving factors
that predominantly determine the joint sedimentary charac-
teristics of grain size, geochemical and mineralogical composi-
tion, and foraminifera content (Figure 7d) are interpreted as
the turbulence of the water during sedimentation (PC1) and
the water depth of the source area (PC2). Together, they define
two main sediment source areas for onshore tsunami deposits
of the IOT 2004 and its predecessors (Figure 9): Coarse-grained
sections were eroded at the beach and the shallow subtidal
down to a 2-m water depth (derived from shallow water and
deposited under highly turbulent conditions), while fine-
grained material originates from water shallower than�45 m
(derived from deeper water and deposited under less turbulent
flow conditions); a more precise localisation was hindered by
missing reference samples between�2 and�45 m. Sediments
from terrestrial environments and the inner shelf below a 45-m
water depth are not significant contributors to the onshore
tsunami deposits. This result is consistent with previous
estimates for IOT 2004 deposits in Thailand that postulate
source areas shallower than a 20-m water depth (Hawkes et al.,
2007; Srisutam and Wagner, 2010; Szczucinski et al., 2006).
However, tsunami deposits represent mixtures of sediment
originating from different zones (Hawkes et al., 2007; Horton et
al., 2011; Sawai et al., 2009), and the dominance of sediment
derived from the beach and nearshore zone may mask evidence
of more distal source areas that are simply underrepresented
and thus statistically insignificant. Hence, the determined
source areas indicate the zones where most material was
eroded but probably do not indicate the maximum water depth
of tsunami wave erosion.
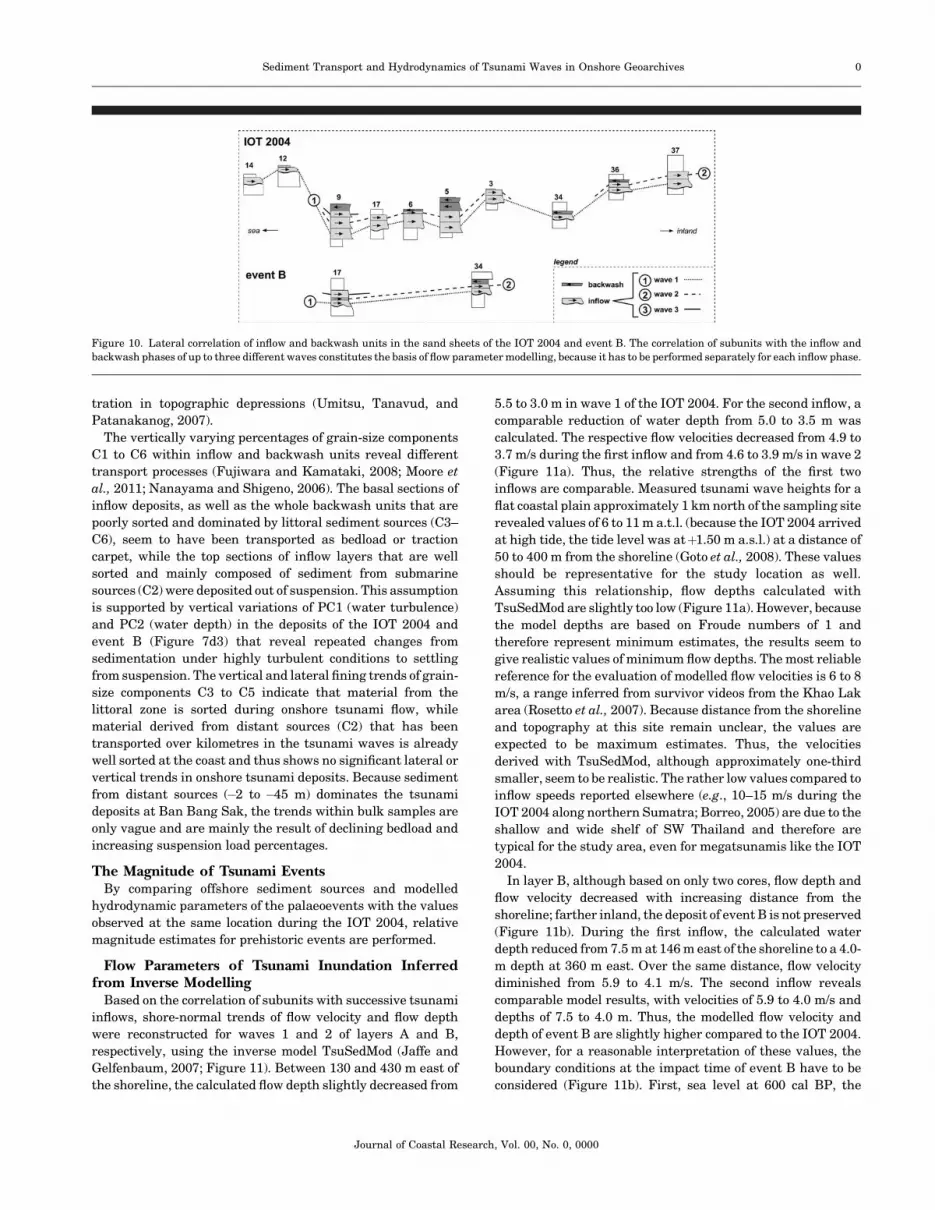
Tsunami Inundation and Transport ProcessesEach subunit of the tsunami deposits (Figure 4) is supposed
to be accumulated by a single inflow or backwash of the
tsunami wave train. Considering the sedimentary structure of
ideal onshore tsunami deposits (Nanayama and Shigeno, 2006)
and its proposed modification due to erosion by subsequent
waves (Naruse et al., 2010), the observed succession of
normally and inversely graded subunits in the IOT 2004
deposits reflects three tsunami inflows and the final withdraw-
al of the water (Figure 10). This number of inundating waves is
in accordance with observations from the Thai coast (Bell et al.,
2005; Hori et al., 2007; Sakuna et al., 2012). While the run-up
deposits of inflows 1 and 2 are continuous throughout both
transects, a third inflow unit is preserved only at the margin of
swale II (BBS 9), and backwash deposits are restricted to the
deeper parts of the swales. This discontinuity is probably the
result of interactions between the second and the third tsunami
wave, which led to a combined sedimentary unit locally, and re-
erosion of inflow deposits by concentrated final backwash in
topographic depressions (Fagherazzi and Du, 2008). The
subunits of event B reflect three tsunami inflows and—in
swale I—the final backwash.
Although tsunami inflow proceeded from west to east
approximately perpendicular to the coast, the continuous
inflow deposits of the first two IOT 2004 waves show only
slight fining and thinning trends, because deposition and
erosion of the tsunamites is affected by changes in topography
as well. While the absence of any shore-normal trend in the
third inflow deposit and layer B is due to their discontinuous
spread, the missing trend in the IOT 2004 backwash layer is
explained by its deviating flow direction due to flow concen-
Figure 9. Signatures of onshore tsunami deposits and reference samples from terrestrial and marine environments. The synopsis of grain-size data (curves),
mineralogical composition (circles), and foraminifera assemblages (ellipsoids) clearly points to the littoral and the subtidal (shallower than�45 m) as the main
sediment source of the event deposits.
Journal of Coastal Research, Vol. 00, No. 0, 0000
0 Brill et al.
tration in topographic depressions (Umitsu, Tanavud, and
Patanakanog, 2007).
The vertically varying percentages of grain-size components
C1 to C6 within inflow and backwash units reveal different
transport processes (Fujiwara and Kamataki, 2008; Moore et
al., 2011; Nanayama and Shigeno, 2006). The basal sections of
inflow deposits, as well as the whole backwash units that are
poorly sorted and dominated by littoral sediment sources (C3–
C6), seem to have been transported as bedload or traction
carpet, while the top sections of inflow layers that are well
sorted and mainly composed of sediment from submarine
sources (C2) were deposited out of suspension. This assumption
is supported by vertical variations of PC1 (water turbulence)
and PC2 (water depth) in the deposits of the IOT 2004 and
event B (Figure 7d3) that reveal repeated changes from
sedimentation under highly turbulent conditions to settling
from suspension. The vertical and lateral fining trends of grain-
size components C3 to C5 indicate that material from the
littoral zone is sorted during onshore tsunami flow, while
material derived from distant sources (C2) that has been
transported over kilometres in the tsunami waves is already
well sorted at the coast and thus shows no significant lateral or
vertical trends in onshore tsunami deposits. Because sediment
from distant sources (�2 to �45 m) dominates the tsunami
deposits at Ban Bang Sak, the trends within bulk samples are
only vague and are mainly the result of declining bedload and
increasing suspension load percentages.
The Magnitude of Tsunami EventsBy comparing offshore sediment sources and modelled
hydrodynamic parameters of the palaeoevents with the values
observed at the same location during the IOT 2004, relative
magnitude estimates for prehistoric events are performed.
Flow Parameters of Tsunami Inundation Inferredfrom Inverse Modelling
Based on the correlation of subunits with successive tsunami
inflows, shore-normal trends of flow velocity and flow depth
were reconstructed for waves 1 and 2 of layers A and B,
respectively, using the inverse model TsuSedMod (Jaffe and
Gelfenbaum, 2007; Figure 11). Between 130 and 430 m east of
the shoreline, the calculated flow depth slightly decreased from
5.5 to 3.0 m in wave 1 of the IOT 2004. For the second inflow, a
comparable reduction of water depth from 5.0 to 3.5 m was
calculated. The respective flow velocities decreased from 4.9 to
3.7 m/s during the first inflow and from 4.6 to 3.9 m/s in wave 2
(Figure 11a). Thus, the relative strengths of the first two
inflows are comparable. Measured tsunami wave heights for a
flat coastal plain approximately 1 km north of the sampling site
revealed values of 6 to 11 m a.t.l. (because the IOT 2004 arrived
at high tide, the tide level was atþ1.50 m a.s.l.) at a distance of
50 to 400 m from the shoreline (Goto et al., 2008). These values
should be representative for the study location as well.
Assuming this relationship, flow depths calculated with
TsuSedMod are slightly too low (Figure 11a). However, because
the model depths are based on Froude numbers of 1 and
therefore represent minimum estimates, the results seem to
give realistic values of minimum flow depths. The most reliable
reference for the evaluation of modelled flow velocities is 6 to 8
m/s, a range inferred from survivor videos from the Khao Lak
area (Rosetto et al., 2007). Because distance from the shoreline
and topography at this site remain unclear, the values are
expected to be maximum estimates. Thus, the velocities
derived with TsuSedMod, although approximately one-third
smaller, seem to be realistic. The rather low values compared to
inflow speeds reported elsewhere (e.g., 10–15 m/s during the
IOT 2004 along northern Sumatra; Borreo, 2005) are due to the
shallow and wide shelf of SW Thailand and therefore are
typical for the study area, even for megatsunamis like the IOT
2004.
In layer B, although based on only two cores, flow depth and
flow velocity decreased with increasing distance from the
shoreline; farther inland, the deposit of event B is not preserved
(Figure 11b). During the first inflow, the calculated water
depth reduced from 7.5 m at 146 m east of the shoreline to a 4.0-
m depth at 360 m east. Over the same distance, flow velocity
diminished from 5.9 to 4.1 m/s. The second inflow reveals
comparable model results, with velocities of 5.9 to 4.0 m/s and
depths of 7.5 to 4.0 m. Thus, the modelled flow velocity and
depth of event B are slightly higher compared to the IOT 2004.
However, for a reasonable interpretation of these values, the
boundary conditions at the impact time of event B have to be
considered (Figure 11b). First, sea level at 600 cal BP, the
Figure 10. Lateral correlation of inflow and backwash units in the sand sheets of the IOT 2004 and event B. The correlation of subunits with the inflow and
backwash phases of up to three different waves constitutes the basis of flow parameter modelling, because it has to be performed separately for each inflow phase.
Journal of Coastal Research, Vol. 00, No. 0, 0000
Sediment Transport and Hydrodynamics of Tsunami Waves in Onshore Geoarchives 0

inferred timing of event B (Brill et al., 2011), had already
reached a level of less than 1 m above its present position, but
tide level is not predictable and may have been up to 3 m lower
than that during the IOT 2004 if event B occurred during
springtide low water (Scheffers et al., 2012). Second, assuming
little compaction, which is reasonable due to the predominantly
sandy substrate, the ground surface prior to inundation by
event B was approximately 3 m lower than today at BBS 17 and
1 m lower than today at BBS 34 (Figure 11b). Finally, although
the exact position of the shoreline is unknown, as a result of
coastal accretion it was located east of its present position,
somewhere within ridge II (Brill et al., 2011).
Because tide level and level of ground surface are not
constant, the onshore flow depth above surface as calculated by
TsuSedMod is not adequate to compare values of the IOT 2004
and event B. Better comparability is ensured by using the flow
depth above tide level that accounts for differences in water
level and surface elevation. Assuming a moderate tide level
around mean water for event B, the flow depths of 5.5 to 7.0 m
a.t.l. calculated for event B are comparable to those modelled
for the IOT 2004 (Table 2 and Figure 11); in the case of high or
low water at the time of inundation, the wave height would be
about 1.5 m higher or lower than that of 2004, giving a possible
range of 4.0 to 8.5 m for the flow depth. The eastern position of
the shoreline reduces the inland distance of the sampling sites
by up to 100 m. Because flow depth and velocity generally
decrease with distance from the shoreline (e.g., Jaffe and
Gelfenbaum, 2007; Richmond et al., 2011), elevated values
compared to the IOT 2004 have to be expected at each sampling
site for waves of the same size.
Potential postsedimentary disturbances of event B deposits
that would affect modelling results are reduction of deposit
thickness by erosion or soil development and changes in grain
size due to bioturbation (Szczucinski, 2012). Whereas changes
in thickness have only a minor effect on the results of
TsuSedMod, the model is sensitive to grain-size changes (Jaffe
and Gelfenbaum, 2007). However, significant disturbances, if
present, would have been detected in the suspension-graded
sections. Critical for the height of modelled flow parameters is
the bed roughness that was only estimated empirically (Jaffe et
al., 2011, 2012). However, the results for the IOT 2004 deposits
seem to be reasonable compared to video measurements and
posttsunami field surveys, and because the morphological
setting did not change appreciably between the palaeotsunami
and 2004, the comparison should be valid.
Wave Parameters Estimated from Sediment SourcesUchida et al. (2010) used the maximum offshore sediment
source (water depth and distance from the shoreline) of
tsunami deposits, determined on the basis of foraminifera
associations, to estimate hydrodynamic parameters (period
Figure 11. Modelled flow depths and flow velocities for (a) the IOT 2004 and (b) event B perpendicular to the shoreline using the inverse model TsuSedMod (Jaffe
and Gelfenbaum, 2007). While panel a is used to evaluate the validity of the model, panel b provides a magnitude estimate for palaeoevent B. (a) Modelling results
for the three waves of the IOT 2004 are compared to flow velocities reconstructed from survivor videos (Rosetto et al., 2007) and flow depth estimates from a
posttsunami survey (Goto et al., 2008). (b) Modelled parameters for event B are compared to IOT 2004 modelling results corrected for altitude changes in tide level
and ground surface, as well as shifts in shoreline position. a.s.¼ above surface.
Journal of Coastal Research, Vol. 00, No. 0, 0000
0 Brill et al.

and amplitude) of the associated tsunami waves. The same is
possible for sediment sources of tsunami deposits from Ban
Bang Sak. However, the rather wide source area of a 45- to 2-m
water depth that was determined for the local tsunamites
implies transport distances between 20 km (40-m water depth)
and less than 8 km (10-m water depth). Although the
corresponding wave parameters in the model of Uchida et al.
(2010) are in agreement with those measured during the IOT
2004 (i.e. wave periods of 10–30 minutes and maximum
offshore amplitudes of 1–2 m; see Choowong et al., 2007; Tsuji
et al., 2006), they do not allow a prediction of unknown wave
parameters in prehistoric tsunami events. A smaller range of
the source area that would be necessary to improve the model
input parameters is limited by (1) missing reference samples
from water depths between 2 and 45 m, which hinders a further
differentiation on the basis of comparison, and (2) the low
inclination of the shelf that does not allow detailed discrimi-
nation of depth levels based on the ecological ranges of
foraminifera, as was done in other regions (e.g., by Nanayama
and Shigeno, 2006; Uchida et al., 2010).
CONCLUSIONSAlthough the application of sedimentation modelling with
TsuSedMod and the determination of sediment sources to
deposits of the IOT 2004 revealed chances for an assessment of
local tsunami magnitudes—values of modelled flow parame-
ters and transport distances are in good agreement with
independent observations—their application to prehistoric
tsunami deposits shows several limitations:
(1) In addition to assumptions concerning bed roughness and
Froude number, which as suggested by the results of the
IOT 2004, may be adequately estimated, the application
of TsuSedMod to prehistoric events requires further
assumptions of model parameters that are unknown for
past conditions. While land level and long-term sea level
changes may be reconstructed with reasonable precision,
uncertainties concerning the tide level at the time of
impact in particular significantly decrease the precision
of model predictions. For the youngest predecessor at Ban
Bang Sak (dated to 500–700 cal BP), this results in
modelled flow depths between 4.0 and 8.5 m if the whole
tidal range is taken into account.
(2) Although the analysed parameters generally enable
deduction of sediment source areas for onshore deposits
of extreme wave events, these estimates are rather
imprecise and partly only allow qualitative differentia-
tion (marine or terrestrial sources in geochemistry and
mineralogy and shelf, subtidal, littoral, or foredune
environments in granulometry). The best results could
be obtained from foraminifera associations. These may
allow further differentiation of sediment sources at water
depths between �2 and �45 m if more reference samples
from this zone are included in the analysis. However,
because species from the deepest part of the source area
would probably be underrated compared to species from
shallower waters, where more sediment is eroded, the
obtained values still would be minimum estimates.
Nevertheless, despite all of these uncertainties, both ap-
proaches at least allow qualitative comparison between modern
and prehistoric events and thus may provide information for a
relative magnitude assessment. In the case of Ban Bang Sak,
this enabled relation of the youngest predecessor (500–700 cal
BP) and several older events (1180–2000 cal BP) to tsunamis
with comparable magnitudes such as the IOT 2004, whereas
another tsunami candidate shows source areas attributed to a
storm or a small tsunami rather than a megaevent such as the
IOT 2004.
ACKNOWLEDGMENTSThis study was part of the Thai–German research cooper-
ation Tracing Tsunami Impacts On- and Offshore in the
Andaman Sea Region, financially supported by the National
Research Council of Thailand (Ref. GE3/2554) and the
German Research Foundation (Refs. PAK 228; BR 877/27-1,
-2; and KE 190/26-1), which is gratefully acknowledged.
Bruce Jaffe (U.S. Geological Survey) kindly provided Tsu-
SedMod and suggestions for application. We thank Dieter
Kelletat (Essen and Cologne) for helpful discussions and
advice both in the field and in the lab. Furthermore, we
appreciate the administrative and logistic support by Penjai
Sompongchaiyakul and Suratta Bunsomboonsakul (Chula-
longkorn University, Bangkok).
LITERATURE CITEDAd-hoc-Arbeitsgruppe Boden der Staatlichen Geologischen Dienste
und der Bundesanstalt fur Geowissenschaften und Rohstoffe (eds.),2005. Bodenkundliche Kartieranleitung. Stuttgart, Germany:Schweizerbart, 438p.
Apotsos, A.; Gelfenbaum, G., and Jaffe, B., 2012. Time-dependentonshore tsunami response. Coastal Engineering, 64, 73–86.
Apotsos, A.; Jaffe, B.; Gelfenbaum, G., and Elias, E., 2009. Modelingtime-varying tsunami sediment deposition. Proceedings of CoastalDynamics 2009: Impacts of Human Activities on Dynamic CoastalProcesses (Tokyo, Japan), pp. 1–15.
Bell, R.; Cowan, H.; Dalziell, E.; Evans, E.; O’Leary, M.; Rush, B., andYule, L., 2005. Survey of impacts on the Andaman coast, southernThailand following the great Sumatra–Andaman earthquake andtsunami of December 26, 2004. Bulletin of the New Zealand Societyof Earthquake Engineering, 38(3), 123–148.
Bilham, R.; Engdahl, E.R.; Feldl, N., and Satyabala, S.P., 2005.Partial and complete rupture of the Indo-Andaman plate boundary1847–2004. Seismological Research Letters, 76(3), 299–311.
Blott, S.J. and Pye, K., 2001. Gradistat: A grain size distribution andstatistics package for the analysis of unconsolidated sediments.Earth Surface Processes and Landforms, 26(11), 1237–1248.
Borreo, J., 2005. Field survey of northern Sumatra and Banda Aceh,Indonesia after the tsunami and earthquake of 26 December 2004.Seismological Research Letters, 76(3), 312–320.
Brill, D.; Bruckner, H.; Jankaew, K.; Kelletat, D.; Scheffers, A., andScheffers, S., 2011. Potential predecessors of the 2004 IndianOcean tsunami—sedimentary evidence of extreme wave events atBan Bang Sak, SW Thailand. Sedimentary Geology, 239(3–4), 146–161.
Brill, D.; Klasen, N.; Bruckner, H.; Jankaew, K.; Kelletat, D.;Scheffers, A., and Scheffers, S., 2012a. Local inundation distancesand regional tsunami recurrence in the Indian Ocean inferred fromluminescence dating of sandy deposits in Thailand. NaturalHazards and Earth System Sciences, 12, 2177–2192.
Brill, D.; Klasen, N.; Bruckner, H.; Jankaew, K.; Scheffers, A.;Kelletat, D., and Scheffers, S., 2012b: OSL dating of tsunamideposits from Phra Thong Island, Thailand. Quaternary Geochro-nology, 10, 224–229.
Journal of Coastal Research, Vol. 00, No. 0, 0000
Sediment Transport and Hydrodynamics of Tsunami Waves in Onshore Geoarchives 0
Choowong, M.; Muratoshi, N.; Hisada, K.; Charoentitirat, T.;Charusiri, P.; Phantuwongraj, S.; Wongkok, P.; Choowong, A.;Subsayjun, R.; Chutakositkanon, V.; Jankaew, K., and Kanjana-payont, P., 2008a. Flow conditions of the 2004 Indian Oceantsunami in Thailand, inferred from capping bedforms andsedimentary structures. Terra Nova, 20(2), 141–149.
Choowong, M.; Murakoshi, N.; Hisada, K.; Charusiri, P.; Doarerk, V.;Charoentitirat, T.; Chutakositkanon, V.; Jankaew, K., and Kanja-napayont, P., 2007. Erosion and deposition by the 2004 IndianOcean tsunami in Phuket and Phang-nga provinces, Thailand.Journal of Coastal Research, 23(5), 1270–1276.
Choowong, M.; Phantuwongraj, S.; Charoentitirat, T.; Chutakositka-non, V.; Yumuang, S., and Charusiri, P., 2008b. Beach recoveryafter 2004 Indian Ocean tsunami from Phang-nga, Thailand.Geomorphology, 104(3–4), 134–142.
Costa, P.J.; Andrade, C.; Freitas, M.C.; Oliveira, M.A.; Lopes, V.;Dawson, A.G.; Moreno, J.; Fatela, F., and Jouanneau, J.M., 2012. Atsunami record in the sedimentary archive of the central Algarvecoast, Portugal: characterizing sediment, reconstructing sourcesand inundation paths. The Holocene, 22(8), 899–914.
Davies, H.L.; Davies, J.M.; Perembo, R.C.B., and Lus, W.Y., 2003. TheAitape 1998 tsunami: reconstructing the event from interviews andfield mapping. Pure and Applied Geophysics, 160, 1895–922.
Dawson, A.; Hindson, R.; Andrade, C.; Freitas, C.; Parish, R., andBateman, M., 1995. Tsunami sedimentation associated with theLisbon earthquake of 1 November AD 1755: Boca do Rio, Algarve,Portugal. The Holocene, 5(2), 209–215.
Dheeradilok, P., 1995. Quaternary coastal morphology and depositionin Thailand. Quaternary International, 26, 49–54.
Di Geronimo, I.; Choowong, M., and Phantuwongraj, S., 2009.Geomorphology and superficial bottom sediments of Khao Lakcoastal area (SW Thailand). Polish Journal of EnvironmentalStudies, 18(1), 111–121.
Engel, M. and May, S.M., 2012. Bonaire’s boulder fields revisited:evidence for Holocene tsunami impact on the Leeward Antilles.Quaternary Science Reviews, 54, 126–141.
Fagherazzi, S. and Du, X., 2008. Tsunamigenic incisions produced bythe December 2004 earthquake along the coasts of Thailand,Indonesia and Sri Lanka. Geomorphology, 99(1–4), 120–129.
Feldens, P.; Schwarzer, K.; Sakuna, D.; Szczucinski, W., andSomgpongchaiykul, P., 2012. Sediment distribution on the innercontinental shelf off Khao Lak (Thailand) after the 2004 IndianOcean tsunami. Earth Planets Space, 64, 875–887.
Feldens, P.; Schwarzer, K.; Szczucinski, W.; Stattegger, K.; Sakuna,D., and Somgpongchaiykul, P., 2009. Impact of 2004 tsunami onseafloor morphology and offshore sediments, Pakarang Cape,Thailand. Polish Journal of Environmental Studies, 18(1), 63–68.
Fenton, C. and Sutiwanich, C., 2005. Paleoseismic investigation of theRanong and Khlong Marui faults, Chumphon Province, SouthernThailand. Presented at the American Geophysical Union FallMeeting 2005 (San Francisco, AGU).
Folk, R.L. and Ward, W.C., 1957. Brazos River bar: a study in thesignificance of grain size parameters. Journal of SedimentaryPetrology, 27(1), 3–26.
Fujiwara, O. and Kamataki, T., 2008. Tsunami depositional processesreflecting the waveform in a small bay: interpretation from thegrain-size distribution and sedimentary structures. In: Shiki, T.;Tsuji, Y., and Yamazaki, T. (eds.), Tsunamiites: Features andImplications. Oxford, United Kingdom: Elsevier Science, pp. 133–152.
Goto, K.; Imamura, F.; Keerthi, N.; Kunthasap, P.; Matsui, T.;Minoura, K.; Ruangrassamee, A.; Sugawara, D., and Supharatid,S., 2008. Distribution and significance of the 2004 Indian Oceantsunami deposits: initial results from Thailand and Sri Lanka. In:Shiki, T.; Tsuji, Y., and Yamazaki, T. (eds.), Tsunamiites: Featuresand Implications. Oxford, United Kingdom: Elsevier Science, pp.105–122.
Goto, K.; Okada, K., and Imamura, F., 2010. Numerical analysis ofboulder transport by the 2004 Indian Ocean tsunami at PakarangCape, Thailand. Marine Geology, 268(1–4), 97–105.
Grand Pre, C.A.; Horton, B.; Kelsey, H.; Rubin, C.; Hawkes, A.;Daryono, M.; Rosenberg, G., and Culver, S., 2012. Stratigraphic
evidence for an early Holocene earthquake in Aceh, Indonesia.Quaternary Science Reviews, 54, 142–151.
Hammer, Ø.; Harper, D.A.T., and Ryan, P.D., 2001. PAST: paleon-tological statistics software package for education and dataanalysis. Palaeontologia Electronica, 4(1), 1–9.
Hawkes, A.D.; Bird, M.; Cowie, S.; Grundy-Warr, C.; Horton, B.P.;Tan Shau Hwai, A.; Law, L.; Macgregor, C.; Nott, J.; Eong Ong, J.;Rigg, J.; Robinson, R.; Tan-Mullins, M.; Tiong Sa, T.; Yasin, Z., andWan Aik, L., 2007. Sediments deposited by the 2004 Indian Oceantsunami along the Malaysia–Thailand Peninsula. Marine Geology,242(1–3), 169–190.
Hori, K.; Kuzumoto, R.; Hirouchi, D.; Umitsu, M.; Janjirawuttikul,N., and Patanakanog, B., 2007. Horizontal and vertical variation of2004 Indian tsunami deposits: an example of two transects alongthe western coast of Thailand. Marine Geology, 239(3–4), 163–172.
Horton, B.P.; Sawai, Y.; Hawkes, A.D., and Witter, R.C., 2011.Sedimentology and paleontology of a tsunami deposit accompany-ing the great Chilean earthquake of February 2010. MarineMicropaleontology, 79(3–4), 132–138.
Jaffe, B. and Gelfenbaum, G., 2007. A simple model for calculatingtsunami flow speed from tsunami deposits. Sedimentary Geology,200(3–4), 347–361.
Jaffe, B.; Goto, K.; Sugawara, D.; Richmond, B.; Fujino, S., andNishimura, Y., 2012. Flow speed estimated by inverse modelling ofsandy tsunami deposits: results from the 11 March 2011 tsunamion the coastal plain near the Sendai Airport, Honshu, Japan.Sedimentary Geology, 282, 90–109.
Jaffe, B.; Buckley, M.; Richmond, B.; Strotz, L.; Etienne, S.; Clark, K.;Watt, S.; Gelfenbaum, G., and Goff, J., 2011. Flow speed estimatedby inverse modeling of sandy sediment deposited by the 29September 2009 tsunami near Satitoa, east Upolu, Samoa. Earth-Science Reviews, 107(1–2), 23–37.
Jankaew, K.; Atwater, B.F.; Sawai, Y.; Choowong, M.; Charoentitirat,T.; Martin, M.E., and Prendergast, A., 2008. Medieval forewarningof the 2004 Indian Ocean tsunami in Thailand. Nature, 455, 1228–1231.
Kelletat, D.; Scheffers, S.R., and Scheffers, A., 2007. Field signaturesof the SE-Asian mega-tsunami along the west coast of Thailandcompared to Holocene paleo-tsunami from the Atlantic region. Pureand Applied Geophysics, 164, 413–431.
Lay, T.; Kanamori, H.; Ammon, C.J.; Nettles, M.; Ward, S.N.; Aster,R.C.; Beck, A.L.; Bilek, S.L.; Brudzinski, M.R.; Butler, R.; Deshon,H.R.; Ekstrom, G.; Satake, K., and Sipkin, S., 2005. The greatSumatra–Andaman earthquake of 26 December 2004. Science, 308,1127–1133.
Liu, P.; Lynett, P.; Fernando, H.; Jaffe, B.; Fritz, H.; Higman, B.;Morton, R.; Goff, J., and Synolakis, C., 2005. Observations by theinternational tsunami survey team in Sri Lanka. Science, 308,1595.
Loeblich, A.R. and Tappan, H., 1994. Foraminifera of the Sahul Shelfand Timor Sea., Special Publication 31. Washington DC: CushmanFoundation for Foraminiferal Research, 661p.
Loeblich, A.R. and Tappan, H., 1987. Foraminiferal Genera and TheirClassification. New York: Van Nostrand Reinhold, 2 volumes,1182p.
Lvholt, F.; Bungum, H.; Harbitz, C.B.; Glimsdal, S.; Lindholm, C.D.,and Pedersen, G., 2006. Earthquake related tsunami hazard alongthe western coast of Thailand. Natural Hazards and Earth SystemScience, 6, 979–997.
Malik, J.N.; Shishikura, M.; Echigo, T.; Ikeda, Y.; Satake, K.;Kayanne, H.; Sawai, Y.; Murty, C.V.R., and Dishit, O., 2011.Geologic evidence for two pre-2004 earthquakes during recentcenturies near Port Blair, South Andaman Island, India. Geology,39(6), 559–562.
Meltzner, A.J; Sieh, K.; Chiang, H.-W.; Shen, C.-C.; Suwargadi, B.W.;Natawidjaja, D.H.; Philibosian, B.E.; Briggs, R.W., and Galetzka,J., 2010. Coral evidence for earthquake recurrence and an AD1390–1455 cluster at the south end of the 2004 Aceh-Andamanrupture. Journal of Geophysical Research, 115(B10402), 1–46.
Monecke, K.; Finger, W.; Klarer, D.; Kongko, W.; McAdoo, B.G.;Moore, A.L., and Sudrajat, S.U., 2008. A 1,000-year sediment
Journal of Coastal Research, Vol. 00, No. 0, 0000
0 Brill et al.
record of tsunami recurrence in northern Sumatra. Nature, 455,1232–1234.
Moore, A.; Goff, J.; McAdoo, B.; Fritz, H.; Gusman, A.; Kalligeris, N.;Kalsum, K.; Susanto, A.; Suteja, D., and Synolakis, C., 2011.Sedimentary deposits from the 17 July 2006 western Java tsunami,Indonesia: use of grain size analyses to assess tsunami flow depth,speed, and traction carpet characteristics. Pure and AppliedGeophysics, 168, 1951–1961.
Moore, A.L.; McAdoo, B.G., and Ruffman, A., 2007. Landward finingfrom multiple sources in a sand sheet deposited by the 1929 GrandBanks tsunami, Newfoundland. Sedimentary Geology, 200(3–4),336–346.
Morton, R.; Gelfenbaum, G., and Jaffe, B.E., 2007. Physical criteriafor distinguishing sandy tsunami and storm deposits using modernexamples. Sedimentary Geology, 200(3–4), 184–207.
Murty, T.S. and Flather, R.A., 2004. Impact of storm surges in theBay of Bengal. In: Finkl, C.W. (ed.), Coastal Hazards. Journal ofCoastal Research, Special Issue No. 12, pp. 149–161.
Nagendra, R.; Kamalak Kannan, B.V.; Sajith, C.; Sen, G.; Reddy,A.N., and Srinivasalu, S., 2005. A record of foraminiferalassemblage in tsunami sediments along Nagappattinam coast,Tamil Nadu. Current Science, 89(11), 1947–1952.
Nanayama, F. and Shigeno, K., 2006. Inflow and outflow facies fromthe 1993 tsunami in southwest Hokkaido. Sedimentary Geology,187(3–4), 139–158.
Nanayama, F.; Satake, K.; Furukawa, R.; Shimokawa, K.; Atwater,B.F.; Shigeno, K., and Yamaki, S., 2003. Unusually largeearthquakes inferred from tsunami deposits along the Kuriltrench. Nature, 424, 660–663.
Naruse, H.; Fujino, S.; Suphawajruksakul, A., and Jarupongsakul, T.,2010. Features and formation processes of multiple depositionlayers from the 2004 Indian Ocean tsunami at Ban Nam Khem,southern Thailand. Island Arc, 19(3), 399–411.
Nott, J., 2003. Waves, coastal boulder deposits and the importance ofthe pre-transport setting. Earth and Planetary Science Letters,210(1–2), 269–276.
Okal, E.A. and Synolakis, C.E., 2008. Far-field tsunami hazard frommega-thrust earthquakes in the Indian Ocean. GeophysicalJournal International, 172, 995–1015.
Osborne, A.R. and Burch, T.L., 1980. Internal solitons in theAndaman Sea. Science, 208, 451–460.
Papadopoulos, G. and Imamura, F., 2001. A proposal for a newtsunami intensity scale. ITS Proceedings, 5(1), 569–577.
Paris, R.; Wassmer, P.; Sartohadi, J.; Lavigne, F.; Barthomeuf, B.;Desgages, E.; Grancher, D.; Baumert, P.; Vautier, F.; Brunstein,D., and Gomez, C., 2009. Tsunamis as geomorphic crises: lessonsfrom the December 26, 2004 tsunami in Lhok Nga, West BandaAceh (Sumatra, Indonesia). Geomorphology, 104(1–2), 59–72.
Peters, R. and Jaffe, B.E., 2010. Identification of Tsunami Deposits inthe Geologic Record: Developing Criteria Using Recent TsunamiDeposits. U.S. Geological Survey Open-File Report 1239, 39p.
Peterson, C.; Carver, G.; Cruikshank, K.; Abramson, H.; Garrison-Laney, C., and Dengler, L, 2011. Evaluation of the use ofpaleotsunami deposits to reconstruct inundation distance andrunup heights associated with prehistoric inundation events,Crescent City, southern Cascadia margin. Earth Surface Processesand Landforms, 36, 967–980.
Pinegina, T.K. and Bourgeois, J., 2001. Historical and paleo-tsunamideposits on Kamchatka, Russia: long-term chronologies and long-distance correlations. Natural Hazards and Earth System Sciences,1, 177–185.
Prendergast, A.; Cupper, M.L.; Jankaew, K., and Sawai, Y., 2012.Indian Ocean tsunami recurrence from optical dating of tsunamisand sheets in Thailand. Marine Geology, 295–298, 20–27.
Pritchard, D. and Dickinson, L., 2008. Modelling the sedimentarysignature of long waves on coasts: implications for tsunamireconstruction. Sedimentary Geology, 206(1–4), 42–57.
Rajendran, C.P.; Rajendran, K.; Machado, T.; Satyamurthy, T.;Aravazhi, P., and Jaiswal, M., 2006. Evidence of ancient seasurges at the Mamallapuram coast of India and implications forprevious Indian Ocean tsunami events. Current Science, 91(9),1242–1247.
Rajendran, K.; Rajendran, C.P.; Earnest, A.; Ravi Prasad, G.V.;Dutta, K.; Ray, D.K., and Anu, R., 2008. Age estimates of coastalterraces in the Andaman and Nicobar Islands and their tectonicimplications. Tectonophysics, 455(1–4), 53–60.
Richmond, B.; Buckley, M.; Etienne, S.; Chague-Goff, C.; Clark, K.;Goff, J.; Dominey-Howes, D., and Strotz, L., 2011. Deposits, flowcharacteristics, and landscape change resulting from the Septem-ber 2009 South Pacific tsunami in the Samoan islands. Earth-Science Reviews, 107(1–2), 38–51.
Rosetto, T.; Peiris, A.; Pomonis, A.; Wilkinson, S.M; Del Re, D.; Koo,R., and Gallocher, S., 2007. The Indian Ocean tsunami of December26, 2004: observations in Sri Lanka and Thailand. NaturalHazards, 42, 105–124.
Sakuna, D.; Szczucinski, W.; Feldens, P.; Schwarzer, K., andKhokiattiwong, S., 2012. Sedimentary deposits left by the 2004Indian Ocean tsunami on the inner continental shelf offshore ofKhao Lak, Andaman Sea (Thailand). Earth Planets Space, 64, 931–943.
Sawai, Y.; Jankaew, K.; Martin, M.E.; Prendergast, A.; Choowong,M., and Charoentitirat, T., 2009. Diatom assemblages in tsunamideposits associated with the 2004 Indian Ocean tsunami at PhraThong Island, Thailand. Marine Micropaleontology, 73(1–2), 70–79.
Scheffers, A.; Brill, D.; Kelletat, D.; Bruckner, H.; Scheffers, S., andFox, K., 2012. Holocene sea levels along the Andaman Sea Coast ofThailand. The Holocene, 22(10), 1169–1180.
Sinsakul, S., 1992. Evidence of Quaternary sea level changes in thecoastal areas of Thailand: a review. Journal of Southeast AsianEarth Sciences, 7(1), 23–37.
Smith, D.E.; Foster, I.D.L.; Long, D., and Shi, S., 2007. Reconstruct-ing the pattern and depth of flow onshore in a paleotsunami fromassociated deposits. Sedimentary Geology, 200(3–4), 362–371.
Soulsby, R.L.; Smith, D.E., and Ruffman, A., 2007. Reconstructingtsunami run-up from sedimentary characteristics—a simple math-ematical model. Coastal Sediments ’07: Proceedings of the 6thInternational Symposium on Coastal Engineering and Science ofCoastal Sediment Processes (New Orleans, Louisiana), Volume 2,pp. 1075–1088.
Spiske, M.; Weiss, R.; Bahlburg, H.; Roskosch, J., and Amijaya, H.,2010. The TsuSedMod inversion model applied to the deposits ofthe 2004 Sumatra and 2006 Java tsunami and implications forestimating flow parameters of paleo-tsunami. Sedimentary Geolo-gy, 224(1–4), 29–37.
Srisutam, C. and Wagner, J.-F., 2010. Tsunami sediment character-istics at the Thai Andaman coast. Pure and Applied Geophysics,167, 215–232.
Subarya, C.; Chlieh, M.; Prawirodirdjo, L.; Avouac, J.P.; Bock, Y.;Sieh, K.; Meltzner, A.J.; Natawidjaja, D.H., and McCaffery, R.,2006. Plate-boundary deformation associated with the greatSumatra–Andaman earthquake. Nature, 440, 46–51.
Sugawara, D.; Minoura, K., and Imamura, F., 2008. Tsunamis andtsunami sedimentology. In: Shiki, T.; Tsuji, Y., and Yamazaki, T.(eds.), Tsunamiites: Features and Implications. Oxford, UnitedKingdom: Elsevier Science, pp. 9–49.
Sumatra Earthquake Tsunami Field Survey Staff, 2005. TheDecember 26, 2004 Sumatra earthquake tsunami, tsunami fieldsurvey around Phuket, Thailand. http://www.drs.dpri.kyoto-u.ac.jp/sumatra/thailand/phuket_survey_e.html (accessed 10 December2012).
Switzer, A.D. and Jones, B.G., 2008. Large-scale overwash sedimen-tation in a freshwater lagoon from the southeast Australian coast:sea-level change, tsunami or exceptionally large storm? TheHolocene, 18(5), 787–803.
Switzer, A.D.; Pucillo, K.; Haredy, R.A.; Jones, B.G., and Bryant,E.A., 2005. Sea level, storm or tsunami: enigmatic sand sheetdeposits in a sheltered coastal embayment from southeastern NewSouth Wales, Australia. Journal of Coastal Research, 21(4), 655–663.
Szczucinski, W., 2012. The post-depositional changes of the onshore2004 tsunami deposits on the Andaman Sea coast of Thailand.Natural Hazards, 60, 115–133.
Szczucinski, W.; Chaimanee, N.; Niedzielski, P.; Rachlewicz, G.;Saisuttichai, D.; Tepsuwan, T.; Lorenc, S., and Siepak, J., 2006.
Journal of Coastal Research, Vol. 00, No. 0, 0000
Sediment Transport and Hydrodynamics of Tsunami Waves in Onshore Geoarchives 0

Environmental and geological impacts of the 26 December 2004
tsunami in coastal zone of Thailand—overview of short and long-
term effects. Polish Journal of Environmental Studies, 15(5), 793–
810.
Tsuji, Y.; Namegaya, Y.; Matsumotu, H.; Iwasaki, S.; Kanbua, W.;
Sriwichai, M., and Meesuk, V., 2006. The 2004 Indian tsunami in
Thailand: surveyed runup heights and tide gauge records. Earth
Planets Space, 58(2), 223–232.
Uchida, J.; Fujiwara, O.; Hasegawa, S., and Kamataki, T., 2010.
Sources and depositional processes of tsunami deposits: analysis
using foraminiferal tests and hydrodynamic verification. Island
Arc, 19(3), 427–442.
Umitsu, M.; Tanavud, C., and Patanakanog, B., 2007. Effects oflandforms on tsunami flow in the plains of Banda Aceh, Indonesia,and Nam Khem, Thailand. Marine Geology, 242(1–3), 141–153.
Watkinson, I.; Elders, C., and Hall, R., 2008. The kinematic history ofthe Khlong Marui and Ranong faults, southern Thailand. Journalof Structural Geology, 30(12), 1554–1571.
WoRMS (World Register of Marine Species), 2012. Foraminifera.http://www.marinespecies.org/aphia.php?p¼taxdetails&id¼1410(accessed June 2012).
Yawsangratt, S.; Szczucinski, W.; Chaimanee, N.; Jagodzinski, R.;Lorenc, S.; Chatprasert, S.; Saisuttichai, D., and Tepsuwan, T.,2009. Depositional effects of 2004 tsunami and hypotheticalpaleotsunami near Thap Lamu Navy Base in Phang Nga Province,Thailand. Polish Journal of Environmental Studies, 18(1), 17–23.
Journal of Coastal Research, Vol. 00, No. 0, 0000
0 Brill et al.