secondary structure polymorphism in oxytricha nova telomeric dna
TRANSCRIPT
Secondary structure polymorphism in Oxytrichanova telomeric DNAChristoph Krafft, James M. Benevides and George J. Thomas Jr*
Division of Cell Biology and Biophysics, School of Biological Sciences, University of Missouri±Kansas City,Kansas City, MO 64110-2499, USA
Received May 31, 2002; Revised and Accepted July 23, 2002
ABSTRACT
Tandem repeats of the telomeric DNA sequenced(T4G4) of Oxytricha nova are capable of formingunusually stable secondary structures incorporat-ing Hoogsteen hydrogen bonding interactions. Thebiological signi®cance of such DNA structures issupported by evidence of speci®c recognition oftelomere end-binding proteins in the crystal state.To further characterize structural polymorphism ofOxytricha telomeric DNAs, we have obtained andinterpreted Raman, ultraviolet resonance Raman(UVRR) and circular dichroism (CD) spectra of thetandem repeats d(G4T4G4) (Oxy1.5), d(T4G4)2 (Oxy2)and dT6(T4G4)2 (T6Oxy2) and related non-telomericisomers in aqueous salt solutions. Raman markersof Oxy1.5 identify both C2¢-endo/anti and C2¢-endo/syn conformations of the deoxyguanosine residuesand Hoogsteen hydrogen bonded guanine quartets,consistent with the quadruplex fold determined pre-viously by solution NMR spectroscopy. Raman,UVRR and CD signatures and Raman dynamicmeasurements, to monitor imino NH®ND exchan-ges, show that the Oxy1.5 antiparallel quadruplexfold is distinct from the hairpin structures of Oxy2and T6Oxy2, single-stranded structures of d(TG)8and dT6(TG)8 and previously reported quadruplexstructures of d(T4G4)4 (Oxy4) and dG12. Spectralmarkers of the telomeric and telomere-related DNAstructures are tabulated and novel Raman andUVRR indicators of thymidine and deoxyguanosineconformations are identi®ed. The results will beuseful for probing structures of Oxytricha telomericrepeats in complexes with telomere end-bindingproteins.
INTRODUCTION
Telomeres, the protein±DNA complexes that protect the endsof eukaryotic chromosomes from degradation and fusion, areessential for a variety of cellular functions (1). The telomericDNA strand that is oriented in the 5¢®3¢ direction is
distinguished by multiple repeats of the sequence d(TnAm
G3±4), where n and m are small integers. The guanine-richtelomeric segment may range in size from several base pairs totens of kilobase pairs. A single-stranded overhang at theterminus of the guanine-rich strand is a feature that isconserved among protozoa (2), yeast (3) and mammals (4). Inthe ciliated protozoan Oxytricha nova this telomeric 3¢overhang consists of the 16 base sequence d(T4G4)2, alsoreferred to as Oxy2. Recent studies suggest that molecularmechanisms of telomere maintenance may also be conservedamong different eukaryotic species (5,6).
Telomeric DNA sequences are remarkable for their abilityto form highly stable quadruplex structures in vitro (7). Anintermolecular quadruplex structure of the Oxytricha telo-meric sequence d(G4T4G4) (Oxy1.5), in which Hoogsteenhydrogen bonded guanine quartets (Fig. 1A) tether fourstrands in parallel (Fig. 1E), has been reported to accompanythermal denaturation of the Watson±Crick duplex d(G4T4G4)´d(C4A4C4) in the presence of high concentrations of alkalimetal ions (8). On the other hand, the tandem repeat d(T4G4)4
(Oxy4) readily forms an intramolecular quadruplex distin-guished by antiparallel folding of the DNA backbone andguanine quartets (8). Alkali metal ions facilitate conversion ofthis `foldback' structure to the intermolecular parallelquadruplex (9,10). Variants of the foldback secondary struc-ture have also been demonstrated for dimers of Oxy1.5 in thecrystal (Fig. 1B) (11) and solution (Fig. 1C) states (12). In thecase of Oxy2, a solution hairpin fold stabilized by HoogsteenG´G pairs has been proposed (Fig. 1D; 10).
Folded secondary structures of Oxytricha telomericsequences are characterized by thymidine loops (dT4) andHoogsteen hydrogen bonded dG residues in both the C2¢-endo/syn and C2¢-endo/anti conformations. Because Ramanmarker bands have been established for both the dT4 loop andfor syn and anti dG moieties (8,10,13±15), Raman spectros-copy provides a convenient probe of these structural features.In addition, Raman monitoring of hydrogen isotope exchangedynamics differentiates between guanines involved in theformation of Hoogsteen pairs and quartets (10,15). Thecapability of Raman spectroscopy to probe equilibrium anddynamic properties of telomeric DNA structures can beextended to dilute DNA solutions (~10 mM) through thetechnique of UV resonance Raman spectroscopy (UVRR)using 257 nm excitation (16±19).
*To whom correspondence should be addressed. Tel: +1 816 235 5247; Fax: +1 816 235 1503; Email: [email protected] address:Christoph Krafft, Institut fuÈr Analytische Chemie, Technische UniversitaÈt Dresden, D-01062 Dresden, Germany
ã 2002 Oxford University Press Nucleic Acids Research, 2002, Vol. 30 No. 18 3981±3991
by guest on February 8, 2016http://nar.oxfordjournals.org/
Dow
nloaded from

Here, we report Raman and UVRR signatures of thesecondary structures formed by the Oxytricha telomeric DNAsequences Oxy1.5, Oxy2 and T6Oxy2 in aqueous solutionscontaining either Na+ or both Na+ and K+. We also computedifference spectra diagnostic of structural transitions betweenfolded and unfolded states of these sequences. The T6Oxy2oligomer differs from Oxy2 by the addition of six dT residuesat the 5¢ terminus. Such a 5¢ leader may be required forrecognition of telomeric DNA by cellular telomere-bindingfactors in vivo (20±22). The Raman and UVRR spectra are
complemented by corresponding circular dichroism (CD)spectra, which are compared with previously reported CDpro®les of telomeric DNA (23). The results allow identi®ca-tion of tertiary folds common to different repeats of theOxytricha telomeric sequence and provide a reference libraryfor future characterization of structure transformationsinduced by binding of telomere-speci®c factors. The presentresults extend previous Raman investigations of Oxy2 andOxy4 (8±10,15) and X-ray and NMR studies of Oxy1.5(11,12,24±26).
MATERIALS AND METHODS
Sample preparation
Oligonucleotides d(G4T4G4) (Oxy1.5), d(T4G4)2 (Oxy2),dT6(T4G4)2 (T6Oxy2), d(TG)8 and dT6(TG)8 were synthe-sized by standard methods and puri®ed on an ISCO model2350 HPLC system (ISCO, Lincoln, NE) using a HamiltonPRP-1 reversed-phase column. The column was heated to90°C to ensure denaturation of DNA secondary structureduring puri®cation. For HPLC, samples were dissolved in0.1 M triethylamine acetate, pH 8. Optima grade acetonitrile(Fisher Scienti®c, Pittsburgh, PA) was used for elution. The®rst chromatographic step separated detritylated failuresequences from the correct sequence containing the tritylgroup. Peak fractions were pooled, lyophilized and detrity-lated in 80% acetic acid. The pure oligonucleotide wasobtained after a second chromatographic step. The sampleswere desalted by dialysis (1000 molecular weight cut-off)against water. DNA concentrations were determined usingan average nucleotide molar extinction at 260 nm of9850 M±1´cm±1. Puri®ed DNA was dissolved to 15 mg/ml inwater and adjusted to pH 7.2 6 0.2, using either dilute HCl orNaOH, and lyophilized. The lyophilizate was dissolved to~30 mg/ml in 50 mM TEN sample buffer (10 mM Tris pH 7.2,1 mM EDTA, 50 mM NaCl).
The samples of Oxy1.5, Oxy2 and T6Oxy2 examined byspectroscopic methods were also characterized by PAGEunder non-denaturing conditions (data not shown). Oxy1.5migrated as a single, highly folded species, presumed to be aquadruplex. Both Oxy2 and T6Oxy2 migrated more slowlythan Oxy1.5 but more rapidly than the single-stranded modelsd(TG)8 and dT6(TG)8. This is consistent with the formation ofsimilarly folded secondary structures distinct from thequadruplex (10).
Raman spectroscopy
Aliquots (6 ml) of samples were sealed in glass capillary tubes(Kimax no. 34507) for Raman spectroscopy. Spectra wereexcited with the 532 nm line of a solid state Nd:YVO4 laser(Verdi model V; Coherent, Santa Clara, CA) using 200 mW ofradiant power at the sample. Rayleigh scattered light wasseparated by a notch ®lter. Raman scattered light wascollected with a single spectrograph (500M; SPEXIndustries, Metuchen, NJ) equipped with a liquid nitrogen-cooled, charge-coupled device detector. The spectrometer wascalibrated with indene and CCl4 as wavenumber standards.Reported Raman wavenumbers are accurate to 61 cm±1 forsharp bands and to within 62 cm±1 for broad or overlappingbands. Sample temperature was maintained at 10°C during
Figure 1. (A) Hoogsteen hydrogen bonded guanine quartet. (B) Crystalstructure of d(G4T4G4) (Oxy1.5) incorporating guanine quartets (11).(C) Solution structure of Oxy1.5 incorporating guanine quartets (12).(D) Hairpin structure of d(T4G4)2 (Oxy2) incorporating G´G pairs (10).(E) Parallel-stranded quadruplex structure of Oxy2 (9).
3982 Nucleic Acids Research, 2002, Vol. 30 No. 18
by guest on February 8, 2016http://nar.oxfordjournals.org/
Dow
nloaded from
data collections by use of a thermostat designed for the 90°scattering geometry. In a typical data collection protocol, four10 min exposures were accumulated and averaged. Solventcompensations and other spectral manipulations were accom-plished using standard software routines (Galactic IndustriesCorp., Salem, NH).
Time-resolved Raman spectroscopy to monitor deuteriumexchange of Oxy1.5 in D2O solution was carried out usingprotocols similar to those described previously for Oxy4 andOxy2 (10,15). Brie¯y, the DNA was lyophilized from 50 mMTEN sample buffer and redissolved to the same volume inD2O. The sample was sealed in a glass capillary andthermostated at 20°C for collection of data as H®D exchangeprogressed.
UV resonance Raman spectroscopy
Samples of dT6(TG)8, dT6(T4G4)2, d(TG)8, d(T4G4)2 andd(G4T4G4) were prepared in low salt (25 mM Na2SO4) andhigh salt (25 mM Na2SO4, 150 mM KCl) buffers at DNAconcentrations of 10, 10, 14, 14 and 19 mM, respectively, bydilution of 30 mg/ml stock solutions. An aliquot (120 ml) ofeach sample was transferred to a cylindrical quartz cellmounted in an air-driven thermostated sample rotator(~300 r.p.m.). UVRR spectra were excited with the 257 nmline of a continuous wave, frequency-doubled argon ion laser(model FreD; Coherent, Santa Clara, CA) using ~1 mW ofradiant power at the sample. Further details of this instru-mentation have been described (27,28). No sample photo-decomposition could be detected for exposure times up to~6 min. Wavenumbers of reported UVRR bands are accurateto 62 cm±1.
Circular dichroism spectroscopy
CD spectra in the region 240±330 nm were recorded on aJasco-720 spectropolarimeter (Jasco, Easton, MD) usingcells of 1 cm optical path and an instrument scan speed of20 nm/min with a response time of 1 s. For CD spectroscopy,DNA solutions were prepared at 3 mM in 10 mM sodiumphosphate, pH 7.5.
RESULTS AND INTERPRETATION
Characterization of telomeric and non-telomeric DNAsequences
Circular dichroism spectroscopy. CD spectra (240±330 nm) ofnon-telomeric sequence isomers d(TG)8 and dT6(TG)8
(Fig. 2A) exhibit a single sharp ellipticity maximum at280 nm and a minimum of lesser amplitude near 258±260 nm,consistent with single-stranded helical conformations stabil-ized by the stacking of bases (29,30). CD spectra of Oxy1.5,Oxy2 and T6Oxy2 (Fig. 2B) are more complex. Oxy1.5, twomolecules of which form a quadruplex containing onlyinterstrand hydrogen bonding (Fig. 1C; 12), exhibits a troughat 265 nm and peaks at 246 and 295 nm diagnostic of guaninequartets (23). Figure 2B shows that this signature changes asthe d(G4T4G4) sequence is extended by 5¢-thymidylate leadersof four (Oxy2) and 10 residues (T6Oxy2). Thus, Oxy2 exhibitssubstantially lower amplitudes at 246, 265 and 295 nm and adistinct positive band at 278 nm not apparent in the Oxy1.5CD spectrum. For T6Oxy2, the attenuations of positive
ellipticities at wavelengths below 260 nm and above 290 nmare even more pronounced and the spectrum is stronglydominated by a maximum at 278 nm and minimum at 258 nm.
Computed T6Oxy2 ± Oxy2 and dT6(TG)8 ± d(TG)8
difference spectra are virtually superimposable (Fig. 2C),indicating similar folds. Also, the difference signatures ofFigure 2C closely approximate the spectra of Figure 2A,implying a single-stranded base stack for the dT6 leader.Likewise, the Oxy2 ± d(TG)8 and T6Oxy2 ± dT6(TG)8
differences of Figure 2D are nearly congruent, consistent witha common G4T4G4 fold. CD signatures of these sequences arethus well explained as sums of modules contributed byconstituent folds.
A further manipulation of the CD data is instructive.Assuming that the CD contribution from the single-stranded5¢-dT4 leader of Oxy2 can be represented by 2/3 of the CDcontribution from the dT6 leader of T6Oxy2 (as generated inFig. 2C), then the difference Oxy2 ± dT4 (Fig. 2D, ®lledcircles) should approximate the CD contribution of theG4T4G4 fold of Oxy2. We propose this CD pro®le,characterized by ellipticity maxima near 255 and 300 nm, asdiagnostic of the secondary structure of the folded G4T4G4
domain of Oxy2. This fold consists of a hairpin stabilized byHoogsteen G´G pairs (10) and the proposed CD signaturediffers signi®cantly from that of the Oxy1.5 quadruplex(Fig. 2B). The data of Figure 2D are also consistent with ahairpin secondary structure for the folded G4T4G4 domain ofT6Oxy2. In summary, the CD data distinguish the antiparallelquadruplex fold of the Oxy1.5 dimer (Fig. 1C) from theantiparallel hairpin folds of Oxy2 and T6Oxy2 monomers(Fig. 1D). Further distinction is provided by the Raman andUVRR spectra discussed below.
The telomeric DNA samples yielding the CD spectra ofFigure 2B were also examined by PAGE under non-denaturing conditions (data not shown). The gels con®rmthat T6Oxy2 and Oxy2 migrate as hairpins and that thepreparations are free of appreciable quantities of quadruplexesor higher order aggregates.
Raman spectroscopy. The Raman spectrum of Oxy1.5(Fig. 3A, top trace) exhibits prominent phosphodiester mark-ers at 835 and 1091 cm±1, indicating g±/g± O±P conformationsof the C5¢±O5¢±P±O3¢±C3¢ network. This conformation alsooccurs in double-helical B-DNA and telomeric quadruplexes(8,31). Raman markers at 1336 and 684 cm±1 identify the C2¢-endo/anti dG conformation, whereas the marker at 1325 cm±1
and the partially resolved shoulder near 670 cm±1 identify C2¢-endo/syn dG (8,32,33). Thymidines of the Oxy1.5 loopproduce the weak band near 610 6 2 cm±1 and also contributeto the Raman intensity near 668 cm±1 (15,30). Markers near610 and 668 cm±1 are assigned to thymidines of the dT4 loop(15,34). The data indicate comparable populations of C2¢-endo/anti and C2¢-endo/syn dG conformers and predominantlyC2¢-endo/anti dT conformers in Oxy1.5. Raman markers at1482 and 1722 cm±1, which are sensitive to guanine hydrogenbonding (8,15,35,36), indicate that both N7 and O6 participatein interbase hydrogen bonding (Table 1). All of the key Ramanmarkers of Oxy1.5 are therefore consistent with the structureof Figure 1C.
The Oxy2 and T6Oxy2 Raman signatures are distinguishedfrom Oxy1.5 by the intensities of thymidine marker bands
Nucleic Acids Research, 2002, Vol. 30 No. 18 3983
by guest on February 8, 2016http://nar.oxfordjournals.org/
Dow
nloaded from

(Fig. 3A). Oxy2 and T6Oxy2 also exhibit electrophoreticmobilities and protium/deuterium (H/D) exchange kineticscharacteristic of a hairpin structure containing Hoogsteen G´Gpairs (Fig. 3A) (10). As in the case of Oxy1.5, these secondarystructures contain equal populations of C2¢-endo/syn and C2¢-endo/anti dG conformers and primarily C2¢-endo/anti dTconformers in their dT4 loops.
In contrast to the telomeric DNA sequences of Figure 3A,for which the dominant peak of the 660±690 cm±1 intervaloccurs at 684 cm±1, the non-telomeric sequences of Figure 3Bexhibit their dominant peak at signi®cantly lower wave-number. Thus, the bands centered at 675 cm±1 in d(TG)8 andat 669 cm±1 in dT6(TG)8 consist mainly of overlappingcontributions from the dT conformer (C2¢-endo/anti dT at~668 cm±1) and the principal dG conformer (C2¢-endo/syn dGat 675 cm±1). The greater dT composition in dT6(TG)8 versusd(TG)8 has the effect of displacing the band to a slightlylower wavenumber value (Table 1). Interestingly, the 1300±1350 cm±1 pro®le of each non-telomeric sequence also appearsto consist of two overlapping components, a dominant peak at1322 cm±1 (C2¢-endo/syn dG) and a weaker shoulder at1336 cm±1 (C2¢-endo/anti dG). The minor population of thelatter dG conformer presumably accounts for the broad wingon the high wavenumber side of the 675 cm±1 peak in d(TG)8
and the 669 cm±1 peak in dT6(TG)8. The non-telomericsequences of Figure 3B lack a dT loop and therefore give nomarker near 610 6 2 cm±1. Likewise, Raman bands charac-teristic of solvent-exposed guanine N7 and O6 sites (1486 and1686 cm±1) replace the markers (1482 and 1722 cm±1)diagnostic of Hoogsteen N7 and C6=O hydrogen bondinginteractions of the G´G pairs. Also, the guanine Raman markerat 1575 cm±1, which is sensitive to solvation of the exocyclicC2±NH2 group, differs from the analogous band (1580 cm±1)in telomeric DNA (15). Thus, Raman markers diagnostic ofeither hairpin or quadruplex secondary structures are absentfrom Raman spectra of d(TG)8 and dT6(TG)8. On the otherhand, the prominent DNA backbone markers at 836 and1091 cm±1 in Figure 3B indicate the same local phosphodiesterconformation (g±/g) as in telomeric sequences. The secondarystructure for both of the non-telomeric sequences is apparentlya base-stacked single strand.
UVRR spectroscopy. The strucutral signi®cance of the UVRRsignatures of Figure 3C and D can be understood by referenceto UVRR studies of model structures (17,28,36,37) andcomparison with the off-resonance data of Figure 3A and B.For telomeric structures, the guanine UVRR markers at 1324and 1482 cm±1 (Fig. 3C) coincide with their off-resonance
Figure 2. Circular dichroism spectra (240±330 nm). (A) d(TG)8 (®lled triangle) and dT6(TG)8 (open triangle). (B) Oxy1.5 (®lled circle), Oxy2 (®lled triangle)and T6Oxy2 (open square). (C) Differences: T6Oxy2 ± Oxy2 (open square) and dT6(TG)8 ± d(TG)8 (®lled square). (D) Differences: Oxy2 ± dT4 (®lled circle),Oxy2 ± d(TG)8 (®lled triangle) and, T6Oxy2 ± dT6(TG)8 (open triangle). Data were obtained on a Jasco-720 spectropolarimeter (20 nm/min scan speed; 1 sresponse time; 1 cm path) from 3 mM DNA samples in 10 mM sodium phosphate, pH 7.5, at 20°C.
3984 Nucleic Acids Research, 2002, Vol. 30 No. 18
by guest on February 8, 2016http://nar.oxfordjournals.org/
Dow
nloaded from
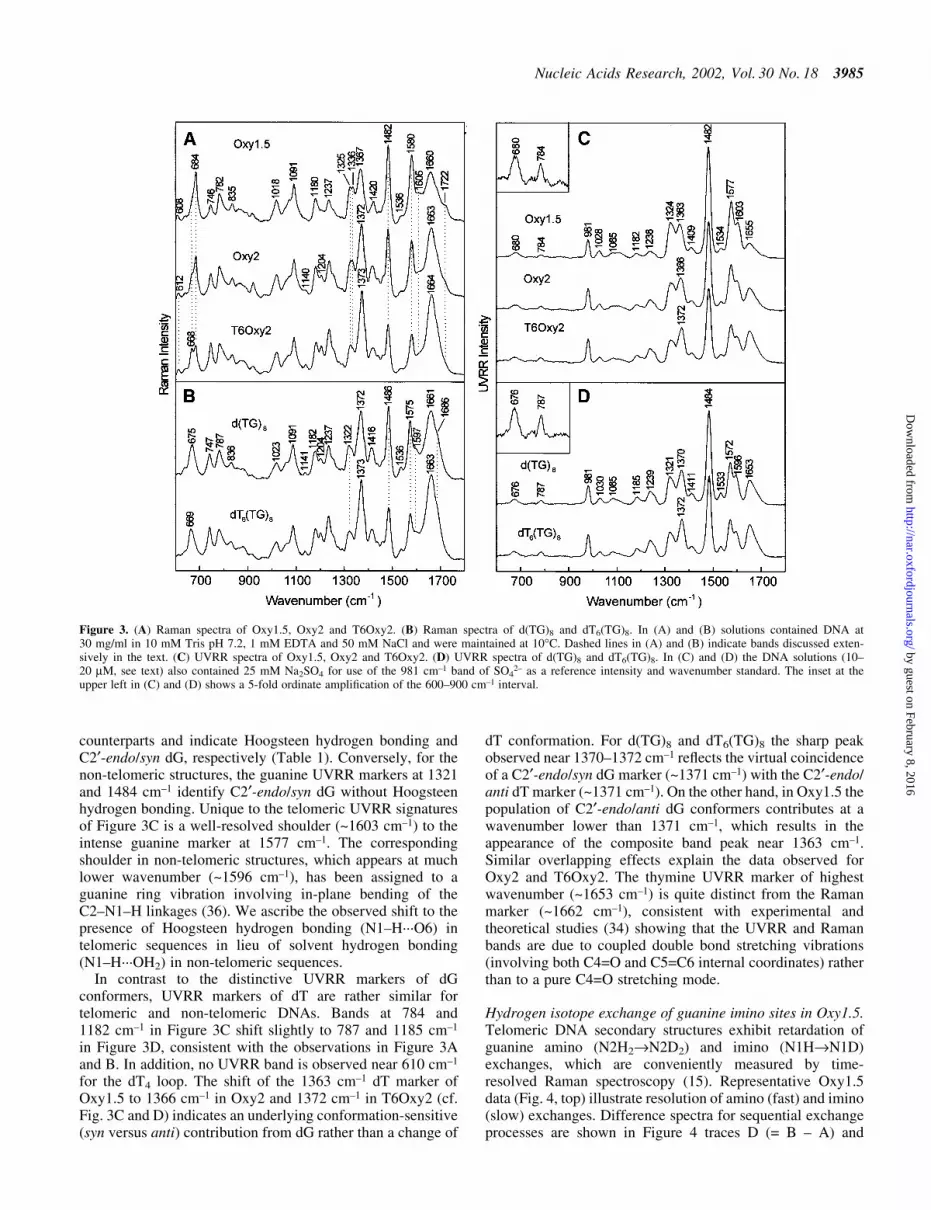
counterparts and indicate Hoogsteen hydrogen bonding andC2¢-endo/syn dG, respectively (Table 1). Conversely, for thenon-telomeric structures, the guanine UVRR markers at 1321and 1484 cm±1 identify C2¢-endo/syn dG without Hoogsteenhydrogen bonding. Unique to the telomeric UVRR signaturesof Figure 3C is a well-resolved shoulder (~1603 cm±1) to theintense guanine marker at 1577 cm±1. The correspondingshoulder in non-telomeric structures, which appears at muchlower wavenumber (~1596 cm±1), has been assigned to aguanine ring vibration involving in-plane bending of theC2±N1±H linkages (36). We ascribe the observed shift to thepresence of Hoogsteen hydrogen bonding (N1±H´´´O6) intelomeric sequences in lieu of solvent hydrogen bonding(N1±H´´´OH2) in non-telomeric sequences.
In contrast to the distinctive UVRR markers of dGconformers, UVRR markers of dT are rather similar fortelomeric and non-telomeric DNAs. Bands at 784 and1182 cm±1 in Figure 3C shift slightly to 787 and 1185 cm±1
in Figure 3D, consistent with the observations in Figure 3Aand B. In addition, no UVRR band is observed near 610 cm±1
for the dT4 loop. The shift of the 1363 cm±1 dT marker ofOxy1.5 to 1366 cm±1 in Oxy2 and 1372 cm±1 in T6Oxy2 (cf.Fig. 3C and D) indicates an underlying conformation-sensitive(syn versus anti) contribution from dG rather than a change of
dT conformation. For d(TG)8 and dT6(TG)8 the sharp peakobserved near 1370±1372 cm±1 re¯ects the virtual coincidenceof a C2¢-endo/syn dG marker (~1371 cm±1) with the C2¢-endo/anti dT marker (~1371 cm±1). On the other hand, in Oxy1.5 thepopulation of C2¢-endo/anti dG conformers contributes at awavenumber lower than 1371 cm±1, which results in theappearance of the composite band peak near 1363 cm±1.Similar overlapping effects explain the data observed forOxy2 and T6Oxy2. The thymine UVRR marker of highestwavenumber (~1653 cm±1) is quite distinct from the Ramanmarker (~1662 cm±1), consistent with experimental andtheoretical studies (34) showing that the UVRR and Ramanbands are due to coupled double bond stretching vibrations(involving both C4=O and C5=C6 internal coordinates) ratherthan to a pure C4=O stretching mode.
Hydrogen isotope exchange of guanine imino sites in Oxy1.5.Telomeric DNA secondary structures exhibit retardation ofguanine amino (N2H2®N2D2) and imino (N1H®N1D)exchanges, which are conveniently measured by time-resolved Raman spectroscopy (15). Representative Oxy1.5data (Fig. 4, top) illustrate resolution of amino (fast) and imino(slow) exchanges. Difference spectra for sequential exchangeprocesses are shown in Figure 4 traces D (= B ± A) and
Figure 3. (A) Raman spectra of Oxy1.5, Oxy2 and T6Oxy2. (B) Raman spectra of d(TG)8 and dT6(TG)8. In (A) and (B) solutions contained DNA at30 mg/ml in 10 mM Tris pH 7.2, 1 mM EDTA and 50 mM NaCl and were maintained at 10°C. Dashed lines in (A) and (B) indicate bands discussed exten-sively in the text. (C) UVRR spectra of Oxy1.5, Oxy2 and T6Oxy2. (D) UVRR spectra of d(TG)8 and dT6(TG)8. In (C) and (D) the DNA solutions (10±20 mM, see text) also contained 25 mM Na2SO4 for use of the 981 cm±1 band of SO4
2± as a reference intensity and wavenumber standard. The inset at theupper left in (C) and (D) shows a 5-fold ordinate ampli®cation of the 600±900 cm±1 interval.
Nucleic Acids Research, 2002, Vol. 30 No. 18 3985
by guest on February 8, 2016http://nar.oxfordjournals.org/
Dow
nloaded from

E (= C ± B), respectively. Guanine H/D exchanges produceshifts of Raman peaks from ~1018 to 980 cm±1, 1367 to 1356cm±1, 1482 to 1480 cm±1 and 1722 to 1713 cm±1 (cf. traces A, Band C of Fig. 4) (15). In the computed difference spectra, theseparate effects of amino and imino exchanges are more clearlydifferentiated. Note, for example, that the imino exchangeprocess results in a peak/trough pro®le at 1689/1717 cm±1
which provides a basis for quanti®cation of the N1H®N1Dexchange rate. The traces in the upper panel of Figure 4 andrelated time-dependent spectra yield the exchange kineticspro®les shown in the bottom panel of Figure 4.
We interpret the results of Figure 4 (bottom) as indicative ofat least two distinct phases of guanine imino exchange inOxy1.5. The more rapidly exchanging fraction (phase 1),which is complete at time t < 100 min with apparent rate k »1.39 3 10±2 min±1, represents N1H sites that are onlymarginally protected by the quadruplex secondary structure.These are likely to reside in the peripheral G quartets (Fig. 1C).
The more slowly exchanging fraction (phase 2), whichexchanges in the period ~100 < t < ~4275 min with apparentrate k » 3.86 3 10±4 min±1, represents more protected N1Hsites, presumably those of the internal G quartets (10,15). Thephase 2 protons of Oxy1.5 exchange at a rate that is moresimilar to those of hairpins (10) and extended quadruplexes(15). The guanine H/D exchange data in the bottom panel ofFigure 4 may also be ®tted to a single exponential function(not shown) with ®rst order rate constant k » 5.9 3 10±3 min±1,which is close to values reported for hairpins (10). The resultsof Figure 4 further imply that approximately equal populationsof protons exchange in phases 1 and 2. We conclude that Gquartets of the NMR determined Oxy1.5 quadruplex (12) arenot as well protected from H/D exchange as those in thequadruplex structure of Oxy4 (15). This could re¯ect either thefundamental structural difference between the two quadru-plexes (i.e. two interleaved chains in Oxy1.5 versus a singlefoldback chain in Oxy4) or different exchange mechanisms.
Table 1. Raman and UV resonance Raman bands of Oxytricha telomeric DNA and related non-telomeric DNA sequences in H2O and D2O solutionsa
Telomeric repeatb Non-telomeric isomerc Assignmentd Commente
Ramanf UVRRg Ramanf UVRRg
608 (603) dT T4 diagonal loop612 T4 hairpin loop668 (651) 668 (655) dT C2¢-endo/anti675 (679) 680h (677) 675 (675) 676 (677) dG C2¢-endo/syn684 (683) 680h (677) dG C2¢-endo/anti746 (734) 740 (732) 747 (736) 737 (733) dT T(N3)i
782 (782) 784 (785) 787 (786) 787 (784) bk OPO; dT g±/g±
835 (832) 836 (831) bk OPO g±/g±
(980) dG ND def G(N1, N2)j
1018 1023 (1018) dG NH def; dT G(N2)1028 (1030) 1030 (1034) dG1085 (1085) 1085 (1085) dG
1091 (1091) 1091 (1090) bk PO2± intensity standard
1140 1141 dT1180 (1155) 1182 (1157) 1182 (1157) 1185 (1157) unpaired dT T(N3)1237 (1242) 1238 (1242) 1237 (1237) 1239 (1244) dT T(N3)
(1268) (1267) (1264) dT ND def T(N3)1325 (1325) 1324 (1320) 1322 (1318) 1321 (1319) dG C2¢-endo/syn1336 (1336) u u u u u dG C2¢-endo/anti1363k (1357) 1363l (1360) u (1359) u (1356) dG ND2 def G(N2), C2¢-endo/anti1372 (1372) ul (1373) 1372 (1374) 1371 (1374) dT; dG dG C2¢-endo/syn
(1403) (1403) dG ND,ND2 def (N1, N2)j
1412 (1410s) (1407) 1411 (1410s) dG; dT1420 (1420) 1416 (1415) C5¢H2 def1482 (1478) 1482 (1478) 1486 (1476) 1484 (1477) dG N7 H-bond1536 (1535) 1534 (1535) 1536 (1536) 1533 (1534) dG1580 (1580) 1577 (1578) 1575 (1574) 1572 (1574) dG N7 H-bond1605 1603 1597 (1603) 1596 dG NH def N1H H-bond1662 (1662) 1655 (1659) 1661 (1659) 1653 (1658) dT C=O str O4 H-bond1722 (1689) 1686 (1685) dG C=O str O6 H-bond
aRaman and UVRR bands are given in cm±1 units (no data indicates no band observed; u indicates unresolved wavenumber; D2O solution data are inparentheses). Relative Raman and UVRR intensities (not listed) vary among sequences in accordance with T:G content and conformation (see text). Data arecompiled from this work and previous results (8,10,15,30,32,34,37,45).bData apply to Oxy1.5, Oxy2 and T6Oxy2 unless otherwise noted.cData apply to d(TG)8 and dT6(TG)8.dAbbreviations: bk, backbone; def, deformation; str, stretch. Standard notation is used for deoxynucleosides and chemical groups.eParentheses indicate sites of deuteration. Standard notation is used for deoxynucleotide conformations.fOff-resonance excitation (532 or 514.5 nm).gUV resonance excitation (257 nm).hComposite of C2¢-endo/syn dG (~675 cm±1) and C2¢-endo/anti dG (~684 cm±1) markers.iVery weak in UVRR spectra.jThe band shifts to ~1392 cm±1 in d(G12) upon N2 amino deuteration and to ~1400 cm±1 when the N1 imino site is additionally deuterated.kShoulder to the more intense band of dT at 1372 cm±1.lOverlap of dT and dG markers.
3986 Nucleic Acids Research, 2002, Vol. 30 No. 18
by guest on February 8, 2016http://nar.oxfordjournals.org/
Dow
nloaded from
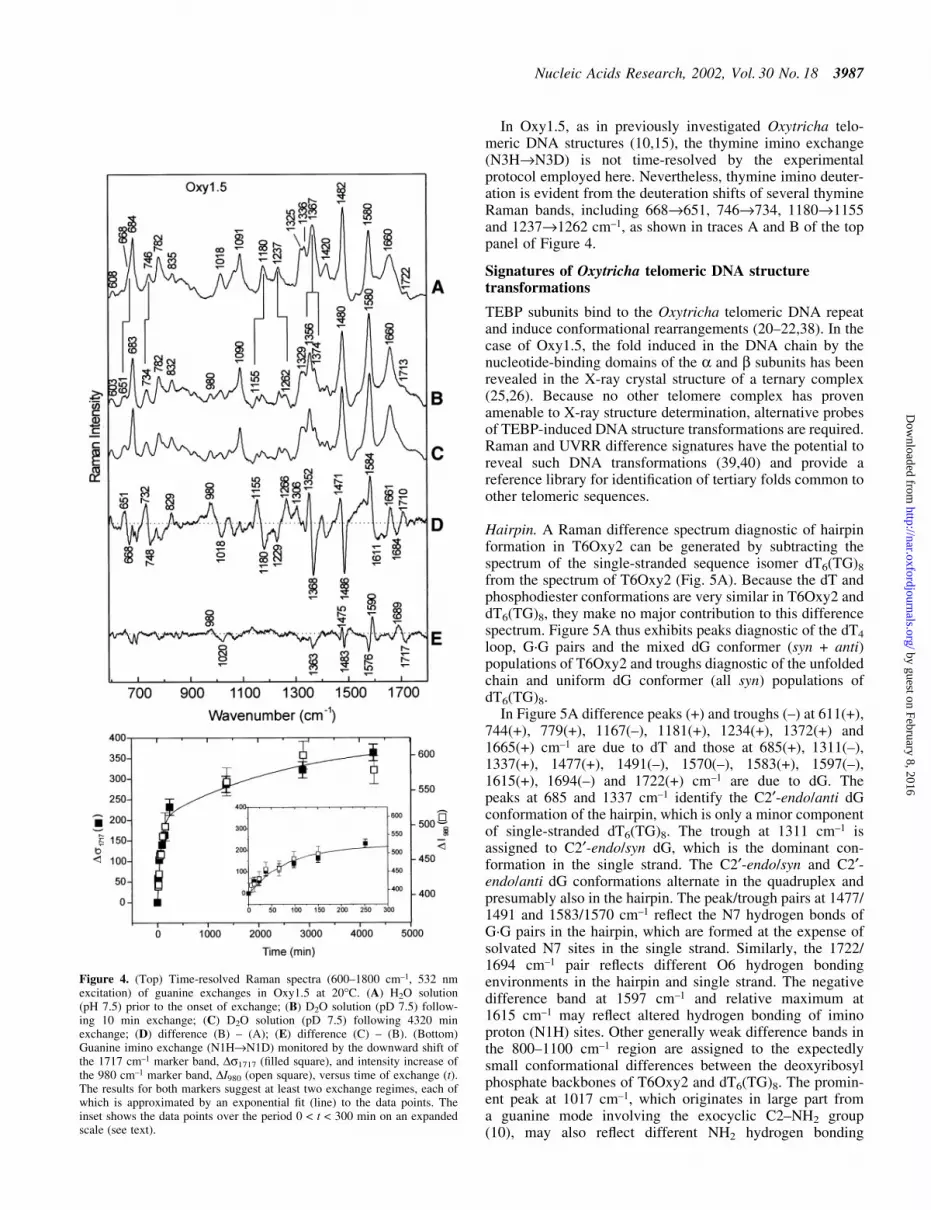
In Oxy1.5, as in previously investigated Oxytricha telo-meric DNA structures (10,15), the thymine imino exchange(N3H®N3D) is not time-resolved by the experimentalprotocol employed here. Nevertheless, thymine imino deuter-ation is evident from the deuteration shifts of several thymineRaman bands, including 668®651, 746®734, 1180®1155and 1237®1262 cm±1, as shown in traces A and B of the toppanel of Figure 4.
Signatures of Oxytricha telomeric DNA structuretransformations
TEBP subunits bind to the Oxytricha telomeric DNA repeatand induce conformational rearrangements (20±22,38). In thecase of Oxy1.5, the fold induced in the DNA chain by thenucleotide-binding domains of the a and b subunits has beenrevealed in the X-ray crystal structure of a ternary complex(25,26). Because no other telomere complex has provenamenable to X-ray structure determination, alternative probesof TEBP-induced DNA structure transformations are required.Raman and UVRR difference signatures have the potential toreveal such DNA transformations (39,40) and provide areference library for identi®cation of tertiary folds common toother telomeric sequences.
Hairpin. A Raman difference spectrum diagnostic of hairpinformation in T6Oxy2 can be generated by subtracting thespectrum of the single-stranded sequence isomer dT6(TG)8
from the spectrum of T6Oxy2 (Fig. 5A). Because the dT andphosphodiester conformations are very similar in T6Oxy2 anddT6(TG)8, they make no major contribution to this differencespectrum. Figure 5A thus exhibits peaks diagnostic of the dT4
loop, G´G pairs and the mixed dG conformer (syn + anti)populations of T6Oxy2 and troughs diagnostic of the unfoldedchain and uniform dG conformer (all syn) populations ofdT6(TG)8.
In Figure 5A difference peaks (+) and troughs (±) at 611(+),744(+), 779(+), 1167(±), 1181(+), 1234(+), 1372(+) and1665(+) cm±1 are due to dT and those at 685(+), 1311(±),1337(+), 1477(+), 1491(±), 1570(±), 1583(+), 1597(±),1615(+), 1694(±) and 1722(+) cm±1 are due to dG. Thepeaks at 685 and 1337 cm±1 identify the C2¢-endo/anti dGconformation of the hairpin, which is only a minor componentof single-stranded dT6(TG)8. The trough at 1311 cm±1 isassigned to C2¢-endo/syn dG, which is the dominant con-formation in the single strand. The C2¢-endo/syn and C2¢-endo/anti dG conformations alternate in the quadruplex andpresumably also in the hairpin. The peak/trough pairs at 1477/1491 and 1583/1570 cm±1 re¯ect the N7 hydrogen bonds ofG´G pairs in the hairpin, which are formed at the expense ofsolvated N7 sites in the single strand. Similarly, the 1722/1694 cm±1 pair re¯ects different O6 hydrogen bondingenvironments in the hairpin and single strand. The negativedifference band at 1597 cm±1 and relative maximum at1615 cm±1 may re¯ect altered hydrogen bonding of iminoproton (N1H) sites. Other generally weak difference bands inthe 800±1100 cm±1 region are assigned to the expectedlysmall conformational differences between the deoxyribosylphosphate backbones of T6Oxy2 and dT6(TG)8. The promin-ent peak at 1017 cm±1, which originates in large part froma guanine mode involving the exocyclic C2±NH2 group(10), may also re¯ect different NH2 hydrogen bonding
Figure 4. (Top) Time-resolved Raman spectra (600±1800 cm±1, 532 nmexcitation) of guanine exchanges in Oxy1.5 at 20°C. (A) H2O solution(pH 7.5) prior to the onset of exchange; (B) D2O solution (pD 7.5) follow-ing 10 min exchange; (C) D2O solution (pD 7.5) following 4320 minexchange; (D) difference (B) ± (A); (E) difference (C) ± (B). (Bottom)Guanine imino exchange (N1H®N1D) monitored by the downward shift ofthe 1717 cm±1 marker band, Ds1717 (®lled square), and intensity increase ofthe 980 cm±1 marker band, DI980 (open square), versus time of exchange (t).The results for both markers suggest at least two exchange regimes, each ofwhich is approximated by an exponential ®t (line) to the data points. Theinset shows the data points over the period 0 < t < 300 min on an expandedscale (see text).
Nucleic Acids Research, 2002, Vol. 30 No. 18 3987
by guest on February 8, 2016http://nar.oxfordjournals.org/
Dow
nloaded from

environments in hairpin and strand. It is interesting that thedifference spectrum of Figure 5A exhibits many features incommon with the previously computed difference spectrum ofOxy2 between 10°C (hairpin) and 90°C (thermally unfolded)(41), although the latter re¯ects additional spectral perturb-ations caused by base unstacking at the higher temperature.Subtraction of the Raman spectrum of d(TG)8 from that ofOxy2 yields a difference spectrum (not shown) that is verysimilar to Figure 5A.
Figure 5B shows the UVRR difference spectrum computedbetween Oxy2 and d(TG)8, both at 10°C. With the possibleexception of a barely distinguishable peak near 1029 cm±1 duemainly to guanine, no peaks or troughs occur in the region600±1300 cm±1. This is consistent with the low UVRR cross-sections for vibrational modes within this spectral interval(28). However, a rich pattern of difference bands occurs in the1300±1700 cm±1 interval. The observed UVRR differencespectrum, with peaks and troughs at 1317(±), 1338(+),1356(+), 1475(+), 1493(±), 1562(±), 1579(+), 1610(+) and1685(±) cm±1, closely resembles the corresponding off-resonance difference pro®le (compare the 1300±1700 cm±1
intervals of Figure 5A and B), con®rming similar folds.A simplifying advantage of the UVRR signature is theabsence of Raman bands from the deoxyribosyl phosphatebackbone.
Figure 5C shows the UVRR difference spectrum computedfor Oxy2 between 10 and 70°C. This difference spectrumre¯ects thermal denaturation of the Oxy2 secondary structure.It is very similar to that of Figure 5B, which underscores theattribution of peaks to dG and dT residues of the hairpin foldand troughs to dG and dT in the single strand. This similarityfurther con®rms that the d(TG)8 single strand is a reasonablemodel for the denatured hairpin of similar base composition.The UVRR difference pro®le, unlike the off-resonance Ramandifference pro®le, is uncomplicated by Raman contributionsfrom the DNA backbone.
We also computed the UVRR difference spectrum (notshown) for d(TG)8 between 10°C (minuend) and 70°C(subtrahend). As expected, this difference spectrum is feeblein comparison with that of Figure 5C. It consists only oftroughs of low intensity in the region 1300±1700 cm±1, whichre¯ect recovery of Raman hypochromism at the highertemperature upon disordering of the d(TG)8 single strand.
Thymidine leader. The upper trace of Figure 6A shows theRaman difference spectrum obtained by subtracting thespectra of Oxy2 and T6Oxy2, which represents the Ramanspectrum of dT6 attached to a hairpin fold (Oxy2). Similarly,the lower trace of Figure 6A represents the Raman spectrum ofdT6 attached to an alternating dT/dG single strand. The Ramansignature of the thymidine leader is not signi®cantly affectedby the DNA fold to which it is attached. This signature is verysimilar to the Raman spectrum of poly(dT) (30). Figure 6Billustrates the same point for the UVRR spectrum.
Quadruplex. The top panel of Figure 7 shows the differencespectrum obtained by compensating the Raman spectrum ofthe Oxy1.5 quadruplex for contributions of dG and dTresidues in a single-stranded sequence isomer. The corres-ponding UVRR difference signature is shown in the bottompanel of Figure 7. Interestingly, the Raman and UVRRsignatures of Figure 7 exhibit many similarities to theircounterparts in Figure 5. Important distinctions, however, arethe relative amplitudes of peaks and troughs in the 1450±1750 cm±1 interval. For example, the band near 1723 cm±1,which is a speci®c marker of Hoogsteen O6 interaction, ismore intense in Figure 7 than in Figure 5A, consistent with thegreater number of Hoogsteen hydrogen bonding interactionsper guanine residue of the quadruplex. Another interestingdifference between Figure 5A and the top panel of Figure 7 isthe wavenumber value of the thymidine loop marker (611versus 605 cm±1). This may signify different loop geometriesin the respective structures. We propose the difference spectraof Figure 7 as the Raman and UVRR signatures diagnostic ofthe Oxy1.5 quadruplex.
DISCUSSION AND CONCLUSIONS
We have reported and interpreted Raman, UVRR and CDspectra of the Oxytricha telomeric DNA sequences Oxy1.5,Oxy2 and T6Oxy2 and of the non-telomeric sequence isomersd(TG)8 and dT6(TG)8. This work extends the database of DNA
Figure 5. (A) Raman signature (10°C) of the hairpin fold of T6Oxy2generated by the difference T6Oxy2 ± dT6(TG)8. (B) UVRR signature(10°C) of the hairpin fold of Oxy2 generated by the difference Oxy2 ±d(TG)8. (C) UVRR signature of the hairpin fold of Oxy2 generated by thedifference Oxy210°C ± Oxy270°C. Asterisks in traces (B) and (C) indicateuncompensated intensity of the reference intensity standard (981 cm±1 bandof SO4
2±).
3988 Nucleic Acids Research, 2002, Vol. 30 No. 18
by guest on February 8, 2016http://nar.oxfordjournals.org/
Dow
nloaded from

structures probed by the UVRR method and correlates theUVRR spectra (257 nm excitation) of Oxy1.5, Oxy2, T6Oxy2,d(TG)8 and dT6(TG)8 with corresponding off-resonanceRaman spectra (532 nm excitation). The greater sensitivityof UVRR spectroscopy facilitates identi®cation of telomericDNA folds in solutions that are several orders of magnitudemore dilute than those typically employed in off-resonanceRaman studies. Raman and UVRR spectra are complementedby CD spectra, con®rming and extending previously reportedCD results and providing a correlation between CD andvibrational spectra. We ®nd that Oxy1.5 exhibits the positiveand negative CD bands near 295 and 265 nm, respectively,proposed as diagnostic of a quadruplex (23). Conversely,Oxy2 and T6Oxy2 contain only the positive bands near300 and 255 nm, proposed as diagnostic of the hairpin fold (10).
In the 2.5 AÊ X-ray crystal structure of Oxy1.5, two strandsof he dodecanucleotide form a quadruplex having antiparallelstrand topology (Fig. 1B; 11). However, in the NMR solutionstructure of Oxy1.5, the quadruplex comprises two strandsinterleaved to combine both parallel and antiparallel strandorientations (Fig. 1C). The quadruplex structure of Figure 1C
has also been discovered within the lattice of an O.novaTEBP/DNA co-crystal solved at 1.86 AÊ resolution (25).Because the buffer conditions employed in the presentexperiments more closely approximate those in the solutionNMR and co-crystal X-ray studies, it is reasonable to assumethat the Oxy1.5 structure examined here adopts the quadruplexstrand topology of Figure 1C rather than that of Figure 1B.This is consistent with the Raman, UVRR and CD results andis also supported by the H/D exchange measurements.
Raman marker bands diagnostic of speci®c dG conform-ations and interactions in telomeric DNA structures have beenreported previously (8,42). The present work shows thatcomparable dG markers occur within the 1300±1700 cm±1
interval of UVRR spectra. UVRR spectra of telomeric DNAsequences also exhibit a novel dG marker at 1600 6 5 cm±1.No comparable band can be resolved in off-resonance Ramanspectra, owing to an apparently low off-resonance Ramanscattering cross-section and possible obscuration by intenseneighboring bands of the guanine (1575 cm±1) and thyminerings (1660 cm±1). In accordance with previous work(8,15,36), we assign the 1600 cm±1 marker to a vibrationinvolving the guanine N1H imino group, and note that itappears at a higher wavenumber value in natively foldedstructures (~1605 cm±1, Fig. 3A) than in single-stranded non-telomeric DNA (~1597 cm±1, Fig. 3B). We propose thisUVRR marker as a means of distinguishing the N1H´´´O6hydrogen bond between two guanines (e.g. in Hoogsteen G´Gpairs or G quartets) from the N1H´´´OH2 hydrogen bondbetween guanine and solvent.
It is interesting to note that at DNA concentrations (10±20 mM) employed for UVRR spectroscopy a parallel-strandedquadruplex is not induced by prolonged heating of either
Figure 6. (A) Raman signatures (10°C) of the thymidine 5¢ leader generatedby the differences T6Oxy2 ± Oxy2 (top trace) and dT6(TG)8 ± d(TG)8
(bottom trace). (B) UVRR signatures (10°C) of the thymidine 5¢ leader gen-erated by the differences T6Oxy2 ± Oxy2 (top trace) and dT6(TG)8 ±d(TG)8 (bottom trace). Asterisks indicate uncompensated intensity of thereference intensity standard (981 cm±1 band of SO4
2±).
Figure 7. Raman (top) and UVRR (bottom) signatures of the guanine quar-tet component of Oxy1.5 generated by compensating corresponding Oxy1.5spectra for contributions from dT (see text).
Nucleic Acids Research, 2002, Vol. 30 No. 18 3989
by guest on February 8, 2016http://nar.oxfordjournals.org/
Dow
nloaded from
Oxy1.5, Oxy2 or T6Oxy2, irrespective of salt concentration.Conversely, such quadruplexes are readily formed at the muchhigher DNA concentrations (10±100 mM) usually employedin off-resonance Raman studies (9). Thus, UVRR provides adecisive advantage over off-resonance Raman spectroscopyfor investigating antiparallel quadruplexes without thecomplication of parallel quadruplex formation.
The H/D exchange of guanine imino (N1H®N1D) sites inOxy1.5 is biphasic, with rates of 1.39 3 10±2 and 3.86 310±4 min±1. The overall exchange process can also bedescribed in terms of a single rate constant of 5.9 310±3 min±1, which is intermediate between values reportedfor Oxy2 (4.6 3 10±3) and T6Oxy2 (9.6 3 10±3 min±1) (10).Much slower rates (~10±6 min±1) are exhibited by the foldback(antiparallel) and extended (parallel) quadruplex structures ofOxy4 (15). Therefore, although the Oxy1.5 quadruplexcontains G quartets of high stability, it does not exhibit thesame degree of H/D exchange protection observed for Oxy4quadruplexes. One plausible explanation for this ®nding is thatguanine exchange depends not simply on the nature ofinterbase hydrogen bonding but also on DNA strand topology.For example, in both the solution NMR and co-crystalX-ray structures of the Oxy1.5 quadruplex (12,25), thestrand topology results in a very wide groove (10 AÊ ) thatis not present in the Oxy4 quadruplex structures (43,44). Thewide groove of the Oxy1.5 structure may facilitate solventpenetration for more rapid guanine proton exchanges. This isanalogous to the case of B-DNA. It is also possible that H/Dexchanges may proceed by different mechanisms in Oxy1.5and Oxy4 structures.
The distinctive structure and H/D exchange kineticsobserved for Oxy1.5 vis-aÁ-vis Oxy2 and T6Oxy2 demonstratethat the single-stranded 5¢ leader sequence (the so-called 3¢overhang) plays an important role in telomeric DNA structureand dynamics. The single-stranded dT4 sequence of Oxy2 (ordT10 sequence of T6Oxy2) may function to stabilize hairpinformation in the d(G4T4G4) sequence to which it is linked.
Quadruplex formation, whether by a mechanism of strandassociation in the case of Oxy1.5 or folding in the case ofOxy4, is presumably disfavored if a stable hairpin is formedinitially. The single-stranded overhang may thus provide anatural barrier to quadruplex associations.
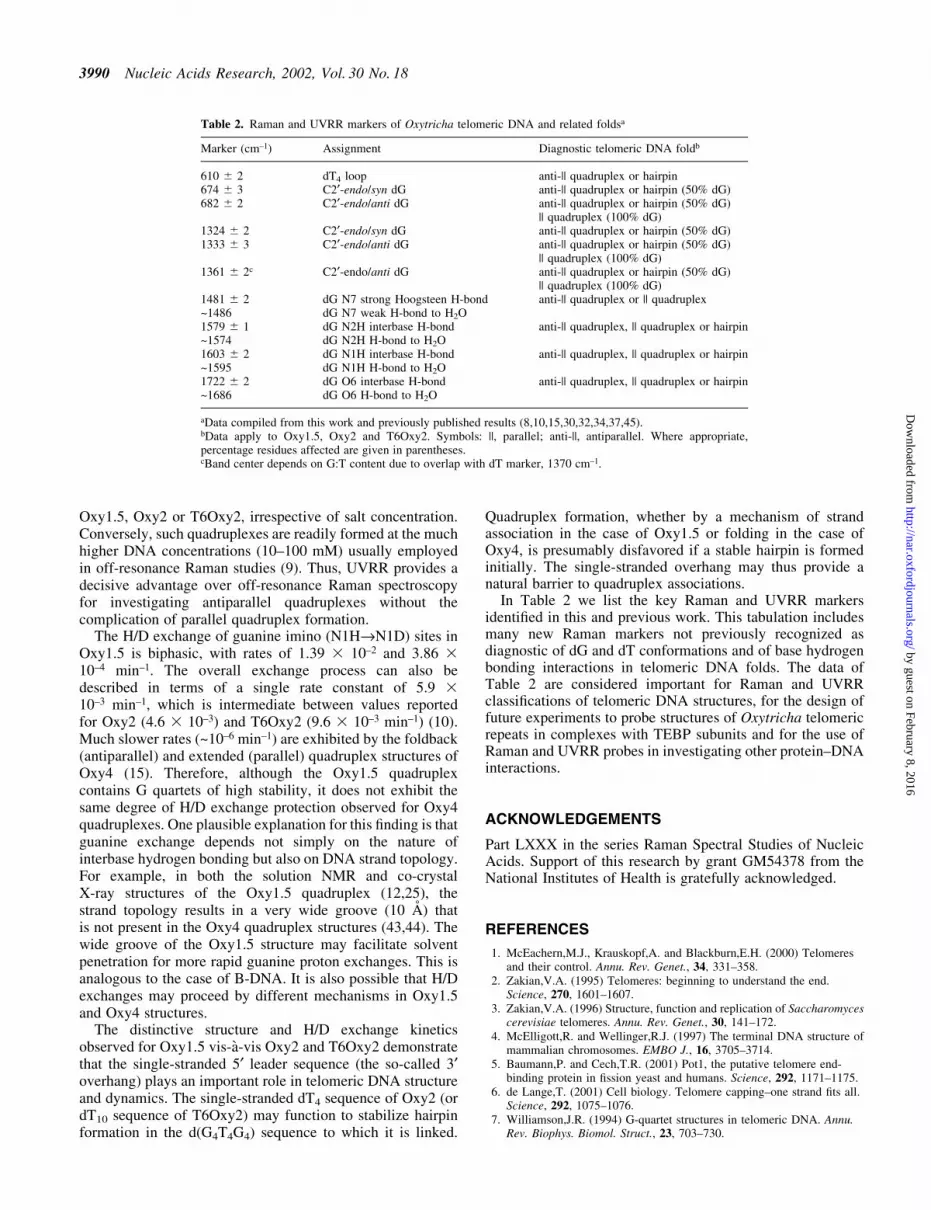
In Table 2 we list the key Raman and UVRR markersidenti®ed in this and previous work. This tabulation includesmany new Raman markers not previously recognized asdiagnostic of dG and dT conformations and of base hydrogenbonding interactions in telomeric DNA folds. The data ofTable 2 are considered important for Raman and UVRRclassi®cations of telomeric DNA structures, for the design offuture experiments to probe structures of Oxytricha telomericrepeats in complexes with TEBP subunits and for the use ofRaman and UVRR probes in investigating other protein±DNAinteractions.
ACKNOWLEDGEMENTS
Part LXXX in the series Raman Spectral Studies of NucleicAcids. Support of this research by grant GM54378 from theNational Institutes of Health is gratefully acknowledged.
REFERENCES
1. McEachern,M.J., Krauskopf,A. and Blackburn,E.H. (2000) Telomeresand their control. Annu. Rev. Genet., 34, 331±358.
2. Zakian,V.A. (1995) Telomeres: beginning to understand the end.Science, 270, 1601±1607.
3. Zakian,V.A. (1996) Structure, function and replication of Saccharomycescerevisiae telomeres. Annu. Rev. Genet., 30, 141±172.
4. McElligott,R. and Wellinger,R.J. (1997) The terminal DNA structure ofmammalian chromosomes. EMBO J., 16, 3705±3714.
5. Baumann,P. and Cech,T.R. (2001) Pot1, the putative telomere end-binding protein in ®ssion yeast and humans. Science, 292, 1171±1175.
6. de Lange,T. (2001) Cell biology. Telomere capping±one strand ®ts all.Science, 292, 1075±1076.
7. Williamson,J.R. (1994) G-quartet structures in telomeric DNA. Annu.Rev. Biophys. Biomol. Struct., 23, 703±730.
Table 2. Raman and UVRR markers of Oxytricha telomeric DNA and related foldsa
Marker (cm±1) Assignment Diagnostic telomeric DNA foldb
610 6 2 dT4 loop anti-|| quadruplex or hairpin674 6 3 C2¢-endo/syn dG anti-|| quadruplex or hairpin (50% dG)682 6 2 C2¢-endo/anti dG anti-|| quadruplex or hairpin (50% dG)
|| quadruplex (100% dG)1324 6 2 C2¢-endo/syn dG anti-|| quadruplex or hairpin (50% dG)1333 6 3 C2¢-endo/anti dG anti-|| quadruplex or hairpin (50% dG)
|| quadruplex (100% dG)1361 6 2c C2¢-endo/anti dG anti-|| quadruplex or hairpin (50% dG)
|| quadruplex (100% dG)1481 6 2 dG N7 strong Hoogsteen H-bond anti-|| quadruplex or || quadruplex~1486 dG N7 weak H-bond to H2O1579 6 1 dG N2H interbase H-bond anti-|| quadruplex, || quadruplex or hairpin~1574 dG N2H H-bond to H2O1603 6 2 dG N1H interbase H-bond anti-|| quadruplex, || quadruplex or hairpin~1595 dG N1H H-bond to H2O1722 6 2 dG O6 interbase H-bond anti-|| quadruplex, || quadruplex or hairpin~1686 dG O6 H-bond to H2O
aData compiled from this work and previously published results (8,10,15,30,32,34,37,45).bData apply to Oxy1.5, Oxy2 and T6Oxy2. Symbols: ||, parallel; anti-||, antiparallel. Where appropriate,percentage residues affected are given in parentheses.cBand center depends on G:T content due to overlap with dT marker, 1370 cm±1.
3990 Nucleic Acids Research, 2002, Vol. 30 No. 18
by guest on February 8, 2016http://nar.oxfordjournals.org/
Dow
nloaded from

8. Miura,T. and Thomas,G.J.,Jr (1994) Structural polymorphism oftelomere DNA: interquadruplex and duplex-quadruplex conversionsprobed by Raman spectroscopy. Biochemistry, 33, 7848±7856.
9. Miura,T., Benevides,J.M. and Thomas,G.J.,Jr (1995) A phase diagramfor sodium and potassium ion control of polymorphism in telomericDNA. J. Mol. Biol., 248, 233±238.
10. Laporte,L. and Thomas,G.J.,Jr (1998) A hairpin conformation for the 3¢overhang of Oxytricha nova telomeric DNA. J. Mol. Biol., 281, 261±270.
11. Kang,C., Zhang,X., Ratliff,R., Moyzis,R. and Rich,A. (1992) Crystalstructure of four-stranded Oxytricha telomeric DNA. Nature, 356,126±131.
12. Smith,F.W. and Feigon,J. (1992) Quadruplex structure of Oxytrichatelomeric DNA oligonucleotides. Nature, 356, 164±168.
13. Nishimura,Y., Tsuboi,M., Nakano,T., Higuchi,S., Sato,T., Shida,T.,Uesugi,S., Ohtsuka,E. and Ikehara,M. (1983) Raman diagnosis of nucleicacid structure: sugar-puckering and glycosidic conformation in theguanosine moiety. Nucleic Acids Res., 11, 1579±1588.
14. Benevides,J.M., Wang,A.H.J., van der Marel,G.A., van Boom,J.H. andThomas,G.J.,Jr (1989) Effect of the GT mismatch on backbone and sugarconformations of Z-DNA and B-DNA: analysis by Raman spectroscopyof crystal and solution structures of d(CGCGTG) and d(CGCGCG).Biochemistry, 28, 304±310.
15. Miura,T. and Thomas,G.J.,Jr (1995) Structure and dynamics ofinterstrand guanine association in quadruplex telomeric DNA.Biochemistry, 34, 9645±9654.
16. Wen,Z.Q., Overman,S.A. and Thomas,G.J.,Jr (1997) Structure andinteractions of the single-stranded DNA genome of ®lamentous virus fd:investigation by ultraviolet resonance Raman spectroscopy.Biochemistry, 36, 7810±7820.
17. Wen,Z.Q., Armstrong,A. and Thomas,G.J.,Jr (1999) Demonstration byultraviolet resonance Raman spectroscopy of differences in DNAorganization and interactions in ®lamentous viruses Pf1 and fd.Biochemistry, 38, 3148±3156.
18. Wen,Z.Q. and Thomas,G.J.,Jr (2000) Ultraviolet-resonance Ramanspectroscopy of the ®lamentous virus Pf3: interactions of Trp 38 speci®cto the assembled virion subunit. Biochemistry, 39, 146±152.
19. Wen,Z.Q., Overman,S.A., Bondre,P. and Thomas,G.J.,Jr (2001)Structure and organization of bacteriophage Pf3 probed by Raman andultraviolet resonance Raman spectroscopy. Biochemistry, 40, 449±458.
20. Fang,G. and Cech,T.R. (1993) The beta subunit of Oxytricha telomere-binding protein promotes G-quartet formation by telomeric DNA. Cell,74, 875±885.
21. Fang,G. and Cech,T.R. (1993) Oxytricha telomere-binding protein:DNA-dependent dimerization of the alpha and beta subunits.Proc. Natl Acad. Sci. USA, 90, 6056±6060.
22. Fang,G., Gray,J.T. and Cech,T.R. (1993) Oxytricha telomere-bindingprotein: separable DNA-binding and dimerization domains of the alpha-subunit. Genes Dev., 7, 870±882.
23. Balagurumoorthy,P., Brahmachari,S.K., Mohanty,D., Bansal,M. andSasisekharan,V. (1992) Hairpin and parallel quartet structures fortelomeric sequences. Nucleic Acids Res., 20, 4061±4067.
24. Schultze,P., Hud,N.V., Smith,F.W. and Feigon,J. (1999) The effect ofsodium, potassium and ammonium ions on the conformation of thedimeric quadruplex formed by the Oxytricha nova telomere repeatoligonucleotide d(G(4)T(4)G(4)). Nucleic Acids Res., 27, 3018±3028.
25. Horvath,M.P. and Schultz,S.C. (2001) DNA G-quartets in a 1.86 AÊ
resolution structure of an Oxytricha nova telomeric protein-DNAcomplex. J. Mol. Biol., 310, 367±377.
26. Horvath,M.P., Schweiker,V.L., Bevilacqua,J.M., Ruggles,J.A. andSchultz,S.C. (1998) Crystal structure of the Oxytricha nova telomereend binding protein complexed with single strand DNA. Cell, 95,963±974.
27. Russell,M.P., VohnõÂk,S. and Thomas,G.J.,Jr (1995) Design andperformance of an ultraviolet resonance Raman spectrometer for proteinsand nucleic acids. Biophys. J., 68, 1607±1612.
28. Wen,Z.Q. and Thomas,G.J.,Jr (1998) Ultraviolet resonance Ramanspectroscopy of DNA and protein constituents of viruses: assignments
and cross sections for excitations at 257, 244, 238 and 229 nm.Biopolymers, 45, 247±256.
29. Gray,D.M., Ratliff,R.L. and Vaughan,M.R. (1992) Circular dichroismspectroscopy of DNA. Methods Enzymol., 211, 389±406.
30. Movileanu,L., Benevides,J.M. and Thomas,G.J.,Jr (1999) Temperaturedependence of the Raman spectrum of DNA. I. Raman signatures ofpremelting and melting transitions of poly(dA-dT)´poly(dA-dT).J. Raman Spectrosc., 30, 637±649.
31. Erfurth,S.C., Kiser,E.J. and Peticolas,W.L. (1972) Determination of thebackbone structure of nucleic acids and nucleic acid oligomers by laserRaman scattering. Proc. Natl Acad. Sci. USA, 69, 938±941.
32. Benevides,J.M., Wang,A.H.J., van der Marel,G.A., van Boom,J.H.,Rich,A. and Thomas,G.J.,Jr (1984) The Raman spectra of left-handedDNA oligomers incorporating AT base pairs. Nucleic Acids Res., 12,5913±5925.
33. Benevides,J.M., Wang,A.H.J., Rich,A., Kyogoku,Y., van der Marel,G.A.,van Boom,J.H. and Thomas,G.J.,Jr (1986) The Raman spectra of singlecrystals of r(GCG)d(CGC) and d(CCCCGGGG) as models for A-DNA,their structure transitions in aqueous solution and comparison withdouble helical poly(dG)´poly(dC). Biochemistry, 25, 41±50.
34. Tsuboi,M., Komatsu,K., Hoshi,J., Kawashima,E., Sekine,T., Ishido,Y.,Russell,M.P., Benevides,J.M. and Thomas,G.J.,Jr (1997) Raman andinfrared spectra of (2¢S)-[2¢-2H] thymidine: vibrational coupling betweendeoxyribosyl and thymine moieties and structural implications.J. Am. Chem. Soc., 119, 2025±2032.
35. Nishimura,Y., Tsuboi,M., Sato,T. and Aoki,K. (1986) Conformation-sensitive Raman lines of mononucleotides and their use in a structureanalysis of polynucleotides: guanine and cytosine nucleotides.J. Mol. Struct., 146, 123±153.
36. Toyama,A., Hanada,N., Ono,J., Yoshimitsu,E. and Takeuchi,H. (1999)Assignments of guanosine UV resonance Raman bands on the basis of13C, 15N and 18O substitution effects. J. Raman Spectrosc., 30, 623±630.
37. Thomas,G.J.,Jr and Tsuboi,M. (1993) Raman spectroscopy of nucleicacids and their complexes. In Bush,C.A. (ed.), Advances in BiophysicalChemistry, Vol. 3. JAI Press, Greenwich, CT, pp. 1±70.
38. Fang,G. and Cech,T.R. (1993) Characterization of a G-quartet formationreaction promoted by the b-subunit of the Oxytricha telomere-bindingprotein. Biochemistry, 32, 11646±11657.
39. Benevides,J.M., Chan,G., Lu,X.J., Olson,W.K., Weiss,M.A. andThomas,G.J.,Jr (2000) Protein-directed DNA structure. I. Ramanspectroscopy of a high-mobility-group box with application to human sexreversal. Biochemistry, 39, 537±547.
40. Benevides,J.M., Li,T., Lu,X.J., Srinivasan,A.R., Olson,W.K.,Weiss,M.A. and Thomas,G.J.,Jr (2000) Protein-directed DNA structure.II. Raman spectroscopy of a leucine zipper bZIP complex. Biochemistry,39, 548±556.
41. Laporte,L., Benevides,J.M. and Thomas,G.J.,Jr (1999) Molecularmechanism of DNA recognition by the a subunit of the Oxytrichatelomere binding protein. Biochemistry, 38, 582±588.
42. Miura,T. and Thomas,G.J.,Jr (1995) Optical and vibrationalspectroscopic methods. In Glasel,J.A. and Deutscher,M.P. (eds),Introduction to Biophysical Methods for Protein and Nucleic AcidResearch. Academic Press, New York, NY, pp. 261±315.
43. Laughlan,G., Murchie,A.I., Norman,D.G., Moore,M.H., Moody,P.C.,Lilley,D.M. and Luisi,B. (1994) The high-resolution crystal structure of aparallel-stranded guanine tetraplex. Science, 265, 520±524.
44. Aboul-ela,F., Murchie,A.I., Norman,D.G. and Lilley,D.M. (1994)Solution structure of a parallel-stranded tetraplex formed by d(TG4T) inthe presence of sodium ions by nuclear magnetic resonance spectroscopy.J. Mol. Biol., 243, 458±471.
45. Benevides,J.M., Wang,A.H.J., van der Marel,G.A., van Boom,J.H. andThomas,G.J.,Jr (1988) Crystal and solution structures of the B-DNAdodecamer d(CGCAAATTTGCG) probed by Raman spectroscopy:heterogeneity in the crystal structure does not persist in the solutionstructure. Biochemistry, 27, 931±938.
Nucleic Acids Research, 2002, Vol. 30 No. 18 3991
by guest on February 8, 2016http://nar.oxfordjournals.org/
Dow
nloaded from