second year evaluation report for the cornerstone literacy initiative
TRANSCRIPT
INSTITUTE FOR EDUCATION AND SOCIAL POLICY Steinhardt School of Education, New York University
Second Year Evaluation Report Cornerstone Literacy Initiative January 2004
Education and Social Policy I N S T I T U T E F O R
Steinhardt School of Education ♦New York University 726 Broadway, 5th Floor ♦ New York, NY 10003-9580
Tel: (212) 998-5880 ♦ Fax:(212) 995-4564 ♦ email:[email protected] ♦ www.nyu.edu/iesp
© 2004 New York University Institute for Education and Social Policy
SECOND YEAR
EVALUATION REPORT FOR THE
CORNERSTONE LITERACY INITIATIVE
Prepared by
Dana Lockwood, Project Director Christine Donis-Keller, Data Analyst
Ellie Hanlon, Project Coordinator Tom Saunders, Data Analyst
Lihua Wang, Data Coordinator Meryle Weinstein, Data Analyst
Norm Fruchter, IESP Director
Researchers Colin Chellman Deinya Phenix Dorothy Siegel
January 2004
TABLE OF CONTENTS
1
INTRODUCTION.......................................................................................................................................................2 EVALUATION GOALS............................................................................................................................................2 SUMMARY OF FIRST YEAR EVALUATION REPORT FINDINGS...................................................3 TEST SCORE OUTCOMES....................................................................................................................................4
Phase I ...............................................................................................................................7 Cleveland.......................................................................................................................7
Cleveland Outcomes Summary....................................................................................11 Jackson........................................................................................................................11
Jackson Outcomes Summary ......................................................................................17 Talladega.....................................................................................................................18
Talladega Outcomes Summary....................................................................................21 Trenton ........................................................................................................................22
Trenton Outcomes Summary......................................................................................25 Phase II ............................................................................................................................26
Bridgeport, CT.............................................................................................................26 Bridgeport Outcomes Summary..................................................................................28
Greenwood, MS............................................................................................................29 Greenwood Outcomes Summary.................................................................................32
Phase III...........................................................................................................................33 Dalton, GA...................................................................................................................33
Dalton Outcomes Summary........................................................................................34 New Haven, CT ............................................................................................................34
New Haven Outcomes Summary ................................................................................35 Springfield, MA............................................................................................................36
Springfield Outcomes Summary..................................................................................36 SURVEY AND INTERVIEW FINDINGS.......................................................................................................38
Implementation.................................................................................................................39 Learning Environment..................................................................................................39
Learning Environment Summary.................................................................................42 Professional Learning...................................................................................................43
Site Team Participation in Professional Learning ...........................................................43 Schoolwide Professional Learning Activities .................................................................46 Professional Learning Summary ..................................................................................56
Parent Involvement.......................................................................................................56 Impact..............................................................................................................................57
Teaching Practice.........................................................................................................57 Teaching Practice Impact Summary.............................................................................62
Students’ Literacy Growth.............................................................................................62 Student Literacy Impact Summary...............................................................................63
Expansion and Sustainability.........................................................................................64 Scaling Up Within Schools..........................................................................................64 Scaling Up Within Districts.........................................................................................66 Sustainability.............................................................................................................67 Expansion and Sustainability Summary ........................................................................67
CONCLUSION...........................................................................................................................................................68 Summary of Findings.........................................................................................................68 Next Steps........................................................................................................................69
APPENDIX TABLE OF CONTENTS..............................................................................................................72
Cornerstone Second Year Evaluation Report
2
INTRODUCTION
In September 2001, New York University’s Institute for Education and Social Policy (IESP)
was awarded a grant by the New York Institute for Special Education to evaluate the Cornerstone K-
3 national literacy initiative. Since its inception in 2000-01, Cornerstone has expanded its work to 27
schools across the country. The initial Cornerstone sites in Phase I districts—Cleveland, OH;
Jackson, MS; Talladega, AL; Trenton, NJ—began implementing Cornerstone during the project’s
initial school year. Schools in the Phase II districts—Bridgeport, CT and Greenwood, MS—became
Cornerstone participants during the 2001-02 school year. Phase III schools—Dalton, GA; New
Haven, CT; and Springfield, MA— began their Cornerstone activities during the school year (2002-
03). This current year (2003-04) is Cornerstone’s fourth year of operation.
Although The Cornerstone Initiative has added two new districts in Phase IV (and two new
schools in Cleveland), the NYU evaluation focuses on only the schools and districts in Phases I-III.
This report examines the implementation of The Cornerstone Initiative in 18 schools from nine
school districts, representing the Phases I-III, and summarizes our findings from the first two years
of evaluation, from September 2001 through August 2003. We treat the school year before The
Cornerstone Initiative began as the baseline year for each district. Thus the 1999-2000 year, the
school year before Cornerstone’s first round of implementation began, is the baseline year for Phase
I districts.
EVALUATION GOALS
This evaluation assesses how, and to what extent, the implementation of The Cornerstone
Initiative impacts the literacy growth and achievement of participating students, as well as the literacy
outcomes of participating schools and districts. We assess Cornerstone’s implementation and impact
against Cornerstone goals as articulated by program staff, school practitioners and district
administrators; through interviews; and from official Cornerstone materials. We measure
Cornerstone’s impact by analyzing the results of district and state standardized test scores
administered to students in Cornerstone schools, and by assessing the outcomes of the
Developmental Reading Assessment (DRA), an instrument administered by the Cornerstone coaches
to measure the literacy growth of participating students. 1 Based on these goals, three research
questions frame the evaluation:
• To what extent have participating schools and districts been successful in implementing
the Cornerstone model?
1 The DRA is also administered districtwide in Bridgeport, New Haven and Springfield.
Cornerstone Second Year Evaluation Report
3
• To what extent have the classroom practices of coaches and teachers (both in K-3 and in the upper grades) in the Cornerstone schools changed as a result of the initiative?
• To what extent have student test scores and DRA levels changed as a result of
Cornerstone’s implementation in participating schools and districts?
Although Cornerstone’s primary mission is “to ensure that all children reach an acceptable level
of literacy by third grade,” Cornerstone has increasingly come to regard its efforts as a whole-school
reform program, and has expanded its work to fourth grade and beyond in many of the schools
participating in the initiative. Thus, our evaluation will pay increasing attention to evidence of
whether Cornerstone practices are spreading throughout the upper grades in participating schools.
SUMMARY OF FIRST YEAR EVALUATION REPORT FINDINGS
Our NYU evaluation officially started with the beginning of Cornerstone’s second year of
implementation, 2001-02, although we have collected demographic and outcome data from Phase I
districts for both the first year of Cornerstone implementation, 2000-01, and the baseline year, 1999-
2000. Our First Year Evaluation Report (January 2003) focused on Phase I and II Cornerstone schools
and districts after the second year or first year of implementation. Our findings indicated that,
overall, the implementation of Cornerstone was proceeding on target. The report highlighted
Cornerstone’s many strengths, including the quality and depth of Cornerstone professional
development opportunities, the commitment and capacity of Cornerstone staff in recognizing and
addressing problems as they arose, and the attention paid to forming a network of Cornerstone
colleagues across the country. Cornerstone’s impact on schools was indicated by reported changes in
school and classroom environment and by the extent of faculty participation in professional learning
opportunities, such as book study groups. Site team members (principals, coaches, critical friends)
and teachers at Cornerstone schools were enthusiastic about the impact of the initiative on their
professional practice and on their school’s instructional culture, and generally praised the level of
support and training they were receiving from Cornerstone.
A key challenge highlighted in the first-year report was the issue of sustainability. Site team
members were concerned that staff and site team turnover would impede the spread of Cornerstone
practices, and were apprehensive about how to maintain program momentum beyond the period of
Cornerstone support. Changes in student achievement were not yet evident in terms of standardized
test scores, but the report provided baseline data on student achievement in the Phase I and II
districts where such data were available.
Cornerstone Second Year Evaluation Report
4
TEST SCORE OUTCOMES
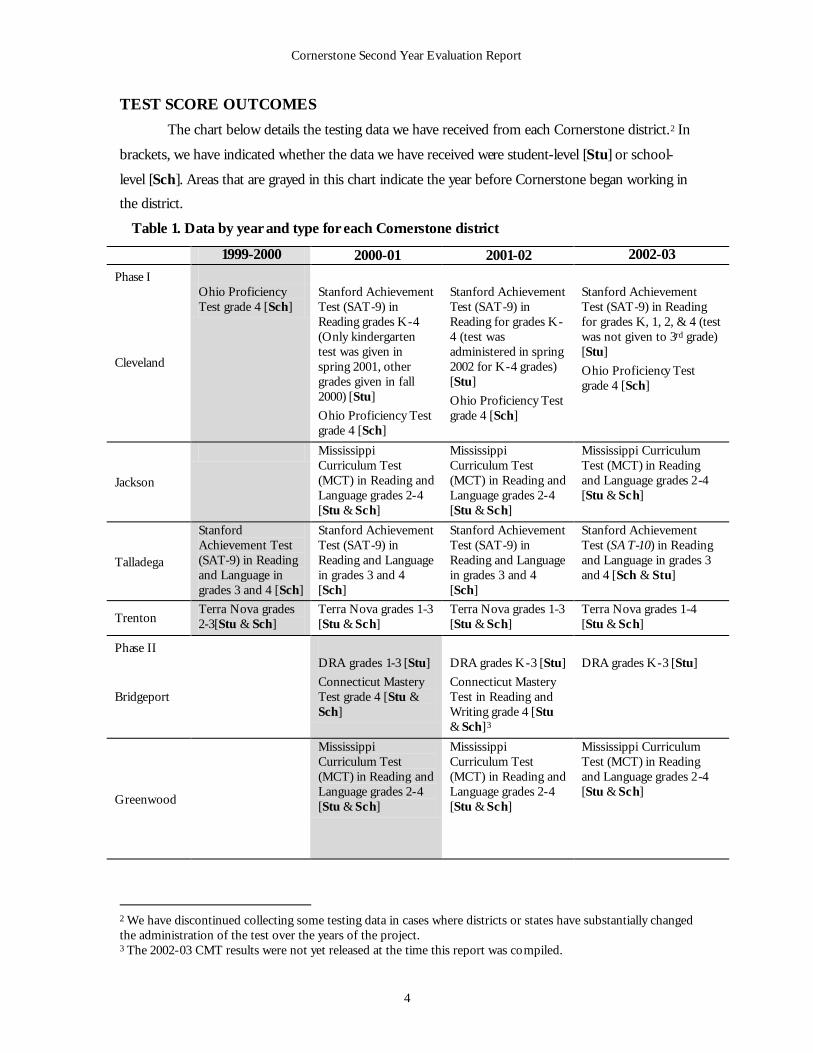
The chart below details the testing data we have received from each Cornerstone district.2 In
brackets, we have indicated whether the data we have received were student-level [Stu] or school-
level [Sch]. Areas that are grayed in this chart indicate the year before Cornerstone began working in
the district.
Table 1. Data by year and type for each Cornerstone district
1999-2000 2000-01 2001-02 2002-03
Phase I
Cleveland
Ohio Proficiency Test grade 4 [Sch]
Stanford Achievement Test (SAT-9) in Reading grades K-4 (Only kindergarten test was given in spring 2001, other grades given in fall 2000) [Stu]
Ohio Proficiency Test grade 4 [Sch]
Stanford Achievement Test (SAT-9) in Reading for grades K-4 (test was administered in spring 2002 for K-4 grades) [Stu]
Ohio Proficiency Test grade 4 [Sch]
Stanford Achievement Test (SAT-9) in Reading for grades K, 1, 2, & 4 (test was not given to 3rd grade) [Stu]
Ohio Proficiency Test grade 4 [Sch]
Jackson
Mississippi Curriculum Test (MCT) in Reading and Language grades 2-4 [Stu & Sch]
Mississippi Curriculum Test (MCT) in Reading and Language grades 2-4 [Stu & Sch]
Mississippi Curriculum Test (MCT) in Reading and Language grades 2-4 [Stu & Sch]
Talladega
Stanford Achievement Test (SAT-9) in Reading and Language in grades 3 and 4 [Sch]
Stanford Achievement Test (SAT-9) in Reading and Language in grades 3 and 4 [Sch]
Stanford Achievement Test (SAT-9) in Reading and Language in grades 3 and 4 [Sch]
Stanford Achievement Test (SAT-10) in Reading and Language in grades 3 and 4 [Sch & Stu]
Trenton Terra Nova grades 2-3[Stu & Sch]
Terra Nova grades 1-3 [Stu & Sch]
Terra Nova grades 1-3 [Stu & Sch]
Terra Nova grades 1-4 [Stu & Sch]
Phase II
Bridgeport
DRA grades 1-3 [Stu]
Connecticut Mastery Test grade 4 [Stu & Sch]
DRA grades K-3 [Stu]
Connecticut Mastery Test in Reading and Writing grade 4 [Stu & Sch] 3
DRA grades K-3 [Stu]
Greenwood
Mississippi Curriculum Test (MCT) in Reading and Language grades 2-4 [Stu & Sch]
Mississippi Curriculum Test (MCT) in Reading and Language grades 2-4 [Stu & Sch]
Mississippi Curriculum Test (MCT) in Reading and Language grades 2-4 [Stu & Sch]
2 We have discontinued collecting some testing data in cases where districts or states have substantially changed the administration of the test over the years of the project. 3 The 2002-03 CMT results were not yet released at the time this report was compiled.
Cornerstone Second Year Evaluation Report
5
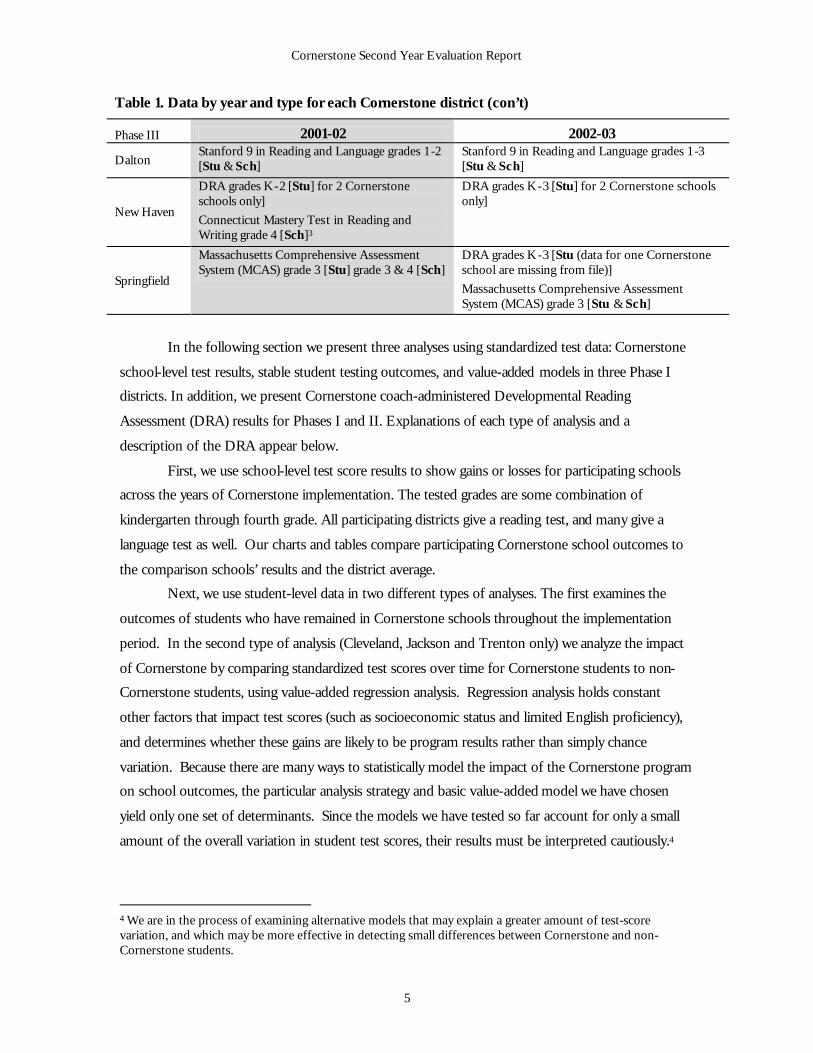
Table 1. Data by year and type for each Cornerstone district (con’t)
Phase III 2001-02 2002-03
Dalton Stanford 9 in Reading and Language grades 1-2 [Stu & Sch]
Stanford 9 in Reading and Language grades 1-3 [Stu & Sch]
New Haven
DRA grades K-2 [Stu] for 2 Cornerstone schools only]
Connecticut Mastery Test in Reading and Writing grade 4 [Sch]3
DRA grades K-3 [Stu] for 2 Cornerstone schools only]
Springfield
Massachusetts Comprehensive Assessment System (MCAS) grade 3 [Stu] grade 3 & 4 [Sch]
DRA grades K-3 [Stu (data for one Cornerstone school are missing from file)]
Massachusetts Comprehensive Assessment System (MCAS) grade 3 [Stu & Sch]
In the following section we present three analyses using standardized test data: Cornerstone
school-level test results, stable student testing outcomes, and value-added models in three Phase I
districts. In addition, we present Cornerstone coach-administered Developmental Reading
Assessment (DRA) results for Phases I and II. Explanations of each type of analysis and a
description of the DRA appear below.
First, we use school-level test score results to show gains or losses for participating schools
across the years of Cornerstone implementation. The tested grades are some combination of
kindergarten through fourth grade. All participating districts give a reading test, and many give a
language test as well. Our charts and tables compare participating Cornerstone school outcomes to
the comparison schools’ results and the district average.
Next, we use student-level data in two different types of analyses. The first examines the
outcomes of students who have remained in Cornerstone schools throughout the implementation
period. In the second type of analysis (Cleveland, Jackson and Trenton only) we analyze the impact
of Cornerstone by comparing standardized test scores over time for Cornerstone students to non-
Cornerstone students, using value-added regression analysis. Regression analysis holds constant
other factors that impact test scores (such as socioeconomic status and limited English proficiency),
and determines whether these gains are likely to be program results rather than simply chance
variation. Because there are many ways to statistically model the impact of the Cornerstone program
on school outcomes, the particular analysis strategy and basic value-added model we have chosen
yield only one set of determinants. Since the models we have tested so far account for only a small
amount of the overall variation in student test scores, their results must be interpreted cautiously.4
4 We are in the process of examining alternative models that may explain a greater amount of test-score variation, and which may be more effective in detecting small differences between Cornerstone and non-Cornerstone students.
Cornerstone Second Year Evaluation Report
6
Our regression model examines differences in test score gains over time between
Cornerstone and non-Cornerstone students in the lower grades within each district.5 An examination
of test score gains indicates whether Cornerstone students had greater or lesser gains than other
students in the same district. We present an examination of test score gains and the results of our
regression model for Cleveland, Jackson and Trenton. The relevant Talladega data are not yet
available6, and the Phase II and III districts are still too new to amass the longitudinal data necessary
for the regression model.
We also present the results of the Cornerstone-administered Developmental Reading
Assessment (DRA), one of three assessments administered to a small sample of students in each
Cornerstone school.7 (The others are the Major Point Interview for Readers [MPIR] and a writing
sample.) These assessments are administered to inform coaches and teachers about the progress of a
sample of students, and to collect achievement data to assess the impact of the initiative. However,
there are some current limitations to the usefulness of the DRA data in drawing conclusions about
the impact on student literacy. One limitation is that the test was administered at different times
during the school year in both of the testing years. Additionally, the sample sizes are small and there
is a high attrition rate due to mobility at some sites. A more detailed description of the testing format
and procedure are in the appendix.
The results of the DRA from all students tested in the Phase I and II Cornerstone schools
during 2001-02 and 2002-03 appear in each district section. Phase III schools only have an initial year
of data (2002-03) and therefore are not included in this year’s report. District-administered DRA
results are presented for Bridgeport and New Haven. The tables show the cross-sectional results by
year and grade level. The cross-sectional sample includes students who were tested only once, as well
as students who remained in the sample for the two years. District charts8 are presented for those
districts that had two years of data for both Cornerstone schools.9
5 As The Cornerstone Initiative focuses on schools with challenging student populations, it is important to note that test score gains represent the number of points that a student’s score increased over a time period, regardless of the student’s initial score. For example a student whose scale score was 250 in the first year and 300 in the subsequent year would show a gain of 50. Conversely, a student whose score decreases over mu ltiple years will have a negative gain score. 6 Despite repeated promises from the Talladega State Education Department, we have not yet received student-level data for the 2000-01 and 2001-02 school years. We are hopeful that we will receive these data for inclusion in the next report. 7 Bridgeport, New Haven and Springfield also administer the DRA districtwide. Bridgeport and New Haven’s districtwide assessment results are also included in this report for the Cornerstone schools in those districts. 8 Data for stable students were aggregated to the district level due to very small n’s at each school. 9 The sample of students in the district charts is limited to students who were tested both years and who made grade progress (i.e. tested in 1 st grade in 2001-02 and 2nd grade in 2002-03). Overall, 71% of the students who were tested in 2001-02 were tested again in 2002-03.
Cornerstone Second Year Evaluation Report
7
Phase I
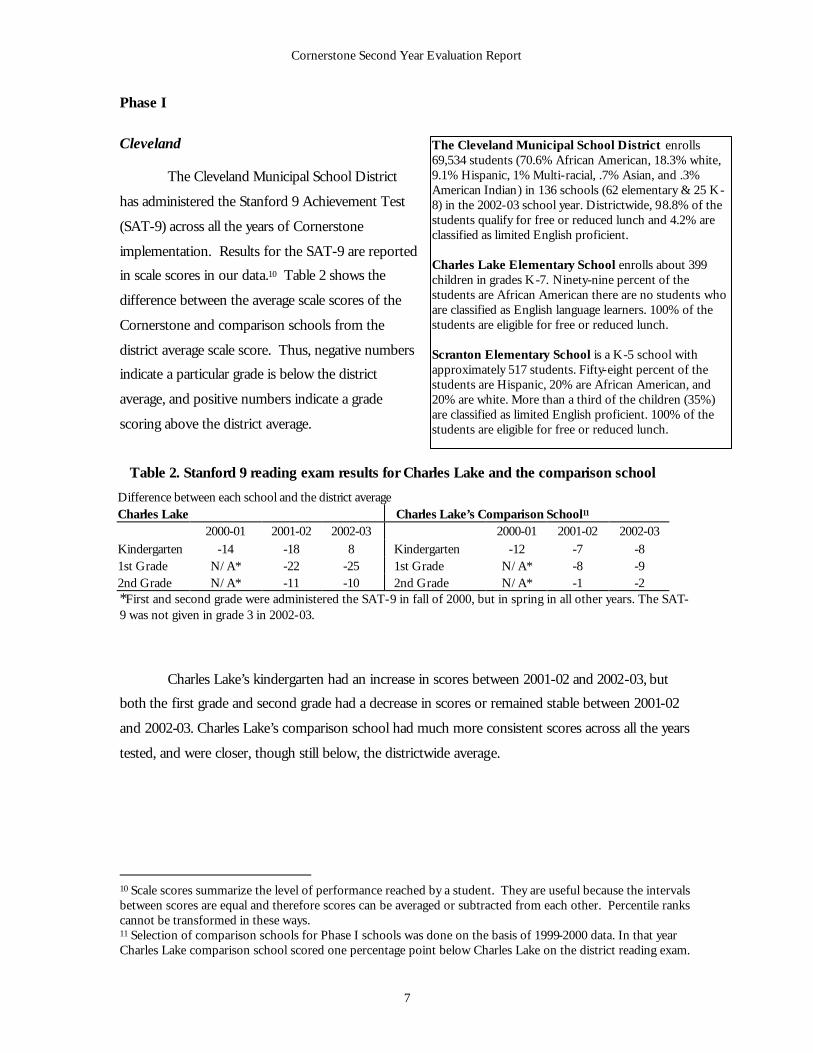
Cleveland
The Cleveland Municipal School District
has administered the Stanford 9 Achievement Test
(SAT-9) across all the years of Cornerstone
implementation. Results for the SAT-9 are reported
in scale scores in our data.10 Table 2 shows the
difference between the average scale scores of the
Cornerstone and comparison schools from the
district average scale score. Thus, negative numbers
indicate a particular grade is below the district
average, and positive numbers indicate a grade
scoring above the district average.
Table 2. Stanford 9 reading exam results for Charles Lake and the comparison school
Difference between each school and the district average Charles Lake Charles Lake’s Comparison School11 2000-01 2001-02 2002-03 2000-01 2001-02 2002-03 Kindergarten -14 -18 8 Kindergarten -12 -7 -8 1st Grade N/A* -22 -25 1st Grade N/A* -8 -9 2nd Grade N/A* -11 -10 2nd Grade N/A* -1 -2 *First and second grade were administered the SAT-9 in fall of 2000, but in spring in all other years. The SAT-9 was not given in grade 3 in 2002-03.
Charles Lake’s kindergarten had an increase in scores between 2001-02 and 2002-03, but
both the first grade and second grade had a decrease in scores or remained stable between 2001-02
and 2002-03. Charles Lake’s comparison school had much more consistent scores across all the years
tested, and were closer, though still below, the districtwide average.
10 Scale scores summarize the level of performance reached by a student. They are useful because the intervals between scores are equal and therefore scores can be averaged or subtracted from each other. Percentile ranks cannot be transformed in these ways. 11 Selection of comparison schools for Phase I schools was done on the basis of 1999-2000 data. In that year Charles Lake comparison school scored one percentage point below Charles Lake on the district reading exam.
The Cleveland Municipal School District enrolls 69,534 students (70.6% African American, 18.3% white, 9.1% Hispanic, 1% Multi-racial, .7% Asian, and .3% American Indian) in 136 schools (62 elementary & 25 K-8) in the 2002-03 school year. Districtwide, 98.8% of the students qualify for free or reduced lunch and 4.2% are classified as limited English proficient. Charles Lake Elementary School enrolls about 399 children in grades K-7. Ninety-nine percent of the students are African American there are no students who are classified as English language learners. 100% of the students are eligible for free or reduced lunch. Scranton Elementary School is a K-5 school with approximately 517 students. Fifty-eight percent of the students are Hispanic, 20% are African American, and 20% are white. More than a third of the children (35%) are classified as limited English proficient. 100% of the students are eligible for free or reduced lunch.
Cornerstone Second Year Evaluation Report
8
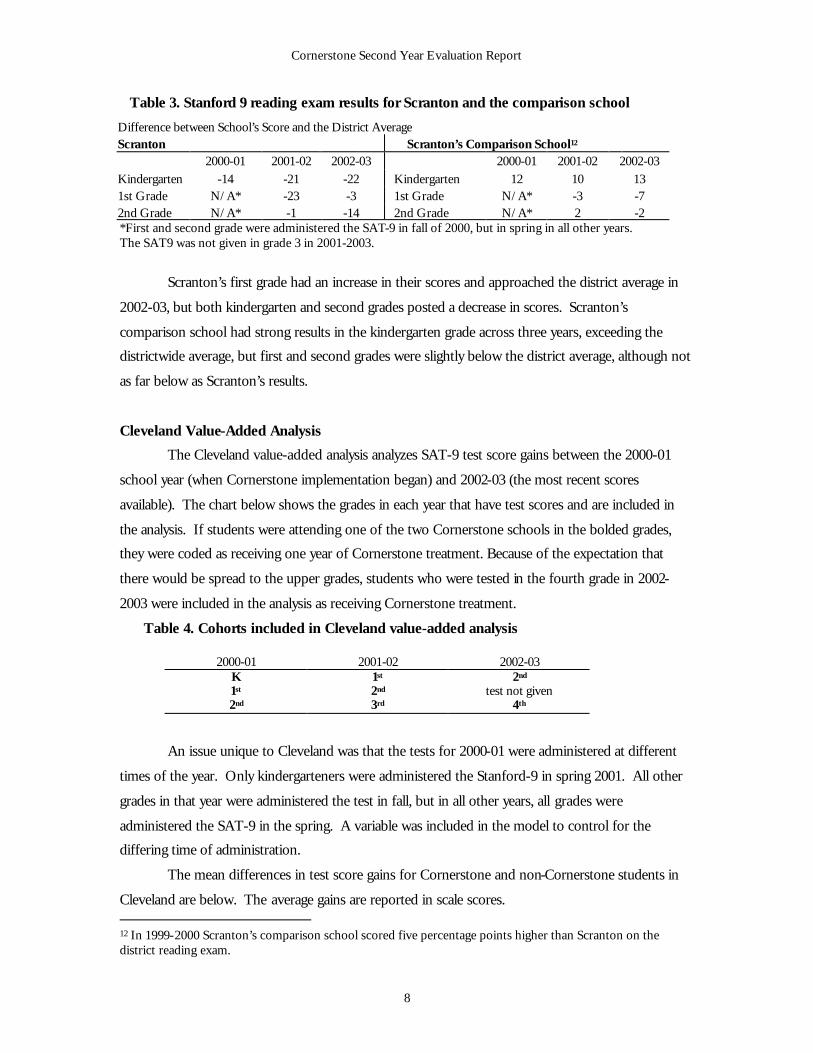
Table 3. Stanford 9 reading exam results for Scranton and the comparison school
Difference between School’s Score and the District Average Scranton Scranton’s Comparison School12 2000-01 2001-02 2002-03 2000-01 2001-02 2002-03 Kindergarten -14 -21 -22 Kindergarten 12 10 13 1st Grade N/A* -23 -3 1st Grade N/A* -3 -7 2nd Grade N/A* -1 -14 2nd Grade N/A* 2 -2 *First and second grade were administered the SAT-9 in fall of 2000, but in spring in all other years. The SAT9 was not given in grade 3 in 2001-2003.
Scranton’s first grade had an increase in their scores and approached the district average in
2002-03, but both kindergarten and second grades posted a decrease in scores. Scranton’s
comparison school had strong results in the kindergarten grade across three years, exceeding the
districtwide average, but first and second grades were slightly below the district average, although not
as far below as Scranton’s results.
Cleveland Value-Added Analysis
The Cleveland value-added analysis analyzes SAT-9 test score gains between the 2000-01
school year (when Cornerstone implementation began) and 2002-03 (the most recent scores
available). The chart below shows the grades in each year that have test scores and are included in
the analysis. If students were attending one of the two Cornerstone schools in the bolded grades,
they were coded as receiving one year of Cornerstone treatment. Because of the expectation that
there would be spread to the upper grades, students who were tested in the fourth grade in 2002-
2003 were included in the analysis as receiving Cornerstone treatment.
Table 4. Cohorts included in Cleveland value-added analysis
An issue unique to Cleveland was that the tests for 2000-01 were administered at different
times of the year. Only kindergarteners were administered the Stanford-9 in spring 2001. All other
grades in that year were administered the test in fall, but in all other years, all grades were
administered the SAT-9 in the spring. A variable was included in the model to control for the
differing time of administration.
The mean differences in test score gains for Cornerstone and non-Cornerstone students in
Cleveland are below. The average gains are reported in scale scores. 12 In 1999-2000 Scranton’s comparison school scored five percentage points higher than Scranton on the district reading exam.
2000-01 2001-02 2002-03 K 1st 2nd 1st 2nd test not given 2nd 3rd 4th
Cornerstone Second Year Evaluation Report
9
Table 5. Average gains of Cornerstone and Non-Cornerstone students on SAT-9 Reading scores
Length of Treatment Average Reading Scale Score Gain Number of Students
1 year of Cornerstone 101.07 73
2 years of Cornerstone 97.61 62
3 years of Cornerstone 94.35 95
Non-Cornerstone 97.25 7,769
The “Length of Treatment” column in the table above refers to the number of years that
each student participated in Cornerstone. By 2002-03, a student with three years of test score
data could have received up to three years of instruction under the program, given the schedule
of implementation. Students with 1-2 years of Cornerstone treatment had test score gains very
similar to, though slightly higher than, the district’s non-Cornerstone students. Students
receiving three years of Cornerstone treatment did not have as large scale score gains as the rest
of the district’s students. Our regression model, constructed to test whether these differences are
statistically significant, included controls for race/ethnicity, limited English proficiency, special
education status, whether the student was retained, and a control for whether the student was
tested in the fall or the spring of 2000-01. The control for time of testing adjusted for the fewer
months of instruction students tested in the fall received. The results are presented below.
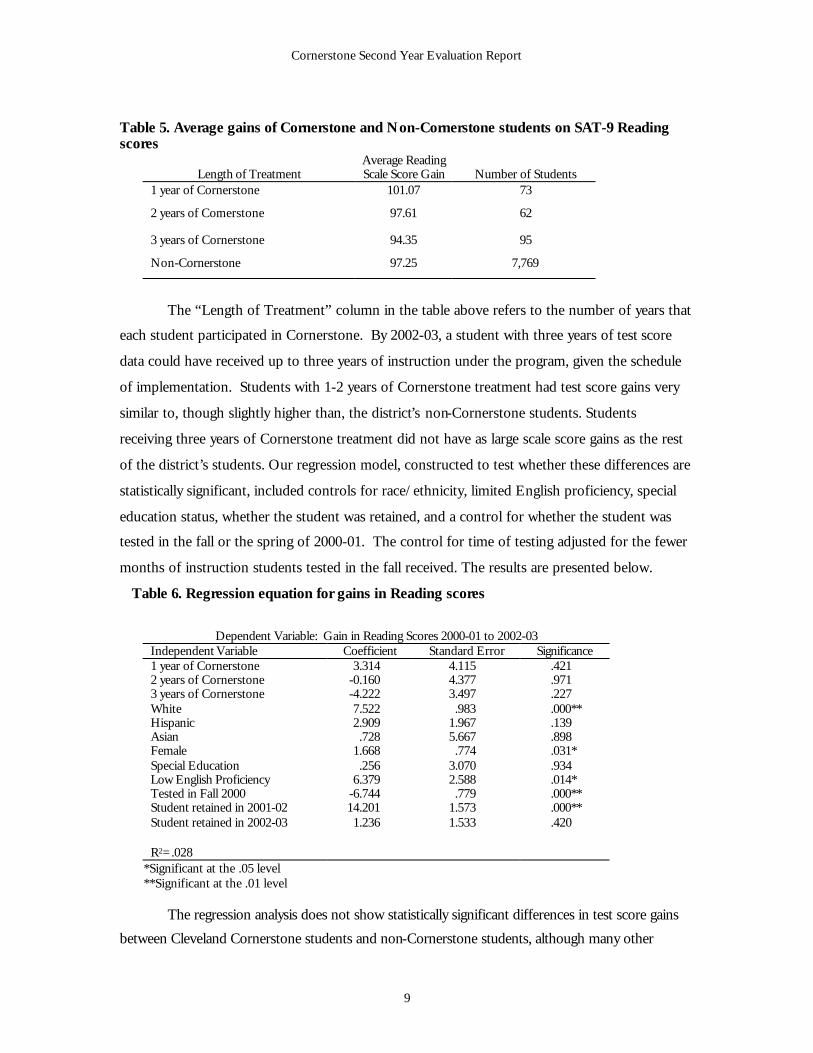
Table 6. Regression equation for gains in Reading scores
Dependent Variable: Gain in Reading Scores 2000-01 to 2002-03 Independent Variable Coefficient Standard Error Significance 1 year of Cornerstone 3.314 4.115 .421 2 years of Cornerstone -0.160 4.377 .971 3 years of Cornerstone -4.222 3.497 .227 White 7.522 .983 .000** Hispanic 2.909 1.967 .139 Asian .728 5.667 .898 Female 1.668 .774 .031* Special Education .256 3.070 .934 Low English Proficiency 6.379 2.588 .014* Tested in Fall 2000 -6.744 .779 .000** Student retained in 2001-02 14.201 1.573 .000** Student retained in 2002-03 1.236 1.533 .420
R2=.028
*Significant at the .05 level **Significant at the .01 level
The regression analysis does not show statistically significant differences in test score gains
between Cleveland Cornerstone students and non-Cornerstone students, although many other
Cornerstone Second Year Evaluation Report
10
variables in our model were significant. But as the table shows, our R2 for this equation is .028,
meaning that only 2.8% of the variance in the Reading gain score is explained by our model. This
very small percent indicates that other factors impacting the gain score are not included.
Cornerstone DRA Results for Cleveland
The table below shows the results for each school on the DRA administered by the
coaches across the two years for which data are available.
Table 7. DRA results for Charles Lake and Scranton
First Grade Second Grade Third Grade Cleveland
2001-02 2002-03 2001-02 2002-03 2001-02 2002-03 students reading at or above
January benchmarks 22.2% 33.3% 36.4% 58.3% 60.0% 58.3% Charles
Lake Total number of students tested 9 9 11 12 5 12
students reading at or above January benchmarks 0% 9.1% 16.6% 23.1% 28.6% 23.1% Scranton
Total number of students tested 10 11 12 13 7 13
The percent of students meeting the benchmarks in Charles Lake and Scranton show an
increase in reading levels from 2001-02 to 2002-03 in the first and second grades, but a slight fall-off
of reading levels in grade three.
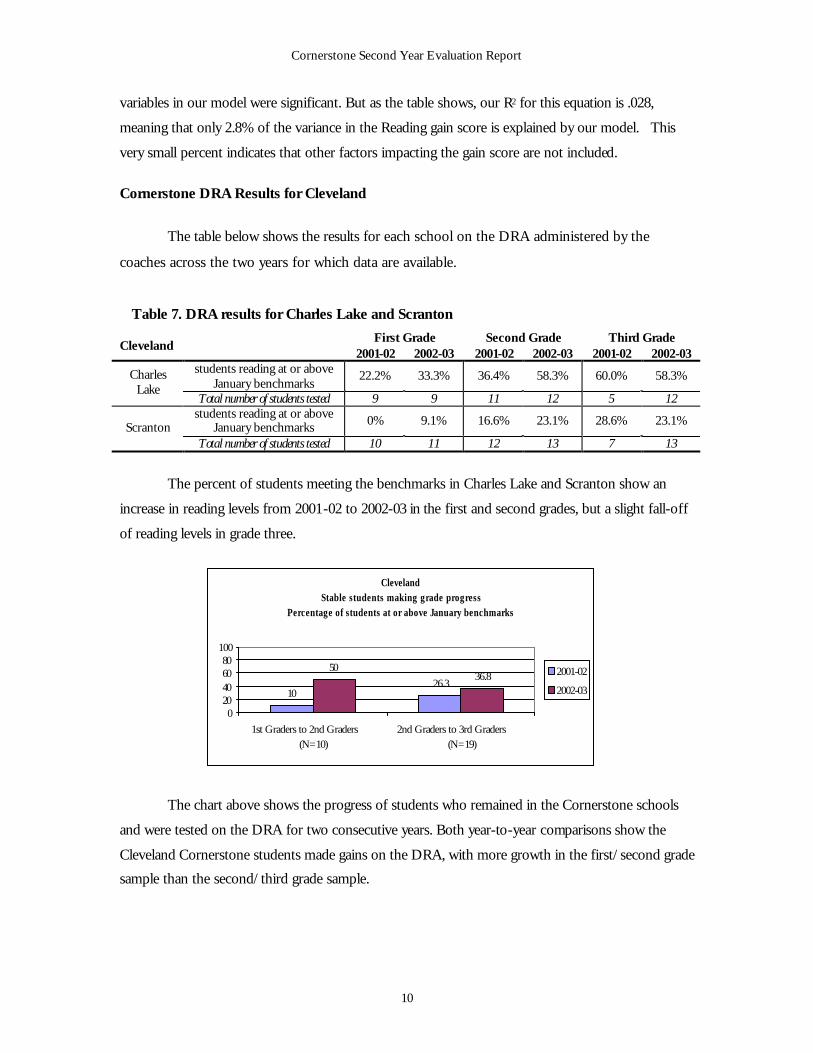
The chart above shows the progress of students who remained in the Cornerstone schools
and were tested on the DRA for two consecutive years. Both year-to-year comparisons show the
Cleveland Cornerstone students made gains on the DRA, with more growth in the first/second grade
sample than the second/third grade sample.
ClevelandStable students making grade progress
Percentage of students at or above January benchmarks
1026.3
5036.8
020406080
100
1st Graders to 2nd Graders (N=10)
2nd Graders to 3rd Graders (N=19)
2001-02
2002-03
Cornerstone Second Year Evaluation Report
11
Cleveland Outcomes Summary Standardized test score results for Cleveland’s Cornerstone schools are inconclusive. With
few exceptions, neither Lake nor Scranton’s kindergarten through second grades exceeded the
district’s average performance or the performance of their comparison schools. No clear patterns
emerged from the mix of gains and losses posted by the two Cornerstone schools.
Similarly and predictably, the Cleveland value-added analysis of the performance of stable
Cornerstone students across years, compared with the district’s non-Cornerstone students, did not
find significant differences even when holding constant race/ethnicity, special education status,
limited English proficiency and retention. The score gain for Cornerstone students was not
significantly different from the gain of non-Cornerstone students.
On the DRA assessment, both Cornerstone schools showed strong year-to-year gains in first
grade, and smaller year-to-year gains in second grade. Both schools posted small score losses in year-
to-year third grade scores. The analysis of the DRA progress of stable Cornerstone students across
years is more promising. Cornerstone second graders made strong gains over their first grade scores,
and Cornerstone third graders achieved modest progress over their second grade performance. But
because the numbers of students in both DRA analyses are small, the results are, at best, suggestive.
Overall, Cleveland’s Cornerstone schools demonstrated no conclusive patterns in their
standardized test-score results or their value-added analysis. The Cornerstone schools’ DRA
performance was, tentatively, more positive and promising, especially at the first and second grade
levels.
Jackson
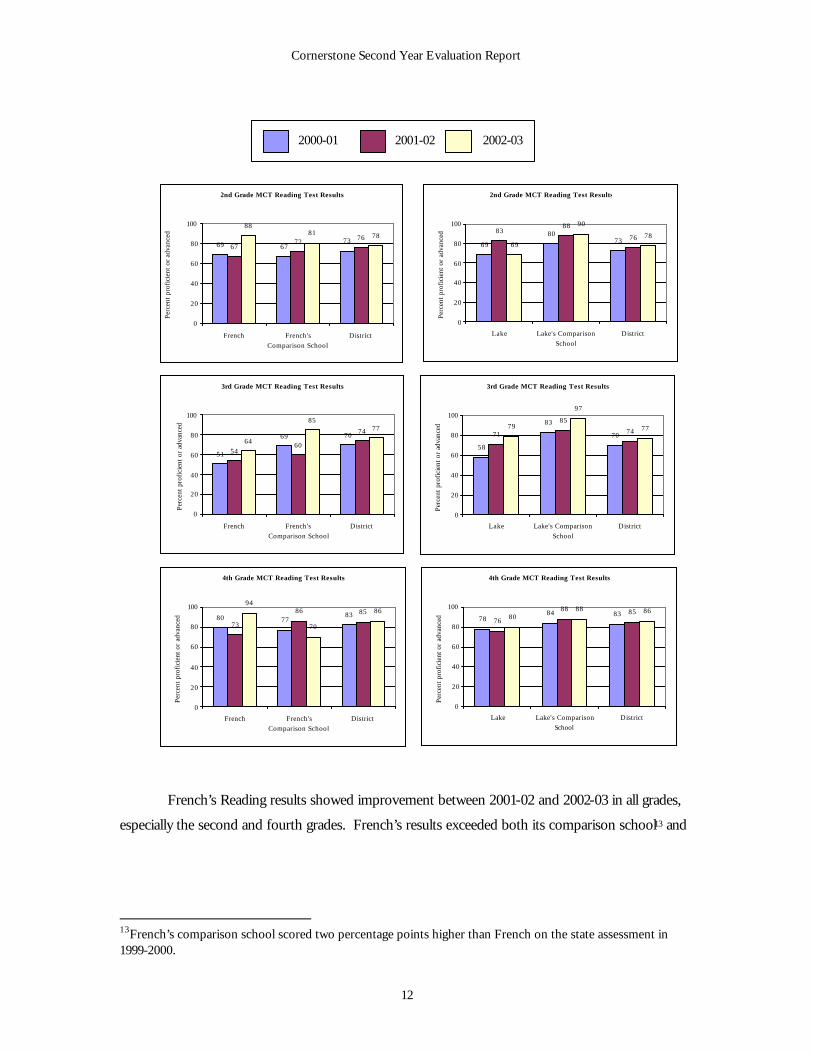
Since 2000-01, the State of Mississippi has
given the Mississippi Curriculum Test (MCT) in
grades 2, 3, and 4 for Reading and Language. The
MCT measures the percent of students scoring at
a minimal level, a basic level, a proficient level or
an advanced level. The charts presented here
indicate what percent of student scored at the
proficient or advanced level in the Cornerstone
schools, their comparison schools, and the district as a whole.
The Jackson Public School District enrolls 31,235 students (94% African American, 5.5% white) in 58 schools (37 elementary). Seventy-two percent of the students qualify for free or reduced lunch and less than 1% are classified as English language learners. French Elementary School is a K-5 school with 365 students. Almost all students are African American and qualify for free or reduced lunch. Viola Lake Elementary School is a K-5 school with 558 students. Almost all students are African American and 95% qualify for free or reduced lunch.
Cornerstone Second Year Evaluation Report
12
French’s Reading results showed improvement between 2001-02 and 2002-03 in all grades,
especially the second and fourth grades. French’s results exceeded both its comparison school13 and
13French’s comparison school scored two percentage points higher than French on the state assessment in 1999-2000.
2000-01 2001-02 2002-03
3rd Grade MCT Reading Test Results
51
69 70
5460
74
64
8577
0
20
40
60
80
100
French French's
Comparison School
District
Per
cent
pro
fici
ent
or a
dvan
ced
3rd Grade MCT Reading Test Results
58
83
7071
85
7479
97
77
0
20
40
60
80
100
Lake Lake's Comparison
School
District
Per
cent
pro
fici
ent
or a
dvan
ced
4th Grade MCT Reading Test Results
80 7783
73
86 8594
70
86
0
20
40
60
80
100
French French's
Comparison School
District
Per
cent
pro
fici
ent
or a
dvan
ced
4th Grade MCT Reading Test Results
7884 83
76
88 8580
88 86
0
20
40
60
80
100
Lake Lake's Comparison
School
District
Per
cent
pro
fici
ent
or a
dvan
ced
2nd Grade MCT Reading Test Results
69 6773
6772
76
8881 78
0
20
40
60
80
100
French French's
Comparison School
District
Per
cent
pro
fici
ent
or a
dvan
ced
2nd Grade MCT Reading Test Results
69
8073
8388
7669
90
78
0
20
40
60
80
100
Lake Lake's Comparison
School
District
Per
cent
pro
fici
ent
or a
dvan
ced
Cornerstone Second Year Evaluation Report
13
the district average in second and fourth grade. Lake’s third grade improved in 2002-03 as against
the previous year, but Lake did not match the performance of its comparison school in any grade. 14
Lake’s third grade did exceed the district average in 2002-03.
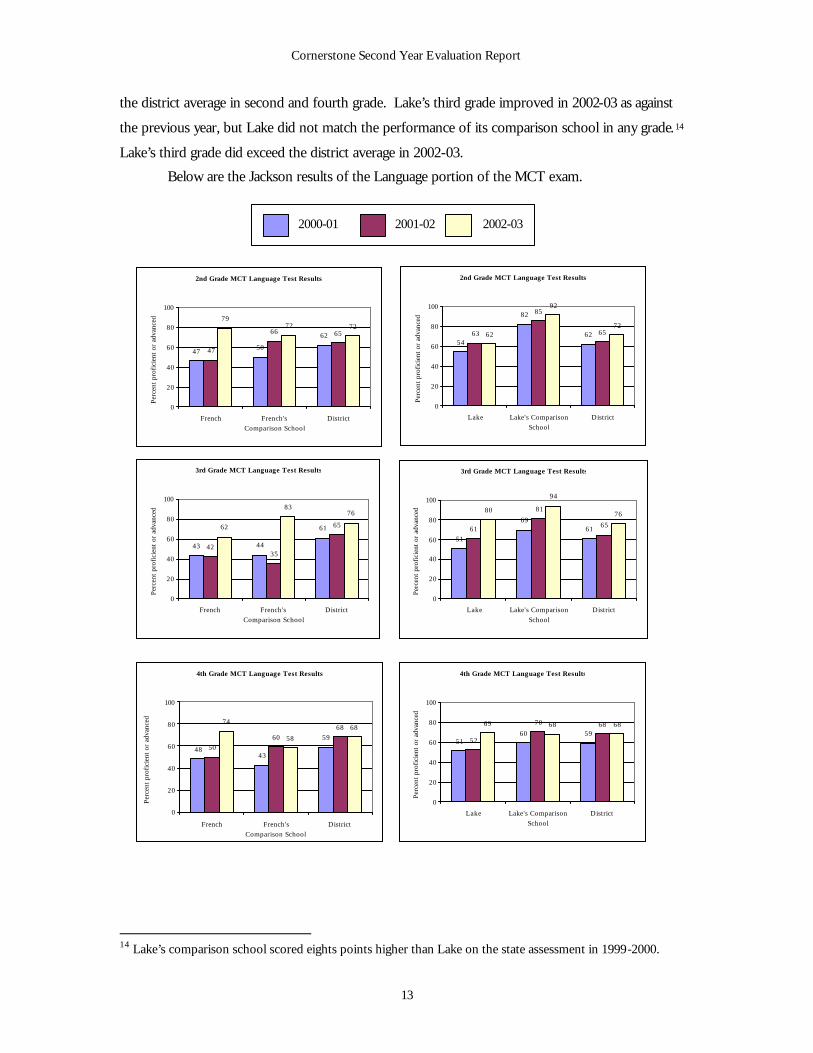
Below are the Jackson results of the Language portion of the MCT exam.
14 Lake’s comparison school scored eights points higher than Lake on the state assessment in 1999-2000.
2000-01 2001-02 2002-03
2nd Grade MCT Language Test Results
4750
62
47
66 65
7972 72
0
20
40
60
80
100
French French's
Comparison School
District
Per
cent
pro
fici
ent
or a
dvan
ced
2nd Grade MCT Language Test Results
54
82
6263
85
6562
92
72
0
20
40
60
80
100
Lake Lake's Comparison
School
DistrictP
erce
nt p
rofi
cien
t or
adv
ance
d
3rd Grade MCT Language Test Results
43 44
61
4235
6562
8376
0
20
40
60
80
100
French French's
Comparison School
District
Per
cent
pro
fici
ent
or a
dvan
ced
3rd Grade MCT Language Test Results
51
696161
81
65
80
94
76
0
20
40
60
80
100
Lake Lake's Comparison
School
District
Per
cent
pro
fici
ent
or a
dvan
ced
4th Grade MCT Language Test Results
4843
59
50
60
6874
58
68
0
20
40
60
80
100
French French's
Comparison School
District
Per
cent
pro
fici
ent
or a
dvan
ced
4th Grade MCT Language Test Results
5160 59
52
70 6869 68 68
0
20
40
60
80
100
Lake Lake's Comparison
School
District
Per
cent
pro
fici
ent
or a
dvan
ced
Cornerstone Second Year Evaluation Report
14
French demonstrated strong growth in second and third grades from 2001-02 to 2002-03 on
the Language exam, surpassing the performance of both its comparison school15 and the district
average. French’s third grade growth was also impressive, but the school’s performance remained
below its comparison school and the district average in that grade. Lake’s third and fourth grade
gains from 2001-02 to 2002-03 were quite large on the Language exam, exceeding both its
comparison school and the district average in fourth grade, and outdoing the district average in third
grade.
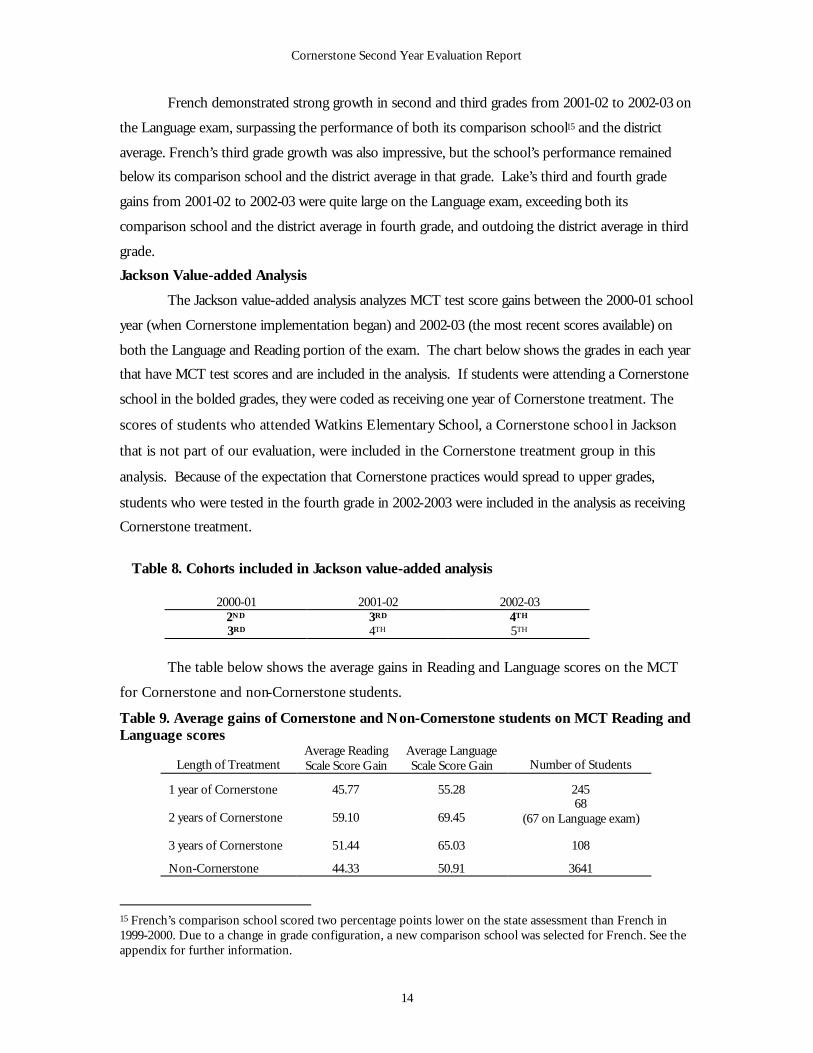
Jackson Value-added Analysis
The Jackson value-added analysis analyzes MCT test score gains between the 2000-01 school
year (when Cornerstone implementation began) and 2002-03 (the most recent scores available) on
both the Language and Reading portion of the exam. The chart below shows the grades in each year
that have MCT test scores and are included in the analysis. If students were attending a Cornerstone
school in the bolded grades, they were coded as receiving one year of Cornerstone treatment. The
scores of students who attended Watkins Elementary School, a Cornerstone school in Jackson
that is not part of our evaluation, were included in the Cornerstone treatment group in this
analysis. Because of the expectation that Cornerstone practices would spread to upper grades,
students who were tested in the fourth grade in 2002-2003 were included in the analysis as receiving
Cornerstone treatment.
Table 8. Cohorts included in Jackson value-added analysis
The table below shows the average gains in Reading and Language scores on the MCT
for Cornerstone and non-Cornerstone students.
Table 9. Average gains of Cornerstone and Non-Cornerstone students on MCT Reading and Language scores
Length of Treatment Average Reading Scale Score Gain
Average Language Scale Score Gain Number of Students
1 year of Cornerstone 45.77 55.28 245
2 years of Cornerstone 59.10 69.45 68
(67 on Language exam)
3 years of Cornerstone 51.44 65.03 108
Non-Cornerstone 44.33 50.91 3641
15 French’s comparison school scored two percentage points lower on the state assessment than French in 1999-2000. Due to a change in grade configuration, a new comparison school was selected for French. See the appendix for further information.
2000-01 2001-02 2002-03 2ND 3RD 4TH 3RD 4TH 5TH
Cornerstone Second Year Evaluation Report
15
As Table 9 shows, the Cornerstone students in Jackson had greater scale score gains on
average in both Reading and Language than non-Cornerstone students.
The results of our preliminary value-added analysis indicate a statistically significant, positive
difference for two years of Cornerstone participation on Reading scores, as well as one, two or three
years of participation on Language scores. Our regression model includes variables such as free lunch
status, whether students were retained, and race/ethnicity in order to control for differences based
on these factors.16 However, because the very low R2 of our equations indicate that other factors
impacting the gain score are not included in our current model, these results must be interpreted
cautiously. The coefficients from the two regression models with Reading and Language score gains
as the dependent variables are presented below. The column in the far right indicates whether the
coefficient is statistically significant.
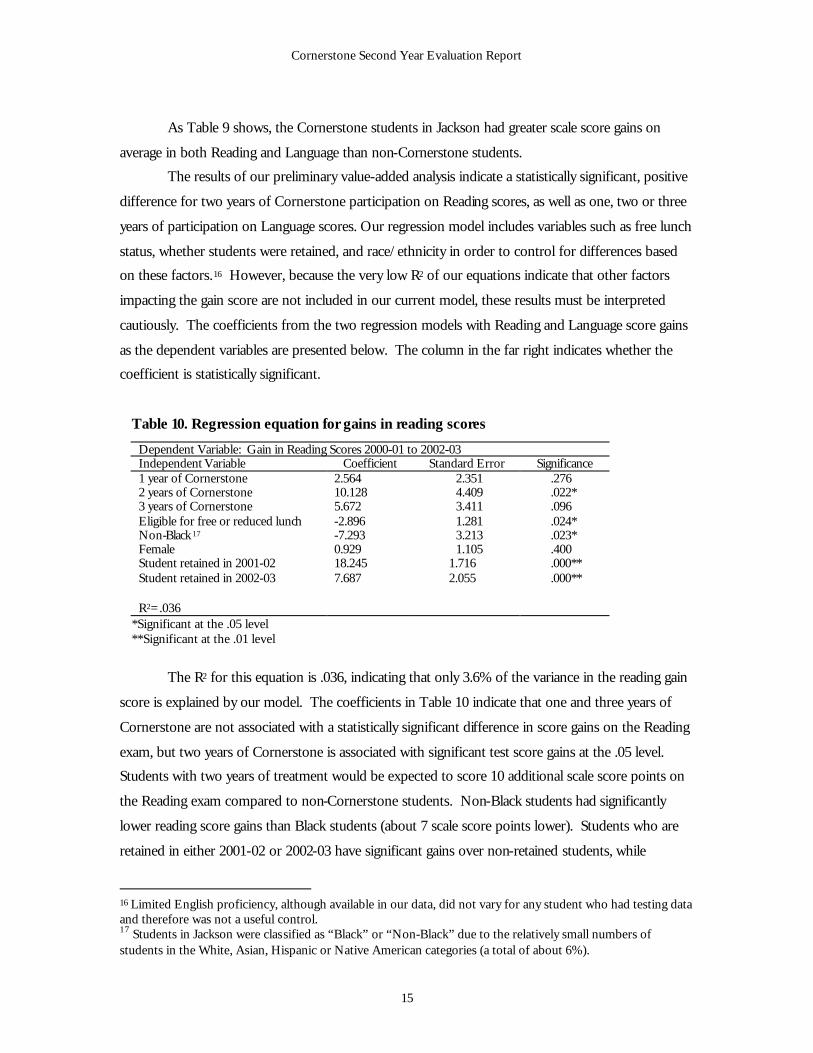
Table 10. Regression equation for gains in reading scores
Dependent Variable: Gain in Reading Scores 2000-01 to 2002-03 Independent Variable Coefficient Standard Error Significance 1 year of Cornerstone 2.564 2.351 .276 2 years of Cornerstone 10.128 4.409 .022* 3 years of Cornerstone 5.672 3.411 .096 Eligible for free or reduced lunch -2.896 1.281 .024* Non-Black 17 -7.293 3.213 .023* Female 0.929 1.105 .400 Student retained in 2001-02 18.245 1.716 .000** Student retained in 2002-03 7.687 2.055 .000**
R2=.036
*Significant at the .05 level **Significant at the .01 level
The R2 for this equation is .036, indicating that only 3.6% of the variance in the reading gain
score is explained by our model. The coefficients in Table 10 indicate that one and three years of
Cornerstone are not associated with a statistically significant difference in score gains on the Reading
exam, but two years of Cornerstone is associated with significant test score gains at the .05 level.
Students with two years of treatment would be expected to score 10 additional scale score points on
the Reading exam compared to non-Cornerstone students. Non-Black students had significantly
lower reading score gains than Black students (about 7 scale score points lower). Students who are
retained in either 2001-02 or 2002-03 have significant gains over non-retained students, while
16 Limited English proficiency, although available in our data, did not vary for any student who had testing data and therefore was not a useful control. 17 Students in Jackson were classified as “Black” or “Non-Black” due to the relatively small numbers of students in the White, Asian, Hispanic or Native American categories (a total of about 6%).
Cornerstone Second Year Evaluation Report
16
students who are eligible for free or reduced lunches have significantly less gains than students who
are not eligible. Gender does not have a significant relationship with Reading test score gains.
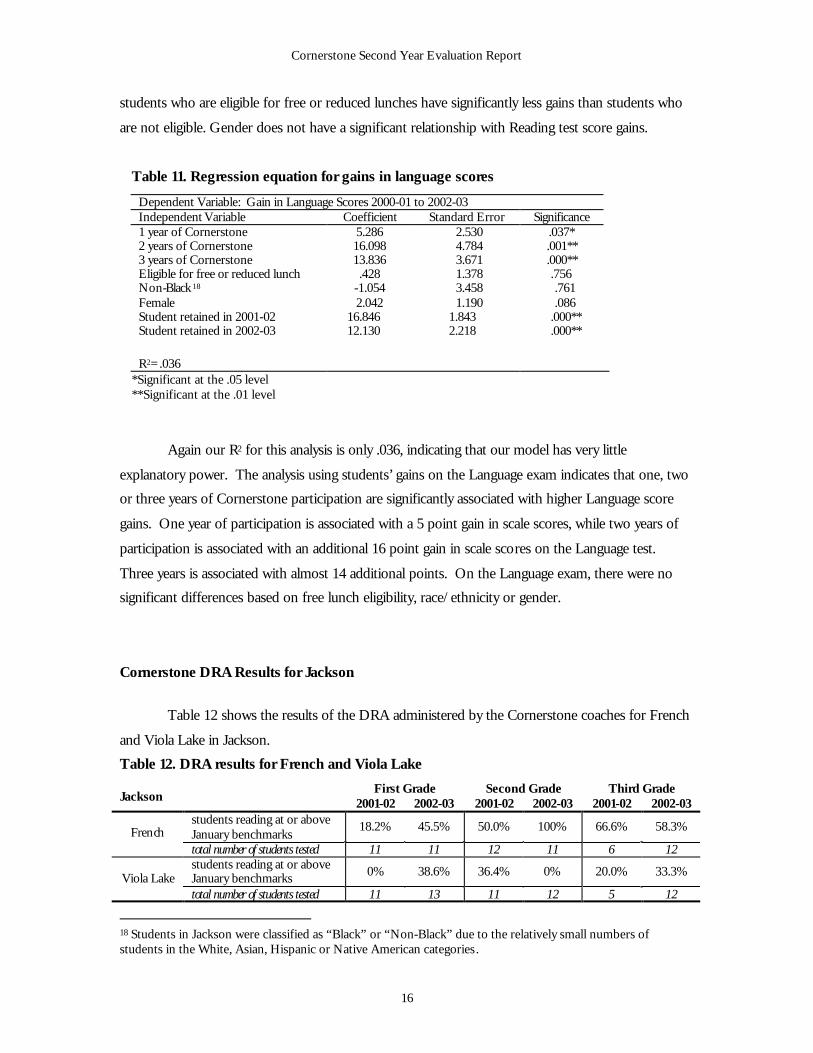
Table 11. Regression equation for gains in language scores
Dependent Variable: Gain in Language Scores 2000-01 to 2002-03 Independent Variable Coefficient Standard Error Significance 1 year of Cornerstone 5.286 2.530 .037* 2 years of Cornerstone 16.098 4.784 .001** 3 years of Cornerstone 13.836 3.671 .000** Eligible for free or reduced lunch .428 1.378 .756 Non-Black 18 -1.054 3.458 .761 Female 2.042 1.190 .086 Student retained in 2001-02 16.846 1.843 .000** Student retained in 2002-03 12.130 2.218 .000**
R2=.036
*Significant at the .05 level **Significant at the .01 level
Again our R2 for this analysis is only .036, indicating that our model has very little
explanatory power. The analysis using students’ gains on the Language exam indicates that one, two
or three years of Cornerstone participation are significantly associated with higher Language score
gains. One year of participation is associated with a 5 point gain in scale scores, while two years of
participation is associated with an additional 16 point gain in scale scores on the Language test.
Three years is associated with almost 14 additional points. On the Language exam, there were no
significant differences based on free lunch eligibility, race/ethnicity or gender.
Cornerstone DRA Results for Jackson
Table 12 shows the results of the DRA administered by the Cornerstone coaches for French
and Viola Lake in Jackson.
Table 12. DRA results for French and Viola Lake
First Grade Second Grade Third Grade Jackson 2001-02 2002-03 2001-02 2002-03 2001-02 2002-03
students reading at or above January benchmarks
18.2% 45.5% 50.0% 100% 66.6% 58.3% French total number of students tested 11 11 12 11 6 12 students reading at or above January benchmarks 0% 38.6% 36.4% 0% 20.0% 33.3% Viola Lake total number of students tested 11 13 11 12 5 12
18 Students in Jackson were classified as “Black” or “Non-Black” due to the relatively small numbers of students in the White, Asian, Hispanic or Native American categories .
Cornerstone Second Year Evaluation Report
17
The DRA results for French show strong increases in reading levels in the first and second
grades, from 2001-02 to 2002-03, and a slight decrease in the third grade. Viola Lake’s DRA results
show a strong gain in first grade, a sharp drop-off in the second grade, and a gain in the third grade,
from 2001-02 to 2002-03.
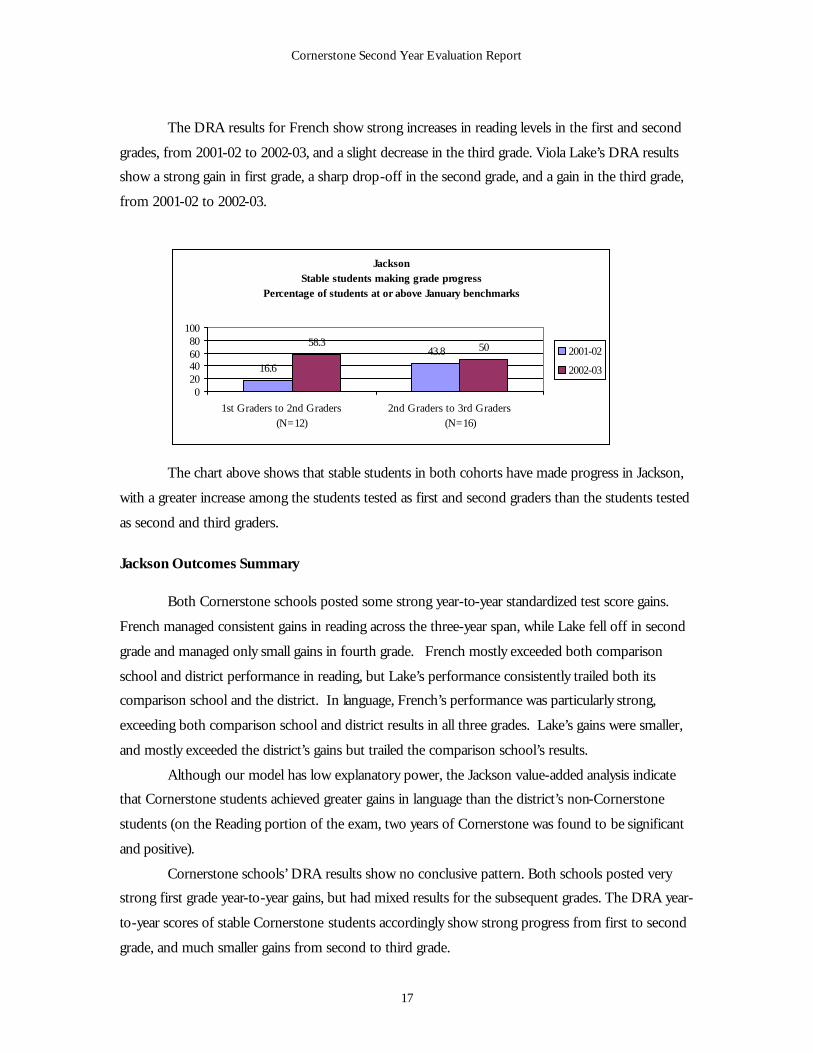
The chart above shows that stable students in both cohorts have made progress in Jackson,
with a greater increase among the students tested as first and second graders than the students tested
as second and third graders.
Jackson Outcomes Summary
Both Cornerstone schools posted some strong year-to-year standardized test score gains.
French managed consistent gains in reading across the three-year span, while Lake fell off in second
grade and managed only small gains in fourth grade. French mostly exceeded both comparison
school and district performance in reading, but Lake’s performance consistently trailed both its
comparison school and the district. In language, French’s performance was particularly strong,
exceeding both comparison school and district results in all three grades. Lake’s gains were smaller,
and mostly exceeded the district’s gains but trailed the comparison school’s results.
Although our model has low explanatory power, the Jackson value-added analysis indicate
that Cornerstone students achieved greater gains in language than the district’s non-Cornerstone
students (on the Reading portion of the exam, two years of Cornerstone was found to be significant
and positive).
Cornerstone schools’ DRA results show no conclusive pattern. Both schools posted very
strong first grade year-to-year gains, but had mixed results for the subsequent grades. The DRA year-
to-year scores of stable Cornerstone students accordingly show strong progress from first to second
grade, and much smaller gains from second to third grade.
JacksonStable students making grade progress
Percentage of students at or above January benchmarks
16.6
43.858.3 50
020406080
100
1st Graders to 2nd Graders (N=12)
2nd Graders to 3rd Graders (N=16)
2001-02
2002-03
Cornerstone Second Year Evaluation Report
18
Overall, Jackson’s Cornerstone schools seem to be making clear progress, relative to both
district and comparison school performance, especially in the early grades.
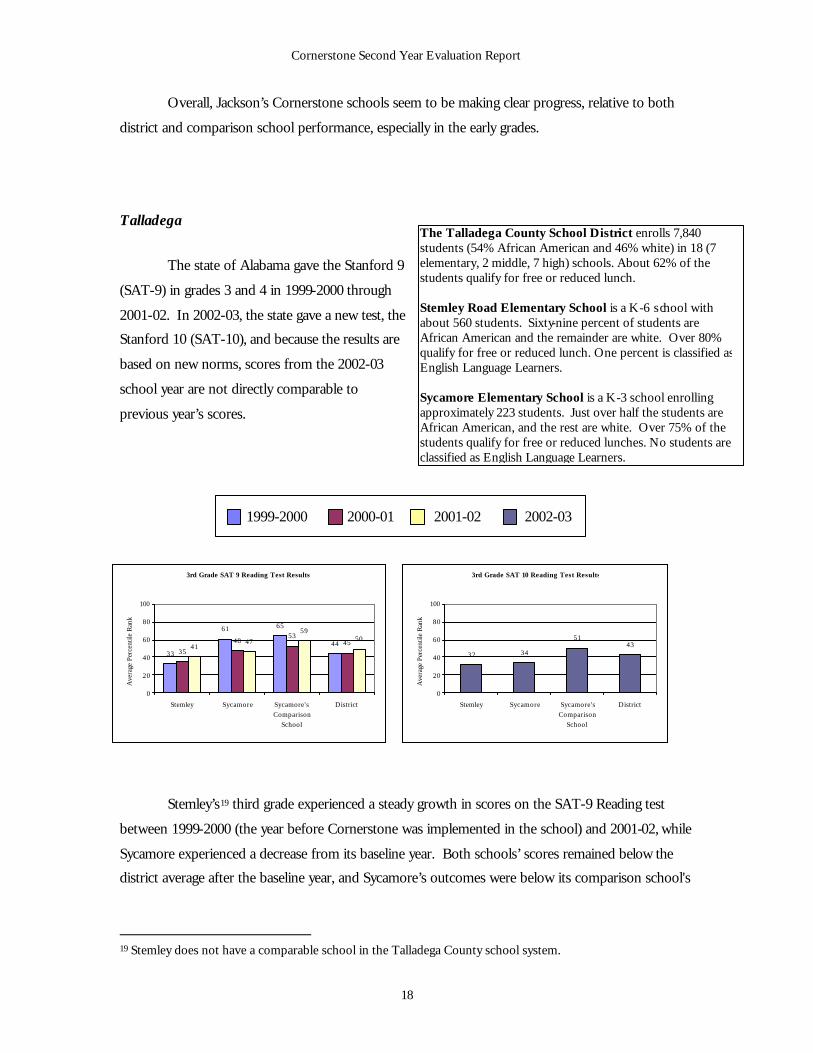
Talladega
The state of Alabama gave the Stanford 9
(SAT-9) in grades 3 and 4 in 1999-2000 through
2001-02. In 2002-03, the state gave a new test, the
Stanford 10 (SAT-10), and because the results are
based on new norms, scores from the 2002-03
school year are not directly comparable to
previous year’s scores.
Stemley’s19 third grade experienced a steady growth in scores on the SAT-9 Reading test
between 1999-2000 (the year before Cornerstone was implemented in the school) and 2001-02, while
Sycamore experienced a decrease from its baseline year. Both schools’ scores remained below the
district average after the baseline year, and Sycamore’s outcomes were below its comparison school's
19 Stemley does not have a comparable school in the Talladega County school system.
The Talladega County School District enrolls 7,840 students (54% African American and 46% white) in 18 (7 elementary, 2 middle, 7 high) schools. About 62% of the students qualify for free or reduced lunch. Stemley Road Elementary School is a K-6 school with about 560 students. Sixty-nine percent of students are African American and the remainder are white. Over 80% qualify for free or reduced lunch. One percent is classified as English Language Learners. Sycamore Elementary School is a K-3 school enrolling approximately 223 students. Just over half the students are African American, and the rest are white. Over 75% of the students qualify for free or reduced lunches. No students are classified as English Language Learners.
1999-2000 2000-01 2001-02 2002-03
3rd Grade SAT 9 Reading Test Results
33
61 65
4435
4853
4541
47
5950
0
20
40
60
80
100
Stemley Sycamore Sycamore's
Comparison
School
District
Ave
rage
Per
cent
ile R
ank
3rd Grade SAT 10 Reading Test Results
32 34
5143
0
20
40
60
80
100
Stemley Sycamore Sycamore's
Comparison
School
District
Ave
rage
Per
cent
ile R
ank
Cornerstone Second Year Evaluation Report
19
4th Grade SAT 9 Reading Test Results
3730
38
49 49 50
0
20
40
60
80
100
Stemley District
Ave
rage
Per
cent
ile R
ank
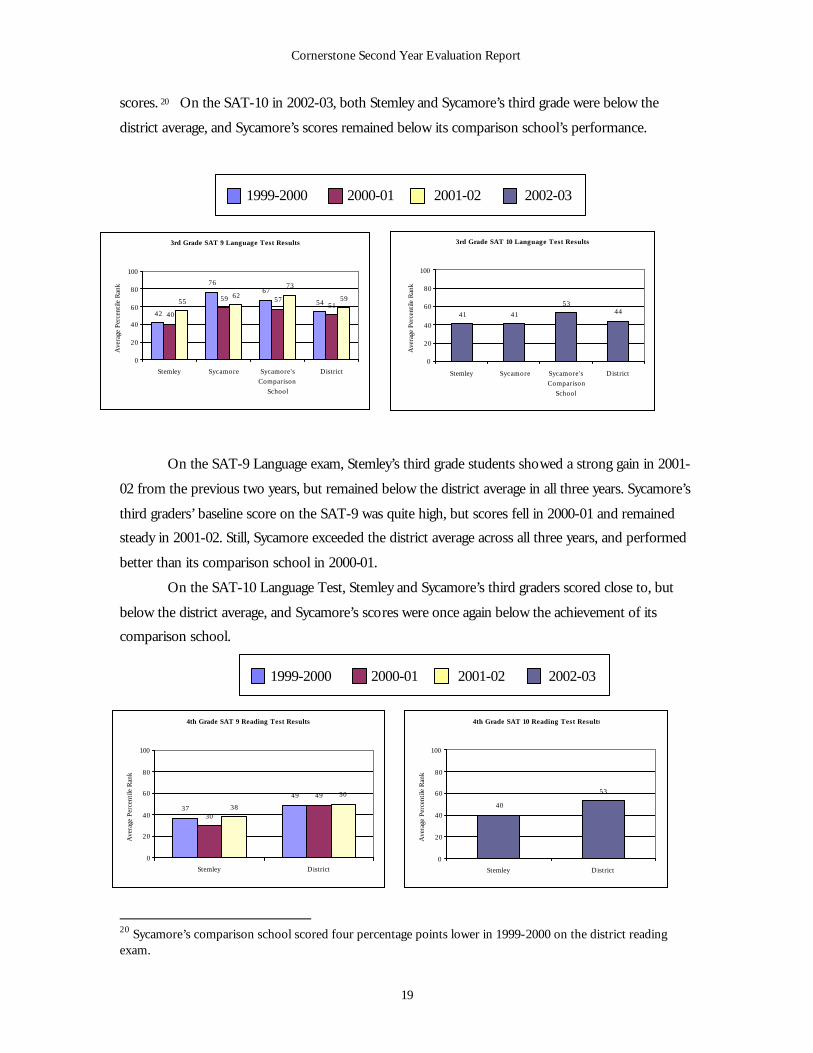
scores. 20 On the SAT-10 in 2002-03, both Stemley and Sycamore’s third grade were below the
district average, and Sycamore’s scores remained below its comparison school’s performance.
On the SAT-9 Language exam, Stemley’s third grade students showed a strong gain in 2001-
02 from the previous two years, but remained below the district average in all three years. Sycamore’s
third graders’ baseline score on the SAT-9 was quite high, but scores fell in 2000-01 and remained
steady in 2001-02. Still, Sycamore exceeded the district average across all three years, and performed
better than its comparison school in 2000-01.
On the SAT-10 Language Test, Stemley and Sycamore’s third graders scored close to, but
below the district average, and Sycamore’s scores were once again below the achievement of its
comparison school.
20 Sycamore’s comparison school scored four percentage points lower in 1999-2000 on the district reading exam.
1999-2000 2000-01 2001-02 2002-03
1999-2000 2000-01 2001-02 2002-03
3rd Grade SAT 9 Language Test Results
42
7667
54
40
59 5751
5562
73
59
0
20
40
60
80
100
Stemley Sycamore Sycamore's
Comparison
School
District
Ave
rage
Per
cent
ile R
ank
3rd Grade SAT 10 Language Test Results
41 41
5344
0
20
40
60
80
100
Stemley Sycamore Sycamore's
Comparison
School
District
Ave
rage
Per
cent
ile R
ank
4th Grade SAT 10 Reading Test Results
40
53
0
20
40
60
80
100
Stemley District
Ave
rage
Per
cent
ile R
ank
Cornerstone Second Year Evaluation Report
20
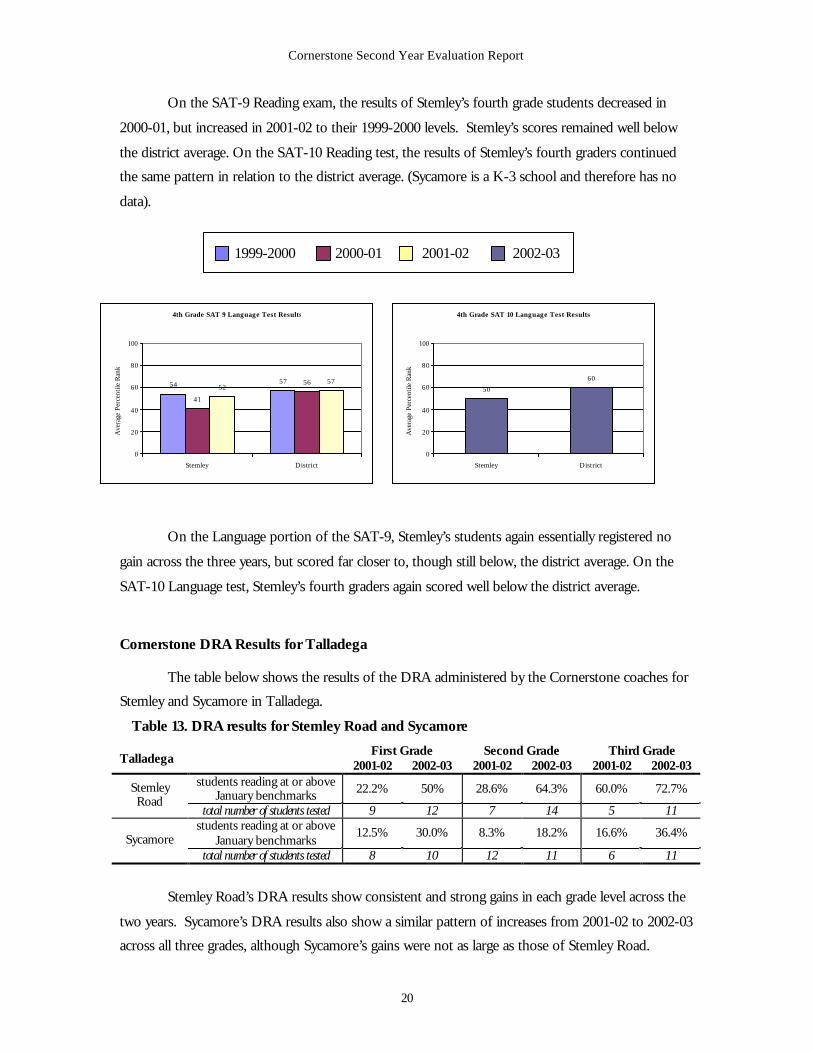
On the SAT-9 Reading exam, the results of Stemley’s fourth grade students decreased in
2000-01, but increased in 2001-02 to their 1999-2000 levels. Stemley’s scores remained well below
the district average. On the SAT-10 Reading test, the results of Stemley’s fourth graders continued
the same pattern in relation to the district average. (Sycamore is a K-3 school and therefore has no
data).
On the Language portion of the SAT-9, Stemley’s students again essentially registered no
gain across the three years, but scored far closer to, though still below, the district average. On the
SAT-10 Language test, Stemley’s fourth graders again scored well below the district average.
Cornerstone DRA Results for Talladega
The table below shows the results of the DRA administered by the Cornerstone coaches for
Stemley and Sycamore in Talladega.
Table 13. DRA results for Stemley Road and Sycamore
First Grade Second Grade Third Grade Talladega 2001-02 2002-03 2001-02 2002-03 2001-02 2002-03
students reading at or above January benchmarks 22.2% 50% 28.6% 64.3% 60.0% 72.7% Stemley
Road total number of students tested 9 12 7 14 5 11
students reading at or above January benchmarks
12.5% 30.0% 8.3% 18.2% 16.6% 36.4% Sycamore total number of students tested 8 10 12 11 6 11
Stemley Road’s DRA results show consistent and strong gains in each grade level across the
two years. Sycamore’s DRA results also show a similar pattern of increases from 2001-02 to 2002-03
across all three grades, although Sycamore’s gains were not as large as those of Stemley Road.
1999-2000 2000-01 2001-02 2002-03
4th Grade SAT 9 Language Test Results
54 57
41
5652
57
0
20
40
60
80
100
Stemley District
Ave
rage
Per
cent
ile R
ank
4th Grade SAT 10 Language Test Results
50
60
0
20
40
60
80
100
Stemley District
Ave
rage
Per
cent
ile R
ank
Cornerstone Second Year Evaluation Report
21
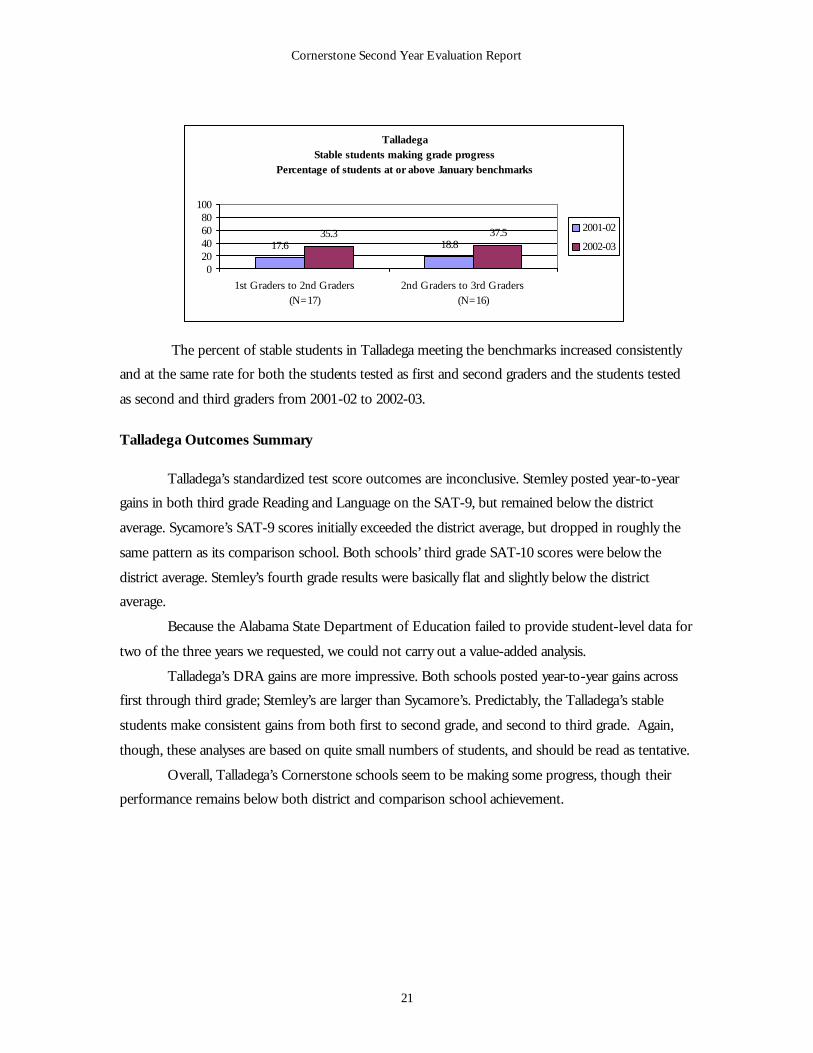
The percent of stable students in Talladega meeting the benchmarks increased consistently
and at the same rate for both the students tested as first and second graders and the students tested
as second and third graders from 2001-02 to 2002-03.
Talladega Outcomes Summary
Talladega’s standardized test score outcomes are inconclusive. Stemley posted year-to-year
gains in both third grade Reading and Language on the SAT-9, but remained below the district
average. Sycamore’s SAT-9 scores initially exceeded the district average, but dropped in roughly the
same pattern as its comparison school. Both schools’ third grade SAT-10 scores were below the
district average. Stemley’s fourth grade results were basically flat and slightly below the district
average.
Because the Alabama State Department of Education failed to provide student-level data for
two of the three years we requested, we could not carry out a value-added analysis.
Talladega’s DRA gains are more impressive. Both schools posted year-to-year gains across
first through third grade; Stemley’s are larger than Sycamore’s. Predictably, the Talladega’s stable
students make consistent gains from both first to second grade, and second to third grade. Again,
though, these analyses are based on quite small numbers of students, and should be read as tentative.
Overall, Talladega’s Cornerstone schools seem to be making some progress, though their
performance remains below both district and comparison school achievement.
TalladegaStable students making grade progress
Percentage of students at or above January benchmarks
17.6 18.835.3 37.5
020406080
100
1st Graders to 2nd Graders (N=17)
2nd Graders to 3rd Graders (N=16)
2001-02
2002-03
Cornerstone Second Year Evaluation Report
22
Trenton
The district of Trenton administers the
Terra Nova in both Reading and Language in
grades 1-3. The scores are measured in national
percentile ranks. Below are tables indicating the
percent of students scoring at the 51st percentile
or above in the Cornerstone schools and their
comparison schools.
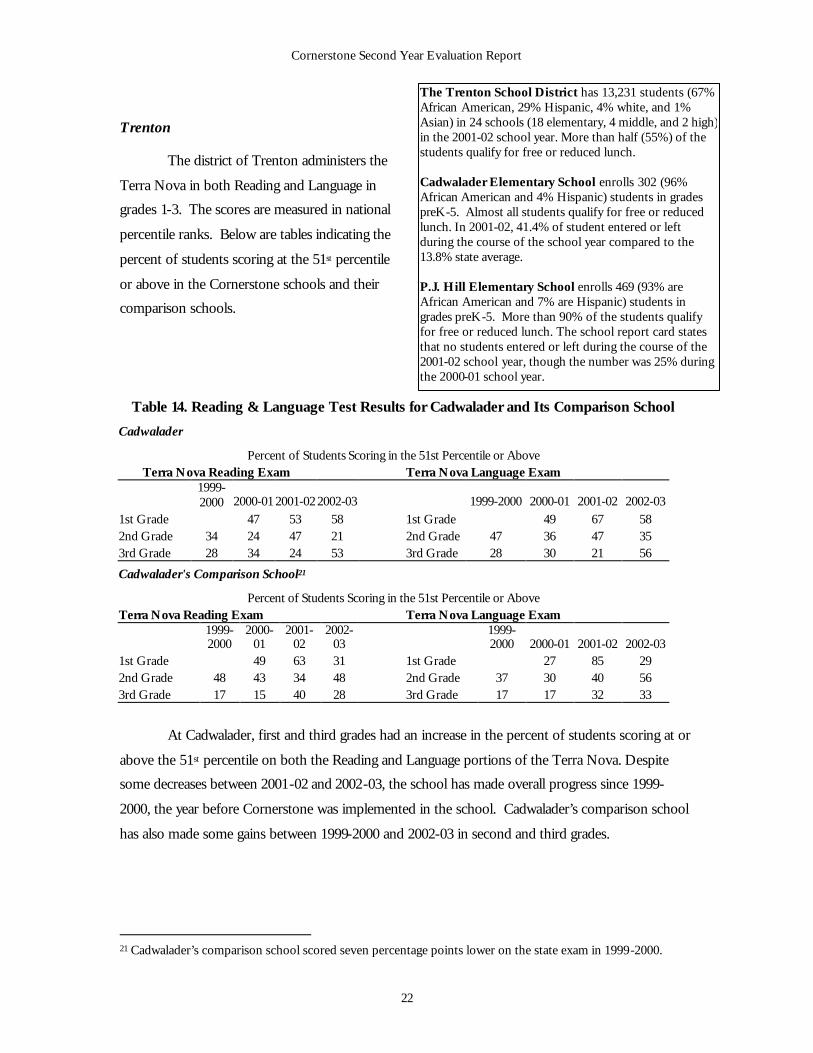
Table 14. Reading & Language Test Results for Cadwalader and Its Comparison School
Cadwalader
Percent of Students Scoring in the 51st Percentile or Above Terra Nova Reading Exam Terra Nova Language Exam
1999-2000 2000-01 2001-02 2002-03 1999-2000 2000-01 2001-02 2002-03
1st Grade 47 53 58 1st Grade 49 67 58 2nd Grade 34 24 47 21 2nd Grade 47 36 47 35 3rd Grade 28 34 24 53 3rd Grade 28 30 21 56
Cadwalader's Comparison School21 Percent of Students Scoring in the 51st Percentile or Above
Terra Nova Reading Exam Terra Nova Language Exam
1999-2000
2000-01
2001-02
2002-03
1999-2000 2000-01 2001-02 2002-03
1st Grade 49 63 31 1st Grade 27 85 29 2nd Grade 48 43 34 48 2nd Grade 37 30 40 56 3rd Grade 17 15 40 28 3rd Grade 17 17 32 33
At Cadwalader, first and third grades had an increase in the percent of students scoring at or
above the 51st percentile on both the Reading and Language portions of the Terra Nova. Despite
some decreases between 2001-02 and 2002-03, the school has made overall progress since 1999-
2000, the year before Cornerstone was implemented in the school. Cadwalader’s comparison school
has also made some gains between 1999-2000 and 2002-03 in second and third grades.
21 Cadwalader’s comparison school scored seven percentage points lower on the state exam in 1999-2000.
The Trenton School District has 13,231 students (67% African American, 29% Hispanic, 4% white, and 1% Asian) in 24 schools (18 elementary, 4 middle, and 2 high) in the 2001-02 school year. More than half (55%) of the students qualify for free or reduced lunch. Cadwalader Elementary School enrolls 302 (96% African American and 4% Hispanic) students in grades preK-5. Almost all students qualify for free or reduced lunch. In 2001-02, 41.4% of student entered or left during the course of the school year compared to the 13.8% state average. P.J. Hill Elementary School enrolls 469 (93% are African American and 7% are Hispanic) students in grades preK-5. More than 90% of the students qualify for free or reduced lunch. The school report card states that no students entered or left during the course of the 2001-02 school year, though the number was 25% during the 2000-01 school year.
Cornerstone Second Year Evaluation Report
23
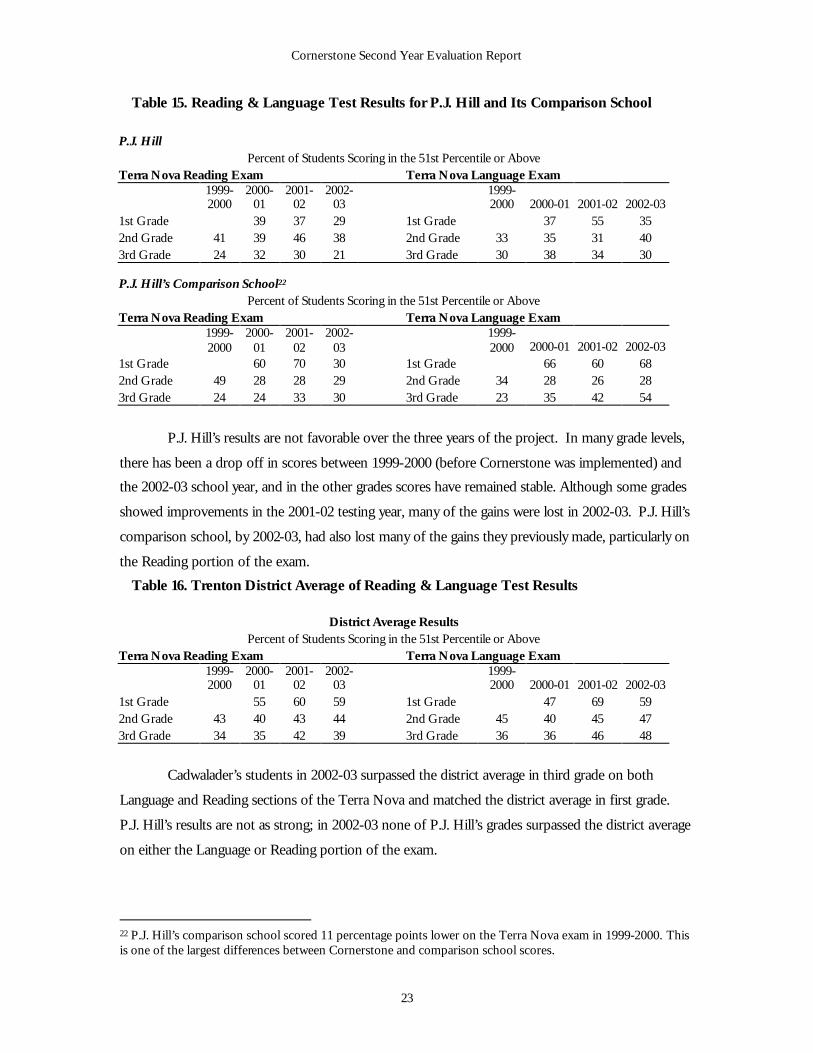
Table 15. Reading & Language Test Results for P.J. Hill and Its Comparison School
P.J. Hill Percent of Students Scoring in the 51st Percentile or Above
Terra Nova Reading Exam Terra Nova Language Exam
1999-2000
2000-01
2001-02
2002-03
1999-2000 2000-01 2001-02 2002-03
1st Grade 39 37 29 1st Grade 37 55 35 2nd Grade 41 39 46 38 2nd Grade 33 35 31 40 3rd Grade 24 32 30 21 3rd Grade 30 38 34 30 P.J. Hill’s Comparison School22
Percent of Students Scoring in the 51st Percentile or Above Terra Nova Reading Exam Terra Nova Language Exam
1999-2000
2000-01
2001-02
2002-03
1999-2000 2000-01 2001-02 2002-03
1st Grade 60 70 30 1st Grade 66 60 68 2nd Grade 49 28 28 29 2nd Grade 34 28 26 28 3rd Grade 24 24 33 30 3rd Grade 23 35 42 54
P.J. Hill’s results are not favorable over the three years of the project. In many grade levels,
there has been a drop off in scores between 1999-2000 (before Cornerstone was implemented) and
the 2002-03 school year, and in the other grades scores have remained stable. Although some grades
showed improvements in the 2001-02 testing year, many of the gains were lost in 2002-03. P.J. Hill’s
comparison school, by 2002-03, had also lost many of the gains they previously made, particularly on
the Reading portion of the exam.
Table 16. Trenton District Average of Reading & Language Test Results
District Average Results Percent of Students Scoring in the 51st Percentile or Above
Terra Nova Reading Exam Terra Nova Language Exam
1999-2000
2000-01
2001-02
2002-03
1999-2000 2000-01 2001-02 2002-03
1st Grade 55 60 59 1st Grade 47 69 59 2nd Grade 43 40 43 44 2nd Grade 45 40 45 47 3rd Grade 34 35 42 39 3rd Grade 36 36 46 48
Cadwalader’s students in 2002-03 surpassed the district average in third grade on both
Language and Reading sections of the Terra Nova and matched the district average in first grade.
P.J. Hill’s results are not as strong; in 2002-03 none of P.J. Hill’s grades surpassed the district average
on either the Language or Reading portion of the exam.
22 P.J. Hill’s comparison school scored 11 percentage points lower on the Terra Nova exam in 1999-2000. This is one of the largest differences between Cornerstone and comparison school scores.
Cornerstone Second Year Evaluation Report
24
Trenton Value-added Analysis
The Trenton value-added analysis analyzes Terra Nova test score gains between the 2000-01
school year (when Cornerstone implementation began) and 2002-03 (the most recent scores
available) on both the Language and Reading portion of the exam. The chart below shows the tested
grades in each year that were included in the analysis. The grades in which Cornerstone was
implemented are indicated in bold type. In these grades, students who attended one of the two
Cornerstone schools were coded as receiving one year of Cornerstone treatment.
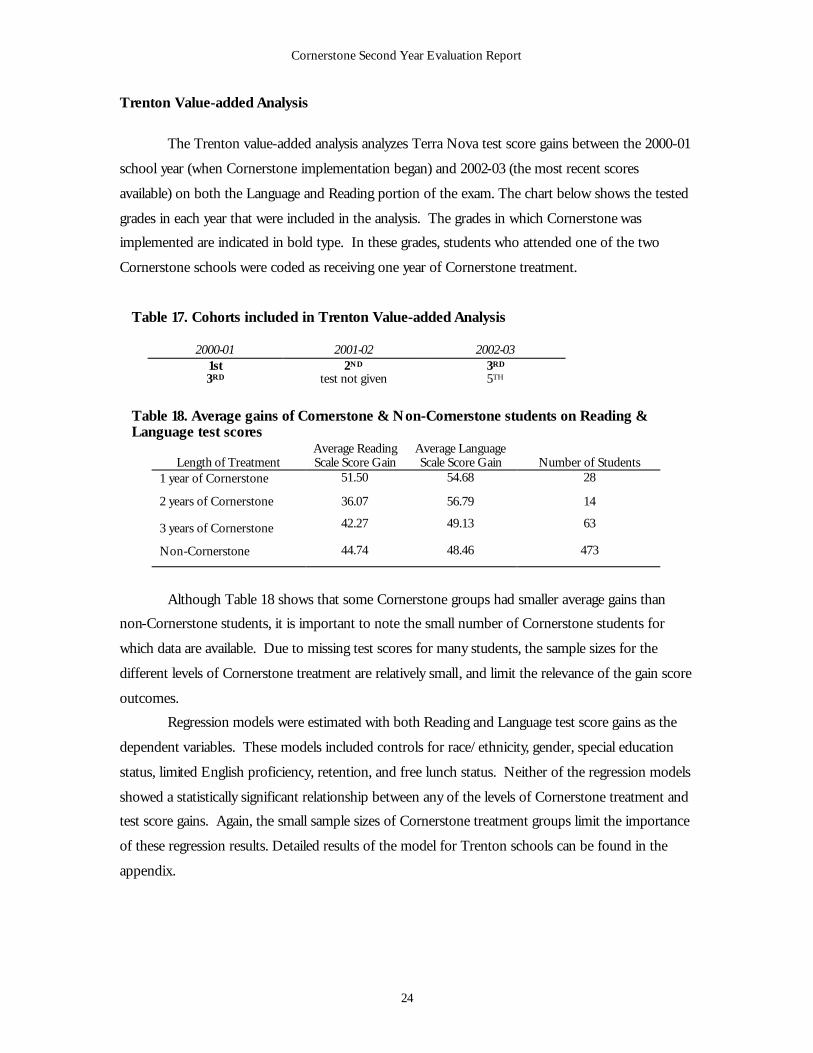
Table 17. Cohorts included in Trenton Value-added Analysis
Table 18. Average gains of Cornerstone & Non-Cornerstone students on Reading & Language test scores
Length of Treatment Average Reading Scale Score Gain
Average Language Scale Score Gain Number of Students
1 year of Cornerstone 51.50 54.68 28
2 years of Cornerstone 36.07 56.79 14
3 years of Cornerstone 42.27 49.13 63
Non-Cornerstone 44.74 48.46 473
Although Table 18 shows that some Cornerstone groups had smaller average gains than
non-Cornerstone students, it is important to note the small number of Cornerstone students for
which data are available. Due to missing test scores for many students, the sample sizes for the
different levels of Cornerstone treatment are relatively small, and limit the relevance of the gain score
outcomes.
Regression models were estimated with both Reading and Language test score gains as the
dependent variables. These models included controls for race/ethnicity, gender, special education
status, limited English proficiency, retention, and free lunch status. Neither of the regression models
showed a statistically significant relationship between any of the levels of Cornerstone treatment and
test score gains. Again, the small sample sizes of Cornerstone treatment groups limit the importance
of these regression results. Detailed results of the model for Trenton schools can be found in the
appendix.
2000-01 2001-02 2002-03 1st 2ND 3RD 3RD test not given 5TH
Cornerstone Second Year Evaluation Report
25
Cornerstone DRA Results for Trenton
The table below shows the results for each school on the DRA administered by the
coaches across the two years for which data are available.
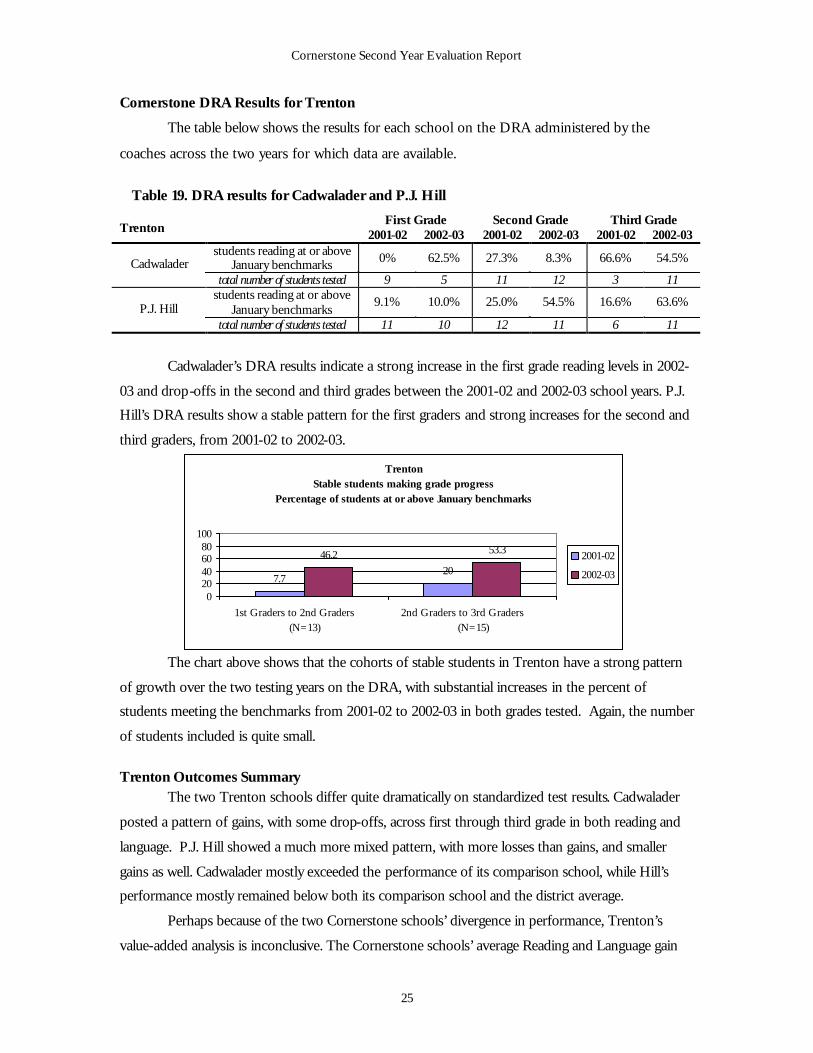
Table 19. DRA results for Cadwalader and P.J. Hill
First Grade Second Grade Third Grade Trenton 2001-02 2002-03 2001-02 2002-03 2001-02 2002-03
students reading at or above January benchmarks 0% 62.5% 27.3% 8.3% 66.6% 54.5% Cadwalader
total number of students tested 9 5 11 12 3 11 students reading at or above
January benchmarks 9.1% 10.0% 25.0% 54.5% 16.6% 63.6% P.J. Hill
total number of students tested 11 10 12 11 6 11
Cadwalader’s DRA results indicate a strong increase in the first grade reading levels in 2002-
03 and drop-offs in the second and third grades between the 2001-02 and 2002-03 school years. P.J.
Hill’s DRA results show a stable pattern for the first graders and strong increases for the second and
third graders, from 2001-02 to 2002-03.
The chart above shows that the cohorts of stable students in Trenton have a strong pattern
of growth over the two testing years on the DRA, with substantial increases in the percent of
students meeting the benchmarks from 2001-02 to 2002-03 in both grades tested. Again, the number
of students included is quite small.
Trenton Outcomes Summary The two Trenton schools differ quite dramatically on standardized test results. Cadwalader
posted a pattern of gains, with some drop-offs, across first through third grade in both reading and
language. P.J. Hill showed a much more mixed pattern, with more losses than gains, and smaller
gains as well. Cadwalader mostly exceeded the performance of its comparison school, while Hill’s
performance mostly remained below both its comparison school and the district average.
Perhaps because of the two Cornerstone schools’ divergence in performance, Trenton’s
value-added analysis is inconclusive. The Cornerstone schools’ average Reading and Language gain
TrentonStable students making grade progress
Percentage of students at or above January benchmarks
7.720
46.2 53.3
020406080
100
1st Graders to 2nd Graders (N=13)
2nd Graders to 3rd Graders (N=15)
2001-02
2002-03
Cornerstone Second Year Evaluation Report
26
score was not much different than the district’s non-Cornerstone students achieved, and the
regression analysis could not establish any significance for Cornerstone treatment. But the sample
sizes were quite small for the Cornerstone schools across the three year period, likely due to a
combination of missing data and student mobility.
Trenton Cornerstone schools’ DRA results are also confounding. Cadwalader’s big year-to-
year gain in first grade is followed by year-to-year losses in second and third grade. P.J. Hill’s results
reverse that pattern. Yet Cornerstone stable students, both second and third grade students, make
good progress over their previous years’ results. Again, caution should be used when interpreting
these results because of the small sample size.
Overall, Trenton Cornerstone’s schools’ results are mixed and unclear. Cadwalader seems to
be making progress in standardized test results, but not in the DRA, while P.J. Hill seems to be
making some progress in their DRA results.
Phase II
Bridgeport, CT
The district of Bridgeport
administers the DRA to students in grades
K-3 three times a year. Both Maplewood
Annex and Luis Muñoz Marín have very
high student mobility,23 and for this reason
the DRA results are presented for students
who remained stable in their Cornerstone
schools for both 2001-02 and 2002-03.
These DRA results indicate the spring
testing administration results and the spring
Bridgeport benchmarks. The administration
and scoring of the DRA is different in
Bridgeport than the administration of the
DRA by coaches in most other Cornerstone districts. For each grade, except the third grade, the
Bridgeport benchmarks are lower than those recommended by the DRA (and used by us for the
presentation of the DRA data in this report). The benchmarks also changed over the two years of
data here, with cutoffs becoming higher in 2002-03. Also, teachers only included a student’s reading
level if the student achieved a 95% accuracy level on the book they were tested with. For the
23 On the 2001-02 school report card, Marín was reported to have 59% of same students who attended the school the previous year and at Maplewood the percent is 69%.
The Bridgeport Public School District enrolls 22,796 students (43% African American, 43% Hispanic, 11% white, and 3% Asian) in 35 schools (19 elementary & 10 K-8) in the 2001-02 school year. Sixty-seven percent of the students qualify for free or reduced lunch and 39% are classified as English language learners. Twenty-seven percent of the students didn’t attend their current school the previous year. Maplewood Annex Elementary School enrolls 240 students in grades preK-3. Forty-eight percent of the students are African American, 39% Hispanic, 10% white, and 4% Asian. Ninety-two percent of the students qualify for free or reduced lunch and 40% are classified as English language learners. Thirty-one percent of the students didn’t attend this school the previous year. Maplewood is designated as an “overflow” school. Luis Muñoz Marín Elementary School enrolls 1,040 students in grades preK-8 (250 in grades K-3). Seventy-six percent of the students are Hispanic, 20% African American, 2% Asian, 1% white, and 1% American Indian. Sixty-nine percent of the students qualify for free or reduced lunch and 68% are classified as English language learners . Forty-one percent of the students didn’t attend this school the previous year.
Cornerstone Second Year Evaluation Report
27
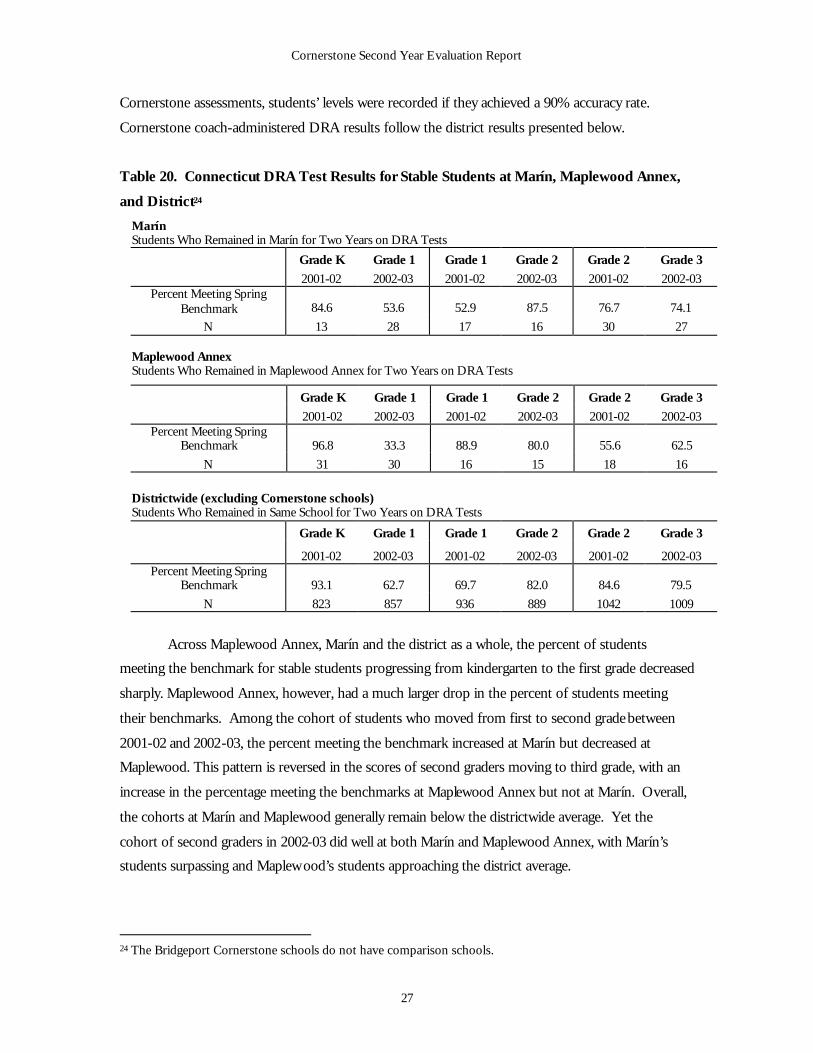
Cornerstone assessments, students’ levels were recorded if they achieved a 90% accuracy rate.
Cornerstone coach-administered DRA results follow the district results presented below.
Table 20. Connecticut DRA Test Results for Stable Students at Marín, Maplewood Annex,
and District24
Marín Students Who Remained in Marín for Two Years on DRA Tests
Grade K Grade 1 Grade 1 Grade 2 Grade 2 Grade 3
2001-02 2002-03 2001-02 2002-03 2001-02 2002-03 Percent Meeting Spring
Benchmark 84.6 53.6 52.9 87.5 76.7 74.1
N 13 28 17 16 30 27 Maplewood Annex Students Who Remained in Maplewood Annex for Two Years on DRA Tests
Grade K Grade 1 Grade 1 Grade 2 Grade 2 Grade 3
2001-02 2002-03 2001-02 2002-03 2001-02 2002-03 Percent Meeting Spring
Benchmark 96.8 33.3 88.9 80.0 55.6 62.5
N 31 30 16 15 18 16
Districtwide (excluding Cornerstone schools) Students Who Remained in Same School for Two Years on DRA Tests
Grade K Grade 1 Grade 1 Grade 2 Grade 2 Grade 3
2001-02 2002-03 2001-02 2002-03 2001-02 2002-03 Percent Meeting Spring
Benchmark 93.1 62.7 69.7 82.0 84.6 79.5
N 823 857 936 889 1042 1009
Across Maplewood Annex, Marín and the district as a whole, the percent of students
meeting the benchmark for stable students progressing from kindergarten to the first grade decreased
sharply. Maplewood Annex, however, had a much larger drop in the percent of students meeting
their benchmarks. Among the cohort of students who moved from first to second grade between
2001-02 and 2002-03, the percent meeting the benchmark increased at Marín but decreased at
Maplewood. This pattern is reversed in the scores of second graders moving to third grade, with an
increase in the percentage meeting the benchmarks at Maplewood Annex but not at Marín. Overall,
the cohorts at Marín and Maplewood generally remain below the districtwide average. Yet the
cohort of second graders in 2002-03 did well at both Marín and Maplewood Annex, with Marín’s
students surpassing and Maplewood’s students approaching the district average.
24 The Bridgeport Cornerstone schools do not have comparison schools.
Cornerstone Second Year Evaluation Report
28
Cornerstone DRA Results for Bridgeport
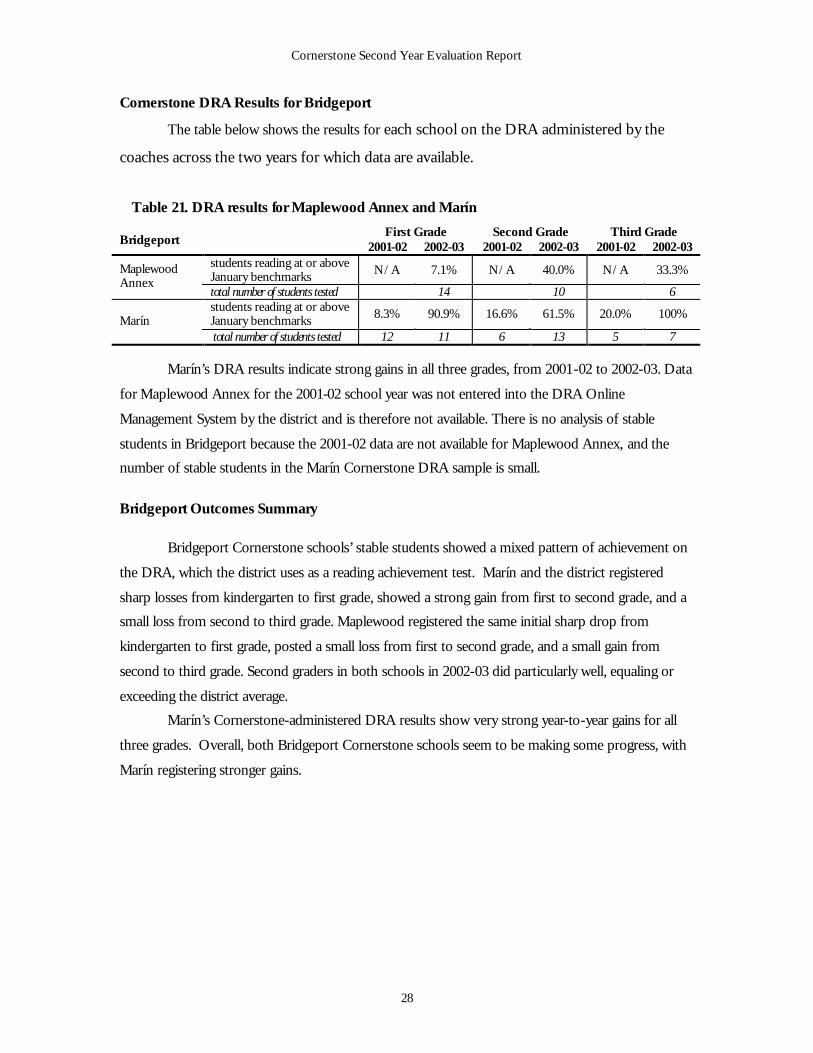
The table below shows the results for each school on the DRA administered by the
coaches across the two years for which data are available.
Table 21. DRA results for Maplewood Annex and Marín
First Grade Second Grade Third Grade Bridgeport 2001-02 2002-03 2001-02 2002-03 2001-02 2002-03
students reading at or above January benchmarks N/A 7.1% N/A 40.0% N/A 33.3% Maplewood
Annex total number of students tested 14 10 6 students reading at or above January benchmarks 8.3% 90.9% 16.6% 61.5% 20.0% 100% Marín total number of students tested 12 11 6 13 5 7
Marín’s DRA results indicate strong gains in all three grades, from 2001-02 to 2002-03. Data
for Maplewood Annex for the 2001-02 school year was not entered into the DRA Online
Management System by the district and is therefore not available. There is no analysis of stable
students in Bridgeport because the 2001-02 data are not available for Maplewood Annex, and the
number of stable students in the Marín Cornerstone DRA sample is small.
Bridgeport Outcomes Summary
Bridgeport Cornerstone schools’ stable students showed a mixed pattern of achievement on
the DRA, which the district uses as a reading achievement test. Marín and the district registered
sharp losses from kindergarten to first grade, showed a strong gain from first to second grade, and a
small loss from second to third grade. Maplewood registered the same initial sharp drop from
kindergarten to first grade, posted a small loss from first to second grade, and a small gain from
second to third grade. Second graders in both schools in 2002-03 did particularly well, equaling or
exceeding the district average.
Marín’s Cornerstone-administered DRA results show very strong year-to-year gains for all
three grades. Overall, both Bridgeport Cornerstone schools seem to be making some progress, with
Marín registering stronger gains.
Cornerstone Second Year Evaluation Report
29
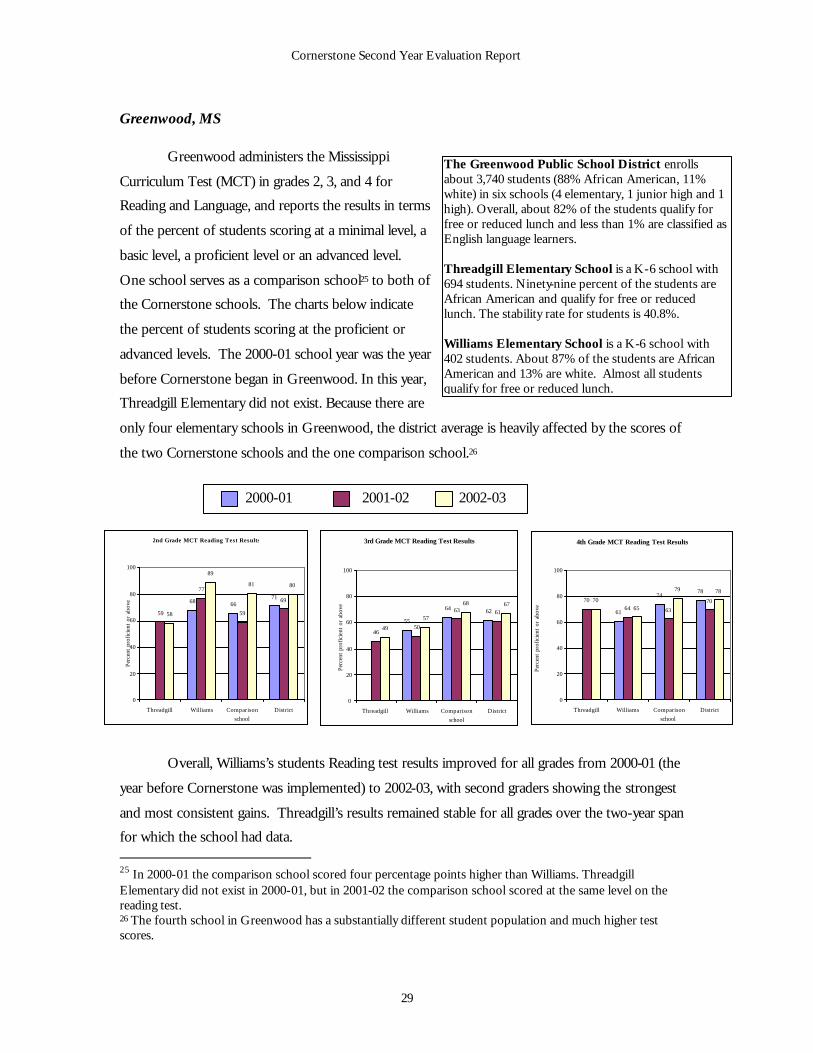
Greenwood, MS
Greenwood administers the Mississippi
Curriculum Test (MCT) in grades 2, 3, and 4 for
Reading and Language, and reports the results in terms
of the percent of students scoring at a minimal level, a
basic level, a proficient level or an advanced level.
One school serves as a comparison school25 to both of
the Cornerstone schools. The charts below indicate
the percent of students scoring at the proficient or
advanced levels. The 2000-01 school year was the year
before Cornerstone began in Greenwood. In this year,
Threadgill Elementary did not exist. Because there are
only four elementary schools in Greenwood, the district average is heavily affected by the scores of
the two Cornerstone schools and the one comparison school.26
Overall, Williams’s students Reading test results improved for all grades from 2000-01 (the
year before Cornerstone was implemented) to 2002-03, with second graders showing the strongest
and most consistent gains. Threadgill’s results remained stable for all grades over the two-year span
for which the school had data. 25 In 2000-01 the comparison school scored four percentage points higher than Williams. Threadgill Elementary did not exist in 2000-01, but in 2001-02 the comparison school scored at the same level on the reading test. 26 The fourth school in Greenwood has a substantially different student population and much higher test scores.
The Greenwood Public School District enrolls about 3,740 students (88% African American, 11% white) in six schools (4 elementary, 1 junior high and 1 high). Overall, about 82% of the students qualify for free or reduced lunch and less than 1% are classified as English language learners. Threadgill Elementary School is a K-6 school with 694 students. Ninety-nine percent of the students are African American and qualify for free or reduced lunch. The stability rate for students is 40.8%. Williams Elementary School is a K-6 school with 402 students. About 87% of the students are African American and 13% are white. Almost all students qualify for free or reduced lunch.
2000-01 2001-02 2002-03
2nd Grade MCT Reading Test Results
68 6671
59
77
59
69
58
89
81 80
0
20
40
60
80
100
Threadgill Williams Comparison
school
District
Per
cent
pro
fici
ent
or a
bove
3rd Grade MCT Reading Test Results
55
64 62
4650
63 61
49
57
68 67
0
20
40
60
80
100
Threadgill Williams Comparison
school
District
Per
cent
pro
fici
ent
or a
bove
4th Grade MCT Reading Test Results
61
7478
7064 63
707065
79 78
0
20
40
60
80
100
Threadgill Williams Comparison
school
District
Per
cent
pro
fici
ent
or a
bove
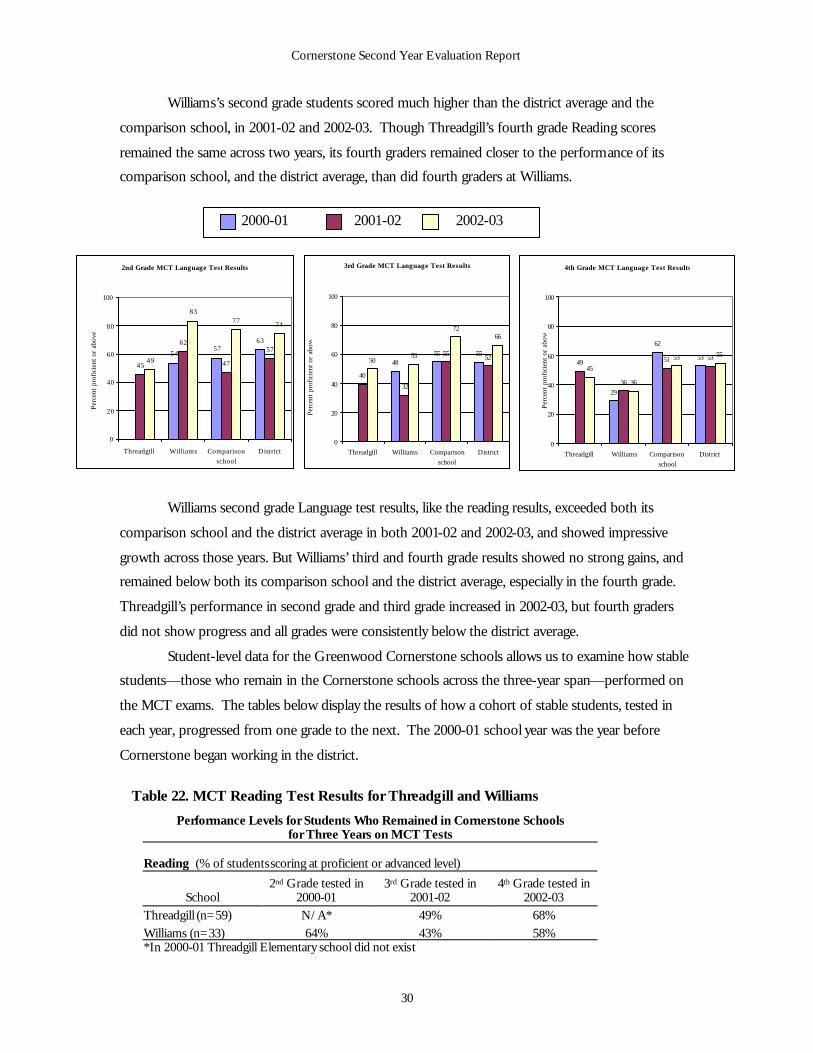
Cornerstone Second Year Evaluation Report
30
4th Grade MCT Language Test Results
29
62
5349
36
51 53
45
36
53 55
0
20
40
60
80
100
Threadgill Williams Comparison
school
District
Per
cent
pro
fici
ent
or a
bove
Williams’s second grade students scored much higher than the district average and the
comparison school, in 2001-02 and 2002-03. Though Threadgill’s fourth grade Reading scores
remained the same across two years, its fourth graders remained closer to the performance of its
comparison school, and the district average, than did fourth graders at Williams.
Williams second grade Language test results, like the reading results, exceeded both its
comparison school and the district average in both 2001-02 and 2002-03, and showed impressive
growth across those years. But Williams’ third and fourth grade results showed no strong gains, and
remained below both its comparison school and the district average, especially in the fourth grade.
Threadgill’s performance in second grade and third grade increased in 2002-03, but fourth graders
did not show progress and all grades were consistently below the district average.
Student-level data for the Greenwood Cornerstone schools allows us to examine how stable
students—those who remain in the Cornerstone schools across the three-year span—performed on
the MCT exams. The tables below display the results of how a cohort of stable students, tested in
each year, progressed from one grade to the next. The 2000-01 school year was the year before
Cornerstone began working in the district.
Table 22. MCT Reading Test Results for Threadgill and Williams
Performance Levels for Students Who Remained in Cornerstone Schools for Three Years on MCT Tests
Reading (% of students scoring at proficient or advanced level)
School 2nd Grade tested in
2000-01 3rd Grade tested in
2001-02 4th Grade tested in
2002-03 Threadgill (n=59) N/A* 49% 68% Williams (n=33) 64% 43% 58%
*In 2000-01 Threadgill Elementary school did not exist
2000-01 2001-02 2002-03
3rd Grade MCT Language Test Results
4855 55
40
32
555250
53
7266
0
20
40
60
80
100
Threadgill Williams Comparison
school
District
Per
cent
pro
fici
ent
or a
bove
2nd Grade MCT Language Test Results
5457
63
45
62
47
57
49
8377
74
0
20
40
60
80
100
Threadgill Wil l iams Comparison
school
District
Per
cent
pro
fici
ent
or a
bove
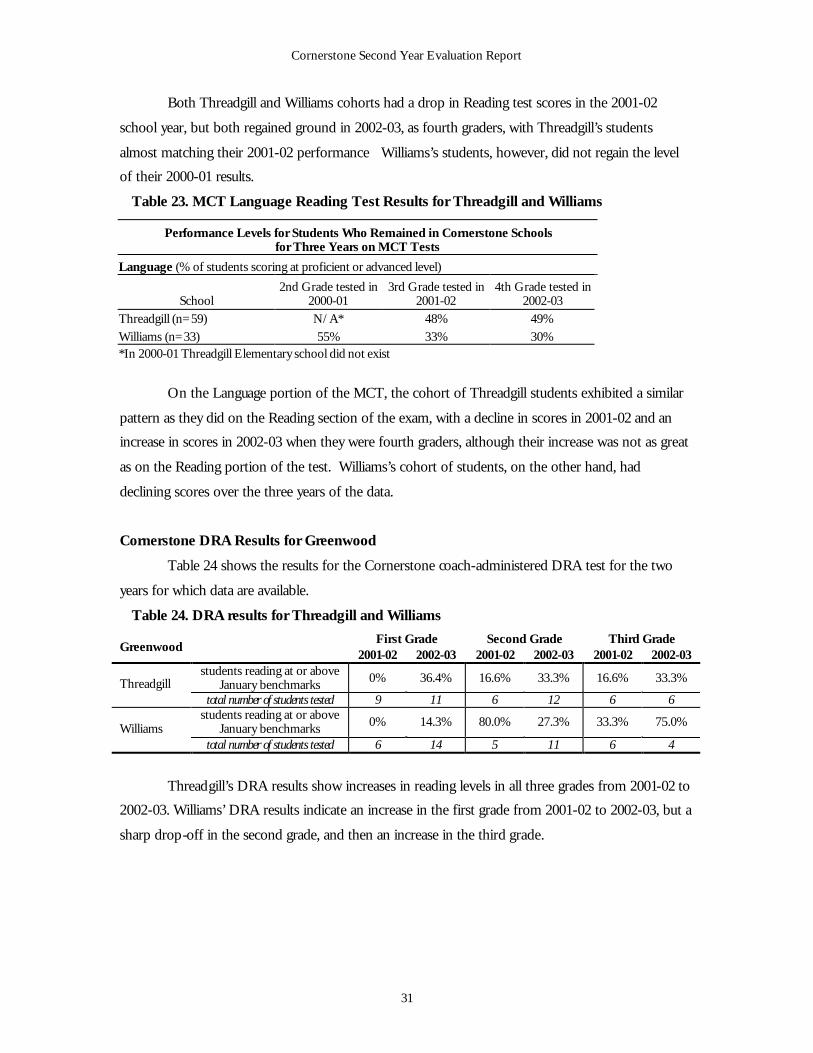
Cornerstone Second Year Evaluation Report
31
Both Threadgill and Williams cohorts had a drop in Reading test scores in the 2001-02
school year, but both regained ground in 2002-03, as fourth graders, with Threadgill’s students
almost matching their 2001-02 performance Williams’s students, however, did not regain the level
of their 2000-01 results.
Table 23. MCT Language Reading Test Results for Threadgill and Williams
Performance Levels for Students Who Remained in Cornerstone Schools for Three Years on MCT Tests
Language (% of students scoring at proficient or advanced level)
School 2nd Grade tested in
2000-01 3rd Grade tested in
2001-02 4th Grade tested in
2002-03 Threadgill (n=59) N/A* 48% 49% Williams (n=33) 55% 33% 30% *In 2000-01 Threadgill Elementary school did not exist
On the Language portion of the MCT, the cohort of Threadgill students exhibited a similar
pattern as they did on the Reading section of the exam, with a decline in scores in 2001-02 and an
increase in scores in 2002-03 when they were fourth graders, although their increase was not as great
as on the Reading portion of the test. Williams’s cohort of students, on the other hand, had
declining scores over the three years of the data.
Cornerstone DRA Results for Greenwood
Table 24 shows the results for the Cornerstone coach-administered DRA test for the two
years for which data are available.
Table 24. DRA results for Threadgill and Williams
First Grade Second Grade Third Grade Greenwood
2001-02 2002-03 2001-02 2002-03 2001-02 2002-03 students reading at or above
January benchmarks 0% 36.4% 16.6% 33.3% 16.6% 33.3% Threadgill total number of students tested 9 11 6 12 6 6
students reading at or above January benchmarks 0% 14.3% 80.0% 27.3% 33.3% 75.0% Williams
total number of students tested 6 14 5 11 6 4
Threadgill’s DRA results show increases in reading levels in all three grades from 2001-02 to
2002-03. Williams’ DRA results indicate an increase in the first grade from 2001-02 to 2002-03, but a
sharp drop-off in the second grade, and then an increase in the third grade.
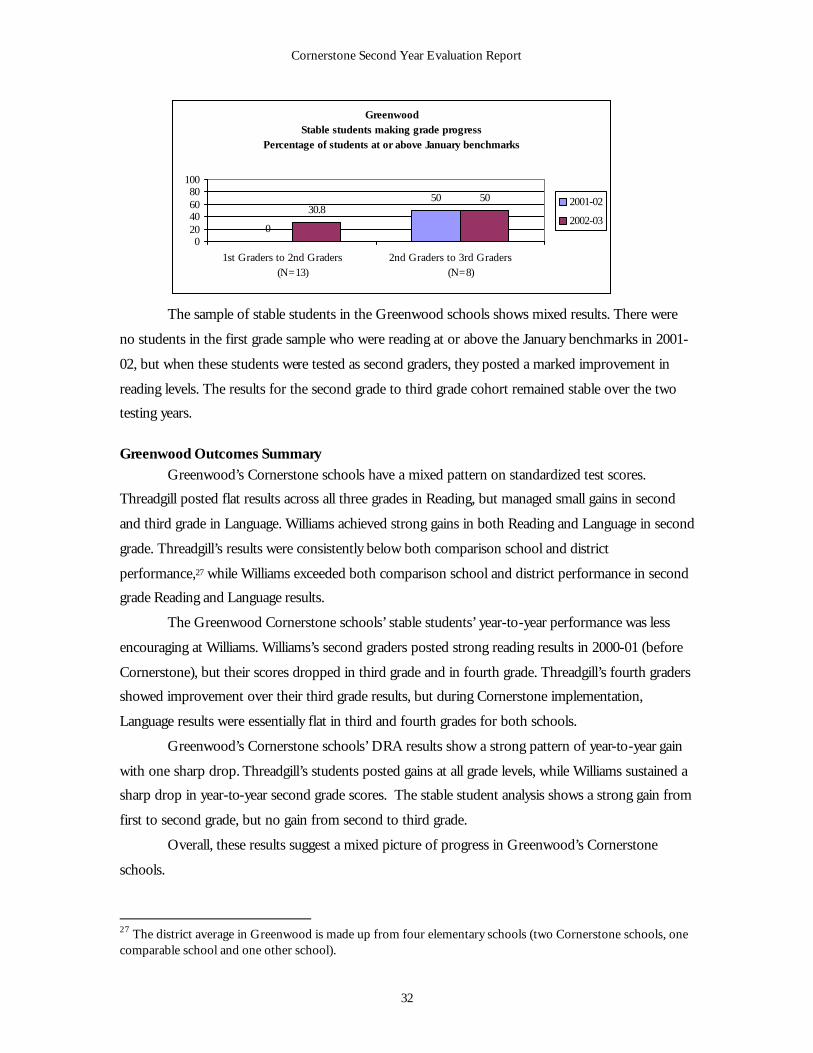
Cornerstone Second Year Evaluation Report
32
GreenwoodStable students making grade progress
Percentage of students at or above January benchmarks
0
5030.8
50
020406080
100
1st Graders to 2nd Graders (N=13)
2nd Graders to 3rd Graders (N=8)
2001-02
2002-03
The sample of stable students in the Greenwood schools shows mixed results. There were
no students in the first grade sample who were reading at or above the January benchmarks in 2001-
02, but when these students were tested as second graders, they posted a marked improvement in
reading levels. The results for the second grade to third grade cohort remained stable over the two
testing years.
Greenwood Outcomes Summary Greenwood’s Cornerstone schools have a mixed pattern on standardized test scores.
Threadgill posted flat results across all three grades in Reading, but managed small gains in second
and third grade in Language. Williams achieved strong gains in both Reading and Language in second
grade. Threadgill’s results were consistently below both comparison school and district
performance,27 while Williams exceeded both comparison school and district performance in second
grade Reading and Language results.
The Greenwood Cornerstone schools’ stable students’ year-to-year performance was less
encouraging at Williams. Williams’s second graders posted strong reading results in 2000-01 (before
Cornerstone), but their scores dropped in third grade and in fourth grade. Threadgill’s fourth graders
showed improvement over their third grade results, but during Cornerstone implementation,
Language results were essentially flat in third and fourth grades for both schools.
Greenwood’s Cornerstone schools’ DRA results show a strong pattern of year-to-year gain
with one sharp drop. Threadgill’s students posted gains at all grade levels, while Williams sustained a
sharp drop in year-to-year second grade scores. The stable student analysis shows a strong gain from
first to second grade, but no gain from second to third grade.
Overall, these results suggest a mixed picture of progress in Greenwood’s Cornerstone
schools.
27 The district average in Greenwood is made up from four elementary schools (two Cornerstone schools, one comparable school and one other school).
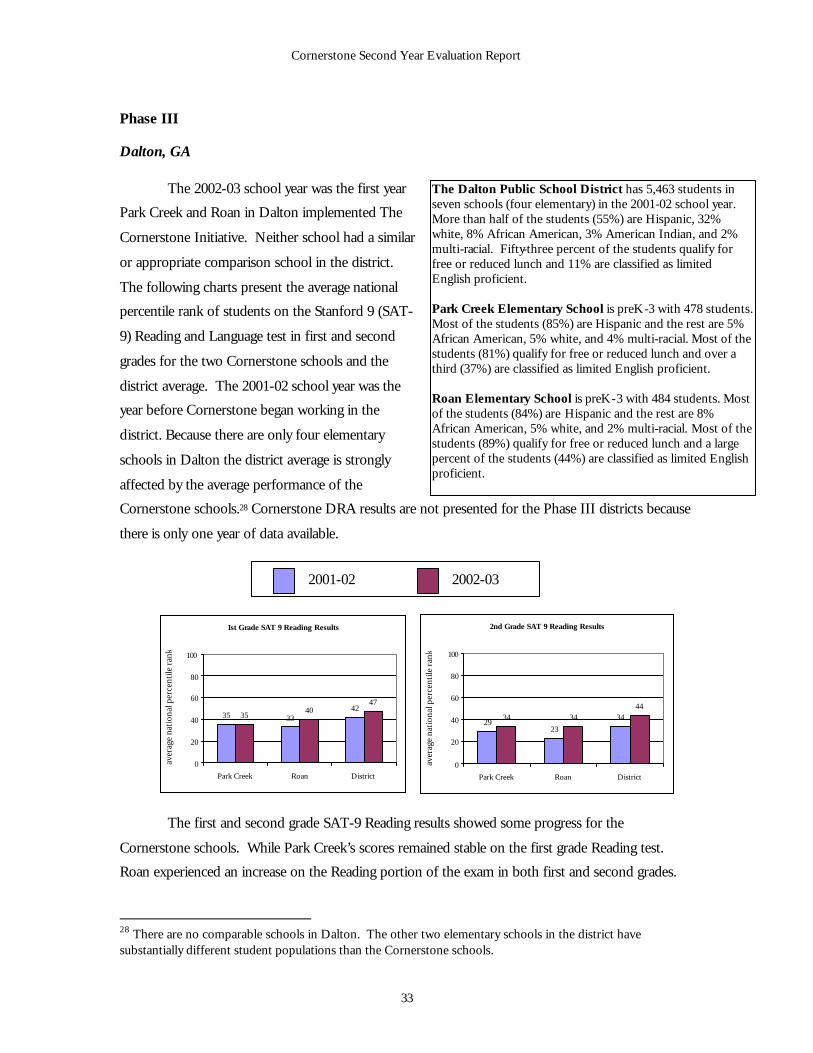
Cornerstone Second Year Evaluation Report
33
Phase III
Dalton, GA
The 2002-03 school year was the first year
Park Creek and Roan in Dalton implemented The
Cornerstone Initiative. Neither school had a similar
or appropriate comparison school in the district.
The following charts present the average national
percentile rank of students on the Stanford 9 (SAT-
9) Reading and Language test in first and second
grades for the two Cornerstone schools and the
district average. The 2001-02 school year was the
year before Cornerstone began working in the
district. Because there are only four elementary
schools in Dalton the district average is strongly
affected by the average performance of the
Cornerstone schools.28 Cornerstone DRA results are not presented for the Phase III districts because
there is only one year of data available.
The first and second grade SAT-9 Reading results showed some progress for the
Cornerstone schools. While Park Creek’s scores remained stable on the first grade Reading test.
Roan experienced an increase on the Reading portion of the exam in both first and second grades.
28 There are no comparable schools in Dalton. The other two elementary schools in the district have substantially different student populations than the Cornerstone schools.
The Dalton Public School District has 5,463 students in seven schools (four elementary) in the 2001-02 school year. More than half of the students (55%) are Hispanic, 32% white, 8% African American, 3% American Indian, and 2% multi-racial. Fifty-three percent of the students qualify for free or reduced lunch and 11% are classified as limited English proficient. Park Creek Elementary School is preK-3 with 478 students. Most of the students (85%) are Hispanic and the rest are 5% African American, 5% white, and 4% multi-racial. Most of the students (81%) qualify for free or reduced lunch and over a third (37%) are classified as limited English proficient. Roan Elementary School is preK-3 with 484 students. Most of the students (84%) are Hispanic and the rest are 8% African American, 5% white, and 2% multi-racial. Most of the students (89%) qualify for free or reduced lunch and a large percent of the students (44%) are classified as limited English proficient.
2001-02 2002-03
2nd Grade SAT 9 Reading Results
2923
3434 3444
0
20
40
60
80
100
Park Creek Roan District
aver
age
nati
onal
per
cent
ile r
ank
1st Grade SAT 9 Reading Results
35 3342
3540
47
0
20
40
60
80
100
Park Creek Roan District
aver
age
nati
onal
per
cent
ile r
ank
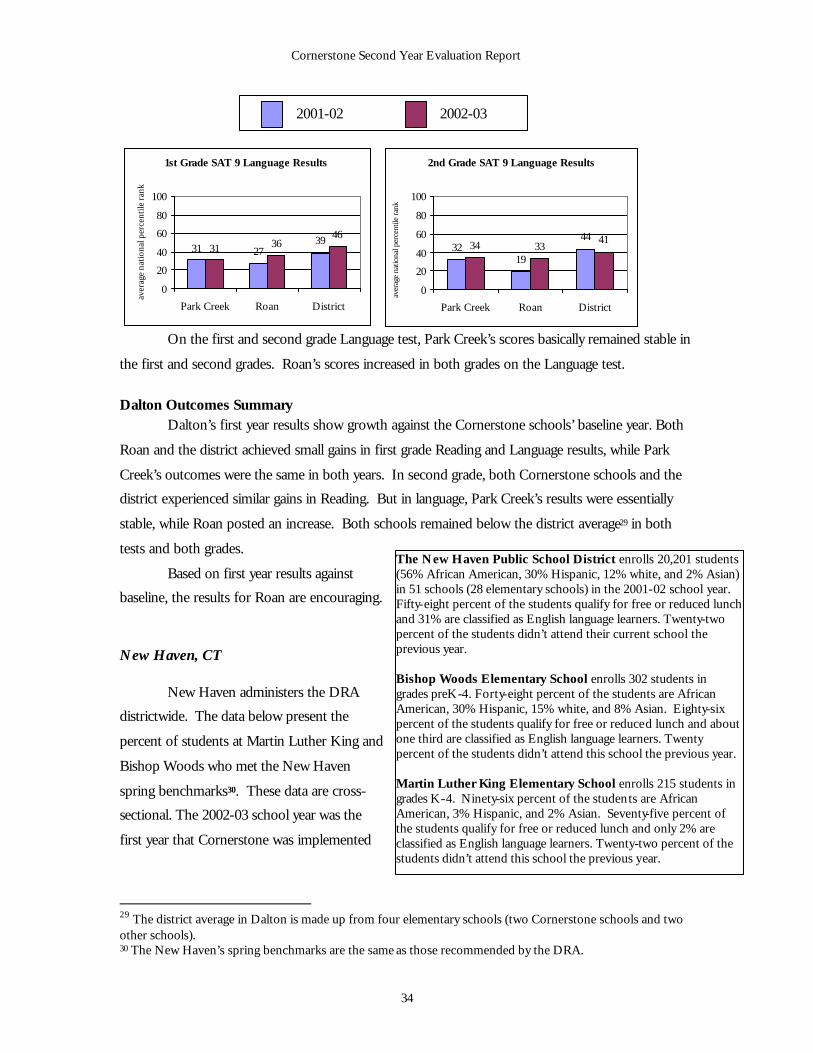
Cornerstone Second Year Evaluation Report
34
On the first and second grade Language test, Park Creek’s scores basically remained stable in
the first and second grades. Roan’s scores increased in both grades on the Language test.
Dalton Outcomes Summary Dalton’s first year results show growth against the Cornerstone schools’ baseline year. Both
Roan and the district achieved small gains in first grade Reading and Language results, while Park
Creek’s outcomes were the same in both years. In second grade, both Cornerstone schools and the
district experienced similar gains in Reading. But in language, Park Creek’s results were essentially
stable, while Roan posted an increase. Both schools remained below the district average29 in both
tests and both grades.
Based on first year results against
baseline, the results for Roan are encouraging.
New Haven, CT New Haven administers the DRA
districtwide. The data below present the
percent of students at Martin Luther King and
Bishop Woods who met the New Haven
spring benchmarks30. These data are cross-
sectional. The 2002-03 school year was the
first year that Cornerstone was implemented
29 The district average in Dalton is made up from four elementary schools (two Cornerstone schools and two other schools). 30 The New Haven’s spring benchmarks are the same as those recommended by the DRA.
2001-02 2002-03
The New Haven Public School District enrolls 20,201 students (56% African American, 30% Hispanic, 12% white, and 2% Asian) in 51 schools (28 elementary schools) in the 2001-02 school year. Fifty-eight percent of the students qualify for free or reduced lunch and 31% are classified as English language learners. Twenty-two percent of the students didn’t attend their current school the previous year. Bishop Woods Elementary School enrolls 302 students in grades preK-4. Forty-eight percent of the students are African American, 30% Hispanic, 15% white, and 8% Asian. Eighty-six percent of the students qualify for free or reduced lunch and about one third are classified as English language learners. Twenty percent of the students didn’t attend this school the previous year. Martin Luther King Elementary School enrolls 215 students in grades K-4. Ninety-six percent of the students are African American, 3% Hispanic, and 2% Asian. Seventy-five percent of the students qualify for free or reduced lunch and only 2% are classified as English language learners. Twenty-two percent of the students didn’t attend this school the previous year.
1st Grade SAT 9 Language Results
31 2739
31 3646
0
20
40
60
80
100
Park Creek Roan District
aver
age
nati
onal
per
cent
ile r
ank
2nd Grade SAT 9 Language Results
3219
4434 33
41
0
20
40
60
80
100
Park Creek Roan District
aver
age
natio
nal p
erce
ntile
ran
k
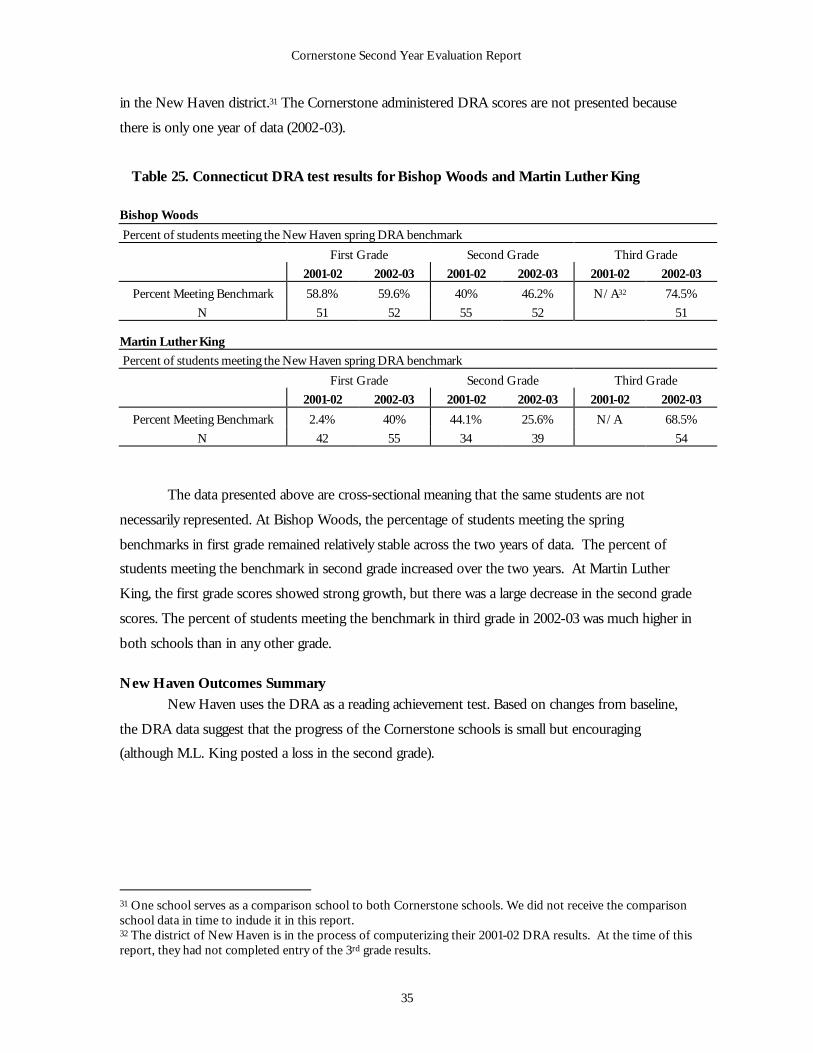
Cornerstone Second Year Evaluation Report
35
in the New Haven district.31 The Cornerstone administered DRA scores are not presented because
there is only one year of data (2002-03).
Table 25. Connecticut DRA test results for Bishop Woods and Martin Luther King
Bishop Woods
Percent of students meeting the New Haven spring DRA benchmark
First Grade Second Grade Third Grade
2001-02 2002-03 2001-02 2002-03 2001-02 2002-03
Percent Meeting Benchmark 58.8% 59.6% 40% 46.2% N/A32 74.5%
N 51 52 55 52 51 Martin Luther King
Percent of students meeting the New Haven spring DRA benchmark
First Grade Second Grade Third Grade
2001-02 2002-03 2001-02 2002-03 2001-02 2002-03
Percent Meeting Benchmark 2.4% 40% 44.1% 25.6% N/A 68.5%
N 42 55 34 39 54
The data presented above are cross-sectional meaning that the same students are not
necessarily represented. At Bishop Woods, the percentage of students meeting the spring
benchmarks in first grade remained relatively stable across the two years of data. The percent of
students meeting the benchmark in second grade increased over the two years. At Martin Luther
King, the first grade scores showed strong growth, but there was a large decrease in the second grade
scores. The percent of students meeting the benchmark in third grade in 2002-03 was much higher in
both schools than in any other grade.
New Haven Outcomes Summary New Haven uses the DRA as a reading achievement test. Based on changes from baseline,
the DRA data suggest that the progress of the Cornerstone schools is small but encouraging
(although M.L. King posted a loss in the second grade).
31 One school serves as a comparison school to both Cornerstone schools. We did not receive the comparison school data in time to include it in this report. 32 The district of New Haven is in the process of computerizing their 2001-02 DRA results. At the time of this report, they had not completed entry of the 3rd grade results.
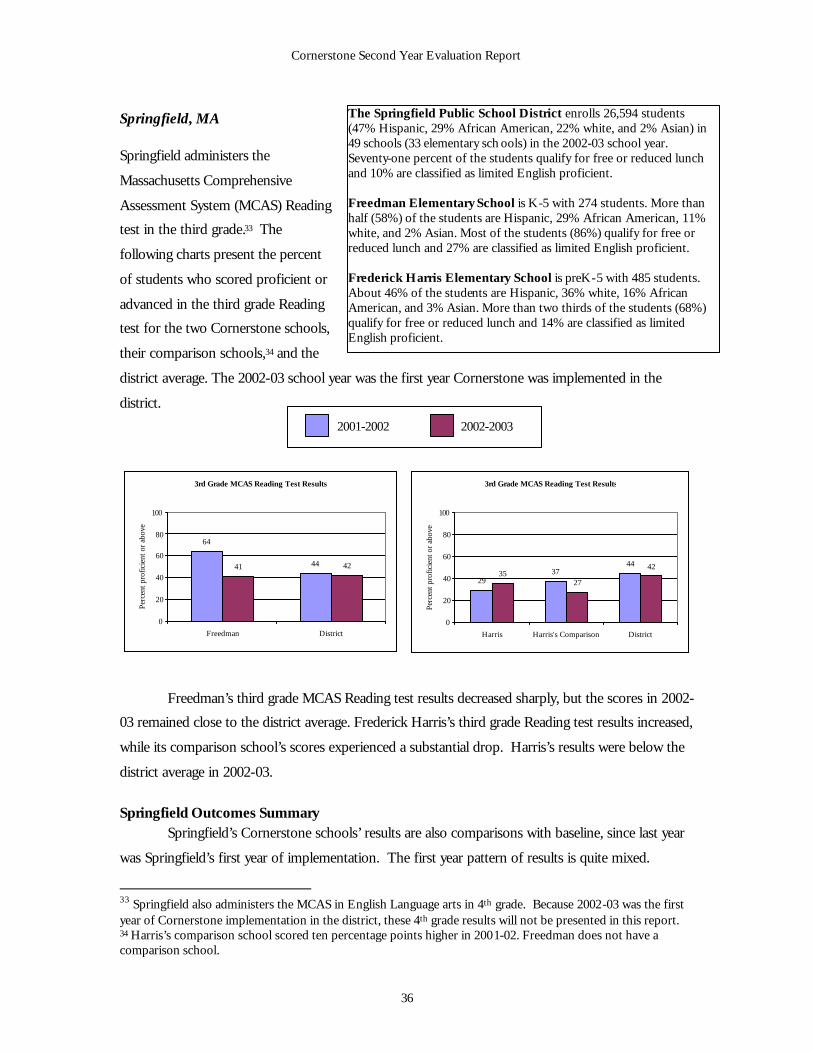
Cornerstone Second Year Evaluation Report
36
Springfield, MA Springfield administers the
Massachusetts Comprehensive
Assessment System (MCAS) Reading
test in the third grade.33 The
following charts present the percent
of students who scored proficient or
advanced in the third grade Reading
test for the two Cornerstone schools,
their comparison schools,34 and the
district average. The 2002-03 school year was the first year Cornerstone was implemented in the
district.
Freedman’s third grade MCAS Reading test results decreased sharply, but the scores in 2002-
03 remained close to the district average. Frederick Harris’s third grade Reading test results increased,
while its comparison school’s scores experienced a substantial drop. Harris’s results were below the
district average in 2002-03.
Springfield Outcomes Summary Springfield’s Cornerstone schools’ results are also comparisons with baseline, since last year
was Springfield’s first year of implementation. The first year pattern of results is quite mixed.
33 Springfield also administers the MCAS in English Language arts in 4th grade. Because 2002-03 was the first year of Cornerstone implementation in the district, these 4th grade results will not be presented in this report. 34 Harris’s comparison school scored ten percentage points higher in 2001-02. Freedman does not have a comparison school.
The Springfield Public School District enrolls 26,594 students (47% Hispanic, 29% African American, 22% white, and 2% Asian) in 49 schools (33 elementary sch ools) in the 2002-03 school year. Seventy-one percent of the students qualify for free or reduced lunch and 10% are classified as limited English proficient. Freedman Elementary School is K-5 with 274 students. More than half (58%) of the students are Hispanic, 29% African American, 11% white, and 2% Asian. Most of the students (86%) qualify for free or reduced lunch and 27% are classified as limited English proficient. Frederick Harris Elementary School is preK-5 with 485 students. About 46% of the students are Hispanic, 36% white, 16% African American, and 3% Asian. More than two thirds of the students (68%) qualify for free or reduced lunch and 14% are classified as limited English proficient.
2001-2002 2002-2003
3rd Grade MCAS Reading Test Results
64
4441 42
0
20
40
60
80
100
Freedman District
Per
cent
pro
ficie
nt o
r ab
ove
3rd Grade MCAS Reading Test Results
2937
4435
27
42
0
20
40
60
80
100
Harris Harris's Comparison District
Per
cent
pro
ficie
nt o
r ab
ove

Cornerstone Second Year Evaluation Report
37
Freedman’s Reading scores fell, but remained very close to the district average. Harris’s score rose,
exceeded its comparison school’s performance, but remained below the district.
Cornerstone Second Year Evaluation Report
38
SURVEY AND INTERVIEW FINDINGS
The sections below report our findings about Cornerstone implementation in the 18
participating Phase I-III schools, and the impact of Cornerstone’s implementation on teacher
practice and student literacy development. The survey and interview data from site team members
and teachers in participating Cornerstone schools are integrated by topic and phase35. Comparisons
between survey data from the 2002-03 and the 2001-02 school years are presented when available.
As outlined in the Year 2 Progress Report (July 2003), we expanded the number and breadth of
surveys administered in the second year of the evaluation. We developed a survey for critical friends,
and revised the principal and coach surveys to capture more detail about Cornerstone practices at
participating schools. Principals, coaches, and critical friends completed those surveys in mid- May
2003.
An online survey of all teachers in the Cornerstone schools was administered in the spring of
2003. This survey probes how teachers in the Cornerstone schools perceive and are involved w ith the
initiative, and asks teachers to assess changes in their schools and their practice, as a result of
Cornerstone implementation. The Cornerstone-wide response rate for the online teacher survey was
73% in 2003, as compared with 61% in 2002. Participation rates across schools varied from 26%36 to
100% in 2003. Six schools had a 100% response rate on the survey.
The NYU team conducted 116 interviews over the course of the 2002-03 school year.
Interviews were conducted at 18 schools with coaches (36), principals37 (9), and in Phase I and II
schools containing upper grades, with one or two fourth grade teachers (18). At the district level, we
interviewed ten38 district strategy managers, nine district superintendents, and four critical friends39.
We revised our first-year interview protocols to incorporate new developments within the initiative
since its inception, and to more effectively capture changes in instructional practices at each school.
Interviews were also conducted with principals and teachers in comparison schools in the
nine Cornerstone districts; 17 interviews were conducted at ten comparison schools. These
interviews focused on school reform models being implemented in comparison schools, the
existence of alternative literacy programs, the nature of professional development programs, school
and district-level assessments, and the extent of practitioners’ awareness of The Cornerstone
35 We have presented data by phase because it is the expectation that schools in the same phase will, generally, be at the same stage of implementation. We note whenever there are large differences among schools within the same phase. 36 This school had the lowest response rate. The next lowest response rate was 44%. 37 Only new principals and Phase III principals were interviewed. Those that had been interviewed last year were surveyed instead. 38 At the time of our interviews, New Haven had two co-district strategy managers. We interviewed both. 39 Only new critical friends were interviewed, those that had been interviewed last year were surveyed instead.
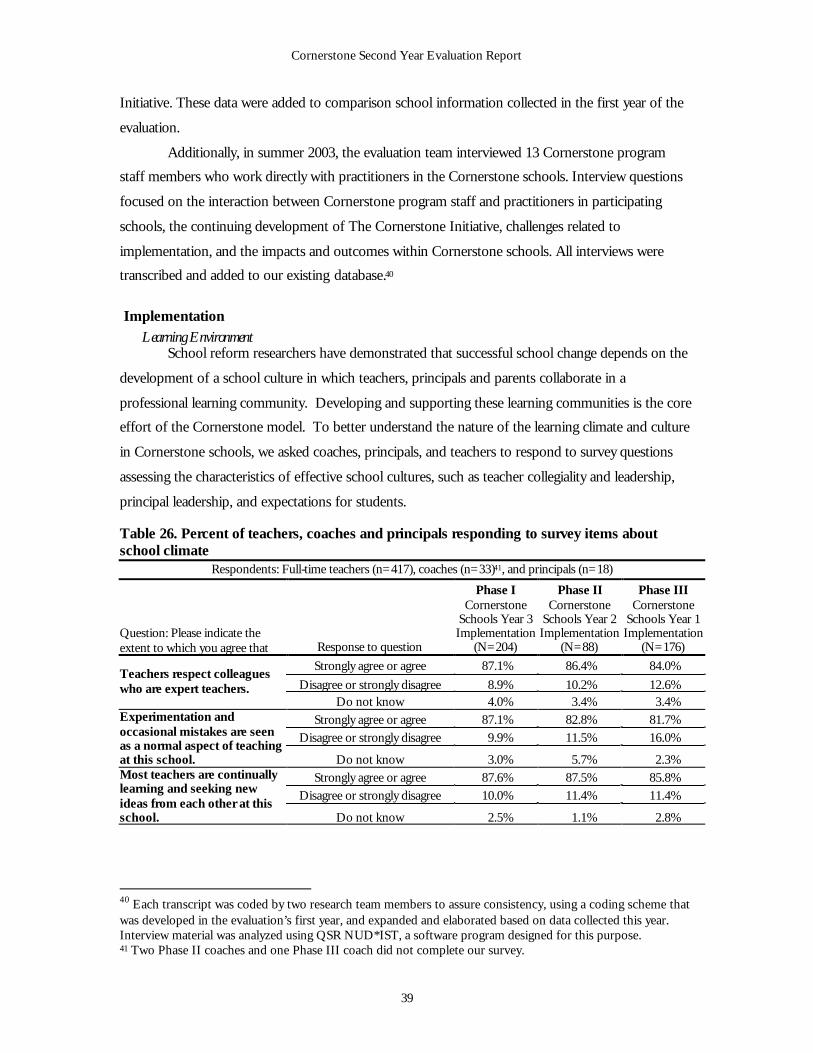
Cornerstone Second Year Evaluation Report
39
Initiative. These data were added to comparison school information collected in the first year of the
evaluation.
Additionally, in summer 2003, the evaluation team interviewed 13 Cornerstone program
staff members who work directly with practitioners in the Cornerstone schools. Interview questions
focused on the interaction between Cornerstone program staff and practitioners in participating
schools, the continuing development of The Cornerstone Initiative, challenges related to
implementation, and the impacts and outcomes within Cornerstone schools. All interviews were
transcribed and added to our existing database.40
Implementation Learning Environment
School reform researchers have demonstrated that successful school change depends on the
development of a school culture in which teachers, principals and parents collaborate in a
professional learning community. Developing and supporting these learning communities is the core
effort of the Cornerstone model. To better understand the nature of the learning climate and culture
in Cornerstone schools, we asked coaches, principals, and teachers to respond to survey questions
assessing the characteristics of effective school cultures, such as teacher collegiality and leadership,
principal leadership, and expectations for students.
Table 26. Percent of teachers, coaches and principals responding to survey items about school climate
Respondents: Full-time teachers (n=417), coaches (n=33)41, and principals (n=18)
Question: Please indicate the extent to which you agree that Response to question
Phase I Cornerstone
Schools Year 3 Implementation
(N=204)
Phase II Cornerstone
Schools Year 2 Implementation
(N=88)
Phase III Cornerstone
Schools Year 1 Implementation
(N=176)
Strongly agree or agree 87.1% 86.4% 84.0%
Disagree or strongly disagree 8.9% 10.2% 12.6% Teachers respect colleagues who are expert teachers.
Do not know 4.0% 3.4% 3.4% Strongly agree or agree 87.1% 82.8% 81.7%
Disagree or strongly disagree 9.9% 11.5% 16.0%
Experimentation and occasional mistakes are seen as a normal aspect of teaching at this school. Do not know 3.0% 5.7% 2.3%
Strongly agree or agree 87.6% 87.5% 85.8% Disagree or strongly disagree 10.0% 11.4% 11.4%
Most teachers are continually learning and seeking new ideas from each other at this school. Do not know 2.5% 1.1% 2.8%
40 Each transcript was coded by two research team members to assure consistency, using a coding scheme that was developed in the evaluation’s first year, and expanded and elaborated based on data collected this year. Interview material was analyzed using QSR NUD*IST, a software program designed for this purpose. 41 Two Phase II coaches and one Phase III coach did not complete our survey.
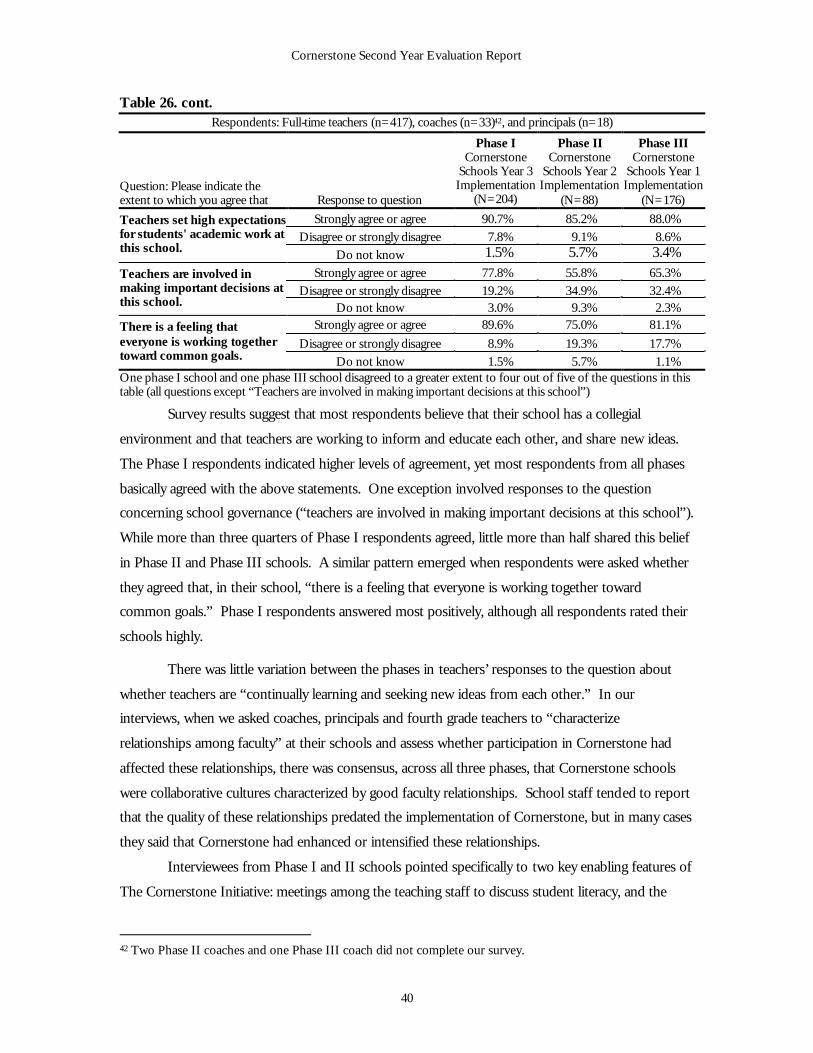
Cornerstone Second Year Evaluation Report
40
Table 26. cont. Respondents: Full-time teachers (n=417), coaches (n=33)42, and principals (n=18)
Question: Please indicate the extent to which you agree that Response to question
Phase I Cornerstone
Schools Year 3 Implementation
(N=204)
Phase II Cornerstone
Schools Year 2 Implementation
(N=88)
Phase III Cornerstone
Schools Year 1 Implementation
(N=176)
Strongly agree or agree 90.7% 85.2% 88.0% Disagree or strongly disagree 7.8% 9.1% 8.6%
Teachers set high expectations for students' academic work at this school. Do not know 1.5% 5.7% 3.4%
Strongly agree or agree 77.8% 55.8% 65.3% Disagree or strongly disagree 19.2% 34.9% 32.4%
Teachers are involved in making important decisions at this school. Do not know 3.0% 9.3% 2.3%
Strongly agree or agree 89.6% 75.0% 81.1%
Disagree or strongly disagree 8.9% 19.3% 17.7% There is a feeling that everyone is working together toward common goals. Do not know 1.5% 5.7% 1.1% One phase I school and one phase III school disagreed to a greater extent to four out of five of the questions in this table (all questions except “Teachers are involved in making important decisions at this school”)
Survey results suggest that most respondents believe that their school has a collegial
environment and that teachers are working to inform and educate each other, and share new ideas.
The Phase I respondents indicated higher levels of agreement, yet most respondents from all phases
basically agreed with the above statements. One exception involved responses to the question
concerning school governance (“teachers are involved in making important decisions at this school”).
While more than three quarters of Phase I respondents agreed, little more than half shared this belief
in Phase II and Phase III schools. A similar pattern emerged when respondents were asked whether
they agreed that, in their school, “there is a feeling that everyone is working together toward
common goals.” Phase I respondents answered most positively, although all respondents rated their
schools highly.
There was little variation between the phases in teachers’ responses to the question about
whether teachers are “continually learning and seeking new ideas from each other.” In our
interviews, when we asked coaches, principals and fourth grade teachers to “characterize
relationships among faculty” at their schools and assess whether participation in Cornerstone had
affected these relationships, there was consensus, across all three phases, that Cornerstone schools
were collaborative cultures characterized by good faculty relationships. School staff tended to report
that the quality of these relationships predated the implementation of Cornerstone, but in many cases
they said that Cornerstone had enhanced or intensified these relationships.
Interviewees from Phase I and II schools pointed specifically to two key enabling features of
The Cornerstone Initiative: meetings among the teaching staff to discuss student literacy, and the
42 Two Phase II coaches and one Phase III coach did not complete our survey.
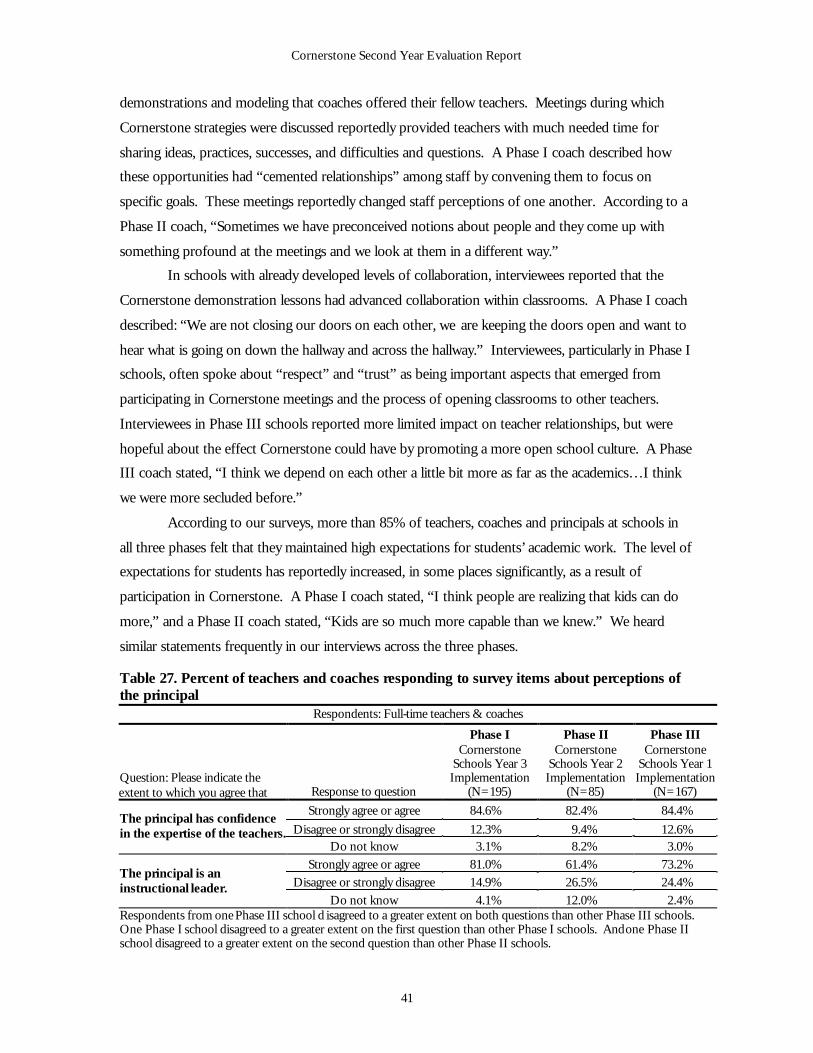
Cornerstone Second Year Evaluation Report
41
demonstrations and modeling that coaches offered their fellow teachers. Meetings during which
Cornerstone strategies were discussed reportedly provided teachers with much needed time for
sharing ideas, practices, successes, and difficulties and questions. A Phase I coach described how
these opportunities had “cemented relationships” among staff by convening them to focus on
specific goals. These meetings reportedly changed staff perceptions of one another. According to a
Phase II coach, “Sometimes we have preconceived notions about people and they come up with
something profound at the meetings and we look at them in a different way.”
In schools with already developed levels of collaboration, interviewees reported that the
Cornerstone demonstration lessons had advanced collaboration within classrooms. A Phase I coach
described: “We are not closing our doors on each other, we are keeping the doors open and want to
hear what is going on down the hallway and across the hallway.” Interviewees, particularly in Phase I
schools, often spoke about “respect” and “trust” as being important aspects that emerged from
participating in Cornerstone meetings and the process of opening classrooms to other teachers.
Interviewees in Phase III schools reported more limited impact on teacher relationships, but were
hopeful about the effect Cornerstone could have by promoting a more open school culture. A Phase
III coach stated, “I think we depend on each other a little bit more as far as the academics…I think
we were more secluded before.”
According to our surveys, more than 85% of teachers, coaches and principals at schools in
all three phases felt that they maintained high expectations for students’ academic work. The level of
expectations for students has reportedly increased, in some places significantly, as a result of
participation in Cornerstone. A Phase I coach stated, “I think people are realizing that kids can do
more,” and a Phase II coach stated, “Kids are so much more capable than we knew.” We heard
similar statements frequently in our interviews across the three phases.
Table 27. Percent of teachers and coaches responding to survey items about perceptions of the principal
Respondents: Full-time teachers & coaches
Question: Please indicate the extent to which you agree that Response to question
Phase I Cornerstone
Schools Year 3 Implementation
(N=195)
Phase II Cornerstone
Schools Year 2 Implementation
(N=85)
Phase III Cornerstone
Schools Year 1 Implementation
(N=167)
Strongly agree or agree 84.6% 82.4% 84.4%
Disagree or strongly disagree 12.3% 9.4% 12.6% The principal has confidence in the expertise of the teachers.
Do not know 3.1% 8.2% 3.0% Strongly agree or agree 81.0% 61.4% 73.2%
Disagree or strongly disagree 14.9% 26.5% 24.4% The principal is an instructional leader.
Do not know 4.1% 12.0% 2.4% Respondents from one Phase III school d isagreed to a greater extent on both questions than other Phase III schools. One Phase I school disagreed to a greater extent on the first question than other Phase I schools. And one Phase II school disagreed to a greater extent on the second question than other Phase II schools.
Cornerstone Second Year Evaluation Report
42
Cornerstone defines the principal’s role as critical to successful Cornerstone implementation.
As one measure of effective leadership, survey respondents were asked to assess whether their
principal “has confidence in the expertise of the teachers.” Table 27 indicates that most teachers
agreed. However, marked differences surfaced about perceptions of the principal as an instructional
leader. While most Phase I respondents reported that their principals were instructional leaders,
fewer Phase II and Phase III teachers agreed.
During interviews with fourth grade teachers (Phases I and II) and coaches (Phases I, II and
III), participants were asked about the levels of support they receive from the principal. Differences
among the phases in the types of support provided by principals surfaced. Phase I participants
described the principal as very supportive, and many reported changes in principal practice since the
beginning of Cornerstone. These changes ranged from the principal being more flexible in allowing
teachers to meet as grade level teams to developing a more shared leadership style. A Phase I coach
described the change as, “she visited [teacher’s] classrooms, gave them feedback on how well they
were doing and told them to talk to us. And she asked us what needs to be done differently. In
previous years, unless we sought her out we didn’t get her.”
In contrast, most Phase II participants describe the principal as very accommodating, but
less active in The Cornerstone Initiative. A Phase II coach described her principal as “very
supportive and very hands-off.” Another Phase II coach at a different school described the support
of the principal by saying that her principal is “very helpful. [The Principal] is just there to let us do
what we need to do.” Phase III participants also generally described the principals as very
supportive, and indicated that principals were instrumental in releasing funds for classroom libraries
or providing the coaches with time at staff meetings to discuss Cornerstone with the faculty. A Phase
III coach said of the principal, “She’s very on top of everything that is required of Cornerstone and
very supportive.”
Learning Environment Summary
Our survey and interview findings indicate that the majority of the site team members and
school practitioners viewed the learning environment in their schools as collegial, and their principal
as supportive and confident about the expertise of teachers. In many cases, interviews with coaches
and principals affirmed that The Cornerstone Initiative had improved or intensified the collaborative
culture in these schools. However, survey results show a greater degree of shared leadership in the
Phase I schools than in the Phase II and III schools. Interviews with coaches confirmed that the
longer the schools implemented The Cornerstone Initiative, the more likely that teachers would feel
empowered, adopt an open school culture, and have high expectation for students; and the more
Cornerstone Second Year Evaluation Report
43
likely that principals change their practices in promoting literacy learning and shared leadership in
schools. Overall, The Cornerstone Initiative seems to have had a positive impact on the schools’
learning environment, though the intensity varies across the three phases, given the weight of existing
school cultures and the amount of time they have been involved in The Cornerstone Initiative.
Professional Learning
The Cornerstone Initiative is based on the belief that on-going professional support for site
team members and teachers inculcates a commitment to learning and change. The following sections
explore the implementation of professional learning experiences (Cornerstone meetings and staff
visits, participating in reviews of other Cornerstone schools, and videoconferences) and their effects
on site team members (principals, coaches and critical friends), and also assess the implementation
and effects of schoolwide Cornerstone components (asset-mapping, book study groups, school
review, and demonstration lessons) on the entire school staff.
Site Team Participation in Professional Learning
Direct Support from Cornerstone
Every year, coaches, critical friends, principals, district strategy managers, parent
representatives, and superintendents are asked to participate in Cornerstone Regional Meetings, a
visit to London schools (new participants only)43 and the Cornerstone Summer Institute. For first
year districts, the meetings serve as an introduction to the implementation of Cornerstone. For
returning districts, the Summer Institute and Regional Meetings help reinforce and expand their
work. Principal, coach, and critical friend surveys and interviews indicate that participants found
these meetings important to understanding and implementing Cornerstone.
43 Survey results about the London trip are not presented due to the smaller number of respondents who participate each year.

Cornerstone Second Year Evaluation Report
44
Table 28. Percent of coaches, critical friends and principals responding to survey items about Cornerstone meetings
Respondents: Coaches, Critical Friends & Principals
Response to question
Phase I Cornerstone
Schools Year 3
Implementation N=27
Phase II Cornerstone
Schools Year 2
Implementation N=11
Phase III Cornerstone
Schools Year 1
Implementation N=19
Very useful 74.1% 72.7% 63.2% Somewhat useful 22.2% 18.2% 15.8%
Neutral 0.0% 9.1% 15.8% Somewhat not useful 3.7% 0.0% 5.3%
How useful did you find the 2002 Summer Institute for improving your understanding and implementation of Cornerstone? Not at all 0.0% 0.0% 0.0%
Very useful 63.0% 72.7% 63.2% Somewhat useful 33.3% 18.2% 21.1%
Neutral 3.7% 9.1% 10.5% Somewhat not useful 0.0% 0.0% 5.3%
How useful did you find the 2003 Regional Meeting for improving your understanding and implementation of Cornerstone? Not at all 0.0% 0.0% 0.0%
Cornerstone participants at one Phase III school had found the Cornerstone meetings less useful than other Phase III schools. One Phase I and one Phase II school found the Summer Institute less useful than other schools within the same phase.
Table 28 shows that the majority of Phase I and II respondents found both the Summer
Institute and the Regional Meetings to be “very useful.” More Phase III respondents reported that
the meetings were “somewhat not useful” or felt “neutral” about their importance. Echoing
perceptions we heard during first year interviews with Phase I and II site team members, some
coaches and principals in Phase III schools described their initial uncertainty about Cornerstone. A
Phase III coach explained, “Well, at first, it's a bit overwhelming, but now that we've been in it for
the year, I can see how valuable the training really was.” It seems that, as schools become more
familiar with Cornerstone, their appreciation of the Regional Meetings and the Summer Institute
increases.
Cornerstone staff also provide on-going support through school visits, and consult with
coaches and teachers to help improve their literacy teaching strategies. In addition to helping clarify
issues related to understanding the literacy framework and implementing Cornerstone strategies,
coaches reported that Cornerstone staff visits were invaluable for boosting interest in the initiative
and conferring legitimacy on their efforts. One coach stated: “I think [staff visits] play an important
role because when we’ve been with them at our trainings, we come away feeling rejuvenated and
special…so we were really happy when they came [to our school] because we figured that would give
the faculty a boost.”
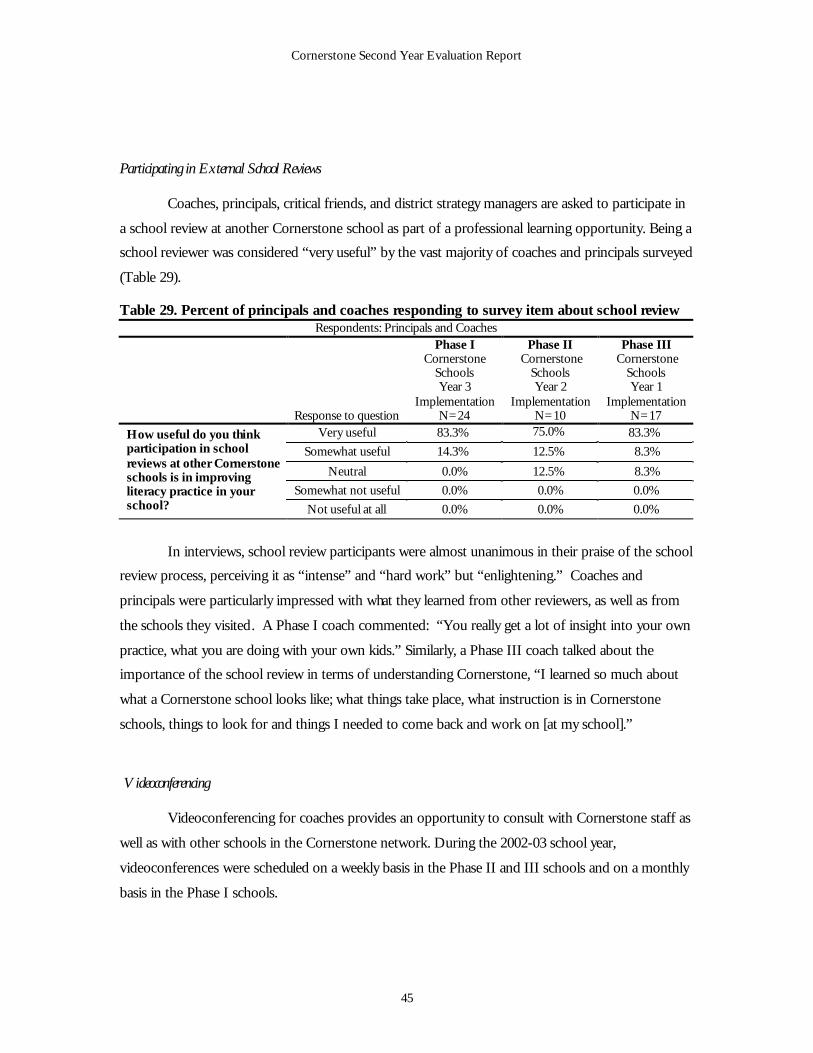
Cornerstone Second Year Evaluation Report
45
Participating in External School Reviews
Coaches, principals, critical friends, and district strategy managers are asked to participate in
a school review at another Cornerstone school as part of a professional learning opportunity. Being a
school reviewer was considered “very useful” by the vast majority of coaches and principals surveyed
(Table 29).
Table 29. Percent of principals and coaches responding to survey item about school review Respondents: Principals and Coaches
Response to question
Phase I Cornerstone
Schools Year 3
Implementation N=24
Phase II Cornerstone
Schools Year 2
Implementation N=10
Phase III Cornerstone
Schools Year 1
Implementation N=17
Very useful 83.3% 75.0% 83.3%
Somewhat useful 14.3% 12.5% 8.3%
Neutral 0.0% 12.5% 8.3%
Somewhat not useful 0.0% 0.0% 0.0%
How useful do you think participation in school reviews at other Cornerstone schools is in improving literacy practice in your school? Not useful at all 0.0% 0.0% 0.0%
In interviews, school review participants were almost unanimous in their praise of the school
review process, perceiving it as “intense” and “hard work” but “enlightening.” Coaches and
principals were particularly impressed with what they learned from other reviewers, as well as from
the schools they visited. A Phase I coach commented: “You really get a lot of insight into your own
practice, what you are doing with your own kids.” Similarly, a Phase III coach talked about the
importance of the school review in terms of understanding Cornerstone, “I learned so much about
what a Cornerstone school looks like; what things take place, what instruction is in Cornerstone
schools, things to look for and things I needed to come back and work on [at my school].”
Videoconferencing
Videoconferencing for coaches provides an opportunity to consult with Cornerstone staff as
well as with other schools in the Cornerstone network. During the 2002-03 school year,
videoconferences were scheduled on a weekly basis in the Phase II and III schools and on a monthly
basis in the Phase I schools.
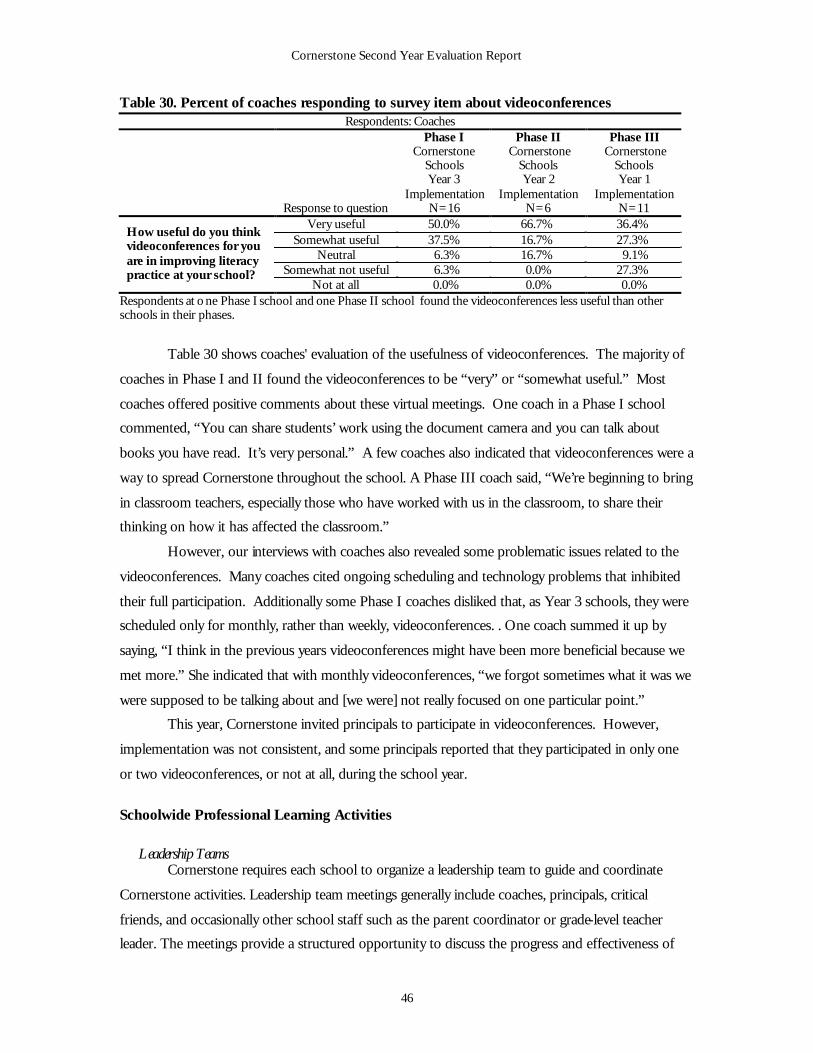
Cornerstone Second Year Evaluation Report
46
Table 30. Percent of coaches responding to survey item about videoconferences Respondents: Coaches
Response to question
Phase I Cornerstone
Schools Year 3
Implementation N=16
Phase II Cornerstone
Schools Year 2
Implementation N=6
Phase III Cornerstone
Schools Year 1
Implementation N=11
Very useful 50.0% 66.7% 36.4% Somewhat useful 37.5% 16.7% 27.3%
Neutral 6.3% 16.7% 9.1% Somewhat not useful 6.3% 0.0% 27.3%
How useful do you think videoconferences for you are in improving literacy practice at your school?
Not at all 0.0% 0.0% 0.0% Respondents at o ne Phase I school and one Phase II school found the videoconferences less useful than other schools in their phases.
Table 30 shows coaches' evaluation of the usefulness of videoconferences. The majority of
coaches in Phase I and II found the videoconferences to be “very” or “somewhat useful.” Most
coaches offered positive comments about these virtual meetings. One coach in a Phase I school
commented, “You can share students’ work using the document camera and you can talk about
books you have read. It’s very personal.” A few coaches also indicated that videoconferences were a
way to spread Cornerstone throughout the school. A Phase III coach said, “We’re beginning to bring
in classroom teachers, especially those who have worked with us in the classroom, to share their
thinking on how it has affected the classroom.”
However, our interviews with coaches also revealed some problematic issues related to the
videoconferences. Many coaches cited ongoing scheduling and technology problems that inhibited
their full participation. Additionally some Phase I coaches disliked that, as Year 3 schools, they were
scheduled only for monthly, rather than weekly, videoconferences. . One coach summed it up by
saying, “I think in the previous years videoconferences might have been more beneficial because we
met more.” She indicated that with monthly videoconferences, “we forgot sometimes what it was we
were supposed to be talking about and [we were] not really focused on one particular point.”
This year, Cornerstone invited principals to participate in videoconferences. However,
implementation was not consistent, and some principals reported that they participated in only one
or two videoconferences, or not at all, during the school year.
Schoolwide Professional Learning Activities
Leadership Teams
Cornerstone requires each school to organize a leadership team to guide and coordinate
Cornerstone activities. Leadership team meetings generally include coaches, principals, critical
friends, and occasionally other school staff such as the parent coordinator or grade-level teacher
leader. The meetings provide a structured opportunity to discuss the progress and effectiveness of
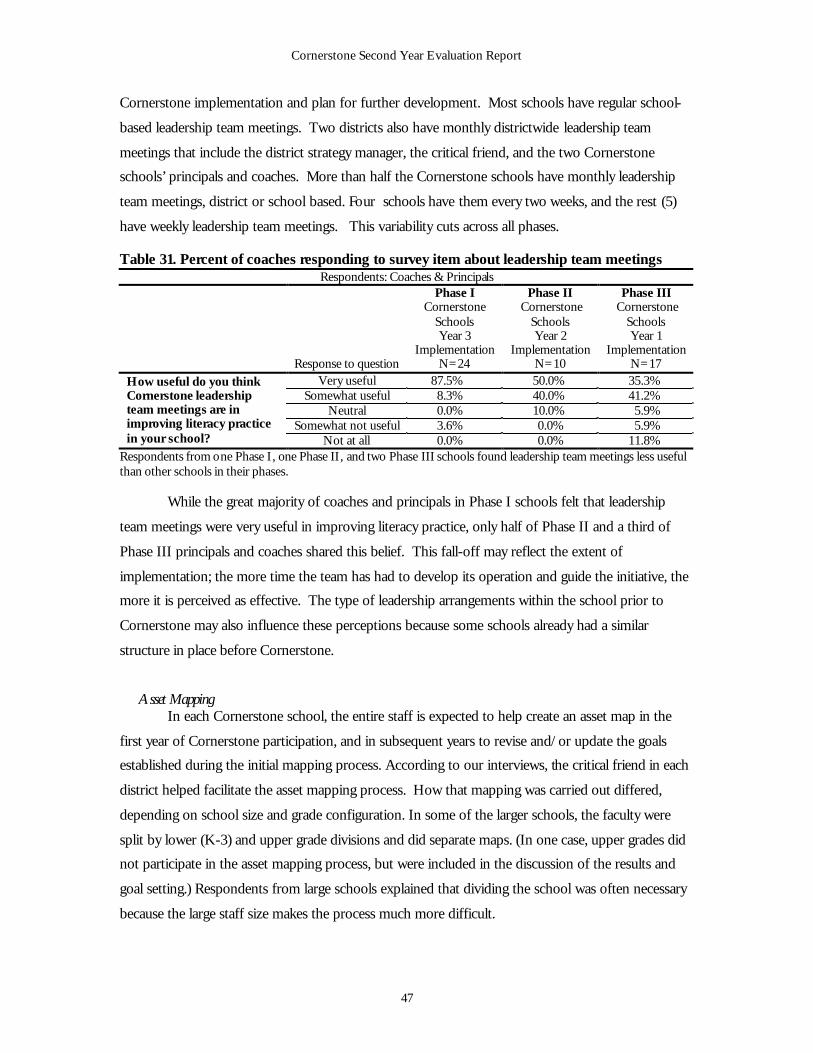
Cornerstone Second Year Evaluation Report
47
Cornerstone implementation and plan for further development. Most schools have regular school-
based leadership team meetings. Two districts also have monthly districtwide leadership team
meetings that include the district strategy manager, the critical friend, and the two Cornerstone
schools’ principals and coaches. More than half the Cornerstone schools have monthly leadership
team meetings, district or school based. Four schools have them every two weeks, and the rest (5)
have weekly leadership team meetings. This variability cuts across all phases.
Table 31. Percent of coaches responding to survey item about leadership team meetings Respondents: Coaches & Principals
Response to question
Phase I Cornerstone
Schools Year 3
Implementation N=24
Phase II Cornerstone
Schools Year 2
Implementation N=10
Phase III Cornerstone
Schools Year 1
Implementation N=17
Very useful 87.5% 50.0% 35.3% Somewhat useful 8.3% 40.0% 41.2%
Neutral 0.0% 10.0% 5.9% Somewhat not useful 3.6% 0.0% 5.9%
How useful do you think Cornerstone leadership team meetings are in improving literacy practice in your school? Not at all 0.0% 0.0% 11.8%
Respondents from one Phase I, one Phase II, and two Phase III schools found leadership team meetings less useful than other schools in their phases.
While the great majority of coaches and principals in Phase I schools felt that leadership
team meetings were very useful in improving literacy practice, only half of Phase II and a third of
Phase III principals and coaches shared this belief. This fall-off may reflect the extent of
implementation; the more time the team has had to develop its operation and guide the initiative, the
more it is perceived as effective. The type of leadership arrangements within the school prior to
Cornerstone may also influence these perceptions because some schools already had a similar
structure in place before Cornerstone.
Asset Mapping In each Cornerstone school, the entire staff is expected to help create an asset map in the
first year of Cornerstone participation, and in subsequent years to revise and/or update the goals
established during the initial mapping process. According to our interviews, the critical friend in each
district helped facilitate the asset mapping process. How that mapping was carried out differed,
depending on school size and grade configuration. In some of the larger schools, the faculty were
split by lower (K-3) and upper grade divisions and did separate maps. (In one case, upper grades did
not participate in the asset mapping process, but were included in the discussion of the results and
goal setting.) Respondents from large schools explained that dividing the school was often necessary
because the large staff size makes the process much more difficult.
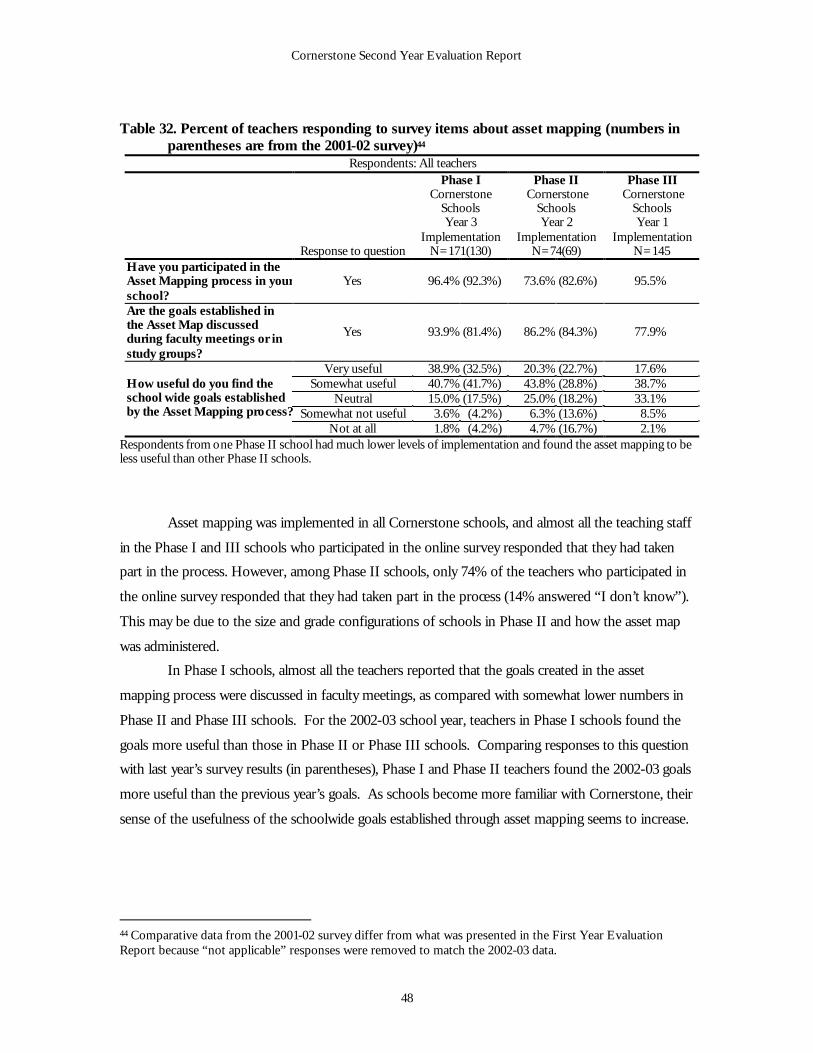
Cornerstone Second Year Evaluation Report
48
Table 32. Percent of teachers responding to survey items about asset mapping (numbers in parentheses are from the 2001-02 survey)44
Respondents: All teachers
Response to question
Phase I Cornerstone
Schools Year 3
Implementation N=171(130)
Phase II Cornerstone
Schools Year 2
Implementation N=74(69)
Phase III Cornerstone
Schools Year 1
Implementation N=145
Have you participated in the Asset Mapping process in your school?
Yes 96.4% (92.3%) 73.6% (82.6%) 95.5%
Are the goals established in the Asset Map discussed during faculty meetings or in study groups?
Yes 93.9% (81.4%) 86.2% (84.3%) 77.9%
Very useful 38.9% (32.5%) 20.3% (22.7%) 17.6% Somewhat useful 40.7% (41.7%) 43.8% (28.8%) 38.7%
Neutral 15.0% (17.5%) 25.0% (18.2%) 33.1% Somewhat not useful 3.6% (4.2%) 6.3% (13.6%) 8.5%
How useful do you find the school wide goals established by the Asset Mapping process?
Not at all 1.8% (4.2%) 4.7% (16.7%) 2.1% Respondents from one Phase II school had much lower levels of implementation and found the asset mapping to be less useful than other Phase II schools.
Asset mapping was implemented in all Cornerstone schools, and almost all the teaching staff
in the Phase I and III schools who participated in the online survey responded that they had taken
part in the process. However, among Phase II schools, only 74% of the teachers who participated in
the online survey responded that they had taken part in the process (14% answered “I don’t know”).
This may be due to the size and grade configurations of schools in Phase II and how the asset map
was administered.
In Phase I schools, almost all the teachers reported that the goals created in the asset
mapping process were discussed in faculty meetings, as compared with somewhat lower numbers in
Phase II and Phase III schools. For the 2002-03 school year, teachers in Phase I schools found the
goals more useful than those in Phase II or Phase III schools. Comparing responses to this question
with last year’s survey results (in parentheses), Phase I and Phase II teachers found the 2002-03 goals
more useful than the previous year’s goals. As schools become more familiar with Cornerstone, their
sense of the usefulness of the schoolwide goals established through asset mapping seems to increase.
44 Comparative data from the 2001-02 survey differ from what was presented in the First Year Evaluation Report because “not applicable” responses were removed to match the 2002-03 data.
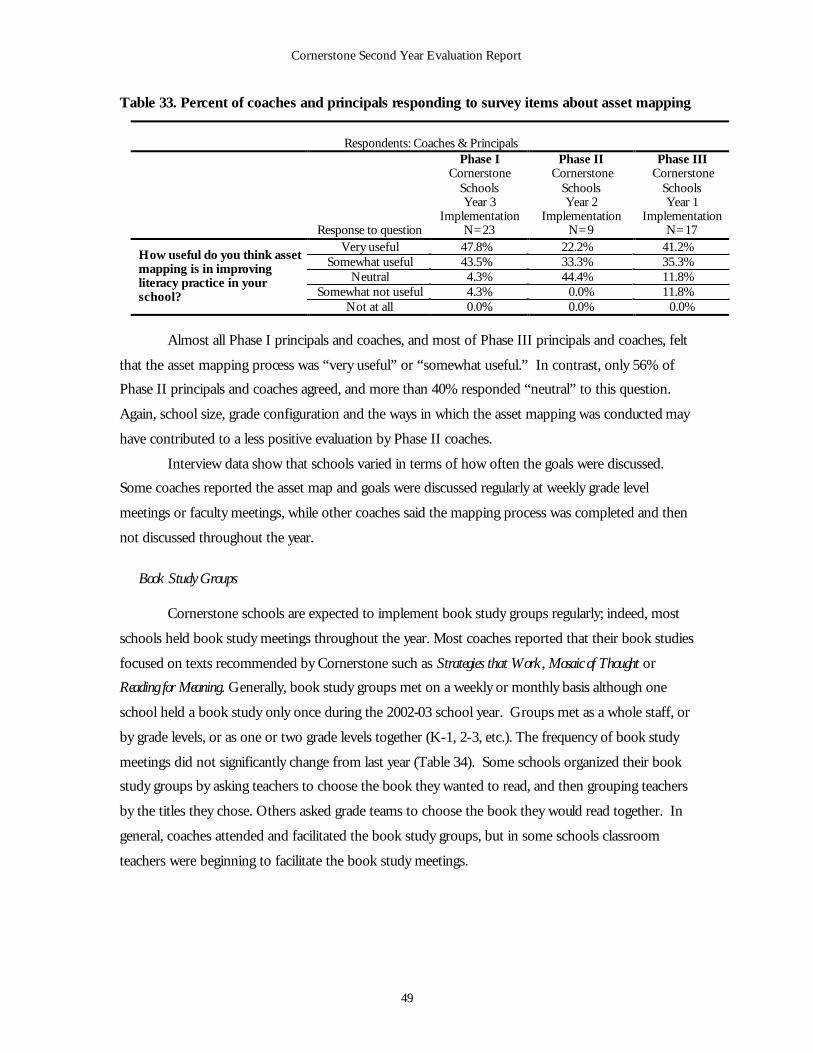
Cornerstone Second Year Evaluation Report
49
Table 33. Percent of coaches and principals responding to survey items about asset mapping
Respondents: Coaches & Principals
Response to question
Phase I Cornerstone
Schools Year 3
Implementation N=23
Phase II Cornerstone
Schools Year 2
Implementation N=9
Phase III Cornerstone
Schools Year 1
Implementation N=17
Very useful 47.8% 22.2% 41.2% Somewhat useful 43.5% 33.3% 35.3%
Neutral 4.3% 44.4% 11.8% Somewhat not useful 4.3% 0.0% 11.8%
How useful do you think asset mapping is in improving literacy practice in your school?
Not at all 0.0% 0.0% 0.0%
Almost all Phase I principals and coaches, and most of Phase III principals and coaches, felt
that the asset mapping process was “very useful” or “somewhat useful.” In contrast, only 56% of
Phase II principals and coaches agreed, and more than 40% responded “neutral” to this question.
Again, school size, grade configuration and the ways in which the asset mapping was conducted may
have contributed to a less positive evaluation by Phase II coaches.
Interview data show that schools varied in terms of how often the goals were discussed.
Some coaches reported the asset map and goals were discussed regularly at weekly grade level
meetings or faculty meetings, while other coaches said the mapping process was completed and then
not discussed throughout the year.
Book Study Groups
Cornerstone schools are expected to implement book study groups regularly; indeed, most
schools held book study meetings throughout the year. Most coaches reported that their book studies
focused on texts recommended by Cornerstone such as Strategies that Work, Mosaic of Thought or
Reading for Meaning. Generally, book study groups met on a weekly or monthly basis although one
school held a book study only once during the 2002-03 school year. Groups met as a whole staff, or
by grade levels, or as one or two grade levels together (K-1, 2-3, etc.). The frequency of book study
meetings did not significantly change from last year (Table 34). Some schools organized their book
study groups by asking teachers to choose the book they wanted to read, and then grouping teachers
by the titles they chose. Others asked grade teams to choose the book they would read together. In
general, coaches attended and facilitated the book study groups, but in some schools classroom
teachers were beginning to facilitate the book study meetings.
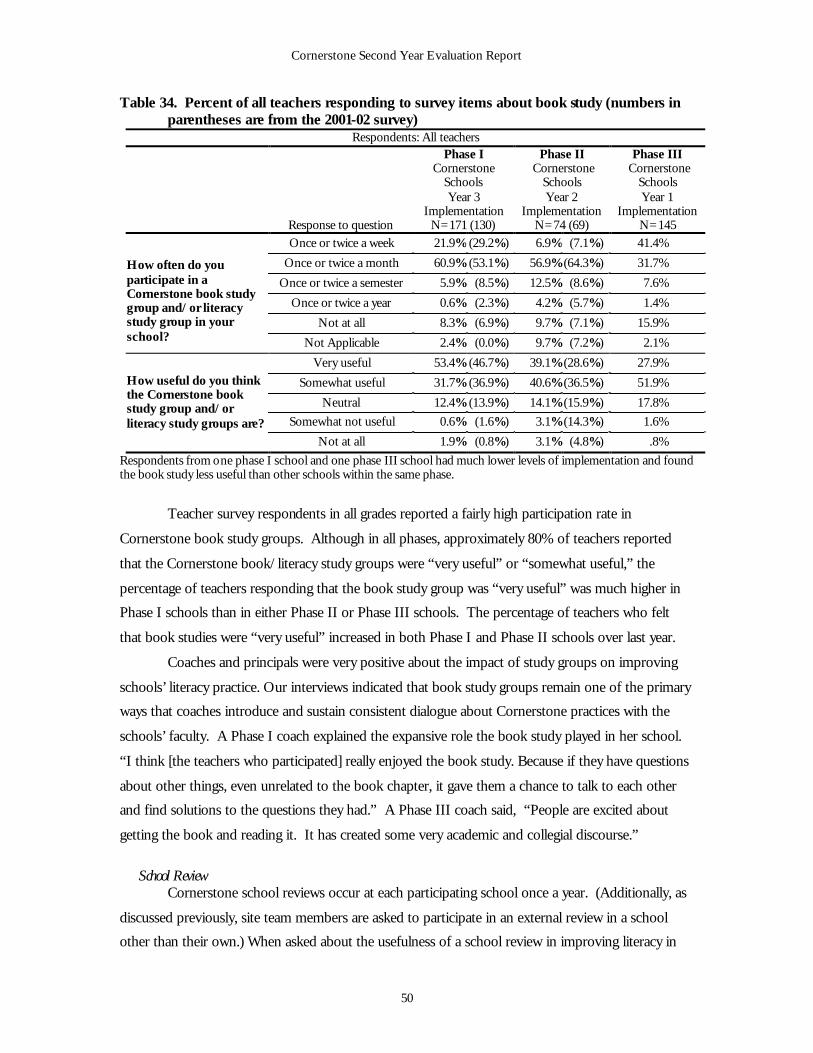
Cornerstone Second Year Evaluation Report
50
Table 34. Percent of all teachers responding to survey items about book study (numbers in parentheses are from the 2001-02 survey)
Respondents: All teachers
Response to question
Phase I Cornerstone
Schools Year 3
Implementation N=171 (130)
Phase II Cornerstone
Schools Year 2
Implementation N=74 (69)
Phase III Cornerstone
Schools Year 1
Implementation N=145
Once or twice a week 21.9% (29.2%) 6.9% (7.1%) 41.4%
Once or twice a month 60.9% (53.1%) 56.9% (64.3%) 31.7%
Once or twice a semester 5.9% (8.5%) 12.5% (8.6%) 7.6%
Once or twice a year 0.6% (2.3%) 4.2% (5.7%) 1.4%
Not at all 8.3% (6.9%) 9.7% (7.1%) 15.9%
How often do you participate in a Cornerstone book study group and/or literacy study group in your school? Not Applicable 2.4% (0.0%) 9.7% (7.2%) 2.1%
Very useful 53.4% (46.7%) 39.1% (28.6%) 27.9%
Somewhat useful 31.7% (36.9%) 40.6% (36.5%) 51.9%
Neutral 12.4% (13.9%) 14.1% (15.9%) 17.8%
Somewhat not useful 0.6% (1.6%) 3.1% (14.3%) 1.6%
How useful do you think the Cornerstone book study group and/or literacy study groups are?
Not at all 1.9% (0.8%) 3.1% (4.8%) .8%
Respondents from one phase I school and one phase III school had much lower levels of implementation and found the book study less useful than other schools within the same phase.
Teacher survey respondents in all grades reported a fairly high participation rate in
Cornerstone book study groups. Although in all phases, approximately 80% of teachers reported
that the Cornerstone book/literacy study groups were “very useful” or “somewhat useful,” the
percentage of teachers responding that the book study group was “very useful” was much higher in
Phase I schools than in either Phase II or Phase III schools. The percentage of teachers who felt
that book studies were “very useful” increased in both Phase I and Phase II schools over last year.
Coaches and principals were very positive about the impact of study groups on improving
schools’ literacy practice. Our interviews indicated that book study groups remain one of the primary
ways that coaches introduce and sustain consistent dialogue about Cornerstone practices with the
schools’ faculty. A Phase I coach explained the expansive role the book study played in her school.
“I think [the teachers who participated] really enjoyed the book study. Because if they have questions
about other things, even unrelated to the book chapter, it gave them a chance to talk to each other
and find solutions to the questions they had.” A Phase III coach said, “People are excited about
getting the book and reading it. It has created some very academic and collegial discourse.”
School Review
Cornerstone school reviews occur at each participating school once a year. (Additionally, as
discussed previously, site team members are asked to participate in an external review in a school
other than their own.) When asked about the usefulness of a school review in improving literacy in
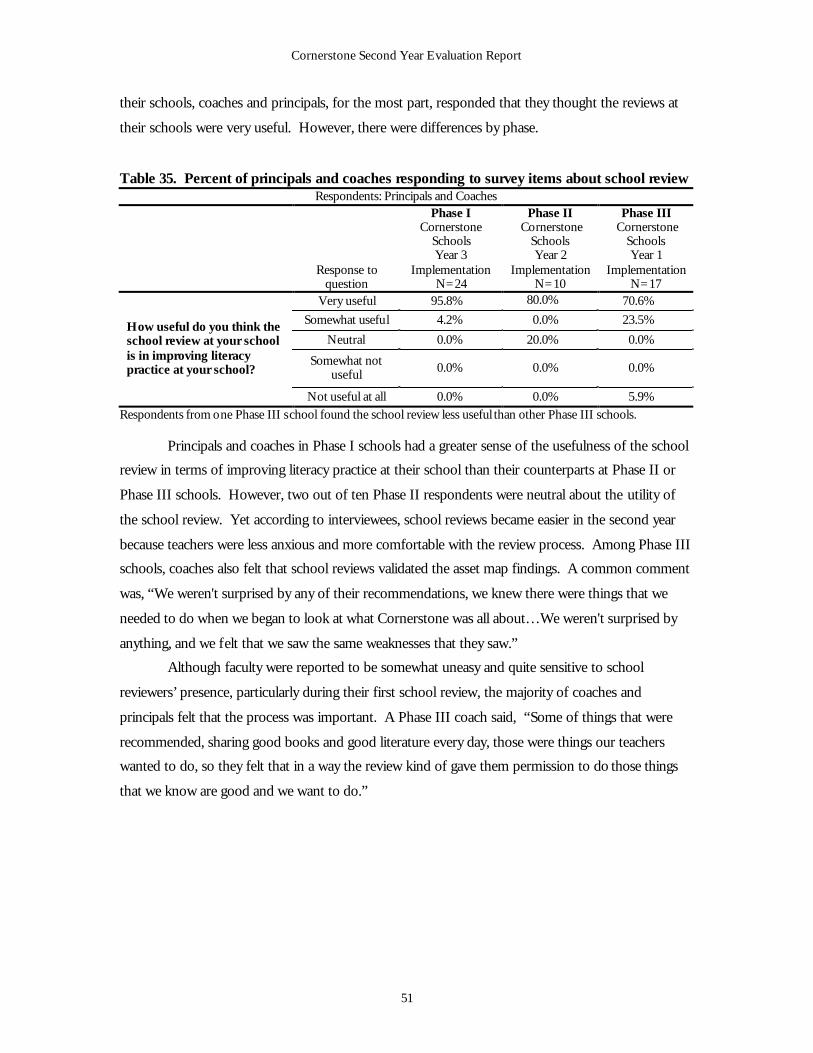
Cornerstone Second Year Evaluation Report
51
their schools, coaches and principals, for the most part, responded that they thought the reviews at
their schools were very useful. However, there were differences by phase.
Table 35. Percent of principals and coaches responding to survey items about school review Respondents: Principals and Coaches
Response to question
Phase I Cornerstone
Schools Year 3
Implementation N=24
Phase II Cornerstone
Schools Year 2
Implementation N=10
Phase III Cornerstone
Schools Year 1
Implementation N=17
Very useful 95.8% 80.0% 70.6%
Somewhat useful 4.2% 0.0% 23.5%
Neutral 0.0% 20.0% 0.0%
Somewhat not useful 0.0% 0.0% 0.0%
How useful do you think the school review at your school is in improving literacy practice at your school?
Not useful at all 0.0% 0.0% 5.9% Respondents from one Phase III school found the school review less useful than other Phase III schools.
Principals and coaches in Phase I schools had a greater sense of the usefulness of the school
review in terms of improving literacy practice at their school than their counterparts at Phase II or
Phase III schools. However, two out of ten Phase II respondents were neutral about the utility of
the school review. Yet according to interviewees, school reviews became easier in the second year
because teachers were less anxious and more comfortable with the review process. Among Phase III
schools, coaches also felt that school reviews validated the asset map findings. A common comment
was, “We weren't surprised by any of their recommendations, we knew there were things that we
needed to do when we began to look at what Cornerstone was all about…We weren't surprised by
anything, and we felt that we saw the same weaknesses that they saw.”
Although faculty were reported to be somewhat uneasy and quite sensitive to school
reviewers’ presence, particularly during their first school review, the majority of coaches and
principals felt that the process was important. A Phase III coach said, “Some of things that were
recommended, sharing good books and good literature every day, those were things our teachers
wanted to do, so they felt that in a way the review kind of gave them permission to do those things
that we know are good and we want to do.”
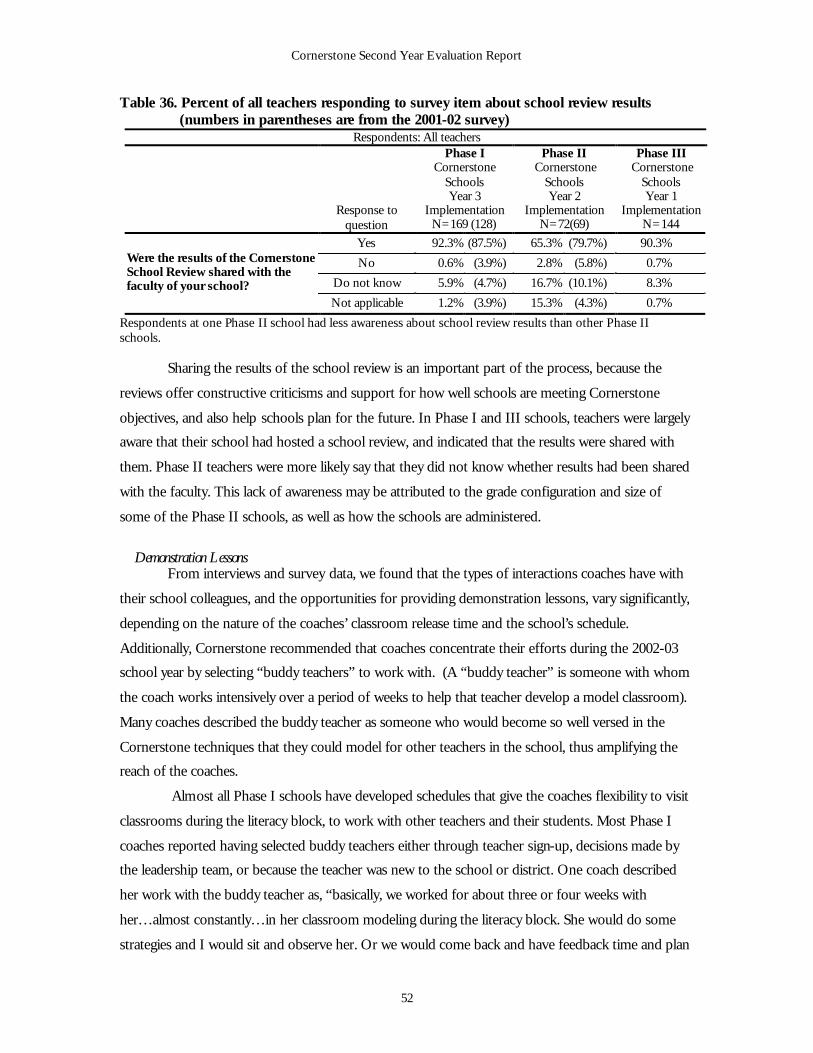
Cornerstone Second Year Evaluation Report
52
Table 36. Percent of all teachers responding to survey item about school review results (numbers in parentheses are from the 2001-02 survey)
Respondents: All teachers
Response to question
Phase I Cornerstone
Schools Year 3
Implementation N=169 (128)
Phase II Cornerstone
Schools Year 2
Implementation N=72(69)
Phase III Cornerstone
Schools Year 1
Implementation N=144
Yes 92.3% (87.5%) 65.3% (79.7%) 90.3%
No 0.6% (3.9%) 2.8% (5.8%) 0.7%
Do not know 5.9% (4.7%) 16.7% (10.1%) 8.3%
Were the results of the Cornerstone School Review shared with the faculty of your school?
Not applicable 1.2% (3.9%) 15.3% (4.3%) 0.7%
Respondents at one Phase II school had less awareness about school review results than other Phase II schools.
Sharing the results of the school review is an important part of the process, because the
reviews offer constructive criticisms and support for how well schools are meeting Cornerstone
objectives, and also help schools plan for the future. In Phase I and III schools, teachers were largely
aware that their school had hosted a school review, and indicated that the results were shared with
them. Phase II teachers were more likely say that they did not know whether results had been shared
with the faculty. This lack of awareness may be attributed to the grade configuration and size of
some of the Phase II schools, as well as how the schools are administered.
Demonstration Lessons
From interviews and survey data, we found that the types of interactions coaches have with
their school colleagues, and the opportunities for providing demonstration lessons, vary significantly,
depending on the nature of the coaches’ classroom release time and the school’s schedule.
Additionally, Cornerstone recommended that coaches concentrate their efforts during the 2002-03
school year by selecting “buddy teachers” to work with. (A “buddy teacher” is someone with whom
the coach works intensively over a period of weeks to help that teacher develop a model classroom).
Many coaches described the buddy teacher as someone who would become so well versed in the
Cornerstone techniques that they could model for other teachers in the school, thus amplifying the
reach of the coaches.
Almost all Phase I schools have developed schedules that give the coaches flexibility to visit
classrooms during the literacy block, to work with other teachers and their students. Most Phase I
coaches reported having selected buddy teachers either through teacher sign-up, decisions made by
the leadership team, or because the teacher was new to the school or district. One coach described
her work with the buddy teacher as, “basically, we worked for about three or four weeks with
her…almost constantly…in her classroom modeling during the literacy block. She would do some
strategies and I would sit and observe her. Or we would come back and have feedback time and plan
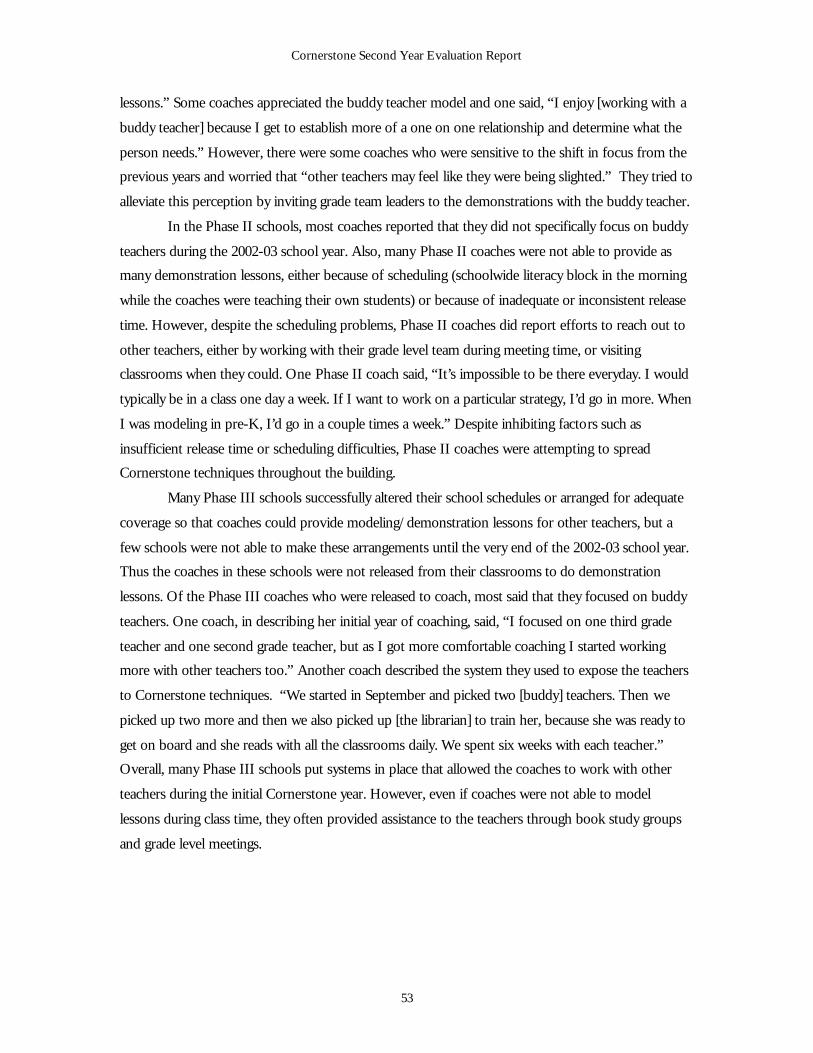
Cornerstone Second Year Evaluation Report
53
lessons.” Some coaches appreciated the buddy teacher model and one said, “I enjoy [working with a
buddy teacher] because I get to establish more of a one on one relationship and determine what the
person needs.” However, there were some coaches who were sensitive to the shift in focus from the
previous years and worried that “other teachers may feel like they were being slighted.” They tried to
alleviate this perception by inviting grade team leaders to the demonstrations with the buddy teacher.
In the Phase II schools, most coaches reported that they did not specifically focus on buddy
teachers during the 2002-03 school year. Also, many Phase II coaches were not able to provide as
many demonstration lessons, either because of scheduling (schoolwide literacy block in the morning
while the coaches were teaching their own students) or because of inadequate or inconsistent release
time. However, despite the scheduling problems, Phase II coaches did report efforts to reach out to
other teachers, either by working with their grade level team during meeting time, or visiting
classrooms when they could. One Phase II coach said, “It’s impossible to be there everyday. I would
typically be in a class one day a week. If I want to work on a particular strategy, I’d go in more. When
I was modeling in pre-K, I’d go in a couple times a week.” Despite inhibiting factors such as
insufficient release time or scheduling difficulties, Phase II coaches were attempting to spread
Cornerstone techniques throughout the building.
Many Phase III schools successfully altered their school schedules or arranged for adequate
coverage so that coaches could provide modeling/demonstration lessons for other teachers, but a
few schools were not able to make these arrangements until the very end of the 2002-03 school year.
Thus the coaches in these schools were not released from their classrooms to do demonstration
lessons. Of the Phase III coaches who were released to coach, most said that they focused on buddy
teachers. One coach, in describing her initial year of coaching, said, “I focused on one third grade
teacher and one second grade teacher, but as I got more comfortable coaching I started working
more with other teachers too.” Another coach described the system they used to expose the teachers
to Cornerstone techniques. “We started in September and picked two [buddy] teachers. Then we
picked up two more and then we also picked up [the librarian] to train her, because she was ready to
get on board and she reads with all the classrooms daily. We spent six weeks with each teacher.”
Overall, many Phase III schools put systems in place that allowed the coaches to work with other
teachers during the initial Cornerstone year. However, even if coaches were not able to model
lessons during class time, they often provided assistance to the teachers through book study groups
and grade level meetings.
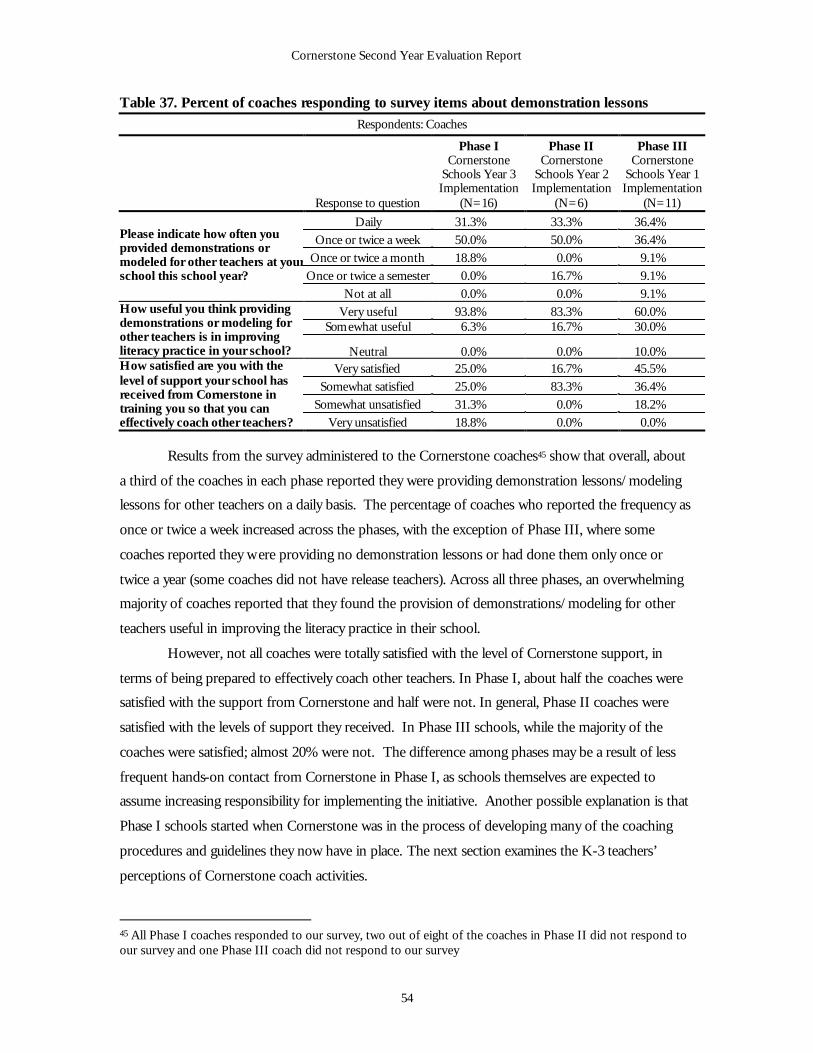
Cornerstone Second Year Evaluation Report
54
Table 37. Percent of coaches responding to survey items about demonstration lessons Respondents: Coaches
Response to question
Phase I Cornerstone
Schools Year 3 Implementation
(N=16)
Phase II Cornerstone
Schools Year 2 Implementation
(N=6)
Phase III Cornerstone
Schools Year 1 Implementation
(N=11)
Daily 31.3% 33.3% 36.4% Once or twice a week 50.0% 50.0% 36.4%
Once or twice a month 18.8% 0.0% 9.1% Once or twice a semester 0.0% 16.7% 9.1%
Please indicate how often you provided demonstrations or modeled for other teachers at your school this school year?
Not at all 0.0% 0.0% 9.1% Very useful 93.8% 83.3% 60.0%
Somewhat useful 6.3% 16.7% 30.0% How useful you think providing demonstrations or modeling for other teachers is in improving literacy practice in your school? Neutral 0.0% 0.0% 10.0%
Very satisfied 25.0% 16.7% 45.5% Somewhat satisfied 25.0% 83.3% 36.4%
Somewhat unsatisfied 31.3% 0.0% 18.2%
How satisfied are you with the level of support your school has received from Cornerstone in training you so that you can effectively coach other teachers? Very unsatisfied 18.8% 0.0% 0.0%
Results from the survey administered to the Cornerstone coaches45 show that overall, about
a third of the coaches in each phase reported they were providing demonstration lessons/modeling
lessons for other teachers on a daily basis. The percentage of coaches who reported the frequency as
once or twice a week increased across the phases, with the exception of Phase III, where some
coaches reported they were providing no demonstration lessons or had done them only once or
twice a year (some coaches did not have release teachers). Across all three phases, an overwhelming
majority of coaches reported that they found the provision of demonstrations/modeling for other
teachers useful in improving the literacy practice in their school.
However, not all coaches were totally satisfied with the level of Cornerstone support, in
terms of being prepared to effectively coach other teachers. In Phase I, about half the coaches were
satisfied with the support from Cornerstone and half were not. In general, Phase II coaches were
satisfied with the levels of support they received. In Phase III schools, while the majority of the
coaches were satisfied; almost 20% were not. The difference among phases may be a result of less
frequent hands-on contact from Cornerstone in Phase I, as schools themselves are expected to
assume increasing responsibility for implementing the initiative. Another possible explanation is that
Phase I schools started when Cornerstone was in the process of developing many of the coaching
procedures and guidelines they now have in place. The next section examines the K-3 teachers’
perceptions of Cornerstone coach activities.
45 All Phase I coaches responded to our survey, two out of eight of the coaches in Phase II did not respond to our survey and one Phase III coach did not respond to our survey
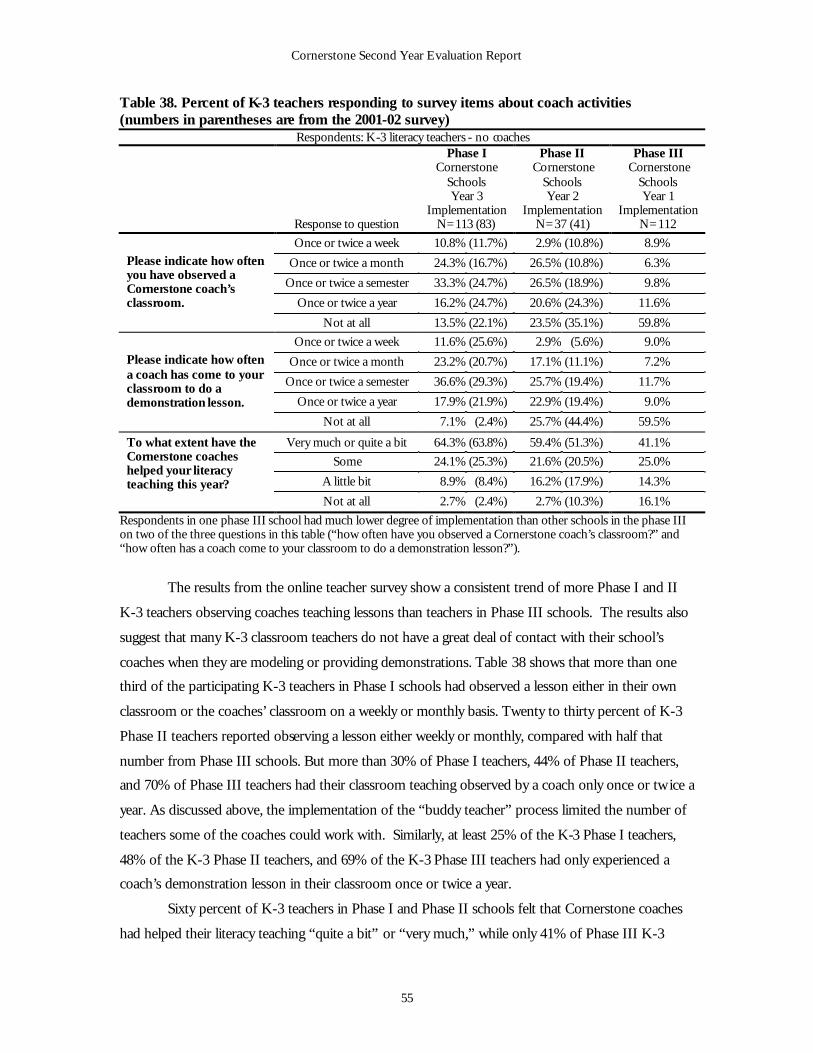
Cornerstone Second Year Evaluation Report
55
Table 38. Percent of K-3 teachers responding to survey items about coach activities (numbers in parentheses are from the 2001-02 survey)
Respondents: K-3 literacy teachers - no coaches
Response to question
Phase I Cornerstone
Schools Year 3
Implementation N=113 (83)
Phase II Cornerstone
Schools Year 2
Implementation N=37 (41)
Phase III Cornerstone
Schools Year 1
Implementation N=112
Once or twice a week 10.8% (11.7%) 2.9% (10.8%) 8.9%
Once or twice a month 24.3% (16.7%) 26.5% (10.8%) 6.3%
Once or twice a semester 33.3% (24.7%) 26.5% (18.9%) 9.8%
Once or twice a year 16.2% (24.7%) 20.6% (24.3%) 11.6%
Please indicate how often you have observed a Cornerstone coach’s classroom.
Not at all 13.5% (22.1%) 23.5% (35.1%) 59.8%
Once or twice a week 11.6% (25.6%) 2.9% (5.6%) 9.0%
Once or twice a month 23.2% (20.7%) 17.1% (11.1%) 7.2%
Once or twice a semester 36.6% (29.3%) 25.7% (19.4%) 11.7%
Once or twice a year 17.9% (21.9%) 22.9% (19.4%) 9.0%
Please indicate how often a coach has come to your classroom to do a demonstration lesson.
Not at all 7.1% (2.4%) 25.7% (44.4%) 59.5%
Very much or quite a bit 64.3% (63.8%) 59.4% (51.3%) 41.1%
Some 24.1% (25.3%) 21.6% (20.5%) 25.0%
A little bit 8.9% (8.4%) 16.2% (17.9%) 14.3%
To what extent have the Cornerstone coaches helped your literacy teaching this year? Not at all 2.7% (2.4%) 2.7% (10.3%) 16.1%
Respondents in one phase III school had much lower degree of implementation than other schools in the phase III on two of the three questions in this table (“how often have you observed a Cornerstone coach’s classroom?” and “how often has a coach come to your classroom to do a demonstration lesson?”).
The results from the online teacher survey show a consistent trend of more Phase I and II
K-3 teachers observing coaches teaching lessons than teachers in Phase III schools. The results also
suggest that many K-3 classroom teachers do not have a great deal of contact with their school’s
coaches when they are modeling or providing demonstrations. Table 38 shows that more than one
third of the participating K-3 teachers in Phase I schools had observed a lesson either in their own
classroom or the coaches’ classroom on a weekly or monthly basis. Twenty to thirty percent of K-3
Phase II teachers reported observing a lesson either weekly or monthly, compared with half that
number from Phase III schools. But more than 30% of Phase I teachers, 44% of Phase II teachers,
and 70% of Phase III teachers had their classroom teaching observed by a coach only once or tw ice a
year. As discussed above, the implementation of the “buddy teacher” process limited the number of
teachers some of the coaches could work with. Similarly, at least 25% of the K-3 Phase I teachers,
48% of the K-3 Phase II teachers, and 69% of the K-3 Phase III teachers had only experienced a
coach’s demonstration lesson in their classroom once or twice a year.
Sixty percent of K-3 teachers in Phase I and Phase II schools felt that Cornerstone coaches
had helped their literacy teaching “quite a bit” or “very much,” while only 41% of Phase III K-3
Cornerstone Second Year Evaluation Report
56
teachers responded similarly. The differences among phases are probably related to how long the
schools have been implementing Cornerstone. Site team members reported that during a school’s
first year, it is often difficult to coordinate schedules to free up coaches for demonstration lessons.
Also, because the coaches themselves are often learning the techniques they need to teach during the
first year, some report that they do not feel ready to model for other teachers until they get more
comfortable with the strategies.
Professional Learning Summary
Professional learning experiences for Cornerstone participants are offered in multiple
formats, ranging from direct support from Cornerstone staff for site team members and school staff
to those opportunities provided within schools by coaches and critical friends. Interview and survey
data indicate that overall, these experiences are valued by site team members and teaching staff as
being useful for understanding and advancing the implementation of Cornerstone strategies in
classrooms. In evaluating direct support from Cornerstone, participants, particularly those in Phase I
and II schools, felt that Cornerstone meetings, staff visits, participating in school reviews and
videoconferencing were very helpful to maintaining momentum and advancing Cornerstone
practices. Phase III respondents were less enthusiastic about these opportunities, but, as indicated by
the first year evaluation, increasing familiarity with Cornerstone seems to enhance their perceived
usefulness. Schoolwide professional learning activities such as leadership teams, asset mapping, book
study groups, school reviews and demonstration lessons were also perceived to be most useful in
schools that had the most experience with Cornerstone. An exception to these findings was in coach
satisfaction with the level of support received from Cornerstone specifically geared towards coaching
other teachers.
Parent Involvement
Defined as critical in The Cornerstone Initiative, parent and community engagement is
another core element in helping schools to meet Cornerstone literacy goals. To increase such
engagement, Cornerstone developed a process through which schools submit proposals for parent
involvement activities, and are awarded grants of $5,000 to carry them out.
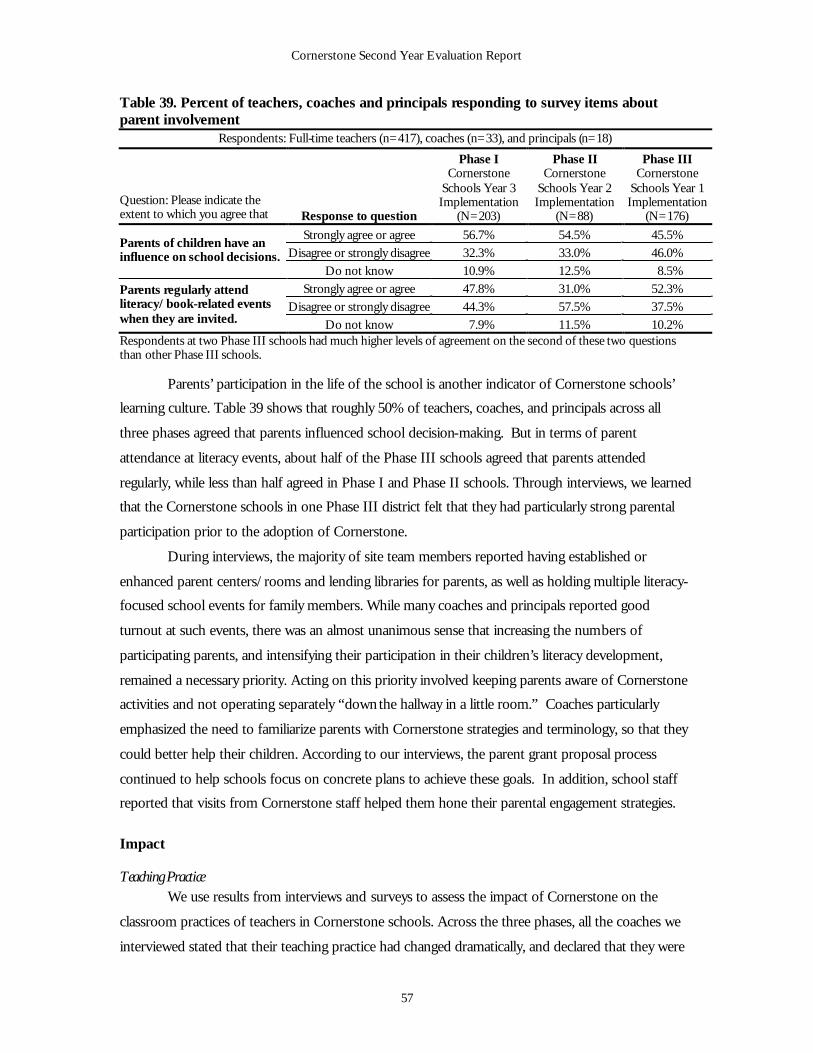
Cornerstone Second Year Evaluation Report
57
Table 39. Percent of teachers, coaches and principals responding to survey items about parent involvement
Respondents: Full-time teachers (n=417), coaches (n=33), and principals (n=18)
Question: Please indicate the extent to which you agree that Response to question
Phase I Cornerstone
Schools Year 3 Implementation
(N=203)
Phase II Cornerstone
Schools Year 2 Implementation
(N=88)
Phase III Cornerstone
Schools Year 1 Implementation
(N=176)
Strongly agree or agree 56.7% 54.5% 45.5% Disagree or strongly disagree 32.3% 33.0% 46.0%
Parents of children have an influence on school decisions.
Do not know 10.9% 12.5% 8.5% Strongly agree or agree 47.8% 31.0% 52.3%
Disagree or strongly disagree 44.3% 57.5% 37.5% Parents regularly attend literacy/book-related events when they are invited. Do not know 7.9% 11.5% 10.2% Respondents at two Phase III schools had much higher levels of agreement on the second of these two questions than other Phase III schools.
Parents’ participation in the life of the school is another indicator of Cornerstone schools’
learning culture. Table 39 shows that roughly 50% of teachers, coaches, and principals across all
three phases agreed that parents influenced school decision-making. But in terms of parent
attendance at literacy events, about half of the Phase III schools agreed that parents attended
regularly, while less than half agreed in Phase I and Phase II schools. Through interviews, we learned
that the Cornerstone schools in one Phase III district felt that they had particularly strong parental
participation prior to the adoption of Cornerstone.
During interviews, the majority of site team members reported having established or
enhanced parent centers/rooms and lending libraries for parents, as well as holding multiple literacy-
focused school events for family members. While many coaches and principals reported good
turnout at such events, there was an almost unanimous sense that increasing the numbers of
participating parents, and intensifying their participation in their children’s literacy development,
remained a necessary priority. Acting on this priority involved keeping parents aware of Cornerstone
activities and not operating separately “down the hallway in a little room.” Coaches particularly
emphasized the need to familiarize parents with Cornerstone strategies and terminology, so that they
could better help their children. According to our interviews, the parent grant proposal process
continued to help schools focus on concrete plans to achieve these goals. In addition, school staff
reported that visits from Cornerstone staff helped them hone their parental engagement strategies.
Impact
Teaching Practice We use results from interviews and surveys to assess the impact of Cornerstone on the
classroom practices of teachers in Cornerstone schools. Across the three phases, all the coaches we
interviewed stated that their teaching practice had changed dramatically, and declared that they were
Cornerstone Second Year Evaluation Report
58
“never going back to the old way of teaching.” Coaches described their instructional methods as less
teacher-centered, and indicated that their teaching practices since Cornerstone involved an increase
in modeling for students, asking students deeper questions, and more strategic planning for lessons.
Coaches described changes in how they thought about their teaching. A Phase III coach described,
“It has definitely changed my practice, because while I have always been a reflective teacher, I’m
more so. Cornerstone has helped me strive to better my practice.” Coaches also reported about the
ways in which their changed thinking is being translated into the classroom activities they used to
improve student learning. “I understand the importance of giving kids a lot more time to read and a
lot more time to do free writing. And I do more conferencing with kids than I used to” (a Phase I
coach).
Coaches in the Phase I schools reported that many K-3 teachers have incorporated
Cornerstone elements into their teaching practices. These changes were evident in both classroom
organization and teaching strategies. In the words of one coach, “I’ve seen many teachers in our
building change the environment of their classrooms. Teachers now typically have their children’s
desks in groups. People didn’t normally have rugs or library areas.” Another coach described the
change she saw in colleagues’ teaching practice: “Teachers in the past tended to focus more on
surface structure…now teachers are getting into deep structures…they understand now that the two
systems are taught simultaneously and not separately.” Another coach reported that teachers were
realizing that students do not need to be told everything and that “modeling has become a big thing
in the kindergarten and first grades.”
In the Phase II schools, coaches report an increase in teachers’ use of Cornerstone strategies.
Coaches indicate that teachers are using more Cornerstone literacy strategies and relying less on basal
books and worksheets. One coach described the impact as, “When I look around the classroom, I
see writing, writing, writing.” Another described the use of Cornerstone practices. “I think the
majority of teachers are tuned into the Cornerstone concept. They have a better understanding than
last year. I’d say about 80% are practicing it. And more are coming on board…It’s more than last
year, so it’s got to be working.” Another coach though noted the tensions teachers experienced
between Cornerstone strategies and their previous teaching practices. “I think most teachers are
trying to use the strategies, but I think that most teachers like to use the basal readers, too.”
Phase III coaches, in the first year of implementation, reported that the largest effect of
Cornerstone was on the classroom environments of the K-3 teachers. One coach reported the efforts
she and another teacher made in changing the environment. “We stayed on a Friday night until 6
o’clock rearranging [another teacher’s] room.” Another coach described how, “I sat down and
ordered chairs and carpets for teachers” to help change their classroom environments. Coaches in
Phase III schools did not perceive as many overall changes in teaching practice, which is probably
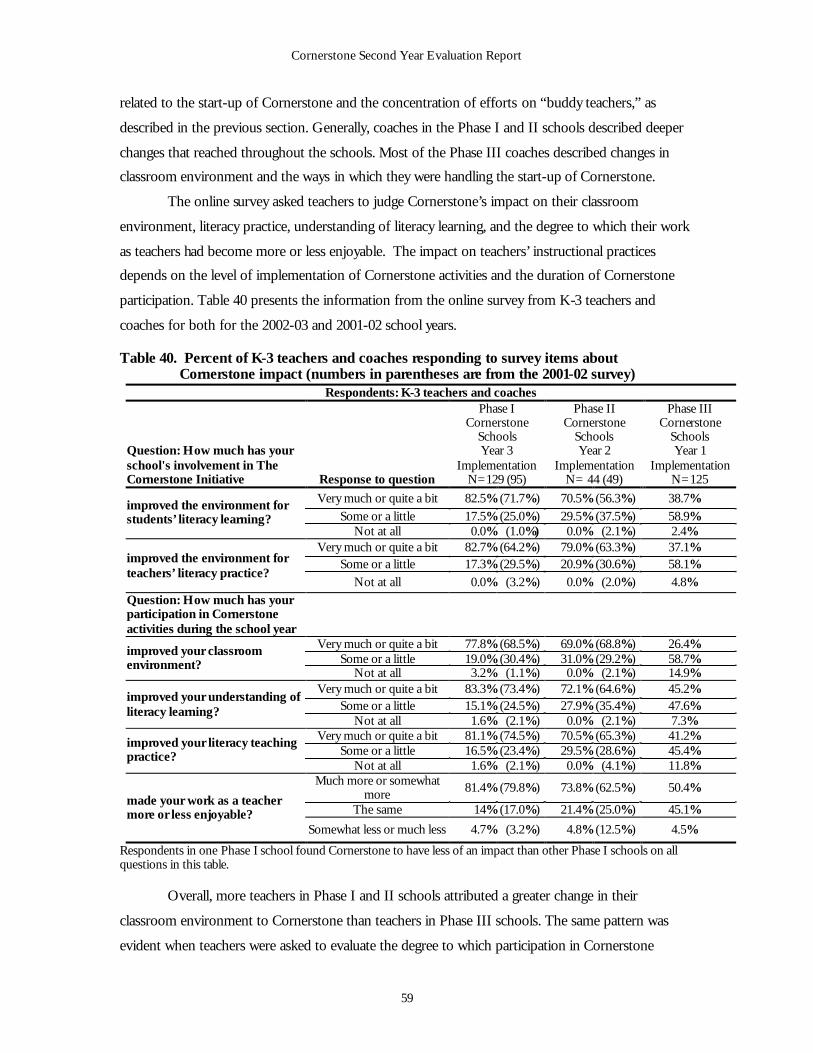
Cornerstone Second Year Evaluation Report
59
related to the start-up of Cornerstone and the concentration of efforts on “buddy teachers,” as
described in the previous section. Generally, coaches in the Phase I and II schools described deeper
changes that reached throughout the schools. Most of the Phase III coaches described changes in
classroom environment and the ways in which they were handling the start-up of Cornerstone.
The online survey asked teachers to judge Cornerstone’s impact on their classroom
environment, literacy practice, understanding of literacy learning, and the degree to which their work
as teachers had become more or less enjoyable. The impact on teachers’ instructional practices
depends on the level of implementation of Cornerstone activities and the duration of Cornerstone
participation. Table 40 presents the information from the online survey from K-3 teachers and
coaches for both for the 2002-03 and 2001-02 school years.
Table 40. Percent of K-3 teachers and coaches responding to survey items about Cornerstone impact (numbers in parentheses are from the 2001-02 survey)
Respondents: K-3 teachers and coaches Question: How much has your school's involvement in The Cornerstone Initiative Response to question
Phase I Cornerstone
Schools Year 3
Implementation N=129 (95)
Phase II Cornerstone
Schools Year 2
Implementation N= 44 (49)
Phase III Cornerstone
Schools Year 1
Implementation N=125
Very much or quite a bit 82.5% (71.7%) 70.5% (56.3%) 38.7% Some or a little 17.5% (25.0%) 29.5% (37.5%) 58.9%
improved the environment for students’ literacy learning?
Not at all 0.0% (1.0%) 0.0% (2.1%) 2.4% Very much or quite a bit 82.7% (64.2%) 79.0% (63.3%) 37.1%
Some or a little 17.3% (29.5%) 20.9% (30.6%) 58.1% improved the environment for teachers’ literacy practice?
Not at all 0.0% (3.2%) 0.0% (2.0%) 4.8% Question: How much has your participation in Cornerstone activities during the school year
Very much or quite a bit 77.8% (68.5%) 69.0% (68.8%) 26.4% Some or a little 19.0% (30.4%) 31.0% (29.2%) 58.7%
improved your classroom environment?
Not at all 3.2% (1.1%) 0.0% (2.1%) 14.9% Very much or quite a bit 83.3% (73.4%) 72.1% (64.6%) 45.2%
Some or a little 15.1% (24.5%) 27.9% (35.4%) 47.6% improved your understanding of literacy learning?
Not at all 1.6% (2.1%) 0.0% (2.1%) 7.3% Very much or quite a bit 81.1% (74.5%) 70.5% (65.3%) 41.2%
Some or a little 16.5% (23.4%) 29.5% (28.6%) 45.4% improved your literacy teaching practice?
Not at all 1.6% (2.1%) 0.0% (4.1%) 11.8% Much more or somewhat
more 81.4% (79.8%) 73.8% (62.5%) 50.4%
The same 14% (17.0%) 21.4% (25.0%) 45.1% made your work as a teacher more or less enjoyable?
Somewhat less or much less 4.7% (3.2%) 4.8% (12.5%) 4.5%
Respondents in one Phase I school found Cornerstone to have less of an impact than other Phase I schools on all questions in this table.
Overall, more teachers in Phase I and II schools attributed a greater change in their
classroom environment to Cornerstone than teachers in Phase III schools. The same pattern was
evident when teachers were asked to evaluate the degree to which participation in Cornerstone
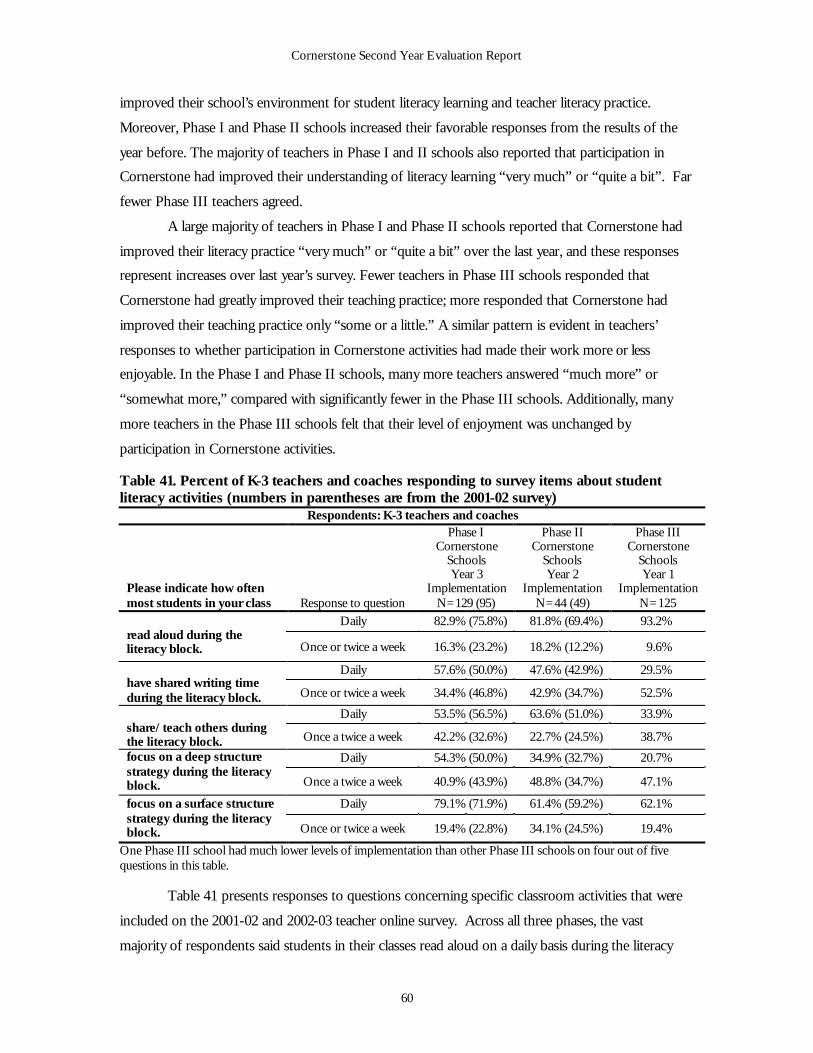
Cornerstone Second Year Evaluation Report
60
improved their school’s environment for student literacy learning and teacher literacy practice.
Moreover, Phase I and Phase II schools increased their favorable responses from the results of the
year before. The majority of teachers in Phase I and II schools also reported that participation in
Cornerstone had improved their understanding of literacy learning “very much” or “quite a bit”. Far
fewer Phase III teachers agreed.
A large majority of teachers in Phase I and Phase II schools reported that Cornerstone had
improved their literacy practice “very much” or “quite a bit” over the last year, and these responses
represent increases over last year’s survey. Fewer teachers in Phase III schools responded that
Cornerstone had greatly improved their teaching practice; more responded that Cornerstone had
improved their teaching practice only “some or a little.” A similar pattern is evident in teachers’
responses to whether participation in Cornerstone activities had made their work more or less
enjoyable. In the Phase I and Phase II schools, many more teachers answered “much more” or
“somewhat more,” compared with significantly fewer in the Phase III schools. Additionally, many
more teachers in the Phase III schools felt that their level of enjoyment was unchanged by
participation in Cornerstone activities.
Table 41. Percent of K-3 teachers and coaches responding to survey items about student literacy activities (numbers in parentheses are from the 2001-02 survey)
Respondents: K-3 teachers and coaches Please indicate how often most students in your class Response to question
Phase I Cornerstone
Schools Year 3
Implementation N=129 (95)
Phase II Cornerstone
Schools Year 2
Implementation N=44 (49)
Phase III Cornerstone
Schools Year 1
Implementation N=125
Daily 82.9% (75.8%) 81.8% (69.4%) 93.2% read aloud during the literacy block. Once or twice a week 16.3% (23.2%) 18.2% (12.2%) 9.6%
Daily 57.6% (50.0%) 47.6% (42.9%) 29.5% have shared writing time during the literacy block. Once or twice a week 34.4% (46.8%) 42.9% (34.7%) 52.5%
Daily 53.5% (56.5%) 63.6% (51.0%) 33.9% share/teach others during the literacy block. Once a twice a week 42.2% (32.6%) 22.7% (24.5%) 38.7%
Daily 54.3% (50.0%) 34.9% (32.7%) 20.7% focus on a deep structure strategy during the literacy block. Once a twice a week 40.9% (43.9%) 48.8% (34.7%) 47.1%
Daily 79.1% (71.9%) 61.4% (59.2%) 62.1% focus on a surface structure strategy during the literacy block. Once or twice a week 19.4% (22.8%) 34.1% (24.5%) 19.4%
One Phase III school had much lower levels of implementation than other Phase III schools on four out of five questions in this table.
Table 41 presents responses to questions concerning specific classroom activities that were
included on the 2001-02 and 2002-03 teacher online survey. Across all three phases, the vast
majority of respondents said students in their classes read aloud on a daily basis during the literacy
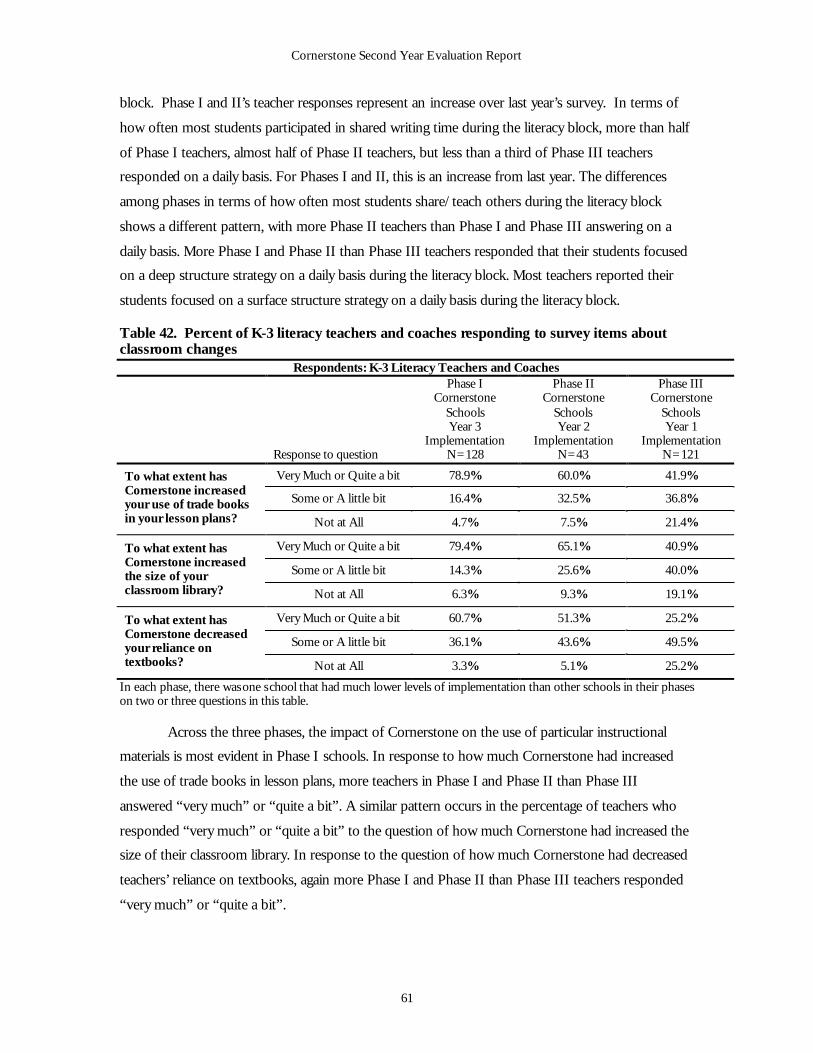
Cornerstone Second Year Evaluation Report
61
block. Phase I and II’s teacher responses represent an increase over last year’s survey. In terms of
how often most students participated in shared writing time during the literacy block, more than half
of Phase I teachers, almost half of Phase II teachers, but less than a third of Phase III teachers
responded on a daily basis. For Phases I and II, this is an increase from last year. The differences
among phases in terms of how often most students share/teach others during the literacy block
shows a different pattern, with more Phase II teachers than Phase I and Phase III answering on a
daily basis. More Phase I and Phase II than Phase III teachers responded that their students focused
on a deep structure strategy on a daily basis during the literacy block. Most teachers reported their
students focused on a surface structure strategy on a daily basis during the literacy block.
Table 42. Percent of K-3 literacy teachers and coaches responding to survey items about classroom changes
In each phase, there was one school that had much lower levels of implementation than other schools in their phases on two or three questions in this table.
Across the three phases, the impact of Cornerstone on the use of particular instructional
materials is most evident in Phase I schools. In response to how much Cornerstone had increased
the use of trade books in lesson plans, more teachers in Phase I and Phase II than Phase III
answered “very much” or “quite a bit”. A similar pattern occurs in the percentage of teachers who
responded “very much” or “quite a bit” to the question of how much Cornerstone had increased the
size of their classroom library. In response to the question of how much Cornerstone had decreased
teachers’ reliance on textbooks, again more Phase I and Phase II than Phase III teachers responded
“very much” or “quite a bit”.
Respondents: K-3 Literacy Teachers and Coaches
Response to question
Phase I Cornerstone
Schools Year 3
Implementation N=128
Phase II Cornerstone
Schools Year 2
Implementation N=43
Phase III Cornerstone
Schools Year 1
Implementation N=121
Very Much or Quite a bit 78.9% 60.0% 41.9%
Some or A little bit 16.4% 32.5% 36.8%
To what extent has Cornerstone increased your use of trade books in your lesson plans? Not at All 4.7% 7.5% 21.4%
Very Much or Quite a bit 79.4% 65.1% 40.9%
Some or A little bit 14.3% 25.6% 40.0%
To what extent has Cornerstone increased the size of your classroom library? Not at All 6.3% 9.3% 19.1%
Very Much or Quite a bit 60.7% 51.3% 25.2%
Some or A little bit 36.1% 43.6% 49.5%
To what extent has Cornerstone decreased your reliance on textbooks? Not at All 3.3% 5.1% 25.2%
Cornerstone Second Year Evaluation Report
62
The responses to survey questions dealing with classroom activities suggest a pattern of
implementation growth over the years of Cornerstone’s work in the school. Firstly, the surveys
record an increase for Phase I and II schools over last year’s reported implementation levels in
almost all areas of instruction. Secondly, the surveys record a higher level of implementation in Phase
I than in Phase II and Phase III. This pattern suggests that Cornerstone impact takes a number of
years, but that in general there has been a steady amplification of Cornerstone implementation over
the multiple years of the initiative.
Teaching Practice Impact Summary The most prominent impact The Cornerstone Initiative has had on participating schools is
its impact on the teaching practice of K-3 literacy teachers, evident through the gradual but
substantial changes in their practice since the implementation of Cornerstone. Interview results
reveal that there has been a steady increase in how much Cornerstone has changed K-3 literacy
teachers’ teaching practice. Coaches and principals report that teachers in the Phase III schools
improved their classroom environment this year, while teachers in the Phase II schools began to
incorporate some Cornerstone strategies relying less on basal books and worksheets. Teachers in
Phase I schools have incorporated a great deal of Cornerstone strategies such as modeling and deep
structure in their practice. Our on-line teacher survey results substantiate the interview findings that
there has been a consistent growth and intensification of implementation, across time and across
phases, in terms of the improvement of the school environment, the change in student activities
during literacy class, and the impact on the practice of K-3 teachers.
Students’ Literacy Growth Almost all the coaches indicated that they had seen changes in student literacy since the
beginning of their school's participation in Cornerstone. Many reported that students were
developing a genuine love of reading. One coach said, “I am seeing that the kids are more interested
in reading and enjoy reading more. I have heard one teacher say the kids are choosing to take books
at recess time and taking books home with them more than they did before.” Coaches also indicated
that students were becoming better critical thinkers and were able to express themselves more
fluently, both verbally and in writing. A Phase II coach described the change in student literacy by
saying, “I can see a world of difference in the children…They are so knowledgeable about authors
and they love to write their own books. They like to read!” A Phase III coach also noted how the
difference was noticeable to others. “I’ve had so many parents come up and say, ‘I love this. He
comes home and he is reading every night. He wants to read.” Referring to students in other
teachers’ classes, coaches noted differences in literacy skills related to the teaching. One coach stated,
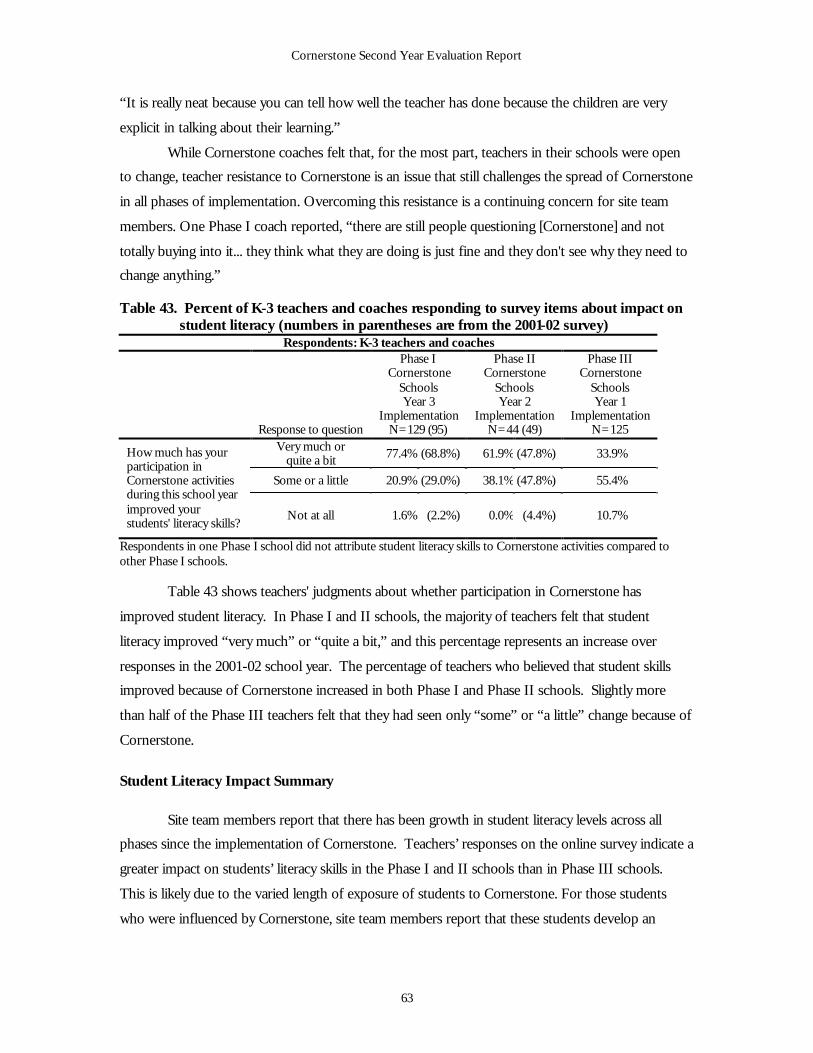
Cornerstone Second Year Evaluation Report
63
“It is really neat because you can tell how well the teacher has done because the children are very
explicit in talking about their learning.”
While Cornerstone coaches felt that, for the most part, teachers in their schools were open
to change, teacher resistance to Cornerstone is an issue that still challenges the spread of Cornerstone
in all phases of implementation. Overcoming this resistance is a continuing concern for site team
members. One Phase I coach reported, “there are still people questioning [Cornerstone] and not
totally buying into it... they think what they are doing is just fine and they don't see why they need to
change anything.”
Table 43. Percent of K-3 teachers and coaches responding to survey items about impact on student literacy (numbers in parentheses are from the 2001-02 survey)
Respondents: K-3 teachers and coaches
Response to question
Phase I Cornerstone
Schools Year 3
Implementation N=129 (95)
Phase II Cornerstone
Schools Year 2
Implementation N=44 (49)
Phase III Cornerstone
Schools Year 1
Implementation N=125
Very much or quite a bit 77.4% (68.8%) 61.9% (47.8%) 33.9%
Some or a little 20.9% (29.0%) 38.1% (47.8%) 55.4%
How much has your participation in Cornerstone activities during this school year improved your students' literacy skills?
Not at all 1.6% (2.2%) 0.0% (4.4%) 10.7%
Respondents in one Phase I school did not attribute student literacy skills to Cornerstone activities compared to other Phase I schools.
Table 43 shows teachers' judgments about whether participation in Cornerstone has
improved student literacy. In Phase I and II schools, the majority of teachers felt that student
literacy improved “very much” or “quite a bit,” and this percentage represents an increase over
responses in the 2001-02 school year. The percentage of teachers who believed that student skills
improved because of Cornerstone increased in both Phase I and Phase II schools. Slightly more
than half of the Phase III teachers felt that they had seen only “some” or “a little” change because of
Cornerstone.
Student Literacy Impact Summary
Site team members report that there has been growth in student literacy levels across all
phases since the implementation of Cornerstone. Teachers’ responses on the online survey indicate a
greater impact on students’ literacy skills in the Phase I and II schools than in Phase III schools.
This is likely due to the varied length of exposure of students to Cornerstone. For those students
who were influenced by Cornerstone, site team members report that these students develop an
Cornerstone Second Year Evaluation Report
64
intense love of reading, an increased ability to express themselves both verbally and in writing, and
enhanced critical thinking skills.
Expansion and Sustainability One of the key long-term Cornerstone goals is to “scale up” its literacy model to the upper
grades of those participating schools whose organization extends beyond K-3 (14 of the 18 Phase I,
II, and III schools), as well as into other elementary schools within participating Cornerstone
districts. A related goal is to lay the groundwork for sustaining the Initiative in participating schools
and districts beyond the period of direct Cornerstone support. As with the first year evaluation,
interviews and surveys probed site team members’ views about the expansion of Cornerstone within
and beyond Cornerstone schools, and probed school plans for sustaining the initiative.
Scaling Up Within Schools The first year report highlighted several challenges to expanding Cornerstone into upper
grades including: limited resources, the press of standardized testing, traditionally entrenched faculty,
logistical issues, and staff turnover. Many of these issues remain obstacles to successful expansion,
and the spread to all grade levels has been uneven among schools, even among those schools w ithin
the same phase. In general, Cornerstone has spread to more teachers in schools in earlier than in
later phases, and expanded more among K-3 classrooms than into the upper grades. Coaches and
principals reported that Cornerstone has thus far had a greater impact on K-3 teachers.
In almost all schools, upper grade teachers were invited to participate in Cornerstone
activities. In interviews with fourth grade teachers, many said they had changed their teaching
practice as a result of the initiative. They reported that they ask students more questions, praise
students more, let students read independently during class, and model strategies while reading to
their students. Although Cornerstone coaches’ efforts were focused mainly on K-3 teachers, many
fourth grade teachers reported participating in book study groups, observing a coach’s work, or
having a coach come to their classroom to do a demonstration lesson. Some also discussed working
with Cornerstone staff during visits.
Fourth grade teachers who were interviewed in the Phase I and Phase II schools also noticed
differences in their students, especially in writing ability, as compared to previous years, and many
attributed these differences to Cornerstone practices in the lower grades. One fourth grade teacher
said, “My fourth graders came to me this year doing things my fifth graders couldn’t do midterm last
year. They are really blooming.” Another fourth grade teacher said, “You see more of the students
with a book in their hand.”
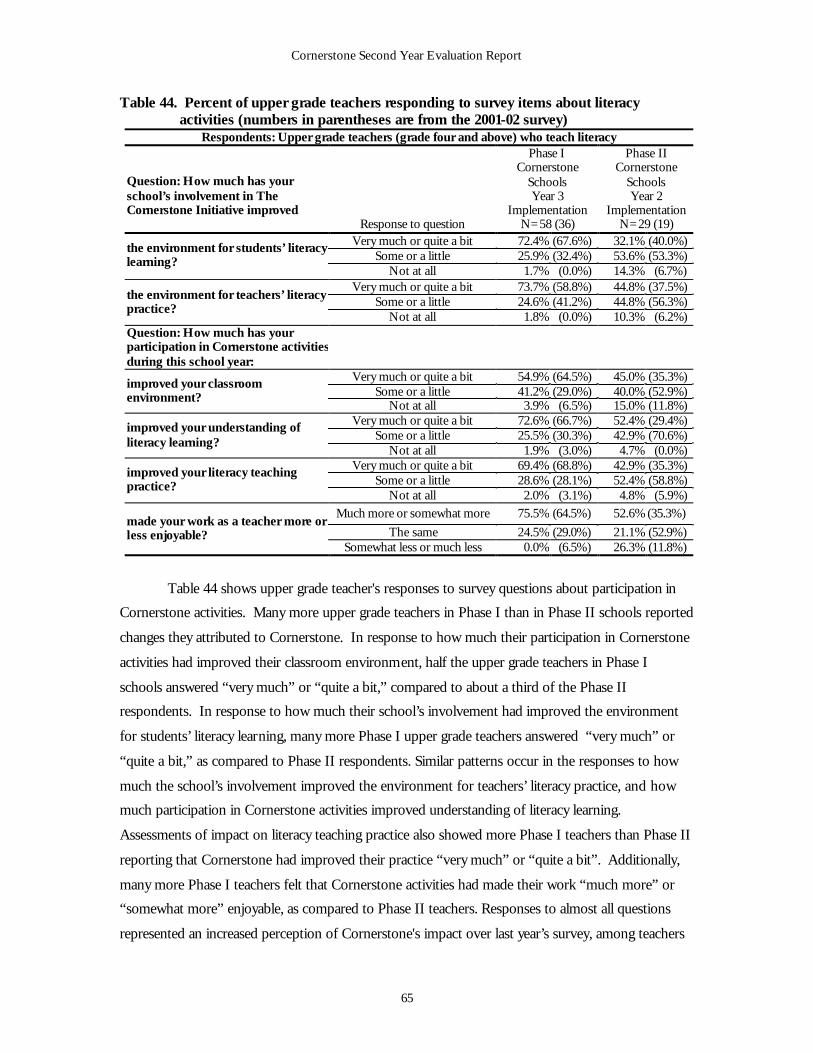
Cornerstone Second Year Evaluation Report
65
Table 44. Percent of upper grade teachers responding to survey items about literacy activities (numbers in parentheses are from the 2001-02 survey)
Respondents: Upper grade teachers (grade four and above) who teach literacy
Question: How much has your school’s involvement in The Cornerstone Initiative improved
Response to question
Phase I Cornerstone
Schools Year 3
Implementation N=58 (36)
Phase II Cornerstone
Schools Year 2
Implementation N=29 (19)
Very much or quite a bit 72.4% (67.6%) 32.1% (40.0%) Some or a little 25.9% (32.4%) 53.6% (53.3%)
the environment for students’ literacy learning?
Not at all 1.7% (0.0%) 14.3% (6.7%) Very much or quite a bit 73.7% (58.8%) 44.8% (37.5%)
Some or a little 24.6% (41.2%) 44.8% (56.3%) the environment for teachers’ literacy practice?
Not at all 1.8% (0.0%) 10.3% (6.2%) Question: How much has your participation in Cornerstone activities during this school year:
Very much or quite a bit 54.9% (64.5%) 45.0% (35.3%) Some or a little 41.2% (29.0%) 40.0% (52.9%)
improved your classroom environment?
Not at all 3.9% (6.5%) 15.0% (11.8%) Very much or quite a bit 72.6% (66.7%) 52.4% (29.4%)
Some or a little 25.5% (30.3%) 42.9% (70.6%) improved your understanding of literacy learning?
Not at all 1.9% (3.0%) 4.7% (0.0%) Very much or quite a bit 69.4% (68.8%) 42.9% (35.3%)
Some or a little 28.6% (28.1%) 52.4% (58.8%) improved your literacy teaching practice?
Not at all 2.0% (3.1%) 4.8% (5.9%) Much more or somewhat more 75.5% (64.5%) 52.6% (35.3%)
The same 24.5% (29.0%) 21.1% (52.9%) made your work as a teacher more or less enjoyable?
Somewhat less or much less 0.0% (6.5%) 26.3% (11.8%)
Table 44 shows upper grade teacher's responses to survey questions about participation in
Cornerstone activities. Many more upper grade teachers in Phase I than in Phase II schools reported
changes they attributed to Cornerstone. In response to how much their participation in Cornerstone
activities had improved their classroom environment, half the upper grade teachers in Phase I
schools answered “very much” or “quite a bit,” compared to about a third of the Phase II
respondents. In response to how much their school’s involvement had improved the environment
for students’ literacy learning, many more Phase I upper grade teachers answered “very much” or
“quite a bit,” as compared to Phase II respondents. Similar patterns occur in the responses to how
much the school’s involvement improved the environment for teachers’ literacy practice, and how
much participation in Cornerstone activities improved understanding of literacy learning.
Assessments of impact on literacy teaching practice also showed more Phase I teachers than Phase II
reporting that Cornerstone had improved their practice “very much” or “quite a bit”. Additionally,
many more Phase I teachers felt that Cornerstone activities had made their work “much more” or
“somewhat more” enjoyable, as compared to Phase II teachers. Responses to almost all questions
represented an increased perception of Cornerstone's impact over last year’s survey, among teachers
Cornerstone Second Year Evaluation Report
66
in both Phase I and Phase II schools. Participation in the initiative seems to have increased
awareness and change among upper grade teachers, depending on the duration of their involvement.
A continuing obstacle to expanding Cornerstone to upper grade teachers is the tendency to
perceive Cornerstone as primarily a lower grade initiative. A fourth grade teacher in a Phase I school
stated, “I think upper grade teachers are saying 'how does this relate to us? We are doing all these
[other] things already.’ They feel they don't have time to do [it].” Another obstacle in the upper
grades is the emphasis on standardized testing; upper grade teachers perceived that using
Cornerstone practices would detract from necessary test preparation. A fourth grade teacher stated,
“testing, testing, and testing. All we hear is testing…everyone is scared to do just about anything else
right now.” Finally, the departmentalized structure and scheduling of upper grade classes were
sometimes perceived as obstacles to using Cornerstone practices, and posed impediments to
participating in Cornerstone professional learning. Despite these obstacles, survey data suggests that
Cornerstone has made progress in reaching upper grade faculty within their schools.
Scaling Up Within Districts The spread of Cornerstone to other schools in participating districts depends on the
initiative of the district office personnel – particularly the district strategy manager and the
superintendent. They can help spread Cornerstone to other district schools by integrating
Cornerstone into district strategies, plans, and literacy frameworks; through networking; or through
districtwide professional development. Information about Cornerstone was also spread through
informal networks of principals and teachers, especially in the smaller districts. In some districts,
integrating Cornerstone was facilitated by its compatibility with other literacy strategies already in
place. A district strategy manager explained that because “Cornerstone in its philosophy is just best
practice,” it is very much “in synch” with the existing district literacy strategy and “not one layer on
top of another.” In other districts, literacy plans have been altered as a direct result of involvement
and exposure to Cornerstone. A Phase II district strategy manager reported: “We’ve redesigned the
entire language arts framework, so we’re implementing the Cornerstone framework with that, and
that will be in all the schools.”
Although the majority of comparison school personnel had heard of Cornerstone, generally,
the expansion of Cornerstone practices had not yet penetrated additional district schools. District
staff expressed their intention to spread Cornerstone to additional schools, but only a few had
concrete plans in place at the time of our interviews. Some strategies for spreading Cornerstone
included sister school arrangements, bringing faculty from other schools to see Cornerstone “lab
schools,” and inviting Cornerstone coaches to lead districtwide professional development.
Cornerstone Second Year Evaluation Report
67
Sustainability
Sustaining The Cornerstone Initiative beyond the period of funding and support is an
issue that districts and schools have variously dealt with during the initiative’s development. In
the first year of the evaluation, although site team members expressed anxiety about sustaining
Cornerstone beyond the period of project support, few had begun to develop sustainability
plans. Those plans that had been developed were formulated primarily in leadership teams in
Phase I schools. In schools that had begun to develop plans, the primary strategy outlined by site
team members was building capacity by expanding the coaching role to a larger number of
teachers who had worked with coaches and had gained some mastery of Cornerstone strategies.
However, coaching arrangements require release time for teachers, and thus call for additional
resources. According to interviews with district personnel, a lack of financial resources was the
primary concern as districts and schools contemplated preserving Cornerstone coaching and
professional learning arrangements.
Expansion and Sustainability Summary
The expansion of Cornerstone to upper grades has been uneven among the three phases, as
well as within each phase. In all phases, upper grade teachers in most schools had been invited to
participate in Cornerstone activities and professional development. But because of the amount of
time spent working with Cornerstone, there was more expansion of Cornerstone practices to upper
grades in the Phase I schools than in the Phase II schools, and much less (as would be expected) in
the Phase III schools. Comparison of the first and second year survey results indicates a growing
impact of Cornerstone on upper grade teachers’ teaching practices and classroom environment, as
well as on the contexts for students’ literacy learning. The spread of Cornerstone districtwide,
however, varies among different districts and is not consistent among the phases. In many districts
there has been increasing awareness and interest about the Initiative among other schools,
particularly in small districts. Yet, for the most part, very few districts have taken concrete steps to
spread Cornerstone practices.
Many challenges continue to hinder the expansion of The Cornerstone Initiative within the
school and the district. The challenges range from upper grade teachers’ perceptions of Cornerstone
as solely a K-3 initiative, to structural constrains like scheduling, the physical and psychological
separation of lower and upper grades, and the escalating pressure generated by standardized testing.
As some Phase I schools began to develop plans to sustain the Initiative beyond four years, a lack of
financial resources became the central concern.
Cornerstone Second Year Evaluation Report
68
CONCLUSION
Summary of Findings
This report assesses The Cornerstone Initiative’s implementation through its third year of
support for Phase I schools, midpoint support for Phase II schools, and the initial year of support
for Phase III schools. Our evaluation of the progress of the Cornerstone schools and The
Cornerstone Initiative is based on the results of the testing implemented by each district and by
Cornerstone, and the data from our interviews and surveys with site team members and Cornerstone
staff. Given that data, our evaluation summary is, at best, cautiously positive.
The district- and state-administered standardized test results in the Cornerstone schools
show mixed and inconclusive results. While some Cornerstone schools, as in Jackson, for example,
posted encouraging outcomes that suggest a clear program impact on participating students, results
in other districts demonstrated few overall positive trends, and varying degrees of progress. Many
schools show strong gains in some grades in some years, but those gains are rarely sustained. For
most Cornerstone districts, our analyses could not determine any strong patterns of test-score
growth.
The DRA results are more encouraging, if tentative, because of the small sample size. In
most Cornerstone schools, the percentage of students reading at or above the DRA benchmarks
increased across the 1st-3rd grade levels from 2001-02 to 2002-03. This pattern of growth over time
becomes stronger when the outcomes for those students who have remained in the Cornerstone
schools over both testing years (we call them “stable” students) are analyzed separately. We
characterize these results as encouraging because they suggest that the students most exposed to the
Cornerstone “treatment” demonstrate the most literacy growth, on the assessment instrument that,
in The Cornerstone Initiative’s judgment, closely measures those skills and capacities that
Cornerstone is designed to develop. We would be more encouraged by these outcomes if the DRA
administration had been more uniform across Cornerstone schools, and if a much larger number of
students had been tested in the sample.
Our analysis of interview and survey data revealed three patterns as schools attempt to
implement and expand Cornerstone's impact. First, although implementation is not consistent
within phases, site team members in Phase I schools reported a higher level of implementation than
their counterparts in Phase II and Phase III schools. This was true for K-3 teachers as well as for
upper grade teachers. Moreover, based on our surveys and interviews, Phase III schools, as
expected, had only begun to lay the foundation for the coming years of Cornerstone work. Second,
the Phase I and Phase II schools reported an intensified level of implementation in the 2002-03 year,
Cornerstone Second Year Evaluation Report
69
as opposed to the previous year’s efforts. Both these patterns suggest that after multiple years of
implementation, Cornerstone has increasingly affected change in teaching practices, school culture,
and site team member's perception of student literacy levels.
Next Steps
Survey and interview data indicate that Cornerstone practices are increasingly spreading
through the K-3 grades and in some cases the upper grades (especially at Phase I schools), and that
site team members are almost uniformly enthusiastic about the impact Cornerstone practices have on
students in their school. But as our previous discussion indicated, though the DRA results seem to
support the strong positive changes reported in our surveys and interviews, the standardized test
score results do not. What factors may be causing these dissonant findings?
First, a structural mismatch may be partly to blame. The Cornerstone model is based on
focused professional development for two teachers (the coaches), who are in turn expected to change
the practice of the other teachers in their schools by providing expert assistance during
demonstration lessons, modeling, and in book study groups. But how much the coaches have been
able to change the practice of their colleague K-3 teachers in each school varies considerably. In
some Cornerstone schools, most of the K-3 staff has been affected, and in other schools, only
particular K-3 teachers. Moreover, Cornerstone spread across the K-3 teacher continuum is not the
only important variable. The depth and intensity of the coach-teacher interaction also affects the
extent of change in teacher practice. But the Cornerstone schools’ standardized test score results are
not differentiated by teacher or classroom, and have no necessary relationship to Cornerstone’s
spread, depth or intensity of implementation. The testing results combine the scores of students
whose teachers consistently use Cornerstone strategies, and use them effectively, with the test scores
of students of teachers who do not use Cornerstone strategies, or use them sporadically or ineptly.
Thus the test score results may well be reflecting, and confounding, variations in Cornerstone
implementation in participating schools.
Another key issue is that the district-administered standardized tests, which vary across each
state and district, measure different literacy and language skills. Thus the results of one district’s tests
may have little or no relationship to the test results in another district, because the tests themselves
are so different. This may be one reason why there are no clear cross-district trends or patterns.
More important, the standardized tests in literacy and language that the Cornerstone districts
impose largely assess atomized skills – decoding, word recognition, short paragraph comprehension –
through decontextualized methods – fill in the blank, bubble in the right answer. The DRA
assessment is based on the kinds of reading that Cornerstone classes consistently encourage, and the
Cornerstone Second Year Evaluation Report
70
DRA analyzes the extent of student progress in text-based comprehension and analytical reading and
thinking skills. Thus it is not surprising that Cornerstone students demonstrate greater literacy
progress on the DRA; it is assessing what they are learning in the modes they are learning, as
appropriate assessment should.
A final structural issue that may help to explain the mismatch between Cornerstone’s
standardized test score results and the data from our surveys and interviews, as well as the DRA
outcomes, is the extent of student mobility in each Cornerstone district. The small numbers in our
multi-year sample of stable or continuing Cornerstone students suggests the extent of student loss
due to year-to-year mobility. Many students who are part of the Cornerstone program in one year
exit the school, or the district, in the following year. But within-year mobility may also be a problem
confounding the standardized test score results. Students who start the year in a Cornerstone
program may exit the school before the standardized testing date, usually in April. And many other
students may enter the school mid-year, or later, and experience only a very short period of
Cornerstone implementation before they are tested. Because district standardized test score results
do not control for within-year mobility, the scores of “treatment” students are confounded by the
scores of newcomer, non-treatment students.
We are developing a number of strategies to deal with these structural issues. We will
attempt to deal with variations in Cornerstone implementation by developing an implementation
index for each school, based on our survey and interview data. This index will allow us to analyze
the relationships between each Cornerstone school’s extent of implementation – strong, moderate
and weak, for example, using categories of spread, intensity and depth – and each Cornerstone
school’s standardized test score and DRA results. While this index will not capture the extent of
implementation variation within schools, it should help us differentiate successful Cornerstone
implementation and practice across schools. If the variation in that practice shows strong relationships
with both standardized testing and DRA outcomes, we will be able to specify the conditions under
which the Cornerstone program is more and less successful. We will also include measures of
mobility in our future analyses. We will use student-level data to assess mobility at each Cornerstone
school, and test the relationships between mobility rates, extent of implementation, and test score
results. We will also consider negotiating with The Cornerstone Initiative to standardize DRA
administration and to increase the size of the tested sample, to make the DRA results far more
robust and reliable.
Research on school reform has documented the difficulty of measuring "scaling up" efforts
beyond whether a reform succeeds in reaching increasing numbers of students and schools – a
simple definition of spread that does consider depth or intensity of implementation. As the Phase I
Cornerstone schools enter their final year of support, we will attempt to assess the depth, intensity

Cornerstone Second Year Evaluation Report
71
and embeddedness of The Cornerstone Initiative’s instructional principles and practices. Our efforts
may help to forecast the extent of sustainability of the initiative beyond the period of direct
Cornerstone support in each participating school and district.
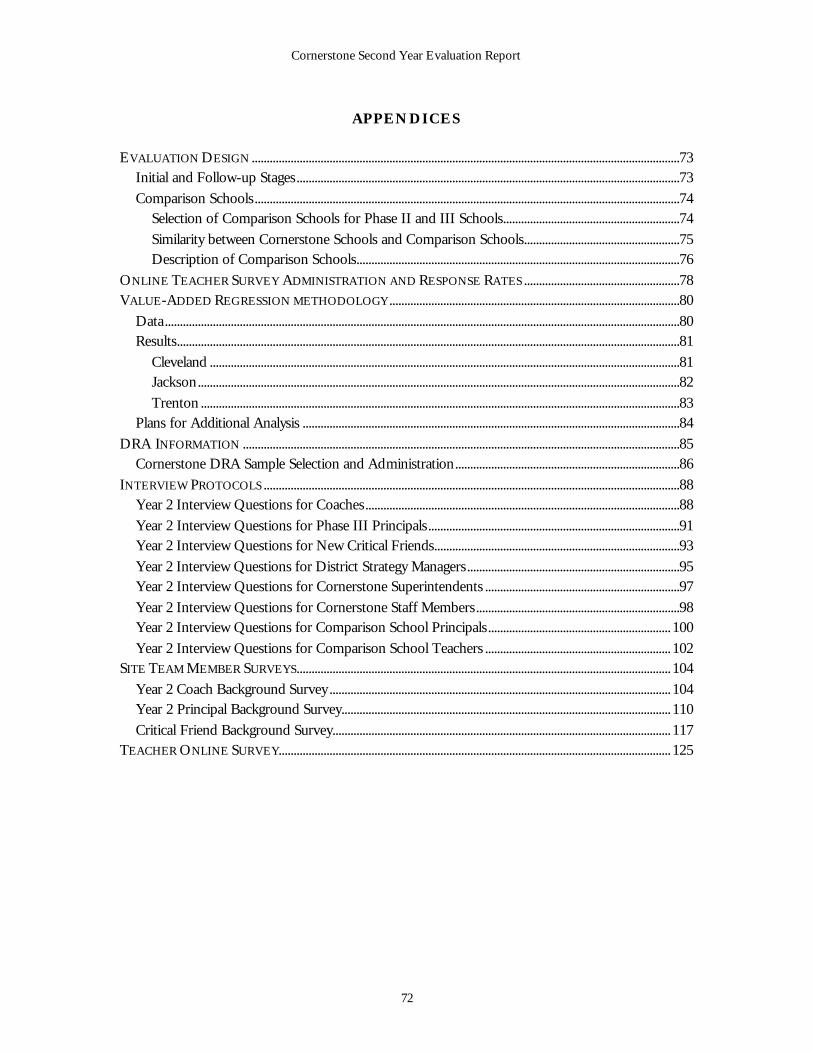
Cornerstone Second Year Evaluation Report
72
APPENDICES
EVALUATION DESIGN ...............................................................................................................................................73
Initial and Follow-up Stages................................................................................................................................73 Comparison Schools..............................................................................................................................................74
Selection of Comparison Schools for Phase II and III Schools...........................................................74 Similarity between Cornerstone Schools and Comparison Schools....................................................75 Description of Comparison Schools............................................................................................................76
ONLINE TEACHER SURVEY ADMINISTRATION AND RESPONSE RATES ....................................................78 VALUE-ADDED REGRESSION METHODOLOGY .................................................................................................80
Data............................................................................................................................................................................80 Results........................................................................................................................................................................81
Cleveland .............................................................................................................................................................81 Jackson.................................................................................................................................................................82 Trenton ................................................................................................................................................................83
Plans for Additional Analysis ..............................................................................................................................84 DRA INFORMATION ..................................................................................................................................................85
Cornerstone DRA Sample Selection and Administration...........................................................................86 INTERVIEW PROTOCOLS ...........................................................................................................................................88
Year 2 Interview Questions for Coaches.........................................................................................................88 Year 2 Interview Questions for Phase III Principals....................................................................................91 Year 2 Interview Questions for New Critical Friends..................................................................................93 Year 2 Interview Questions for District Strategy Managers.......................................................................95 Year 2 Interview Questions for Cornerstone Superintendents .................................................................97 Year 2 Interview Questions for Cornerstone Staff Members....................................................................98 Year 2 Interview Questions for Comparison School Principals............................................................. 100 Year 2 Interview Questions for Comparison School Teachers .............................................................. 102
SITE TEAM MEMBER SURVEYS............................................................................................................................. 104 Year 2 Coach Background Survey .................................................................................................................. 104 Year 2 Principal Background Survey.............................................................................................................. 110 Critical Friend Background Survey................................................................................................................. 117
TEACHER ONLINE SURVEY................................................................................................................................... 125
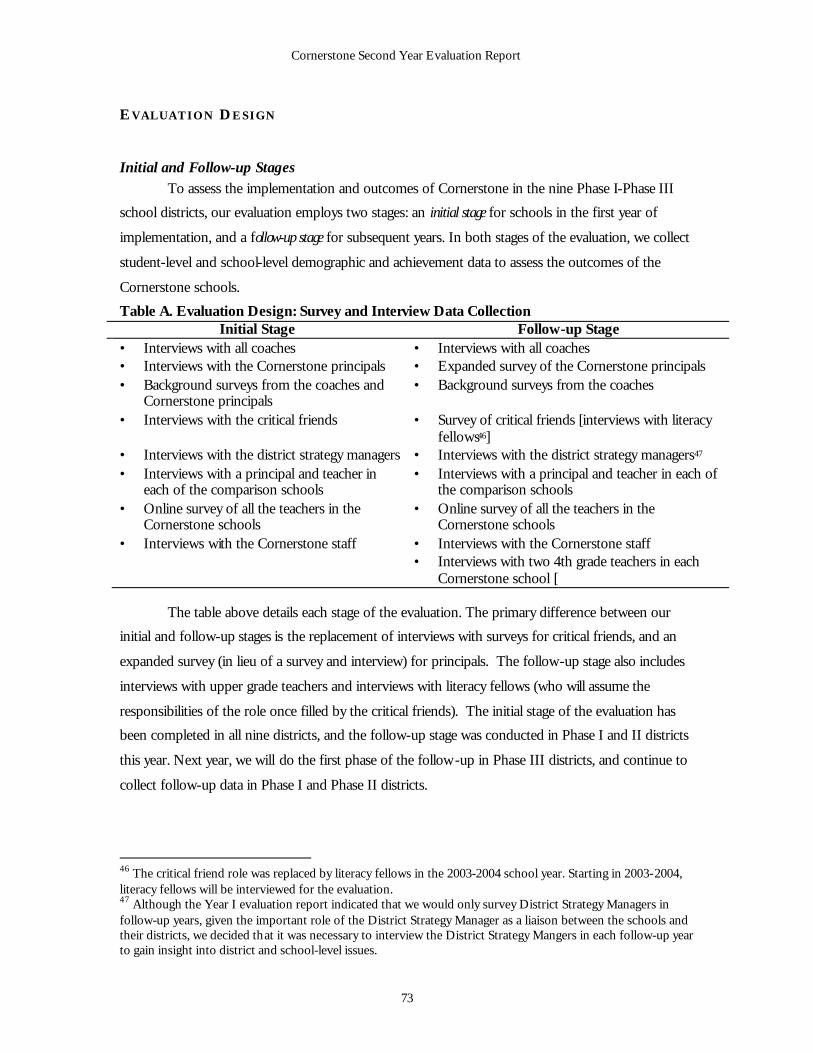
Cornerstone Second Year Evaluation Report
73
EVALUATION DESIGN
Initial and Follow-up Stages To assess the implementation and outcomes of Cornerstone in the nine Phase I-Phase III
school districts, our evaluation employs two stages: an initial stage for schools in the first year of
implementation, and a follow-up stage for subsequent years. In both stages of the evaluation, we collect
student-level and school-level demographic and achievement data to assess the outcomes of the
Cornerstone schools.
Table A. Evaluation Design: Survey and Interview Data Collection Initial Stage Follow-up Stage
• Interviews with all coaches • Interviews with all coaches • Interviews with the Cornerstone principals • Expanded survey of the Cornerstone principals • Background surveys from the coaches and
Cornerstone principals • Background surveys from the coaches
• Interviews with the critical friends • Survey of critical friends [interviews with literacy fellows46]
• Interviews with the district strategy managers • Interviews with the district strategy managers47 • Interviews with a principal and teacher in
each of the comparison schools • Interviews with a principal and teacher in each of
the comparison schools • Online survey of all the teachers in the
Cornerstone schools • Online survey of all the teachers in the
Cornerstone schools • Interviews with the Cornerstone staff • Interviews with the Cornerstone staff
• Interviews with two 4th grade teachers in each Cornerstone school [
The table above details each stage of the evaluation. The primary difference between our
initial and follow-up stages is the replacement of interviews with surveys for critical friends, and an
expanded survey (in lieu of a survey and interview) for principals. The follow-up stage also includes
interviews with upper grade teachers and interviews with literacy fellows (who will assume the
responsibilities of the role once filled by the critical friends). The initial stage of the evaluation has
been completed in all nine districts, and the follow-up stage was conducted in Phase I and II districts
this year. Next year, we will do the first phase of the follow-up in Phase III districts, and continue to
collect follow-up data in Phase I and Phase II districts.
46 The critical friend role was replaced by literacy fellows in the 2003-2004 school year. Starting in 2003-2004, literacy fellows will be interviewed for the evaluation. 47 Although the Year I evaluation report indicated that we would only survey District Strategy Managers in follow-up years, given the important role of the District Strategy Manager as a liaison between the schools and their districts, we decided that it was necessary to interview the District Strategy Mangers in each follow-up year to gain insight into district and school-level issues.
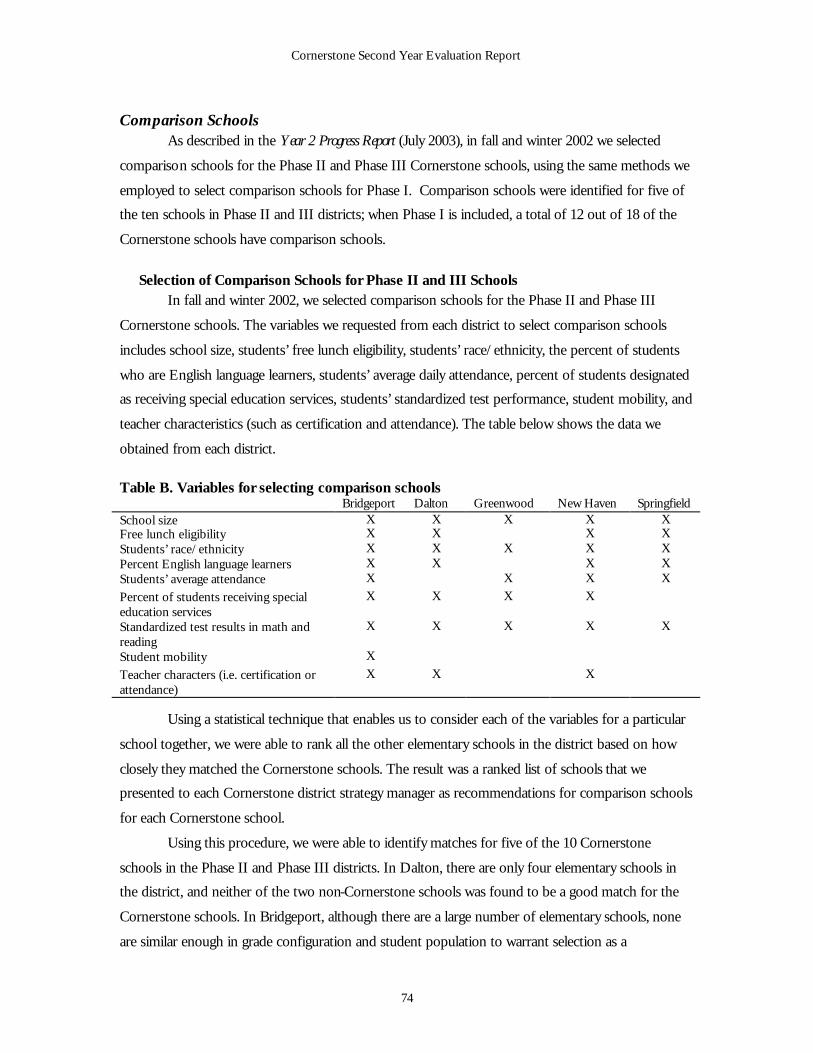
Cornerstone Second Year Evaluation Report
74
Comparison Schools As described in the Year 2 Progress Report (July 2003), in fall and winter 2002 we selected
comparison schools for the Phase II and Phase III Cornerstone schools, using the same methods we
employed to select comparison schools for Phase I. Comparison schools were identified for five of
the ten schools in Phase II and III districts; when Phase I is included, a total of 12 out of 18 of the
Cornerstone schools have comparison schools.
Selection of Comparison Schools for Phase II and III Schools In fall and winter 2002, we selected comparison schools for the Phase II and Phase III
Cornerstone schools. The variables we requested from each district to select comparison schools
includes school size, students’ free lunch eligibility, students’ race/ethnicity, the percent of students
who are English language learners, students’ average daily attendance, percent of students designated
as receiving special education services, students’ standardized test performance, student mobility, and
teacher characteristics (such as certification and attendance). The table below shows the data we
obtained from each district.
Table B. Variables for selecting comparison schools Bridgeport Dalton Greenwood New Haven Springfield School size X X X X X Free lunch eligibility X X X X Students’ race/ethnicity X X X X X Percent English language learners X X X X Students’ average attendance X X X X Percent of students receiving special education services
X X X X
Standardized test results in math and reading
X X X X X
Student mobility X Teacher characters (i.e. certification or attendance)
X X X
Using a statistical technique that enables us to consider each of the variables for a particular
school together, we were able to rank all the other elementary schools in the district based on how
closely they matched the Cornerstone schools. The result was a ranked list of schools that we
presented to each Cornerstone district strategy manager as recommendations for comparison schools
for each Cornerstone school.
Using this procedure, we were able to identify matches for five of the 10 Cornerstone
schools in the Phase II and Phase III districts. In Dalton, there are only four elementary schools in
the district, and neither of the two non-Cornerstone schools was found to be a good match for the
Cornerstone schools. In Bridgeport, although there are a large number of elementary schools, none
are similar enough in grade configuration and student population to warrant selection as a
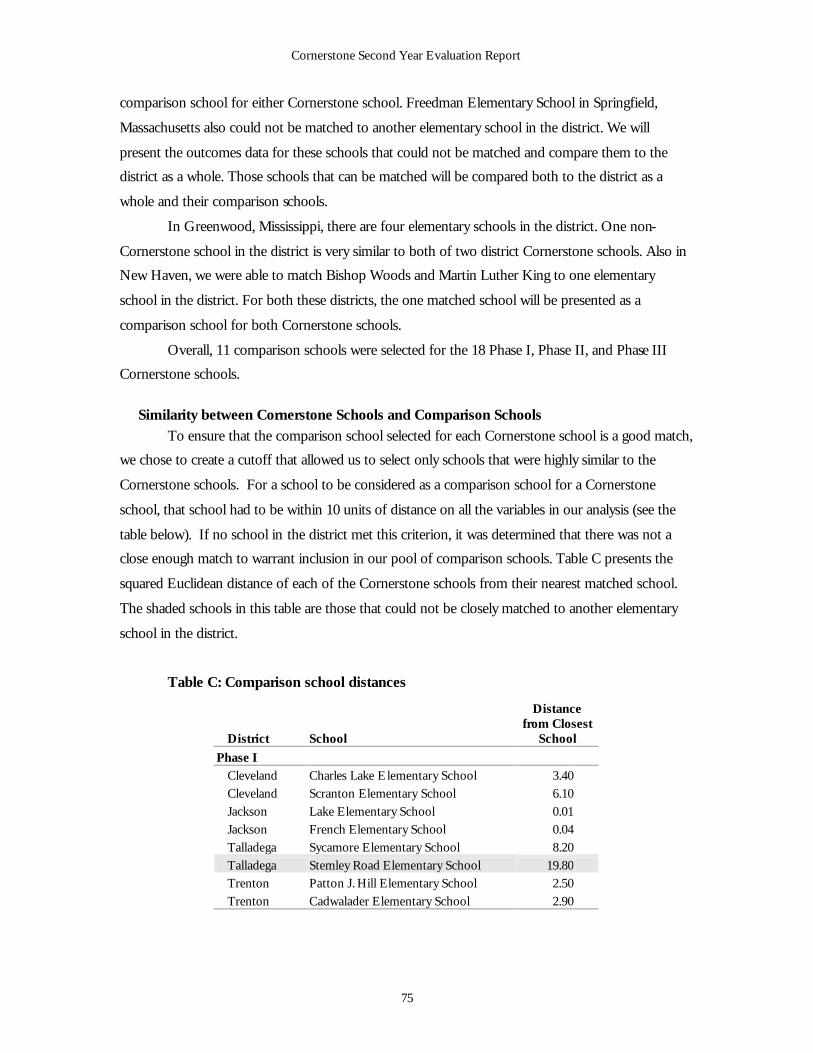
Cornerstone Second Year Evaluation Report
75
comparison school for either Cornerstone school. Freedman Elementary School in Springfield,
Massachusetts also could not be matched to another elementary school in the district. We will
present the outcomes data for these schools that could not be matched and compare them to the
district as a whole. Those schools that can be matched will be compared both to the district as a
whole and their comparison schools.
In Greenwood, Mississippi, there are four elementary schools in the district. One non-
Cornerstone school in the district is very similar to both of two district Cornerstone schools. Also in
New Haven, we were able to match Bishop Woods and Martin Luther King to one elementary
school in the district. For both these districts, the one matched school will be presented as a
comparison school for both Cornerstone schools.
Overall, 11 comparison schools were selected for the 18 Phase I, Phase II, and Phase III
Cornerstone schools.
Similarity between Cornerstone Schools and Comparison Schools To ensure that the comparison school selected for each Cornerstone school is a good match,
we chose to create a cutoff that allowed us to select only schools that were highly similar to the
Cornerstone schools. For a school to be considered as a comparison school for a Cornerstone
school, that school had to be within 10 units of distance on all the variables in our analysis (see the
table below). If no school in the district met this criterion, it was determined that there was not a
close enough match to warrant inclusion in our pool of comparison schools. Table C presents the
squared Euclidean distance of each of the Cornerstone schools from their nearest matched school.
The shaded schools in this table are those that could not be closely matched to another elementary
school in the district.
Table C: Comparison school distances
District School
Distance from Closest
School
Phase I
Cleveland Charles Lake Elementary School 3.40 Cleveland Scranton Elementary School 6.10 Jackson Lake Elementary School 0.01 Jackson French Elementary School 0.04 Talladega Sycamore Elementary School 8.20 Talladega Stemley Road Elementary School 19.80 Trenton Patton J. Hill Elementary School 2.50 Trenton Cadwalader Elementary School 2.90
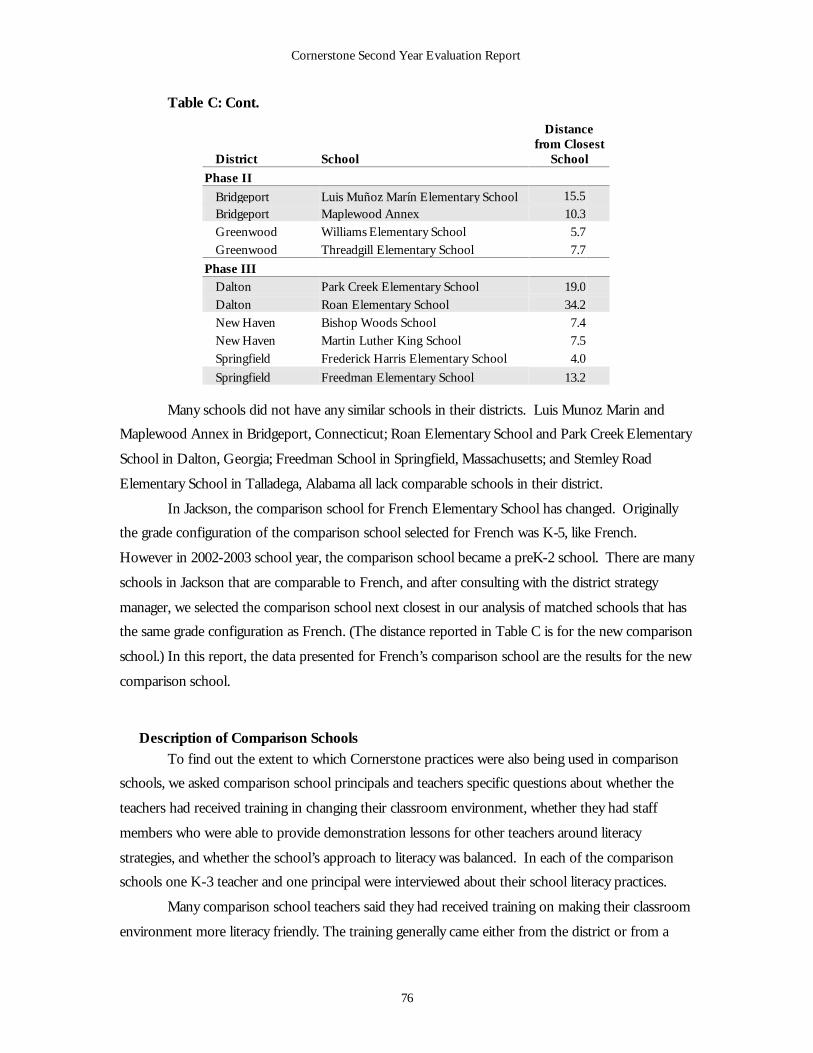
Cornerstone Second Year Evaluation Report
76
Table C: Cont.
District School
Distance from Closest
School
Phase II
Bridgeport Luis Muñoz Marín Elementary School 15.5Bridgeport Maplewood Annex 10.3Greenwood Williams Elementary School 5.7Greenwood Threadgill Elementary School 7.7
Phase III Dalton Park Creek Elementary School 19.0Dalton Roan Elementary School 34.2New Haven Bishop Woods School 7.4New Haven Martin Luther King School 7.5Springfield Frederick Harris Elementary School 4.0
Springfield Freedman Elementary School 13.2 Many schools did not have any similar schools in their districts. Luis Munoz Marin and
Maplewood Annex in Bridgeport, Connecticut; Roan Elementary School and Park Creek Elementary
School in Dalton, Georgia; Freedman School in Springfield, Massachusetts; and Stemley Road
Elementary School in Talladega, Alabama all lack comparable schools in their district.
In Jackson, the comparison school for French Elementary School has changed. Originally
the grade configuration of the comparison school selected for French was K-5, like French.
However in 2002-2003 school year, the comparison school became a preK-2 school. There are many
schools in Jackson that are comparable to French, and after consulting with the district strategy
manager, we selected the comparison school next closest in our analysis of matched schools that has
the same grade configuration as French. (The distance reported in Table C is for the new comparison
school.) In this report, the data presented for French’s comparison school are the results for the new
comparison school.
Description of Comparison Schools To find out the extent to which Cornerstone practices were also being used in comparison
schools, we asked comparison school principals and teachers specific questions about whether the
teachers had received training in changing their classroom environment, whether they had staff
members who were able to provide demonstration lessons for other teachers around literacy
strategies, and whether the school’s approach to literacy was balanced. In each of the comparison
schools one K-3 teacher and one principal were interviewed about their school literacy practices.
Many comparison school teachers said they had received training on making their classroom
environment more literacy friendly. The training generally came either from the district or from a
Cornerstone Second Year Evaluation Report
77
commercial source such as the publisher of the school’s basal reading series or from a school reform
program in place in the school. Teachers in comparison schools reported that the training generally
covered topics such as classroom library areas, displaying student work, and creating a more print-
rich classroom. Generally, the training was in workshop formats and teachers did not receive actual
hands-on assistance in altering their own classrooms.
In just more than half the comparison schools, the teachers and principals interviewed stated
that they did not have formal teacher-coaches or teacher-leader programs in place. A few reported
that teachers in their schools participated in learning walks where they observed other teachers’
classrooms. Some also said that mentors were routinely assigned to new teachers in the school but
did not receive release time to work with new teachers. The mentors served more as guides and the
new teachers were able go to the mentor with any problems she or he may have. Some schools did
have teachers who were referred to as English Language Arts Developers or Reading Specialists who
had release time and received additional professional development from the district or from their
school’s literacy program. These teachers’ roles were described generally as assisting other teachers
with improving their literacy practice through demonstration lessons or workshops.
In general, we found that most interviewees in the comparison schools were familiar with balanced
literacy and characterized their school’s approach to literacy instruction as balanced. Teachers listed a
number of classroom activities they did that were part of a balanced literacy block such as guided
reading, individualized reading, linking reading and writing, and phonics. Many interviewees that
characterized their literacy approach as balanced reported that their district or state reading plan or
the literacy program in place in their school emphasized a balanced literacy approach. The additional
literacy programs in place in the comparison schools are: Comer, Professional Learning
Communities, Carbo Reading Styles, Alabama Reading Initiative, Success for All, and Adaptive
Learning Environment Model (ALEM).
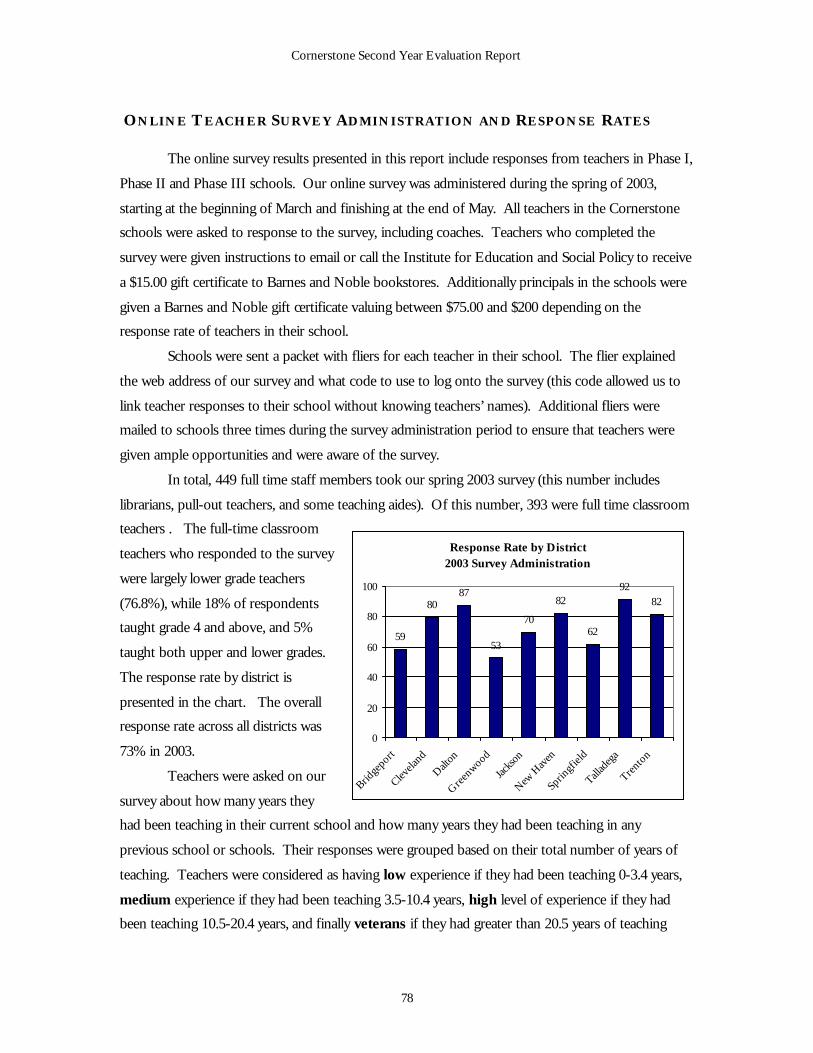
Cornerstone Second Year Evaluation Report
78
ONLINE T EACHER SURVEY ADMINISTRATION AND RESPONSE RATES
The online survey results presented in this report include responses from teachers in Phase I,
Phase II and Phase III schools. Our online survey was administered during the spring of 2003,
starting at the beginning of March and finishing at the end of May. All teachers in the Cornerstone
schools were asked to response to the survey, including coaches. Teachers who completed the
survey were given instructions to email or call the Institute for Education and Social Policy to receive
a $15.00 gift certificate to Barnes and Noble bookstores. Additionally principals in the schools were
given a Barnes and Noble gift certificate valuing between $75.00 and $200 depending on the
response rate of teachers in their school.
Schools were sent a packet with fliers for each teacher in their school. The flier explained
the web address of our survey and what code to use to log onto the survey (this code allowed us to
link teacher responses to their school without knowing teachers’ names). Additional fliers were
mailed to schools three times during the survey administration period to ensure that teachers were
given ample opportunities and were aware of the survey.
In total, 449 full time staff members took our spring 2003 survey (this number includes
librarians, pull-out teachers, and some teaching aides). Of this number, 393 were full time classroom
teachers . The full-time classroom
teachers who responded to the survey
were largely lower grade teachers
(76.8%), while 18% of respondents
taught grade 4 and above, and 5%
taught both upper and lower grades.
The response rate by district is
presented in the chart. The overall
response rate across all districts was
73% in 2003.
Teachers were asked on our
survey about how many years they
had been teaching in their current school and how many years they had been teaching in any
previous school or schools. Their responses were grouped based on their total number of years of
teaching. Teachers were considered as having low experience if they had been teaching 0-3.4 years,
medium experience if they had been teaching 3.5-10.4 years, high level of experience if they had
been teaching 10.5-20.4 years, and finally veterans if they had greater than 20.5 years of teaching
Response Rate by District 2003 Survey Administration
59
8087
53
70
82
62
9282
0
20
40
60
80
100
Bridge
port
Clevela
nd
Dalton
Gre
enwood
Jacks
on
New H
aven
Sprin
gfiel
d
Tallad
ega
Trento
n
Cornerstone Second Year Evaluation Report
79
experience.48 Our respondents were fairly equally distributed across these experience categories, with
the medium group most represented. Twenty-one percent of the classroom teachers were new
teachers, 32% percent were in the medium group, 25% were in the high group and 22% were in the
veteran group of teachers. Eight teachers out of the 393 classroom teachers did not respond to this
question about their experience level. This distribution is similar to last year’s distribution, although
new teachers were represented to a greater degree and veteran teachers less in the 2003
administration.49
A higher proportion of the respondents to the 2003 survey said that they were licensed and
certified. In the 2002 survey administration 88% of respondents indicated they were licensed and
certified; in the 2003 administration 96% of respondents indicated they were licensed and certified.
This could be due to the stricter requirements of No Child Left Behind. The percent of respondents
indicating that they had a master’s degree or higher increased slightly to 54% in 2003 over 51% in
2002.
48 The cutoffs used to establish the four levels of experience are the same as those used by the National Center for Education Statistics in their Schools and Staffing Survey. 49 In the survey administration for the 2001-2002 school year, 18% of teachers responding were new, 32% had a medium level of experience, 22% had a high level of experience and 28% were veteran teachers.
Cornerstone Second Year Evaluation Report
80
VALUE-ADDED REGRESSION METHODOLOGY This section presents a more detailed explanation of the statistical methodology used to
examine Cornerstone’s impact in the Cleveland, Jackson, and Trenton schools. The preliminary
analysis presented in this report uses a basic value-added model to determine if there are statistically
significant differences in test-score improvements over time between Cornerstone and non-
Cornerstone students in each district. The model is as follows:
SCORE = α + βX + δCS + γR + e
In the above, SCORE refers to the difference in a student’s test score between 2000-01 and
2002-03. X refers to a set of student characteristics including race, gender, and low-income status.
These characteristics varied somewhat across the districts depending on the data submitted. For
example, some districts provided information on limited English proficiency while others did not.
CS refers to the number of years that a student participated in Cornerstone. R is an indicator of
whether a student was retained. The coefficients (β, δ, γ) indicate the number of points of change in
the student’s test score associated with each of the variables. This basic model does not include any
controls for school effects, which is discussed subsequently under Plans for Additional Analysis.
Data
The value-added analysis uses student-level data provided by three of the Cornerstone
districts, which included scale scores on standardized tests in Reading (and sometimes Language) for
each year between 2000-01 and 2002-03 as well as the school, grade level, race, gender, free-lunch
status, and special-education status of each student. As this data was contained in multiple records
for many students, a considerable amount of effort was devoted to creating data sets with unique
records containing test score information and student characteristics for as many students as
possible. However, in some districts there were issues with missing demographic data and incorrect
student identifiers for substantial numbers of students.
The data sets for each district included all students in grades in which Cornerstone was
implemented. Students were coded as receiving Cornerstone treatment for a given year if they
attended a school and grade in which the initiative was being implemented. Because of the
expectation that Cornerstone practices will spread to the upper grades of the Cornerstone schools,
for the 2002-03 school year, if a student was tested in the fourth grade they were included in the
group of students who had received Cornerstone treatment. Non-Cornerstone students in the
districts served as comparison groups. The total years of Cornerstone participation was then
calculated for use as a predictor in the model so that differential impacts of the level of program
participation could be examined. In some districts, a small number of students transferred between
Cornerstone Second Year Evaluation Report
81
the two Cornerstone schools. These students were excluded from the analysis because the change in
schools might be expected to reduce their scores, and therefore understate any impact that
Cornerstone might have had. The differences between each student’s 2001 and 2003 test scores in
Reading and Language (where available) were also calculated for use as dependent variables in the
model.
Results
Regression analysis was used to estimate the value-added model described above for each of
the three districts from which sufficient data has been obtained. The regression results for each of
these districts are presented below. The specific independent variables used for each district (based
on the available data) as well as any other issues encountered in creating the regression models are
also explained. Preliminary examination of regression diagnostics for each set of results presented
below indicated that regression assumptions held for each of the models.
Cleveland
The Cleveland model is based on the Stanford 9 scores in Reading. The Cleveland analysis
included variables for several race/ethnic categories, as the district is more diverse than the others.
The reference group for the race/ethnicity is African American, so the coefficients on these variables
can be interpreted as the difference in score gains compared to African American students. The
model also included a control for students who were tested in the fall of 2000 (all students except for
kindergarteners were tested in fall) rather than the spring of 2001 as these students could be expected
to score lower due to not having received the benefits of extra instruction during the school year.
We did not receive student level data on students’ free lunch status from Cleveland. Cleveland has
not given the Stanford Language exam consistently across the three years included in this analysis.
Table D: Regression equation for gain in Reading Scores in Cleveland
Dependent Variable: Gain in Reading Scores 2000-01 to 2002-03 Independent Variable Coefficient Standard Error Significance 1 year of Cornerstone 3.314 4.115 .421 2 years of Cornerstone -0.160 4.377 .971 3 years of Cornerstone -4.222 3.497 .227 White 7.522 .983 .000** Hispanic 2.909 1.967 .139 Asian .728 5.667 .898 Female 1.668 .774 .031* Special Education .256 3.070 .934 Low English Proficiency 6.379 2.588 .014* Tested in fall 2000 -6.744 .779 .000** Student retained in 2001-02 14.201 1.573 .000** Student retained in 2002-03 1.236 1.533 .420 R2=.028 N=7,667
*Significant at the .05 level **Significant at the .01 level
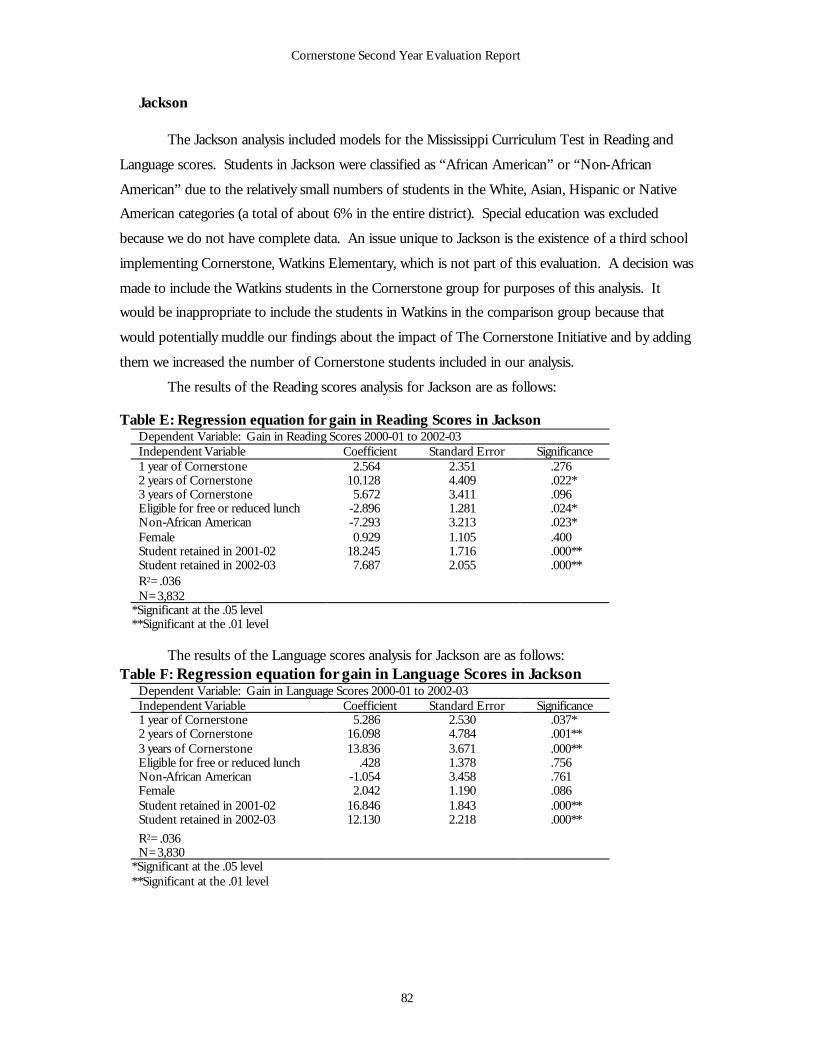
Cornerstone Second Year Evaluation Report
82
Jackson
The Jackson analysis included models for the Mississippi Curriculum Test in Reading and
Language scores. Students in Jackson were classified as “African American” or “Non-African
American” due to the relatively small numbers of students in the White, Asian, Hispanic or Native
American categories (a total of about 6% in the entire district). Special education was excluded
because we do not have complete data. An issue unique to Jackson is the existence of a third school
implementing Cornerstone, Watkins Elementary, which is not part of this evaluation. A decision was
made to include the Watkins students in the Cornerstone group for purposes of this analysis. It
would be inappropriate to include the students in Watkins in the comparison group because that
would potentially muddle our findings about the impact of The Cornerstone Initiative and by adding
them we increased the number of Cornerstone students included in our analysis.
The results of the Reading scores analysis for Jackson are as follows:
Table E: Regression equation for gain in Reading Scores in Jackson Dependent Variable: Gain in Reading Scores 2000-01 to 2002-03 Independent Variable Coefficient Standard Error Significance 1 year of Cornerstone 2.564 2.351 .276 2 years of Cornerstone 10.128 4.409 .022* 3 years of Cornerstone 5.672 3.411 .096 Eligible for free or reduced lunch -2.896 1.281 .024* Non-African American -7.293 3.213 .023* Female 0.929 1.105 .400 Student retained in 2001-02 18.245 1.716 .000** Student retained in 2002-03 7.687 2.055 .000** R2=.036 N=3,832
*Significant at the .05 level **Significant at the .01 level
The results of the Language scores analysis for Jackson are as follows:
Table F: Regression equation for gain in Language Scores in Jackson Dependent Variable: Gain in Language Scores 2000-01 to 2002-03 Independent Variable Coefficient Standard Error Significance 1 year of Cornerstone 5.286 2.530 .037* 2 years of Cornerstone 16.098 4.784 .001** 3 years of Cornerstone 13.836 3.671 .000** Eligible for free or reduced lunch .428 1.378 .756 Non-African American -1.054 3.458 .761 Female 2.042 1.190 .086 Student retained in 2001-02 16.846 1.843 .000** Student retained in 2002-03 12.130 2.218 .000**
R2=.036 N=3,830
*Significant at the .05 level **Significant at the .01 level
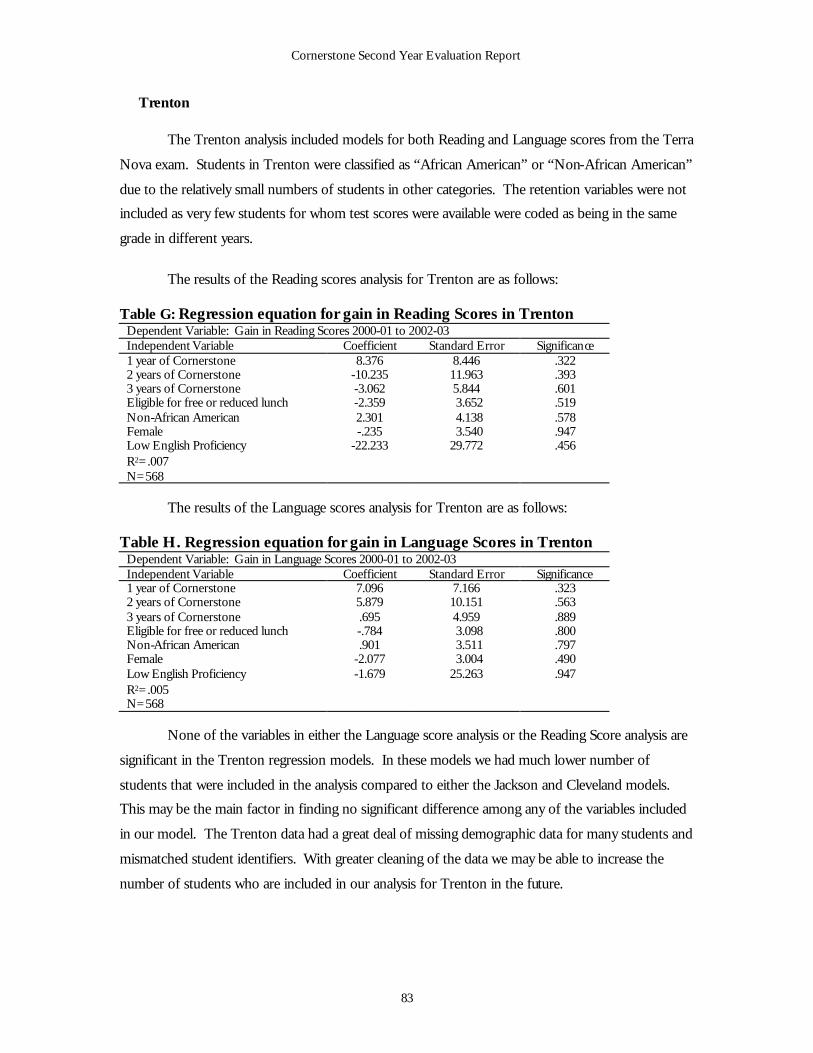
Cornerstone Second Year Evaluation Report
83
Trenton
The Trenton analysis included models for both Reading and Language scores from the Terra
Nova exam. Students in Trenton were classified as “African American” or “Non-African American”
due to the relatively small numbers of students in other categories. The retention variables were not
included as very few students for whom test scores were available were coded as being in the same
grade in different years.
The results of the Reading scores analysis for Trenton are as follows:
Table G: Regression equation for gain in Reading Scores in Trenton
Dependent Variable: Gain in Reading Scores 2000-01 to 2002-03 Independent Variable Coefficient Standard Error Significance 1 year of Cornerstone 8.376 8.446 .322 2 years of Cornerstone -10.235 11.963 .393 3 years of Cornerstone -3.062 5.844 .601 Eligible for free or reduced lunch -2.359 3.652 .519 Non-African American 2.301 4.138 .578 Female -.235 3.540 .947 Low English Proficiency -22.233 29.772 .456 R2=.007 N=568
The results of the Language scores analysis for Trenton are as follows:
Table H. Regression equation for gain in Language Scores in Trenton
Dependent Variable: Gain in Language Scores 2000-01 to 2002-03 Independent Variable Coefficient Standard Error Significance 1 year of Cornerstone 7.096 7.166 .323 2 years of Cornerstone 5.879 10.151 .563 3 years of Cornerstone .695 4.959 .889 Eligible for free or reduced lunch -.784 3.098 .800 Non-African American .901 3.511 .797 Female -2.077 3.004 .490 Low English Proficiency -1.679 25.263 .947 R2=.005 N=568
None of the variables in either the Language score analysis or the Reading Score analysis are
significant in the Trenton regression models. In these models we had much lower number of
students that were included in the analysis compared to either the Jackson and Cleveland models.
This may be the main factor in finding no significant difference among any of the variables included
in our model. The Trenton data had a great deal of missing demographic data for many students and
mismatched student identifiers. With greater cleaning of the data we may be able to increase the
number of students who are included in our analysis for Trenton in the future.
Cornerstone Second Year Evaluation Report
84
Plans for Additional Analysis As the amount of variation accounted for by our preliminary models are very small (with R2
less than .05 for all models), we are exploring alternative ways of modeling the data. In future
models we will include measures of student mobility; we will explore methods for including a
measure of the degree to which a school is implementing Cornerstone; and we will experiment with
the best methods for controlling for student test score results at baseline.
Cornerstone Second Year Evaluation Report
85
DRA INFORMATION
The Developmental Reading Assessment (DRA) is designed to be used with students
reading at the K-3 grade levels. According to the DRA teacher resource guide the main purpose of
the assessment is to “enable primary teachers to systematically observe, record, and evaluate change
in student reading performance and to plan for and teach what each student needs to learn next”.
The DRA is a flexible instrument that can be used several times a year to monitor the progress of
students. The assessment is also increasingly being used by school districts in grading and promotion
decision-making.
The DRA kit consists of a set of leveled stories and is administered to students one-on-one
by a teacher. According to the Teacher Resource Guide that accompanies the set of leveled books, the
DRA level of a child is determined when a student has an accuracy rate of 94% or greater and a
comprehension level of at least Adequate (comprehension levels are Very Little Comprehension,
Some Comprehension, Adequate Comprehension and Very Good Comprehension). Accuracy is
measured by taking a running record (recording exactly what the child says) during oral reading and
counting the number of mistakes the student makes. The comprehension level is determined by the
teacher evaluating the student’s retelling of the story. Key factors in determining the comprehension
level include the student’s inclusion of key events, details, and references to characters as well as the
level of interpretation of the story. Also included as components of the comprehension level are how
responsive the student is to the teacher’s questions and how many prompts are required to elicit the
information from the student. (the retelling is also a verbal ability test). The teacher resource guide
notes that it is sometimes necessary to test a child several times before finding the correct DRA level
of the child based on a 94% accuracy rate and at least an adequate level of comprehension. Although
the DRA Teacher Resource Guide suggests an accuracy rate of 94% be used to determine the DRA
level of a child, the DRA Online Management System prompts teachers to re-assess any student who
has an accuracy rate below 90% before entering the data into the computer. Many students in the
Cornerstone sample were entered into the online system rated below the 94% accuracy rate but
above the 90% accuracy rate.50 Because of this, we have included in our analyses the students who
were at or above 90% on the accuracy measure.
Administering the DRA occurs in a one-on-one conference format that varies slightly
according to the reading level of the child. Children at the lower reading levels (A, 1 and 2) do not
select the books they will read. Instead, the book is selected by the teacher who also reads one or two
pages of text aloud to the student to familiarize the student with the text pattern. Students who are at
50 14% of the student in our database had reading levels assessed between 90% and 94% accuracy.
Cornerstone Second Year Evaluation Report
86
or above a Level 3 are asked to select a book he/she thinks will be appropriate from four or five
books the teacher has laid out in front of the child. After selecting a book the student is given a brief
introduction to the story by the teacher and prompted to look through the book and predict what
happens in the story based on the pictures or from reading the first passage (depending on level of
the story). Students who are between Levels 3 and 16 read the entire book out loud with the teacher
and students who are at Level 18 or above read the first passage out loud and the remainder of the
story is read silently. After reading the story (either out loud or independently) the teacher then asks
the child to retell the story to assess the comprehension level of the student.
Cornerstone DRA Sample Selection and Administration
Coaches in the Cornerstone schools administer the DRA to a sample of students once a
year. In the first year of implementation a sample of thirty-six students (12 kindergarteners, 12 first
graders, six second graders and six third graders) in each school are administered the test. The
sample is selected using a random stratified sampling technique. Teachers in all the K-3 classrooms
were asked to group students into high, medium and low reading categories, and students were
selected randomly from within these groups to ensure that students of all abilities were included in
the small sample. The sample students are assessed each year that they remain enrolled in the school
in grades K-3.
Because student mobility is quite high in many Cornerstone schools, the sample of students
tested on the DRA changes over the two-year time period. When a student who was in the sample
leaves the school, another student is selected as a replacement. Coaches were instructed to randomly
select a replacement student who was identified as in the same grade and reading category (low,
medium or high).
An important consideration that affects the DRA results is the time of administration. The
DRA is a sensitive assessment designed to measure growth over a relatively short period of time.
Many districts administer the DRA two or three times a year, and establish DRA level benchmarks
for each administration period (fall, winter and spring). This practice standardizes administration and
allows districts to assess reading growth from one period of testing to the next with some reliability.
The timing of the DRA administration in the Cornerstone schools varied considerably across
schools. During the 2001-02 school year, the DRA was given in November at some schools, but at
others it was not administered until April. In the 2002-03 school year, coaches were instructed to
administer the DRA in February. From our interviews of Cornerstone coaches, we know that some
schools completed their assessments within the required time-period. However, in other schools, the
assessment was carried out over a considerably longer period of time.
Cornerstone Second Year Evaluation Report
87
The criteria we used in the analyses of the Cornerstone school DRA data are the January
benchmarks suggested on the DRA Online Management system website. These are levels at which
students are expected to be reading at by mid-year, to be considered on grade level. An accurate
DRA reading level of a student is measured when the student’s reading accuracy is 94% or higher
and the comprehension level is at least “adequate”. However, the online system allows teachers to
enter students’ results as long as they read at least at a 90% accuracy rate. For this reason, we used a
criteria of 90% and above on the accuracy rating for students to be included in the analyses. Some
students’ data was initially entered with an accuracy rate below 90%. These students are removed
from our analyses.51
51 The percentage of testing entries eliminated from the sample when a criterion of 90% on accuracy was established is relatively low (5.2%).
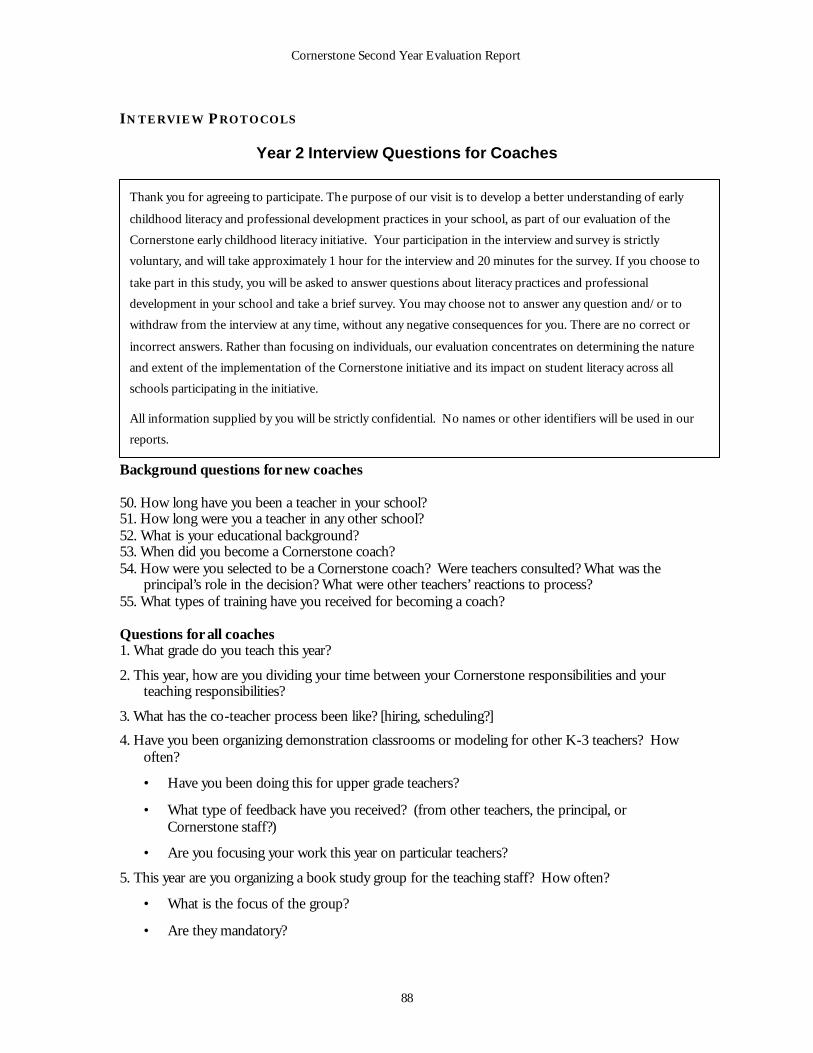
Cornerstone Second Year Evaluation Report
88
Thank you for agreeing to participate. The purpose of our visit is to develop a better understanding of early
childhood literacy and professional development practices in your school, as part of our evaluation of the
Cornerstone early childhood literacy initiative. Your participation in the interview and survey is strictly
voluntary, and will take approximately 1 hour for the interview and 20 minutes for the survey. If you choose to
take part in this study, you will be asked to answer questions about literacy practices and professional
development in your school and take a brief survey. You may choose not to answer any question and/or to
withdraw from the interview at any time, without any negative consequences for you. There are no correct or
incorrect answers. Rather than focusing on individuals, our evaluation concentrates on determining the nature
and extent of the implementation of the Cornerstone initiative and its impact on student literacy across all
schools participating in the initiative.
All information supplied by you will be strictly confidential. No names or other identifiers will be used in our
reports.
INTERVIEW P ROTOCOLS
Year 2 Interview Questions for Coaches
Background questions for new coaches 50. How long have you been a teacher in your school? 51. How long were you a teacher in any other school? 52. What is your educational background? 53. When did you become a Cornerstone coach? 54. How were you selected to be a Cornerstone coach? Were teachers consulted? What was the
principal’s role in the decision? What were other teachers’ reactions to process? 55. What types of training have you received for becoming a coach? Questions for all coaches 1. What grade do you teach this year?
2. This year, how are you dividing your time between your Cornerstone responsibilities and your teaching responsibilities?
3. What has the co-teacher process been like? [hiring, scheduling?]
4. Have you been organizing demonstration classrooms or modeling for other K-3 teachers? How often?
• Have you been doing this for upper grade teachers?
• What type of feedback have you received? (from other teachers, the principal, or Cornerstone staff?)
• Are you focusing your work this year on particular teachers?
5. This year are you organizing a book study group for the teaching staff? How often?
• What is the focus of the group?
• Are they mandatory?
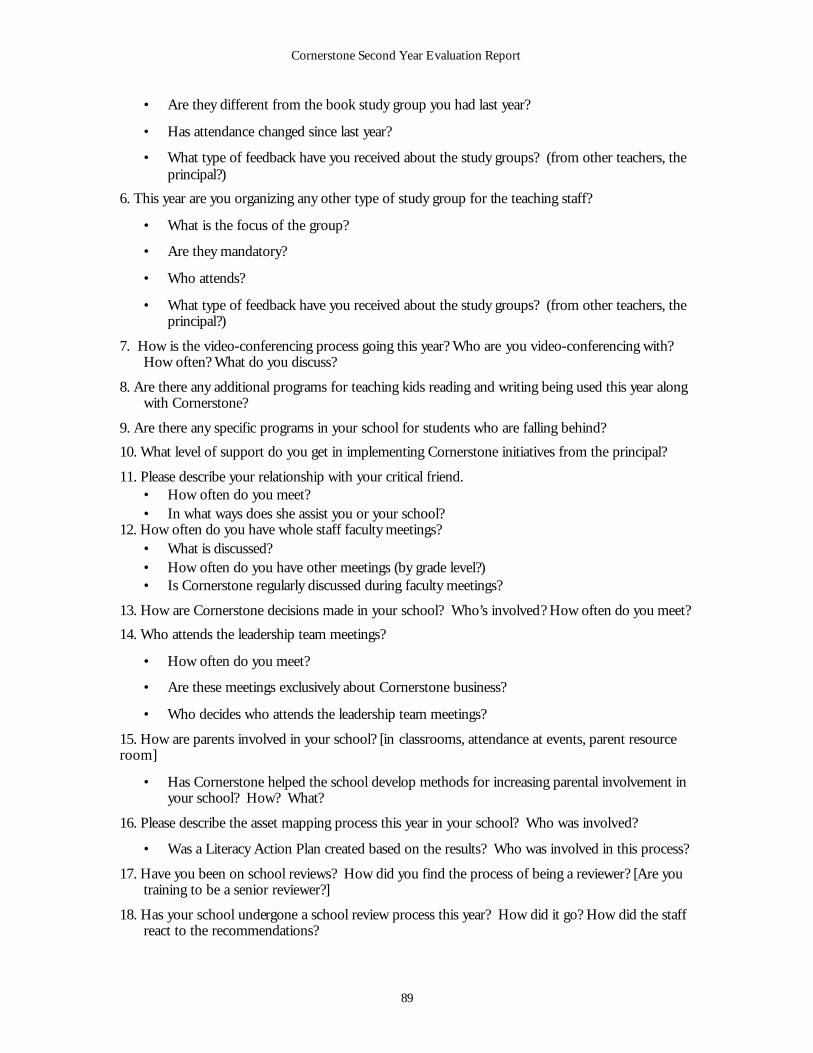
Cornerstone Second Year Evaluation Report
89
• Are they different from the book study group you had last year?
• Has attendance changed since last year?
• What type of feedback have you received about the study groups? (from other teachers, the principal?)
6. This year are you organizing any other type of study group for the teaching staff?
• What is the focus of the group?
• Are they mandatory?
• Who attends?
• What type of feedback have you received about the study groups? (from other teachers, the principal?)
7. How is the video-conferencing process going this year? Who are you video-conferencing with? How often? What do you discuss?
8. Are there any additional programs for teaching kids reading and writing being used this year along with Cornerstone?
9. Are there any specific programs in your school for students who are falling behind?
10. What level of support do you get in implementing Cornerstone initiatives from the principal?
11. Please describe your relationship with your critical friend. • How often do you meet? • In what ways does she assist you or your school?
12. How often do you have whole staff faculty meetings? • What is discussed? • How often do you have other meetings (by grade level?) • Is Cornerstone regularly discussed during faculty meetings?
13. How are Cornerstone decisions made in your school? Who’s involved? How often do you meet?
14. Who attends the leadership team meetings?
• How often do you meet?
• Are these meetings exclusively about Cornerstone business?
• Who decides who attends the leadership team meetings?
15. How are parents involved in your school? [in classrooms, attendance at events, parent resource room]
• Has Cornerstone helped the school develop methods for increasing parental involvement in your school? How? What?
16. Please describe the asset mapping process this year in your school? Who was involved?
• Was a Literacy Action Plan created based on the results? Who was involved in this process?
17. Have you been on school reviews? How did you find the process of being a reviewer? [Are you training to be a senior reviewer?]
18. Has your school undergone a school review process this year? How did it go? How did the staff react to the recommendations?
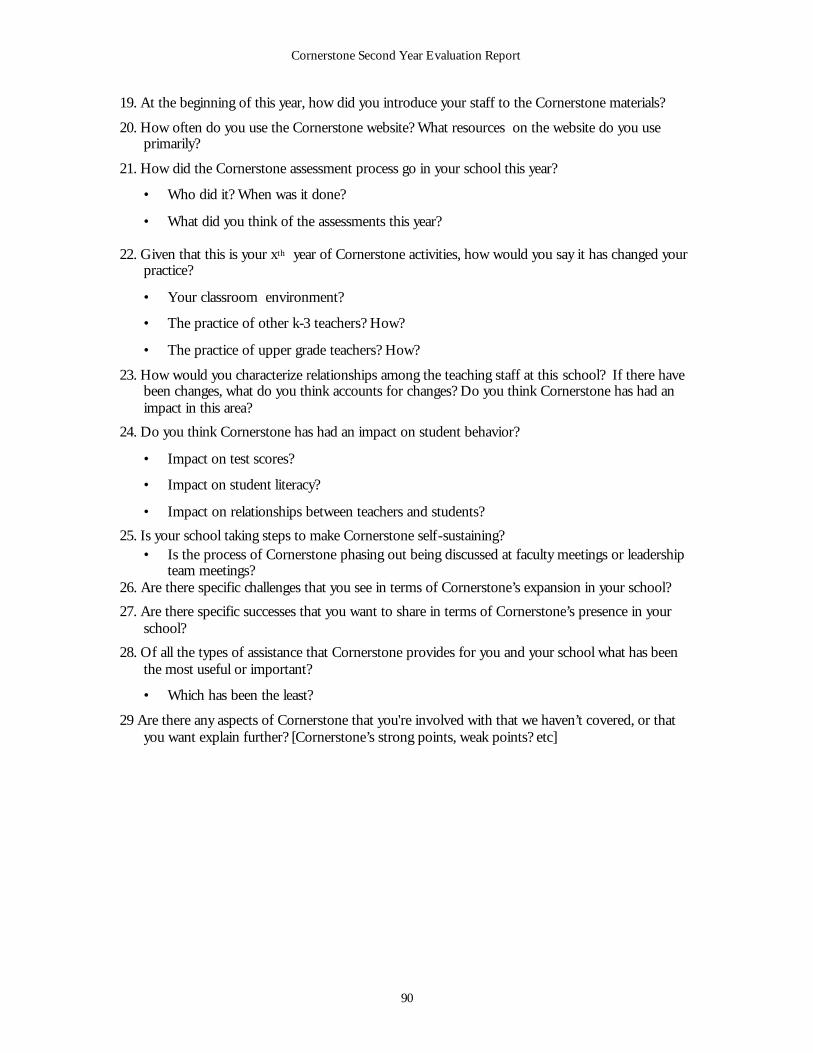
Cornerstone Second Year Evaluation Report
90
19. At the beginning of this year, how did you introduce your staff to the Cornerstone materials?
20. How often do you use the Cornerstone website? What resources on the website do you use primarily?
21. How did the Cornerstone assessment process go in your school this year?
• Who did it? When was it done?
• What did you think of the assessments this year?
22. Given that this is your xth year of Cornerstone activities, how would you say it has changed your practice?
• Your classroom environment?
• The practice of other k-3 teachers? How?
• The practice of upper grade teachers? How?
23. How would you characterize relationships among the teaching staff at this school? If there have been changes, what do you think accounts for changes? Do you think Cornerstone has had an impact in this area?
24. Do you think Cornerstone has had an impact on student behavior?
• Impact on test scores?
• Impact on student literacy?
• Impact on relationships between teachers and students?
25. Is your school taking steps to make Cornerstone self-sustaining? • Is the process of Cornerstone phasing out being discussed at faculty meetings or leadership
team meetings? 26. Are there specific challenges that you see in terms of Cornerstone’s expansion in your school?
27. Are there specific successes that you want to share in terms of Cornerstone’s presence in your school?
28. Of all the types of assistance that Cornerstone provides for you and your school what has been the most useful or important?
• Which has been the least?
29 Are there any aspects of Cornerstone that you're involved with that we haven’t covered, or that you want explain further? [Cornerstone’s strong points, weak points? etc]
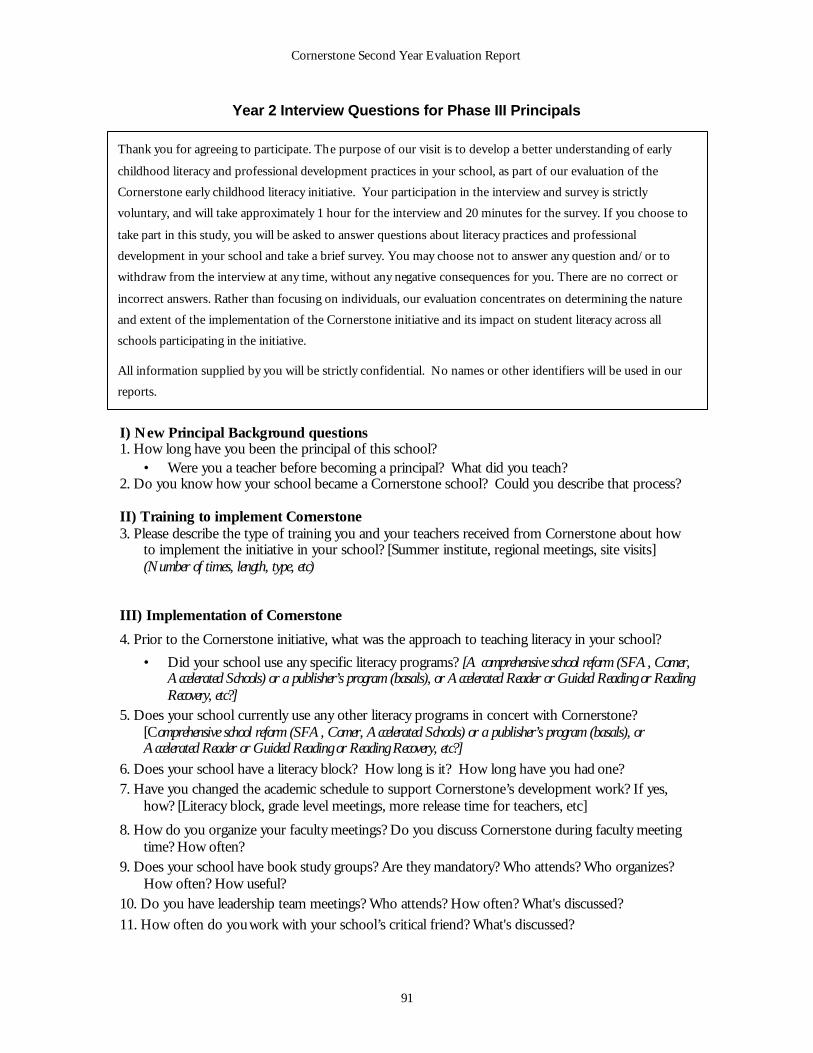
Cornerstone Second Year Evaluation Report
91
Year 2 Interview Questions for Phase III Principals
I) New Principal Background questions 1. How long have you been the principal of this school?
• Were you a teacher before becoming a principal? What did you teach? 2. Do you know how your school became a Cornerstone school? Could you describe that process? II) Training to implement Cornerstone 3. Please describe the type of training you and your teachers received from Cornerstone about how
to implement the initiative in your school? [Summer institute, regional meetings, site visits] (Number of times, length, type, etc)
III) Implementation of Cornerstone
4. Prior to the Cornerstone initiative, what was the approach to teaching literacy in your school?
• Did your school use any specific literacy programs? [A comprehensive school reform (SFA, Comer, Accelerated Schools) or a publisher’s program (basals), or Accelerated Reader or Guided Reading or Reading Recovery, etc?]
5. Does your school currently use any other literacy programs in concert with Cornerstone? [Comprehensive school reform (SFA, Comer, Accelerated Schools) or a publisher’s program (basals), or Accelerated Reader or Guided Reading or Reading Recovery, etc?]
6. Does your school have a literacy block? How long is it? How long have you had one? 7. Have you changed the academic schedule to support Cornerstone’s development work? If yes,
how? [Literacy block, grade level meetings, more release time for teachers, etc]
8. How do you organize your faculty meetings? Do you discuss Cornerstone during faculty meeting time? How often?
9. Does your school have book study groups? Are they mandatory? Who attends? Who organizes? How often? How useful?
10. Do you have leadership team meetings? Who attends? How often? What's discussed? 11. How often do you work with your school’s critical friend? What's discussed?
Thank you for agreeing to participate. The purpose of our visit is to develop a better understanding of early
childhood literacy and professional development practices in your school, as part of our evaluation of the
Cornerstone early childhood literacy initiative. Your participation in the interview and survey is strictly
voluntary, and will take approximately 1 hour for the interview and 20 minutes for the survey. If you choose to
take part in this study, you will be asked to answer questions about literacy practices and professional
development in your school and take a brief survey. You may choose not to answer any question and/or to
withdraw from the interview at any time, without any negative consequences for you. There are no correct or
incorrect answers. Rather than focusing on individuals, our evaluation concentrates on determining the nature
and extent of the implementation of the Cornerstone initiative and its impact on student literacy across all
schools participating in the initiative.
All information supplied by you will be strictly confidential. No names or other identifiers will be used in our
reports.
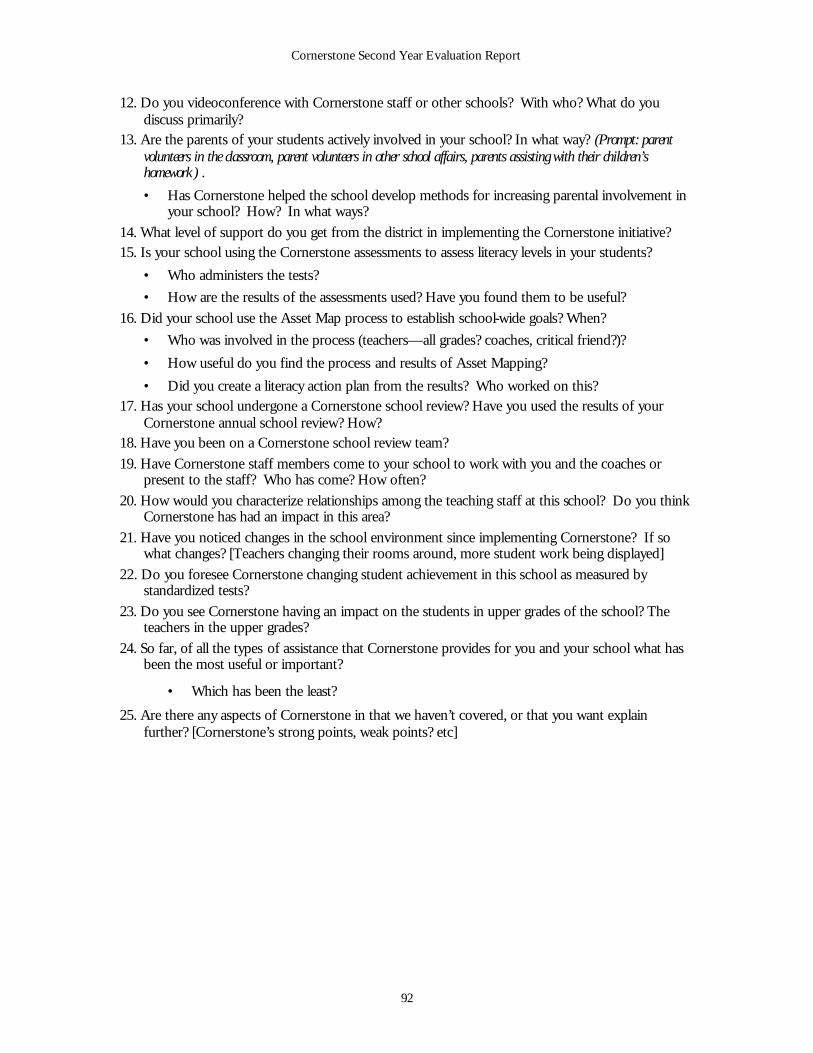
Cornerstone Second Year Evaluation Report
92
12. Do you videoconference with Cornerstone staff or other schools? With who? What do you discuss primarily?
13. Are the parents of your students actively involved in your school? In what way? (Prompt: parent volunteers in the classroom, parent volunteers in other school affairs, parents assisting with their children’s homework) .
• Has Cornerstone helped the school develop methods for increasing parental involvement in your school? How? In what ways?
14. What level of support do you get from the district in implementing the Cornerstone initiative? 15. Is your school using the Cornerstone assessments to assess literacy levels in your students?
• Who administers the tests?
• How are the results of the assessments used? Have you found them to be useful? 16. Did your school use the Asset Map process to establish school-wide goals? When?
• Who was involved in the process (teachers—all grades? coaches, critical friend?)?
• How useful do you find the process and results of Asset Mapping?
• Did you create a literacy action plan from the results? Who worked on this? 17. Has your school undergone a Cornerstone school review? Have you used the results of your
Cornerstone annual school review? How? 18. Have you been on a Cornerstone school review team? 19. Have Cornerstone staff members come to your school to work with you and the coaches or
present to the staff? Who has come? How often? 20. How would you characterize relationships among the teaching staff at this school? Do you think
Cornerstone has had an impact in this area? 21. Have you noticed changes in the school environment since implementing Cornerstone? If so
what changes? [Teachers changing their rooms around, more student work being displayed] 22. Do you foresee Cornerstone changing student achievement in this school as measured by
standardized tests? 23. Do you see Cornerstone having an impact on the students in upper grades of the school? The
teachers in the upper grades? 24. So far, of all the types of assistance that Cornerstone provides for you and your school what has
been the most useful or important?
• Which has been the least?
25. Are there any aspects of Cornerstone in that we haven’t covered, or that you want explain further? [Cornerstone’s strong points, weak points? etc]
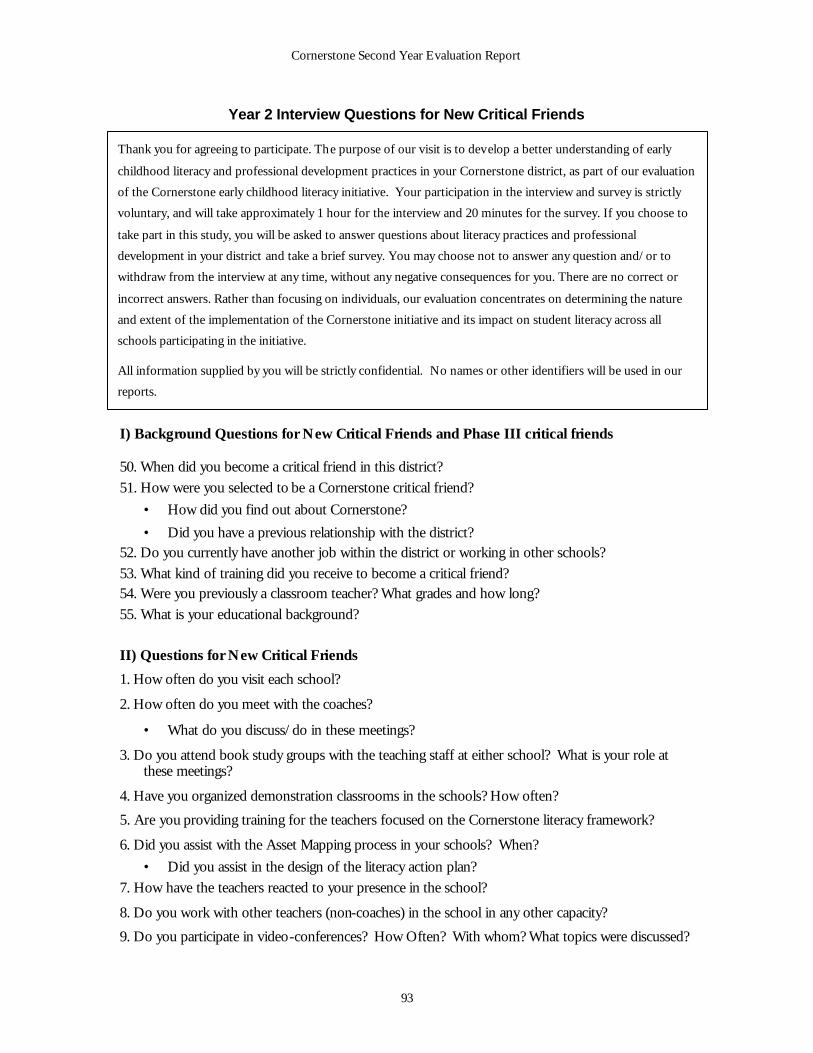
Cornerstone Second Year Evaluation Report
93
Year 2 Interview Questions for New Critical Friends
I) Background Questions for New Critical Friends and Phase III critical friends 50. When did you become a critical friend in this district? 51. How were you selected to be a Cornerstone critical friend?
• How did you find out about Cornerstone?
• Did you have a previous relationship with the district? 52. Do you currently have another job within the district or working in other schools? 53. What kind of training did you receive to become a critical friend? 54. Were you previously a classroom teacher? What grades and how long? 55. What is your educational background? II) Questions for New Critical Friends
1. How often do you visit each school?
2. How often do you meet with the coaches?
• What do you discuss/do in these meetings?
3. Do you attend book study groups with the teaching staff at either school? What is your role at these meetings?
4. Have you organized demonstration classrooms in the schools? How often?
5. Are you providing training for the teachers focused on the Cornerstone literacy framework?
6. Did you assist with the Asset Mapping process in your schools? When?
• Did you assist in the design of the literacy action plan? 7. How have the teachers reacted to your presence in the school?
8. Do you work with other teachers (non-coaches) in the school in any other capacity?
9. Do you participate in video-conferences? How Often? With whom? What topics were discussed?
Thank you for agreeing to participate. The purpose of our visit is to develop a better understanding of early
childhood literacy and professional development practices in your Cornerstone district, as part of our evaluation
of the Cornerstone early childhood literacy initiative. Your participation in the interview and survey is strictly
voluntary, and will take approximately 1 hour for the interview and 20 minutes for the survey. If you choose to
take part in this study, you will be asked to answer questions about literacy practices and professional
development in your district and take a brief survey. You may choose not to answer any question and/or to
withdraw from the interview at any time, without any negative consequences for you. There are no correct or
incorrect answers. Rather than focusing on individuals, our evaluation concentrates on determining the nature
and extent of the implementation of the Cornerstone initiative and its impact on student literacy across all
schools participating in the initiative.
All information supplied by you will be strictly confidential. No names or other identifiers will be used in our
reports.
Cornerstone Second Year Evaluation Report
94
10. Do the schools have leadership team meetings? How often? What's discussed? Do you attend?
11. Do you meet with the principals separately from the leadership team meetings? How often? What’s discussed?
• What level of support do you get in implementing Cornerstone initiatives from the principals?
12.Do you have formal meetings with the Cornerstone staff to discuss your work in the schools? How often?
• Do you also informally communicate with Cornerstone staff on regularly?
13. What types of support for your work do you get from Cornerstone?
14. Have you been on a school review? What did you think of the process?
III) Cornerstone Assessments
15. Have the schools used the Cornerstone assessments to assess literacy levels in the k-3 students?
• Did you assist in process?
• Who administered the tests? When was it completed?
16. What do you think about the assessment tools? Do you think they accurately reflect student literacy levels?
17. Have the classroom teachers in your schools used the results of the Cornerstone assessments? In what ways?
IV) Cornerstone’s Impact on the Schools 18. What do you see as the challenges to making it possible for all K-3 classrooms to fully implement
Cornerstone activities in the schools you work in? 19. Do you see Cornerstone making an impact on the teachers and students in upper grades of the
schools? In what ways? 20.Given that Cornerstone has been in the district for x years, are there discussions about making
Cornerstone self-sustaining? Is the process of Cornerstone being phased out being discussed?
21. What kind of training have you received from Cornerstone this year? (What meetings have you attended?) Have Cornerstone staff come to your district?
22. Of all the types of assistance that Cornerstone provides for you and your school, what has been the most useful or important for you?
• Which has been the least?
23. Are there any aspects of Cornerstone that you're involved with that we haven’t covered, or that you want explain further? Strengths, weaknesses, criticisms, concerns.
Cornerstone Second Year Evaluation Report
95
Year 2 Interview Questions for District Strategy Managers
Background Questions for New or Phase III district strategy managers 50. What is your official position in the district? What’s your role? 51. Were you a teacher? How long? What grades? 52. Do you know how your district became involved with Cornerstone? 53. How was it decided which schools would become Cornerstone in your district? 54. Do you know how the coaches and critical friends selected? Literacy – series of questions about your district’s approach to literacy
1. Do any elementary schools in the district use any comprehensive school reform programs? [(SFA,
Comer, Accelerated Schools, Modern Red Schoolhouse] 2. Do district elementary schools use particular literacy programs/strategies? [Accelerated Reader,
Guided Reading, Balanced Literacy, Four Blocks, Breakthrough to Literacy, or Reading Recovery, etc?] • Are any mandated or recommended by the district or state? • Are there any particular theories of literacy learning behind the programs? • Do the district elementary schools use a particular brand of basal readers? • Are any mandated or recommended by the district or state? • Is there a particular theory of literacy learning focused on by these basals?
3. Do the elementary schools in your district have a literacy block this year? • Is the literacy block mandated or recommended by the district or state? • What are some of the structured activities during this time? • Was there district-wide rescheduling done to accommodate this? • Was there training provided to help teachers understand how to use the time this year?
4. Do the elementary schools provide professional development for teachers focused on literacy? • Who provides it? (district or state?) • How is time created for this? • Are there any particular theories of literacy learning behind it?
5. Does the district have a staff person responsible for literacy development in the elementary schools in the district? Please describe their responsibilities.
6. What assessments do the schools use to assess student literacy?
Thank you for agreeing to participate. The purpose of our visit is to develop a better understanding of early
childhood literacy and professional development practices in your district, as part of our evaluation of the
Cornerstone early childhood literacy initiative. Your participation in this interview is strictly voluntary, and
will take approximately 1 hour. If you choose to take part in this study, you will be asked to answer questions
about literacy practices and professional development in your district. You may choose not to answer any
question and/or to withdraw from the interview at any time, without any negative consequences for you.
There are no correct or incorrect answers. Rather than focusing on individuals, our evaluation concentrates
on determining the nature and extent of the implementation of the Cornerstone initiative and its impact on
student literacy across all schools participating in the initiative.
All information supplied by you will be strictly confidential. No names or other identifiers will be used in our
reports.
Cornerstone Second Year Evaluation Report
96
• What are the district or state mandated tests? Questions about Cornerstone
7. Cornerstone requires the district to pay for a portion of the costs. What percentage has the district
contributed and how was the money used? Who decided how it would be spent? 8. Have you been on Cornerstone school Review team this year? What did you think of the school
review process? 9. How often do you meet with the Cornerstone critical friend this year? (Has the critical friend in
your district changed from last year? If yes, why?) 10. Have there been changes in the Cornerstone coaches or principals in your district this year?
Could you explain why those changes happened? 11. How often have you met with the superintendent to discuss what’s going on in the Cornerstone
schools this year? 12. Do you meet with the principals of elementary schools in your district? How often?
• How often are there discussions about Cornerstone among the principals, formally and/or informally?
13. Are you in contact with Cornerstone staff through videoconferencing or other means this year? How often? What do you discuss?
14. Have you visited the Cornerstone schools this year? How often?
• Have you observed a book study group or a literacy group?
• Have you observed a literacy block? 15. Have you seen changes in the Cornerstone schools since last year?
• How have they changed? 16. What do you see as the main challenges facing Cornerstone initiative in the CS schools? 17. How will your district determine if Cornerstone has been successful? 18. Have you seen any evidence of Cornerstone spreading district-wide?
• Are there discussions about spreading the Cornerstone initiative to other schools in your district?
• What do you see as the challenges facing Cornerstone in terms of spreading district-wide? 19. Given that Cornerstone has been in the district for x years, are there discussions about making
Cornerstone self-sustaining? 20. Of all the types of assistance that Cornerstone provides for the schools and the district what has
been the most useful or important for you?
• Which has been the least? 21. Are there any aspects of Cornerstone that you’re involved with that we haven’t covered, or that
you want to explain further? Strengths, weaknesses, concerns?
Cornerstone Second Year Evaluation Report
97
Year 2 Interview Questions for Cornerstone Superintendents
1. How long have you been the Superintendent of this district?
• What is your teaching background? 2. How and when did your district get involved with the Cornerstone initiative? 3. Why did you choose Cornerstone for your district?
• What about Cornerstone appealed to you? 4. How were the Cornerstone schools in your district selected? 5. How was your district strategy manager selected?
• Do you know how your district’s critical friend was selected? 6. How often do you discuss Cornerstone related matters with your district strategy manager? 7. Have you visited the Cornerstone schools in your district?
• What aspects of Cornerstone did you see in action?
• What did you think of it? 8. On what occasions have you been to Cornerstone-related events? [Regional meetings, meetings
with Steve, within district events?]
• What did you think of them? 9. Are you in regular contact with Cornerstone national staff? Who? Why? 10. Cornerstone requires the district to pay for a portion of the costs. What percentage has the
district contributed and how was the money used? Who decided how it would be spent? 11.Cornerstone expects that the district will eventually take on the cost and management of the
initiative if it is successful.
• What criteria will you use to decide whether Cornerstone is successful? 12. Is there currently a timeline for spreading Cornerstone to the other schools in the district? 13. Do you see evidence of Cornerstone literacy practices in non-Cornerstone schools in the district? 14. Do you have any other comments about literacy practices in your district or Cornerstone?
Thank you for agreeing to participate. The purpose of our visit is to develop a better understanding of
early childhood literacy and professional development practices in your district, as part of our evaluation
of the Cornerstone early childhood literacy initiative. Your participation in this interview is strictly
voluntary, and will take approximately 40 minutes. If you choose to take part in this study, you will be
asked to answer questions about literacy practices and professional development in your district. You
may choose not to answer any question and/or to withdraw from the interview at any time, without any
negative consequences for you. There are no correct or incorrect answers. Rather than focusing on
individuals, our evaluation concentrates on determining the nature and extent of the implementation of
the Cornerstone initiative and its impact on student literacy across all schools participating in the
initiative.
All information supplied by you will be strictly confidential. No names or other identifiers will be used in
our reports.
Cornerstone Second Year Evaluation Report
98
Year 2 Interview Questions for Cornerstone Staff Members
Questions for new Cornerstone staff members: A. Can you tell us about how you came to work for Cornerstone and what you were doing before
you joined them? (how long have you been with CS?) Questions for ALL Cornerstone staff members: 1. Can you describe your current role at Cornerstone? (Has that changed since last year?) 2. How do you communicate with your Cornerstone colleagues about developments in the
Cornerstone schools or other important issues? (meetings, memos, formal/informal, Philly +elsewhere folk)?
3. How have the (coach/critical friend/etc.) roles and responsibilities changed over the last year? 4. To your knowledge, have the Cornerstone materials been changed this past year? Which and in
what ways? • Why were they changed? • Who was responsible for the changes?
Questions about Cornerstone in Schools/ Districts: 5. Do you have contact with the Cornerstone schools or the districts? How often?
• In what form? (Visits, video conferencing, phone, email, etc) • Are there a certain number of days you spend in each school or district or do you decide on
a case by case basis? • What do you usually do when you visit a school or district? • Are there any other occasions you were in Cornerstone schools or districts? (school review?
what was your role at those times)?
Thank you for agreeing to participate. Your participation in this interview is strictly voluntary, and will
take approximately 1 hour. If you choose to take part in this study, you will be asked to answer questions
about literacy practices and professional development in the Cornerstone schools and the culture of the
Cornerstone organization. You may choose not to answer any question and/or to withdraw from the
interview at any time, without any negative consequences for you. There are no correct or incorrect
answers. Rather than focusing on individuals, our evaluation concentrates on determining the nature and
extent of the implementation of the Cornerstone initiative and its impact on student literacy across all
schools participating in the initiative.
All information supplied by you will be strictly confidential. No names or other identifiers will be used in
our reports.
Cornerstone Second Year Evaluation Report
99
6. This is a two part question: If you think about the schools or districts that have been successful at implementing Cornerstone what are their characteristics? And then could you describe the characteristics of the schools or districts that are not successful?
7. From your experience in the schools, how does Cornerstone fit with existing literacy programs and
other district or state initiatives? 8. How is Cornerstone helping schools address the issues of sustainability beyond the period of
direct support? 9. What (if anything) has surprised you about the evolution of Cornerstone? 10. How do you define success for the Cornerstone initiative and what do you see as the main
successes? 11. What do you see as the main challenges facing Cornerstone? 12. How would you describe the culture of the Cornerstone organization? 13. Are there any other important issues or elements of your role or about the organization that we
have not covered that you would like to add?
Cornerstone Second Year Evaluation Report
100
Year 2 Interview Questions for Comparison School Principals
1. How long have you been a principal in this school? 2. Were you a teacher before becoming a principal? What did you teach? 3. Does your school implement any comprehensive school reform program? [(SFA, Comer, Accelerated
Schools, Modern red schoolhouse] 4. Does your school use any particular literacy programs/strategies school wide? [Accelerated Reader, 4
Blocks, or Reading Recovery, etc?] • Which ones? • Which grades are they used in?
5. Are there any specific programs used in your school for students who are falling behind? 6. Are you familiar with balanced literacy? What does this mean to you? Would you characterize your
school’s approach to literacy as balanced? • Do the school use particular program for this? • What sort of training did teachers receive?
7. Are you familiar with guided reading? What does this mean to you? Do your teachers use guided
reading when teaching literacy? • Do the school use particular program for this? • What sort of training did teachers receive?
8. Do your school use any particular brand of Basal readers? What type?
• Is the type mandated or recommended by the district? 9. Does your school have a literacy block?
• How long is it? How frequent is it? • How long has it been implemented? • What is the structure of the literacy block? Are there particular activities that all the teachers
and students should be doing during the literacy block?
Thank you for agreeing to participate in our interview. The purpose of this interview is to develop a better
understanding of early childhood literacy and professional development practices in your school, as part of
our evaluation of the Cornerstone early childhood literacy initiative. Your participation in this interview is
strictly voluntary, and will take approximately 30 minutes. If you choose to take part in this study, you will
be asked to answer questions about literacy practices and professional development your school. You may
choose not to answer any question and/or to withdraw from the interview at any time, without any
negative consequences for you. There are no correct or incorrect answers.
All information supplied by you will be strictly confidential. No names or other identifiers will be used
in our reports.
Cornerstone Second Year Evaluation Report
101
• Would you say that teachers use this time solely for literacy learning? 10. Are there professional development activities for teachers focused on student literacy?
• Provided by whom? • What sort of theory of literacy lay behind the professional development? • How effective do you think the training has been?
11. Is there a person whose responsibility it is to focus on school-wide literacy practices? What does
she/he do? 12. Have the teachers received training on modeling for students strategies to use when reading to
improve comprehension? • Who provided this training?
13. Does your school have anything like teacher-coaches or teacher-leaders, who provide help to
other teachers, either by organizing workshops or opening their own classes to others to observe?
14. Are literacy issues regularly discussed during faculty meetings? 15. Does your school have book study groups for teachers? What books do they read? Are they
mandatory? 16. Have the teachers in your school received training on changing the classroom environment to
create a literacy friendly environment? Who provided this training? 17. How do you assess student literacy in your school? Do you use any assessments in addition to the
district or state standardized assessments? 18. How would you characterize relations between staff at your school? 19. Have you heard of the Cornerstone initiative? 20. What have you heard about it? 21. How did you find out about it? 22. Are there any additional comments you want to add about Cornerstone or the literacy practices in
your school?
Cornerstone Second Year Evaluation Report
102
Year 2 Interview Questions for Comparison School Teachers
1. How long have you been a teacher in this school? 2. What grade do you teach? What subject area do you teach? 3. Does your school implement any comprehensive school reform program? [(SFA, Comer, Accelerated
Schools, Modern red schoolhouse] 4. Does your school use any particular literacy programs/strategies school wide? [Accelerated Reader, 4
Blocks, or Reading Recovery, etc?] • Which ones? • Which grades are they used in?
5. Are there any specific programs used in your school for students who are falling behind? 6. Are you familiar with balanced literacy? What does this mean to you? Would you characterize your
approach to literacy as balanced? • Do the school use particular program for this? • What sort of training has teachers received to implement balanced literacy?
7. Are you familiar with guided reading? What does this mean to you? Do you use guided reading
when teaching literacy? • Do the school use particular program for this? • What sort of training did teachers receive?
8. Do you use any particular brand of Basal readers? What type? Is this used schoolwide? 9. Does your school have a literacy block?
• How long is it? How frequent is it? • How long has it been implemented? • What is the structure of the literacy block? Are there particular activities that all the teachers
and students should be doing during the literacy block? What are they? • Do you use this time solely for literacy learning?
Thank you for agreeing to participate in our interview. The purpose of this interview is to develop a better
understanding of early childhood literacy and professional development practices in your school, as part of
our evaluation of the Cornerstone early childhood literacy initiative. Your participation in this interview is
strictly voluntary, and will take approximately 30 minutes. If you choose to take part in this study, you will
be asked to answer questions about literacy practices and professional development in your school. You
may choose not to answer any question and/or to withdraw from the interview at any time, without any
negative consequences for you.
All information supplied by you will be strictly confidential. No names or other identifiers will be used
in our reports.
Cornerstone Second Year Evaluation Report
103
10. Are there professional development activities for teachers focused on student literacy? Provided by whom?
• What sort of theory of literacy lay behind the professional development?
• How effective would you say the professional development is? 11. Is there a person whose responsibility it is to focus on school-wide literacy practices? What does
she/he do? 12. Have the teachers received training on modeling for students strategies to use when reading to
improve comprehension? • Who provided this training?
13. Does your school have anything like teacher-coaches or teacher-leaders, who provide help to
other teachers, either by organizing workshops or opening their own classes to others to observe?
14. How does your school organize faculty meetings?
• Are literacy issues regularly discussed during faculty meetings? 15. Does your school have book study groups for teachers? What books do they read? Are they
mandatory? 16. Have the teachers in your school received training on changing the classroom environment to
create a literacy friendly environment? Who provided this training? 17. How do you assess student literacy in your school? Do you use any assessments in addition to the
district or state standardized assessments? 18. How would you characterize relations between staff at your school? 19. Have you heard of the Cornerstone initiative? 20. What have you heard about it? 21. How did you find out about it? 22. Are there any additional comments you want to add about Cornerstone or the literacy practices in
your school?
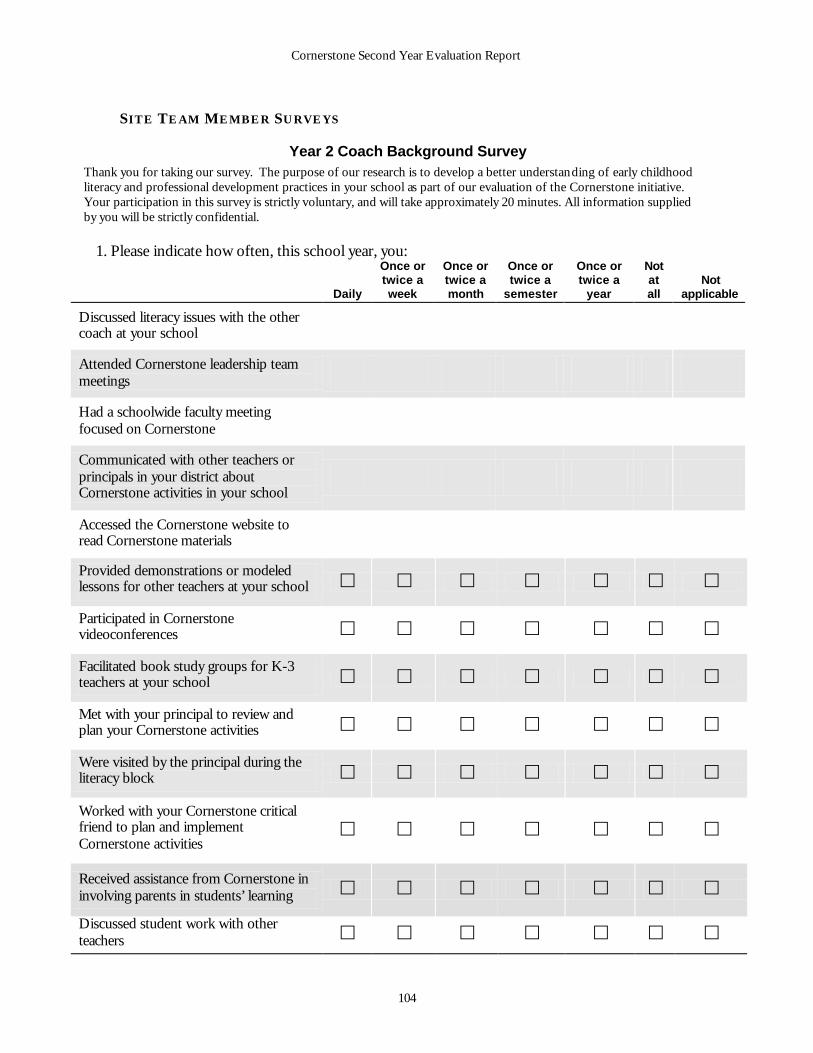
Cornerstone Second Year Evaluation Report
104
SITE TE A M MEMBER SURVEYS
Year 2 Coach Background Survey Thank you for taking our survey. The purpose of our research is to develop a better understanding of early childhood literacy and professional development practices in your school as part of our evaluation of the Cornerstone initiative. Your participation in this survey is strictly voluntary, and will take approximately 20 minutes. All information supplied by you will be strictly confidential.
1. Please indicate how often, this school year, you:
Daily
Once or twice a week
Once or twice a month
Once or twice a
semester
Once or twice a
year
Not at all
Not applicable
Discussed literacy issues with the other coach at your school � � � � � � � Attended Cornerstone leadership team meetings � � � � � � � Had a schoolwide faculty meeting focused on Cornerstone � � � � � � � Communicated with other teachers or principals in your district about Cornerstone activities in your school
� � � � � � � Accessed the Cornerstone website to read Cornerstone materials � � � � � � � Provided demonstrations or modeled lessons for other teachers at your school £ £ £ £ £ £ £
Participated in Cornerstone videoconferences £ £ £ £ £ £ £
Facilitated book study groups for K-3 teachers at your school £ £ £ £ £ £ £
Met with your principal to review and plan your Cornerstone activities £ £ £ £ £ £ £
Were visited by the principal during the literacy block £ £ £ £ £ £ £
Worked with your Cornerstone critical friend to plan and implement Cornerstone activities
£ £ £ £ £ £ £
Received assistance from Cornerstone in involving parents in students’ learning £ £ £ £ £ £ £
Discussed student work with other teachers £ £ £ £ £ £ £
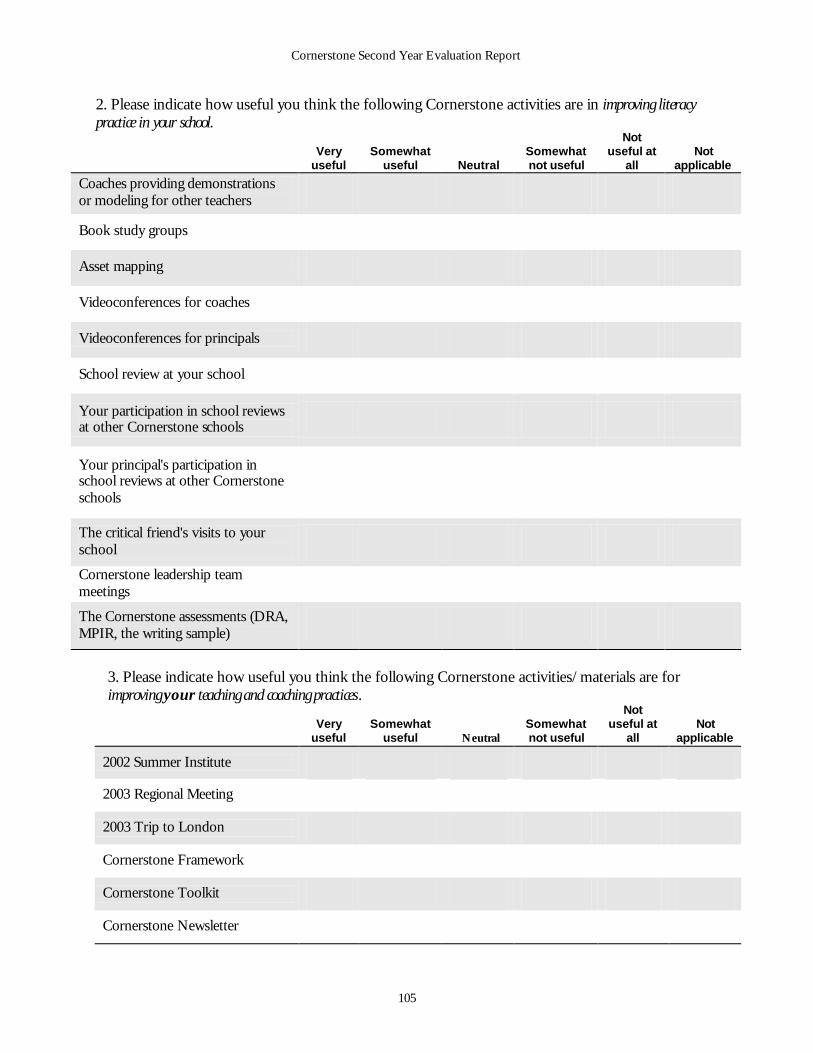
Cornerstone Second Year Evaluation Report
105
2. Please indicate how useful you think the following Cornerstone activities are in improving literacy practice in your school.
Very
useful Somewhat
useful Neutral Somewhat not useful
Not useful at
all Not
applicable
Coaches providing demonstrations or modeling for other teachers � � � � � � Book study groups � � � � � � Asset mapping � � � � � � Videoconferences for coaches � � � � � � Videoconferences for principals � � � � � � School review at your school � � � � � � Your participation in school reviews at other Cornerstone schools � � � � � � Your principal's participation in school reviews at other Cornerstone schools
� � � � � � The critical friend's visits to your school � � � � � � Cornerstone leadership team meetings � � � � � � The Cornerstone assessments (DRA, MPIR, the writing sample) � � � � � �
3. Please indicate how useful you think the following Cornerstone activities/materials are for improving your teaching and coaching practices.
Very
useful Somewhat
useful Neutral Somewhat not useful
Not useful at
all Not
applicable
2002 Summer Institute � � � � � � 2003 Regional Meeting � � � � � � 2003 Trip to London � � � � � � Cornerstone Framework � � � � � � Cornerstone Toolkit � � � � � � Cornerstone Newsletter � � � � � �
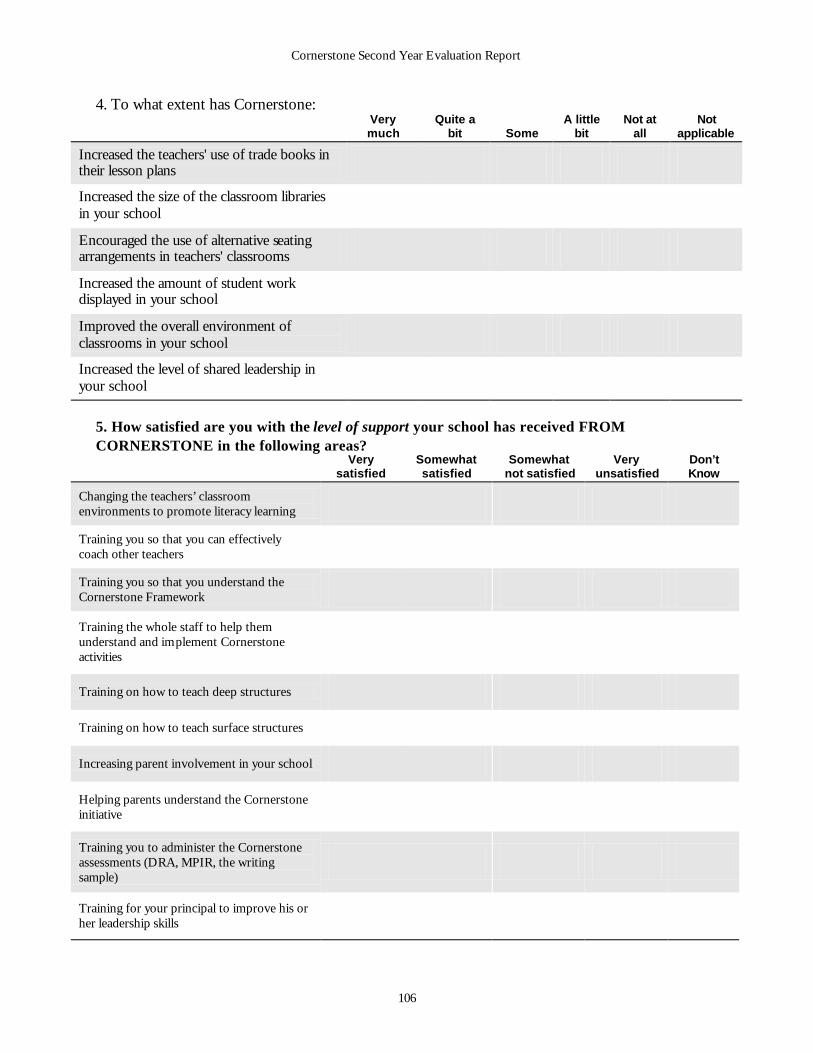
Cornerstone Second Year Evaluation Report
106
4. To what extent has Cornerstone: Very
much Quite a
bit Some A little
bit Not at
all Not
applicable
Increased the teachers' use of trade books in their lesson plans � � � � � � Increased the size of the classroom libraries in your school � � � � � � Encouraged the use of alternative seating arrangements in teachers' classrooms � � � � � � Increased the amount of student work displayed in your school � � � � � � Improved the overall environment of classrooms in your school � � � � � � Increased the level of shared leadership in your school � � � � � �
5. How satisfied are you with the level of support your school has received FROM CORNERSTONE in the following areas?
Very satisfied
Somewhat satisfied
Somewhat not satisfied
Very unsatisfied
Don’t Know
Changing the teachers’ classroom environments to promote literacy learning � � � � � Training you so that you can effectively coach other teachers � � � � � Training you so that you understand the Cornerstone Framework � � � � � Training the whole staff to help them understand and implement Cornerstone activities
� � � � � Training on how to teach deep structures � � � � � Training on how to teach surface structures � � � � � Increasing parent involvement in your school � � � � � Helping parents understand the Cornerstone initiative � � � � � Training you to administer the Cornerstone assessments (DRA, MPIR, the writing sample)
� � � � � Training for your principal to improve his or her leadership skills � � � � �

Cornerstone Second Year Evaluation Report
107
6. How satisfied are you with the level of support you receive from:
Very satisfied
Somewhat satisfied
Somewhat not
satisfied Very
unsatisfied Don’t know
Your critical friend � � � � � Your principal � � � � � Cornerstone staff around administrative matters (travel, scheduling, email/phone access, materials/supplies, etc.)
� � � � � Cornerstone staff around professional development matters (explanation of Framework and testing, role expectations/definitions, leadership training, etc.)
� � � � �
Your district strategy manager � � � � � Your Cornerstone district liaison � � � � � The other coach in your school � � � � �
7. Please indicate the extent to which you agree with the statements below about your school:
Strongly agree Agree Disagree
Strongly disagree Don’t know
Teachers are involved in making important decisions at this school � � � � � I am involved in making important decisions at this school � � � � � The principal has confidence in the expertise of the coaches � � � � � The principal is an instructional leader � � � � � Teachers respect colleagues who are expert teachers � � � � � Parents of children have an influence on school decisions � � � � � Parents regularly attend literacy/book-related events when they are invited � � � � � There is a feeling that everyone is working together toward common goals � � � � �
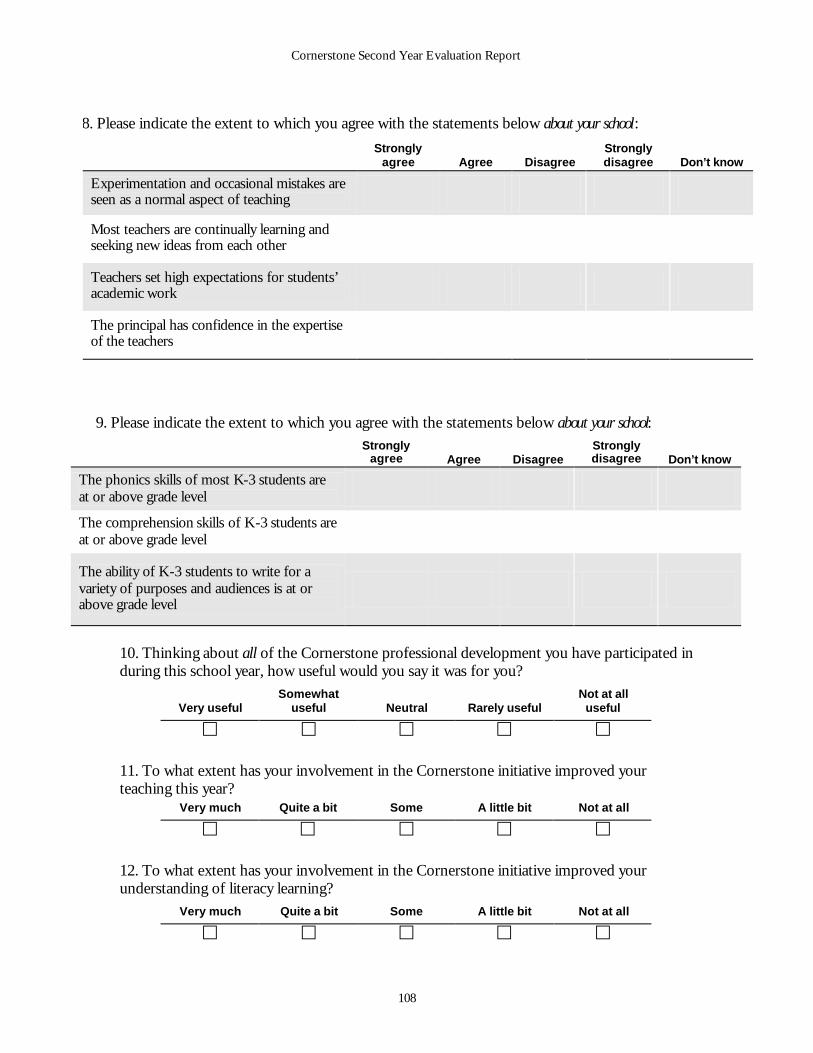
Cornerstone Second Year Evaluation Report
108
7. 8. Please indicate the extent to which you agree with the statements below about your school:
Strongly agree Agree Disagree
Strongly disagree Don’t know
Experimentation and occasional mistakes are seen as a normal aspect of teaching � � � � � Most teachers are continually learning and seeking new ideas from each other � � � � � Teachers set high expectations for students’ academic work � � � � � The principal has confidence in the expertise of the teachers � � � � � 9. Please indicate the extent to which you agree with the statements below about your school:
Strongly agree Agree Disagree
Strongly disagree Don’t know
The phonics skills of most K-3 students are at or above grade level � � � � � The comprehension skills of K-3 students are at or above grade level � � � � � The ability of K-3 students to write for a variety of purposes and audiences is at or above grade level
� � � � � 10. Thinking about all of the Cornerstone professional development you have participated in during this school year, how useful would you say it was for you?
Very useful Somewhat
useful Neutral Rarely useful Not at all
useful
£ £ £ £ £ 11. To what extent has your involvement in the Cornerstone initiative improved your teaching this year?
12. To what extent has your involvement in the Cornerstone initiative improved your understanding of literacy learning?
Very much Quite a bit Some A little bit Not at all
£ £ £ £ £
Very much Quite a bit Some A little bit Not at all
£ £ £ £ £
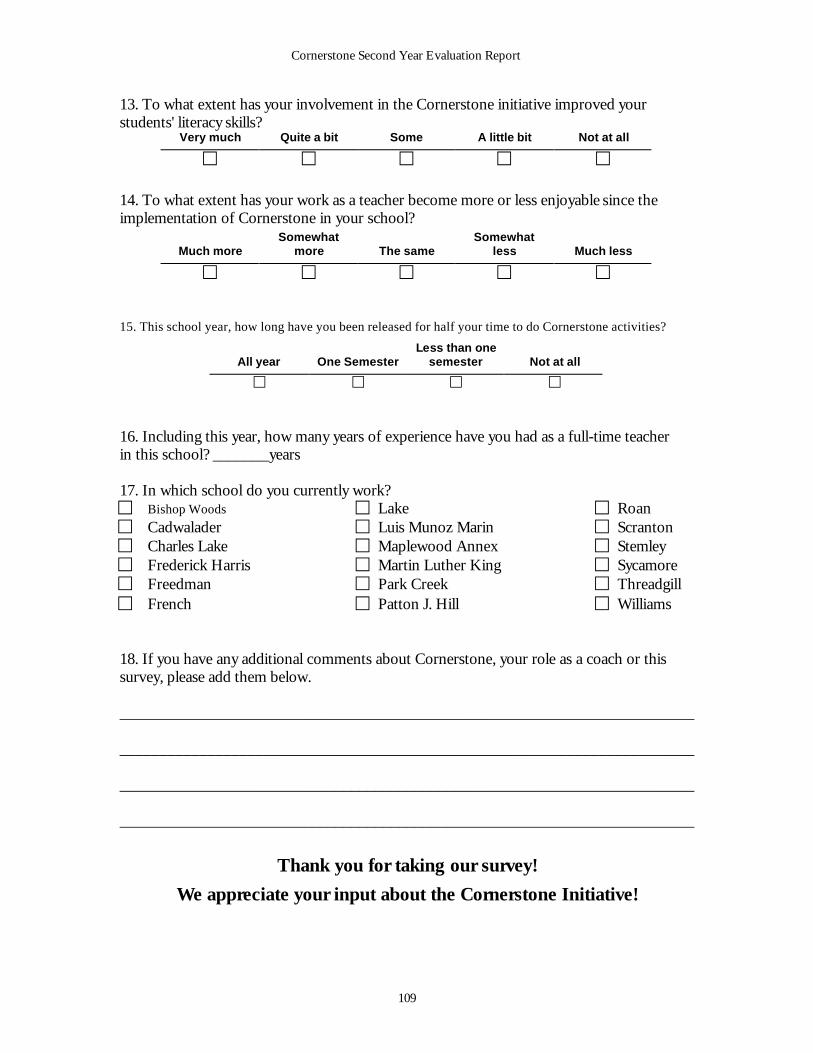
Cornerstone Second Year Evaluation Report
109
13. To what extent has your involvement in the Cornerstone initiative improved your students' literacy skills?
Very much Quite a bit Some A little bit Not at all
£ £ £ £ £ 14. To what extent has your work as a teacher become more or less enjoyable since the implementation of Cornerstone in your school?
Much more Somewhat
more The same Somewhat
less Much less
£ £ £ £ £ 15. This school year, how long have you been released for half your time to do Cornerstone activities?
All year One Semester Less than one
semester Not at all
£ £ £ £ 16. Including this year, how many years of experience have you had as a full-time teacher in this school? _______years 17. In which school do you currently work? £ Bishop Woods £ Lake £ Roan
£ Cadwalader £ Luis Munoz Marin £ Scranton £ Charles Lake £ Maplewood Annex £ Stemley £ Frederick Harris £ Martin Luther King £ Sycamore £ Freedman £ Park Creek £ Threadgill £ French £ Patton J. Hill £ Williams
18. If you have any additional comments about Cornerstone, your role as a coach or this survey, please add them below. ________________________________________________________________________
________________________________________________________________________
________________________________________________________________________
________________________________________________________________________
Thank you for taking our survey!
We appreciate your input about the Cornerstone Initiative!
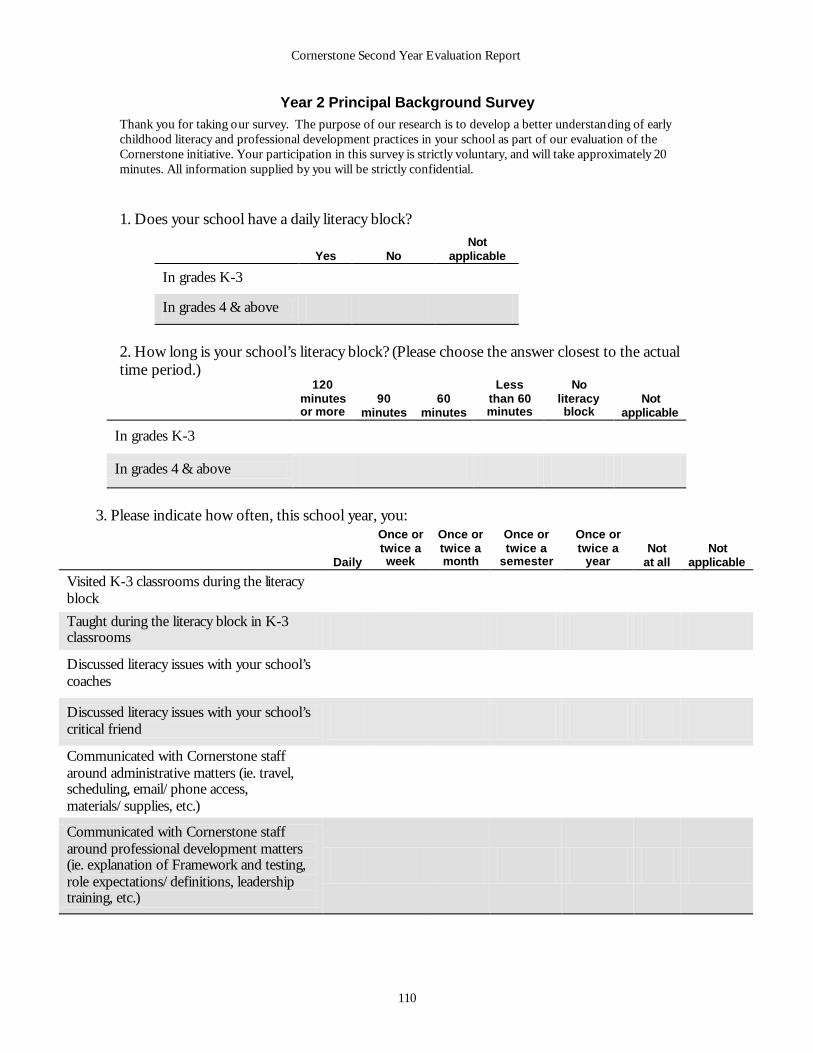
Cornerstone Second Year Evaluation Report
110
Year 2 Principal Background Survey Thank you for taking our survey. The purpose of our research is to develop a better understanding of early childhood literacy and professional development practices in your school as part of our evaluation of the Cornerstone initiative. Your participation in this survey is strictly voluntary, and will take approximately 20 minutes. All information supplied by you will be strictly confidential.
1. Does your school have a daily literacy block?
Yes No
Not applicable
In grades K-3 � � � In grades 4 & above � � �
2. How long is your school’s literacy block? (Please choose the answer closest to the actual time period.)
120 minutes or more
90 minutes
60 minutes
Less than 60 minutes
No literacy block
Not applicable
In grades K-3 � � � � � � In grades 4 & above � � � � � �
3. Please indicate how often, this school year, you:
Daily
Once or twice a week
Once or twice a month
Once or twice a
semester
Once or twice a
year Not
at all Not
applicable
Visited K-3 classrooms during the literacy block � � � � � � � Taught during the literacy block in K-3 classrooms � � � � � � � Discussed literacy issues with your school’s coaches � � � � � � � Discussed literacy issues with your school’s critical friend � � � � � � � Communicated with Cornerstone staff around administrative matters (ie. travel, scheduling, email/phone access, materials/supplies, etc.)
� � � � � � � Communicated with Cornerstone staff around professional development matters (ie. explanation of Framework and testing, role expectations/definitions, leadership training, etc.)
� � � � � � �
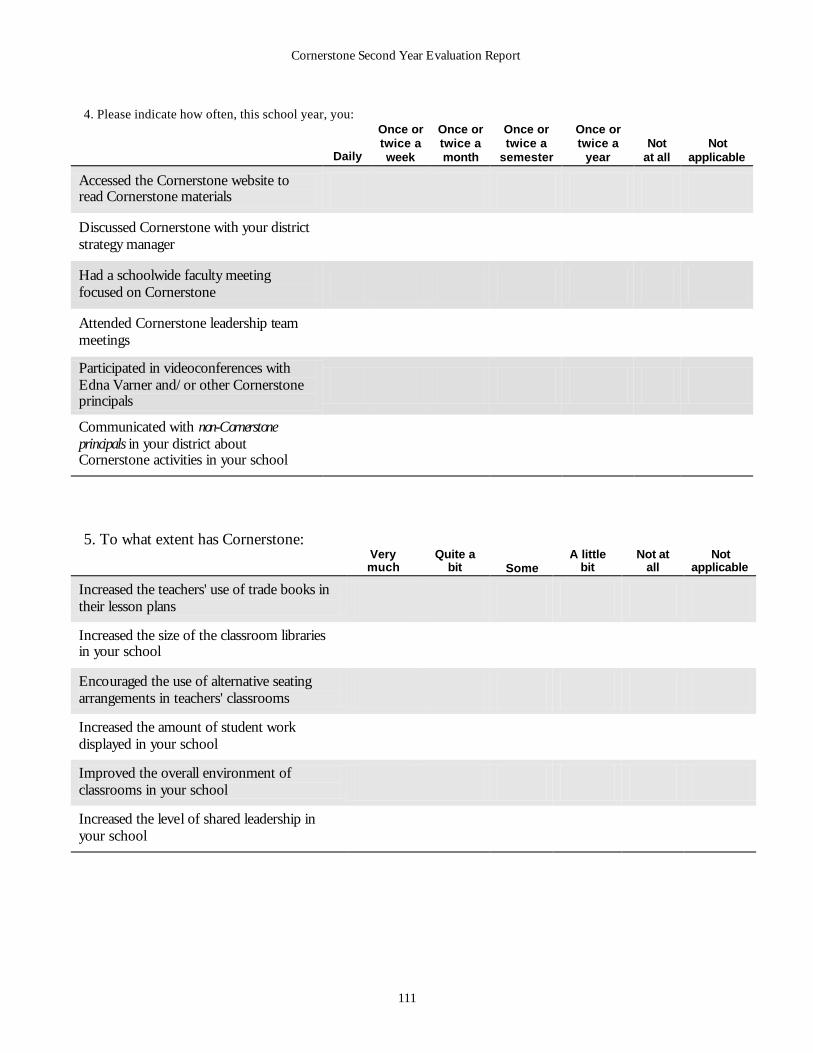
Cornerstone Second Year Evaluation Report
111
4. Please indicate how often, this school year, you:
Daily
Once or twice a week
Once or twice a month
Once or twice a
semester
Once or twice a
year Not
at all Not
applicable
Accessed the Cornerstone website to read Cornerstone materials � � � � � � � Discussed Cornerstone with your district strategy manager � � � � � � � Had a schoolwide faculty meeting focused on Cornerstone � � � � � � � Attended Cornerstone leadership team meetings � � � � � � � Participated in videoconferences with Edna Varner and/or other Cornerstone principals
� � � � � � � Communicated with non-Cornerstone principals in your district about Cornerstone activities in your school
� � � � � � �
5. To what extent has Cornerstone:
Very much
Quite a bit Some
A little bit
Not at all
Not applicable
Increased the teachers' use of trade books in their lesson plans � � � � � � Increased the size of the classroom libraries in your school � � � � � � Encouraged the use of alternative seating arrangements in teachers' classrooms � � � � � � Increased the amount of student work displayed in your school � � � � � � Improved the overall environment of classrooms in your school � � � � � � Increased the level of shared leadership in your school � � � � � �
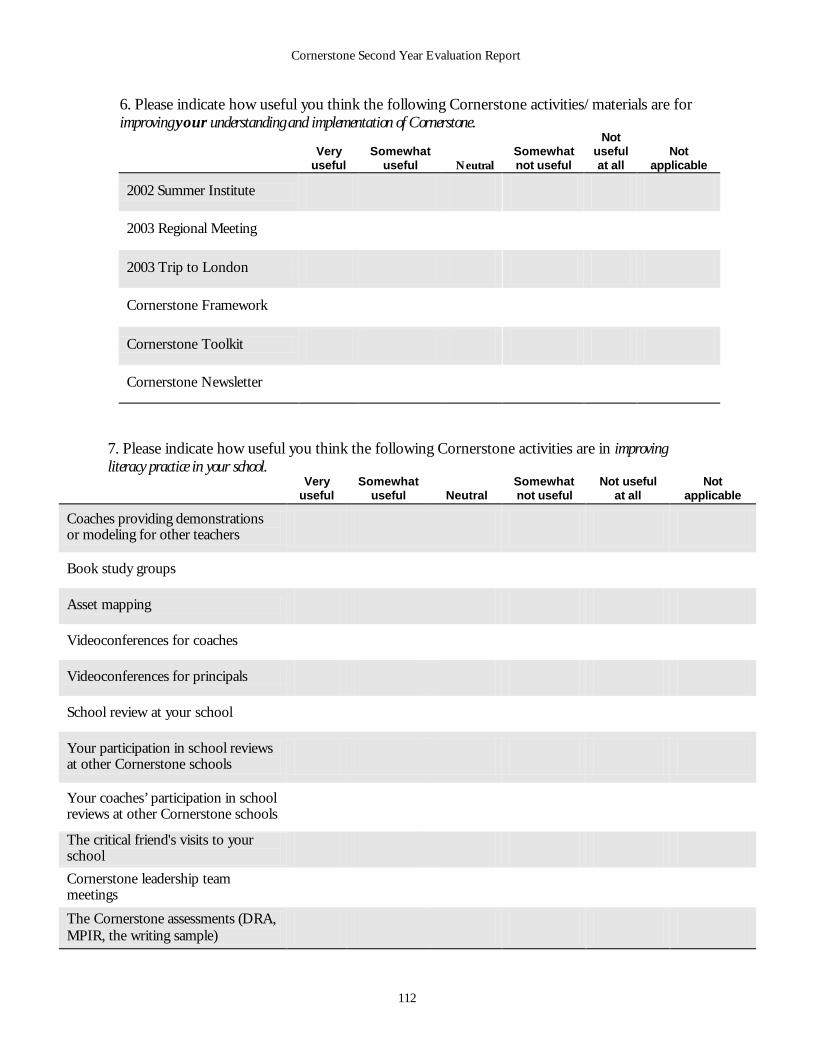
Cornerstone Second Year Evaluation Report
112
6. Please indicate how useful you think the following Cornerstone activities/materials are for improving your understanding and implementation of Cornerstone.
Very useful
Somewhat useful Neutral
Somewhat not useful
Not useful at all
Not applicable
2002 Summer Institute � � � � � � 2003 Regional Meeting � � � � � � 2003 Trip to London � � � � � � Cornerstone Framework � � � � � � Cornerstone Toolkit � � � � � � Cornerstone Newsletter � � � � � �
7. Please indicate how useful you think the following Cornerstone activities are in improving literacy practice in your school.
Very useful
Somewhat useful Neutral
Somewhat not useful
Not useful at all
Not applicable
Coaches providing demonstrations or modeling for other teachers � � � � � � Book study groups � � � � � � Asset mapping � � � � � � Videoconferences for coaches � � � � � � Videoconferences for principals � � � � � � School review at your school � � � � � � Your participation in school reviews at other Cornerstone schools � � � � � � Your coaches’ participation in school reviews at other Cornerstone schools � � � � � � The critical friend's visits to your school � � � � � � Cornerstone leadership team meetings � � � � � � The Cornerstone assessments (DRA, MPIR, the writing sample) � � � � � �
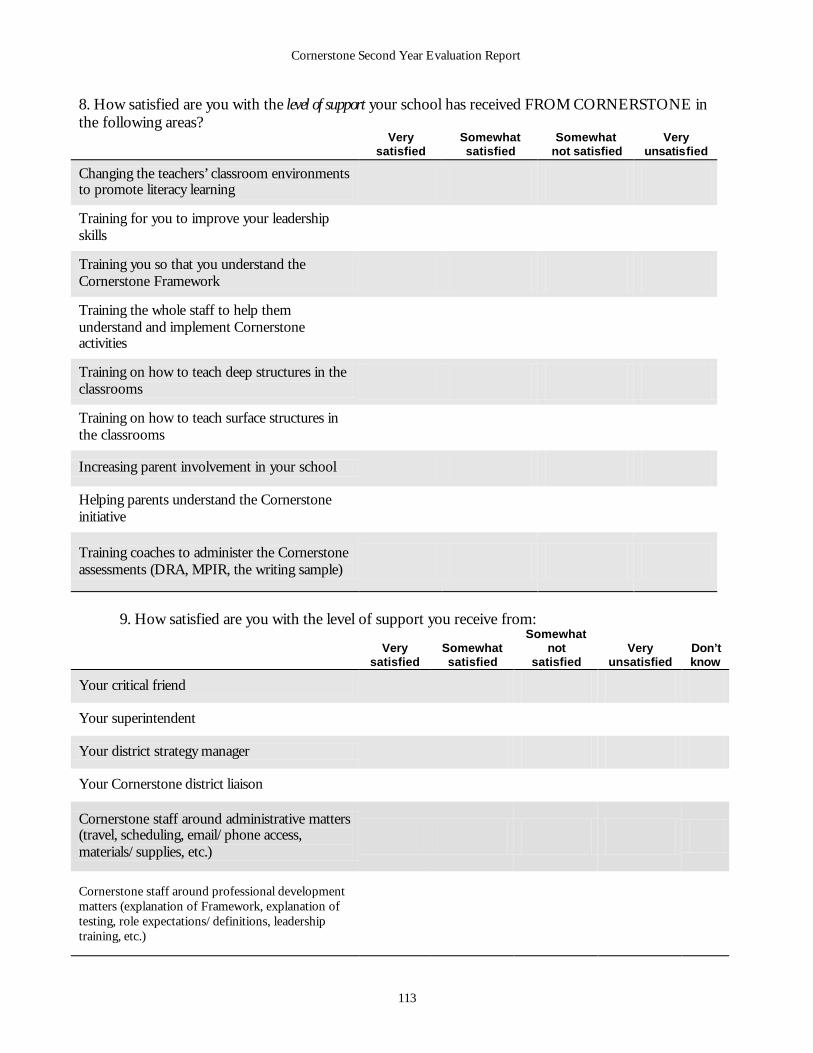
Cornerstone Second Year Evaluation Report
113
8. How satisfied are you with the level of support your school has received FROM CORNERSTONE in the following areas? Very
satisfied Somewhat satisfied
Somewhat not satisfied
Very unsatisfied
Changing the teachers’ classroom environments to promote literacy learning � � � � Training for you to improve your leadership skills � � � � Training you so that you understand the Cornerstone Framework � � � � Training the whole staff to help them understand and implement Cornerstone activities
� � � � Training on how to teach deep structures in the classrooms � � � � Training on how to teach surface structures in the classrooms � � � � Increasing parent involvement in your school � � � � Helping parents understand the Cornerstone initiative � � � � Training coaches to administer the Cornerstone assessments (DRA, MPIR, the writing sample) � � � �
9. How satisfied are you with the level of support you receive from:
Very
satisfied Somewhat satisfied
Somewhat not
satisfied Very
unsatisfied Don’t know
Your critical friend � � � � � Your superintendent � � � � � Your district strategy manager � � � � � Your Cornerstone district liaison � � � � � Cornerstone staff around administrative matters (travel, scheduling, email/phone access, materials/supplies, etc.)
� � � � �
Cornerstone staff around professional development matters (explanation of Framework, explanation of testing, role expectations/definitions, leadership training, etc.)
� � � � �
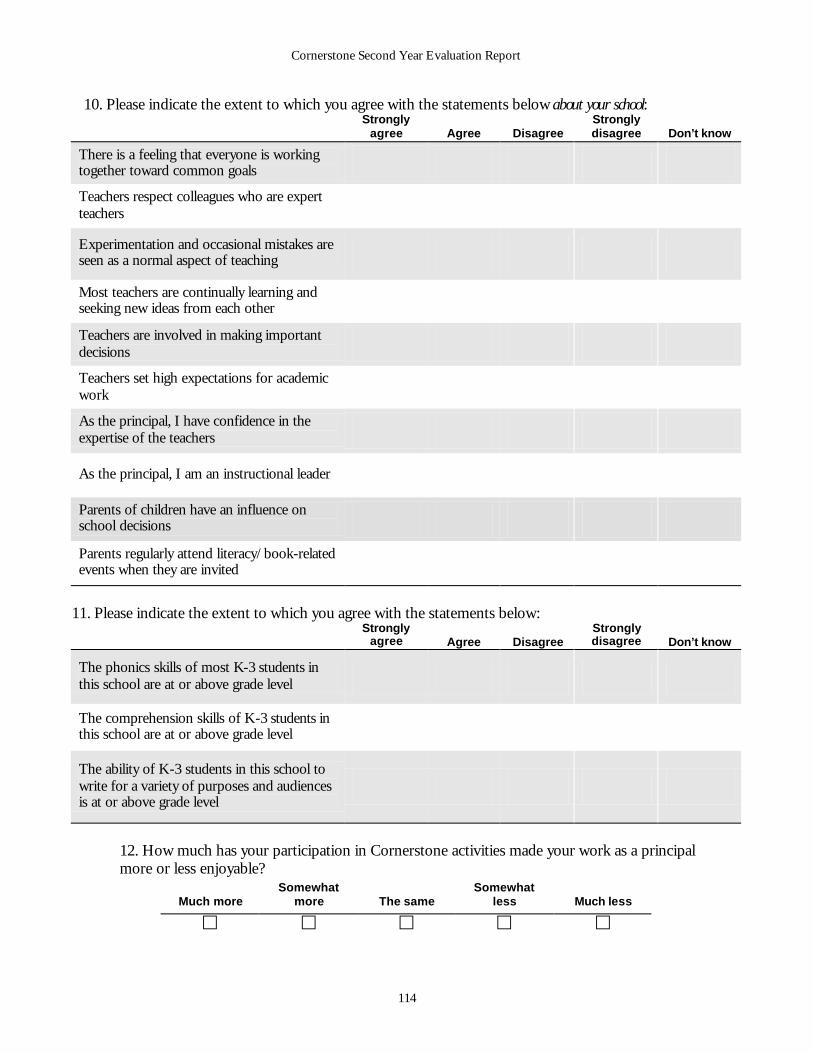
Cornerstone Second Year Evaluation Report
114
10. Please indicate the extent to which you agree with the statements below about your school: Strongly
agree Agree Disagree Strongly disagree Don’t know
There is a feeling that everyone is working together toward common goals � � � � � Teachers respect colleagues who are expert teachers � � � � � Experimentation and occasional mistakes are seen as a normal aspect of teaching � � � � � Most teachers are continually learning and seeking new ideas from each other � � � � � Teachers are involved in making important decisions � � � � � Teachers set high expectations for academic work � � � � � As the principal, I have confidence in the expertise of the teachers � � � � � As the principal, I am an instructional leader � � � � � Parents of children have an influence on school decisions � � � � � Parents regularly attend literacy/book-related events when they are invited � � � � �
11. Please indicate the extent to which you agree with the statements below: Strongly
agree Agree Disagree Strongly disagree Don’t know
The phonics skills of most K-3 students in this school are at or above grade level � � � � � The comprehension skills of K-3 students in this school are at or above grade level � � � � � The ability of K-3 students in this school to write for a variety of purposes and audiences is at or above grade level
� � � � � 12. How much has your participation in Cornerstone activities made your work as a principal more or less enjoyable?
Much more Somewhat
more The same Somewhat
less Much less
£ £ £ £ £
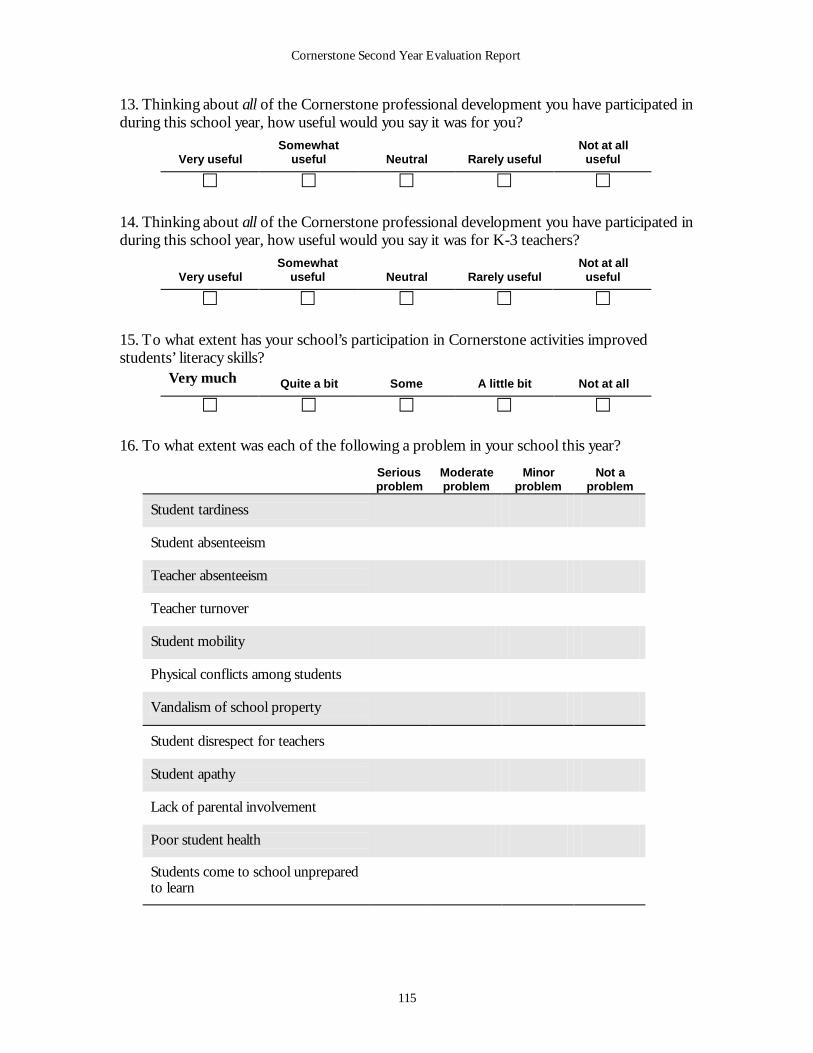
Cornerstone Second Year Evaluation Report
115
13. Thinking about all of the Cornerstone professional development you have participated in during this school year, how useful would you say it was for you?
Very useful Somewhat
useful Neutral Rarely useful Not at all
useful
£ £ £ £ £ 14. Thinking about all of the Cornerstone professional development you have participated in during this school year, how useful would you say it was for K-3 teachers?
15. To what extent has your school’s participation in Cornerstone activities improved students’ literacy skills?
Very much Quite a bit Some A little bit Not at all
£ £ £ £ £ 16. To what extent was each of the following a problem in your school this year?
Serious problem
Moderate problem
Minor problem
Not a problem
Student tardiness � � � � Student absenteeism � � � � Teacher absenteeism � � � � Teacher turnover � � � � Student mobility � � � � Physical conflicts among students � � � � Vandalism of school property � � � � Student disrespect for teachers � � � � Student apathy � � � � Lack of parental involvement � � � � Poor student health � � � � Students come to school unprepared to learn � � � �
Very useful Somewhat
useful Neutral Rarely useful Not at all
useful
£ £ £ £ £
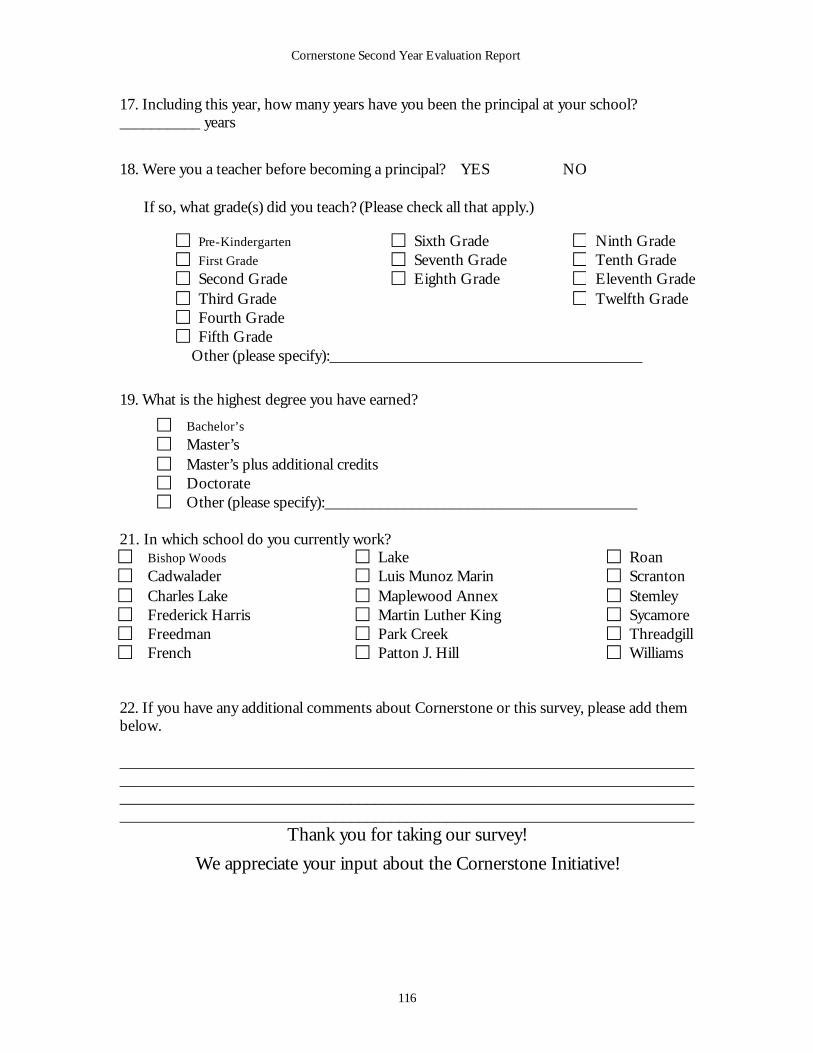
Cornerstone Second Year Evaluation Report
116
17. Including this year, how many years have you been the principal at your school? __________ years
18. Were you a teacher before becoming a principal? YES � NO �
If so, what grade(s) did you teach? (Please check all that apply.)
£ Pre-Kindergarten £ Sixth Grade £ Ninth Grade £ First Grade £ Seventh Grade £ Tenth Grade £ Second Grade £ Eighth Grade £ Eleventh Grade £ Third Grade £ Twelfth Grade £ Fourth Grade £ Fifth Grade
Other (please specify):_______________________________________
19. What is the highest degree you have earned?
£ Bachelor’s
£ Master’s £ Master’s plus additional credits £ Doctorate £ Other (please specify):_______________________________________
21. In which school do you currently work? £ Bishop Woods £ Lake £ Roan
£ Cadwalader £ Luis Munoz Marin £ Scranton £ Charles Lake £ Maplewood Annex £ Stemley £ Frederick Harris £ Martin Luther King £ Sycamore £ Freedman £ Park Creek £ Threadgill £ French £ Patton J. Hill £ Williams
22. If you have any additional comments about Cornerstone or this survey, please add them below. ________________________________________________________________________________________________________________________________________________________________________________________________________________________________________________________________________________________________
Thank you for taking our survey!
We appreciate your input about the Cornerstone Initiative!
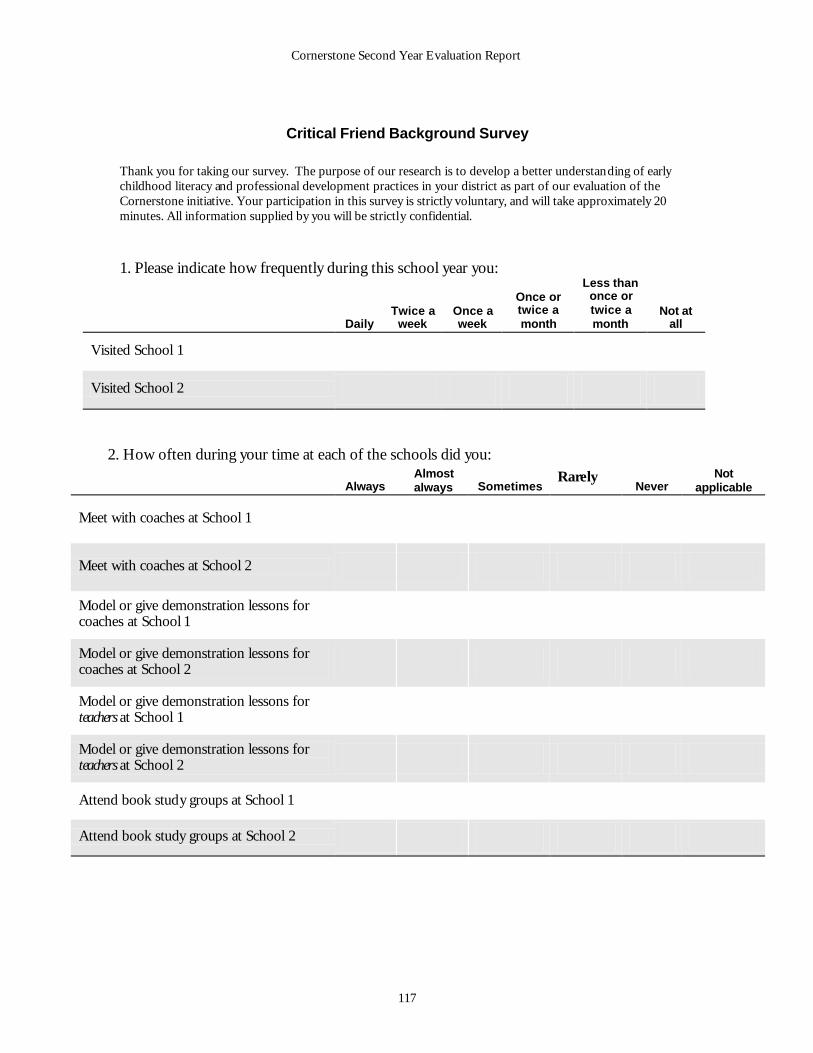
Cornerstone Second Year Evaluation Report
117
Critical Friend Background Survey
Thank you for taking our survey. The purpose of our research is to develop a better understanding of early childhood literacy and professional development practices in your district as part of our evaluation of the Cornerstone initiative. Your participation in this survey is strictly voluntary, and will take approximately 20 minutes. All information supplied by you will be strictly confidential. 1. Please indicate how frequently during this school year you:
Daily Twice a
week Once a week
Once or twice a month
Less than once or twice a month
Not at all
Visited School 1 � � � � � � Visited School 2 � � � � � �
2. How often during your time at each of the schools did you:
Always Almost always Sometimes
Rarely Never
Not applicable
Meet with coaches at School 1 � � � � � �
Meet with coaches at School 2 � � � � � � Model or give demonstration lessons for coaches at School 1 � � � � � � Model or give demonstration lessons for coaches at School 2 � � � � � � Model or give demonstration lessons for teachers at School 1 � � � � � � Model or give demonstration lessons for teachers at School 2 � � � � � �
Attend book study groups at School 1 � � � � � � Attend book study groups at School 2 � � � � � �
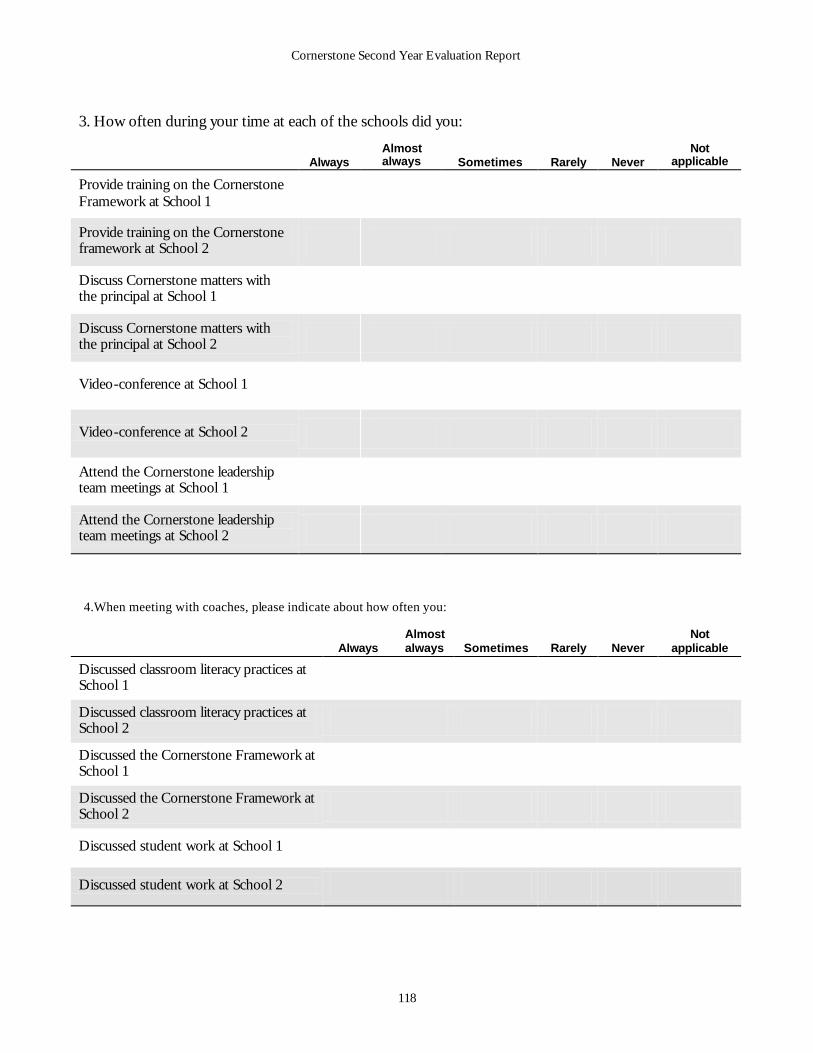
Cornerstone Second Year Evaluation Report
118
3. How often during your time at each of the schools did you:
Always Almost always Sometimes Rarely Never
Not applicable
Provide training on the Cornerstone Framework at School 1 � � � � � � Provide training on the Cornerstone framework at School 2 � � � � � � Discuss Cornerstone matters with the principal at School 1 � � � � � � Discuss Cornerstone matters with the principal at School 2 � � � � � �
Video-conference at School 1 � � � � � �
Video-conference at School 2 � � � � � � Attend the Cornerstone leadership team meetings at School 1 � � � � � � Attend the Cornerstone leadership team meetings at School 2 � � � � � �
4.When meeting with coaches, please indicate about how often you: Always
Almost always Sometimes Rarely Never
Not applicable
Discussed classroom literacy practices at School 1 � � � � � � Discussed classroom literacy practices at School 2 � � � � � � Discussed the Cornerstone Framework at School 1 � � � � � � Discussed the Cornerstone Framework at School 2 � � � � � � Discussed student work at School 1 � � � � � � Discussed student work at School 2 � � � � � �
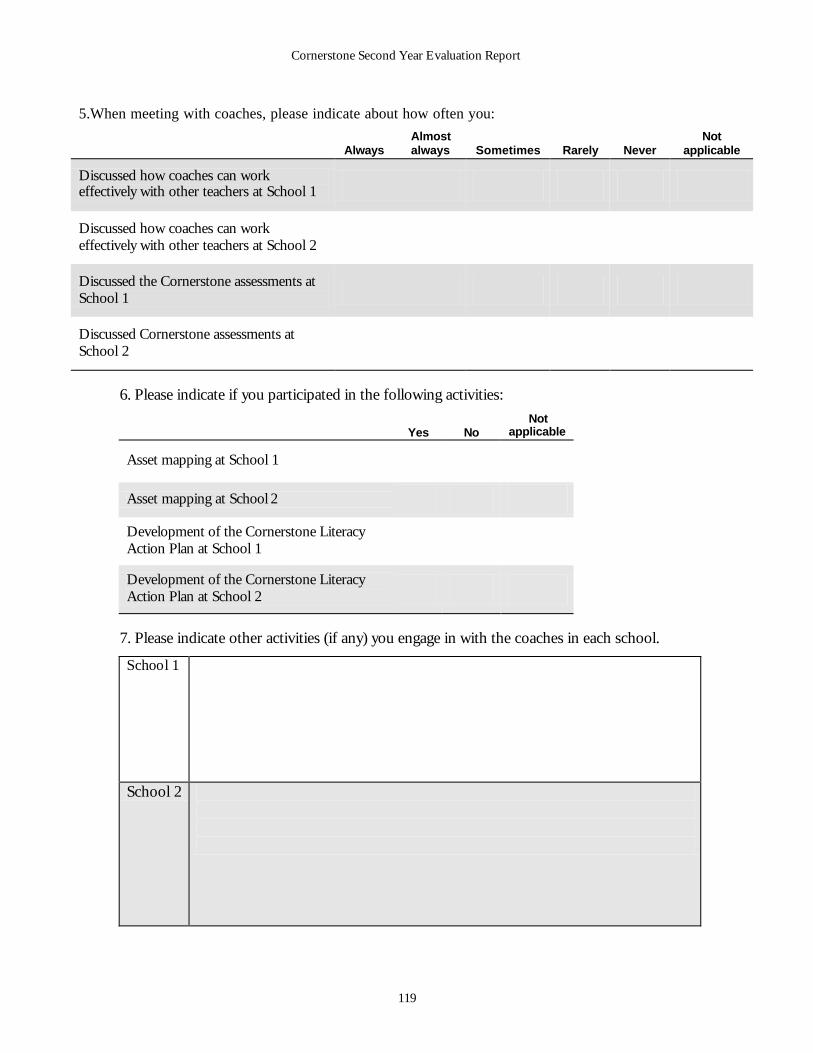
Cornerstone Second Year Evaluation Report
119
5.When meeting with coaches, please indicate about how often you:
Always Almost always Sometimes Rarely Never
Not applicable
Discussed how coaches can work effectively with other teachers at School 1 � � � � � �
Discussed how coaches can work effectively with other teachers at School 2 � � � � � �
Discussed the Cornerstone assessments at School 1 � � � � � �
Discussed Cornerstone assessments at School 2 � � � � � �
6. Please indicate if you participated in the following activities:
Yes No
Not applicable
Asset mapping at School 1 � � � Asset mapping at School 2 � � � Development of the Cornerstone Literacy Action Plan at School 1 � � � Development of the Cornerstone Literacy Action Plan at School 2 � � �
7. Please indicate other activities (if any) you engage in with the coaches in each school.
School 1
School 2
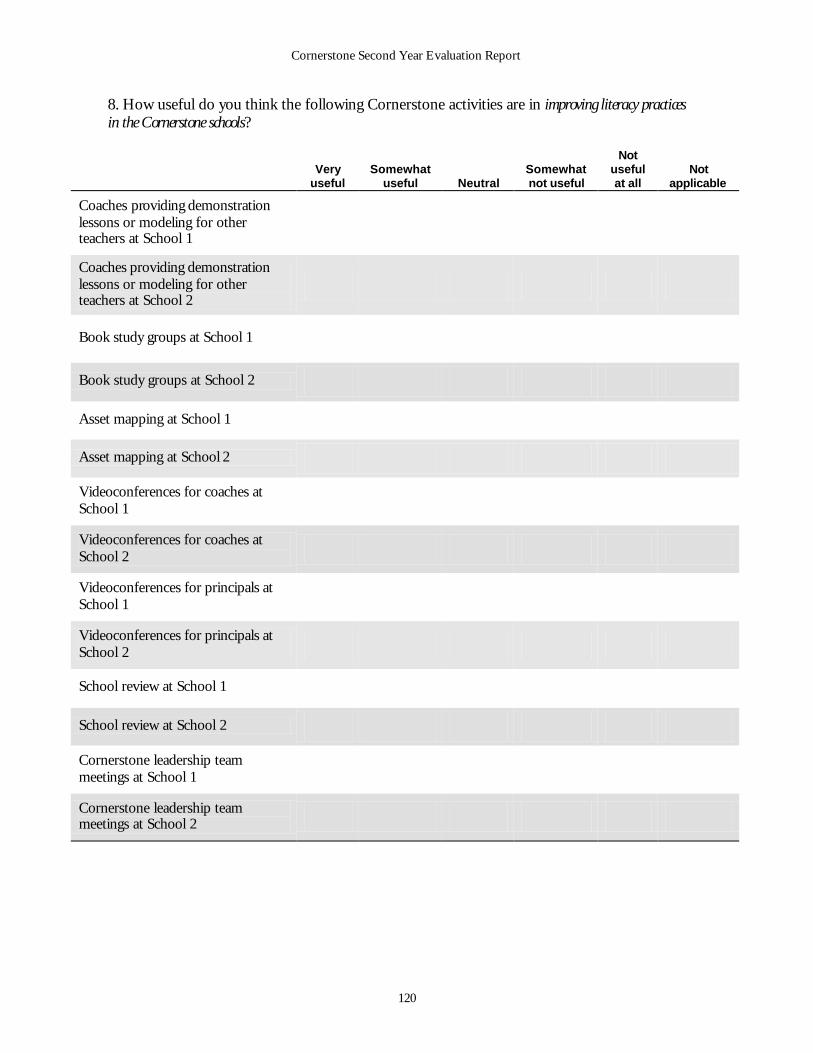
Cornerstone Second Year Evaluation Report
120
8. How useful do you think the following Cornerstone activities are in improving literacy practices in the Cornerstone schools?
Very
useful Somewhat
useful Neutral Somewhat not useful
Not useful at all
Not applicable
Coaches providing demonstration lessons or modeling for other teachers at School 1
� � � � � �
Coaches providing demonstration lessons or modeling for other teachers at School 2
� � � � � �
Book study groups at School 1 � � � � � �
Book study groups at School 2 � � � � � � Asset mapping at School 1 � � � � � � Asset mapping at School 2 � � � � � � Videoconferences for coaches at School 1 � � � � � � Videoconferences for coaches at School 2 � � � � � � Videoconferences for principals at School 1 � � � � � � Videoconferences for principals at School 2 � � � � � �
School review at School 1 � � � � � � School review at School 2 � � � � � � Cornerstone leadership team meetings at School 1 � � � � � � Cornerstone leadership team meetings at School 2 � � � � � �
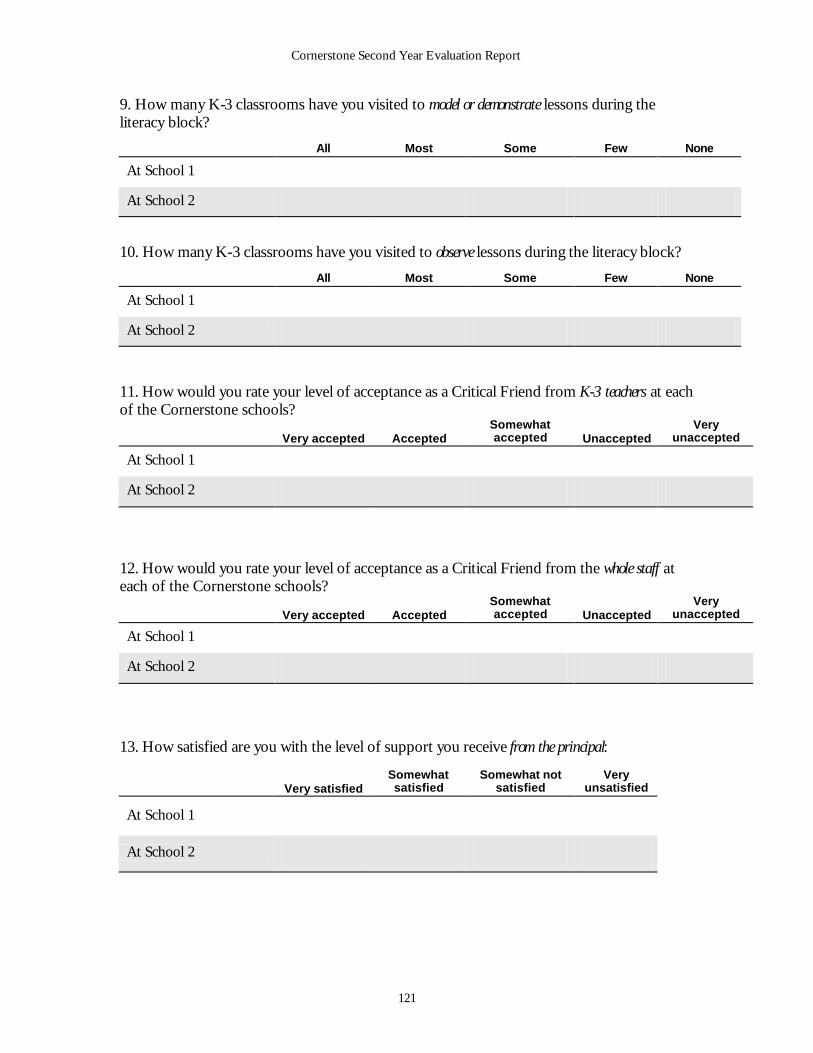
Cornerstone Second Year Evaluation Report
121
9. How many K-3 classrooms have you visited to model or demonstrate lessons during the literacy block?
All Most Some Few None
At School 1 � � � � � At School 2 � � � � �
10. How many K-3 classrooms have you visited to observe lessons during the literacy block?
All Most Some Few None
At School 1 � � � � � At School 2 � � � � �
11. How would you rate your level of acceptance as a Critical Friend from K-3 teachers at each of the Cornerstone schools?
Very accepted Accepted Somewhat accepted Unaccepted
Very unaccepted
At School 1 � � � � � At School 2 � � � � �
12. How would you rate your level of acceptance as a Critical Friend from the whole staff at each of the Cornerstone schools?
Very accepted Accepted Somewhat accepted Unaccepted
Very unaccepted
At School 1 � � � � � At School 2 � � � � �
13. How satisfied are you with the level of support you receive from the principal:
Very satisfied
Somewhat satisfied
Somewhat not satisfied
Very unsatisfied
At School 1 � � � � At School 2 � � � �
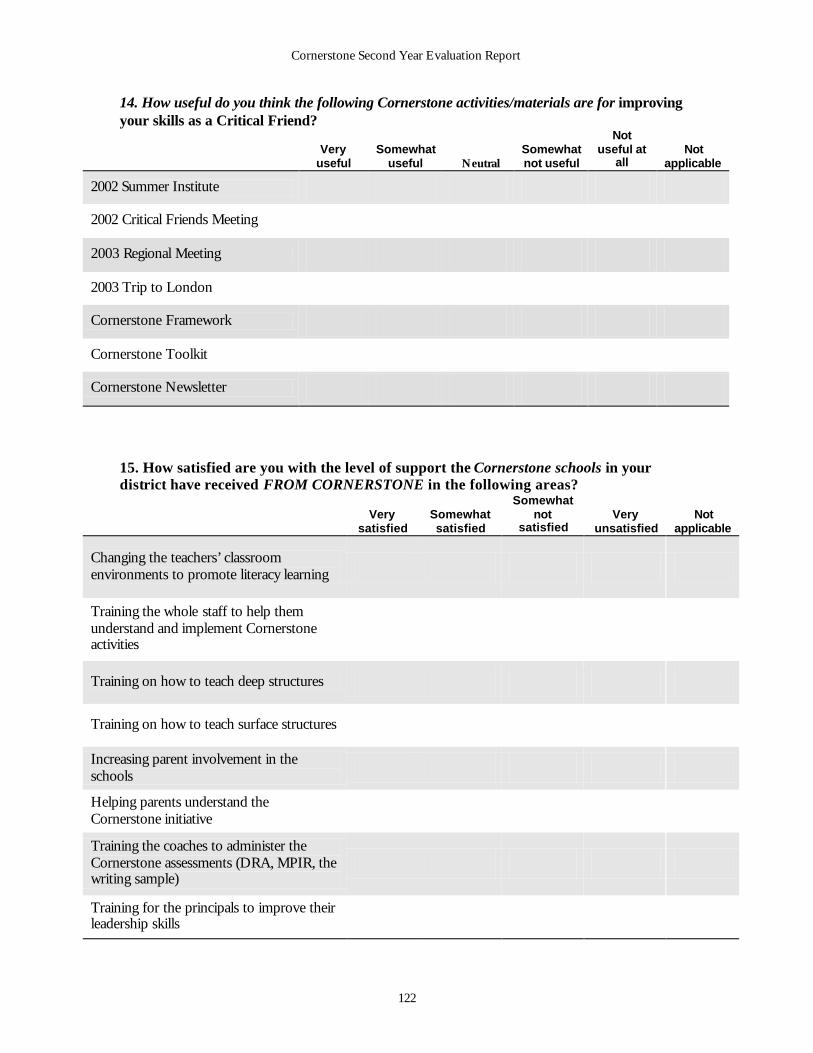
Cornerstone Second Year Evaluation Report
122
14. How useful do you think the following Cornerstone activities/materials are for improving your skills as a Critical Friend?
Very
useful Somewhat
useful Neutral Somewhat not useful
Not useful at
all Not
applicable
2002 Summer Institute � � � � � � 2002 Critical Friends Meeting � � � � � � 2003 Regional Meeting � � � � � � 2003 Trip to London � � � � � � Cornerstone Framework � � � � � � Cornerstone Toolkit � � � � � � Cornerstone Newsletter � � � � � �
15. How satisfied are you with the level of support the Cornerstone schools in your district have received FROM CORNERSTONE in the following areas?
Very
satisfied Somewhat satisfied
Somewhat not
satisfied Very
unsatisfied Not
applicable
Changing the teachers’ classroom environments to promote literacy learning � � � � �
Training the whole staff to help them understand and implement Cornerstone activities
� � � � �
Training on how to teach deep structures � � � � �
Training on how to teach surface structures � � � � � Increasing parent involvement in the schools � � � � � Helping parents understand the Cornerstone initiative � � � � � Training the coaches to administer the Cornerstone assessments (DRA, MPIR, the writing sample)
� � � � �
Training for the principals to improve their leadership skills � � � � �
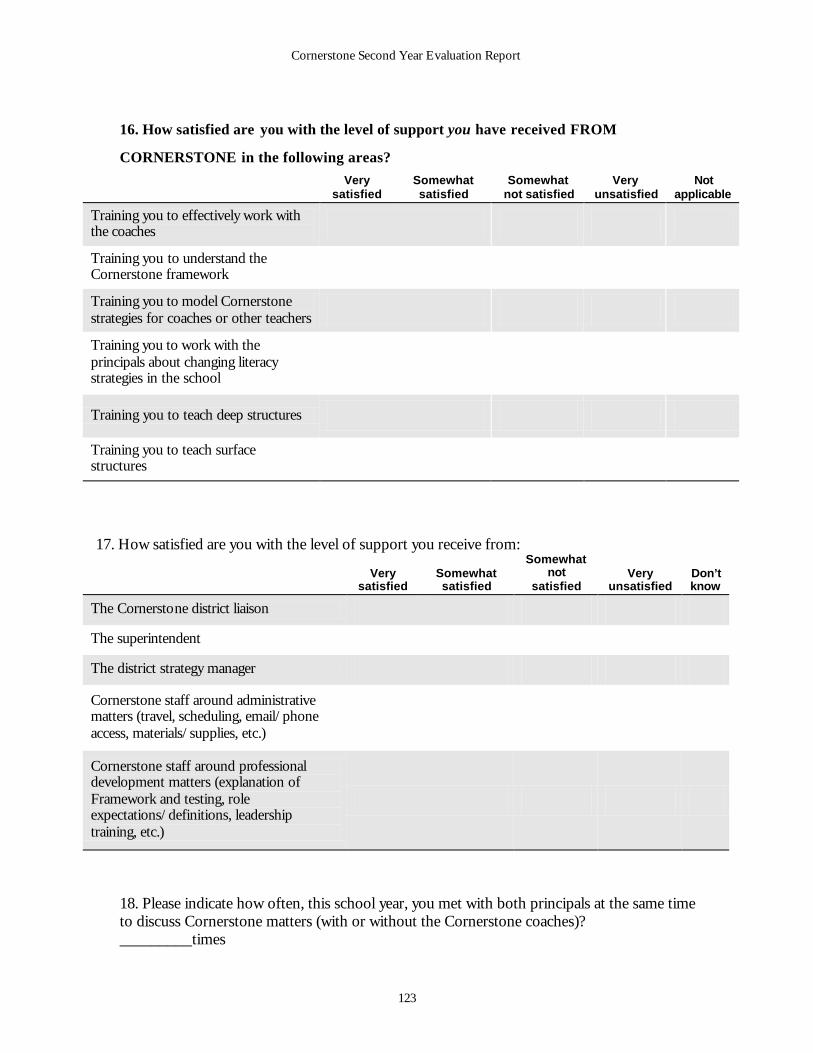
Cornerstone Second Year Evaluation Report
123
16. How satisfied are you with the level of support you have received FROM
CORNERSTONE in the following areas?
Very satisfied
Somewhat satisfied
Somewhat not satisfied
Very unsatisfied
Not applicable
Training you to effectively work with the coaches � � � � � Training you to understand the Cornerstone framework � � � � � Training you to model Cornerstone strategies for coaches or other teachers � � � � � Training you to work with the principals about changing literacy strategies in the school
� � � � �
Training you to teach deep structures � � � � � Training you to teach surface structures � � � � �
17. How satisfied are you with the level of support you receive from:
Very satisfied
Somewhat satisfied
Somewhat not
satisfied Very
unsatisfied Don’t know
The Cornerstone district liaison � � � � � The superintendent � � � � � The district strategy manager � � � � � Cornerstone staff around administrative matters (travel, scheduling, email/phone access, materials/supplies, etc.)
� � � � �
Cornerstone staff around professional development matters (explanation of Framework and testing, role expectations/definitions, leadership training, etc.)
� � � � �
18. Please indicate how often, this school year, you met with both principals at the same time to discuss Cornerstone matters (with or without the Cornerstone coaches)? _________times
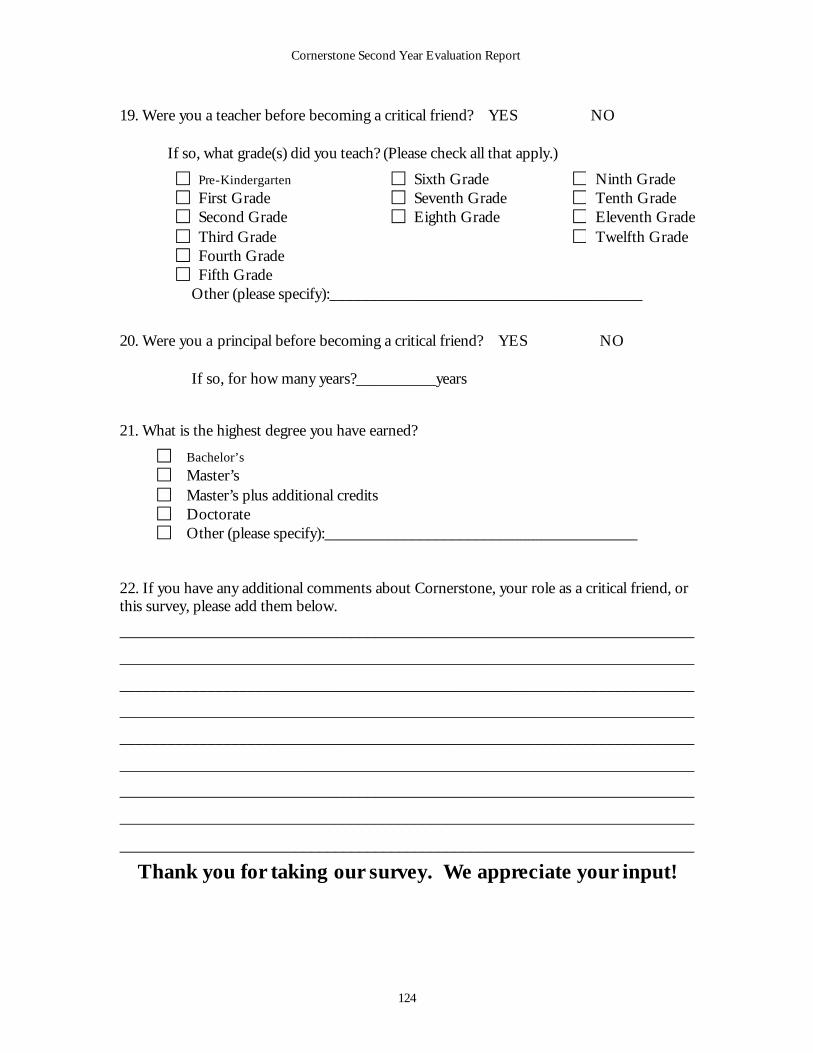
Cornerstone Second Year Evaluation Report
124
19. Were you a teacher before becoming a critical friend? YES � NO �
If so, what grade(s) did you teach? (Please check all that apply.)
£ Pre-Kindergarten £ Sixth Grade £ Ninth Grade £ First Grade £ Seventh Grade £ Tenth Grade £ Second Grade £ Eighth Grade £ Eleventh Grade £ Third Grade £ Twelfth Grade £ Fourth Grade £ Fifth Grade
Other (please specify):_______________________________________
20. Were you a principal before becoming a critical friend? YES � NO �
If so, for how many years?__________years
21. What is the highest degree you have earned?
£ Bachelor’s
£ Master’s £ Master’s plus additional credits £ Doctorate £ Other (please specify):_______________________________________
22. If you have any additional comments about Cornerstone, your role as a critical friend, or this survey, please add them below.
________________________________________________________________________
________________________________________________________________________
________________________________________________________________________
________________________________________________________________________
________________________________________________________________________
________________________________________________________________________
________________________________________________________________________
________________________________________________________________________
________________________________________________________________________
Thank you for taking our survey. We appreciate your input!
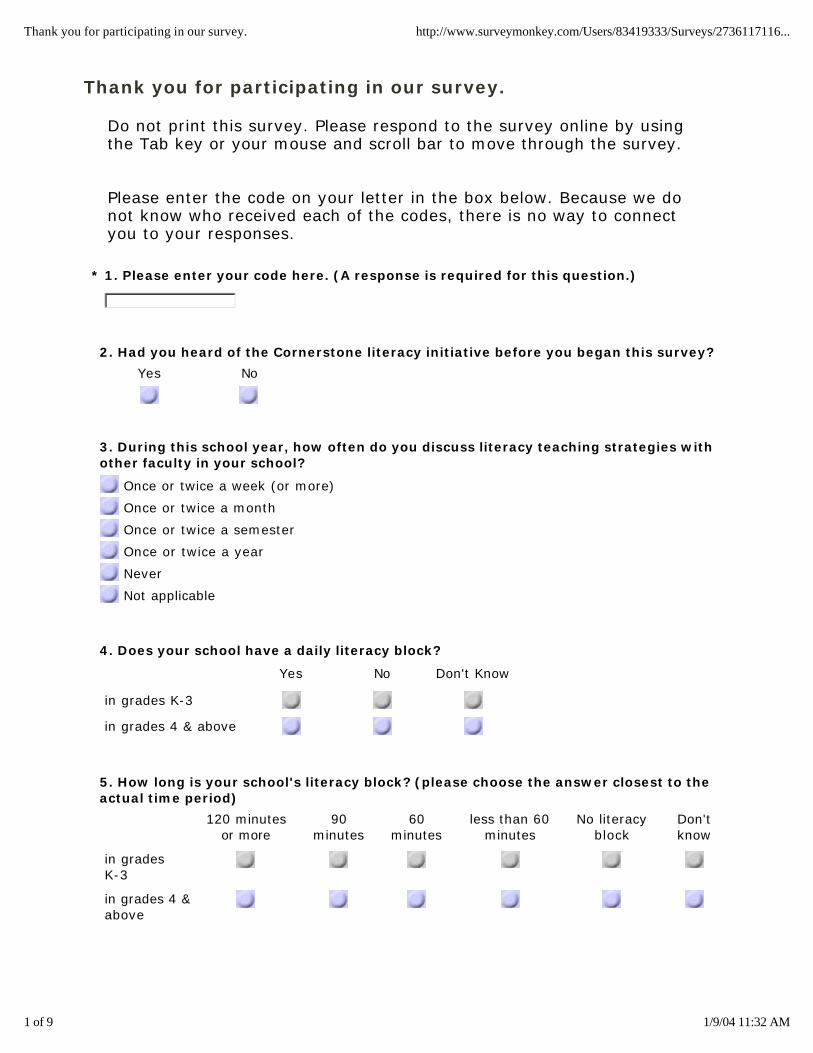
Thank you for participating in our survey. http://www.surveymonkey.com/Users/83419333/Surveys/2736117116...
1 of 9 1/9/04 11:32 AM
Thank you for participating in our survey.
Do not print this survey. Please respond to the survey online by usingthe Tab key or your mouse and scroll bar to move through the survey.
Please enter the code on your letter in the box below. Because we donot know who received each of the codes, there is no way to connect you to your responses.
* 1. Please enter your code here. (A response is required for this question.)
2. Had you heard of the Cornerstone literacy initiative before you began this survey?
Yes No
3. During this school year, how often do you discuss literacy teaching strategies withother faculty in your school?
Once or twice a week (or more)
Once or twice a month
Once or twice a semester
Once or twice a year
Never
Not applicable
4. Does your school have a daily literacy block?
Yes No Don't Know
in grades K-3
in grades 4 & above
5. How long is your school's literacy block? (please choose the answer closest to theactual time period)
120 minutes or more
90 minutes
60 minutes
less than 60 minutes
No literacy block
Don't know
in grades K-3
in grades 4 & above
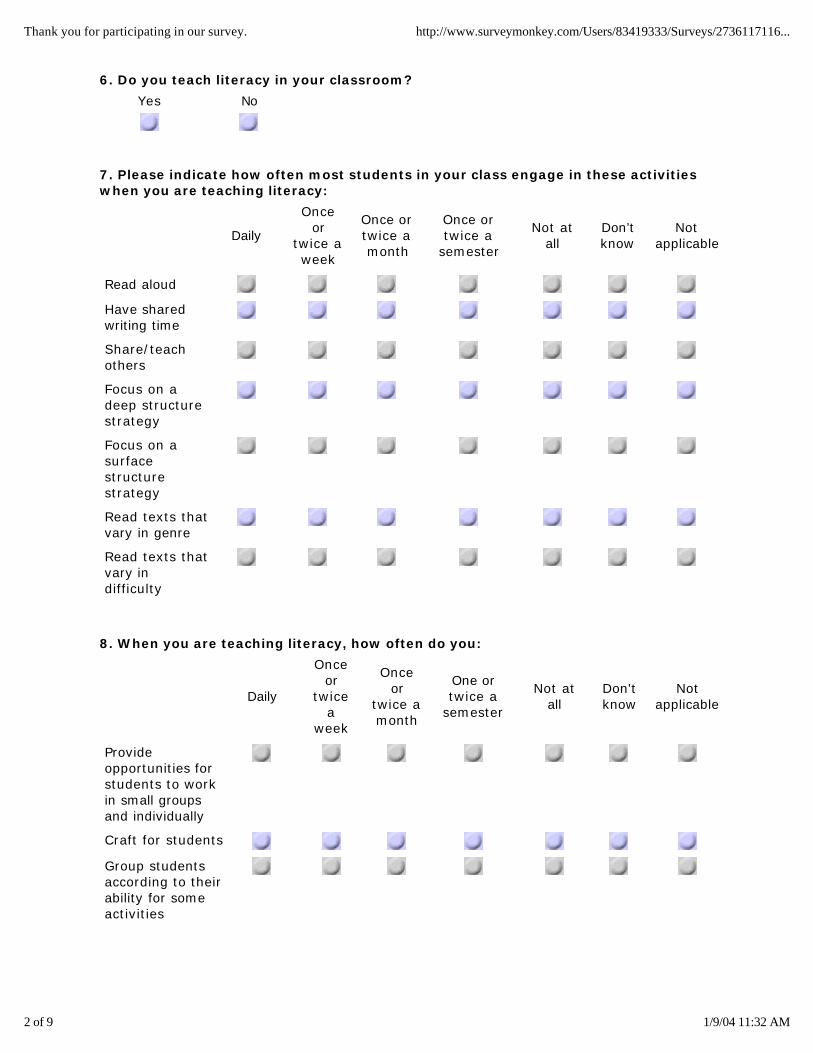
Thank you for participating in our survey. http://www.surveymonkey.com/Users/83419333/Surveys/2736117116...
2 of 9 1/9/04 11:32 AM
6. Do you teach literacy in your classroom?
Yes No
7. Please indicate how often most students in your class engage in these activitieswhen you are teaching literacy:
Daily
Once or
twice a week
Once or twice a month
Once or twice a
semester
Not at all
Don’tknow
Not applicable
Read aloud
Have shared writing time
Share/teach others
Focus on a deep structure strategy
Focus on a surface structure strategy
Read texts that vary in genre
Read texts that vary in difficulty
8. When you are teaching literacy, how often do you:
Daily
Once or
twice a
week
Once or
twice a month
One or twice a
semester
Not at all
Don't know
Not applicable
Provide opportunities for students to work in small groups and individually
Craft for students
Group students according to their ability for some activities
Thank you for participating in our survey. http://www.surveymonkey.com/Users/83419333/Surveys/2736117116...
3 of 9 1/9/04 11:32 AM
9. When you are teaching literacy, how often do you:
Daily
Once or
twice a
week
Once or
twice a month
Once or twice a
semester
Not at all
Don't know
Not applicable
Take time to reflect with the students on what you've covered and it's future applications
Provide opportunities for students to compose meaning when reading and writing
Use invitational groups
Think aloud and model comprehension strategies for students
10. Please indicate how often:
Once or
twice a week
Once or twice a month
Once or twice a
semester
Once or
twice a year
Not at all
Not applicable
You participate in a Cornerstone book study group and/or literacy study group in your school
You have observed aCornerstone coach’sclassroom
A Cornerstone coach has come to your classroom to do a demonstration lesson
A Cornerstone coach has visited your classroom while you were teaching literacy
Thank you for participating in our survey. http://www.surveymonkey.com/Users/83419333/Surveys/2736117116...
4 of 9 1/9/04 11:32 AM
11. Please indicate how often:
Once or
twice a week
Once or twice a month
Once or twice a
semester
Once or
twice a year
Not at all
Don't Know
Not applicable
The principal has visited your classroom while you were teaching literacy
The principal has taught in your classroom
You have metwith theCornerstone“critical friend” todiscuss literacystrategies
12. How useful do you think the Cornerstone book study and/or literacy study groupsare?
Very usefulSomewhat
usefulNeutral
Somewhat notuseful
Not useful at all
Not applicable
13. To what extent have the Cornerstone coaches helped your literacy teaching thisyear?
Very much Quite a bit Some A little bit Not at all Not applicable
14. Are you familiar with the Cornerstone Literacy Framework?
Yes No
15. Have you participated in the Cornerstone Asset Mapping process in your school?
Yes No Don't know
16. How useful do you find the school-wide goals established by the CornerstoneAsset Mapping process?
Very usefulSomewhat
usefulNeutral
Somewhat notuseful
Not useful at all
Not applicable
Thank you for participating in our survey. http://www.surveymonkey.com/Users/83419333/Surveys/2736117116...
5 of 9 1/9/04 11:32 AM
17. Are the goals established in the Cornerstone Asset Map discussed during facultymeetings or in study groups?
Yes No Not applicable
18. Have Cornerstone staff (for example, Ellin Keene, Lu Lewis, Debbie Miller, BruceMorgan, or Edna Varner) come to your school to discuss classroom environment or literacy teaching strategies?
Yes No Don't know
19. How useful did you find their visit/visit(s)?
Very usefulSomewhat
usefulNeutral
Somewhat notuseful
Not useful at all
Not applicable
20. To what extent has Cornerstone:
Very much
Quite a bit
Some A little
bitNot at
allNot
applicable
Increased your use of trade books in your lesson plans
Increased the size of your classroom library
Decreased your reliance on textbooks
21. To what extent has Cornerstone:
Very much
Quite a bit
SomeA
little bit
Not at all
Not applicable
Encouraged your use of alternative seating arrangements in your classroom
Increased the amount of student work you display in your classroom
Improved the overall environment in your classroom
22. Were the results of the Cornerstone School Review shared with the faculty of yourschool?
Yes No Don't know Not applicable
Thank you for participating in our survey. http://www.surveymonkey.com/Users/83419333/Surveys/2736117116...
6 of 9 1/9/04 11:32 AM
23. How much has your participation in Cornerstone activities during this school yearimproved:
Very much
Quite a bit
SomeA
little bit
Not at all
Don’tknow
Not applicable
Your literacy teaching practice
Your understanding of literacy learning
Your classroom’senvironment
Your students' literacy skills
24. Please indicate the extent to which you agree with the statements below:
Strongly agree
Agree DisagreeStrongly disagree
Don't know
In this school there is a feeling that everyone is working together toward common goals.
Teachers in this school respect colleagues who are expert teachers.
Experimentation and occasional mistakes are seen as a normal aspect of teaching in this school.
Most teachers in this school are continually learning and seeking new ideas from each other.
25. Please indicate the extent to which you agree with the statements below:
Strongly agree
Agree DisagreeStrongly disagree
Don't know
Teachers in this school set high expectations for academic work.
Teachers are involved in making important decisions in this school.
The principal has confidence in the expertise of teachers.
The principal in this school is an instructional leader.
Thank you for participating in our survey. http://www.surveymonkey.com/Users/83419333/Surveys/2736117116...
7 of 9 1/9/04 11:32 AM
Parents of children in this school have an influence on school decisions.
Parents regularly attend literacy/book-related events when they are invited.
26. How much has your participation in Cornerstone activities made your work as ateacher more or less enjoyable?
Much moreSomewhat
moreThe same Somewhat less Much less Not applicable
27. How much has your school’s involvement in the Cornerstone initiative improvedthe environment for teachers’ literacy practice?
Very much Quite a bit Some A little bit Not at all
28. How much has your school’s involvement in the Cornerstone initiative improvedthe environment for students’ literacy learning?
Very much Quite a bit Some A little bit Not at all
You're almost done. There's just a few background questions left before the end of the survey.
29. Do you teach at this school full-time?
Yes No
30. Including this year, how many years have you been a full-time teacher IN THISSCHOOL?
31. BEFORE coming to this school, how many years had you been a full-time teacher inother public or private schools?
32. What is your primary teaching assignment? (Please check only one box.)
A regular classroom, teaching most subject areas
English/Reading/Language arts
Thank you for participating in our survey. http://www.surveymonkey.com/Users/83419333/Surveys/2736117116...
8 of 9 1/9/04 11:32 AM
ESL/Bilingual education
Mathematics
Social studies or history
Science
Special education
Computer science
Home economics
Music/Arts
Health education
Physical education
Staff Developer
Literacy Coordinator
Vocational-Technical education
Other (please specify)
33. What grade are you teaching this year? (Please check all that apply.)
Pre-Kindergarten
Kindergarten
1st Grade
2nd Grade
3rd Grade
4th Grade
5th Grade
6th Grade
7th Grade
8th Grade
Ungraded/Multi-Grade classroom (elementary grades)
Ungraded/Multi-Grade classroom (middle grades)
All Grades
Other (please specify)
34. What is the highest degree you have earned?
High School Diploma
Bachelor’s
Master’s
Master’s plus additional credits
Doctorate
Other (please specify)
Thank you for participating in our survey. http://www.surveymonkey.com/Users/83419333/Surveys/2736117116...
9 of 9 1/9/04 11:32 AM
35. What type of certificate/licensure do you have?
Regular or standard certificate/licensure
Other (please specify)
36. Are you currently a Cornerstone coach in your school?
Yes No
37. If you have any additional comments about Cornerstone or this survey, please addthem below.
Please click on the SUBMIT button below to end the survey and find out how to receive your Barnes & Noble gift certificate.
Submit >>