seasonal fluxes of particulate matter in a small closed lake in northern estonia
TRANSCRIPT
SEASONAL FLUXES OF PARTICULATE MATTER IN A SMALLCLOSED LAKE IN NORTHERN ESTONIA
JAAN-MATI PUNNING∗, JAANUS TERASMAA, TIIU KOFF and TIIU ALLIKSAARInstitute of Ecology, Tallinn Pedagogical University, Tallinn, Estonia
(∗ author for correspondence, e-mail: [email protected], Fax: +372 66 22 283)
(Received 25 June 2002; accepted 13 May 2003)
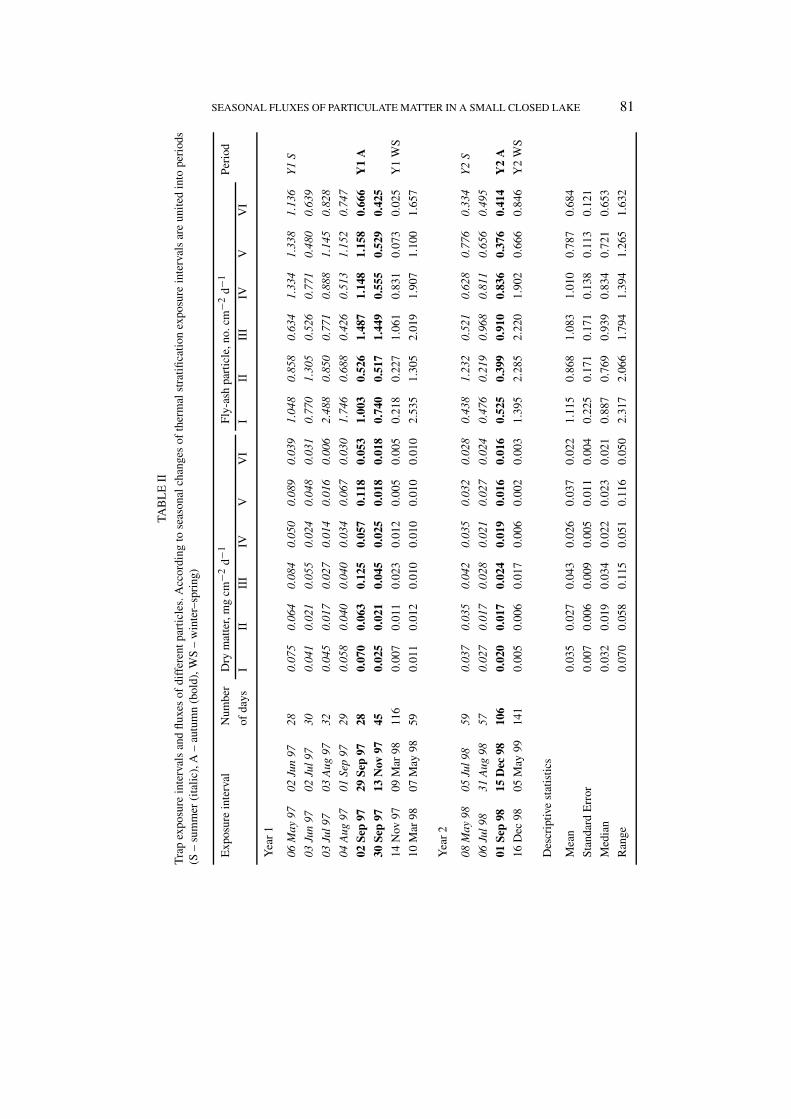
Abstract. The seasonal fluxes of dry matter, spheroidal fly-ash particles and pollen were studied in asmall mesotrophic lake in order to reveal the patterns of their spatial-temporal distribution in regardto seasonal variations. Sediment traps deployed in the lake at different depths and locations were usedto collect samples for calculating sediment fluxes in two years. The results show that resuspension ofsettled particles in the lake with a small dynamic ratio is moderate and depends on seasonal changesin thermal stratification. The rate of particle deposition during the summer stratification period waslow. The weather conditions during early spring, such as air temperature and the thickness of snow-cover, influence the intensity of resuspension. Air temperature and cloudiness during the summerstratification period determine the rate of bioproduction and thermocline parameters, which alsohave a major effect on the seston composition and fluxes.
Keywords: lake morphometry, particle fluxes, resuspension, sedimentation rate, sediment traps
1. Introduction
The study of seston fluxes in lakes has great importance for understanding thecirculation of organic and mineral matter within a lake, as well as the state anddevelopment of lake ecosystems. Knowledge of spatial and temporal patterns ofseston fluxes and interactions at the water-sediment interface is crucial for inter-preting information stored in sediments as well as for estimating internal fluxes ofpollution in water bodies (Boers and Uunk, 1991). As most toxic substances andnutrients in lakes are attached to suspended particles and aggregates (Istvanovics etal., 1989), the distribution, biological uptake and ecological effects of pollutants arehighly dependent of the flux of the carrier particles. The release of nutrients fromthe sediment affects the production of autochthonous particles and the trophic stateof lakes (Søndergaard et al., 1992; Martinova, 1993). Therefore it is necessaryto understand the processes that control the distribution and fluxes of particulatematter in lakes.
Sediment traps are important tools for measuring the total flux in the watercolumn (Bloesch and Uehlinger, 1986), and for the study of the pattern of sedi-ment accumulation (Weyhenmeyer et al., 1995; Heiskanen, 1998), and sedimentresuspension in lakes with different morphometry (Stheinman and Parparov, 1997;Mieszczankin and Noryskiewicz, 2000).
Water, Air, and Soil Pollution 149: 77–92, 2003.© 2003 Kluwer Academic Publishers. Printed in the Netherlands.
78 JAAN-MATI PUNNING ET AL.
The aim of this study was to distinguish the spatial-temporal fluxes of par-ticulate matter by applying indicators associated with seasonal phases of a lake.Our interest was focused on small lakes where the influence of wind/wave activ-ity on resuspension is insignificant. Attention was paid to the vertical and lateraldistribution of organic and mineral matter, and the flux of various types of spe-cific allochthonous particles (pollen, spheroidal fly-ash particles). The influx ofstudied air-borne particles into the lake is pulse-like and takes place in certaintime intervals. This regularity enables calculation of the sedimentation rates ofsuspended matter during different stratification periods and evaluation of the roleof resuspension of bottom sediments.
2. Study Site
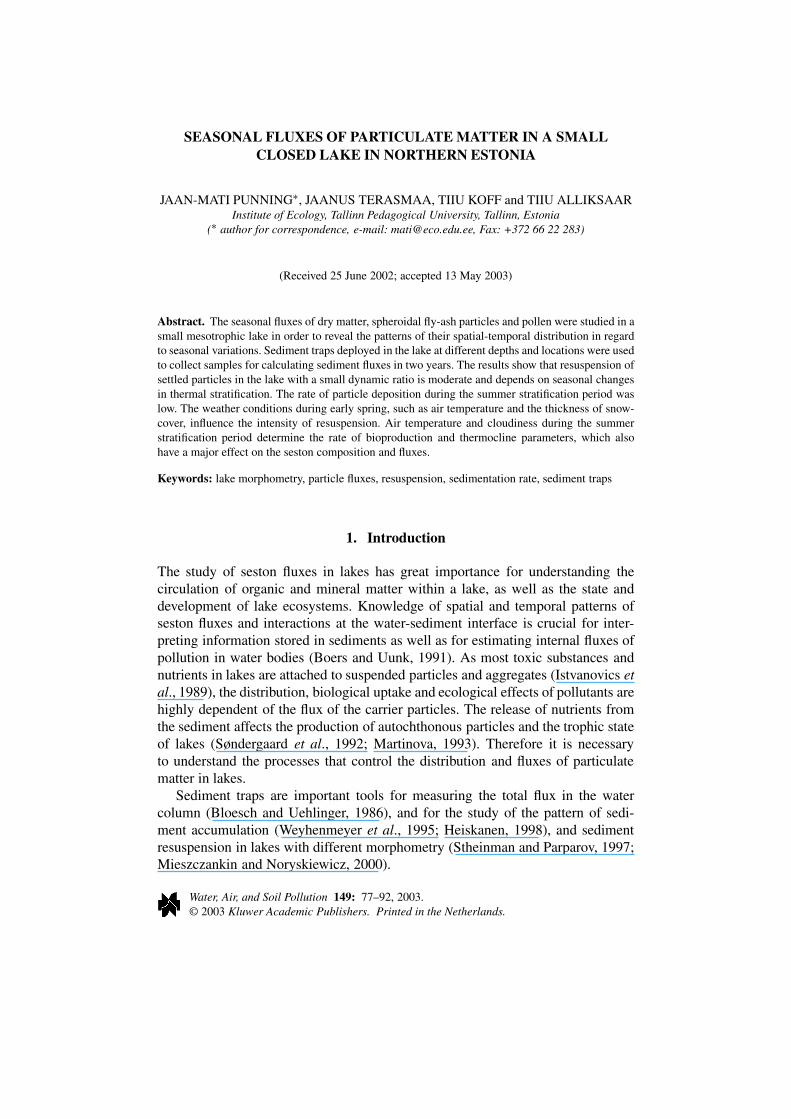
The study was carried out in Lake Jussi Pikkjärv (hereafter Lake Jussi), situatedin the central part of the North-Kõrvemaa Nature Reserve in northern Estonia(59◦40′N, 25◦45′E) (Figure 1). It is a mesotrophic lake with an area of 6.1 ha(Table I), strongly elongated from north to south with a mean depth of 3.4 m and amaximum depth of 9.75 m near the eastern shore (Figure 1b). The lake lies in thearea of limno- and fluvioglacial sediments. Lake Jussi is surrounded by pine forestwith some spruces and birches on these poor sandy soils. The lake lies betweenhillocks and is surrounded by steep sloped kames to the west, north and east. In thesouth it is bordered with an ombrotrophic mire.
3. Material and Methods
The sediment traps were deployed into the lake at different depths: 1.0 m abovethe lake bottom and 1.5 m below the water surface at each site. Three pairs oftraps were placed at three sites along the longest transect of the lake (Figure 1).The traps consisted of cylinders with a surface area of 43.54 cm2 and with anaspect ratio of 5.6. As estimated in previous studies (Håkanson and Jansson, 1983;Punning et al., 2000) this aspect ratio is required to prevent the resuspension of thetrapped material. The experiment lasted two years, from 6 May 1997 until 5 May1999. The intervals of trap exposure were selected according to the season. Thetraps were replaced 12 times (Table II). The average period of deployment lastedone month in summer and 3–4 months in winter. Temperature and oxygen contentof the lake water were measured regularly at the study sites. Seasonal changes inthermal stratification were registered.
Upon removal of the traps, formalin was added to the cylinders to halt bacterialprocesses and photosynthesis. The water was decanted from collected samplesafter their subsiding. The samples were dried at 105 ◦C to a constant weight. Asimplified method was used in pollen samples preparation. After adding tablets
SEASONAL FLUXES OF PARTICULATE MATTER IN A SMALL CLOSED LAKE 79
Figure 1. The location of Lake Jussi Pikkjärv (hereafter Lake Jussi) (a), bathymetry of the lakewith studied profiles (b), and the profiles and placement of traps (c) with dotted lines denoting thethermocline during the stratification period.
with known numbers of markers (Lycopodium spores) in order to estimate con-centration and influx of the pollen (Stockmarr, 1971), the samples were heatedwith 15% H2O2 for 10 min. The samples were washed with distilled water andstained with safranin-stained glycerol. The number of pollen was counted fromone slide; the rest of the sample was used for spheroidal fly-ash particle analyses.The fly-ash particles are microscopic products of incomplete combustion of fossilfuels emitted to the atmosphere by power plants. A combined method of severaltreatment procedures was applied for fly-ash particle analyses (Renberg and Wik,1985; Rose, 1990; Odgaard, 1993). The organic matter was removed from samplesusing 32% H2O2; the biogenic silica was dissolved in 0.3 M solution of NaOH.The residue was washed with distilled water, then a known amount of Lycopodiumspores was added to calculate particle concentration and influx. Fly-ash particles(both spheroidal carbonaceous particles and inorganic ash spheres) were countedat 400× magnification.
Because the duration of trap exposure intervals varied from 28 to 141 days thecalculation of the average flux per day would not be correct either statistically
80 JAAN-MATI PUNNING ET AL.
TABLE I
Main characteristics of Lake Jussi
Characteristic Unit Value Reference
Surface area, S m2 6.1 × 10⁴ Tõnisson, 1995
Maximum water depth m 9.75 Tõnisson, 1995
Mean water depth, Zmean m 3.36 This work
Volume m3 216000 This work
Catchment area m2 24 × 104 Tõnisson, 1995
Epilimnetic water depth in June m 2.5–3.0 This work
Water retention period yr 0.25 Tõnisson, 1995
Shoreline length m 1350 This work
Shoreline length coefficient m 1.5 This work
Dynamic ratio, DR =√
S/Zmean km2 m−1 0.075 This work. Formula
from Håkanson
and Jansson, 1983
Water content in surface sediments % 97 This work
Organic matter in sediments % 85–87 This work
or with regard to season. The fluxes into the cylinders were calculated first cm−2
day−1 for each exposure interval (Table II) and then as the sum for both years andfor all periods, which were separated as seasonal phases in the thermal stratifica-tion in the lake. The summer periods of both years (May–September) (period S,Table II) include the trap exposure intervals when the lake was stratified. The au-tumn overturn, beginning in early September and ending in late autumn (period A,Table II), is followed immediately by the formation of ice on the lake in November-December. Because the replacement of traps was not possible during the ice-coverperiod, winter and early spring seasons are integrated into one observation period(period WS, Table II). The period starts with permanent ice-cover on the lake andends with the inflow of melting water into the lake in April–May. This periodfeatures the highest water level in the lake and maximum water inflow from thecatchment.
4. Meteorological Data
According to the data from a meteorological station (supplied by the Institute ofHydrology and Meteorology of Estonia) about 40 km to the SE of Lake Jussi, theweather patterns during the study years differed greatly (Figure 2). The first quarterof 1997 was warmer, with the air temperature in January and March 3 ◦C above thelong-term average. The snow cover was ca. 30 cm thick in January 1997 but – in
SEASONAL FLUXES OF PARTICULATE MATTER IN A SMALL CLOSED LAKE 81
TAB
LE
II
Tra
pex
posu
rein
terv
als
and
flux
esof
diff
eren
tpar
ticl
es.A
ccor
ding
tose
ason
alch
ange
sof
ther
mal
stra
tifi
cati
onex
posu
rein
terv
als
are
unit
edin
tope
riod
s(S
–su
mm
er(i
tali
c),A
–au
tum
n(b
old)
,WS
–w
inte
r–sp
ring
)
Exp
osur
ein
terv
alN
umbe
rD
rym
atte
r,m
gcm
−2d−
1F
ly-a
shpa
rtic
le,n
o.cm
−2d−
1P
erio
d
ofda
ysI
IIII
IIV
VV
II
IIII
IIV
VV
I
Yea
r1
06M
ay97
02Ju
n97
280.
075
0.06
40.
084
0.05
00.
089
0.03
91.
048
0.85
80.
634
1.33
41.
338
1.13
6Y
1S
03Ju
n97
02Ju
l97
300.
041
0.02
10.
055
0.02
40.
048
0.03
10.
770
1.30
50.
526
0.77
10.
480
0.63
9
03Ju
l97
03A
ug97
320.
045
0.01
70.
027
0.01
40.
016
0.00
62.
488
0.85
00.
771
0.88
81.
145
0.82
8
04A
ug97
01Se
p97
290.
058
0.04
00.
040
0.03
40.
067
0.03
01.
746
0.68
80.
426
0.51
31.
152
0.74
7
02Se
p97
29Se
p97
280.
070
0.06
30.
125
0.05
70.
118
0.05
31.
003
0.52
61.
487
1.14
81.
158
0.66
6Y
1A
30Se
p97
13N
ov97
450.
025
0.02
10.
045
0.02
50.
018
0.01
80.
740
0.51
71.
449
0.55
50.
529
0.42
5
14N
ov97
09M
ar98
116
0.00
70.
011
0.02
30.
012
0.00
50.
005
0.21
80.
227
1.06
10.
831
0.07
30.
025
Y1
WS
10M
ar98
07M
ay98
590.
011
0.01
20.
010
0.01
00.
010
0.01
02.
535
1.30
52.
019
1.90
71.
100
1.65
7
Yea
r2
08M
ay98
05Ju
l98
590.
037
0.03
50.
042
0.03
50.
032
0.02
80.
438
1.23
20.
521
0.62
80.
776
0.33
4Y
2S
06Ju
l98
31A
ug98
570.
027
0.01
70.
028
0.02
10.
027
0.02
40.
476
0.21
90.
968
0.81
10.
656
0.49
5
01Se
p98
15D
ec98
106
0.02
00.
017
0.02
40.
019
0.01
60.
016
0.52
50.
399
0.91
00.
836
0.37
60.
414
Y2
A
16D
ec98
05M
ay99
141
0.00
50.
006
0.01
70.
006
0.00
20.
003
1.39
52.
285
2.22
01.
902
0.66
60.
846
Y2
WS
Des
crip
tive
stat
isti
cs
Mea
n0.
035
0.02
70.
043
0.02
60.
037
0.02
21.
115
0.86
81.
083
1.01
00.
787
0.68
4
Sta
ndar
dE
rror
0.00
70.
006
0.00
90.
005
0.01
10.
004
0.22
50.
171
0.17
10.
138
0.11
30.
121
Med
ian
0.03
20.
019
0.03
40.
022
0.02
30.
021
0.88
70.
769
0.93
90.
834
0.72
10.
653
Ran
ge0.
070
0.05
80.
115
0.05
10.
116
0.05
02.
317
2.06
61.
794
1.39
41.
265
1.63
2
82 JAAN-MATI PUNNING ET AL.
TAB
LE
II
(con
tinu
ed)
Exp
osur
ein
terv
alN
umbe
rB
etul
apo
llen
grai
ns,n
o.cm
−2d−
1P
inus
poll
engr
ains
,no.
cm−2
d−1
Per
iod
ofda
ysI
IIII
IIV
VV
II
IIII
IIV
VV
I
Yea
r1
06M
ay97
02Ju
n97
2860
.00
33.0
077
.00
61.0
083
.00
56.0
011
.00
12.5
012
.00
12.0
038
.00
14.0
0Y
1S
03Ju
n97
02Ju
l97
3012
.00
6.00
13.0
09.
009.
0012
.00
23.0
026
.00
22.0
023
.00
22.0
040
.00
03Ju
l97
03A
ug97
3217
.00
4.00
5.00
2.00
2.00
2.00
17.0
06.
008.
004.
003.
002.
00
04A
ug97
01Se
p97
2915
.00
6.00
0.60
4.00
6.50
9.00
18.5
08.
001.
806.
0012
.00
11.5
0
02Se
p97
29Se
p97
2813
.00
8.00
46.0
08.
0011
.00
16.0
020
.00
10.0
035
.00
20.0
021
.00
21.0
0Y
1A
30Se
p97
13N
ov97
454.
003.
0013
.00
6.00
3.00
3.00
4.00
2.00
11.0
03.
003.
001.
00
14N
ov97
09M
ar98
116
0.10
0.00
0.70
0.10
0.10
0.10
0.00
0.10
0.20
0.00
0.00
0.10
Y1
WS
10M
ar98
07M
ay98
5956
.00
22.0
010
4.00
137.
0032
.00
223.
001.
001.
001.
000.
500.
500.
50
Yea
r2
08M
ay98
05Ju
l98
5959
.00
73.0
012
6.00
81.0
041
.00
45.0
021
.00
34.0
020
.00
22.0
09.
0015
.00
Y2
S
06Ju
l98
31A
ug98
575.
005.
0038
.00
25.0
07.
003.
004.
005.
0011
.00
8.00
6.00
3.00
01Se
p98
15D
ec98
106
1.50
2.50
36.0
024
.00
2.00
0.50
7.00
5.00
12.0
08.
257.
004.
00Y
2A
16D
ec98
05M
ay99
141
9.00
14.0
014
.00
11.0
013
.00
9.00
2.00
2.00
14.0
02.
003.
001.
00Y
2W
S
Des
crip
tive
stat
isti
cs
Mea
n20
.97
14.7
139
.44
30.6
817
.47
31.5
510
.71
9.30
12.3
39.
0610
.38
9.43
Sta
ndar
dE
rror
6.68
5.96
12.1
112
.09
6.97
18.1
62.
513.
032.
862.
413.
273.
44
Med
ian
12.5
06.
0025
.00
10.0
08.
009.
009.
005.
5011
.50
7.00
6.50
3.50
Ran
ge59
.90
73.0
012
5.40
136.
9082
.90
222.
9023
.00
33.9
034
.80
23.0
038
.00
39.9
0
SEASONAL FLUXES OF PARTICULATE MATTER IN A SMALL CLOSED LAKE 83
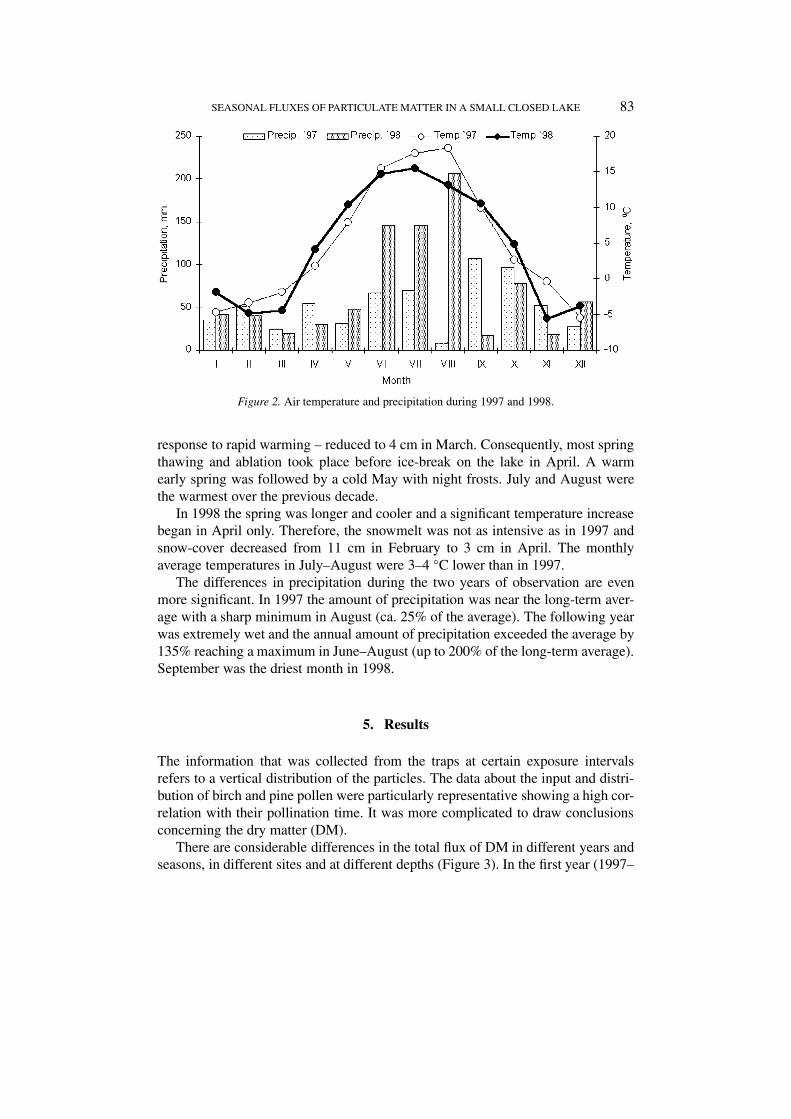
Figure 2. Air temperature and precipitation during 1997 and 1998.
response to rapid warming – reduced to 4 cm in March. Consequently, most springthawing and ablation took place before ice-break on the lake in April. A warmearly spring was followed by a cold May with night frosts. July and August werethe warmest over the previous decade.
In 1998 the spring was longer and cooler and a significant temperature increasebegan in April only. Therefore, the snowmelt was not as intensive as in 1997 andsnow-cover decreased from 11 cm in February to 3 cm in April. The monthlyaverage temperatures in July–August were 3–4 ◦C lower than in 1997.
The differences in precipitation during the two years of observation are evenmore significant. In 1997 the amount of precipitation was near the long-term aver-age with a sharp minimum in August (ca. 25% of the average). The following yearwas extremely wet and the annual amount of precipitation exceeded the average by135% reaching a maximum in June–August (up to 200% of the long-term average).September was the driest month in 1998.
5. Results
The information that was collected from the traps at certain exposure intervalsrefers to a vertical distribution of the particles. The data about the input and distri-bution of birch and pine pollen were particularly representative showing a high cor-relation with their pollination time. It was more complicated to draw conclusionsconcerning the dry matter (DM).
There are considerable differences in the total flux of DM in different years andseasons, in different sites and at different depths (Figure 3). In the first year (1997–
84 JAAN-MATI PUNNING ET AL.
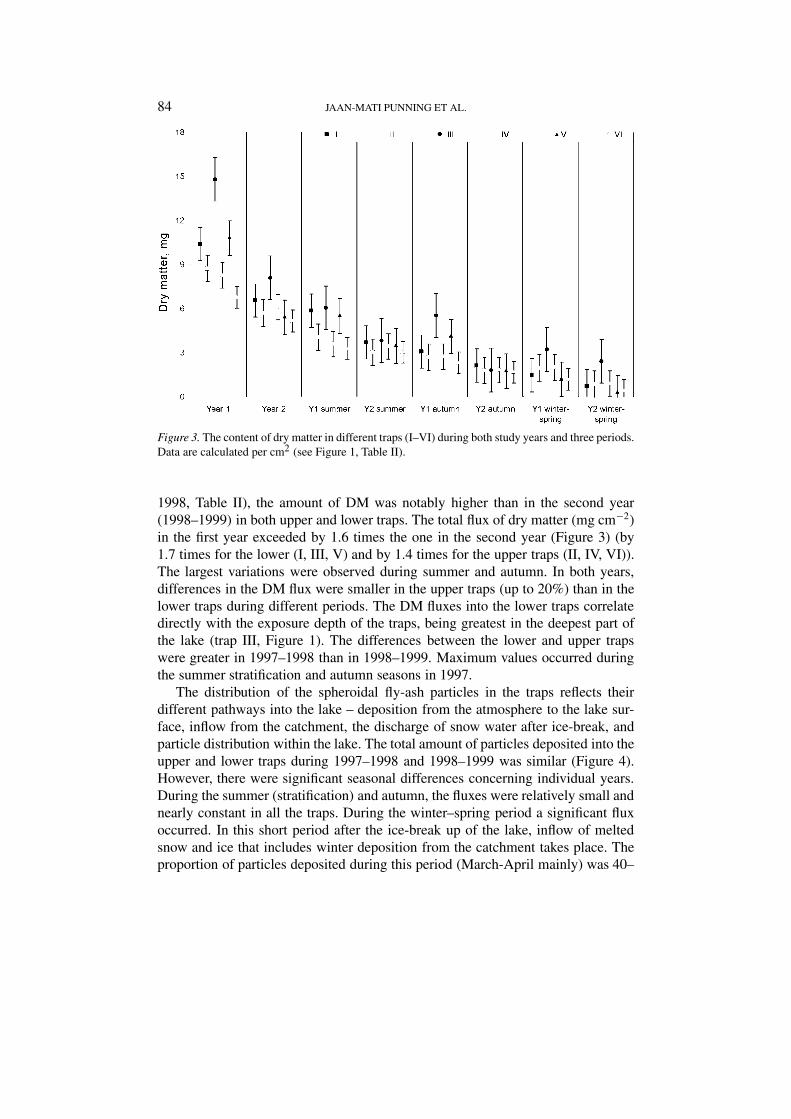
Figure 3. The content of dry matter in different traps (I–VI) during both study years and three periods.Data are calculated per cm2 (see Figure 1, Table II).
1998, Table II), the amount of DM was notably higher than in the second year(1998–1999) in both upper and lower traps. The total flux of dry matter (mg cm−2)in the first year exceeded by 1.6 times the one in the second year (Figure 3) (by1.7 times for the lower (I, III, V) and by 1.4 times for the upper traps (II, IV, VI)).The largest variations were observed during summer and autumn. In both years,differences in the DM flux were smaller in the upper traps (up to 20%) than in thelower traps during different periods. The DM fluxes into the lower traps correlatedirectly with the exposure depth of the traps, being greatest in the deepest part ofthe lake (trap III, Figure 1). The differences between the lower and upper trapswere greater in 1997–1998 than in 1998–1999. Maximum values occurred duringthe summer stratification and autumn seasons in 1997.
The distribution of the spheroidal fly-ash particles in the traps reflects theirdifferent pathways into the lake – deposition from the atmosphere to the lake sur-face, inflow from the catchment, the discharge of snow water after ice-break, andparticle distribution within the lake. The total amount of particles deposited into theupper and lower traps during 1997–1998 and 1998–1999 was similar (Figure 4).However, there were significant seasonal differences concerning individual years.During the summer (stratification) and autumn, the fluxes were relatively small andnearly constant in all the traps. During the winter–spring period a significant fluxoccurred. In this short period after the ice-break up of the lake, inflow of meltedsnow and ice that includes winter deposition from the catchment takes place. Theproportion of particles deposited during this period (March-April mainly) was 40–
SEASONAL FLUXES OF PARTICULATE MATTER IN A SMALL CLOSED LAKE 85
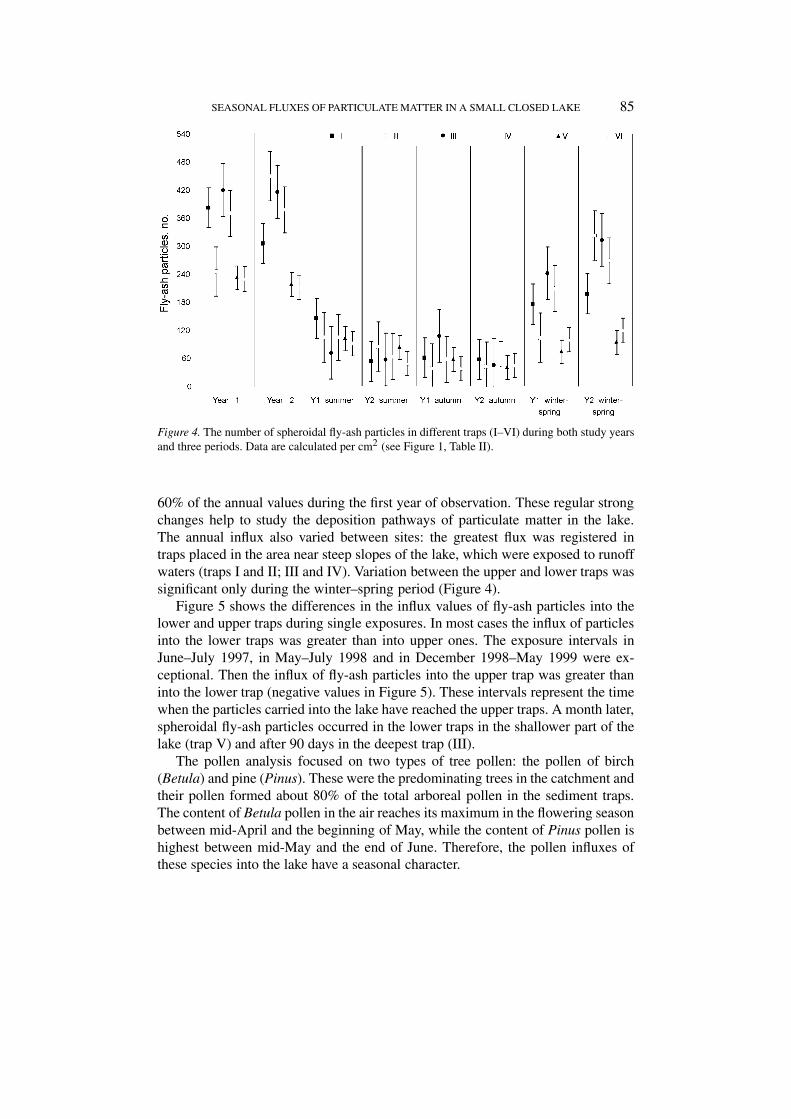
Figure 4. The number of spheroidal fly-ash particles in different traps (I–VI) during both study yearsand three periods. Data are calculated per cm2 (see Figure 1, Table II).
60% of the annual values during the first year of observation. These regular strongchanges help to study the deposition pathways of particulate matter in the lake.The annual influx also varied between sites: the greatest flux was registered intraps placed in the area near steep slopes of the lake, which were exposed to runoffwaters (traps I and II; III and IV). Variation between the upper and lower traps wassignificant only during the winter–spring period (Figure 4).
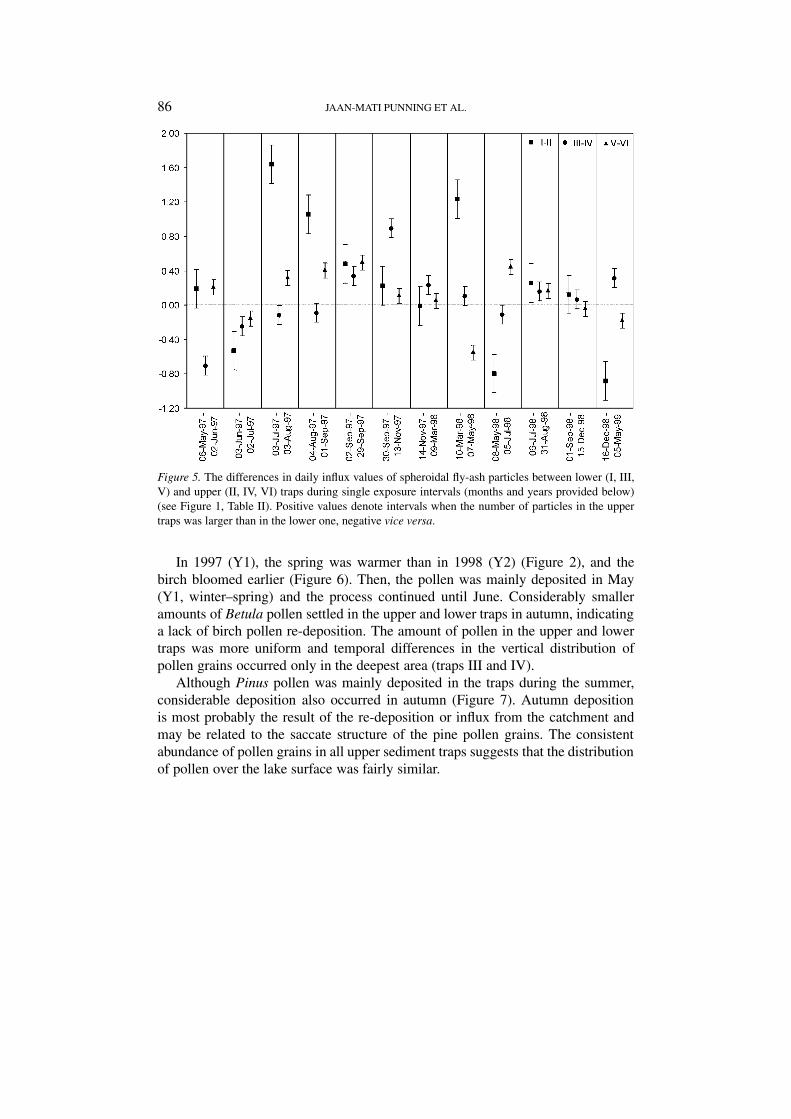
Figure 5 shows the differences in the influx values of fly-ash particles into thelower and upper traps during single exposures. In most cases the influx of particlesinto the lower traps was greater than into upper ones. The exposure intervals inJune–July 1997, in May–July 1998 and in December 1998–May 1999 were ex-ceptional. Then the influx of fly-ash particles into the upper trap was greater thaninto the lower trap (negative values in Figure 5). These intervals represent the timewhen the particles carried into the lake have reached the upper traps. A month later,spheroidal fly-ash particles occurred in the lower traps in the shallower part of thelake (trap V) and after 90 days in the deepest trap (III).
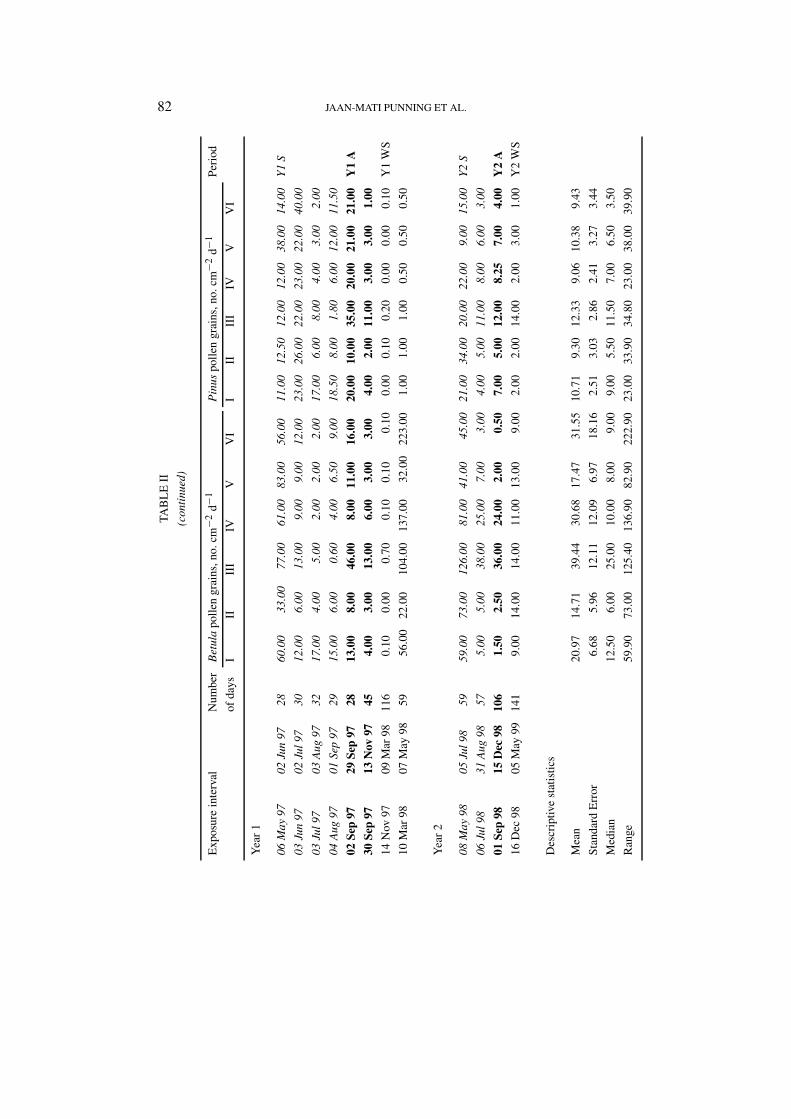
The pollen analysis focused on two types of tree pollen: the pollen of birch(Betula) and pine (Pinus). These were the predominating trees in the catchment andtheir pollen formed about 80% of the total arboreal pollen in the sediment traps.The content of Betula pollen in the air reaches its maximum in the flowering seasonbetween mid-April and the beginning of May, while the content of Pinus pollen ishighest between mid-May and the end of June. Therefore, the pollen influxes ofthese species into the lake have a seasonal character.
86 JAAN-MATI PUNNING ET AL.
Figure 5. The differences in daily influx values of spheroidal fly-ash particles between lower (I, III,V) and upper (II, IV, VI) traps during single exposure intervals (months and years provided below)(see Figure 1, Table II). Positive values denote intervals when the number of particles in the uppertraps was larger than in the lower one, negative vice versa.
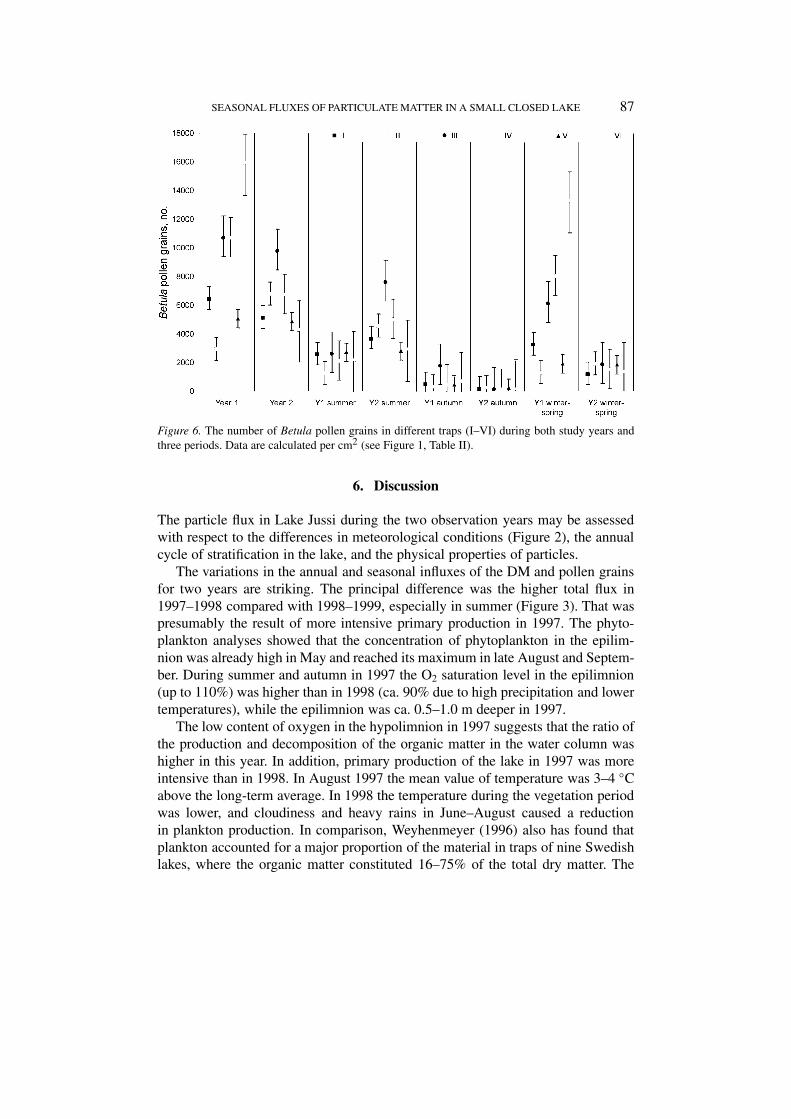
In 1997 (Y1), the spring was warmer than in 1998 (Y2) (Figure 2), and thebirch bloomed earlier (Figure 6). Then, the pollen was mainly deposited in May(Y1, winter–spring) and the process continued until June. Considerably smalleramounts of Betula pollen settled in the upper and lower traps in autumn, indicatinga lack of birch pollen re-deposition. The amount of pollen in the upper and lowertraps was more uniform and temporal differences in the vertical distribution ofpollen grains occurred only in the deepest area (traps III and IV).
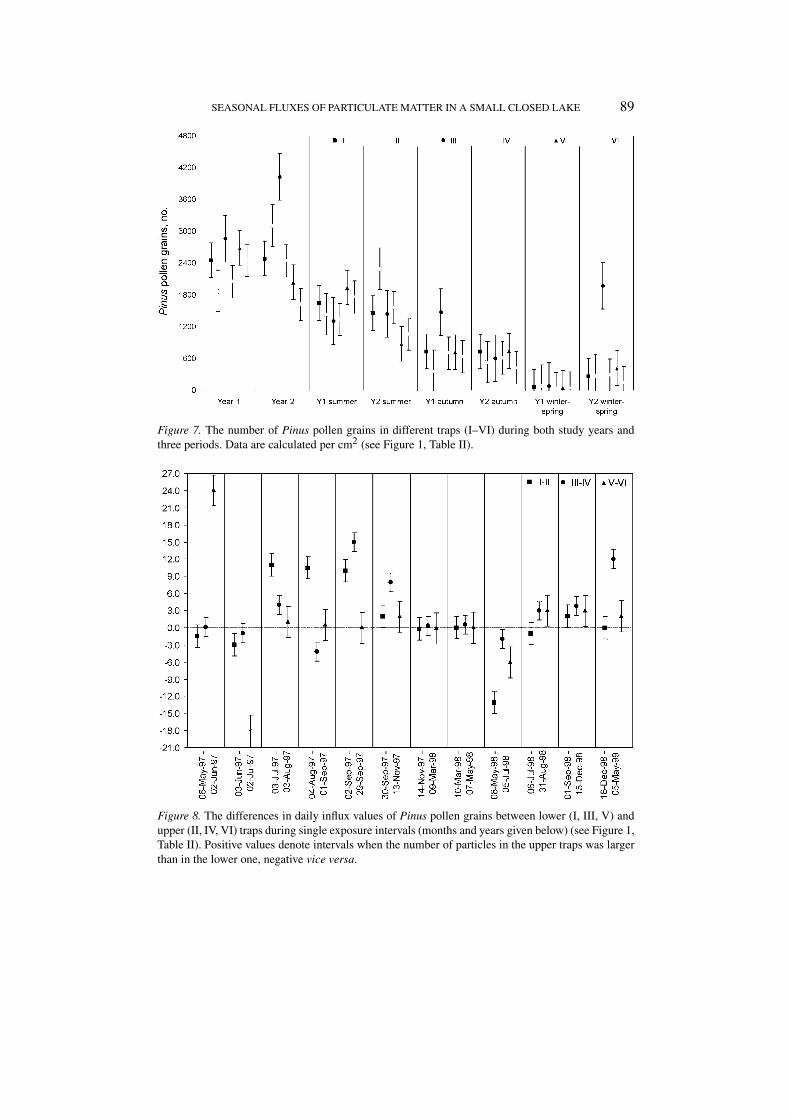
Although Pinus pollen was mainly deposited in the traps during the summer,considerable deposition also occurred in autumn (Figure 7). Autumn depositionis most probably the result of the re-deposition or influx from the catchment andmay be related to the saccate structure of the pine pollen grains. The consistentabundance of pollen grains in all upper sediment traps suggests that the distributionof pollen over the lake surface was fairly similar.
SEASONAL FLUXES OF PARTICULATE MATTER IN A SMALL CLOSED LAKE 87
Figure 6. The number of Betula pollen grains in different traps (I–VI) during both study years andthree periods. Data are calculated per cm2 (see Figure 1, Table II).
6. Discussion
The particle flux in Lake Jussi during the two observation years may be assessedwith respect to the differences in meteorological conditions (Figure 2), the annualcycle of stratification in the lake, and the physical properties of particles.
The variations in the annual and seasonal influxes of the DM and pollen grainsfor two years are striking. The principal difference was the higher total flux in1997–1998 compared with 1998–1999, especially in summer (Figure 3). That waspresumably the result of more intensive primary production in 1997. The phyto-plankton analyses showed that the concentration of phytoplankton in the epilim-nion was already high in May and reached its maximum in late August and Septem-ber. During summer and autumn in 1997 the O2 saturation level in the epilimnion(up to 110%) was higher than in 1998 (ca. 90% due to high precipitation and lowertemperatures), while the epilimnion was ca. 0.5–1.0 m deeper in 1997.
The low content of oxygen in the hypolimnion in 1997 suggests that the ratio ofthe production and decomposition of the organic matter in the water column washigher in this year. In addition, primary production of the lake in 1997 was moreintensive than in 1998. In August 1997 the mean value of temperature was 3–4 ◦Cabove the long-term average. In 1998 the temperature during the vegetation periodwas lower, and cloudiness and heavy rains in June–August caused a reductionin plankton production. In comparison, Weyhenmeyer (1996) also has found thatplankton accounted for a major proportion of the material in traps of nine Swedishlakes, where the organic matter constituted 16–75% of the total dry matter. The
88 JAAN-MATI PUNNING ET AL.
composition of bottom sediments from the deepest part of Lake Jussi demonstratesthat the mineral matter content has remained steady during the last 5 yr (13–15%,deposition rate 0.7 mg cm−2 yr−1). If we presume that the flux of mineral matterinto sediment traps was similar, the proportion of organic matter in the total fluxdeposited in trap III would be over 90%.
The major question for understanding biogeochemical processes in lakes andinterpreting sediment records of lakes remains the significance of resuspended mat-ter in particle fluxes. Weyhenmeyer et al. (1996) have found that the resuspendedparticulate matter forms 47–92% of the total flux. However, all the lakes studiedby Weyhenmeyer featured higher dynamic ratios than Lake Jussi, where the role ofwind/wave activity in resuspension was low.
The relatively similar amount of dry matter in all traps during summer andautumn of the second year (Y2 summer, Y2 autumn, Figure 3) suggests that theresuspension was low and do not exceed 30%. This conclusion is also supportedby the values of the influx of the spheroidal fly-ash particles (Figure 4). The similarinfluxes to upper and lower traps during the stratification period of both yearssuggest an insignificant resuspension of particles.
The influx of spheroidal fly-ash particles can be viewed as an input surge be-cause most of the particles entered the lake in spring, after the break up of ice-cover.In 1999 the spring deposition formed more than 60% from the total annual influxof spheroidal fly-ash particles (Figure 4). This proportion depends on the weatherconditions in winter and the intensity of snow melting in spring: the influx fromthe catchment is higher when the snow melts and flows into the lake prior to thethaw of the soil. This input allows the calculation of the average sinking velocityof particles. The quantities of spheroidal fly-ash particles first increase in the uppertraps (Figure 5). One month later, the flux of the particles in the lower traps exceedsthe one in the upper traps. In the lowermost trap III, located in the deepest area ofthe lake, the number of particles exceeds the one in the upper trap only at the endof summer stratification.
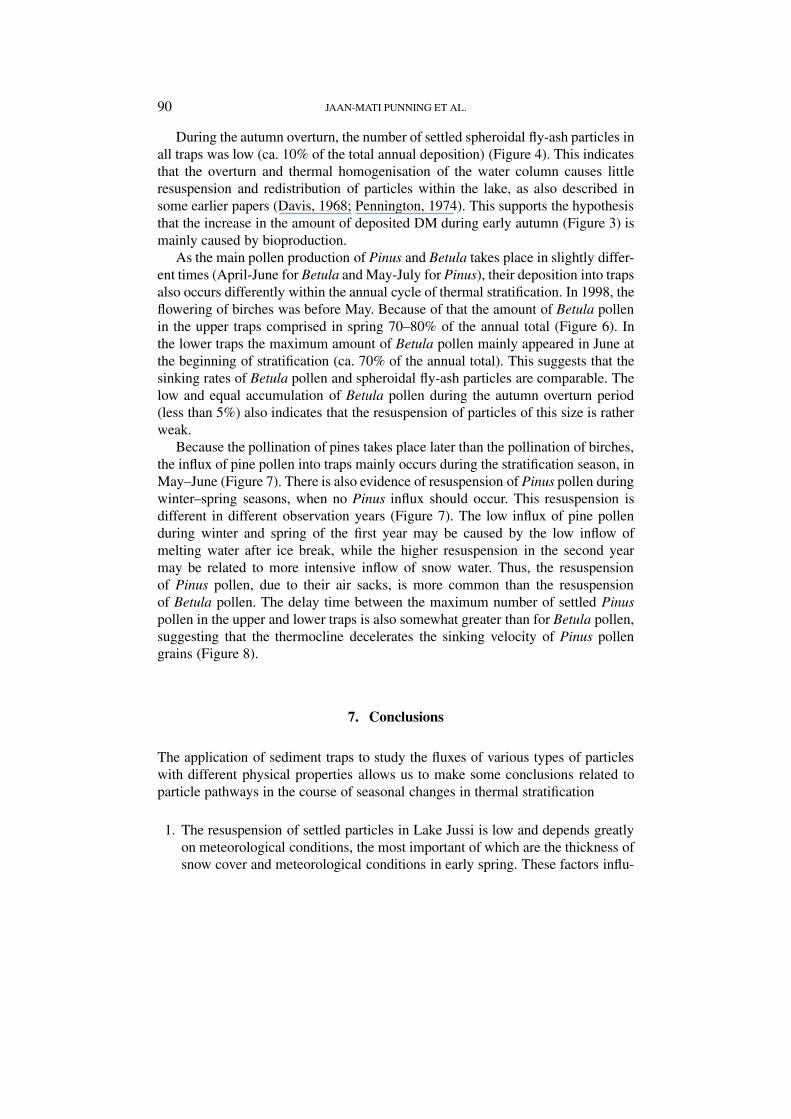
The deposition of Pinus pollen mainly took place during the summer period;clear temporal cycles of the distribution appeared in the upper and lower traps, intraps I–II and III–IV (Figures 7 and 8) in particular. After the period of an intensivepollination of pine (May–June), the amount of pollen in the upper traps exceededthat in the lower one. The differences of the values of Pinus pollen depositedinto upper and lower traps (I–II) show that only after 1–2 months the amount ofPinus pollen in the lower traps exceeded that in the upper trap. Later their fluxesinto both traps equalised (Figure 8). Therefore, the calculated settling velocity offly-ash particles and Pinus pollen was low (6–8 cm day−1). Naturally, this is theaverage rate at least during the stratification season in a relatively shallow lakewhere the thermocline might retard the sinking velocity of particles (Dean et al.,1999). Sinking rates of 2–4 cm day−1 were also observed for natural phytoplanktonassemblages in L. Erken by Rodrigo et al. (1998).
SEASONAL FLUXES OF PARTICULATE MATTER IN A SMALL CLOSED LAKE 89
Figure 7. The number of Pinus pollen grains in different traps (I–VI) during both study years andthree periods. Data are calculated per cm2 (see Figure 1, Table II).
Figure 8. The differences in daily influx values of Pinus pollen grains between lower (I, III, V) andupper (II, IV, VI) traps during single exposure intervals (months and years given below) (see Figure 1,Table II). Positive values denote intervals when the number of particles in the upper traps was largerthan in the lower one, negative vice versa.
90 JAAN-MATI PUNNING ET AL.
During the autumn overturn, the number of settled spheroidal fly-ash particles inall traps was low (ca. 10% of the total annual deposition) (Figure 4). This indicatesthat the overturn and thermal homogenisation of the water column causes littleresuspension and redistribution of particles within the lake, as also described insome earlier papers (Davis, 1968; Pennington, 1974). This supports the hypothesisthat the increase in the amount of deposited DM during early autumn (Figure 3) ismainly caused by bioproduction.
As the main pollen production of Pinus and Betula takes place in slightly differ-ent times (April-June for Betula and May-July for Pinus), their deposition into trapsalso occurs differently within the annual cycle of thermal stratification. In 1998, theflowering of birches was before May. Because of that the amount of Betula pollenin the upper traps comprised in spring 70–80% of the annual total (Figure 6). Inthe lower traps the maximum amount of Betula pollen mainly appeared in June atthe beginning of stratification (ca. 70% of the annual total). This suggests that thesinking rates of Betula pollen and spheroidal fly-ash particles are comparable. Thelow and equal accumulation of Betula pollen during the autumn overturn period(less than 5%) also indicates that the resuspension of particles of this size is ratherweak.
Because the pollination of pines takes place later than the pollination of birches,the influx of pine pollen into traps mainly occurs during the stratification season, inMay–June (Figure 7). There is also evidence of resuspension of Pinus pollen duringwinter–spring seasons, when no Pinus influx should occur. This resuspension isdifferent in different observation years (Figure 7). The low influx of pine pollenduring winter and spring of the first year may be caused by the low inflow ofmelting water after ice break, while the higher resuspension in the second yearmay be related to more intensive inflow of snow water. Thus, the resuspensionof Pinus pollen, due to their air sacks, is more common than the resuspensionof Betula pollen. The delay time between the maximum number of settled Pinuspollen in the upper and lower traps is also somewhat greater than for Betula pollen,suggesting that the thermocline decelerates the sinking velocity of Pinus pollengrains (Figure 8).
7. Conclusions
The application of sediment traps to study the fluxes of various types of particleswith different physical properties allows us to make some conclusions related toparticle pathways in the course of seasonal changes in thermal stratification
1. The resuspension of settled particles in Lake Jussi is low and depends greatlyon meteorological conditions, the most important of which are the thickness ofsnow cover and meteorological conditions in early spring. These factors influ-
SEASONAL FLUXES OF PARTICULATE MATTER IN A SMALL CLOSED LAKE 91
ence the influx intensity of particles from the catchment and the resuspensionof previously deposited material on the lake bottom.
2. As the influx of different particle types into the lake differs temporally, it waspossible to make rough estimations about the sinking rate of spheroidal fly-ash particles and Pinus pollen for the stratification period. The obtained value(approximately 6–8 cm day−1) is low and represents only the time with a strongthermocline, which might reduce substantially the sinking velocity of particles.
3. The share of resuspended particles in the traps exposed in the epilimnion (II,IV, and VI) is relatively small. In the total flux of dry matter, the resuspendedparticles may account for up to 30%, but for fly-ash particles and Betula pollenthe proportion is less than 10%.
This study revealed the great importance of seasonal circulation of seston particlesin the water column and the ways of the formation of the bottom sediment fluxesin a small stratified lake.
Acknowledgements
We thank Prof. Rick Battarbee for his helpful and constructive review of an earlierversion of this paper and two referees for valuable comments. This study wassupported by target-financed projects of the Estonian Ministry of Education andthe Estonian Science Foundation Grants 3773 and 5584.
References
Bloesch, J. and Uehlinger, U.: 1986, ‘Horizontal sedimentation differences in a eutrophic Swiss lake’,Limnol. Oceanogr. 31, 1049–1109.
Boers, P. and Uunk, J.: 1991, ‘Lake Restoration: Estimation of Internal Phosphorus Loading afterReduction of External Loading from Sediment Data’, in P. Boers (ed.), The Release of DissolvedPhosphorus from Lake Sediments, Diss. Ph.D., The Netherlands, pp. 79–90.
Davis, M. B.: 1968, ‘Pollen grains in lake sediments: Redeposition caused by seasonal watercirculation’, Science, N.Y. 162, 796–799.
Dean, J. M., Kemp, A. E. S., Bull, J., Patterson, G. and Zolitschka, B.: 1999, ‘Taking varves to bits:Scanning electron microscopy in the study of laminate sediments and varves’, J. Paleolim. 22,121–136.
Håkanson, L. and Jansson, M.: 1983, Principles of Lake Sedimentology, Springer-Verlag, Berlin,Heidelberg, 316 pp.
Heiskanen, A.-L.: 1998, ‘Factors Governing Sedimentation and Pelagic Nutrient Cycles in theNorthern Baltic Sea’, Monographs of the Boreal Environment Research, 8, Finnish EnvironmentInstitute, Helsinki, 79 pp.
Istvanovics, V., Herodek, S. and Szilagyi, F.: 1989, ‘Phosphate adsorption by different sedimentfractions in Lake Balaton and its protecting reservoirs’, Water Res. 23, 1357–1366.
Martinova, M. V.: 1993, ‘Nitrogen and phosphor compounds in bottom sediments: Mechanisms ofaccumulation, transformation and release’, Hydrobiologia 252, 1–22.
92 JAAN-MATI PUNNING ET AL.
Mieszczankin, T. and Noryskiewicz, B.: 2000, ‘Processes that can disturb the chronostratigraphy oflaminated sediments and pollen deposition’, J. Paleolim. 23, 129–140.
Odgaard, B. V.: 1993, ‘The sedimentary record of spheroidal carbonaceous fly-ash particles inshallow Danish lakes’, J. Paleolim. 8, 171–187.
Pennington, W.: 1974, ‘Seston and sediment formation in five Lake District lakes’, J. Ecol. 62, 215–250.
Punning, J.-M., Koff, T. and Alliksaar, T.: 2000, ‘Matter fluxes in Lake Matsimäe (Central Estonia)estimated from traps and sediment records’, Oil Shale 17(2), 184–200.
Renberg, I. and Wik, M.: 1985, ‘Soot particle counting in recent lake sediments: An indirect datingmethod’, Ecol. Bull. 37, 53–57.
Rodrigo, M. A., Pierson, D. C., Petterson, K., Kaup, E. and Padisák, J.: 1988, ‘Sinking and float-ing rates of natural phytoplankton assembleges in Lake Erken’, Arch. Hydrobiol. Spec. issuesAdvanc. Limnol. 51, 143–156.
Rose, N. L.: 1990, ‘A method for the selective removal of inorganic ash particles from lakesediments’, J. Paleolim. 4, 61–67.
Søndergaard, M., Kristensen, P. and Jeppesen, E.: 1992, ‘Phosphorus release from resuspendedsediment in shallow and wind-exposed Lake Arreso, Denmark’, Hydrobiologia 228, 91–99.
Stheinman, B. S. and Parparov, A. S.: 1997, ‘An approach to particulate matter transfer studies inlittoral zones of lakes with changing morphometry’, Wat. Sci. Tech. 36(4), 199–205.
Stockmarr, J.: 1971, ‘Tablets with spores used in absolute pollen analysis’, Pollen Spores 13, 615–621.
Tõnisson, A.: 1995, ‘Jussi Lake District: The Landscape and Main Development Trends’, in Year-book of the Estonian Geographical Society 29, Tallinn, pp. 17–33 (in Estonian).
Weyhenmeyer, G. A.: 1996, The Significance of Sediment Resuspension in Lakes, Acta UniversitatisUpsaliensis. Comprehensive Summaries of Uppsala Dissertations from the Faculty of Scienceand Technology, Vol. 225, 32 pp.
Weyhenmeyer, G. A., Håkanson, L. and Meili, M.: 1996, ‘A Validated Model for Daily Variationsin the Flux, Origin and Distribution of Settling Particles within Lakes’, in G. A. Weyhenmeyer(ed.), The Significance of Sediment Resuspension in Lakes, Acta Universitatis Upsaliensis, Com-prehensive Summaries of Uppsala Dissertations from the Faculty of Science and Technology,Vol. 225, 32 pp.
Weyhenmeyer, G. A., Meili, M. and Pierson, D. C.: 1995, ‘A simple method to quantify sources ofsettling particles in lakes: Resuspension versus new sedimentation of material from planktonicproduction’, Mar. Freshwater Res. 46, 223–231.