sea-plm 2019 - unicef
TRANSCRIPT
SEA-PLM 2019NATIONAL REPORT OF THE
PHILIPPINES


SEA-PLM 2019NATIONAL REPORT
PHILIPPINESOFTHE
MARCH 2021

Foreword..................................................................................................................................................ixAcknowledgment...................................................................................................................................xi Executive Summary.................................................................................................................................1
Section 1: Introduction.................................................................................................................................7
Section 2: Reading Literacy .......................................................................................................................9
2.1 How does SEA-PLM Assess Reading Literacy?....................................................................................92.2 What can Filipino Grade 5 students do in Reading?.........................................................................11 2.3 SEA-PLM 2019 Reading Alignment with the SGD 4.1......................................................................13
Section 3: Writing Literacy........................................................................................................................15
3.1 How does SEA-PLM Assess Writing Literacy?....................................................................................153.2 What can Filipino Grade 5 students do in Writing? ........................................................................18
Section 4: Mathematics Literacy .............................................................................................................21
4.1 How does SEA-PLM Assess Mathematical Literacy? .......................................................................214.2 What can Filipino Grade 5 Students do in Mathematics?..............................................................234.3 SEA-PLM 2019 Mathematics Alignment with the SDGs...................................................................25
Section 5: Equity in Learning Opportunities .......................................................................................27
5.1 Equity Effects of Children’s Background, Home Influence, andSchool Experience.....................................................................................................................................275.1.1 Gender.................................................................................................................................................275.1.2 Age......................................................................................................................................................285.1.3 Socioeconomic Status....................................................................................................................295.1.4 Combined Gender, School Location, and Socioeconomic Status.......................................305.1.5 Preschool Education.......................................................................................................................315.1.6 School Readiness in Language and Mathematics...................................................................325.1.7 Speaking the Language of Instruction at Home......................................................................335.1.8 Grade Repetition..............................................................................................................................335.1.9 Administrative Region Results by Proficiency Bands..............................................................345.1.10 School Management.....................................................................................................................38
5.2 Equity Effects of School Environment and Teacher Profiles ...........................................................385.2.1 School Size........................................................................................................................................385.2.2 School Location...............................................................................................................................39
TABLE OF CONTENTS
5.2.3 Resources in the local area............................................................................................................405.2.4 Access to textbooks and library...................................................................................................415.2.5 Teacher profiles.................................................................................................................................42
5.3 Equity Effects of Children’s, Teacher’s and Parent’s Attitude andEngagement.............................................................................................................................................44
5.3.1 Children’s attitudes about school.................................................................................................445.3.2 Parental engagement in children’s learning..............................................................................455.3.3 Perception of issues affecting children’s learning in the classroom....................................47
Section 6 Children’s perception of Global Citizenship Education..................................................51
6.1 How does SEA-PLM Assess Global Citizenship?...............................................................................516.2 Perception of global citizenship topics learned at school..............................................................526.3 Attitudes about global citizenship education.....................................................................................536.4 Attitudes about societal issues...............................................................................................................546.5 Attitudes about environmental sustainability.....................................................................................556.6 Attitudes about national and regional identity..................................................................................566.7 Children’s participation in global citizenship activities.....................................................................57
6.7.1 School activities related to global citizenship............................................................................576.7.2 General activities related to global citizenship.........................................................................586.7.3 Future school activities related to global citizenship..............................................................59
6.8 Teachers’ capability in global citizenship education.........................................................................606.8.1 Pre-service preparation for global citizenship education......................................................606.8.2 Confidence in teaching global citizenship topics....................................................................61
6.9 Teachers’ perception of global citizenship education......................................................................626.9.1 Attitudes about children’s global citizenship skills, values,
and characteristics...........................................................................................................................626.9.2 Teacher attitudes about children’s global citizenship learning
at school..........................................................................................................................................636.9.3 Perception of children’s opportunities for global citizenship education
at school...........................................................................................................................................646.10 Comparison of Global Citizenship Scores by Gender, Type of Community,
and Type of School................................................................................................................................656.10.1 Gender...............................................................................................................................................656.10.2 School Location..............................................................................................................................666.10.3 School Management.....................................................................................................................67
Section 7Conclusions and Recommendations...................................................................................69
References .............................................................................................................................................72
LIST OF FIGURES and TABLESFigures
Figure 1. Task characteristics in Reading Literacy Framework........................................................................9 Figure 2. Mean Scores in Reading Literacy Assessment
of SEA-PLM 2019 Participating Countries......................................................................................11Figure 3. Percentage Distribution of Filipino Grade 5 Students
in Reading Assessment by Proficiency Band................................................................................11 Figure 4. Example of reading item, Band 6
(minimum proficiency at end of primary level)...........................................................................12 Figure 5. Example of reading item, Band 2 and below
(below minimum proficiency at end of lower primary).............................................................12Figure 6. Percentage Distribution of Filipino Grade 5 Students’
Performance in Reading against SDG 4.1.1a and SDG 4.1.1.b..................................................13Figure 7. Task Characteristics measured in Writing Literacy..........................................................................15 Figure 8. Mean Scores in the Writing Literacy Assessment
of SEA-PLM 2019 Participating Countries.....................................................................................18 Figure 9. Percentage Distribution of Filipino Grade 5 Students
in Writing Literacy Assessment by Proficiency Band..................................................................18Figure 10. Mathematical Literacy Processes......................................................................................................22Figure 11. Mean Scores in Mathematics Literacy Assessment
of SEA-PLM 2019 Participating Countries....................................................................................23Figure 12. Percentage Distribution of Filipino Grade 5 Students
in Mathematics Assessment by Proficiency Band.......................................................................24Figure 13. Example of mathematics item, Band 8..........................................................................................24Figure 14. Example of mathematics item, Band 5..........................................................................................25Figure 15. Example of mathematics item, Band 3..........................................................................................25Figure 16. Percentage Distribution of Filipino Grade 5 Students’
Performance in Mathematics against SDG 4.1.1a and SDG 4.1.1.b........................................26Figure 17. Percentage Distribution of Children’s Age by Group..................................................................28Figure 18. Scatterplots of Socioeconomic Index and Scores.................................................................29-30Figure 19. Percentage of Grade 5 children in each proficiency band
in Reading by administrative region.............................................................................................34Figure 20. Percentage of Grade 5 children in each proficiency band
in Writing by administrative region...............................................................................................35Figure 21. Percentage of Grade 5 children in each proficiency band
in Mathematics by administrative region.....................................................................................36Figure 22. Mean Scores in Reading, Writing and Mathematics
by School Management...................................................................................................................38Figure 23. Percentage Distribution of Grade 5 Students by School Size..................................................38Figure 24. Difference in average Reading, Writing, and Mathematics
scores by school size.........................................................................................................................39
Figure 25. Percentage Distribution of Grade 5 Students by School Location.........................................39Figure 26. Mean scores in Reading, Writing, and Mathematics of Filipino
Grade 5 Students by School Location.........................................................................................40Figure 27. Difference in average Reading, Writing, and Mathematics scores
by school area resources.................................................................................................................41Figure 28. Percentage distribution of children by their teacher specialization........................................43Figure 29. Percentage distribution of children by their teacher’s training................................................43Figure 30. Percentage Distribution of Students Feeling Agreed with
Attitude Towards School.................................................................................................................44Figure 31. Difference in average reading, writing, and mathematics score
by Attitude Towards School............................................................................................................45Figure 32. Percentage Distribution of Students by regular Parental
Engagement in children learning..................................................................................................45Figure 33. Difference in average reading, writing, and mathematics score
by Parental Engagement................................................................................................................46Figure 34. Percentage Distribution of Students who indicated teacher
classroom-related issues as occurring “often” or “sometimes”.............................................47Figure 35. Difference in average reading, writing, and mathematics scores
by issues hindering school capacity.............................................................................................48Figure 36. Percentage Distribution of Students by Teachers reporting issues
affecting children’s learning “to a moderate extent” or “to a large extent”.............................................................................................................................49
Figure 37. Percentage Distribution of children’s who perceived the globalcitizenship topics to be learned at school..................................................................................52
Figure 38. Percentage Distribution of children who identified the topicsto be important to learn in school.................................................................................................53
Figure 39. Percentage Distribution of children who agreed with societalstatements..........................................................................................................................................54
Figure 40. Percentage Distribution of children who were worried aboutenvironmental sustainability issues...............................................................................................55
Figure 41. Percentage Distribution of children who agreed with identitystatements.........................................................................................................................................56
Figure 42. Percentage Distribution of children who indicated they hadparticipated in school activities related to global citizenship................................................57
Figure 43. Percentage Distribution of children who were willing toparticipate in activities related to global citizenship...............................................................58
Figure 44. Percentage Distribution of children who indicated they werelikely to participate in future school activities related to globalcitizenship..........................................................................................................................................59
Figure 45. Percentage Distribution of teachers who felt prepared to teachglobal citizenship topics.................................................................................................................60
Figure 46. Percentage Distribution of teachers who were confident to teachglobal citizenship topics.................................................................................................................61
Figure 47. Percentage Distribution of teachers who considered that children’sglobal citizenship skills, values and characteristics are important.......................................62
Figure 48. Percentage distribution of teachers who considered that children’s global citizenship learning at school is important.................................................63
Figure 49. Percentage distribution of teachers who reported thatglobal citizenship activities took place in a regular school year...........................................64
Figure 50. Mean GC Scores by Gender..............................................................................................................65 Figure 51. Mean GC Scores by School Location............................................................................................66Figure 52. Mean GC Scores by Type of School Management....................................................................67
Tables
Table 1. Full band specifications and descriptions in Reading LiteracySEA-PLM Assessment 2019....................................................................................................................10
Table 2. Full band specifications and descriptions in Writing LiteracySEA-PLM Assessment 2019............................................................................................................16-17
Table 3. Full band specifications and descriptions in Mathematics LiteracySEA-PLM Assessment 2019..................................................................................................................22
Table 4. Mean Scores in the SEA-PLM 2019 Assessments by Domainand Gender..............................................................................................................................................27
Table 5. Percentage of Boys and Girls in Reading and Mathematicsagainst SDG 4.1.1b (end of primary)..................................................................................................28
Table 6. Regression Coefficients for the Effects of Gender, School Locationand SES in Reading, Writing, and Mathematics.............................................................................30
Table 7. Mean Scores in Reading, Writing, and Mathematicsby Preschool Education.........................................................................................................................31
Table 8. Tasks that children could perform prior to primary education based on parents’ perception.............................................................................................................32
Table 9. Difference in average reading, writing, and mathematics scoresby capacity to perform early language and mathematical tasksprior to Primary Education..................................................................................................................32
Table 10. Difference in average reading, writing, and mathematics scoresby whatever the language of instruction is spoken at home......................................................33
Table 11. Difference in average reading, writing, and mathematics scores by grade repetition......................................................................................................................................33
Table 12. Percentage of Children attending schools whose principal reportedthat these resources were available in their school’s local area.................................................40
Table 13. Percentage of Grade 5 Students Attending Schools by textbook availability.........................................................................................................................42
Table 14. Differences in average reading, writing, and mathematicsby textbook availability ........................................................................................................................42
Table 15. Global Citizenship Assessment Framework....................................................................................51
SOUTHEAST ASIA - PRIMARY LEARNING METRICS 2019 NATIONAL REPORT OF THE PHILIPPINES ix
FOREWORD
On behalf of UNICEF Philippines, we would want to congratulate the Department of Education (DepEd) for participating in the Southeast Asia Primary Learning Metrics (SEA-PLM), along with five other countries in the region. The Philippines National Report on the results of SEA-PLM 2019 provides us with valuable insights to strengthen an evidence-based development agenda for the Southeast Asia Region and for the Philippines to further improve learning for all children.
The Philippines has embarked on notable reforms in basic education since 2013, with the implementation of the K-12 program, making the 13 years of basic education from Kinder to Grade 12 at par with neighboring countries. The Philippines elementary participation rate of 94% in 2018-2019 prior to COVID-19 is comparable with regional peers as per most recent data from the World Bank. The focus of DepEd on quality learning is very timely given the results of PISA 2018 for 15-year old children and TIMSS 2019 for Grade 4 students, which have shown very low results compared to other participating countries.
The SEA-PLM, a new regional large-scale assessment, designed by and for countries in Southeast Asia is an opportunity to monitor learning outcomes across and within countries for Grade 5 pupils. It endeavors to provide a common approach to SEAMEO member countries to understand factors that facilitate or hinder learning and ultimately improve education systems. We’re content to see that standard proficiencies in SEA-PLM are now aligned with the SDG4 indicators for end of lower primary.
The findings of the first cycle of the SEA-PLM in the country suggests the existence of alarming trends of low quality of learning. The average scores of Philippines
in reading, math and writing are all below the average scores of the other five participating countries. The results also show that Grade 5 students in the Philippines put lower value to topics like protecting environment, loss of natural resources and climate change. SEA-PLM is the first large scale assessment that includes global citizenship indicators linked to the development of 21st century skills in K-12 curriculum.
There are as well inequities as students from lower socio-economic status and in rural areas are far more likely to fall behind in acquiring foundational skills. This compelling evidence reminds of more complicated challenges during this pandemic to ensure equitable chance for every child to quality learning.
UNICEF is committed to reducing social, economic, and geographic inequities and disparities among children towards the achievement of the Philippine Development Plan and the Sustainable Development Goals through the implementation of the 8th Country Programme for Children from 2019-2023. We will continue to provide technical assistance for DepEd’s Bureau of Education Assessment on the dissemination of SEA-PLM findings and further analysis alongside the results of other international and national assessments and I UNICEF fully supports DepEd’s decision to continue participating in SEA-PLM’s next cycle.
Let me express my heartful appreciation to DepEd, SEAMEO Secretariat, UNICEF-EAPRO and the research team from the Australian Council for Education Research for the successful implementation of SEA-PLM 2019.
Oyunsaikhan DendevnorovRepresentativeUNICEF Philippines
FOREWORD
In line with the Department’s endeavor to continually provide quality education for the Filipino learners, DepEd implemented the Enhanced Basic Education Program which envisions to raise the standards of the educational system by providing learners the essential skills, competencies, and values for both life-long learning and employment. To achieve its purpose, the State ensures that “Every learner shall be given an equal opportunity to receive quality education that is globally competitive based on a pedagogically sound curriculum that is at par with international standards.” (Republic Act 10533, Section 2).
The low performance of our students in the Program on International Student Assessment (PISA) 2018, and that of our National Achievement Tests (NAT) indicates the alarming need for massive and aggressive reforms in the Philippine education system. While we try to address “ACCESS” in education, we must not forget another important aspect and perhaps, even the biggest education challenge - “QUALITY”.
The country embarked in joining large-scale international assessments (ILSAs) like PISA, TIMSS and SEA-PLM as a measure of quality performance. It will serve as quality indicator for benchmarking, to determine the efficiency and effectiveness of our instructional reforms, and to come-up with global norms and standards. Our participation in these international assessments will help us to identify the gaps that hinder learning so we can properly plan and decisively address these challenges in our short-, medium- and long-term policy directions and interventions.
Guided by the results of these international assessments, the Department, through the leadership of our Secretary Leonor Magtolis-Briones, will work towards the four (4) pillars of Sulong EduKalidad (“Forward Education
Quality”). There will be an intensive review of the curriculum, examination of curriculum implementation, designing relevant teacher’s professional development programs, continuous improvement of learning environment, and an increased collaboration with education stakeholders.
Apparently. education policy starts with a strong foundation at early grades - this is where the SEA-PLM results will be most useful. Hence, the SEA-PLM National Report will provide a rich data/information in assessing learning outcomes, which also include additional background information from students, parents, teachers and school heads. The findings will help to deepen our insights on what our Grade 5 learners can do and cannot do in Reading, Writing, Mathematics and Global Citizenship for us to better know and understand the strengths and weaknesses of the elementary education curriculum and other factors beyond the school setting.
The overall scores in the Proficiency Bands shall be used as a springboard to determine which aspects in the teaching and learning process need to be reviewed and/or reformulated to further improve the learning outcomes of our Grade 5 learners.
Recognizing the significant role of SEA-PLM, the Department will continue to participate in its journey - as it also employs meaningful collaboration and partnership with our neighbors across Southeast Asia. We will actively participate in the collective regional exercise in learning assessment though networking, peer learning, mentorship, and collaboration. We will contribute to the SEA-PLM development initiatives and efforts - as we also benefit in the process.
The journey to quality education is long and not easy - but with the collective effort of all of us moving together, both at the national and regional levels, we can achieve success!
Congratulations to all who made SEA-PLM a reality!
Diosdado M. San AntonioUndersecretary for Curriculum and InstructionDepartment of Education
x
SOUTHEAST ASIA - PRIMARY LEARNING METRICS 2019 NATIONAL REPORT OF THE PHILIPPINES
ACKNOWLEDGEMENT
Acknowledgment is highly accorded to the following persons and organizations:
SEA-PLM 2019 Technical Working GroupUndersecretary Nepomuceno A. Malaluan (Chairperson)Undersecretary Diosdado M. San Antonio (Co-Chairperson)Undersecretary Jesus Lorenzo R. Mateo (Co-Chairperson)Assistant Secretary Alma Ruby C. TorioDirector Nelia V. BenitoDirector Margarita Consolacion C. BallesterosDirector Roger B. Masapol
SEA-PLM 2019 Technical TeamGretchen G. Cordero, Danilyn Joy L. Pangilinan, Armida Celeste, Enrico Totanes, Bernadette Reyes, Sheryll Ann Legarte and Cherry SantiagoBureau of Education Assessment (BEA) Staff
DepEd Regional Offices, Division Offices, Participating Schools in SEA-PLM 2019
UNICEF-PhilippinesIsy Faingold, Teresita Felipe, Aki Osawa
SEAMEO-INNOTECH (Philippines)Dr. Ramon Bacani, Philip Purnell, Dr. Sherlyn Almonte-Acosta
SEA-PLM 2019 ConsultantDr. Kevin Carl P. Santos, Joemari E. Olea, Elleize S. Angeles
Assessment, Curriculum and Technology Research Centre (ACTRC)Dr. Field Rickards, Dr. Marie Therese Angeline Bustos, Dr. Marlene Ferido
Special appreciation is also extended to:• SEAMEO Secretariat-Bangkok• UNICEF-EAPRO• SEA-PLM Secretariat• SEA-PLM Regional Steering Committee• SEA-PLM Technical Advisory Group• SEA-PLM 2019 Participating Countries• Australian Council for Educational Research (ACER)
Secretary Leonor Magtolis-Briones provided the direction and inspiration in supporting the SEA-PLM 2019 Regional Assessment initiatives.
xi
SOUTHEAST ASIA - PRIMARY LEARNING METRICS 2019 NATIONAL REPORT OF THE PHILIPPINES
EXECUTIVE SUMMARY
1. Participation of the Department of Education (DepEd) – Philippines in SEA-PLM 2019
The Southeast Asia Primary Learning Metrics (SEA-PLM) is a large-scale student learning assessment program designed by and for countries in the Southeast Asian Region to assess Grade 5 students’ learning outcomes. It has been developed after the analysis of the curricula of different countries in the Southeast Asian region. It primarily measures learning outcomes in the domains of reading, writing, mathematics, and global citizenship (GC). SEA-PLM also included background questionnaires for students, parents, teachers, and school principals for contextual analysis. More importantly, SEA-PLM is aligned with the minimum proficiency indicators suggested in the Sustainable Development Goal (SDG) 4.1.1, at the end of lower primary and the end of the primary education.1
DepEd endeavors to continually provide quality education for Filipino learners. To ascertain the quality of learning in basic education, DepEd believes that assessment plays an essential role in providing reliable data to diagnose the educational system’s strengths and weaknesses. For this reason, the Philippines participated in the first cycle of SEA-PLM in School Year 2018-2019, together with Cambodia, Lao PDR, Malaysia, Myanmar, and Viet Nam.
In the Philippines, a total of 6,083 Grade 5 students took the SEA-PLM assessments in reading, writing, and mathematics literacy in February 2019 through a paper-and-pencil test. It is the only country that used English as the language for the test as it is the official language of instruction beginning at Grade 4 level. The background questionnaires were administered to 5,780 parents, 1,153 Grade 5 teachers, and 173 school heads.
2. What do Filipino Grade 5 students know and can do in reading, writing, and mathematics?
2.1 Reading
The SEA-PLM 2019 Assessment Frameworok (2017a) defined Reading Literacy as understanding, using, and responding to various written texts to meet personal, societal, economic, and civic needs.
The average score of Filipino Grade 5 students in the Reading Literacy assessment was 288 points, implying that a typical Filipino Grade 5 student can read a range of everyday texts fluently and begin to engage their meaning. The Philippines was one of the four countries that achieved an average score below 300 points, the average of six participating countries.
The majority of Filipino Grade 5 students (63%) met the reading proficiency level expected at the end of lower primary education based on SDG 4.1.1a indicator (Bands 3,4,5). In general, typical Filipino Grade 5 students can read a range of everyday texts fluently, such as simple narratives and personal opinions, and beginning to engage with their meaning. They can also locate prominent details in everyday texts and connect related information where it is obvious, and there is minimal competing information. Typically, they can make simple inferences from prominent information.
1SDG 4.1.1.a describes minimum proficiency for reading and mathematics at the end of lower primary (Grade 4 for the Philippines) and SDG 4.1.1b at the end of primary education (Grade 6 for the Philippines)
1
However, only 10% of Filipino Grade 5 students were able to meet the reading proficiency level at the end of primary education as described by SDG 4.1.1b. They can understand texts with familiar structures and manage competing information when locating ideas and details. Additionally, they can find multiple pieces of related information in texts with familiar structures and make connections between details and ideas to draw inferences. Majority of Grade 5 students achieved this level in Malaysia (58%) and Vietnam (82%), while Cambodia (11%), Myanmar (11%), and Lao PDR (2%) were also at low levels.
On the other hand, more than 25% of Filipino Grade 5 students belonged to the lowest proficiency band in reading literacy. They can only identify relationships between words and their meanings. They did not even meet the proficiency level for reading literacy expected at the end of lower primary, suggesting that they would likely struggle to transition to secondary school.
2.2 Writing
In the SEA-PLM 2019 Assessment Framework (2017a), Writing Literacy refers to constructing meaning by generating a range of written texts to express oneself and communicate with others, to meet personal, societal, and civic needs.
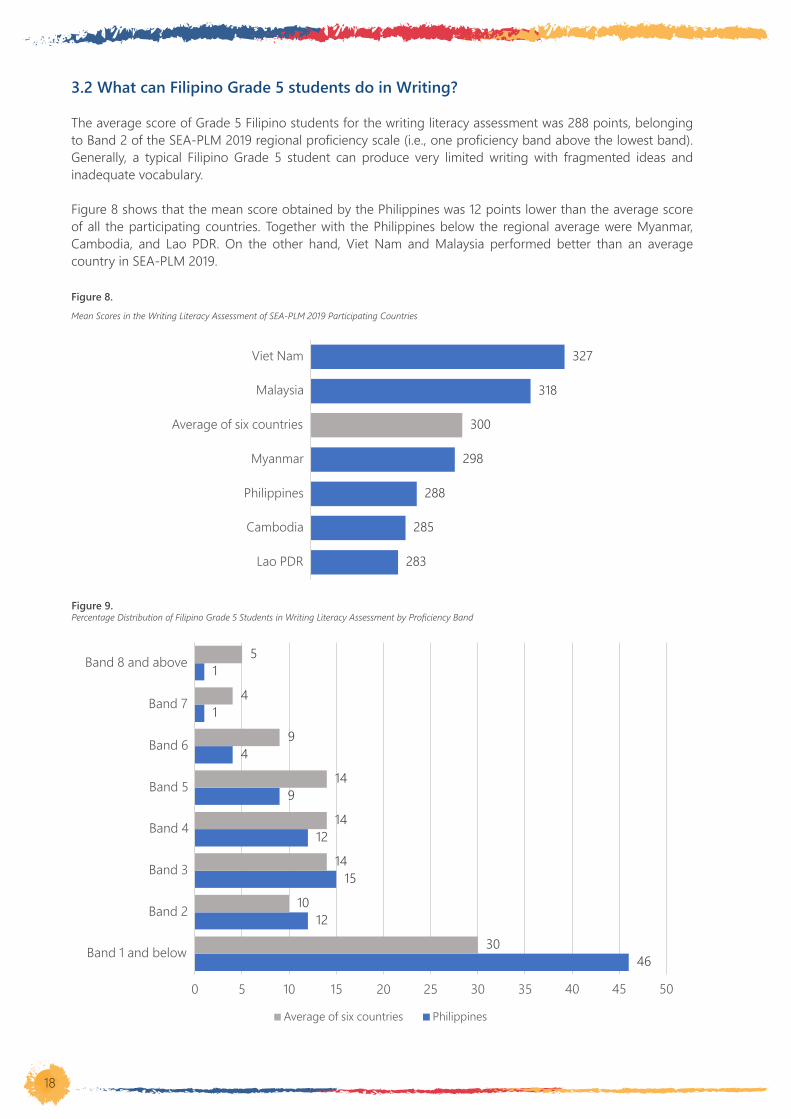
The average score of Grade 5 Filipino students for the writing literacy assessment was 288 points, suggesting that a typical Filipino Grade 5 student can produce very limited writing with fragmented ideas and inadequate vocabulary. Along with the Philippines below the regional average were Cambodia, Lao PDR, and Myanmar.
Almost half (46%) of the Filipino Grade 5 students belonged to the lowest proficiency band in writing literacy. They had limited ability to present ideas in writing. They can produce a few sentences with very limited content. For instance, when describing a picture, they focus only on a few isolated features or create too general ideas. They produce imperative but inconsistent language. Their limited range of vocabulary is inadequate to describe a picture. They use words that are basic and repetitive as well.
Only 6% of Filipino Grade 5 students demonstrated writing proficiencies expected of Grade 5 students. These students can produce texts that draw in a broader world context, with relevant, detailed, and sometimes imaginative ideas. Furthermore, they can write texts with an introduction, body, and conclusion in which ideas are well related and easy to follow. Lastly, they can also write using a polite, formal style and a good range of appropriate vocabulary, with a degree of sophistication. Vietnam (52%) and Malaysia (31%) had more students on this proficiency level, while Cambodia (5%), Lao PDR (6%), and Myanmar (5%) had similar low results like the Philippines.
2.3 Mathematics
In the SEA-PLM 2019 Assessment Framework (2017a), Mathematical Literacy refers to a learner’s capacity to use mathematical knowledge and skills in solving problems and in dealing with different kinds of challenges they may encounter in a variety of contexts, where mathematics may be relevant to those problems and challenges.
The mean score of Filipino Grade 5 students in the mathematics assessment was 288 points, indicating that a typical Filipino Grade 5 student can apply number properties and units of measurement in English. Like the Philippines, Cambodia, Lao PDR, and Myanmar also achieved mean scores in mathematics literacy below the average mean score (300 points) of the six participating countries.
About 42% of the Filipino Grade 5 students met the minimum proficiency at the end of the lower primary education (Bands 4,5) in mathematics. They can apply number properties and units of measurements. In particular, they can find half of a 1-digit even number and understand place value in 5-digit numbers. They can also solve a problem involving capacity that does not include the conversion of units. Moreover, they can apply their knowledge of the number of minutes in an hour and read a value from a bar graph.
2
SOUTHEAST ASIA - PRIMARY LEARNING METRICS 2019 NATIONAL REPORT OF THE PHILIPPINES
On the other hand, around 41% of the Filipino Grade 5 students failed to meet the mathematics proficiency level expected at the end of the lower primary as described by SDG 4.1.1a. At the most, they can only understand place value and scales or measurement. Some of them might be able to add single-digit numbers together only, and others might be able to count a small collection of objects or recognize numbers.
About 17% of Filipino Grade 5 students were able to meet the proficiency level expected at the end of primary in mathematics as described by SDG 4.1.1b. At the least, they can perform mathematical operations, including fractions, and interpret tables and graphs. For instance, they can convert a fraction in tenths to its decimal equivalent. They can also solve problems involving measuring devices requiring conversion of metric units of length and capacity. A large majority of students in Vietnam (92%) and Malaysia (64%) were able to demonstrate this proficiency level. Other countries, Cambodia (19%), Lao PDR (8%), and Myanmar (12%) were at the same level as the Philippines.
3. Equity in learning opportunities
The results showed disparities in Filipino Grade 5 students’ performance in reading, writing, and mathematics based on the analysis of contextual variables. Further analysis will be undertaken to better understand the equity effects of the school environment and teacher profiles.
Gender, Age, Children’s Background and Home Influence
Grade 5 Filipino girls significantly outperformed boys in all three domains. The largest difference can be found in writing literacy, whereas the smallest disparity can be seen in mathematical literacy.
Almost half of Filipino Grade 5 students were 11 years old, followed by about 40% who were 10 years old. About 1 in 10 Filipino Grade 5 students were 12 years old or above. As regards scores, Filipino Grade 5 students aged 12 years and above consistently had significantly lower mean scores than students younger than them.
The analysis revealed a significant positive correlation between the socioeconomic status (SES) index2 and the reading, writing, and mathematics scores. Hence, those students who had more access to learning resources performed better than those who had less access to the same learning materials. This finding emphasizes the inequality in access to quality education of those who are well-off and those who are less fortunate families.
The majority (54%) of the Grade 5 students attended preschool education for two years or more. About 41% of them attended for one year, and only 5% did not attend preschool education. Those who attended preschool education obtained significantly higher mean scores in all three domains, providing evidence of preschool education’s importance in the children’s later academic performance.
School readiness analysis showed that students who can complete ten or more of the early language and mathematical tasks before primary education had significantly higher mean scores across the three domains than students that can perform less than ten tasks before attending primary school. The average scores of Filipino Grade 5 pupils who can do more than ten tasks according to parents were lower than the average scores for the six countries in all three domains. Students in Vietnam and Malaysia who can do less than 10 tasks performed even better than the highest Filipino performers in the three domains. This finding shows that early skills are important and disadvantaged children should be supported across early grades.
A vast majority (93%) of the Filipino Grade 5 students do not speak the language of instruction (i.e., English) at home most of the time. However, there was no significant difference in the reading, writing, and mathematics scores of those children who do and do not speak English at home most of the time. The finding suggests that whether the students speak English at home most of the time or not does not influence their performance in the SEA-PLM 2019 assessments.
More than half (67%) of the Filipino Grade 5 students did not repeat grade level, but it was slightly below the average of the six countries (78%). Filipino Grade 5 students who repeated grade levels had significantly lower mean scores in all three domains than those who did not.
2Socioeconomic Index per child was computed in SEA-PLM 2019. It included parental education, parental occupation and home possessions. Higher value of the index means more resources available for the family
3
Among the sample Filipino Grade 5 students, nine in every ten students were enrolled in public schools.Overall, Filipino Grade 5 students from private schools significantly outperformed those from public schools in all three domains. The gap between the two was more prominent in reading and writing literacy.
Examining the Filipino Grade 5 students’ performance across three domains revealed large variability in the percentage distribution of the students’ proficiency levels among the different administrative regions.
This finding is an indication that there were regions with more Grade 5 students who will likely struggle to transition to secondary schools than others.
In reading, the percentages of Grade 5 students who reached the highest proficiency band (Band 6 and above) ranged from 1.8% (MIMAROPA) to 25.3% (NCR). They were expected to understand texts with familiar structures and manage competing information – competencies expected at the end of primary education. On the other hand, those who can only identify relationships between words and their meanings (Band 2 and below) ranged from 10.7% (NCR) to 43% (Region XII).
Meanwhile, in writing, modest to large percentages (21.3% to 62.5%) of Filipino Grade 5 students across administrative regions were classified under the lowest proficiency band (Band 1 and below). These students had limited ability in presenting ideas in writing. Moreover, among the administrative regions, only a very limited proportion (0 to 3%) of the Grade 5 students reached the expected proficiency level (Band 8 and above) at the end of primary education. This finding suggests that a vast proportion of students across administrative regions that were not demonstrating the proficiency level expected of a Grade 5 student.
Lastly, about 4.7% (Region IV-B) to 34.4% (NCR) of the Filipino Grade 5 students met or progressing toward the expected proficiency level (Band 6 and above) in mathematics at the end of primary education across the administrative regions. At the least, they could perform mathematical operations, including with fractions, and interpret tables and graphs. On the other hand, Region XII (38.4%), Region VIII (31.5%), and CARAGA (30.7%) were the administrative regions from where the greatest percentages of Filipino Grade 5 students in the lowest proficiency band (Band 2 and below) in mathematics came from.
School Environment and Teacher Profiles
Most of the Grade 5 students (35.4%) in the Philippines were enrolled in schools with 1,000 students and over, followed by schools with 200-499 students (34.4%). Only 12.4% of the students attended schools of less than 200 students. It was found that the mean scores in reading, writing, and mathematics of the students attending the smallest schools were significantly lower than those attending the largest schools.
The mean scores of students attending schools in urban areas were significantly higher than those attending schools located in rural areas in all three domains. This finding reveals that the school location plays a vital role in student achievement.
On the average, schools with less available resources in their local area obtained lower mean scores in all three domains than those with more available resources. To fill in this gap, providing more resources to the schools with less available resources could improve their students’ academic performance.
A vast majority of Filipino Grade 5 students had one textbook per student in English (73.8%) and mathematics (71.8%) learning areas. However, it was also estimated that about 8 in 100 Filipino Grade 5 students shared their reading and mathematics textbooks with more than two students. It was found that those students who had their own textbooks obtained significantly higher mean scores in the three domains.
4

SOUTHEAST ASIA - PRIMARY LEARNING METRICS 2019 NATIONAL REPORT OF THE PHILIPPINES
Children’s, Teachers’ and Parents’ Attitude and Engagement
Compared to the average of the six participating countries, the proportion of Grade 5 students in the Philippines with a positive school attitude was lower.
Filipino Grade 5 students with a more positive attitude towards school were more likely to obtain higher scores, on the average, in reading, writing, and mathematics. The finding suggests that providing a favorable school environment to students could contribute to a better academic performance.
From the view of Grade 5 students, the parents’ or guardians’ engagement in their learning was low, ranging from 28% to 36% only. The Philippines had the largest gap in the mean scores for reading, writing, and mathematics between the group with the lowest and the group with the highest parental engagement in schooling. Hence, those Grade 5 students whose parents were more involved in schooling obtained higher mean scores than those whose parents were less engaged in schooling.
Teachers reported that the top issues affecting children’s learning are lack of basic knowledge or skills (69%) and lack of interest (60%). More than half of them also reported the issues of having disruptive students in class (52%) and students’ poor health (52%). Noticeably, the Philippines had more reported issues on students’ lack of sleep, students being hungry in class, students’ absenteeism, and having disruptive students in class than an average participating country in SEA-PLM 2019.
The attitudes of students, practices of teachers, and engagement of parents play an essential role in the development of children’s social and emotional skills that have been found to be crucial to cognitive development. Further analysis of how these factors influence the Grade 5 learner performance in the Philippines will help inform learning delivery improvements.
4. Global Citizenship – What children think about school, community, and global matters
SEA-PLM 2019 is the first large-scale international assessment to measure GC attitudes, values, and behaviors at the primary level. GC incorporates global belonging, solidarity, and identity and is linked with 21st-century skills of critical thinking, problem- solving, empathy, and collaboration, which are the focus of the Philippines K to 12 reform. To be a global citizen, a person must understand the interconnectedness of all life on the planet and hence act to uphold peace, justice, safety, and sustainability of the world (UNICEF & SEAMEO, 2017b).
The majority of Filipino Grade 5 students (71.9%) agreed that the most important global topic learned in school is what is happening inside the country near the Philippines while the least important issue is pollution in places outside the Philippines (55.9%).
Regarding attitudes about societal issues, most Filipino Grade 5 students agreed that it was the government’s role to protect the environment. However, compared with the participating countries in SEA-PLM 2019, the Philippines obtained a lower agreement level with different societal issues. It is also important to note that the percentages of students concerned about the various environmental sustainability issues are always lower than the average of the six countries. Moreover, majority of the Filipino Grade 5 students felt they belonged in their country, but they did not feel much that they had a lot in common with children in the world outside Asia.
Additionally, Filipino Grade 5 students were likely to participate in school activities related to GC, such as voting for class captain/leader/monitor and becoming a candidate for class captain/leader/monitor, compared with students from other participating countries. More than half of the Filipino Grade 5 students were also more likely to participate in general activities related to GC, including helping other people in their community and joining a group to help protect the environment.
5
Conclusions and Recommendations
The Philippines performed below the regional average in reading, writing and mathematics with most students still at the competency level at end of lower primary (Grade 4) and few are moving towards the competencies at end of primary. The goal that every Filipino child is ready for the 21st century is still far fetch, and the challenges are enormous given the learning loss due to the COVID-19 pandemic. The Philippines is the only country who used English as language of the test and could be a critical factor on the results, thus language policy needs in- depth review. Contextual variables from children, parents, teachers, and school heads revealed possible hindrances in equitable learning opportunities for children. The socio-economic status, pre-school education, school readiness in language and mathematics and grade repetition were shown to cause disparity in student’s performance. School size, school location and access to textbooks and library played critical roles in the performance of children. Children’s positive attitude about school and parental engagement were associated with better performance in all three domains. Philippines must continue to collaborate with the SEA-PLM participating countries for cross learning and collective actions to meet the SDG4 goal for quality and inclusive learning for all children. DepEd shall undertake further dissemination of the results and analyses of the SEA-PLM Philippines data to inform policy and program interventions.
Recommendations to address key findings:• Ensuring strong interface of curriculum reforms, pedagogy and assessment with a strong focus on
classroom level assessment;• Greater emphasis on early learning (preschool, Kinder to Grade 3) as a critical key stage to
develop foundational skills;• Addressing the barriers to effective implementation of the use of mother tongue (L1) from K to
Grade 3 and transition to English and Filipino (L2) in Grade 4;• Systematic teacher professional development program and school leadership support;• Improving the learning environment, especially for disadvantaged learners;• Strengthening the reading, writing and mathematics component of the K to 12 education
curriculum in every stage;• Enhancing collaboration and engagement with education stakeholders, parents, and
community leaders to support the educational needs of learners; and• Strengthening analysis and utilization of assessment data including field level monitoring, and
research to continuously inform program innovations especially in the changing context of education, such as the COVID-19 situation.
6
SOUTHEAST ASIA - PRIMARY LEARNING METRICS 2019 NATIONAL REPORT OF THE PHILIPPINES
The Southeast Asia Primary Learning Metrics (SEA-PLM) is a large-scale regional assessment program to assess Grade 5 students’ learning outcomes to inform policymaking and ensure all children achieve meaningful learning. It has been developed after the analysis of the curricula of different countries in the Southeast Asian region. It primarily measures learning outcomes in the domains of reading, writing, mathematics, and global citizenship. Aside from the assessment proper, SEA-PLM also included background questionnaires for students, parents, teachers, and school principals. More importantly, SEA-PLM is aligned in achieving SDG 4, ensuring inclusive and equitable quality education, and learning for the Southeast Asian nations.
SEA-PLM aims to generate reliable data and evidence for monitoring learning outcomes across and within countries and understand the factors that can facilitate or hinder effective learning of children in school. It endeavors to promote regional exchange on learning and education policies and capacitate participating countries in designing and conducting solid learning assessments. Further, it seeks to strengthen the national education stakeholders’ capacity in the analysis, interpretation, and usage of assessment data. Finally, it envisions to help countries to identify, prioritize and address the challenges in education, including curriculum development, resource allocation, pedagogical practice, and planning at the national and sub-national levels (UNICEF & SEAMEO, 2020).
The first cycle of the SEA-PLM assessment was administered during School Year 2018-2019 in the following Southeast Asian countries: Kingdom of Cambodia, Lao People’s Republic, Malaysia, Myanmar, Republic of the Philippines, and Viet Nam.
In the Philippines, multistage stratified sampling was used in selecting the regions, divisions, and schools included in the study. A total of 6,083 Grade 5 students took the SEA-PLM assessments in reading, writing, and mathematics literacy in February 2019 through a paper- and-pencil test. The background questionnaires were administered to 5,780 parents, 1,153 Grade 5 teachers, and 173 school heads. Some exclusions were made due to peace and order issues, remote location, or different curricula being used (e.g., BARMM, international schools).
This national report provides the analysis of both the cognitive instrument and the background questionnaire. The first four sections present the introduction and SEA-PLM assessment results in reading, writing, and mathematics literacy. The fifth section discusses the contextual variables that could influence Grade 5 students’ academic performance. The sixth section details the students’ attitudes and values with respect to global citizenship content that is deemed appropriate and accessible to Grade 5 students in a given SEA-PLM cycle. Lastly, the final (seventh) section presents the conclusions and recommendations to address the key findings based on the analyses of the Philippines’ SEA-PLM assessment data.
7
SECTION 1:
INTRODUCTION

SOUTHEAST ASIA - PRIMARY LEARNING METRICS 2019 NATIONAL REPORT OF THE PHILIPPINES
2.1 How does SEA-PLM Assess Reading Literacy?
Reading Literacy refers to understanding, using, and responding to a range of written texts to meet personal, societal, economic, and civic needs. It is far more than just decoding of words or reading aloud or merely knowledge of words, of linguistic structures and features. It is a foundational skill that seeks to develop cognitive skills such as locating and interpreting information and the idea of relating knowledge about the world of texts and using the texts to develop knowledge of the world.
In the early stages of reading development, several precursor skills need to be acquired to support the central activity of reading for meaning. Few of which include letter and word recognition, fluency, and speed in oral decoding of sentences and passages and listening comprehension. Acquiring these skills at the early stages of reading development underlies success in academic performance and many areas of adult life (Smith, Mikulecky, Kibby, Dreher & Dole, 2000). Its benefits are not limited to participation in school activities and improvement of academic performance, but also in molding the learner’s thinking processes (locating, interpreting, recognizing, etc.). Acquisition of these skills offers a broader spectrum on how a written text might be read, interpreted, and the like.
To underscore the progress and assess the quality of the acquired skills in reading, SEA-PLM designs a monitoring tool that will help provide the policymakers/implementers, schools, teachers, and parents a baseline information on the aspects/areas where learners’ may need assistance or attention as their reading skills progresses.
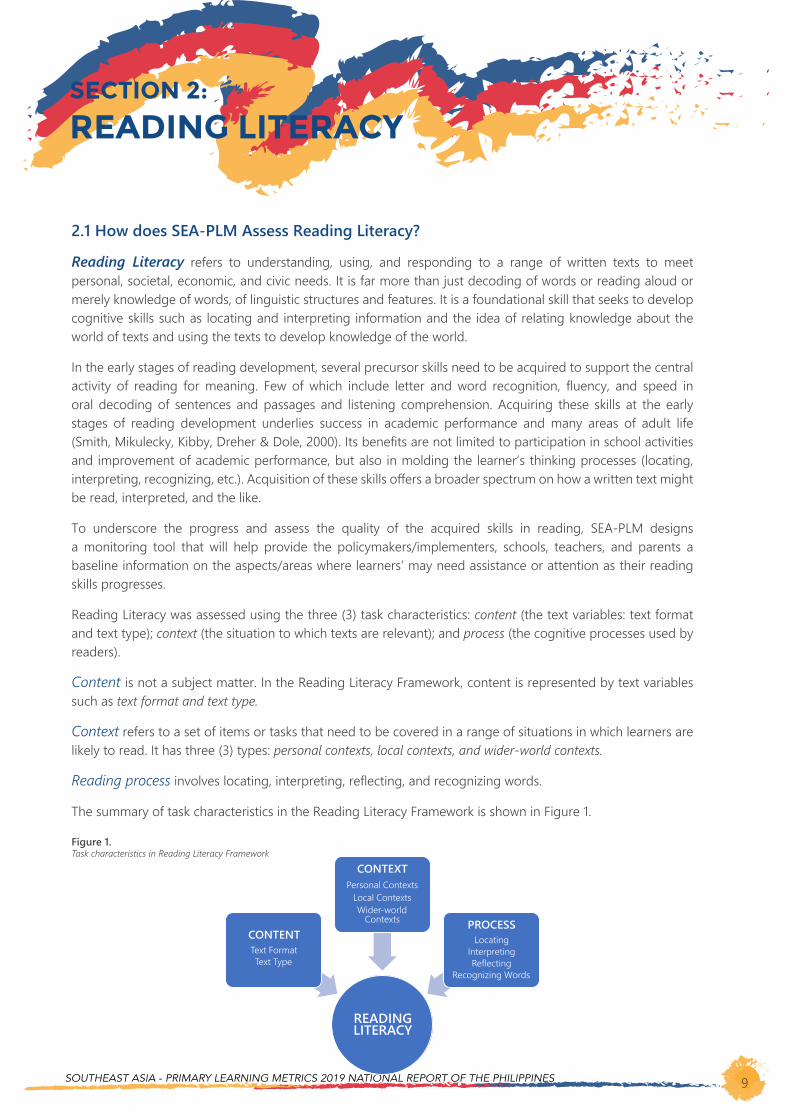
Reading Literacy was assessed using the three (3) task characteristics: content (the text variables: text format and text type); context (the situation to which texts are relevant); and process (the cognitive processes used by readers).
Content is not a subject matter. In the Reading Literacy Framework, content is represented by text variables such as text format and text type.
Context refers to a set of items or tasks that need to be covered in a range of situations in which learners are likely to read. It has three (3) types: personal contexts, local contexts, and wider-world contexts.
Reading process involves locating, interpreting, reflecting, and recognizing words.
The summary of task characteristics in the Reading Literacy Framework is shown in Figure 1.
Figure 1.Task characteristics in Reading Literacy Framework
9
READINGLITERACY
CONTENTText FormatText Type
CONTEXTPersonal Contexts
Local ContextsWider-world
Contexts PROCESSLocating
InterpretingReflecting
Recognizing Words
SECTION 2:
READING LITERACY
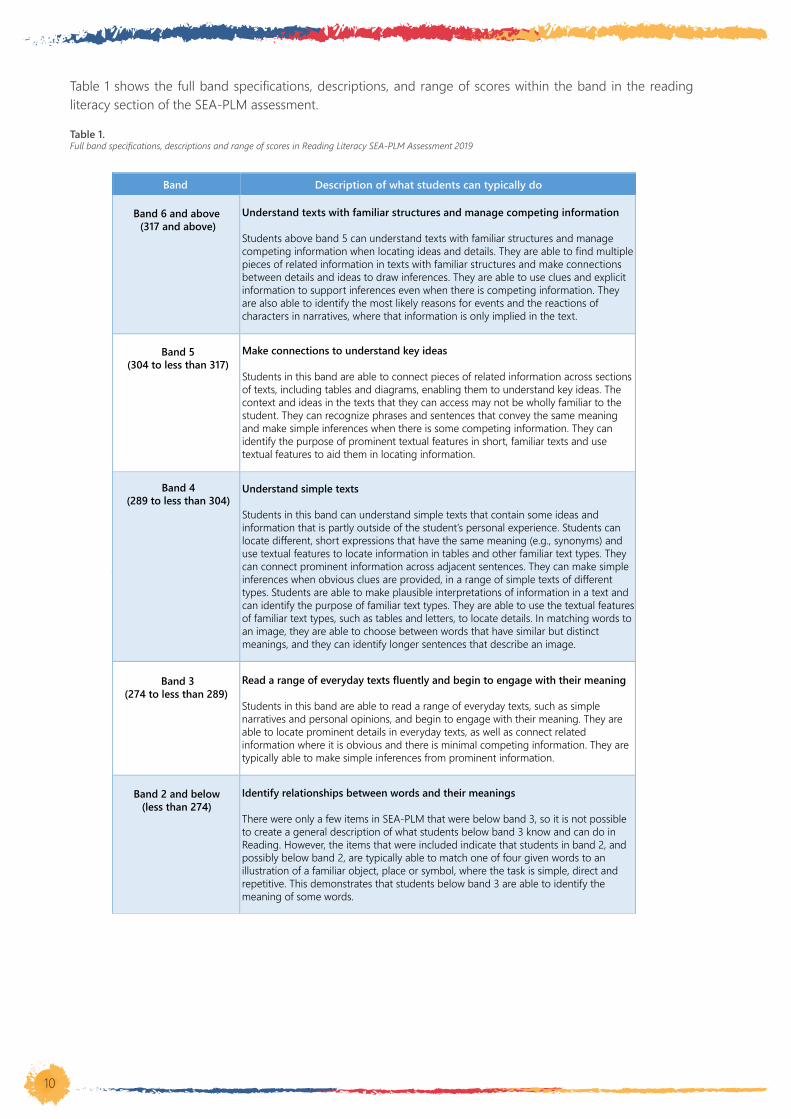
Table 1 shows the full band specifications, descriptions, and range of scores within the band in the reading literacy section of the SEA-PLM assessment.
Table 1.Full band specifications, descriptions and range of scores in Reading Literacy SEA-PLM Assessment 2019
10
Band Description of what students can typically do
Band 6 and above (317 and above)
Understand texts with familiar structures and manage competing information
Students above band 5 can understand texts with familiar structures and manage competing information when locating ideas and details. They are able to find multiple pieces of related information in texts with familiar structures and make connections between details and ideas to draw inferences. They are able to use clues and explicit information to support inferences even when there is competing information. They are also able to identify the most likely reasons for events and the reactions of characters in narratives, where that information is only implied in the text.
Band 5(304 to less than 317)
Band 3(274 to less than 289)
Read a range of everyday texts fluently and begin to engage with their meaning
Students in this band are able to read a range of everyday texts, such as simple narratives and personal opinions, and begin to engage with their meaning. They are able to locate prominent details in everyday texts, as well as connect related information where it is obvious and there is minimal competing information. They are typically able to make simple inferences from prominent information.
Band 2 and below(less than 274)
Identify relationships between words and their meanings
There were only a few items in SEA-PLM that were below band 3, so it is not possible to create a general description of what students below band 3 know and can do in Reading. However, the items that were included indicate that students in band 2, and possibly below band 2, are typically able to match one of four given words to an illustration of a familiar object, place or symbol, where the task is simple, direct and repetitive. This demonstrates that students below band 3 are able to identify the meaning of some words.
Band 4(289 to less than 304)
Understand simple texts
Students in this band can understand simple texts that contain some ideas and information that is partly outside of the student’s personal experience. Students can locate different, short expressions that have the same meaning (e.g., synonyms) and use textual features to locate information in tables and other familiar text types. They can connect prominent information across adjacent sentences. They can make simple inferences when obvious clues are provided, in a range of simple texts of different types. Students are able to make plausible interpretations of information in a text and can identify the purpose of familiar text types. They are able to use the textual features of familiar text types, such as tables and letters, to locate details. In matching words to an image, they are able to choose between words that have similar but distinct meanings, and they can identify longer sentences that describe an image.
Make connections to understand key ideas
Students in this band are able to connect pieces of related information across sections of texts, including tables and diagrams, enabling them to understand key ideas. The context and ideas in the texts that they can access may not be wholly familiar to the student. They can recognize phrases and sentences that convey the same meaning and make simple inferences when there is some competing information. They can identify the purpose of prominent textual features in short, familiar texts and use textual features to aid them in locating information.
SOUTHEAST ASIA - PRIMARY LEARNING METRICS 2019 NATIONAL REPORT OF THE PHILIPPINES 11
275
288
290
292
300
319
336
Lao PDR
Philippines
Cambodia
Myanmar
Average of six countries
Malaysia
Viet Nam
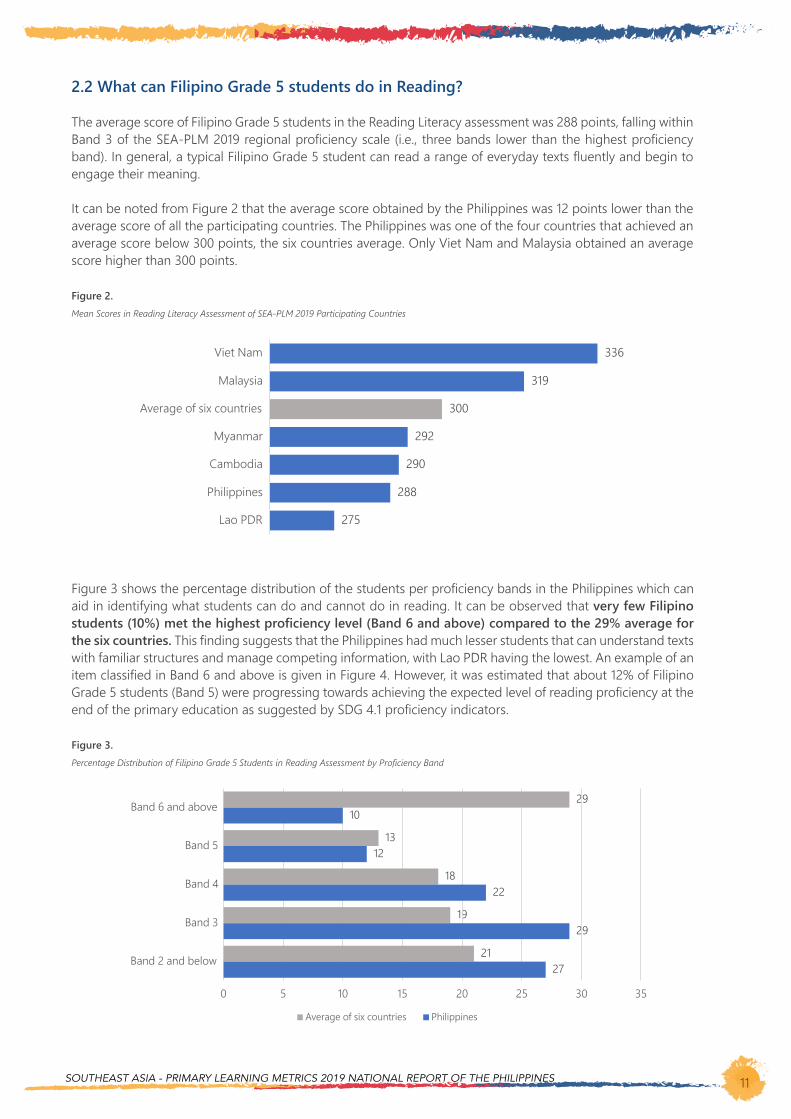
Figure 3 shows the percentage distribution of the students per proficiency bands in the Philippines which can aid in identifying what students can do and cannot do in reading. It can be observed that very few Filipino students (10%) met the highest proficiency level (Band 6 and above) compared to the 29% average for the six countries. This finding suggests that the Philippines had much lesser students that can understand texts with familiar structures and manage competing information, with Lao PDR having the lowest. An example of an item classified in Band 6 and above is given in Figure 4. However, it was estimated that about 12% of Filipino Grade 5 students (Band 5) were progressing towards achieving the expected level of reading proficiency at the end of the primary education as suggested by SDG 4.1 proficiency indicators.
Figure 3.Percentage Distribution of Filipino Grade 5 Students in Reading Assessment by Proficiency Band
Band 6 and above
PhilippinesAverage of six countries
Band 5
Band 4
Band 3
Band 2 and below
35302520151050
29
13
18
19
21
10
22
29
27
12
2.2 What can Filipino Grade 5 students do in Reading?
The average score of Filipino Grade 5 students in the Reading Literacy assessment was 288 points, falling within Band 3 of the SEA-PLM 2019 regional proficiency scale (i.e., three bands lower than the highest proficiency band). In general, a typical Filipino Grade 5 student can read a range of everyday texts fluently and begin to engage their meaning.
It can be noted from Figure 2 that the average score obtained by the Philippines was 12 points lower than the average score of all the participating countries. The Philippines was one of the four countries that achieved an average score below 300 points, the six countries average. Only Viet Nam and Malaysia obtained an average score higher than 300 points.
Figure 2.Mean Scores in Reading Literacy Assessment of SEA-PLM 2019 Participating Countries

It can be seen in Figure 3 that more Filipino Grade 5 students belonged to the lower proficiency bands (Bands 4,3,2) compared to the average of six countries. For example, the largest difference can be noted for Band 3. For an average participating country, only 19% of its students can read a range of everyday texts fluently and begin to engage with their meaning. On the other hand, almost 3 in 10 Filipino Grade 5 students possessed such reading literacy skills.
Additionally, about 27% of the Filipino Grade 5 students belonged to the lowest proficiency band. This means that about one-fourth of Filipino Grade 5 students can only identify relationships between words and their meanings in English, the language of the assessment, which is also the official language of instruction. An example of an item expected to be answered by a student belonging to the lowest proficiency band is given in Figure 5.
Figure 4.Example of reading item, Band 6 (minimum proficiency at end of primary level)
12
Source: SEA-PLM 2019 Regional Report
Figure 5.Example of reading item, Band 2 and below (below minimum proficiency at end of lower primary)
Source: SEA-PLM 2019 Regional Report
SOUTHEAST ASIA - PRIMARY LEARNING METRICS 2019 NATIONAL REPORT OF THE PHILIPPINES 13
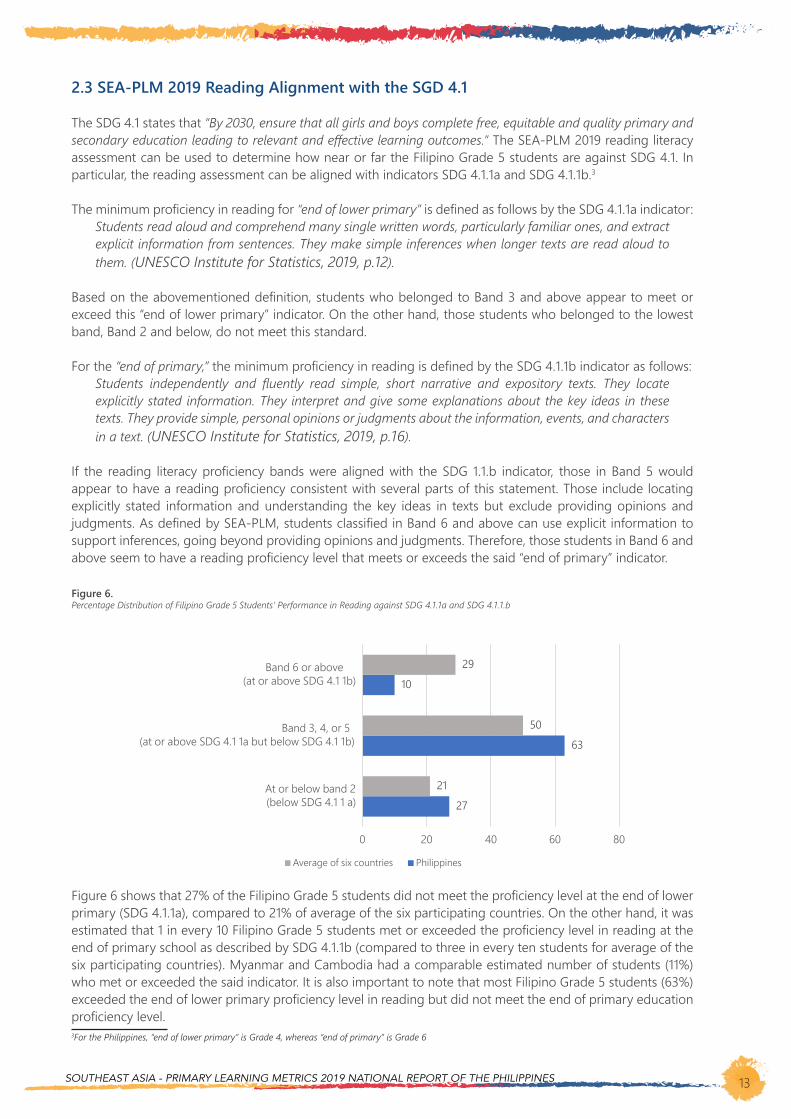
2.3 SEA-PLM 2019 Reading Alignment with the SGD 4.1
The SDG 4.1 states that “By 2030, ensure that all girls and boys complete free, equitable and quality primary and secondary education leading to relevant and effective learning outcomes.” The SEA-PLM 2019 reading literacy assessment can be used to determine how near or far the Filipino Grade 5 students are against SDG 4.1. In particular, the reading assessment can be aligned with indicators SDG 4.1.1a and SDG 4.1.1b.321
The minimum proficiency in reading for “end of lower primary” is defined as follows by the SDG 4.1.1a indicator:Students read aloud and comprehend many single written words, particularly familiar ones, and extract explicit information from sentences. They make simple inferences when longer texts are read aloud to them. (UNESCO Institute for Statistics, 2019, p.12).
Based on the abovementioned definition, students who belonged to Band 3 and above appear to meet or exceed this “end of lower primary” indicator. On the other hand, those students who belonged to the lowest band, Band 2 and below, do not meet this standard.
For the “end of primary,” the minimum proficiency in reading is defined by the SDG 4.1.1b indicator as follows:Students independently and fluently read simple, short narrative and expository texts. They locate explicitly stated information. They interpret and give some explanations about the key ideas in these texts. They provide simple, personal opinions or judgments about the information, events, and characters in a text. (UNESCO Institute for Statistics, 2019, p.16).
If the reading literacy proficiency bands were aligned with the SDG 1.1.b indicator, those in Band 5 would appear to have a reading proficiency consistent with several parts of this statement. Those include locating explicitly stated information and understanding the key ideas in texts but exclude providing opinions and judgments. As defined by SEA-PLM, students classified in Band 6 and above can use explicit information to support inferences, going beyond providing opinions and judgments. Therefore, those students in Band 6 and above seem to have a reading proficiency level that meets or exceeds the said “end of primary” indicator.
Figure 6.Percentage Distribution of Filipino Grade 5 Students’ Performance in Reading against SDG 4.1.1a and SDG 4.1.1.b
3For the Philippines, “end of lower primary” is Grade 4, whereas “end of primary” is Grade 6
27
63
10
21
50
29
0 20 40 60 80
At or below band 2(below SDG 4.1 1 a)
Band 3, 4, or 5 (at or above SDG 4.1 1a but below SDG 4.1 1b)
Band 6 or above(at or above SDG 4.1 1b)
Average of six countries Philippines
Figure 6 shows that 27% of the Filipino Grade 5 students did not meet the proficiency level at the end of lower primary (SDG 4.1.1a), compared to 21% of average of the six participating countries. On the other hand, it was estimated that 1 in every 10 Filipino Grade 5 students met or exceeded the proficiency level in reading at the end of primary school as described by SDG 4.1.1b (compared to three in every ten students for average of the six participating countries). Myanmar and Cambodia had a comparable estimated number of students (11%) who met or exceeded the said indicator. It is also important to note that most Filipino Grade 5 students (63%) exceeded the end of lower primary proficiency level in reading but did not meet the end of primary education proficiency level.
SOUTHEAST ASIA - PRIMARY LEARNING METRICS 2019 NATIONAL REPORT OF THE PHILIPPINES 15
SECTION 3:
WRITING LITERACY
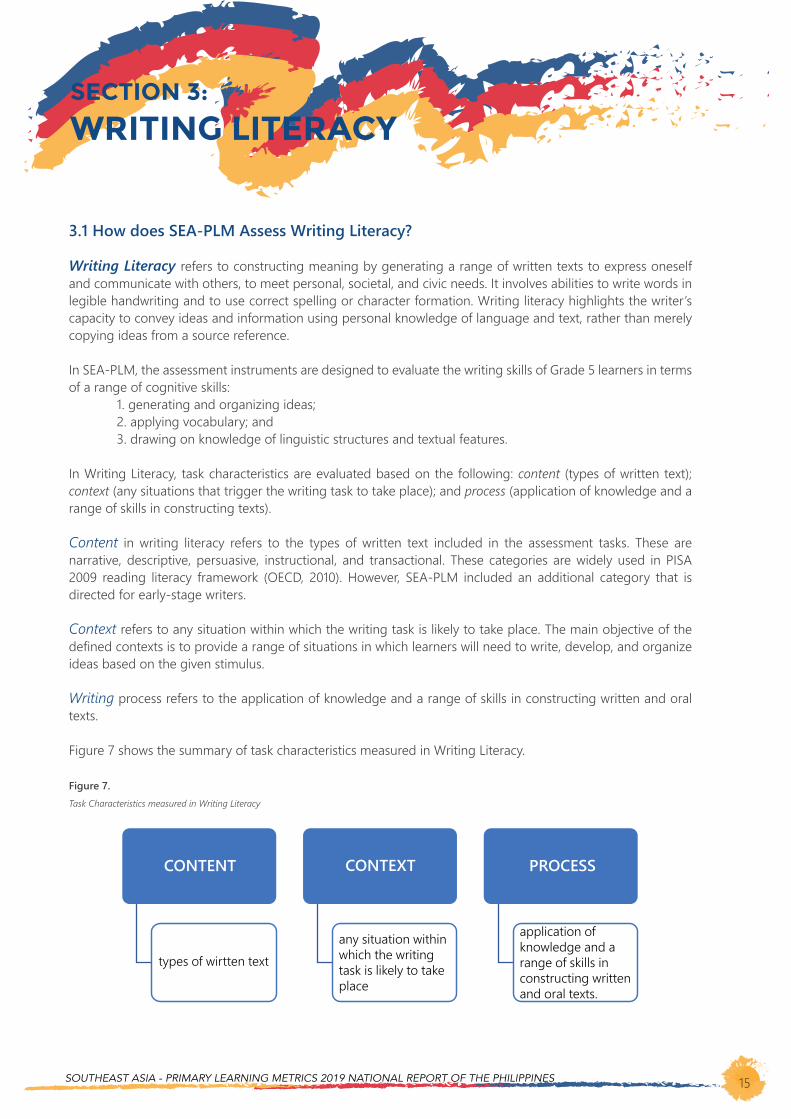
3.1 How does SEA-PLM Assess Writing Literacy?
Writing Literacy refers to constructing meaning by generating a range of written texts to express oneself and communicate with others, to meet personal, societal, and civic needs. It involves abilities to write words in legible handwriting and to use correct spelling or character formation. Writing literacy highlights the writer’s capacity to convey ideas and information using personal knowledge of language and text, rather than merely copying ideas from a source reference.
In SEA-PLM, the assessment instruments are designed to evaluate the writing skills of Grade 5 learners in terms of a range of cognitive skills: 1. generating and organizing ideas; 2. applying vocabulary; and 3. drawing on knowledge of linguistic structures and textual features.
In Writing Literacy, task characteristics are evaluated based on the following: content (types of written text); context (any situations that trigger the writing task to take place); and process (application of knowledge and a range of skills in constructing texts).
Content in writing literacy refers to the types of written text included in the assessment tasks. These are narrative, descriptive, persuasive, instructional, and transactional. These categories are widely used in PISA 2009 reading literacy framework (OECD, 2010). However, SEA-PLM included an additional category that is directed for early-stage writers.
Context refers to any situation within which the writing task is likely to take place. The main objective of the defined contexts is to provide a range of situations in which learners will need to write, develop, and organize ideas based on the given stimulus.
Writing process refers to the application of knowledge and a range of skills in constructing written and oral texts.
Figure 7 shows the summary of task characteristics measured in Writing Literacy.
Figure 7.Task Characteristics measured in Writing Literacy
CONTENT
types of wirtten textany situation within which the writing task is likely to take place
application of knowledge and a range of skills in constructing written and oral texts.
CONTEXT PROCESS

16
Table 2 shows the full band specifications, descriptions, and mean scores within the band in the writing literacy section of the SEA-PLM 2019 assessment.
Table 2.Full band specifications, descriptions and mean scores in Writing Literacy SEA-PLM Assessment 2019
Band 7(338 to less than 346)
Write clear, detailed texts in various contexts with adequate vocabulary
Students in this band can produce texts that relate to wider world, local and personal contexts, expressing ideas that go beyond mere description to include some persuasive or evaluative aspects. Ideas are well related and easy to follow, using sentences that are varied in structure and often correctly formed. Students can produce some complex sentences, but these may contain errors. When writing about a personal context, for example about a favorite activity, they can use vocabulary that goes beyond the basic, to produce some interesting descriptive
Band 6(327 to less than 338)
Write simple texts for a range of purposes with above basic vocabulary
Students in this band can produce texts that relate to local and personal contexts, presenting simple writing with some supporting details. Students in this band produce sequenced writing, which a reader can follow easily, but they are still learning to use linguistic devices to create cohesion within their texts. At this level student vocabulary is basic and beyond; it may be adequate to convey the detail of a message, for example, in a short, formal, note.
Band 8(346 and above)
Write cohesive texts with detailed ideas and a good range of appropriate vocabulary
Students in this band can produce texts that draw on a wider world context, with relevant, detailed and sometimes imaginative ideas. They can write texts with an introduction, body and conclusion in which ideas are well related and easy to follow. For example, they can provide a clear overall description of a detailed image. These students can write using a polite, formal style, and a good range of appropriate vocabulary, with a degree of sophistication.
Band Description of what students can typically do
Band 5(316 to less than 327)
Write non-cohesive basic texts for a range of purposes, using simple vocabulary
Students in this band can write texts such as notes, descriptions, and narratives, in a range of contexts, with well controlled handwriting. They can communicate ideas in simple writing, obviously related to the task, with some attempt at detail. Their ideas are generally expressed in a logical sequence that is relatively easy to follow but may not be adequately linked with connecting words or may lack an introduction or conclusion. A description of a detailed image, for example, may describe a range of elements in the picture with some detail, but not comprise an integrated whole. Sentence forms are generally simple and may be repetitive or may be more complex but contain errors, although students can form correct question forms and punctuation is usually correct. Students in this band can use vocabulary that is sufficient to convey a range of concepts but lacks precision or clarity.
Band 4(306 to less than 316)
Produce limited writing, conveying simple ideas with basic vocabulary
Students in this band can produce limited writing related to the task, presenting simple ideas, but lacking elaboration or detail. In a task such as writing basic instructions, they can present a process clearly, using three or four well-formed but simple sentences, and use the correct form of imperative language for instructions. Basic vocabulary may limit the student’s ability to convey detail at this level.
SOUTHEAST ASIA - PRIMARY LEARNING METRICS 2019 NATIONAL REPORT OF THE PHILIPPINES 17
Band 1 and below(less than 287)
Limited ability to present ideas in writing
Students in this band may be able to produce a few sentences with very limited content. When trying to describe a picture, for example, they may focus on only a few isolated features or produce extremely general ideas. They can produce some imperative language, but it is inconsistent. The limited range of vocabulary accessed by students in this band would be inadequate to describe a picture. Words used are likely to be basic and repetitive.
Band 3(296 to less than 306)
Produce very limited writing, with simple, insufficient ideas and limited vocabulary
Students in this band can produce limited writing relating to personal or local contexts. Ideas may be very simple, irrelevant, or incomplete. They may be disjointed so that the text is difficult to follow. In writing a simple story, for example, there may be some sense of sequence, but it is not consistent or always clear. Students at this level display some competence in using a polite style and can form questions. These students can produce simple or repetitive sentences that use repetition of pronouns or nouns to link ideas. Their handwriting is legible, with most letters (or characters) well-formed. Basic vocabulary at this level is inadequate to convey a good description or may be repetitive. These students can produce simple or repetitive sentences that use repetition of pronouns or nouns to link ideas. Basic vocabulary at this level is inadequate to convey a good description or may be repetitive.
Band Description of what students can typically do
Band 2(287 to less than 296)
Produce very limited writing, with fragmented ideas and inadequate vocabulary
Students in this band can write in a limited way. Ideas can be unclear, irrelevant, limited or consist of fragments only. These students may be able to write one simple correct sentence, or produce incomplete sentences or sentences containing many errors and inconsistent punctuation. Sentence structure is likely to be repetitive. At this level student vocabulary is basic and inadequate to convey a clear message or is very repetitive.
18
283
285
288
298
300
318
327
Lao PDR
Cambodia
Philippines
Myanmar
Average of six countries
Malaysia
Viet Nam
Figure 9.Percentage Distribution of Filipino Grade 5 Students in Writing Literacy Assessment by Proficiency Band
3.2 What can Filipino Grade 5 students do in Writing?
The average score of Grade 5 Filipino students for the writing literacy assessment was 288 points, belonging to Band 2 of the SEA-PLM 2019 regional proficiency scale (i.e., one proficiency band above the lowest band). Generally, a typical Filipino Grade 5 student can produce very limited writing with fragmented ideas and inadequate vocabulary.
Figure 8 shows that the mean score obtained by the Philippines was 12 points lower than the average score of all the participating countries. Together with the Philippines below the regional average were Myanmar, Cambodia, and Lao PDR. On the other hand, Viet Nam and Malaysia performed better than an average country in SEA-PLM 2019.
Figure 8.Mean Scores in the Writing Literacy Assessment of SEA-PLM 2019 Participating Countries
46
12
15
12
9
4
1
1
30
10
14
14
14
9
4
5
0 5 10 15 20 25 30 35 40 45 50
Band 1 and below
Band 2
Band 3
Band 4
Band 5
Band 6
Band 7
Band 8 and above
Average of six countries Philippines
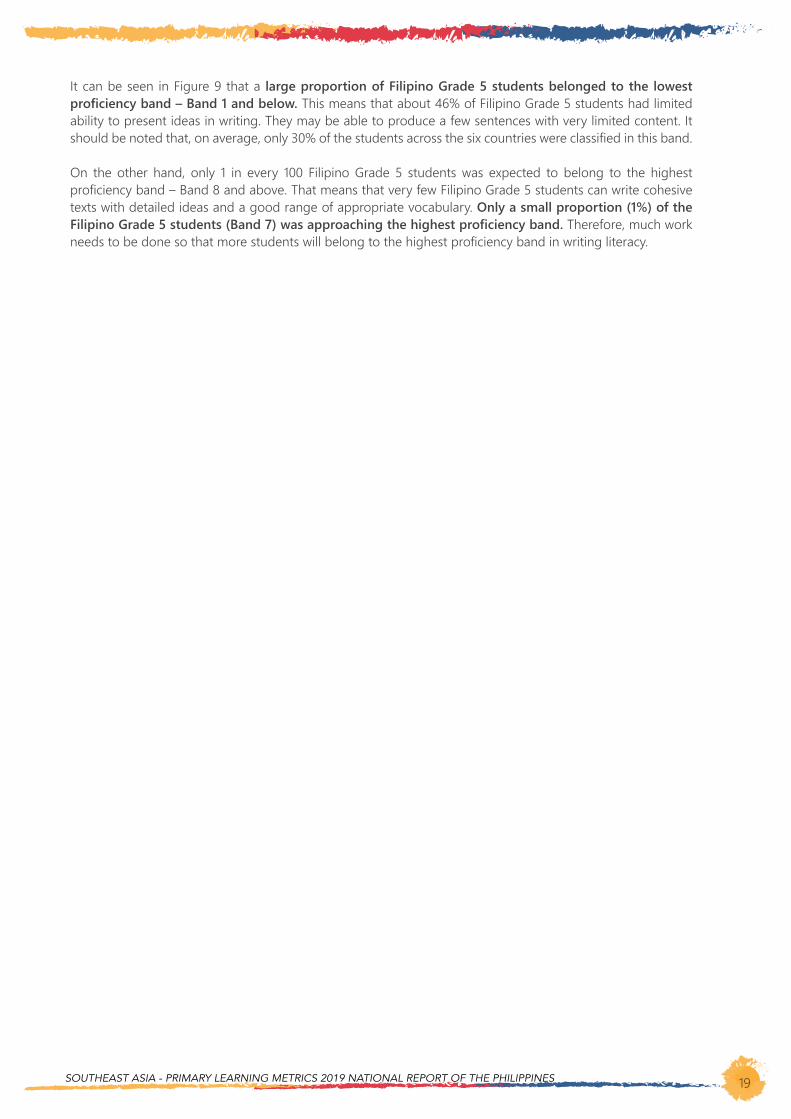
SOUTHEAST ASIA - PRIMARY LEARNING METRICS 2019 NATIONAL REPORT OF THE PHILIPPINES 19
It can be seen in Figure 9 that a large proportion of Filipino Grade 5 students belonged to the lowest proficiency band – Band 1 and below. This means that about 46% of Filipino Grade 5 students had limited ability to present ideas in writing. They may be able to produce a few sentences with very limited content. It should be noted that, on average, only 30% of the students across the six countries were classified in this band.
On the other hand, only 1 in every 100 Filipino Grade 5 students was expected to belong to the highest proficiency band – Band 8 and above. That means that very few Filipino Grade 5 students can write cohesive texts with detailed ideas and a good range of appropriate vocabulary. Only a small proportion (1%) of the Filipino Grade 5 students (Band 7) was approaching the highest proficiency band. Therefore, much work needs to be done so that more students will belong to the highest proficiency band in writing literacy.

SOUTHEAST ASIA - PRIMARY LEARNING METRICS 2019 NATIONAL REPORT OF THE PHILIPPINES 21
4.1 How does SEA-PLM Assess Mathematical Literacy?
Mathematical Literacy is far more than just performing the basic mathematical operations. To understand mathematics, learners need to acquire basic skills from reading and writing domains. Basic communication skills will enable them to recognize and process the information being asked in a mathematical problem and express their reasoning and conclusions. Learning and acquiring the basics in reading, writing, and arithmetic (3R’s) will help them appreciate mathematics and learn to forget the old myth about mathematics as a difficult subject.
In SEA-PLM, Mathematical Literacy refers to a learner’s capacity to use mathematical knowledge and skills in solving problems and in dealing with different kinds of challenges they may encounter in a variety of contexts where mathematics may be relevant to those problems and challenges. Specifically, mathematical literacy refers to:
• use of mathematical knowledge and skills (including those learned in the mathematics classroom) in solving problems that arise in contexts beyond the classroom;
• use mathematical skills and competencies as tools in devising strategies to solve problems;• recognize and appreciate the role of mathematics in the world of actions they need to practice
making sense of their world;• take action needed to solve the given problem, which involves reformulating mathematical language
in a form that can lead to a mathematical solution;• transform the different representations of mathematical objects and information into graphs, tables,
charts, diagrams, symbolic expression; and• interpret mathematical results in relation to the context and to review the merits or limitations of those
results.
To assess the learners’ mathematical skills, the components of the Mathematical Literacy Framework listed below are included:
• Content. This refers to mathematical knowledge and skills acquired to find a mathematical solution;• Process. This refers to the actions required to solve the problem; and• Context. This refers to the situation in which the problem to be solved has arisen.
Content refers to the specific mathematical knowledge and skills in finding the solution to a problem. In SEA-PLM assessment, this includes the following: chance and data, number and algebra, and measurement and geometry.
The Mathematical Literacy Process is composed of four (4) stages: translate, apply, interpret, and review. Translate, in mathematical process, involves the expression of the problem in mathematical language or mathematical formulation to find a suitable solution. Apply, on the other hand, in mathematical process, involves the use of mathematical knowledge and skills in finding a mathematical solution and/or in generating mathematical results. This process focuses mainly on mathematical ideas, objects, and techniques, while interpret, includes retranslating the mathematical solution to the context of the problem. Review may also be included in this process. This is to see whether the findings/results are reasonable and make sense in the context and to identify any possible limitations for the solution.
The mathematical literacy process is summarized in Figure 10.
SECTION 4:
MATHEMATICAL LITERACY
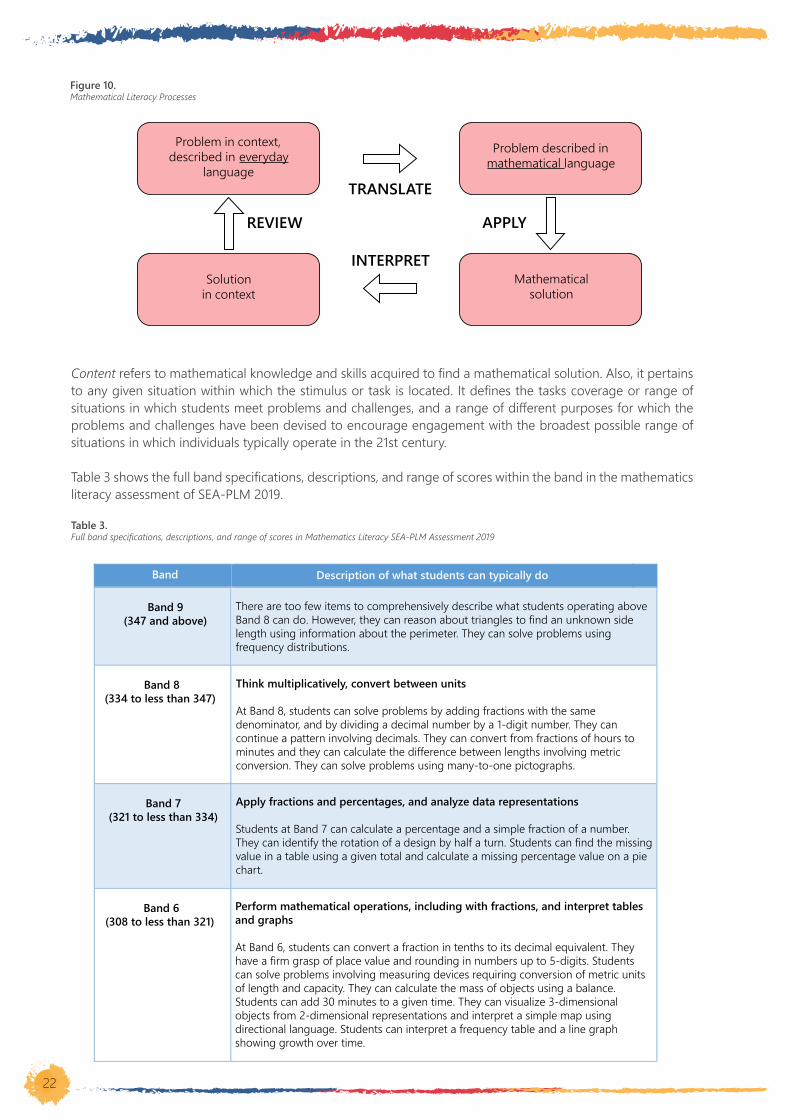
22
Figure 10.Mathematical Literacy Processes
Problem in context,described in everyday
language
Problem described in mathematical language
Solution in context
Mathematicalsolution
TRANSLATE
REVIEW
INTERPRET
APPLY
Content refers to mathematical knowledge and skills acquired to find a mathematical solution. Also, it pertains to any given situation within which the stimulus or task is located. It defines the tasks coverage or range of situations in which students meet problems and challenges, and a range of different purposes for which the problems and challenges have been devised to encourage engagement with the broadest possible range of situations in which individuals typically operate in the 21st century.
Table 3 shows the full band specifications, descriptions, and range of scores within the band in the mathematics literacy assessment of SEA-PLM 2019.
Table 3.Full band specifications, descriptions, and range of scores in Mathematics Literacy SEA-PLM Assessment 2019
Band 8(334 to less than 347)
Think multiplicatively, convert between units
At Band 8, students can solve problems by adding fractions with the same denominator, and by dividing a decimal number by a 1-digit number. They can continue a pattern involving decimals. They can convert from fractions of hours to minutes and they can calculate the difference between lengths involving metric conversion. They can solve problems using many-to-one pictographs.
Band 7(321 to less than 334)
Apply fractions and percentages, and analyze data representations
Students at Band 7 can calculate a percentage and a simple fraction of a number. They can identify the rotation of a design by half a turn. Students can find the missing value in a table using a given total and calculate a missing percentage value on a pie chart.
Band 9(347 and above)
There are too few items to comprehensively describe what students operating above Band 8 can do. However, they can reason about triangles to find an unknown side length using information about the perimeter. They can solve problems using frequency distributions.
Band Description of what students can typically do
Band 6(308 to less than 321)
Perform mathematical operations, including with fractions, and interpret tables and graphs
At Band 6, students can convert a fraction in tenths to its decimal equivalent. They have a firm grasp of place value and rounding in numbers up to 5-digits. Students can solve problems involving measuring devices requiring conversion of metric units of length and capacity. They can calculate the mass of objects using a balance. Students can add 30 minutes to a given time. They can visualize 3-dimensional objects from 2-dimensional representations and interpret a simple map using directional language. Students can interpret a frequency table and a line graph showing growth over time.

SOUTHEAST ASIA - PRIMARY LEARNING METRICS 2019 NATIONAL REPORT OF THE PHILIPPINES 23
Band 4(282 to less than 295)
Apply number properties and units of measurement
At Band 4, students can find half of a 1-digit even number and understand place value in 5-digit numbers. They can solve a problem involving capacity that does not involve conversion of units. They can apply their knowledge of the number of minutes in an hour. Students can read a value from a bar graph.
Band 3(269 to less than 282)
Understand place value and scales of measurement
Students at Band 3 can order 2-digit numbers. They can read length and mass measurements from scales requiring some interpolation. Students can recognize simple shapes and compare angles. They can interpret a simple bar graph.
Band 2 and below(less than 269)
There are too few items to describe what students operating below Band 3 can do. Some students might be able to add single digit numbers together, others might only be able to count a small collection of objects or recognize numbers.
Band 5(295 to less than 308)
Fluently solve arithmetic problems
Students at Band 5 can add 4-digit numbers and subtract 2-digit numbers in context, and they can identify a 5-digit number given in words. Students can continue simple counting and shape patterns. They can model scenarios with multiplication and division. They understand the process of taking half of a quantity. They can interpolate capacity from a marked cylinder and can compare angles to a right angle. They can estimate the mass of an object. Students can read numbers from a table and sum them. They understand the structure of a bar graph showing amounts over time.to find an unknown side length using information about the perimeter. They can solve problems using frequency distributions.
Band Description of what students can typically do
4.2 What can Filipino Grade 5 Students do in Mathematics?
The mean score of Filipino Grade 5 students in the mathematics assessment was 288 points, falling within Band 4 of the SEA-PLM 2019 regional proficiency scale (i.e., five proficiency bands below the highest band). In general, a typical Filipino Grade 5 student can apply number properties and units of measurement in English.
Figure 11 shows that the Philippines’ mean score fell 12 points below the average mean score of the participating countries. Like the Philippines, Cambodia, Myanmar, and Lao PDR also achieved mean scores in mathematics literacy below the average mean score. On the other hand, Viet Nam and Malaysia performed above average in mathematics literacy.
Figure 11.Mean Scores in Mathematics Literacy Assessment of SEA-PLM 2019 Participating Countries
279
288
288
289
300
315
341
Lao PDR
Myanmar
Philippines
Cambodia
Average of six countries
Malaysia
Viet Nam
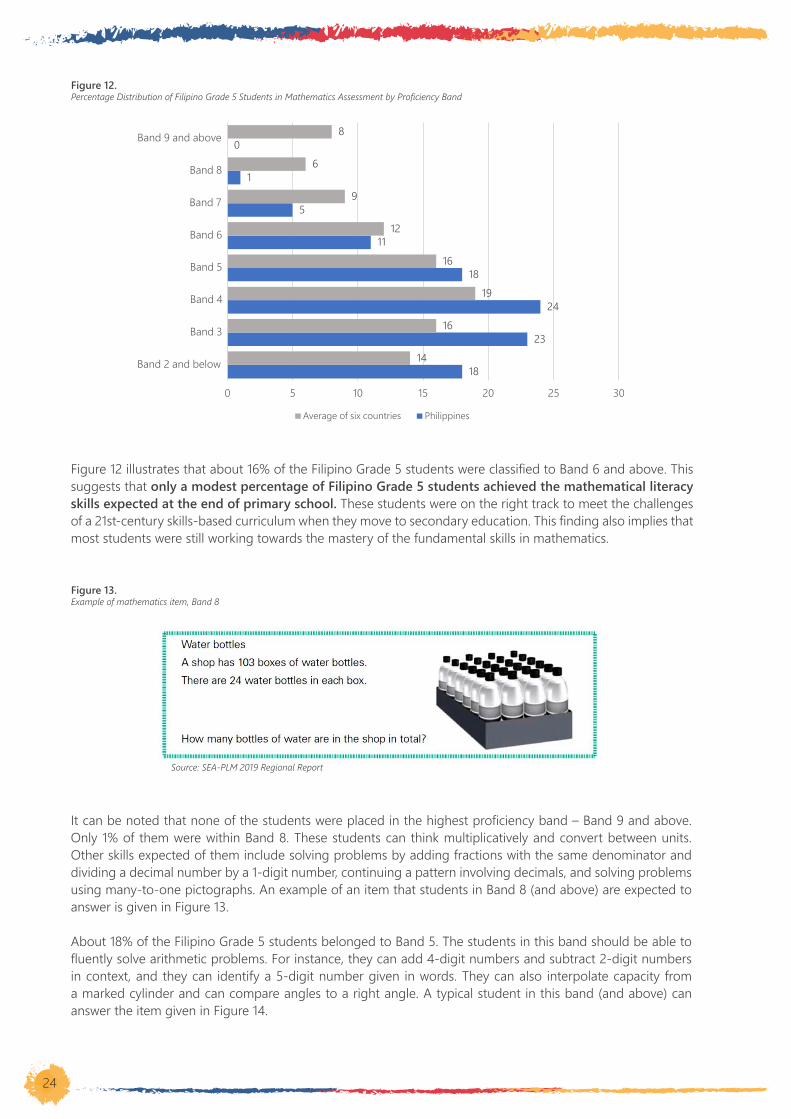
24
Figure 12.Percentage Distribution of Filipino Grade 5 Students in Mathematics Assessment by Proficiency Band
Figure 12 illustrates that about 16% of the Filipino Grade 5 students were classified to Band 6 and above. This suggests that only a modest percentage of Filipino Grade 5 students achieved the mathematical literacy skills expected at the end of primary school. These students were on the right track to meet the challenges of a 21st-century skills-based curriculum when they move to secondary education. This finding also implies that most students were still working towards the mastery of the fundamental skills in mathematics.
18
23
24
18
11
5
1
0
14
16
19
16
12
9
6
8
0 5 10 15 20 25 30
Band 2 and below
Band 3
Band 4
Band 5
Band 6
Band 7
Band 8
Band 9 and above
Average of six countries Philippines
Figure 13.Example of mathematics item, Band 8
Source: SEA-PLM 2019 Regional Report
It can be noted that none of the students were placed in the highest proficiency band – Band 9 and above. Only 1% of them were within Band 8. These students can think multiplicatively and convert between units. Other skills expected of them include solving problems by adding fractions with the same denominator and dividing a decimal number by a 1-digit number, continuing a pattern involving decimals, and solving problems using many-to-one pictographs. An example of an item that students in Band 8 (and above) are expected to answer is given in Figure 13.
About 18% of the Filipino Grade 5 students belonged to Band 5. The students in this band should be able to fluently solve arithmetic problems. For instance, they can add 4-digit numbers and subtract 2-digit numbers in context, and they can identify a 5-digit number given in words. They can also interpolate capacity from a marked cylinder and can compare angles to a right angle. A typical student in this band (and above) can answer the item given in Figure 14.

SOUTHEAST ASIA - PRIMARY LEARNING METRICS 2019 NATIONAL REPORT OF THE PHILIPPINES 25
Figure 14.Example of mathematics item, Band 5
Source: SEA-PLM 2019 Regional Report
Most Filipino Grade 5 students (24%) belonged to Band 4, followed by 23% in Band 3. The students in Band 4 can apply number properties and units of measurement, whereas those in Band 3 can understand place value and scales of measurement. An item that can be answered by a student placed in Band 3 (and above) is presented in Figure 15. Note that 18% or about 2 in 5 Filipino Grade 5 (Band 2 and below) students were unlikely to correctly answer this item.
Figure 15.Example of mathematics item, Band 3
Source: SEA-PLM 2019 Regional Report
It can be observed that the average for six countries shows higher proportions of students belonging to higher proficiency bands (i.e., Band 6 and above) than the Philippines. On the contrary, the Philippines had higher proportions of students categorized to lower proficiency bands (i.e., Band 5 and below). Therefore, these students’ skills must be further enhanced so that they will be able to achieve higher proficiency levels in mathematics literacy.
4.3 SEA-PLM 2019 Mathematics Alignment with the SDGs
SDG 4.1 states that “By 2030, ensure that all girls and boys complete free, equitable and quality primary and secondary education leading to relevant and effective learning outcomes.” The SEA-PLM 2019 mathematics literacy assessment can be used to determine how near or far the Filipino Grade 5 students are against the SDG 4.1. Specifically, the mathematics assessment can be aligned with indicators SDG 4.1.1a and SDG 4.1.1b.
The minimum proficiency in mathematics for “end of lower primary” is defined as follows by the SDG 4.1.1a indicator:
Students can read, write, and compare whole numbers up to 100. They can add and subtract numbers within twenty and solve application problems involving numbers within twenty. Students can recognize simple shapes and their elements. They can read simple data displays. They possess foundational knowledge of spatial orientation and can appraise the relative size of real-world objects. (UNESCO Institute for Statistics, 2019, p.25).
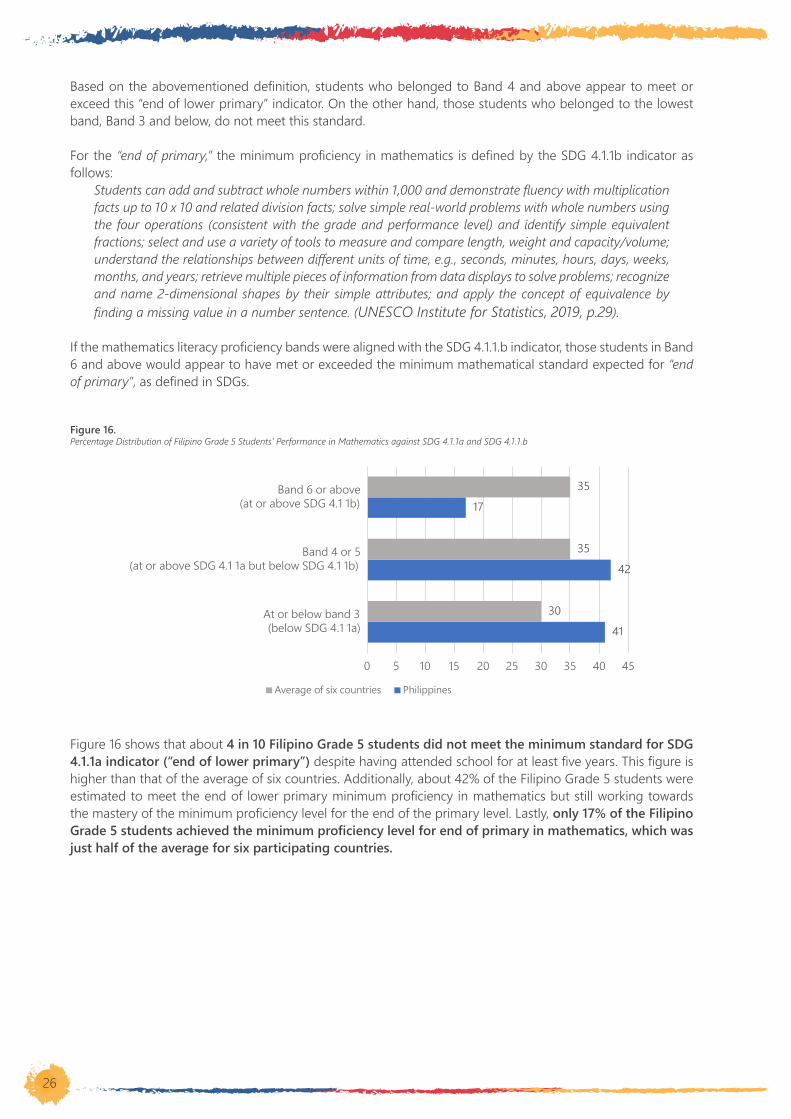
26
Based on the abovementioned definition, students who belonged to Band 4 and above appear to meet or exceed this “end of lower primary” indicator. On the other hand, those students who belonged to the lowest band, Band 3 and below, do not meet this standard.
For the “end of primary,” the minimum proficiency in mathematics is defined by the SDG 4.1.1b indicator as follows:
Students can add and subtract whole numbers within 1,000 and demonstrate fluency with multiplication facts up to 10 x 10 and related division facts; solve simple real-world problems with whole numbers using the four operations (consistent with the grade and performance level) and identify simple equivalent fractions; select and use a variety of tools to measure and compare length, weight and capacity/volume; understand the relationships between different units of time, e.g., seconds, minutes, hours, days, weeks, months, and years; retrieve multiple pieces of information from data displays to solve problems; recognize and name 2-dimensional shapes by their simple attributes; and apply the concept of equivalence by finding a missing value in a number sentence. (UNESCO Institute for Statistics, 2019, p.29).
If the mathematics literacy proficiency bands were aligned with the SDG 4.1.1.b indicator, those students in Band 6 and above would appear to have met or exceeded the minimum mathematical standard expected for “end of primary”, as defined in SDGs.
Figure 16.Percentage Distribution of Filipino Grade 5 Students’ Performance in Mathematics against SDG 4.1.1a and SDG 4.1.1.b
41
42
17
30
35
35
0 5 10 15 20 25 30 35 40 45
At or below band 3(below SDG 4.1 1a)
Band 4 or 5(at or above SDG 4.1 1a but below SDG 4.1 1b)
Band 6 or above(at or above SDG 4.1 1b)
Average of six countries Philippines
Figure 16 shows that about 4 in 10 Filipino Grade 5 students did not meet the minimum standard for SDG 4.1.1a indicator (“end of lower primary”) despite having attended school for at least five years. This figure is higher than that of the average of six countries. Additionally, about 42% of the Filipino Grade 5 students were estimated to meet the end of lower primary minimum proficiency in mathematics but still working towards the mastery of the minimum proficiency level for the end of the primary level. Lastly, only 17% of the Filipino Grade 5 students achieved the minimum proficiency level for end of primary in mathematics, which was just half of the average for six participating countries.
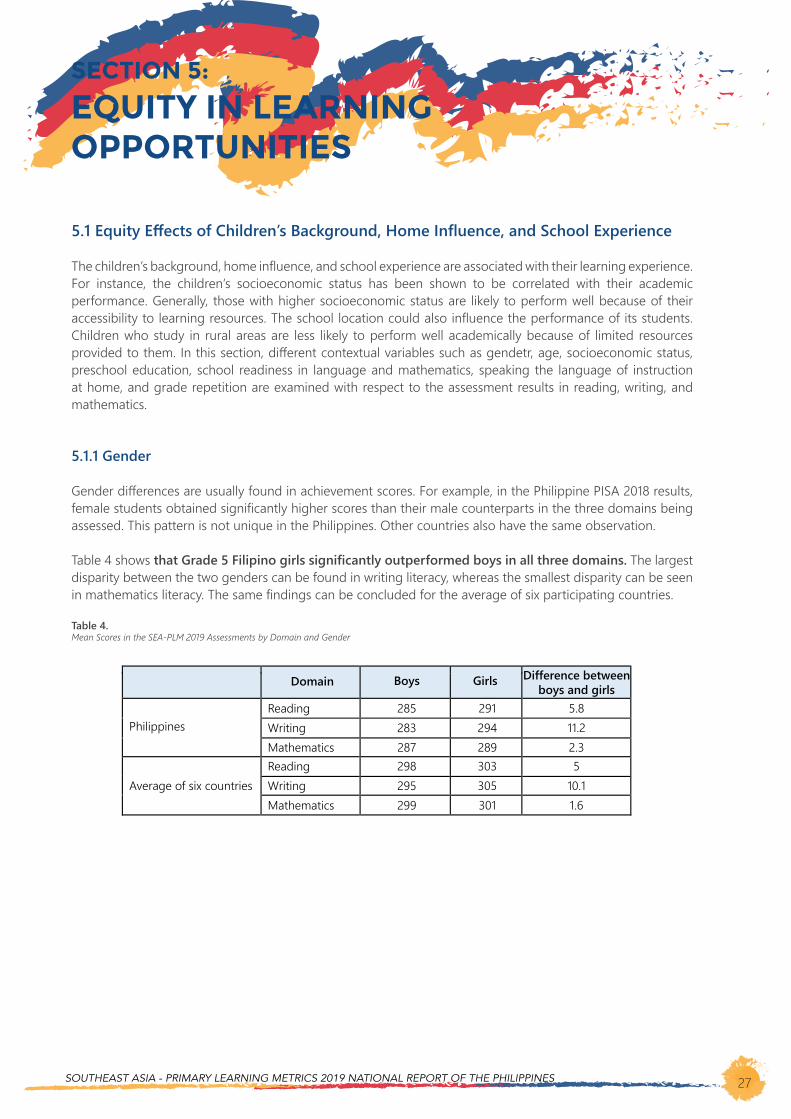
SOUTHEAST ASIA - PRIMARY LEARNING METRICS 2019 NATIONAL REPORT OF THE PHILIPPINES 27
5.1 Equity Effects of Children’s Background, Home Influence, and School Experience
The children’s background, home influence, and school experience are associated with their learning experience. For instance, the children’s socioeconomic status has been shown to be correlated with their academic performance. Generally, those with higher socioeconomic status are likely to perform well because of their accessibility to learning resources. The school location could also influence the performance of its students. Children who study in rural areas are less likely to perform well academically because of limited resources provided to them. In this section, different contextual variables such as gendetr, age, socioeconomic status, preschool education, school readiness in language and mathematics, speaking the language of instruction at home, and grade repetition are examined with respect to the assessment results in reading, writing, and mathematics.
5.1.1 Gender
Gender differences are usually found in achievement scores. For example, in the Philippine PISA 2018 results, female students obtained significantly higher scores than their male counterparts in the three domains being assessed. This pattern is not unique in the Philippines. Other countries also have the same observation.
Table 4 shows that Grade 5 Filipino girls significantly outperformed boys in all three domains. The largest disparity between the two genders can be found in writing literacy, whereas the smallest disparity can be seen in mathematics literacy. The same findings can be concluded for the average of six participating countries.
Table 4.Mean Scores in the SEA-PLM 2019 Assessments by Domain and Gender
Domain
PhilippinesReadingWritingMathematicsReadingWritingMathematics
285283287298295299
291294289303305301
5.811.22.35
10.11.6
Average of six countries
Girls Difference betweenboys and girls
Boys
SECTION 5:
EQUITY IN LEARNING OPPORTUNITIES
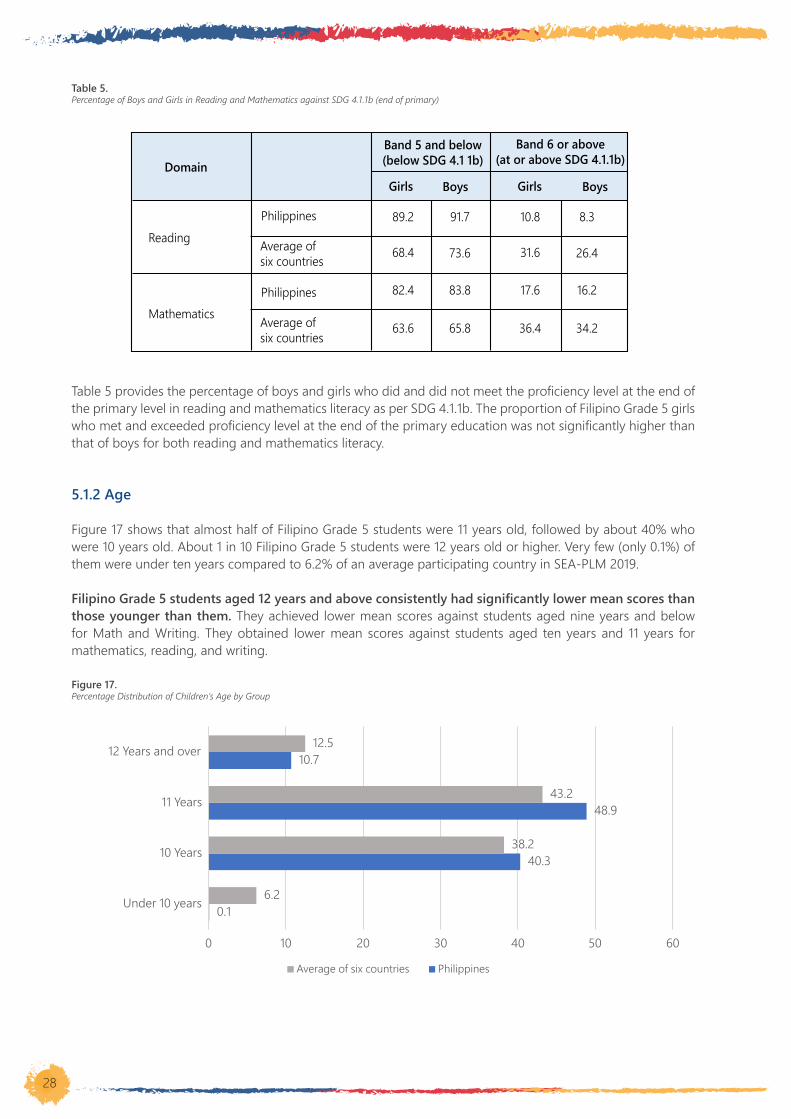
28
PhilippinesReading
Mathematics
89.2
68.4
82.4
63.6
91.7
73.6
83.8
65.8
10.8
31.6
17.6
36.4
8.3
26.4
16.2
34.2
Average of six countries
Philippines
Average of six countries
DomainGirls
Band 5 and below(below SDG 4.1 1b)
Band 6 or above(at or above SDG 4.1.1b)
Boys Girls Boys
Table 5.Percentage of Boys and Girls in Reading and Mathematics against SDG 4.1.1b (end of primary)
Table 5 provides the percentage of boys and girls who did and did not meet the proficiency level at the end of the primary level in reading and mathematics literacy as per SDG 4.1.1b. The proportion of Filipino Grade 5 girls who met and exceeded proficiency level at the end of the primary education was not significantly higher than that of boys for both reading and mathematics literacy.
5.1.2 Age
Figure 17 shows that almost half of Filipino Grade 5 students were 11 years old, followed by about 40% who were 10 years old. About 1 in 10 Filipino Grade 5 students were 12 years old or higher. Very few (only 0.1%) of them were under ten years compared to 6.2% of an average participating country in SEA-PLM 2019.
Filipino Grade 5 students aged 12 years and above consistently had significantly lower mean scores than those younger than them. They achieved lower mean scores against students aged nine years and below for Math and Writing. They obtained lower mean scores against students aged ten years and 11 years for mathematics, reading, and writing.
Figure 17.Percentage Distribution of Children’s Age by Group
0.1
40.3
48.9
10.7
6.2
38.2
43.2
12.5
0 10 20 30 40 50 60
Under 10 years
10 Years
11 Years
12 Years and over
Average of six countries Philippines
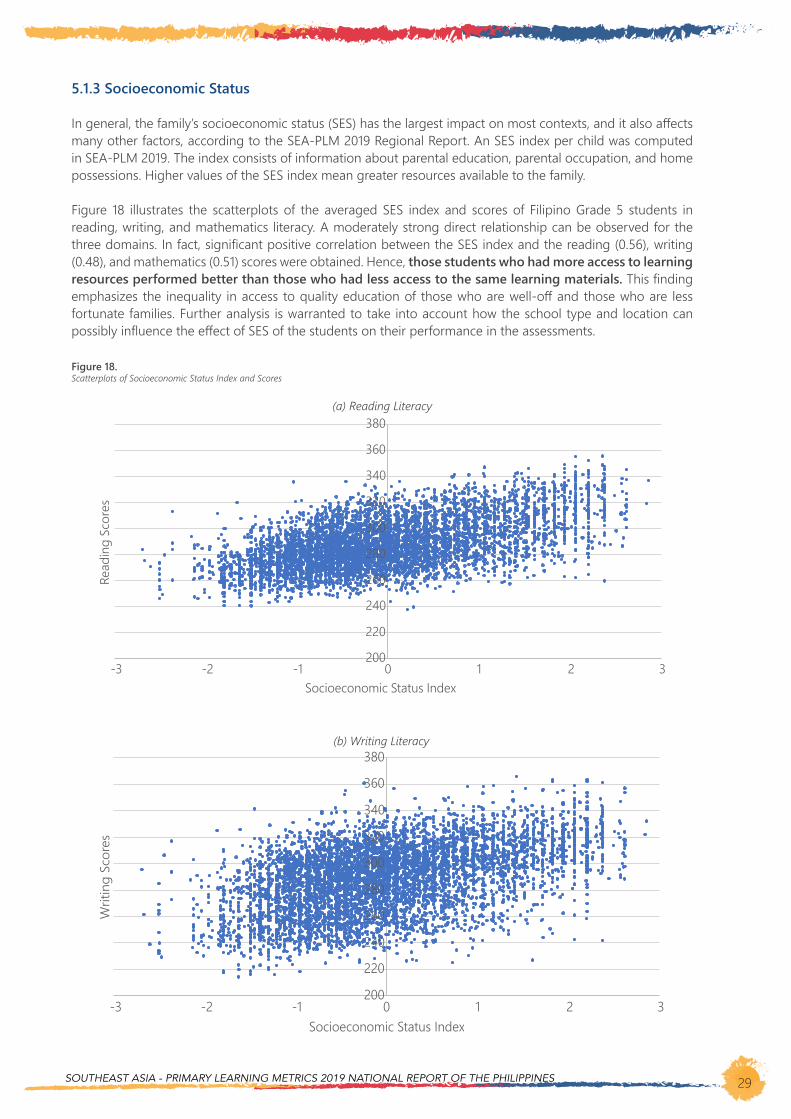
SOUTHEAST ASIA - PRIMARY LEARNING METRICS 2019 NATIONAL REPORT OF THE PHILIPPINES 29
5.1.3 Socioeconomic Status
In general, the family’s socioeconomic status (SES) has the largest impact on most contexts, and it also affects many other factors, according to the SEA-PLM 2019 Regional Report. An SES index per child was computed in SEA-PLM 2019. The index consists of information about parental education, parental occupation, and home possessions. Higher values of the SES index mean greater resources available to the family.
Figure 18 illustrates the scatterplots of the averaged SES index and scores of Filipino Grade 5 students in reading, writing, and mathematics literacy. A moderately strong direct relationship can be observed for the three domains. In fact, significant positive correlation between the SES index and the reading (0.56), writing (0.48), and mathematics (0.51) scores were obtained. Hence, those students who had more access to learning resources performed better than those who had less access to the same learning materials. This finding emphasizes the inequality in access to quality education of those who are well-off and those who are less fortunate families. Further analysis is warranted to take into account how the school type and location can possibly influence the effect of SES of the students on their performance in the assessments.
Figure 18.Scatterplots of Socioeconomic Status Index and Scores
(a) Reading Literacy
200
220
240
260
280
300
320
340
360
380
-3 -2 -1 0 1 2 3
Read
ing
Scor
es
Socioeconomic Status Index
(b) Writing Literacy
200
220
240
260
280
300
320
340
360
380
-3 -2 -1 0 1 2 3
Writ
ing
Scor
es
Socioeconomic Status Index

30
(c) Mathematics Literacy
5.1.4 Combined Gender, School Location, and Socioeconomic Status
A regression analysis was conducted to determine the combined effects of gender, school location, and socioeconomic status on the performance of the Filipino Grade 5 students on reading, writing, and mathematics. Table 6 reveals that all these contextual variables had a significant contribution in explaining the variability in the Filipino Grade 5 students’ scores in reading, writing, and mathematics. While controlling for school location and SES, it was found that girls consistently outperformed boys in the three domains. The highest difference in their performance can be seen in the writing literacy assessment. School location also played an important role as a determinant of the Filipino Grade 5 students’ performance. For the three domains, schools located in urban areas obtained higher mean scores than those located in rural areas, holding SES and gender constant. The largest difference between rural and urban schools’ performance can be seen in writing literacy, whereas the smallest difference can be observed in mathematics literacy.
As shown in Figure 18, SES had a positive relationship with the achievement performance, fixing gender and school location. This result implies that when gender and school location are fixed, higher SES of the family from which the student comes from implies higher mean scores in the three domains, on the average. However, note that the variability explained by gender, school location, and SES was at most 36% in reading and at least 28% in writing and mathematics. This suggests that a huge proportion of the assessment results’ variability has not been explained yet by these three contextual variables. Hence, it warrants further statistical analysis.
Table 6.Regression Coefficients for the Effects of Gender, School Location and SES in Reading, Writing, and Mathematics
DomainGender(boy=0,girl=1)
Schoollocation
(Rural=0,Urban=1)
SESVariance
explained(%)
Reading PhilippinesAverage of six countriesPhilippinesAverage of six countriesPhilippinesAverage of six countries
Writing
Mathematics
6.85.212.210.33.11.7
6.86.112.210.63.14.3
10.68.212.57.89.57.9
362028172818
200
220
240
260
280
300
320
340
360
380
-3 -2 -1 0 1 2 3
Mat
hem
atics
Sco
res
Socioeconomic Status Index
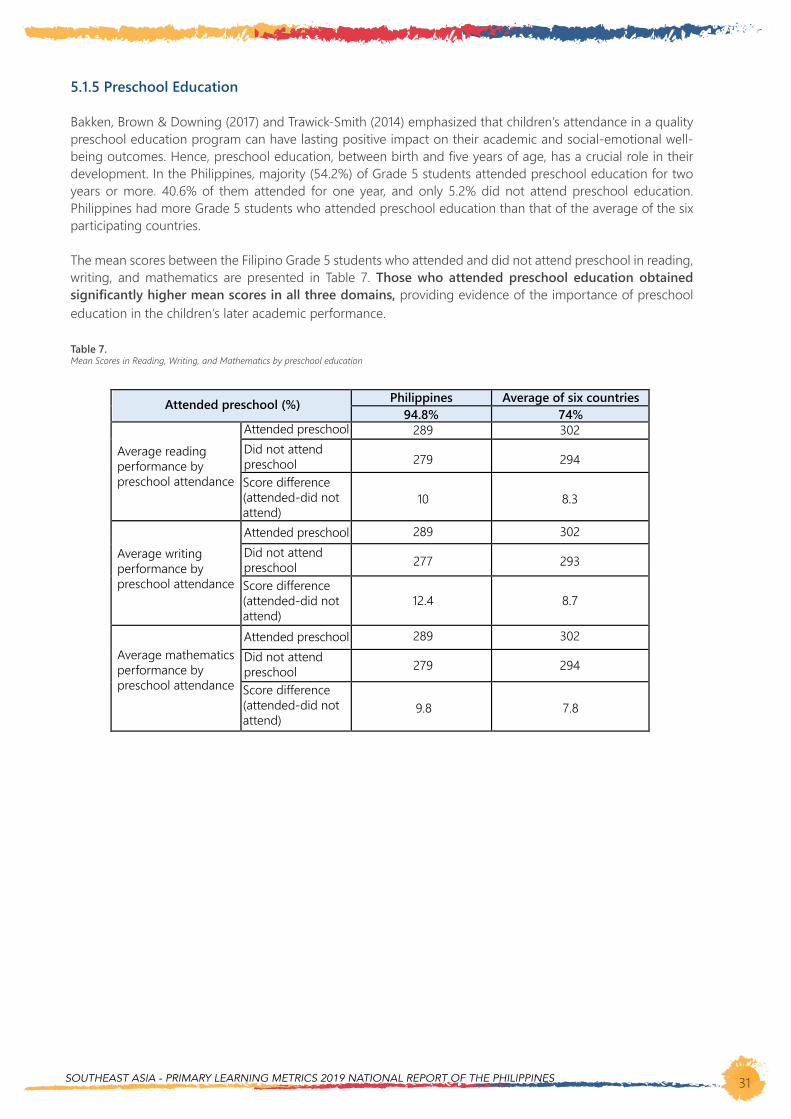
SOUTHEAST ASIA - PRIMARY LEARNING METRICS 2019 NATIONAL REPORT OF THE PHILIPPINES 31
5.1.5 Preschool Education
Bakken, Brown & Downing (2017) and Trawick-Smith (2014) emphasized that children’s attendance in a quality preschool education program can have lasting positive impact on their academic and social-emotional well-being outcomes. Hence, preschool education, between birth and five years of age, has a crucial role in their development. In the Philippines, majority (54.2%) of Grade 5 students attended preschool education for two years or more. 40.6% of them attended for one year, and only 5.2% did not attend preschool education. Philippines had more Grade 5 students who attended preschool education than that of the average of the six participating countries.
The mean scores between the Filipino Grade 5 students who attended and did not attend preschool in reading, writing, and mathematics are presented in Table 7. Those who attended preschool education obtained significantly higher mean scores in all three domains, providing evidence of the importance of preschool education in the children’s later academic performance.
Table 7.Mean Scores in Reading, Writing, and Mathematics by preschool education
Attended preschool (%) Philippines Average of six countries94.8% 74%
Average readingperformance bypreschool attendance
Average writingperformance bypreschool attendance
Average mathematicsperformance bypreschool attendance
Attended preschoolDid not attendpreschoolScore difference(attended-did notattend)Attended preschoolDid not attendpreschoolScore difference(attended-did notattend)Attended preschoolDid not attendpreschoolScore difference(attended-did notattend)
289
277
12.4
289
279
10
289
279
9.8
302
293
8.7
302
294
8.3
302
294
7.8
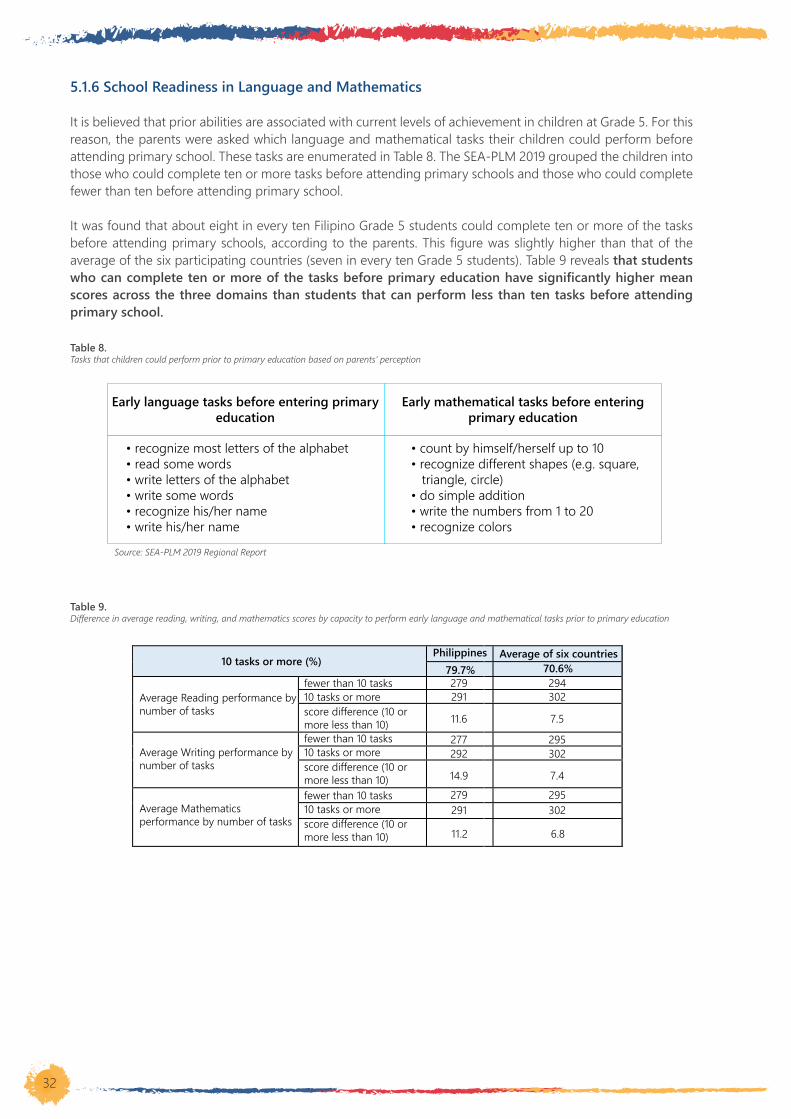
32
5.1.6 School Readiness in Language and Mathematics
It is believed that prior abilities are associated with current levels of achievement in children at Grade 5. For this reason, the parents were asked which language and mathematical tasks their children could perform before attending primary school. These tasks are enumerated in Table 8. The SEA-PLM 2019 grouped the children into those who could complete ten or more tasks before attending primary schools and those who could complete fewer than ten before attending primary school.
It was found that about eight in every ten Filipino Grade 5 students could complete ten or more of the tasks before attending primary schools, according to the parents. This figure was slightly higher than that of the average of the six participating countries (seven in every ten Grade 5 students). Table 9 reveals that students who can complete ten or more of the tasks before primary education have significantly higher mean scores across the three domains than students that can perform less than ten tasks before attending primary school.
Table 8.Tasks that children could perform prior to primary education based on parents’ perception
Early language tasks before entering primaryeducation
• recognize most letters of the alphabet• read some words• write letters of the alphabet• write some words• recognize his/her name• write his/her name
• count by himself/herself up to 10• recognize different shapes (e.g. square, triangle, circle)• do simple addition• write the numbers from 1 to 20• recognize colors
Early mathematical tasks before enteringprimary education
Source: SEA-PLM 2019 Regional Report
Table 9.Difference in average reading, writing, and mathematics scores by capacity to perform early language and mathematical tasks prior to primary education
10 tasks or more (%)Philippines Average of six countries
79.7% 70.6%
Average Reading performance bynumber of tasks
Average Writing performance bynumber of tasks
Average Mathematics performance by number of tasks
fewer than 10 tasks10 tasks or morescore difference (10 or more less than 10)fewer than 10 tasks10 tasks or morescore difference (10 or more less than 10)fewer than 10 tasks10 tasks or morescore difference (10 or more less than 10)
277292
14.9
279291
11.6
279291
11.2
295302
7.4
294302
7.5
295302
6.8

SOUTHEAST ASIA - PRIMARY LEARNING METRICS 2019 NATIONAL REPORT OF THE PHILIPPINES 33
Domain
Children don’tspeak the
language ofinstruction at
home most of the time
Children speakthe language of
instruction athome most of
the time
Difference betweenchildren speak the
language at home and children don’t speak
that language at homemost of the time
Philippines
Average of six countries
ReadingWritingMathematics
ReadingWritingMathematics
288289288
290290
292
288283285
302302
301
0-5.3-2.7
12.111.6
9.2
5.1.8 Grade Repetition
The majority (67%) of the Filipino Grade 5 students did not repeat grade level, but this was slightly below the average of the six countries (78%). Table 11 lists the mean scores in reading, writing, and mathematics literacy by grade repetition. It was found that Filipino Grade 5 students who repeated grade levels had significantly lower mean scores in all three domains than those who did not. Therefore, those students who repeat grade are more likely to have lower achievement levels in any of the three domains. Similar observations can be seen for an average SEA-PLM participating country, except that the difference was larger for the Philippines.
Table 11.Difference in average reading, writing, and mathematics scores by grade repetition
Did not repeat grade (%)Philippines Average of six countries
67.2% 78%
Average Reading performance bygrade repetition
Average Writing performance bygrade repetition
Average Mathematics performance by grade repetition
Repeated gradeDid not repeatScore difference (did notrepeat - repeated)Repeated gradeDid not repeatScore difference (did notrepeat - repeated)Repeated gradeDid not repeatScore difference (did notrepeat - repeated)
276295
18.6
278293
14.7
279293
14.9
291303
12.3
290303
12.5
292303
10.9
5.1.7 Speaking the Language of Instruction at Home
The participating Grade 5 students in SEA-PLM 2019 were asked what language they most often speak at home, which was compared to the language used in the test. It was found that almost all (93%) of the Filipino Grade 5 students do not speak the language of instruction (i.e., English) at home most of the time. Only 7% of them speak English at home most of the time. It should be noted that compared to the other five participating countries, the language of the assessment used in the Philippines was based on the language of instruction in Grade 5, which is English.
Table 10 shows no significant difference in the reading scores of those children who do and do not speak English at home most of the time. However, in writing and mathematics literacy, those children who speak English at home most of the time had slightly lower average scores than those who do not. It appears that whether or not the students speak English at home most of the time does not influence their performance in the SEA-PLM 2019 assessments. For an average participating country, the opposite holds. This finding means that those who speak the language of instruction at home most of the time had higher scores than those who do not.
Table 10.Difference in average reading, writing, and mathematics scores by whatever the language of instruction is spoken at home
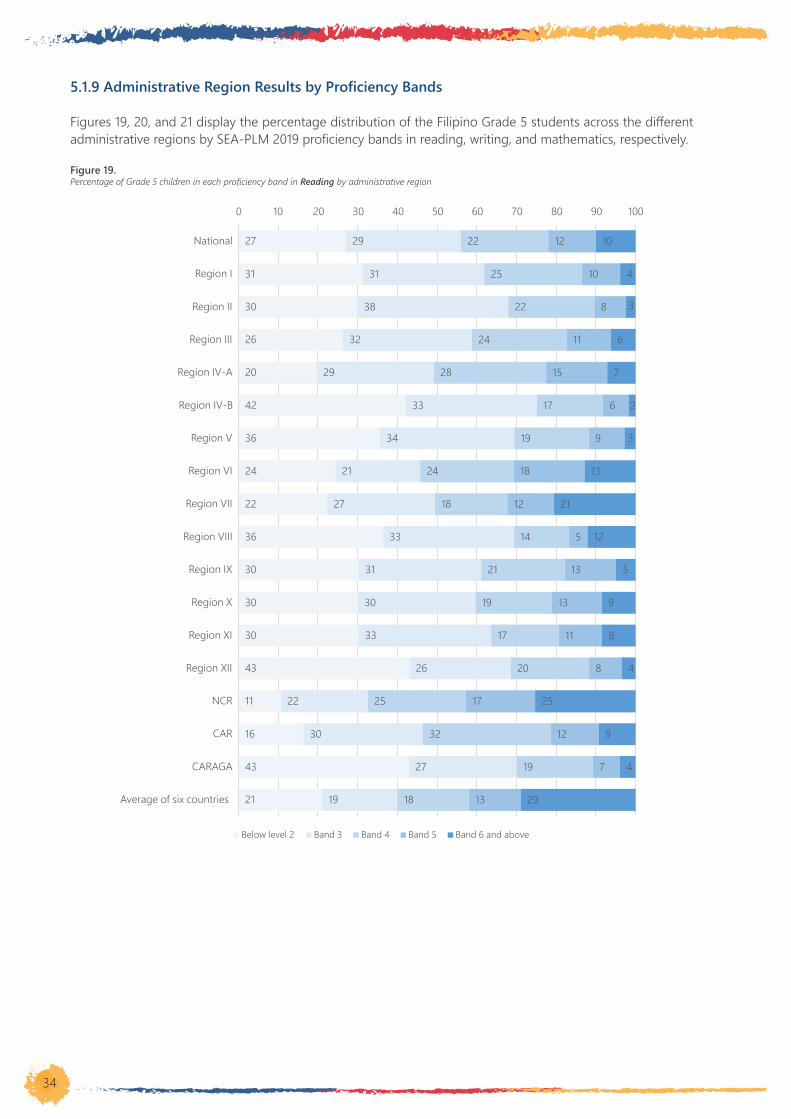
34
27
31
30
26
20
42
36
24
22
36
30
30
30
43
11
16
43
21
29
31
38
32
29
33
34
21
27
33
31
30
33
26
22
30
27
19
22
25
22
24
28
17
19
24
18
14
21
19
17
20
25
32
19
18
12
10
8
11
15
6
9
18
12
5
13
13
11
8
17
12
7
13
10
4
3
6
7
2
3
13
21
12
5
9
8
4
25
9
4
29
0 10 20 30 40 50 60 70 80 90 100
National
Region I
Region II
Region III
Region IV-A
Region IV-B
Region V
Region VI
Region VII
Region VIII
Region IX
Region X
Region XI
Region XII
NCR
CAR
CARAGA
Average of six countries
Below level 2 Band 3 Band 4 Band 5 Band 6 and above
5.1.9 Administrative Region Results by Proficiency Bands
Figures 19, 20, and 21 display the percentage distribution of the Filipino Grade 5 students across the different administrative regions by SEA-PLM 2019 proficiency bands in reading, writing, and mathematics, respectively.
Figure 19.Percentage of Grade 5 children in each proficiency band in Reading by administrative region
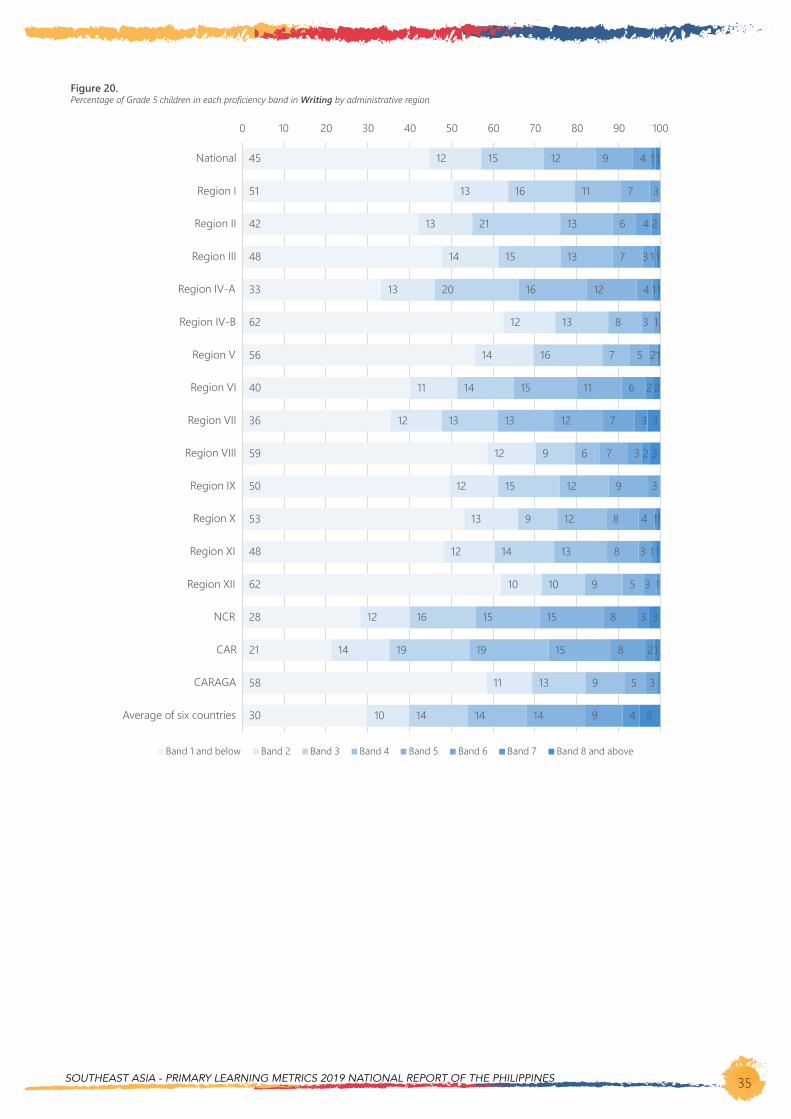
SOUTHEAST ASIA - PRIMARY LEARNING METRICS 2019 NATIONAL REPORT OF THE PHILIPPINES 35
Figure 20.Percentage of Grade 5 children in each proficiency band in Writing by administrative region
45
51
42
48
33
62
56
40
36
59
50
53
48
62
28
21
58
30
12
13
13
14
13
12
14
11
12
12
12
13
12
10
12
14
11
10
15
16
21
15
20
13
16
14
13
9
15
9
14
10
16
19
13
14
12
11
13
13
16
8
7
15
13
6
12
12
13
9
15
19
9
14
9
7
6
7
12
3
5
11
12
7
9
8
8
5
15
15
5
14
4
3
4
3
4
1
2
6
7
3
3
4
3
3
8
8
3
9
1
2
1
1
2
3
2
1
1
1
3
2
4
1
1
1
1
2
3
3
1
1
3
1
5
0 10 20 30 40 50 60 70 80 90 100
National
Region I
Region II
Region III
Region IV-A
Region IV-B
Region V
Region VI
Region VII
Region VIII
Region IX
Region X
Region XI
Region XII
NCR
CAR
CARAGA
Average of six countries
Band 1 and below Band 2 Band 3 Band 4 Band 5 Band 6 Band 7 Band 8 and above
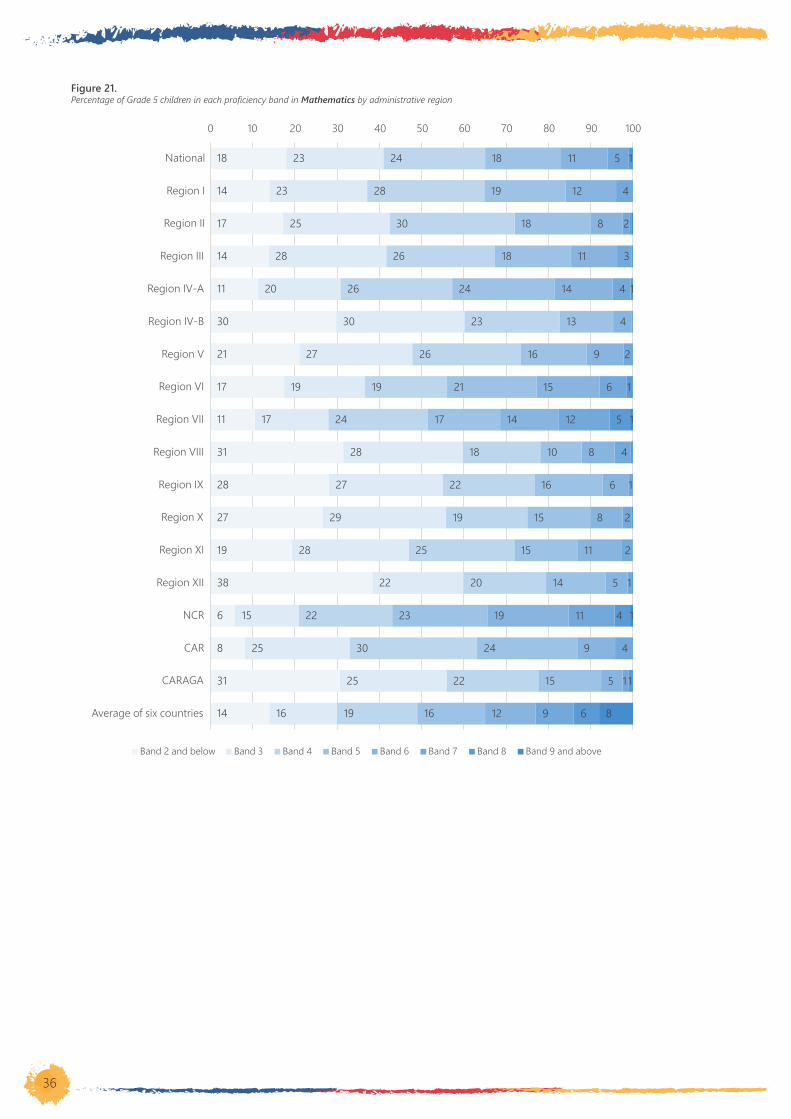
36
Figure 21.Percentage of Grade 5 children in each proficiency band in Mathematics by administrative region
18
14
17
14
11
30
21
17
11
31
28
27
19
38
6
8
31
14
23
23
25
28
20
30
27
19
17
28
27
29
28
22
15
25
25
16
24
28
30
26
26
23
26
19
24
18
22
19
25
20
22
30
22
19
18
19
18
18
24
13
16
21
17
10
16
15
15
14
23
24
15
16
11
12
8
11
14
4
9
15
14
8
6
8
11
5
19
9
5
12
5
4
2
3
4
2
6
12
4
1
2
2
1
11
4
1
9
1
1
1
5
4
1
6
1
1
8
0 10 20 30 40 50 60 70 80 90 100
National
Region I
Region II
Region III
Region IV-A
Region IV-B
Region V
Region VI
Region VII
Region VIII
Region IX
Region X
Region XI
Region XII
NCR
CAR
CARAGA
Average of six countries
Band 2 and below Band 3 Band 4 Band 5 Band 6 Band 7 Band 8 Band 9 and above
SOUTHEAST ASIA - PRIMARY LEARNING METRICS 2019 NATIONAL REPORT OF THE PHILIPPINES 37
Reading Literacy
In reading, the percentage of Filipino Grade 5 students who reached the highest proficiency band (Band 6 and above) across administrative regions ranged from 1.8% to 25.3%. They were expected to understand texts with familiar structures and manage competing information – competencies expected at the end of primary education. NCR achieved the highest estimated proportion of Grade 5 students in this band. It was followed by Region VII (20.6%), Region VI (12.9%), and Region VIII (12.9%). On the other hand, Region V (2.8%), Region II (2.5%), and MIMAROPA (1.8%) had the lowest proportion of Grade 5 students in this proficiency band.
Meanwhile, the proportion of Filipino Grade 5 students belonging to Band 2 and below, the lowest proficiency band, ranged from 10.7% to 43%. These students can only identify relationships between words and their meanings. NCR had the lowest estimated percentage (10.7%) of Grade 5 students in this band. On the other hand, more than four in every ten Grade 5 students in Region IV-B, CARAGA, and Region XII belonged to the lowest band in reading.
Writing
There was a large variation (from 21.3% to 62.5%) in the proportion of Grade 5 students classified under Band 1 and below, the lowest proficiency band in writing, across administrative regions. These students had limited ability in presenting ideas in writing. This result suggests that there was a vast proportion of students across administrative regions that were not demonstrating the proficiency level expected of a Grade 5 student.
CAR had the smallest percentage (21.3%) of Grade 5 students in this band, followed by NCR (28.3%) and Region IV-A (33.2%). On the other hand, CARAGA (58.5%), Region VIII (58.7%), Region XII (61.9%), and Region IV-B (62.5%) had the greatest number of Grade 5 students belonging to the lowest proficiency band in writing.
Only a very limited percentage (0 to 3%) of Grade 5 students belonged to the highest proficiency band in writing. The highest proportion of Grade 5 students in Band 8 and above was from Region VII (3%), NCR (2.7%), and Region VIII (2.6%). On the other hand, the least number of Grade 5 students who belonged to the highest proficiency band were from Region IX (0.1%), Region XII (0.1%), and Region 1 (0%).
Mathematics
Lastly, the proportion of Filipino Grade 5 students who met or were progressing toward the expected proficiency level (Band 6 and above) in mathematics had a broad range (from 4.7% to 34.4%) across administrative regions. At the least, they could perform mathematical operations, including with fractions, and interpret tables and graphs.
NCR (34.4%) and Region VII (31.4%) achieved the highest percentage of Grade 5 students belonging to Band 6 and above, whereas Region XII (6.4%) and Region IV-B (4.7%) obtained the lowest percentages. Region XII (38.4%), Region VIII (31.5%), and CARAGA (30.7%) were the administrative regions from where the highest proportion of Grade 5 students in the lowest proficiency band (Band 2 and below) in mathematics came from. On the other hand, CAR (8.2%) and NCR (5.8%) had the least proportion of Grade 5 students in this band.
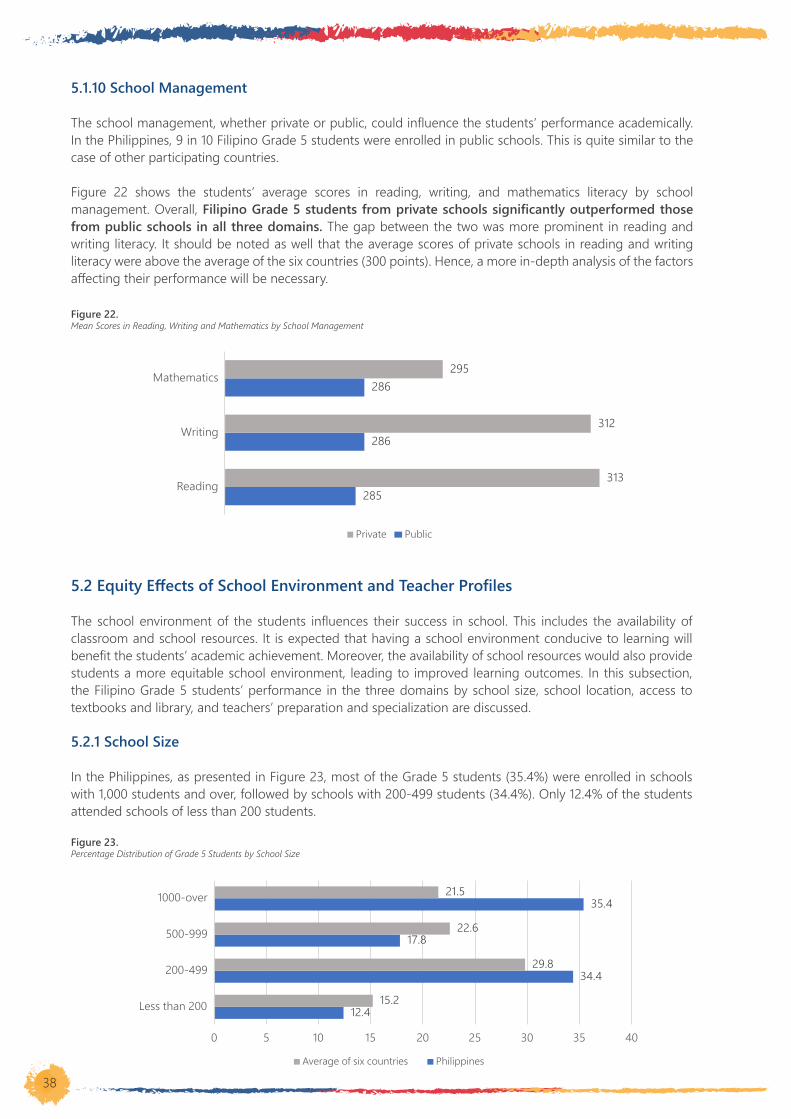
38
5.1.10 School Management
The school management, whether private or public, could influence the students’ performance academically. In the Philippines, 9 in 10 Filipino Grade 5 students were enrolled in public schools. This is quite similar to the case of other participating countries.
Figure 22 shows the students’ average scores in reading, writing, and mathematics literacy by school management. Overall, Filipino Grade 5 students from private schools significantly outperformed those from public schools in all three domains. The gap between the two was more prominent in reading and writing literacy. It should be noted as well that the average scores of private schools in reading and writing literacy were above the average of the six countries (300 points). Hence, a more in-depth analysis of the factors affecting their performance will be necessary.
Figure 22.Mean Scores in Reading, Writing and Mathematics by School Management
285
286
286
313
312
295
Reading
Writing
Mathematics
Private Public
5.2 Equity Effects of School Environment and Teacher Profiles
The school environment of the students influences their success in school. This includes the availability of classroom and school resources. It is expected that having a school environment conducive to learning will benefit the students’ academic achievement. Moreover, the availability of school resources would also provide students a more equitable school environment, leading to improved learning outcomes. In this subsection, the Filipino Grade 5 students’ performance in the three domains by school size, school location, access to textbooks and library, and teachers’ preparation and specialization are discussed.
5.2.1 School Size
In the Philippines, as presented in Figure 23, most of the Grade 5 students (35.4%) were enrolled in schools with 1,000 students and over, followed by schools with 200-499 students (34.4%). Only 12.4% of the students attended schools of less than 200 students.
Figure 23.Percentage Distribution of Grade 5 Students by School Size
12.4
34.4
17.8
35.4
15.2
29.8
22.6
21.5
0 5 10 15 20 25 30 35 40
Less than 200
200-499
500-999
1000-over
Average of six countries Philippines
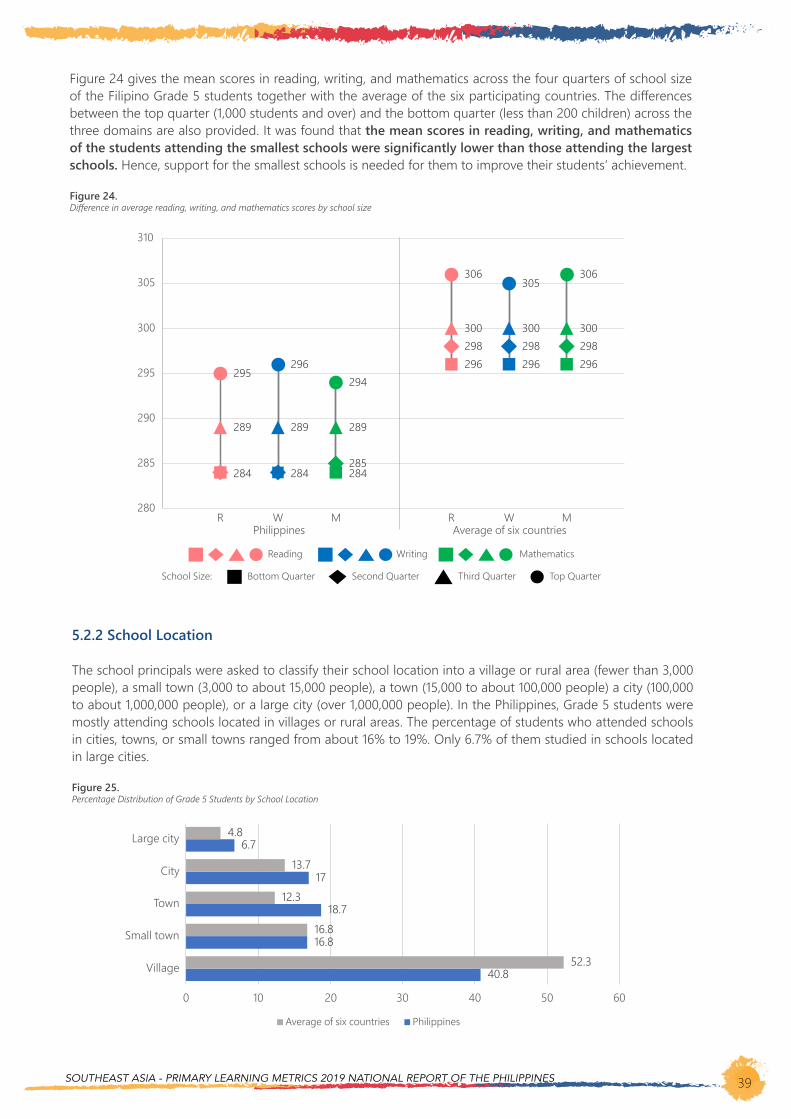
SOUTHEAST ASIA - PRIMARY LEARNING METRICS 2019 NATIONAL REPORT OF THE PHILIPPINES 39
Figure 24 gives the mean scores in reading, writing, and mathematics across the four quarters of school size of the Filipino Grade 5 students together with the average of the six participating countries. The differences between the top quarter (1,000 students and over) and the bottom quarter (less than 200 children) across the three domains are also provided. It was found that the mean scores in reading, writing, and mathematics of the students attending the smallest schools were significantly lower than those attending the largest schools. Hence, support for the smallest schools is needed for them to improve their students’ achievement.
Figure 24.Difference in average reading, writing, and mathematics scores by school size
284
289
295
284
289
296
284285
289
294296298300
306
296298300
305
296298300
306
280
285
290
295
300
305
310
Top QuarterBottom Quarter
Philippines Average of six countries
Second Quarter Third Quarter
R W M R W M
Reading Writing Mathematics
School Size:
5.2.2 School Location
The school principals were asked to classify their school location into a village or rural area (fewer than 3,000 people), a small town (3,000 to about 15,000 people), a town (15,000 to about 100,000 people) a city (100,000 to about 1,000,000 people), or a large city (over 1,000,000 people). In the Philippines, Grade 5 students were mostly attending schools located in villages or rural areas. The percentage of students who attended schools in cities, towns, or small towns ranged from about 16% to 19%. Only 6.7% of them studied in schools located in large cities.
Figure 25.Percentage Distribution of Grade 5 Students by School Location
40.8
16.8
18.7
17
6.7
52.3
16.8
12.3
13.7
4.8
0 10 20 30 40 50 60
Village
Small town
Town
City
Large city
Average of six countries Philippines
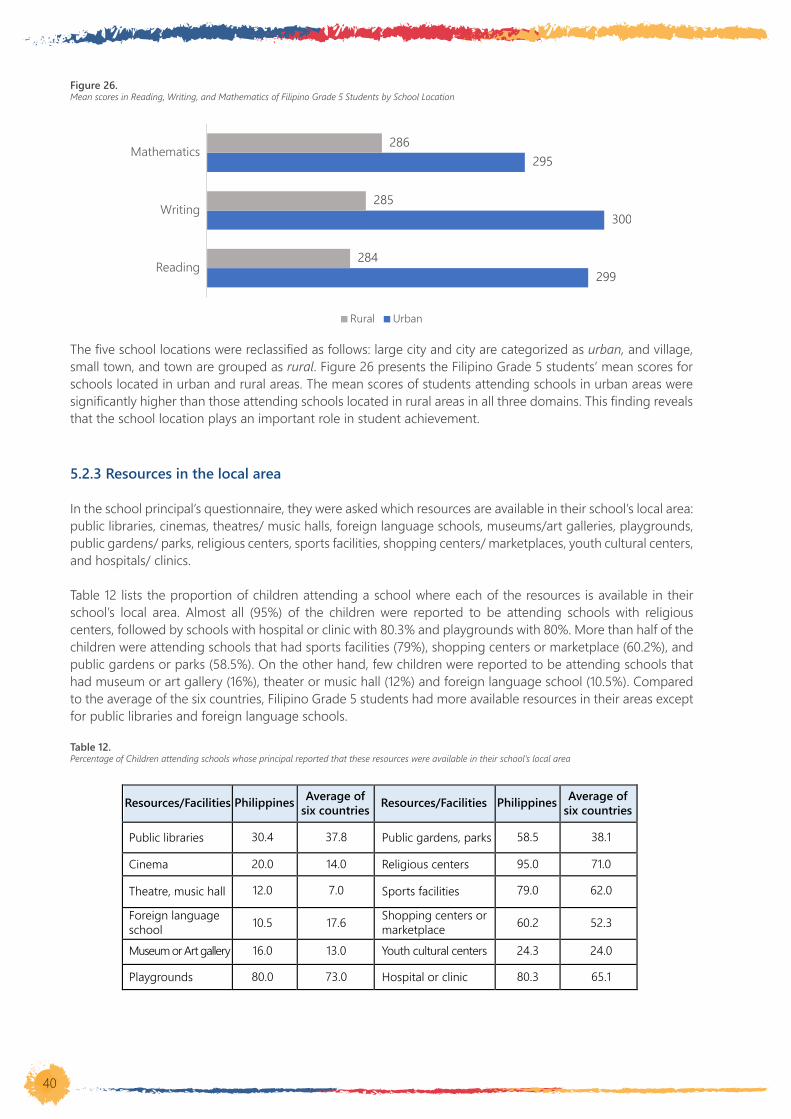
40
Figure 26.Mean scores in Reading, Writing, and Mathematics of Filipino Grade 5 Students by School Location
299
300
295
284
285
286
Reading
Writing
Mathematics
Rural Urban
The five school locations were reclassified as follows: large city and city are categorized as urban, and village, small town, and town are grouped as rural. Figure 26 presents the Filipino Grade 5 students’ mean scores for schools located in urban and rural areas. The mean scores of students attending schools in urban areas were significantly higher than those attending schools located in rural areas in all three domains. This finding reveals that the school location plays an important role in student achievement.
5.2.3 Resources in the local area
In the school principal’s questionnaire, they were asked which resources are available in their school’s local area: public libraries, cinemas, theatres/ music halls, foreign language schools, museums/art galleries, playgrounds, public gardens/ parks, religious centers, sports facilities, shopping centers/ marketplaces, youth cultural centers, and hospitals/ clinics.
Table 12 lists the proportion of children attending a school where each of the resources is available in their school’s local area. Almost all (95%) of the children were reported to be attending schools with religious centers, followed by schools with hospital or clinic with 80.3% and playgrounds with 80%. More than half of the children were attending schools that had sports facilities (79%), shopping centers or marketplace (60.2%), and public gardens or parks (58.5%). On the other hand, few children were reported to be attending schools that had museum or art gallery (16%), theater or music hall (12%) and foreign language school (10.5%). Compared to the average of the six countries, Filipino Grade 5 students had more available resources in their areas except for public libraries and foreign language schools.
Table 12.Percentage of Children attending schools whose principal reported that these resources were available in their school’s local area
Resources/Facilities Philippines Average ofsix countries Resources/Facilities Philippines Average of
six countries
Public libraries
Cinema
Theatre, music hall
Foreign languageschoolMuseum or Art gallery
Playgrounds
Public gardens, parks
Religious centers
Sports facilities
Shopping centers ormarketplaceYouth cultural centers
Hospital or clinic
30.4
20.0
12.0
10.5
16.0
80.0
37.8
14.0
7.0
17.6
13.0
73.0
58.5
95.0
79.0
60.2
24.3
80.3
38.1
71.0
62.0
52.3
24.0
65.1
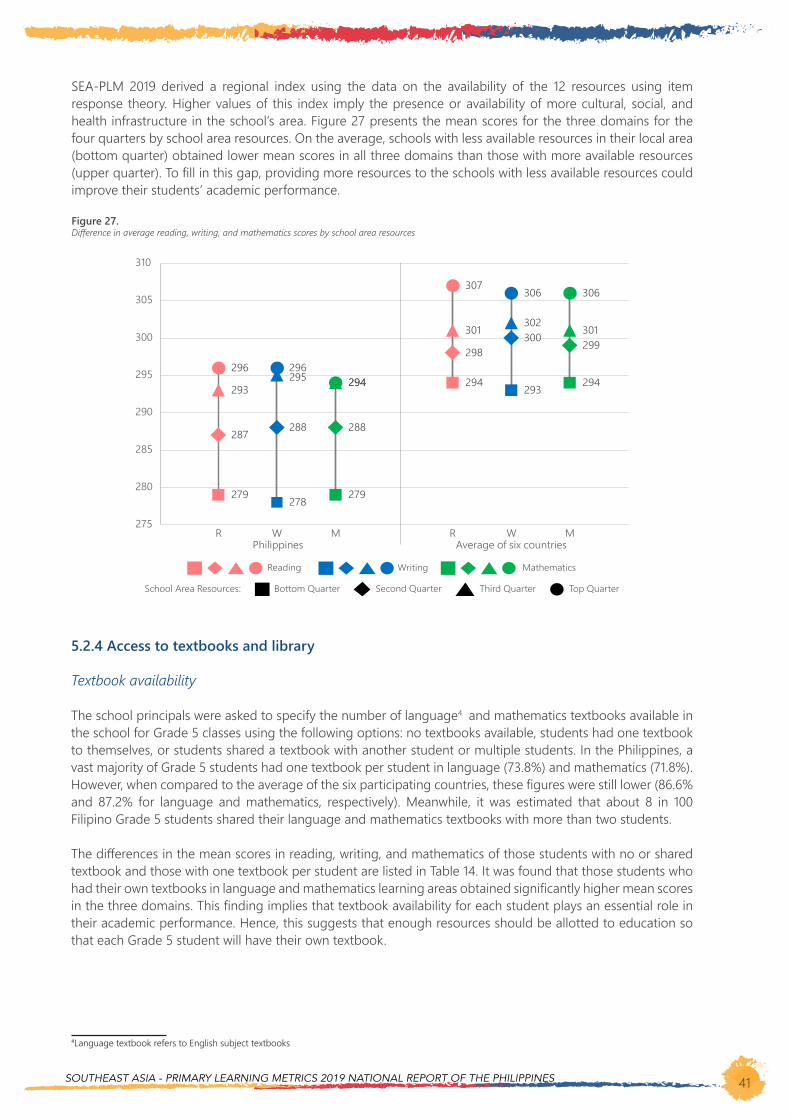
SOUTHEAST ASIA - PRIMARY LEARNING METRICS 2019 NATIONAL REPORT OF THE PHILIPPINES 41
SEA-PLM 2019 derived a regional index using the data on the availability of the 12 resources using item response theory. Higher values of this index imply the presence or availability of more cultural, social, and health infrastructure in the school’s area. Figure 27 presents the mean scores for the three domains for the four quarters by school area resources. On the average, schools with less available resources in their local area (bottom quarter) obtained lower mean scores in all three domains than those with more available resources (upper quarter). To fill in this gap, providing more resources to the schools with less available resources could improve their students’ academic performance.
Figure 27.Difference in average reading, writing, and mathematics scores by school area resources
279
287
293
296
278
288
295296
279
288
294 294
298
301
307
293
300302
306
294
299301
306
275
280
285
290
295
300
305
310
Philippines Average of six countriesR W M R W M
Reading Writing Mathematics
Top QuarterBottom Quarter Second Quarter Third QuarterSchool Area Resources:
294
5.2.4 Access to textbooks and library
Textbook availability
The school principals were asked to specify the number of language41 and mathematics textbooks available in the school for Grade 5 classes using the following options: no textbooks available, students had one textbook to themselves, or students shared a textbook with another student or multiple students. In the Philippines, a vast majority of Grade 5 students had one textbook per student in language (73.8%) and mathematics (71.8%). However, when compared to the average of the six participating countries, these figures were still lower (86.6% and 87.2% for language and mathematics, respectively). Meanwhile, it was estimated that about 8 in 100 Filipino Grade 5 students shared their language and mathematics textbooks with more than two students.
The differences in the mean scores in reading, writing, and mathematics of those students with no or shared textbook and those with one textbook per student are listed in Table 14. It was found that those students who had their own textbooks in language and mathematics learning areas obtained significantly higher mean scores in the three domains. This finding implies that textbook availability for each student plays an essential role in their academic performance. Hence, this suggests that enough resources should be allotted to education so that each Grade 5 student will have their own textbook.
⁴Language textbook refers to English subject textbooks
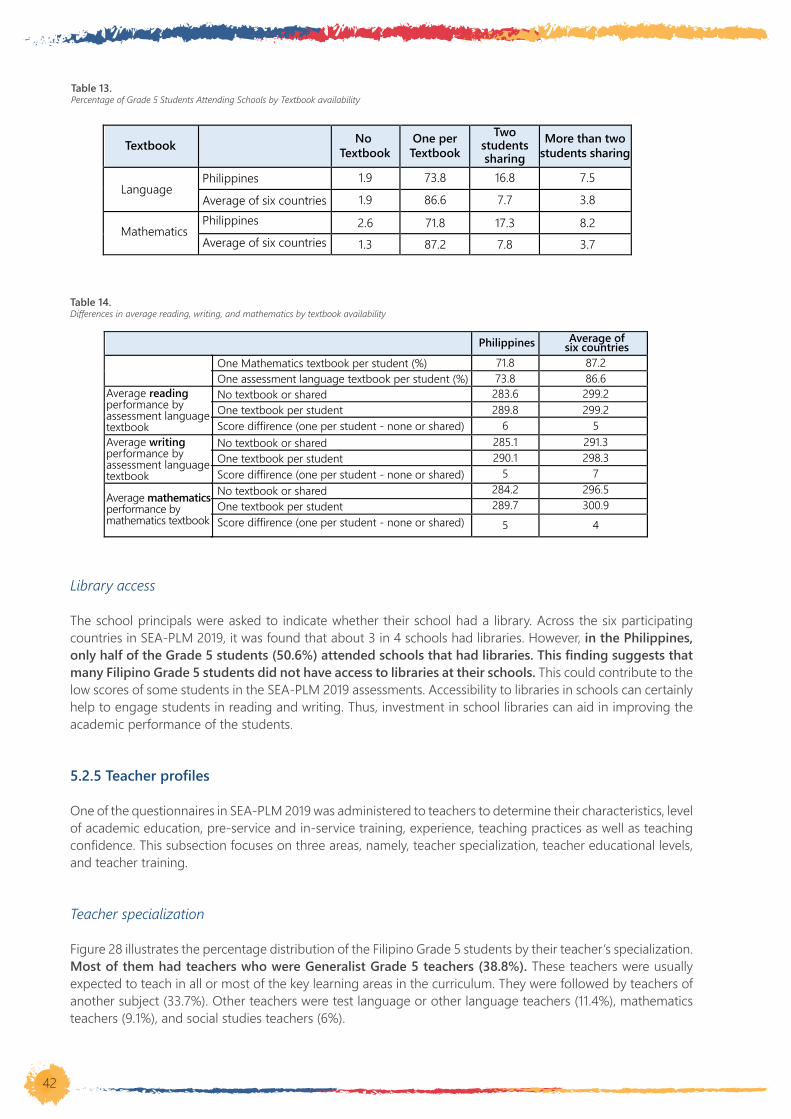
42
Table 13.Percentage of Grade 5 Students Attending Schools by Textbook availability
Textbook No Textbook
One perTextbook
Twostudentssharing
More than twostudents sharing
PhilippinesLanguage
Mathematics
Average of six countriesPhilippines
Average of six countries
1.9
1.9
2.6
1.3
73.8
86.6
71.8
87.2
16.8
7.7
17.3
7.8
7.5
3.8
8.2
3.7
Table 14.Differences in average reading, writing, and mathematics by textbook availability
Philippines Average ofsix countries
Average readingperformance byassessment languagetextbookAverage writingperformance byassessment languagetextbook
Average mathematicsperformance bymathematics textbook
One Mathematics textbook per student (%)One assessment language textbook per student (%)No textbook or sharedOne textbook per studentScore diffirence (one per student - none or shared)No textbook or sharedOne textbook per studentScore diffirence (one per student - none or shared)No textbook or sharedOne textbook per studentScore diffirence (one per student - none or shared)
71.873.8
283.6289.8
6285.1290.1
5284.2289.7
5
87.286.6299.2299.2
5291.3298.3
7296.5300.9
4
Library access
The school principals were asked to indicate whether their school had a library. Across the six participating countries in SEA-PLM 2019, it was found that about 3 in 4 schools had libraries. However, in the Philippines, only half of the Grade 5 students (50.6%) attended schools that had libraries. This finding suggests that many Filipino Grade 5 students did not have access to libraries at their schools. This could contribute to the low scores of some students in the SEA-PLM 2019 assessments. Accessibility to libraries in schools can certainly help to engage students in reading and writing. Thus, investment in school libraries can aid in improving the academic performance of the students.
5.2.5 Teacher profiles
One of the questionnaires in SEA-PLM 2019 was administered to teachers to determine their characteristics, level of academic education, pre-service and in-service training, experience, teaching practices as well as teaching confidence. This subsection focuses on three areas, namely, teacher specialization, teacher educational levels, and teacher training.
Teacher specialization
Figure 28 illustrates the percentage distribution of the Filipino Grade 5 students by their teacher’s specialization. Most of them had teachers who were Generalist Grade 5 teachers (38.8%). These teachers were usually expected to teach in all or most of the key learning areas in the curriculum. They were followed by teachers of another subject (33.7%). Other teachers were test language or other language teachers (11.4%), mathematics teachers (9.1%), and social studies teachers (6%).
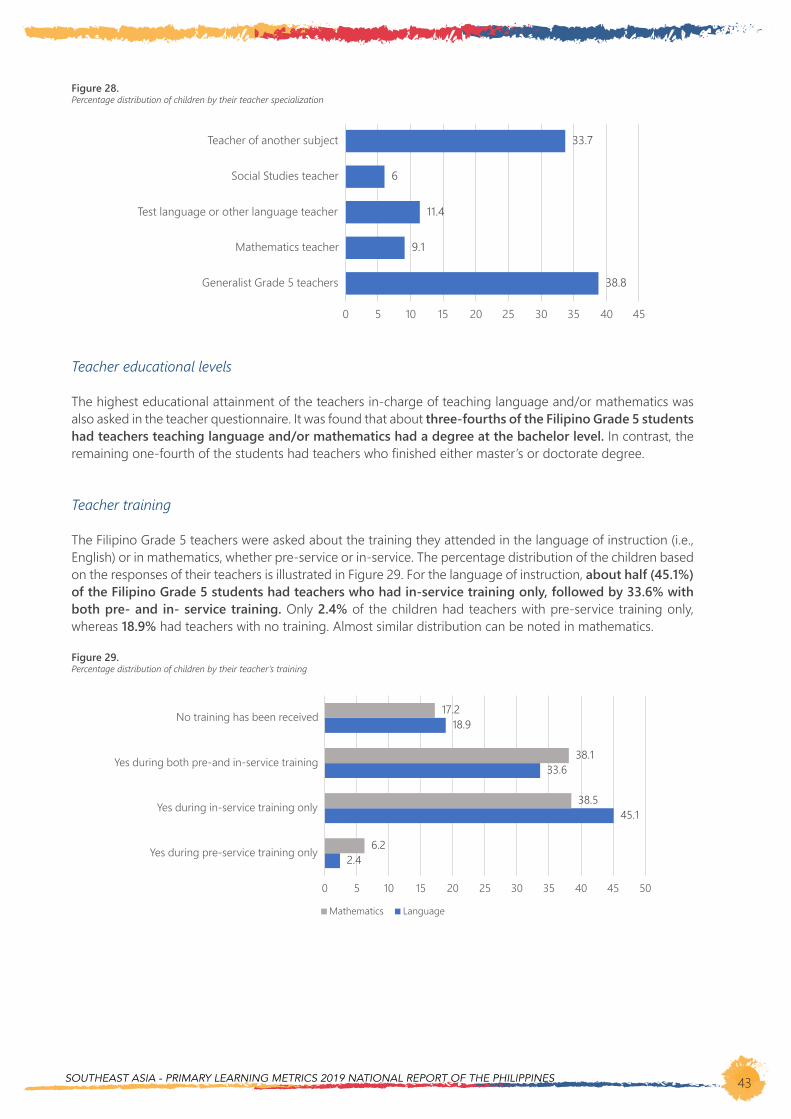
SOUTHEAST ASIA - PRIMARY LEARNING METRICS 2019 NATIONAL REPORT OF THE PHILIPPINES 43
Figure 28.Percentage distribution of children by their teacher specialization
38.8
9.1
11.4
6
33.7
0 5 10 15 20 25 30 35 40 45
Generalist Grade 5 teachers
Mathematics teacher
Test language or other language teacher
Social Studies teacher
Teacher of another subject
Teacher educational levels
The highest educational attainment of the teachers in-charge of teaching language and/or mathematics was also asked in the teacher questionnaire. It was found that about three-fourths of the Filipino Grade 5 students had teachers teaching language and/or mathematics had a degree at the bachelor level. In contrast, the remaining one-fourth of the students had teachers who finished either master’s or doctorate degree.
Teacher training
The Filipino Grade 5 teachers were asked about the training they attended in the language of instruction (i.e., English) or in mathematics, whether pre-service or in-service. The percentage distribution of the children based on the responses of their teachers is illustrated in Figure 29. For the language of instruction, about half (45.1%) of the Filipino Grade 5 students had teachers who had in-service training only, followed by 33.6% with both pre- and in- service training. Only 2.4% of the children had teachers with pre-service training only, whereas 18.9% had teachers with no training. Almost similar distribution can be noted in mathematics.
Figure 29.Percentage distribution of children by their teacher’s training
2.4
45.1
33.6
18.9
6.2
38.5
38.1
17.2
0 5 10 15 20 25 30 35 40 45 50
Yes during pre-service training only
Yes during in-service training only
Yes during both pre-and in-service training
No training has been received
Mathematics Language
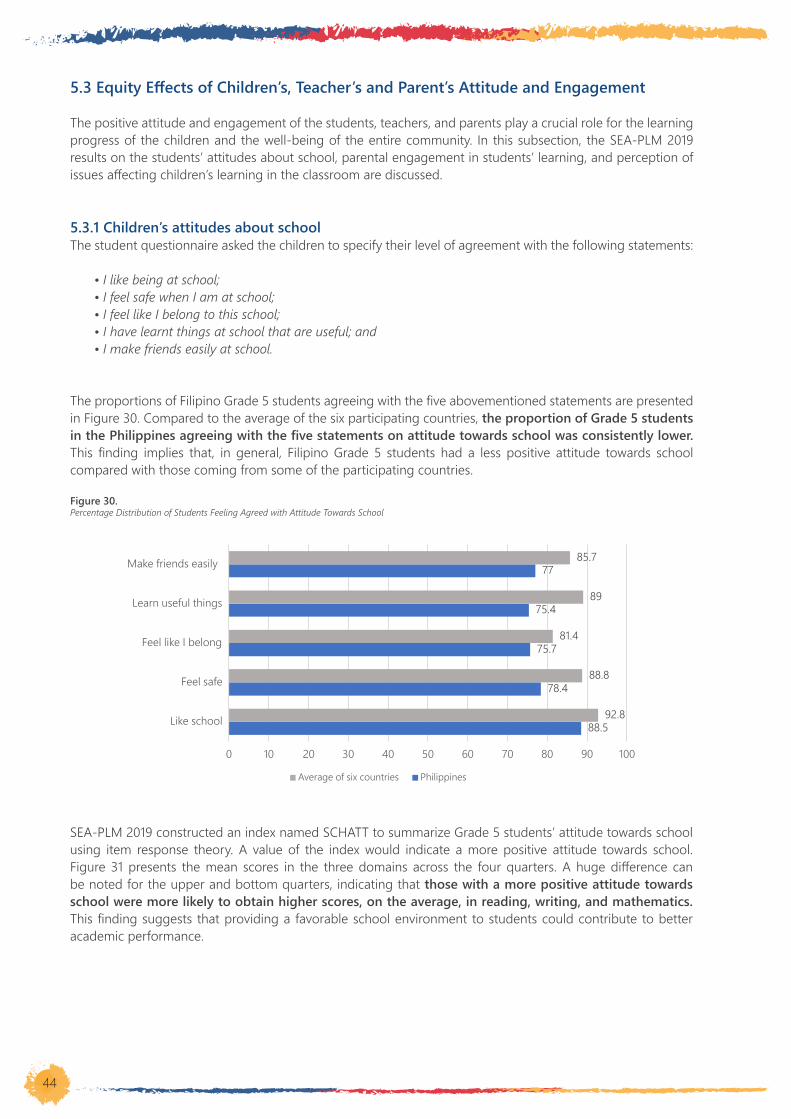
44
5.3 Equity Effects of Children’s, Teacher’s and Parent’s Attitude and Engagement
The positive attitude and engagement of the students, teachers, and parents play a crucial role for the learning progress of the children and the well-being of the entire community. In this subsection, the SEA-PLM 2019 results on the students’ attitudes about school, parental engagement in students’ learning, and perception of issues affecting children’s learning in the classroom are discussed.
5.3.1 Children’s attitudes about schoolThe student questionnaire asked the children to specify their level of agreement with the following statements:
• I like being at school;• I feel safe when I am at school;• I feel like I belong to this school;• I have learnt things at school that are useful; and• I make friends easily at school.
The proportions of Filipino Grade 5 students agreeing with the five abovementioned statements are presented in Figure 30. Compared to the average of the six participating countries, the proportion of Grade 5 students in the Philippines agreeing with the five statements on attitude towards school was consistently lower. This finding implies that, in general, Filipino Grade 5 students had a less positive attitude towards school compared with those coming from some of the participating countries.
Figure 30.Percentage Distribution of Students Feeling Agreed with Attitude Towards School
88.5
78.4
75.7
75.4
77
92.8
88.8
81.4
89
85.7
0 10 20 30 40 50 60 70 80 90 100
Like school
Feel safe
Feel like I belong
Learn useful things
Make friends easily
Average of six countries Philippines
SEA-PLM 2019 constructed an index named SCHATT to summarize Grade 5 students’ attitude towards school using item response theory. A value of the index would indicate a more positive attitude towards school. Figure 31 presents the mean scores in the three domains across the four quarters. A huge difference can be noted for the upper and bottom quarters, indicating that those with a more positive attitude towards school were more likely to obtain higher scores, on the average, in reading, writing, and mathematics. This finding suggests that providing a favorable school environment to students could contribute to better academic performance.
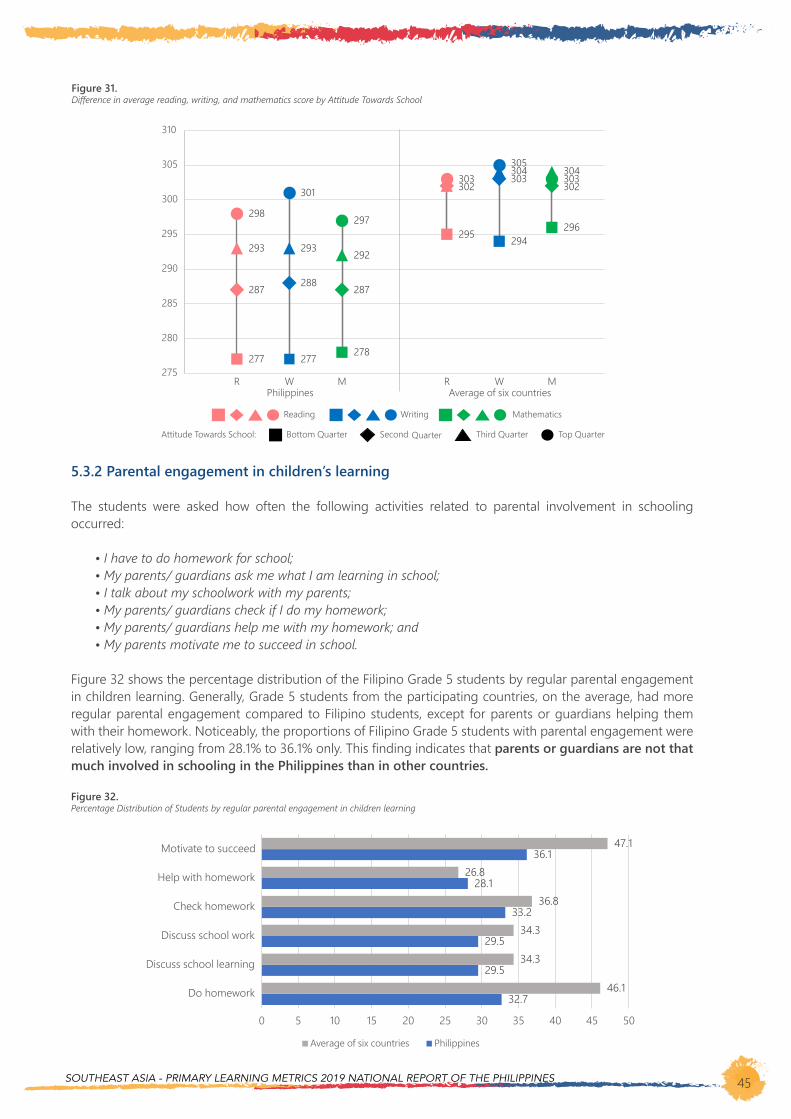
SOUTHEAST ASIA - PRIMARY LEARNING METRICS 2019 NATIONAL REPORT OF THE PHILIPPINES 45
Figure 31.Difference in average reading, writing, and mathematics score by Attitude Towards School
277
287
293
298
277
288
293
301
278
287
292
297295
302303
294
303304305
296
302304303
275
280
285
290
295
300
305
310
Philippines Average of six countriesR W M R W M
Reading Writing Mathematics
Top QuarterBottom Quarter Second Quarter Third QuarterAttitude Towards School:
5.3.2 Parental engagement in children’s learning
The students were asked how often the following activities related to parental involvement in schooling occurred:
• I have to do homework for school;• My parents/ guardians ask me what I am learning in school;• I talk about my schoolwork with my parents;• My parents/ guardians check if I do my homework;• My parents/ guardians help me with my homework; and• My parents motivate me to succeed in school.
Figure 32 shows the percentage distribution of the Filipino Grade 5 students by regular parental engagement in children learning. Generally, Grade 5 students from the participating countries, on the average, had more regular parental engagement compared to Filipino students, except for parents or guardians helping them with their homework. Noticeably, the proportions of Filipino Grade 5 students with parental engagement were relatively low, ranging from 28.1% to 36.1% only. This finding indicates that parents or guardians are not that much involved in schooling in the Philippines than in other countries.
Figure 32.Percentage Distribution of Students by regular parental engagement in children learning
32.7
29.5
29.5
33.2
28.1
36.1
46.1
34.3
34.3
36.8
26.8
47.1
0 5 10 15 20 25 30 35 40 45 50
Do homework
Discuss school learning
Discuss school work
Check homework
Help with homework
Motivate to succeed
Average of six countries Philippines

46
Another index named PARENG was generated based on the six abovementioned statements to summarize parental engagement in school. High values of this index are indication of more parental engagement in schooling. Figure 33 presents the mean scores in the three domains across the four quarters.
Compared to the other five countries, it was found that the Philippines had the largest gap in the mean scores for reading, writing, and mathematics between the upper quarter (above 300 points) and the bottom quarter (below 280 points) on parental engagement in schooling. Hence, those Grade 5 students whose parents were more involved in schooling obtained higher mean scores than those whose parents were less involved in schooling. This finding implies that parental involvement in schooling is an essential factor in students’ performance academically.
Figure 33.Difference in average reading, writing, and mathematics score by Parental Engagement
279280
288
305
279
290
308
280
289
305
294296
303
308
294295
304
309
294
297
303
307
275
280
285
290
295
300
305
310
315
Top QuarterBottom Quarter
Reading Writing Mathematics
Philippines Average of six countries
Second Quarter Third Quarter
R W M R W M
Parental Engagement:
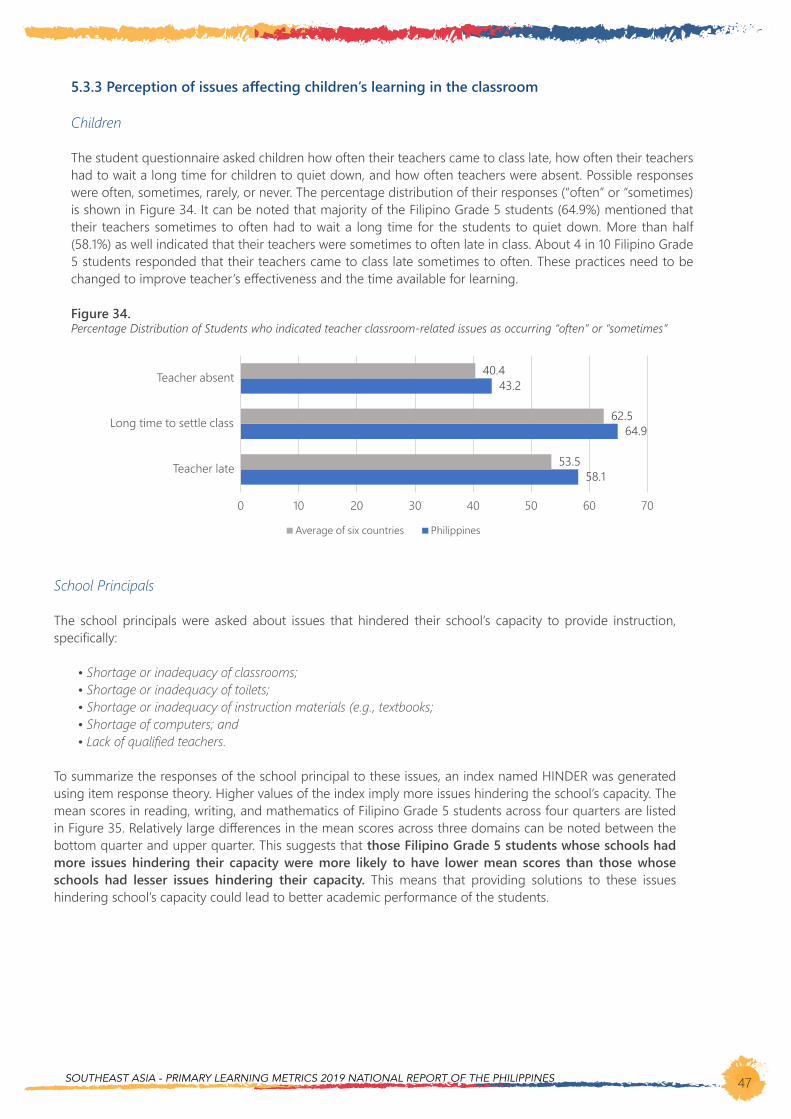
SOUTHEAST ASIA - PRIMARY LEARNING METRICS 2019 NATIONAL REPORT OF THE PHILIPPINES 47
58.1
64.9
43.2
53.5
62.5
40.4
0 10 20 30 40 50 60 70
Teacher late
Long time to settle class
Teacher absent
Average of six countries Philippines
School Principals
The school principals were asked about issues that hindered their school’s capacity to provide instruction, specifically:
• Shortage or inadequacy of classrooms;• Shortage or inadequacy of toilets;• Shortage or inadequacy of instruction materials (e.g., textbooks;• Shortage of computers; and• Lack of qualified teachers.
To summarize the responses of the school principal to these issues, an index named HINDER was generated using item response theory. Higher values of the index imply more issues hindering the school’s capacity. The mean scores in reading, writing, and mathematics of Filipino Grade 5 students across four quarters are listed in Figure 35. Relatively large differences in the mean scores across three domains can be noted between the bottom quarter and upper quarter. This suggests that those Filipino Grade 5 students whose schools had more issues hindering their capacity were more likely to have lower mean scores than those whose schools had lesser issues hindering their capacity. This means that providing solutions to these issues hindering school’s capacity could lead to better academic performance of the students.
5.3.3 Perception of issues affecting children’s learning in the classroom
Children
The student questionnaire asked children how often their teachers came to class late, how often their teachers had to wait a long time for children to quiet down, and how often teachers were absent. Possible responses were often, sometimes, rarely, or never. The percentage distribution of their responses (“often” or “sometimes) is shown in Figure 34. It can be noted that majority of the Filipino Grade 5 students (64.9%) mentioned that their teachers sometimes to often had to wait a long time for the students to quiet down. More than half (58.1%) as well indicated that their teachers were sometimes to often late in class. About 4 in 10 Filipino Grade 5 students responded that their teachers came to class late sometimes to often. These practices need to be changed to improve teacher’s effectiveness and the time available for learning.
Figure 34.Percentage Distribution of Students who indicated teacher classroom-related issues as occurring “often” or “sometimes”
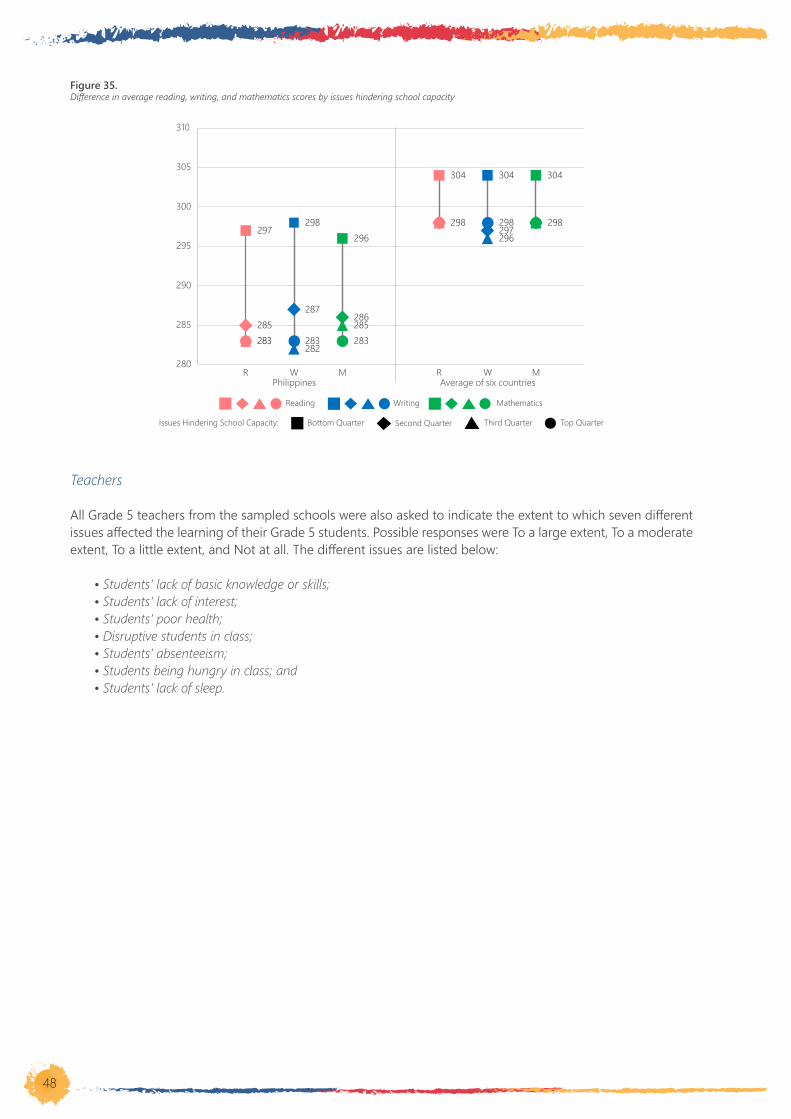
48
297
285283283
298
287
282283
296
286285283
304
298
304
297296298
304
298
280
285
290
295
300
305
310
Top QuarterBottom Quarter
Reading Writing Mathematics
Philippines Average of six countries
Second Quarter Third Quarter
R W M R W M
Issues Hindering School Capacity:
Figure 35.Difference in average reading, writing, and mathematics scores by issues hindering school capacity
Teachers
All Grade 5 teachers from the sampled schools were also asked to indicate the extent to which seven different issues affected the learning of their Grade 5 students. Possible responses were To a large extent, To a moderate extent, To a little extent, and Not at all. The different issues are listed below:
• Students’ lack of basic knowledge or skills;• Students’ lack of interest;• Students’ poor health;• Disruptive students in class;• Students’ absenteeism;• Students being hungry in class; and• Students’ lack of sleep.
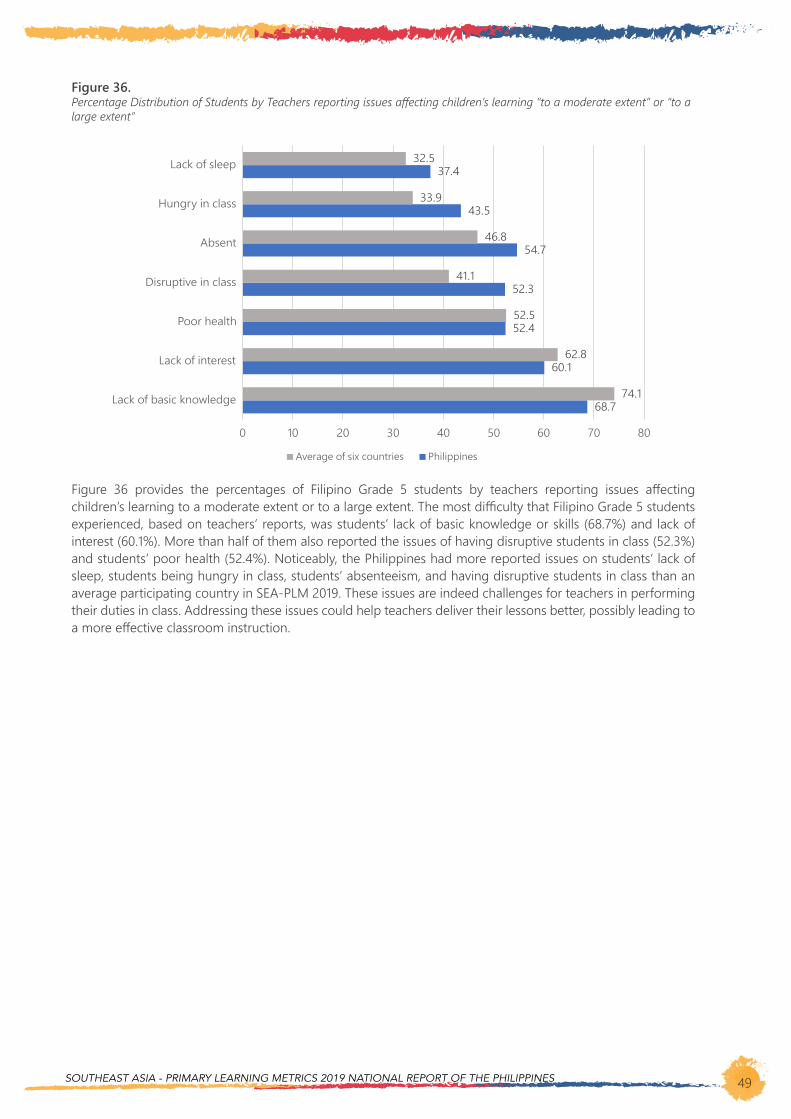
SOUTHEAST ASIA - PRIMARY LEARNING METRICS 2019 NATIONAL REPORT OF THE PHILIPPINES 49
Figure 36 provides the percentages of Filipino Grade 5 students by teachers reporting issues affecting children’s learning to a moderate extent or to a large extent. The most difficulty that Filipino Grade 5 students experienced, based on teachers’ reports, was students’ lack of basic knowledge or skills (68.7%) and lack of interest (60.1%). More than half of them also reported the issues of having disruptive students in class (52.3%) and students’ poor health (52.4%). Noticeably, the Philippines had more reported issues on students’ lack of sleep, students being hungry in class, students’ absenteeism, and having disruptive students in class than an average participating country in SEA-PLM 2019. These issues are indeed challenges for teachers in performing their duties in class. Addressing these issues could help teachers deliver their lessons better, possibly leading to a more effective classroom instruction.
Figure 36.Percentage Distribution of Students by Teachers reporting issues affecting children’s learning “to a moderate extent” or “to a large extent”
68.7
60.1
52.4
52.3
54.7
43.5
37.4
74.1
62.8
52.5
41.1
46.8
33.9
32.5
0 10 20 30 40 50 60 70 80
Lack of basic knowledge
Lack of interest
Poor health
Disruptive in class
Absent
Hungry in class
Lack of sleep
Average of six countries Philippines

SOUTHEAST ASIA - PRIMARY LEARNING METRICS 2019 NATIONAL REPORT OF THE PHILIPPINES 51
6.1 How does SEA-PLM Assess Global Citizenship?
GC is a relatively new concept that expands the notion of citizenship beyond the boundaries of state with the implication that there are multiple issues that connect us as citizens of the globe. While the international definition is yet to confirm, UNESCO (2013) generally described GC as a sense of global belonging, solidarity, and collective identity; a non-legal status beyond the state.
In SEA-PLM Assessment, GC aims to assess the students’ attitudes and values relating to GC content that is deemed appropriate and accessible to Grade 5 students in any given SEA-PLM cycle. Recognizing that Grade 5 students form part of global citizens, would appreciate, and understand the interconnectedness of all life on the planet. They may act and relate to others with this understanding to make the whole world a more peaceful, just, safe, and sustainable place.
The GC framework is composed of three (3) different content sub-domains: cognitive aspect; socio-economic aspect and behavioral aspect. The content sub-domains are assessed using the three (3) measurement sub-domains: attitudes and values; behaviors and skills; and knowledge and understanding. Detailed descriptions of the said sub-domains are summarized in Table 15.
Table 15.Global Citizenship Assessment Framework.
GC sub-domain Description
Cognitive Aspect
Socio-economic Aspect
Behavioral Aspect
Gained through learning about global structures, systems and issues
Reflected on the positive orientations to global citizenship conceptssuch as appreciation of diversity, equality, peace, and human rights.
Related to activities that create positive change and foster socialparticipation.
Items for GC were included in Student Contextual Questionnaire and were administered to sample Grade 5 students only. Students were given 20-30 minutes to accomplish the Student Contextual Questionnaire with GC Items.
In this section, the responses of students regarding different dimensions of GC were measured, such as their level of exposure to GC topics, the topics they deemed to be important to learn, their agreement to different societal and identity statements, and environmental issues they are concerned about. Aside from this, this section also presents the children’s participation and willingness to participate in different GC activities. The responses of the teachers about their capability in teaching GC topics are also presented. Lastly, the various dimensions of GC of students were summarized into indexes and were compared by gender, type of community, and type of school.
SECTION 6:
CHILDREN’S PERCEPTION OFGLOBAL CITIZENSHIP EDUCATION
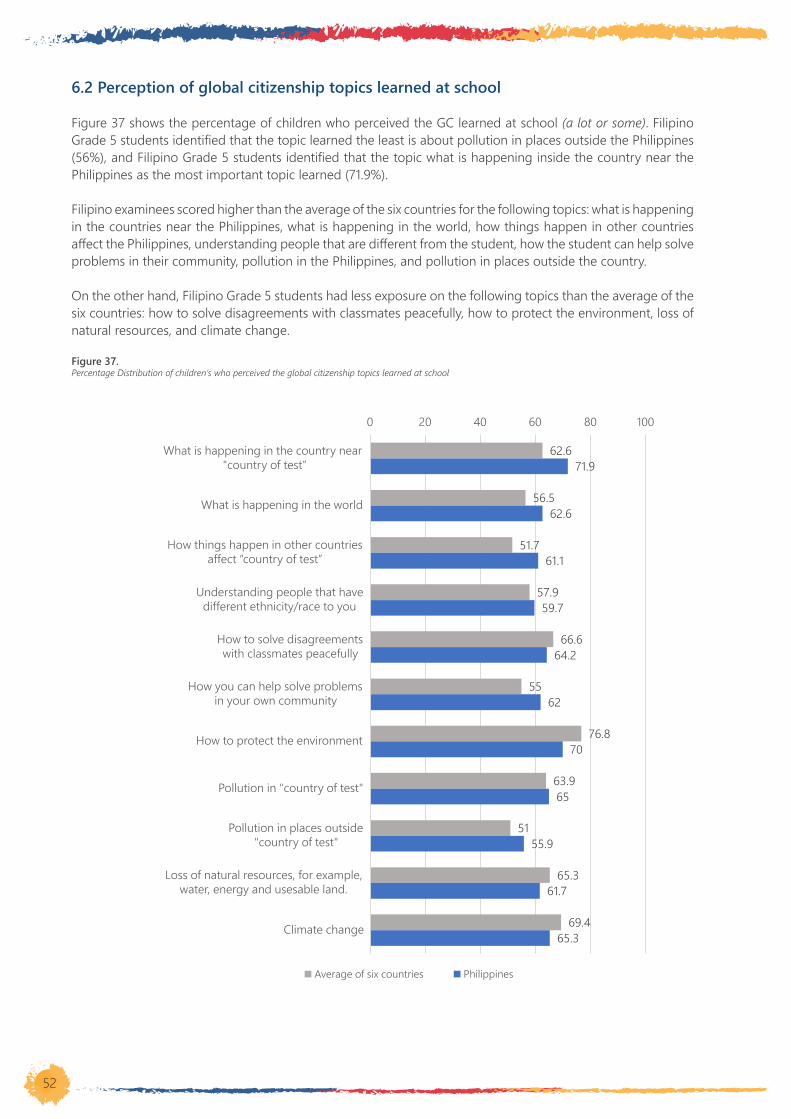
52
6.2 Perception of global citizenship topics learned at school
Figure 37 shows the percentage of children who perceived the GC learned at school (a lot or some). Filipino Grade 5 students identified that the topic learned the least is about pollution in places outside the Philippines (56%), and Filipino Grade 5 students identified that the topic what is happening inside the country near the Philippines as the most important topic learned (71.9%).
Filipino examinees scored higher than the average of the six countries for the following topics: what is happening in the countries near the Philippines, what is happening in the world, how things happen in other countries affect the Philippines, understanding people that are different from the student, how the student can help solve problems in their community, pollution in the Philippines, and pollution in places outside the country.
On the other hand, Filipino Grade 5 students had less exposure on the following topics than the average of the six countries: how to solve disagreements with classmates peacefully, how to protect the environment, loss of natural resources, and climate change.
Figure 37.Percentage Distribution of children’s who perceived the global citizenship topics learned at school
62.6
56.5
51.7
57.9
66.6
55
76.8
63.9
51
65.3
69.4
71.9
62.6
61.1
59.7
64.2
62
70
65
55.9
61.7
65.3
0 20 40 60 80 100
What is happening in the country near "country of test”
What is happening in the world
How things happen in other countriesaffect “country of test”
Understanding people that havedifferent ethnicity/race to you
How to solve disagreementswith classmates peacefully
How you can help solve problemsin your own community
How to protect the environment
Pollution in "country of test"
Pollution in places outside"country of test"
Loss of natural resources, for example,water, energy and usesable land.
Climate change
Average of six countries Philippines
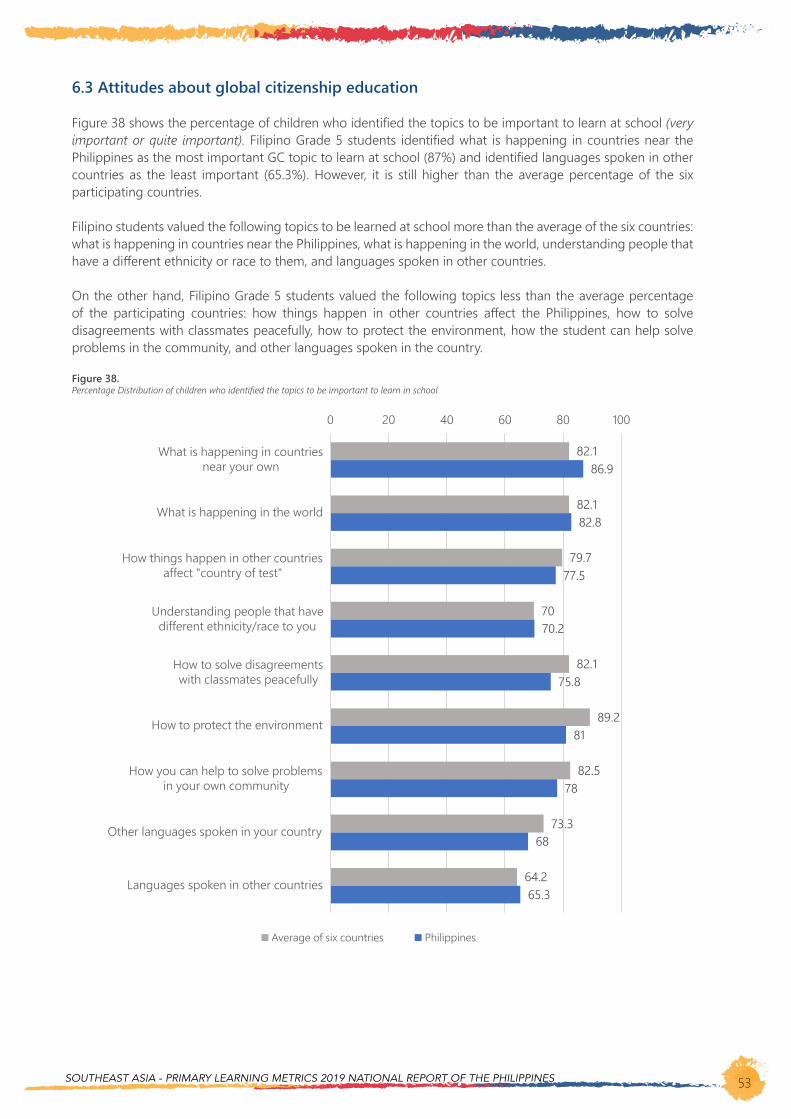
SOUTHEAST ASIA - PRIMARY LEARNING METRICS 2019 NATIONAL REPORT OF THE PHILIPPINES 53
6.3 Attitudes about global citizenship education
Figure 38 shows the percentage of children who identified the topics to be important to learn at school (very important or quite important). Filipino Grade 5 students identified what is happening in countries near the Philippines as the most important GC topic to learn at school (87%) and identified languages spoken in other countries as the least important (65.3%). However, it is still higher than the average percentage of the six participating countries.
Filipino students valued the following topics to be learned at school more than the average of the six countries: what is happening in countries near the Philippines, what is happening in the world, understanding people that have a different ethnicity or race to them, and languages spoken in other countries.
On the other hand, Filipino Grade 5 students valued the following topics less than the average percentage of the participating countries: how things happen in other countries affect the Philippines, how to solve disagreements with classmates peacefully, how to protect the environment, how the student can help solve problems in the community, and other languages spoken in the country.
Figure 38.Percentage Distribution of children who identified the topics to be important to learn in school
82.1
82.1
79.7
70
82.1
89.2
82.5
73.3
64.2
86.9
82.8
77.5
70.2
75.8
81
78
68
65.3
0 20 40 60 80 100
What is happening in countriesnear your own
What is happening in the world
How things happen in other countriesaffect "country of test"
Understanding people that havedifferent ethnicity/race to you
How to solve disagreementswith classmates peacefully
How to protect the environment
How you can help to solve problemsin your own community
Other languages spoken in your country
Languages spoken in other countries
Average of six countries Philippines
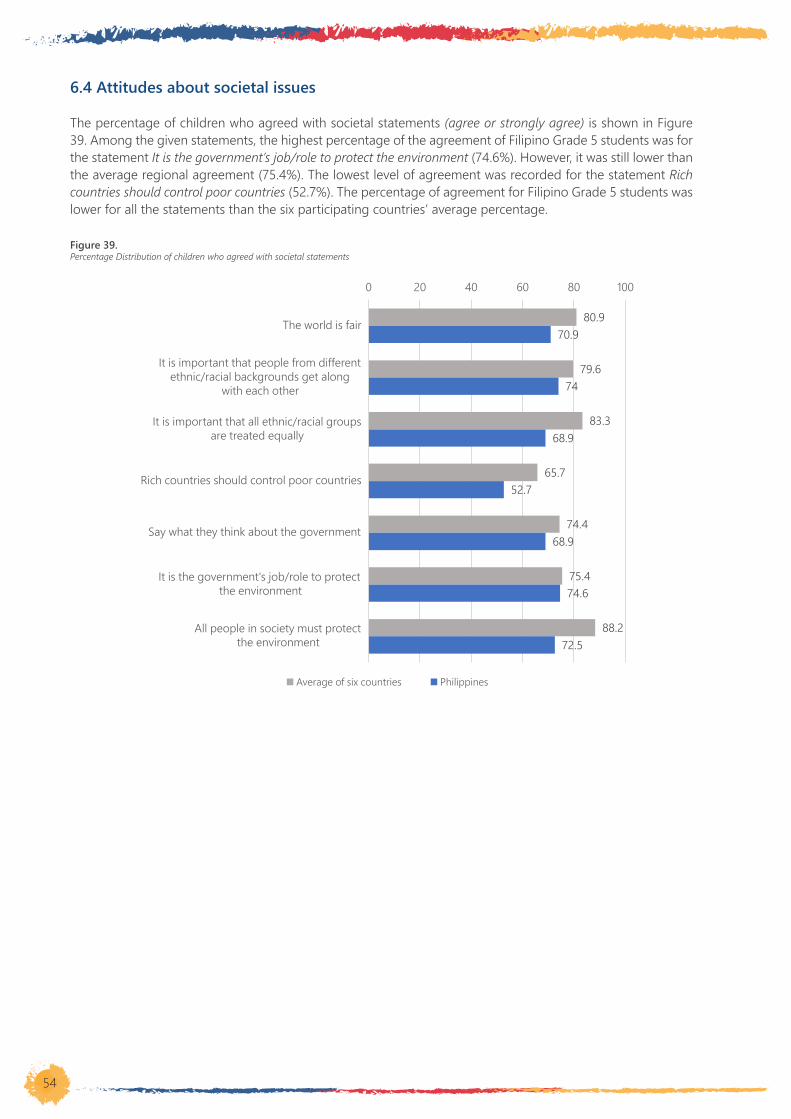
54
6.4 Attitudes about societal issues
The percentage of children who agreed with societal statements (agree or strongly agree) is shown in Figure 39. Among the given statements, the highest percentage of the agreement of Filipino Grade 5 students was for the statement It is the government’s job/role to protect the environment (74.6%). However, it was still lower than the average regional agreement (75.4%). The lowest level of agreement was recorded for the statement Rich countries should control poor countries (52.7%). The percentage of agreement for Filipino Grade 5 students was lower for all the statements than the six participating countries’ average percentage.
Figure 39.Percentage Distribution of children who agreed with societal statements
80.9
79.6
83.3
65.7
74.4
75.4
88.2
70.9
74
68.9
52.7
68.9
74.6
72.5
0 20 40 60 80 100
The world is fair
It is important that people from differentethnic/racial backgrounds get along
with each other
It is important that all ethnic/racial groupsare treated equally
Rich countries should control poor countries
Say what they think about the government
It is the government's job/role to protectthe environment
All people in society must protectthe environment
Average of six countries Philippines
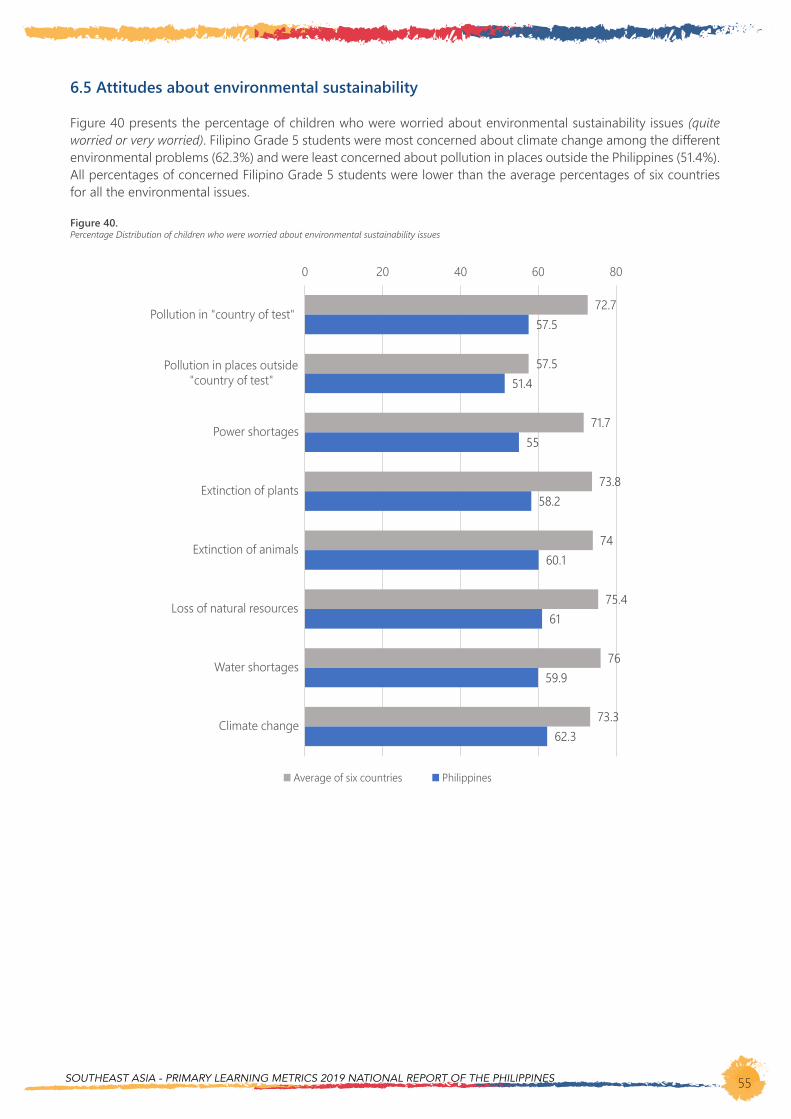
SOUTHEAST ASIA - PRIMARY LEARNING METRICS 2019 NATIONAL REPORT OF THE PHILIPPINES 55
6.5 Attitudes about environmental sustainability
Figure 40 presents the percentage of children who were worried about environmental sustainability issues (quite worried or very worried). Filipino Grade 5 students were most concerned about climate change among the different environmental problems (62.3%) and were least concerned about pollution in places outside the Philippines (51.4%). All percentages of concerned Filipino Grade 5 students were lower than the average percentages of six countries for all the environmental issues.
Figure 40.Percentage Distribution of children who were worried about environmental sustainability issues
72.7
57.5
71.7
73.8
74
75.4
76
73.3
57.5
51.4
55
58.2
60.1
61
59.9
62.3
0 20 40 60 80
Pollution in "country of test"
Pollution in places outside"country of test"
Power shortages
Extinction of plants
Extinction of animals
Loss of natural resources
Water shortages
Climate change
Average of six countries Philippines

56
6.6 Attitudes about national and regional identity
The percentage of children who agreed with identity statements is presented in Figure 41. Among the statements about national and regional identity, most Filipino Grade 5 students agreed that they feel belonged in their own country (86.7%).
On the other hand, among the statements, Filipino Grade 5 students had the lowest agreement for the statement about feeling that they had a lot in common with children in the world outside Asia (49.7%). Filipino students had a higher level of agreement for all the statements except for I feel I have a lot in common with other children in the Philippines.
Figure 41.Percentage Distribution of children who agreed with identity statements
81.8
58.7
58.2
75.6
54
47.3
86.7
59.1
62.5
71.9
55.1
49.7
0 20 40 60 80 100
I feel I belong to "country of test"
I think of myself as Asian
I feel connected to the rest of the world
I feel I have a lot in common with otherchildren in"country of test"
I feel I have a lot in common with otherchildren in Asia
I feel I have a lot in common with childrenin the world outside Asia
Average of six countries Philippines
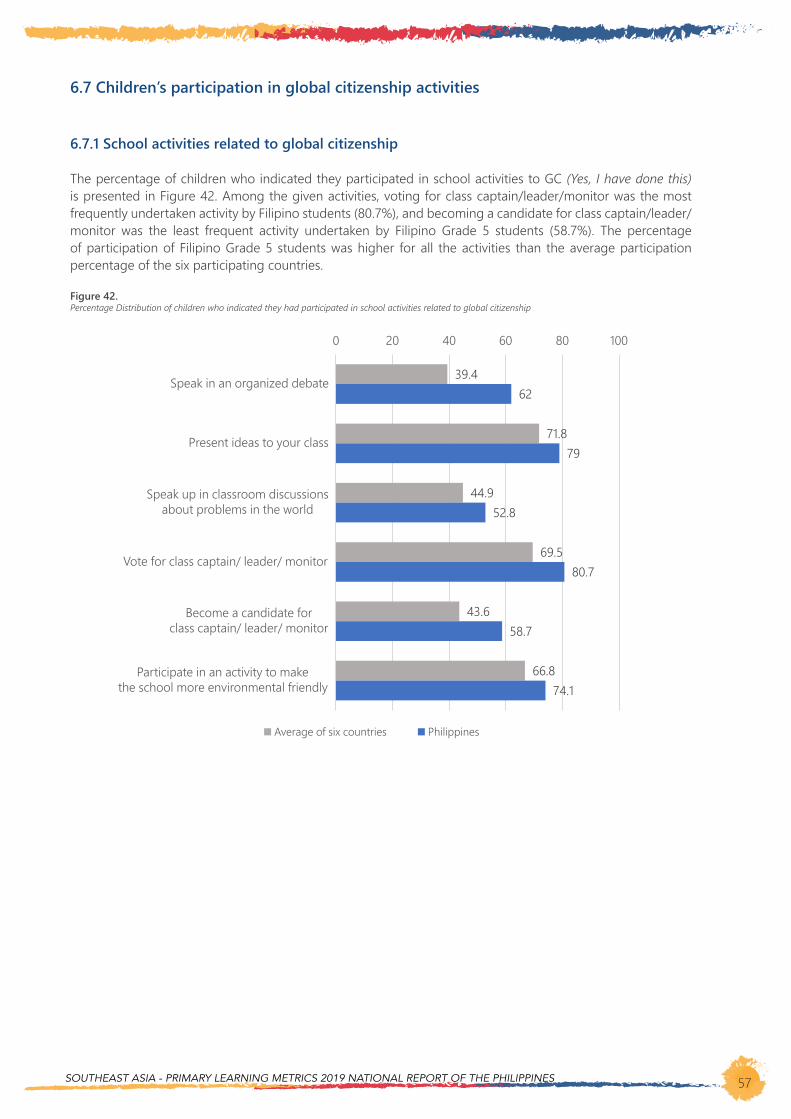
SOUTHEAST ASIA - PRIMARY LEARNING METRICS 2019 NATIONAL REPORT OF THE PHILIPPINES 57
6.7 Children’s participation in global citizenship activities
6.7.1 School activities related to global citizenship
The percentage of children who indicated they participated in school activities to GC (Yes, I have done this) is presented in Figure 42. Among the given activities, voting for class captain/leader/monitor was the most frequently undertaken activity by Filipino students (80.7%), and becoming a candidate for class captain/leader/monitor was the least frequent activity undertaken by Filipino Grade 5 students (58.7%). The percentage of participation of Filipino Grade 5 students was higher for all the activities than the average participation percentage of the six participating countries.
Figure 42.Percentage Distribution of children who indicated they had participated in school activities related to global citizenship
39.4
71.8
44.9
69.5
43.6
66.8
62
79
52.8
80.7
58.7
74.1
0 20 40 60 80 100
Speak in an organized debate
Present ideas to your class
Speak up in classroom discussionsabout problems in the world
Vote for class captain/ leader/ monitor
Become a candidate forclass captain/ leader/ monitor
Participate in an activity to makethe school more environmental friendly
Average of six countries Philippines

58
6.7.2 General activities related to global citizenship
Figure 43 shows the percentage of children who were willing to participate in activities related to GC (I will do this or I might do this). The activity with the highest percentage of Filipino students who stated that they were likely to do was to help other people in the community (81%). Additionally, the activity with the least percentage was to stand up for a classmate who was being badly treated by other students (69.7%). It is important to note that all of the activities had a lower percentage than the average percentage of the six countries except for the activity to make friends with someone from another country.
Figure 43.Percentage Distribution of children who were willing to participate in activities related to global citizenship
8181
77
84.7
69.1
83.1
83.5
78.6
69.7
81
74
77.6
78.8
0 20 40 60 80 100
Tell someone who is littering to stop
Stand up for a classmate who isbeing badly treated by other students
Help other people in your community
Make friends with someonefrom another country
Encourage other peopleto help protect the environment
Join a group to help protectthe environment
Average of six countries Philippines
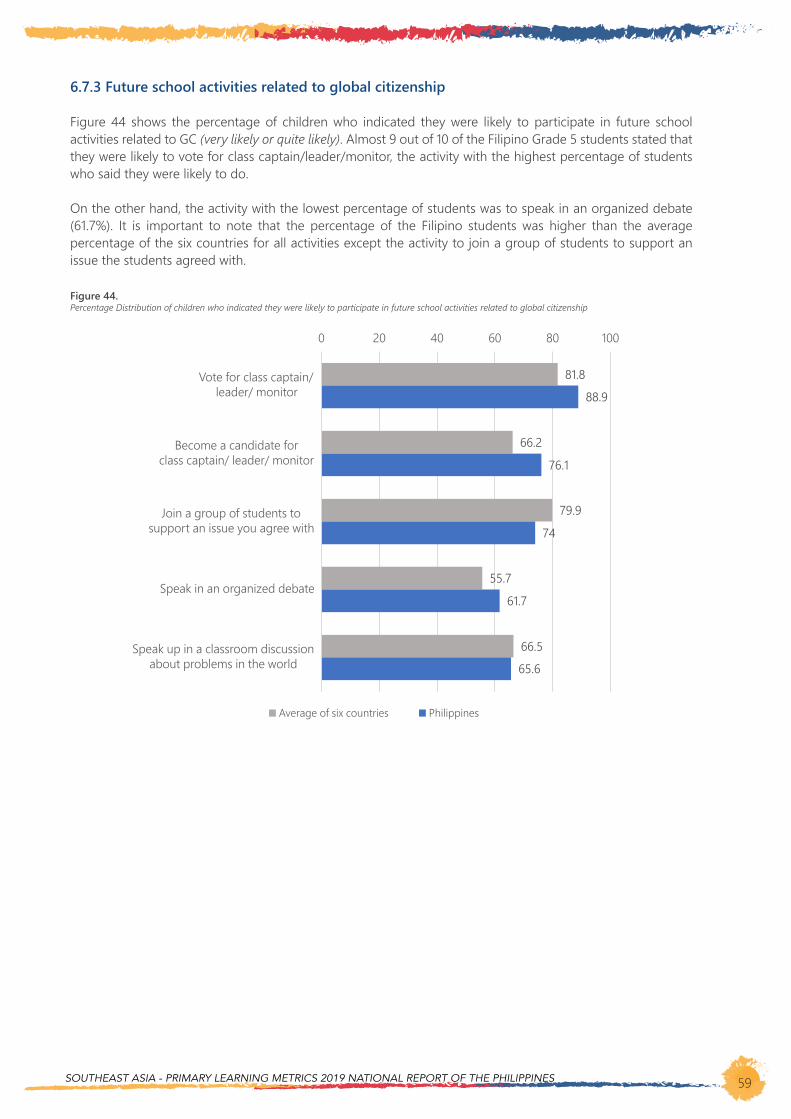
SOUTHEAST ASIA - PRIMARY LEARNING METRICS 2019 NATIONAL REPORT OF THE PHILIPPINES 59
6.7.3 Future school activities related to global citizenship
Figure 44 shows the percentage of children who indicated they were likely to participate in future school activities related to GC (very likely or quite likely). Almost 9 out of 10 of the Filipino Grade 5 students stated that they were likely to vote for class captain/leader/monitor, the activity with the highest percentage of students who said they were likely to do.
On the other hand, the activity with the lowest percentage of students was to speak in an organized debate (61.7%). It is important to note that the percentage of the Filipino students was higher than the average percentage of the six countries for all activities except the activity to join a group of students to support an issue the students agreed with.
Figure 44.Percentage Distribution of children who indicated they were likely to participate in future school activities related to global citizenship
81.8
66.2
79.9
55.7
66.5
88.9
76.1
74
61.7
65.6
0 20 40 60 80 100
Vote for class captain/leader/ monitor
Become a candidate forclass captain/ leader/ monitor
Join a group of students tosupport an issue you agree with
Speak in an organized debate
Speak up in a classroom discussionabout problems in the world
Average of six countries Philippines
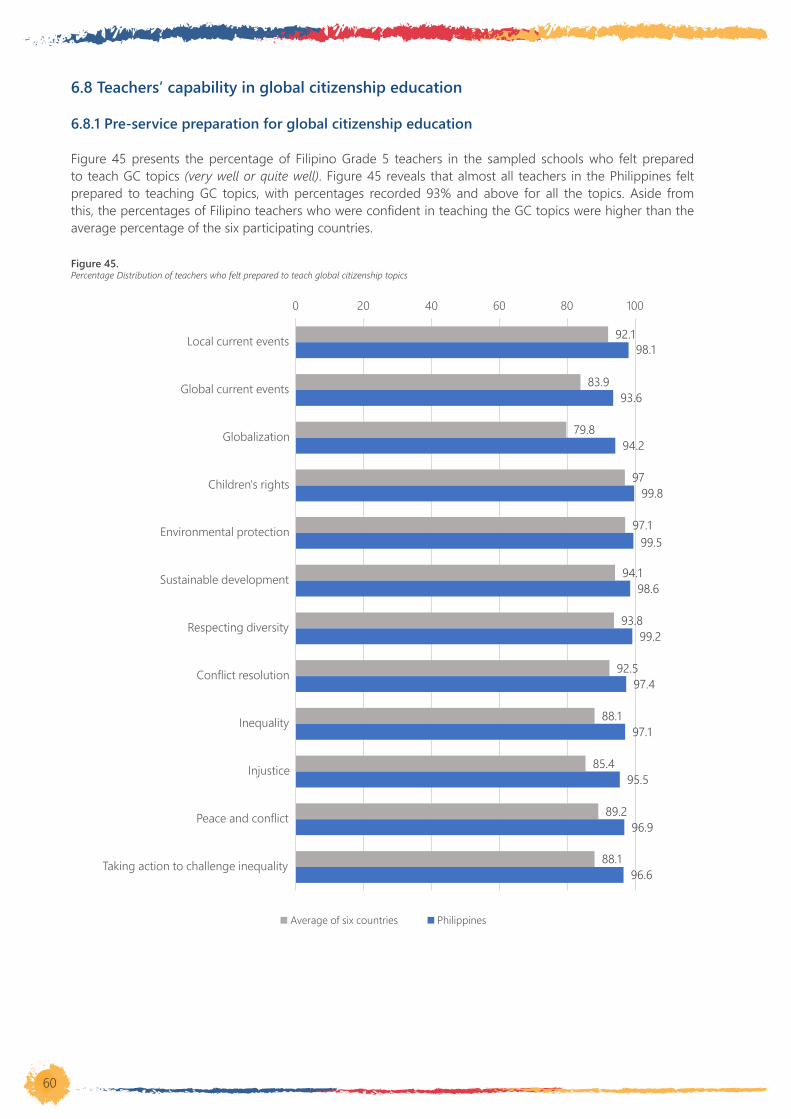
60
6.8 Teachers’ capability in global citizenship education
6.8.1 Pre-service preparation for global citizenship education
Figure 45 presents the percentage of Filipino Grade 5 teachers in the sampled schools who felt prepared to teach GC topics (very well or quite well). Figure 45 reveals that almost all teachers in the Philippines felt prepared to teaching GC topics, with percentages recorded 93% and above for all the topics. Aside from this, the percentages of Filipino teachers who were confident in teaching the GC topics were higher than the average percentage of the six participating countries.
Figure 45.Percentage Distribution of teachers who felt prepared to teach global citizenship topics
92.1
83.9
79.8
97
97.1
94.1
93.8
92.5
88.1
85.4
89.2
88.1
98.1
93.6
94.2
99.8
99.5
98.6
99.2
97.4
97.1
95.5
96.9
96.6
0 20 40 60 80 100
Local current events
Global current events
Globalization
Children's rights
Environmental protection
Sustainable development
Respecting diversity
Conflict resolution
Inequality
Injustice
Peace and conflict
Taking action to challenge inequality
Average of six countries Philippines
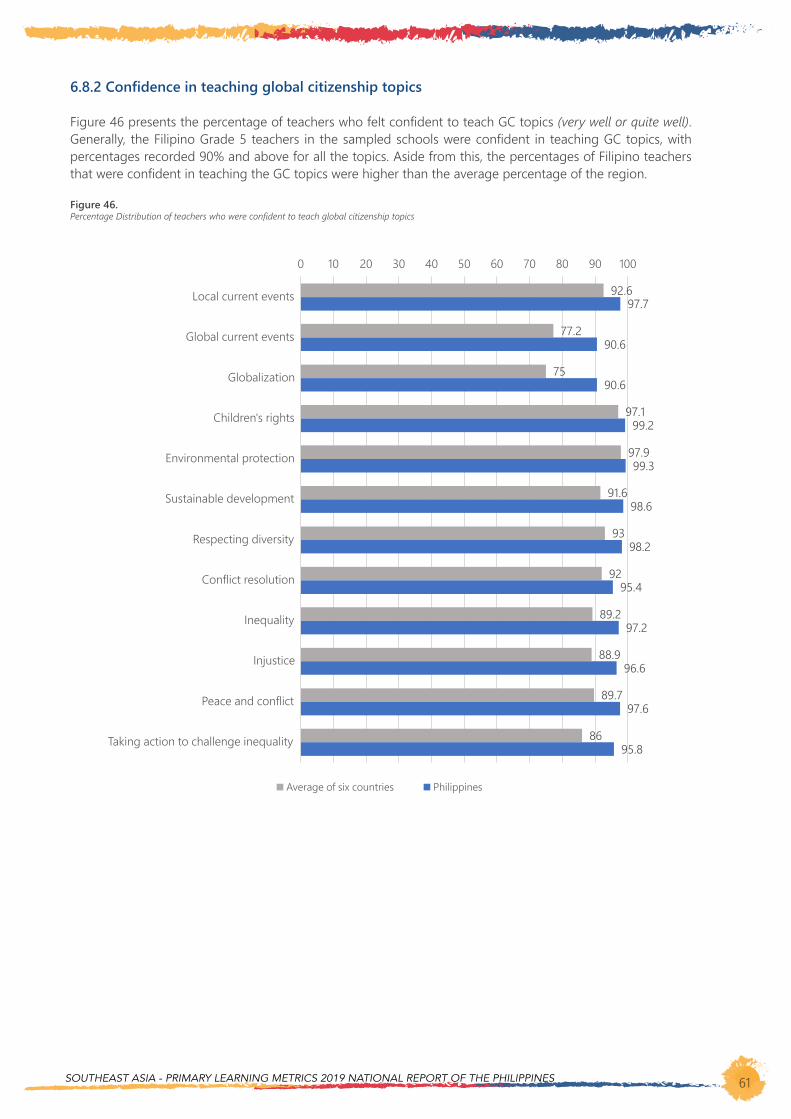
SOUTHEAST ASIA - PRIMARY LEARNING METRICS 2019 NATIONAL REPORT OF THE PHILIPPINES 61
6.8.2 Confidence in teaching global citizenship topics
Figure 46 presents the percentage of teachers who felt confident to teach GC topics (very well or quite well). Generally, the Filipino Grade 5 teachers in the sampled schools were confident in teaching GC topics, with percentages recorded 90% and above for all the topics. Aside from this, the percentages of Filipino teachers that were confident in teaching the GC topics were higher than the average percentage of the region.
Figure 46.Percentage Distribution of teachers who were confident to teach global citizenship topics
92.6
77.2
75
97.1
97.9
91.6
93
92
89.2
88.9
89.7
86
97.7
90.6
90.6
99.2
99.3
98.6
98.2
95.4
97.2
96.6
97.6
95.8
0 10 20 30 40 50 60 70 80 90 100
Local current events
Global current events
Globalization
Children's rights
Environmental protection
Sustainable development
Respecting diversity
Conflict resolution
Inequality
Injustice
Peace and conflict
Taking action to challenge inequality
Average of six countries Philippines

62
6.9 Teachers’ perception of global citizenship education
6.9.1 Attitudes about children’s global citizenship skills, values, and characteristics
The percentages of Filipino Grade 5 teachers who considered that children’s GC skills, values, and characteristics were important (very important or quite important) are presented in Figure 47. Almost all Filipino Grade 5 teachers in the sampled schools thought that children’s GC skills, values, and characteristics were important. Like the previous two categories, the percentages of teachers who believed that GC skills, values, and characteristics were important were higher than the average percentages of the six participating countries.
Figure 47.Percentage Distribution of teachers who considered that children’s global citizenship skills, values and characteristics are important
96.1
93.4
84.6
95
94.3
93.6
98.6
95.1
94.6
92.2
90
87.4
98.1
97.5
93.1
98.5
97.8
97.7
99.5
95.7
96
98.7
97.9
96.7
75 80 85 90 95 100
Feeling connected to other peopleoutside their family, community, or country
Being interested in the world
Caring about the problems of peopleoutside their community or country
Wanting to make the world a better place
Acting to make the world a better place
Encouraging others to actto make the world a better place
Thinking that all people should betreated equally
Willing to challenge injustice
Acting to address inequality
Accepting that people are different
Seeing how local problems have globalconsequences
Valuing traditional histories and culturesother than their own
Average of six countries Philippines
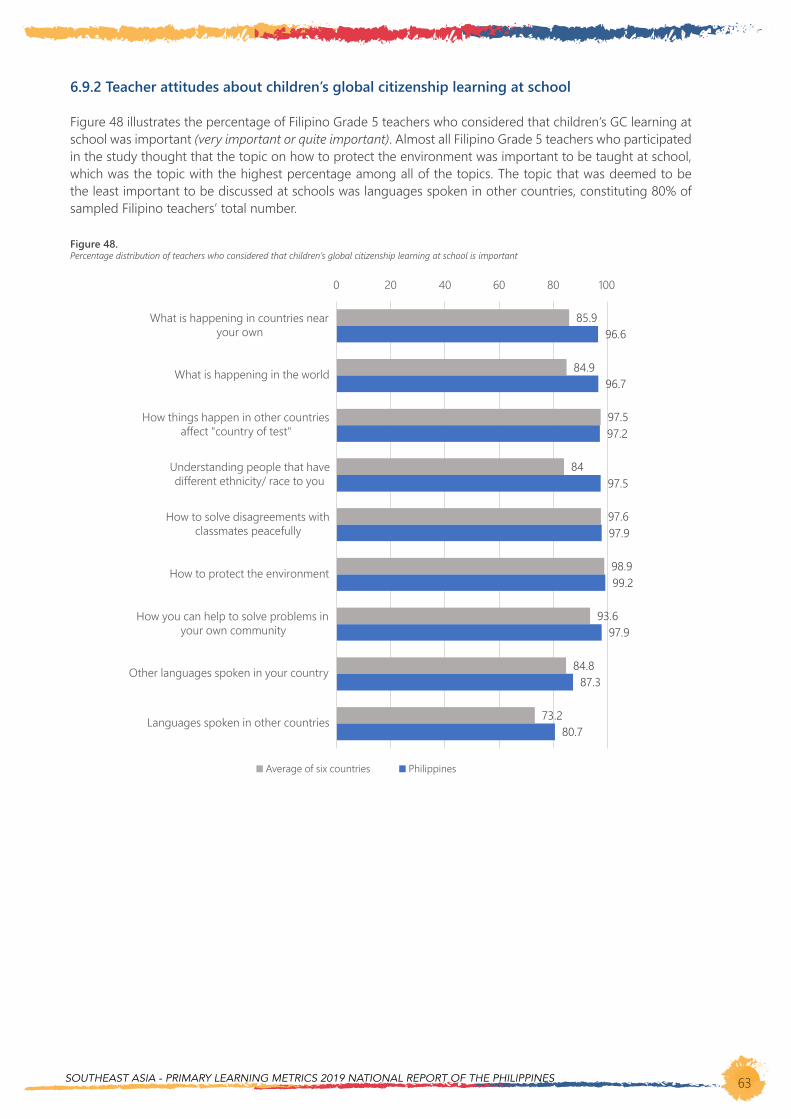
SOUTHEAST ASIA - PRIMARY LEARNING METRICS 2019 NATIONAL REPORT OF THE PHILIPPINES 63
6.9.2 Teacher attitudes about children’s global citizenship learning at school
Figure 48 illustrates the percentage of Filipino Grade 5 teachers who considered that children’s GC learning at school was important (very important or quite important). Almost all Filipino Grade 5 teachers who participated in the study thought that the topic on how to protect the environment was important to be taught at school, which was the topic with the highest percentage among all of the topics. The topic that was deemed to be the least important to be discussed at schools was languages spoken in other countries, constituting 80% of sampled Filipino teachers’ total number.
Figure 48.Percentage distribution of teachers who considered that children’s global citizenship learning at school is important
85.9
84.9
97.5
84
97.6
98.9
93.6
84.8
73.2
96.6
96.7
97.2
97.5
97.9
99.2
97.9
87.3
80.7
0 20 40 60 80 100
What is happening in countries nearyour own
What is happening in the world
How things happen in other countriesaffect "country of test"
Understanding people that havedifferent ethnicity/ race to you
How to solve disagreements withclassmates peacefully
How to protect the environment
How you can help to solve problems inyour own community
Other languages spoken in your country
Languages spoken in other countries
Average of six countries Philippines
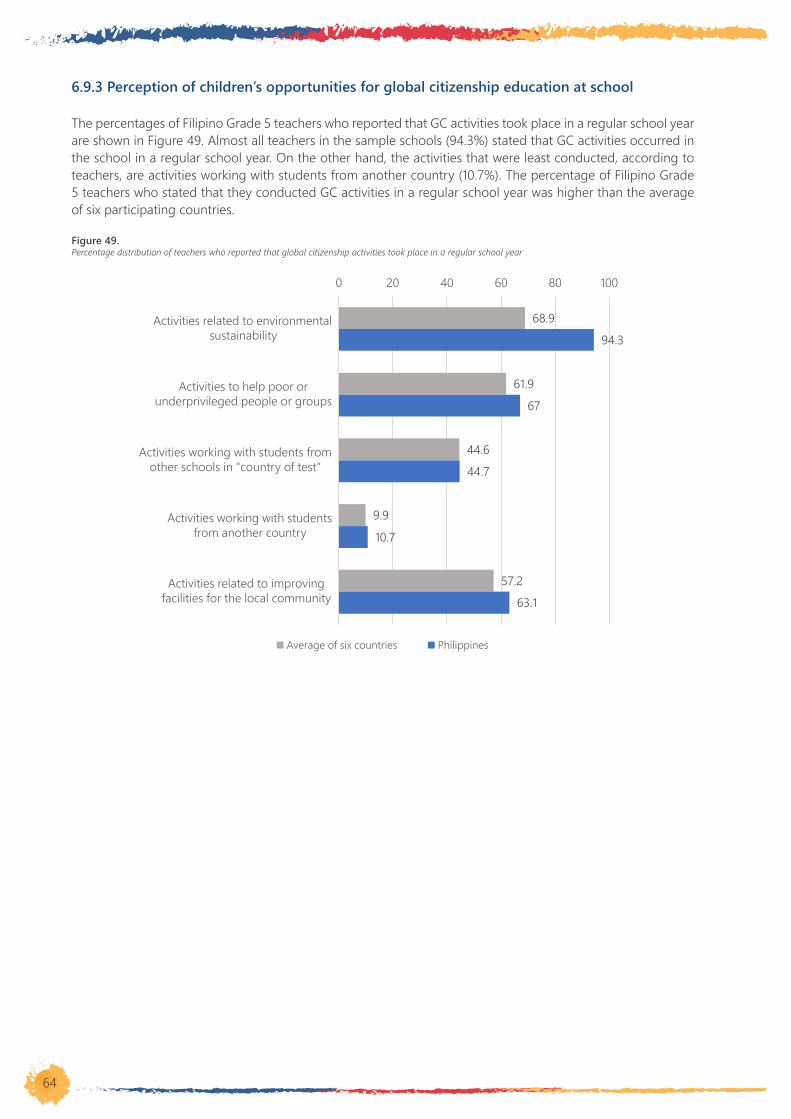
64
6.9.3 Perception of children’s opportunities for global citizenship education at school
The percentages of Filipino Grade 5 teachers who reported that GC activities took place in a regular school year are shown in Figure 49. Almost all teachers in the sample schools (94.3%) stated that GC activities occurred in the school in a regular school year. On the other hand, the activities that were least conducted, according to teachers, are activities working with students from another country (10.7%). The percentage of Filipino Grade 5 teachers who stated that they conducted GC activities in a regular school year was higher than the average of six participating countries.
Figure 49.Percentage distribution of teachers who reported that global citizenship activities took place in a regular school year
68.9
61.9
44.6
9.9
57.2
94.3
67
44.7
10.7
63.1
0 20 40 60 80 100
Activities related to environmentalsustainability
Activities to help poor orunderprivileged people or groups
Activities working with students fromother schools in "country of test"
Activities working with studentsfrom another country
Activities related to improvingfacilities for the local community
Average of six countries Philippines
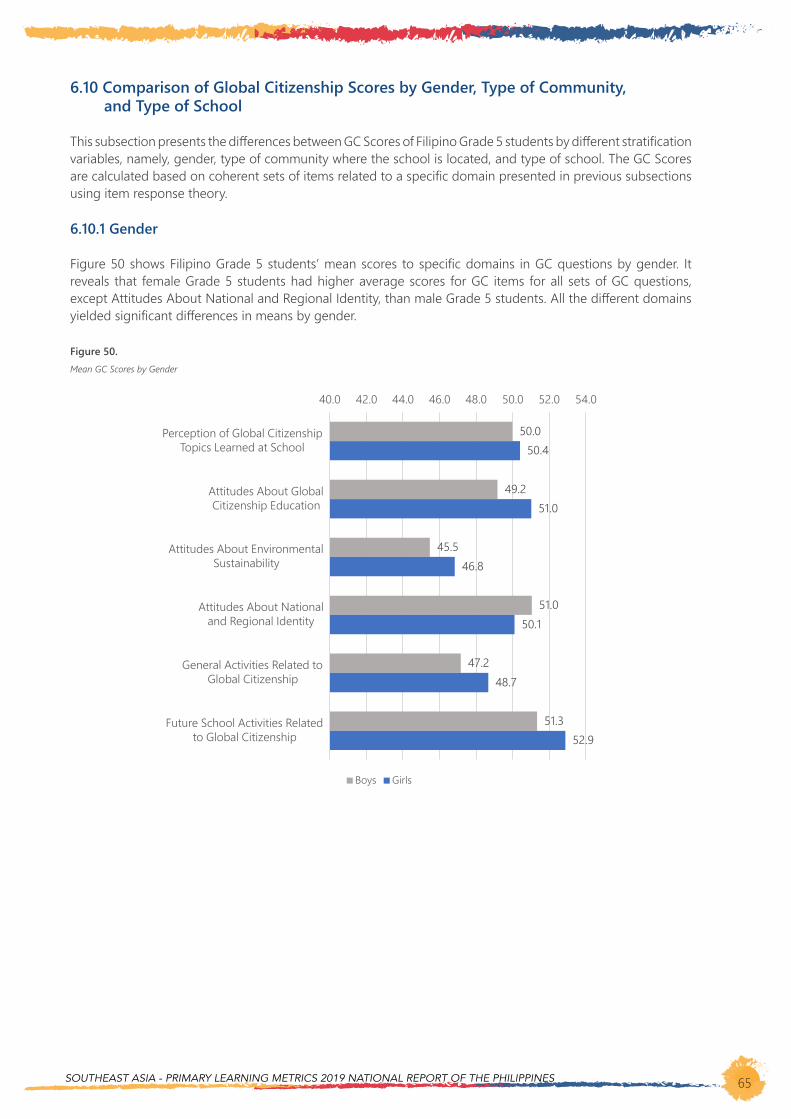
SOUTHEAST ASIA - PRIMARY LEARNING METRICS 2019 NATIONAL REPORT OF THE PHILIPPINES 65
6.10 Comparison of Global Citizenship Scores by Gender, Type of Community, and Type of School
This subsection presents the differences between GC Scores of Filipino Grade 5 students by different stratification variables, namely, gender, type of community where the school is located, and type of school. The GC Scores are calculated based on coherent sets of items related to a specific domain presented in previous subsections using item response theory.
6.10.1 Gender
Figure 50 shows Filipino Grade 5 students’ mean scores to specific domains in GC questions by gender. It reveals that female Grade 5 students had higher average scores for GC items for all sets of GC questions, except Attitudes About National and Regional Identity, than male Grade 5 students. All the different domains yielded significant differences in means by gender.
Figure 50.Mean GC Scores by Gender
50.0
49.2
45.5
51.0
47.2
51.3
50.4
51.0
46.8
50.1
48.7
52.9
40.0 42.0 44.0 46.0 48.0 50.0 52.0 54.0
Perception of Global CitizenshipTopics Learned at School
Attitudes About GlobalCitizenship Education
Attitudes About EnvironmentalSustainability
Attitudes About Nationaland Regional Identity
General Activities Related toGlobal Citizenship
Future School Activities Relatedto Global Citizenship
Boys Girls
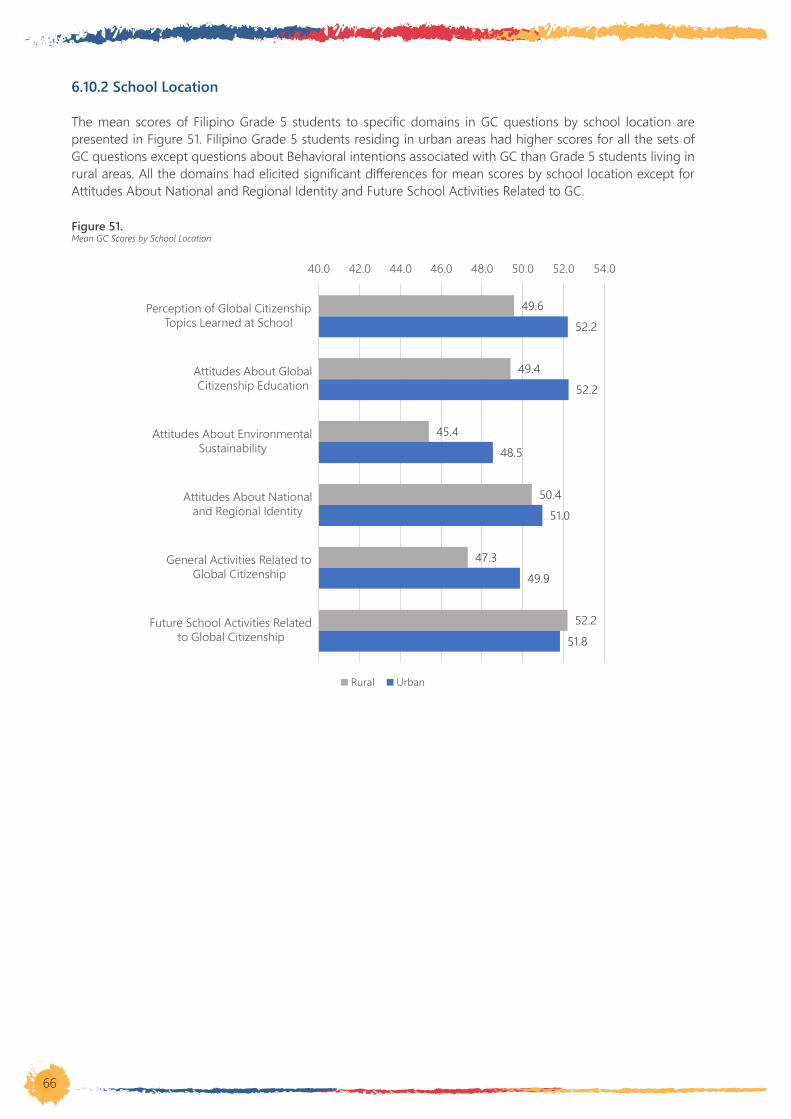
66
6.10.2 School Location
The mean scores of Filipino Grade 5 students to specific domains in GC questions by school location are presented in Figure 51. Filipino Grade 5 students residing in urban areas had higher scores for all the sets of GC questions except questions about Behavioral intentions associated with GC than Grade 5 students living in rural areas. All the domains had elicited significant differences for mean scores by school location except for Attitudes About National and Regional Identity and Future School Activities Related to GC.
Figure 51.Mean GC Scores by School Location
49.6
49.4
45.4
50.4
47.3
52.2
52.2
52.2
48.5
51.0
49.9
51.8
40.0 42.0 44.0 46.0 48.0 50.0 52.0 54.0
Perception of Global CitizenshipTopics Learned at School
Attitudes About GlobalCitizenship Education
Attitudes About EnvironmentalSustainability
Attitudes About Nationaland Regional Identity
General Activities Related toGlobal Citizenship
Future School Activities Relatedto Global Citizenship
Rural Urban

SOUTHEAST ASIA - PRIMARY LEARNING METRICS 2019 NATIONAL REPORT OF THE PHILIPPINES 67
6.10.3 School Management
Figure 52 presents Filipino Grade 5 students’ mean scores to specific domains in GC questions by school management. Grade 5 students from private schools achieved higher mean scores than Grade 5 students from public schools for all the sets of GC items, except for the set of questions that measures Behavioral intentions associated with GC. All domains, except Attitudes About National and Regional Identity, and Future School Activities Related to GC, yielded a significant difference in means scores by school management.
Figure 52.Mean GC Scores by Type of School Management
Perception of Global CitizenshipTopics Learned at School
Attitudes About GlobalCitizenship Education
Attitudes About EnvironmentalSustainability
Attitudes About Nationaland Regional Identity
General Activities Related toGlobal Citizenship
Future School Activities Relatedto Global Citizenship
49.7
49.5
45.5
50.5
47.4
52.2
54.2
55.2
51.5
51.4
52.5
51.4
0.0 20.0 40.0 60.0
Public Private
SOUTHEAST ASIA - PRIMARY LEARNING METRICS 2019 NATIONAL REPORT OF THE PHILIPPINES 69
The Philippines’ participation in large-scale assessments such as SEA-PLM 2019 is indeed another huge step in globalizing the quality of basic education in the country. The Philippines’ performance in SEA-PLM 2019 provides its stakeholders with the current status of what Grade 5 students can and cannot do in reading, writing, and mathematics. When aligned with SDG 4.1.1, a large proportion of Filipino Grade 5 students did not meet the minimum proficiency level in reading and mathematics literacy. More importantly, a substantial number of Filipino Grade 5 students did not even meet the minimum proficiency level at the end of lower primary (Grade 4) both in reading and mathematics literacy. Compared with other participating countries in SEA-PLM 2019, the Philippines performed below the regional average in all three domains. The goal that every Filipino child is ready for the 21st century is still far-fetched, and the challenges are enormous given the learning loss due to the COVID-19 pandemic. Further dissemination of the results and analyses of the SEA-PLM Philippines data will be important to generate collective and coherent actions among education stakeholders.
The analysis of contextual variables collected from children, parents, teachers, and school heads revealed possible hindrances in equal learning opportunities for the children. In the Philippines, the socioeconomic status of the child’s family, preschool education, school readiness in language and mathematics, and grade repetition were shown to cause disparity in the Grade 5 students’ performance. School size, school location, and access to textbooks and library also played critical roles in the performance of the children.
The perception and engagement of the children, teachers, and parents were shown to be crucial in the performance of the students in SEA-PLM 2019. Filipino Grade 5 students with the most positive attitudes about school performed significantly better than those with the least positive attitudes about school. It was also found that higher levels of parental engagement were associated with better performance in reading, writing, and mathematics literacy. Additionally, Filipino Grade 5 students who attended a school where the principal reported a more significant number of issues had a lower score, on the average, than those attending schools where the principal reported a lesser number of issues. Moreover, the Philippines had more reported issues on students’ lack of sleep, students being hungry in class, students’ absenteeism, and having disruptive students in class than an average participating country in SEA-PLM 2019.
The SEA-PLM 2019 is also the first large-scale international assessment that measured global citizenship attitudes, values, and behavior of children at the primary education. Filipino Grade 5 students generally showed awareness of GC issues such as what is happening the countries near the Philippines. They also expressed a high level of agreement that it was the government’s role to protect the environment. However, the proportion of Grade 5 students in the Philippines who were concerned about the different environmental sustainability issues was lower than the average of the participating countries. Furthermore, the majority of Filipino Grade 5 students felt that they belonged in the Philippines, but they did not feel that they had a lot in common with children in the world outside Asia. Interestingly, they were likely to participate in school activities related to GC, such as voting for class captain/leader/monitor and becoming a candidate for class captain/leader/monitor, compared with students from other participating countries. While several contextual variables were already analyzed with respect to the students’ performance in reading, writing, and mathematics, their impact was analyzed one at a time. For this reason, this The Philippines’ participation in large-scale assessments such as SEA-PLM 2019 is indeed another huge step in globalizing the quality of basic education in the country. The Philippines’ performance in SEA-PLM 2019 provides its stakeholders with the current status of what Grade 5 students can and cannot do in reading, writing, and mathematics. When aligned with SDG 4.1.1, a large proportion of Filipino Grade 5 students did not meet the minimum proficiency level in reading and mathematics literacy. More importantly, a substantial number of
SECTION 7:
CONCLUSIONS AND RECOMMENDATIONS
70
Filipino Grade 5 students did not even meet the minimum proficiency level at the end of lower primary (Grade 4) both in reading and mathematics literacy. Compared with other participating countries in SEA-PLM 2019, the Philippines performed below the regional average in all three domains. The goal that every Filipino child is ready for the 21st century is still far-fetched, and the challenges are enormous given the learning loss due to the COVID-19 pandemic. Further dissemination of the results and analyses of the SEA-PLM Philippines data will be important to generate collective and coherent actions among education stakeholders.
The analysis of contextual variables collected from children, parents, teachers, and school heads revealed possible hindrances in equal learning opportunities for the children. In the Philippines, the socioeconomic status of the child’s family, preschool education, school readiness in language and mathematics, and grade repetition were shown to cause disparity in the Grade 5 students’ performance. School size, school location, and access to textbooks and library also played critical roles in the performance of the children.
The perception and engagement of the children, teachers, and parents were shown to be crucial in the performance of the students in SEA-PLM 2019. Filipino Grade 5 students with the most positive attitudes about school performed significantly better than those with the least positive attitudes about school. It was also found that higher levels of parental engagement were associated with better performance in reading, writing, and mathematics literacy. Additionally, Filipino Grade 5 students who attended a school where the principal reported a more significant number of issues had a lower score, on the average, than those attending schools where the principal reported a lesser number of issues. Moreover, the Philippines had more reported issues on students’ lack of sleep, students being hungry in class, students’ absenteeism, and having disruptive students in class than an average participating country in SEA-PLM 2019.
The SEA-PLM 2019 is also the first large-scale international assessment that measured global citizenship attitudes, values, and behavior of children at the primary education. Filipino Grade 5 students generally showed awareness of GC issues such as what is happening the countries near the Philippines. They also expressed a high level of agreement that it was the government’s role to protect the environment. However, the proportion of Grade 5 students in the Philippines who were concerned about the different environmental sustainability issues was lower than the average of the participating countries. Furthermore, the majority of Filipino Grade 5 students felt that they belonged in the Philippines, but they did not feel that they had a lot in common with children in the world outside Asia. Interestingly, they were likely to participate in school activities related to GC, such as voting for class captain/leader/monitor and becoming a candidate for class captain/leader/monitor, compared with students from other participating countries. While several contextual variables were already analyzed with respect to the students’ performance in reading, writing, and mathematics, their impact was analyzed one at a time. For this reason, this report still warrants a more in-depth investigation of the simultaneous effect of these variables on the students’ performance. For instance, it was shown that the mean scores in the three domains of the students attending the smallest schools were significantly lower than those attending the largest schools. However, it might be the case that the bigger schools are in larger cities, which are expected to have better school facilities and resources.
SOUTHEAST ASIA - PRIMARY LEARNING METRICS 2019 NATIONAL REPORT OF THE PHILIPPINES 71
Recommendations to address key findings
• Ensuring strong interface of curriculum reforms, pedagogy and assessment with strong focus on classroom-level assessment;
• Greater focus on early learning (pre-school, Kinder to Grade 3) as critical key stage to develop foundational skills, especially for disadvantaged learners;
• Addressing the barriers to effective implementation on the use of mother tongue (L1) from K to Grade 3 and the transition to English and Filipino (L2) in Grade 4;
• Systematic teacher professional development program and school leadership support;• Improving the learning environment, especially for disadvantaged learners;• Strengthening the reading, writing and mathematics component of the K to 12 education curriculum
in every stage;• Strengthening collaboration and engagement with education stakeholders, parents, and community
leaders to support the educational needs of learners; and• Strengthening analysis and utilization of assessment data including field level monitoring, and research
to continuously inform program innovations especially in the changing context of education, such as the COVID-19 situation.
Furthermore, the SEA-PLM 2019 results shall be disseminated to different stakeholders such as policymakers, DepEd Regional Directors, academic institutions, schools, parents, students, development organizations and other stakeholders. Series of consultative meetings shall be conducted to the aforesaid stakeholders to generate collective programmatic recommendations such as revisions that need to be done in the current curricula of basic education, policies that need to be formulated to minimize the disparity of the students coming from different backgrounds, and professional development programs that need to be implemented for the teachers. More so, DepEd shall continue to strengthen the engagement of external stakeholders to undertake supplemental analysis such as the analysis on the degree of alignment of curriculum with the directions of International Large-Scale Assessments, including SEA-PLM5.1 These recommendations shall inform DepEd’s Sulong EduKalidad campaign to improve the Philippines’ quality of basic education.
5Marilyn Balagtas et al, Directions and Competencies Set in ILSAs: Input to Curriculum Review, June 2020
72
REFERENCES
Bakken, L., Brown, N., & Downing, B. (2017). Early childhood education: The long-term benefits. Journal of Research in Childhood Education, 31(2), 255–269.
OECD (2010), “Reading Framework”, in PISA 2009 Assessment Framework: Key Competencies in Reading, Mathematics and Science, OECD Publishing, Paris.
Smith, M.C., Mikulecky, L., Kibby, M.W., Dreher, M.J., & Dole, J.A. (2000). What will be the demands of literacy in the workplace in the next millennium? Reading Research Quarterly, 35(3),378–383.
Trawick-Smith, J. (2014). Early childhood development (6th ed.). Boston, MA: Pearson.
UNESCO. (2013). Global Citizenship Education: An Emerging Perspective, UNESCO New York, viewed 9 February 2020, https://unesdoc.unesco.org/ark:/48223/pf0000224115
UNESCO Institute for Statistics. (August, 2019) Global Proficiency Framework: Reading and Mathematics Grades 2 to 6. GAML6/REF/16.
UNICEF & SEAMEO. (2017a). SEA-PLM 2019 Assessment framework (1st ed.). Bangkok, Thailand: United Nations Children’s Fund (UNICEF) & Southeast Asian Ministers of Education Organization (SEAMEO) – SEA-PLM Secretariat.
UNICEF & SEAMEO. (2017b). SEA-PLM 2019 Global citizenship assessment framework (1st ed.). Bangkok, Thailand: United Nations Children’s Fund (UNICEF) & Southeast Asian Ministers of Education Organization (SEAMEO) – SEA-PLM Secretariat.
UNICEF & SEAMEO. (2020). SEA-PLM 2019 Main Regional Report, Children’s learning in 6 Southeast Asian countries. Bangkok, Thailand: United Nations Children’s Fund (UNICEF & Southeast Asian Ministers of Education Organization (SEAMEO) – SEA-PLM Secretariat.

