schaeffler winsted 2014
TRANSCRIPT
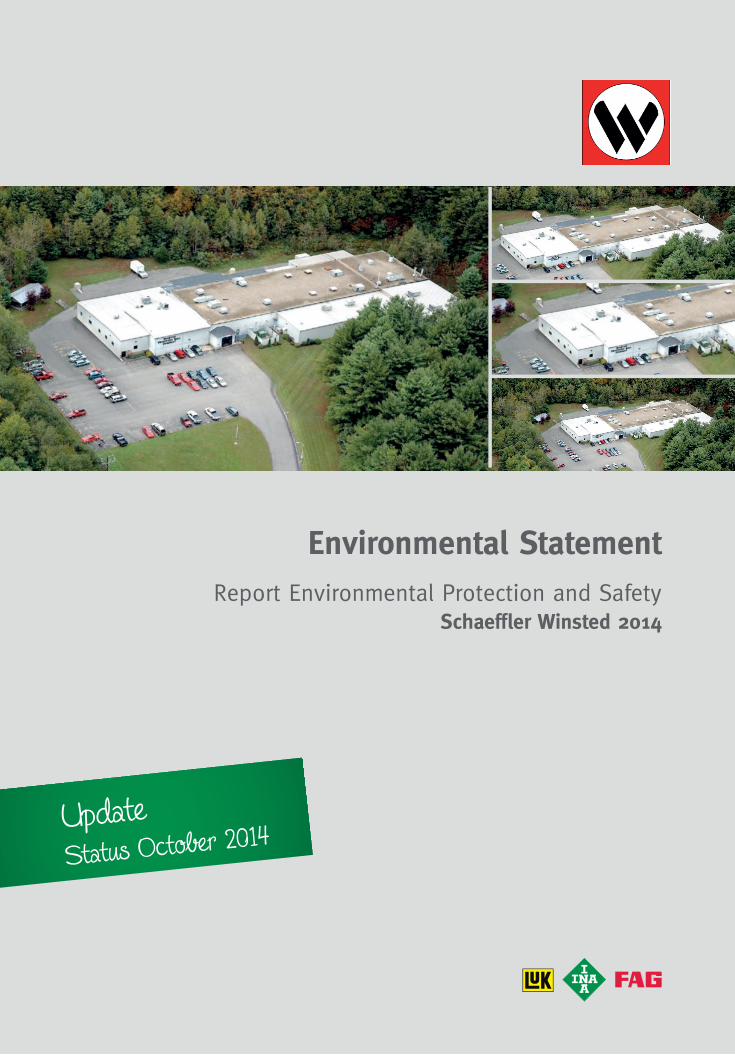
Update Status October 2014
Environmental StatementReport Environmental Protection and Safety
Schaeffler Winsted 2014
Introduction
In the year 2013 the environmental management at Winsted Precision Ball has been reviewed
according to the actual EMAS III regulation and the environmental statement 2012 has been
confirmed. The present actualized environmental statement, referring to the requirements of the
EMAS III (regulation (EC) Nr. 1221 /2009), is integral part of the environmental statement 2013 and
describes the relevant changes, the development of key performance indicators as well as the
status of environmental objectives and targets of the plant.
Changes at the Location
In 2013 Winsted Precision Ball upgraded the software for the Steyr gage in the Quality
Department. Which replaced obsolete equipment.
Winsted also purchased a new Laser Microscope for the Quality Department which allow the site
to calibrate the master balls in house.
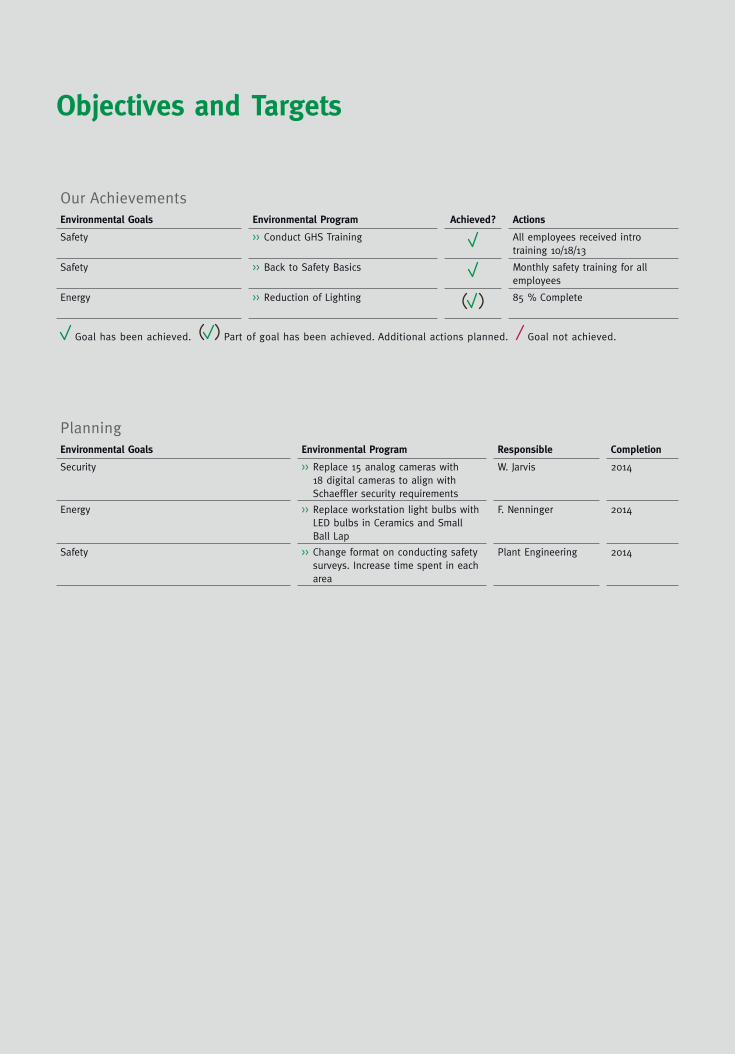
Our AchievementsEnvironmental Goals Environmental Program Achieved? Actions
Safety >> Conduct GHS Training All employees received intro training 10/18/13
Safety >> Back to Safety Basics Monthly safety training for all employees
Energy >> Reduction of Lighting 85 % Complete
Goal has been achieved. Part of goal has been achieved. Additional actions planned. Goal not achieved.
Objectives and Targets
PlanningEnvironmental Goals Environmental Program Responsible Completion
Security >> Replace 15 analog cameras with 18 digital cameras to align with Schaeffler security requirements
W. Jarvis 2014
Energy >> Replace workstation light bulbs with LED bulbs in Ceramics and Small Ball Lap
F. Nenninger 2014
Safety >> Change format on conducting safety surveys. Increase time spent in each area
Plant Engineering 2014
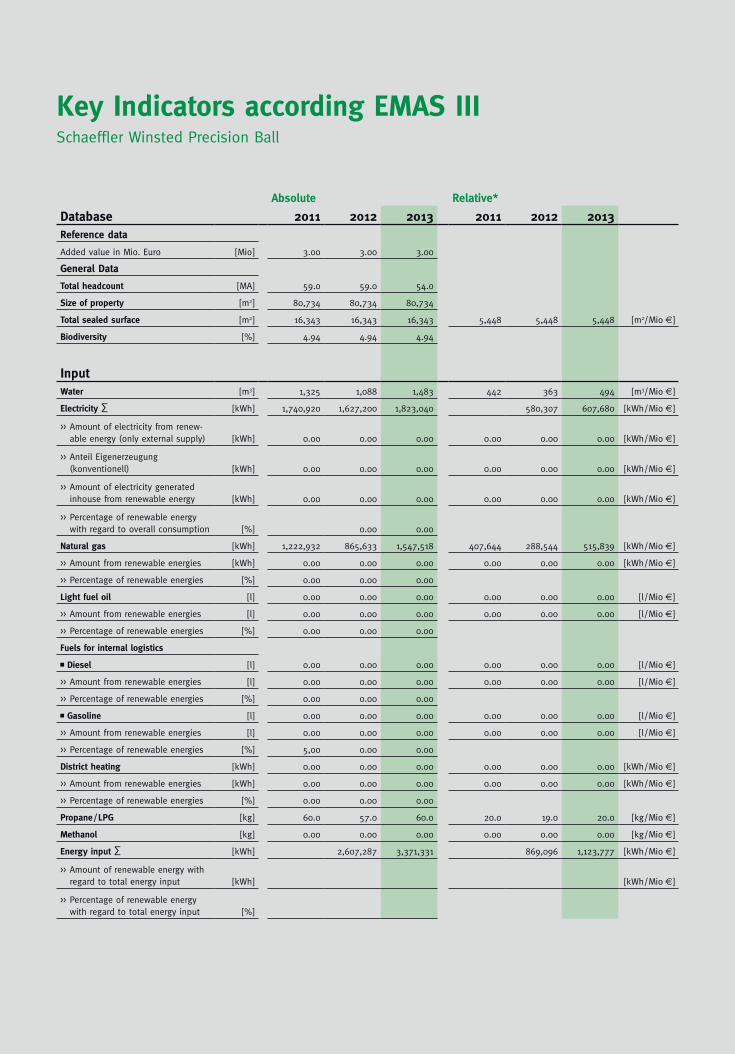
Key Indicators according EMAS III Schaeffler Winsted Precision Ball
Absolute Relative*
Database 2011 2012 2013 2011 2012 2013Reference data
Added value in Mio. Euro [Mio] 3.00 3.00 3.00
General Data
Total headcount [MA] 59.0 59.0 54.0
Size of property [m2] 80,734 80,734 80,734
Total sealed surface [m2] 16,343 16,343 16,343 5,448 5,448 5,448 [m2 / Mio €]
Biodiversity [%] 4.94 4.94 4.94
InputWater [m3] 1,325 1,088 1,483 442 363 494 [m3 / Mio €]
Electricity ∑ [kWh] 1,740,920 1,627,200 1,823,040 580,307 607,680 [kWh / Mio €]
>> Amount of electricity from renewable energy (only external supply) [kWh] 0.00 0.00 0.00 0.00 0.00 0.00 [kWh / Mio €]
>> Anteil Eigenerzeugung (konventionell) [kWh] 0.00 0.00 0.00 0.00 0.00 0.00 [kWh / Mio €]
>> Amount of electricity generated inhouse from renewable energy [kWh] 0.00 0.00 0.00 0.00 0.00 0.00 [kWh / Mio €]
>> Percentage of renewable energy with regard to overall consumption [%] 0.00 0.00
Natural gas [kWh] 1,222,932 865,633 1,547,518 407,644 288,544 515,839 [kWh / Mio €]
>> Amount from renewable energies [kWh] 0.00 0.00 0.00 0.00 0.00 0.00 [kWh / Mio €]
>> Percentage of renewable energies [%] 0.00 0.00 0.00
Light fuel oil [l] 0.00 0.00 0.00 0.00 0.00 0.00 [l / Mio €]
>> Amount from renewable energies [l] 0.00 0.00 0.00 0.00 0.00 0.00 [l / Mio €]
>> Percentage of renewable energies [%] 0.00 0.00 0.00
Fuels for internal logistics
Diesel [l] 0.00 0.00 0.00 0.00 0.00 0.00 [l / Mio €]
>> Amount from renewable energies [l] 0.00 0.00 0.00 0.00 0.00 0.00 [l / Mio €]
>> Percentage of renewable energies [%] 0.00 0.00 0.00
Gasoline [l] 0.00 0.00 0.00 0.00 0.00 0.00 [l / Mio €]
>> Amount from renewable energies [l] 0.00 0.00 0.00 0.00 0.00 0.00 [l / Mio €]
>> Percentage of renewable energies [%] 5,00 0.00 0.00
District heating [kWh] 0.00 0.00 0.00 0.00 0.00 0.00 [kWh / Mio €]
>> Amount from renewable energies [kWh] 0.00 0.00 0.00 0.00 0.00 0.00 [kWh / Mio €]
>> Percentage of renewable energies [%] 0.00 0.00 0.00
Propane / LPG [kg] 60.0 57.0 60.0 20.0 19.0 20.0 [kg / Mio €]
Methanol [kg] 0.00 0.00 0.00 0.00 0.00 0.00 [kg / Mio €]
Energy input ∑ [kWh] 2,607,287 3,371,331 869,096 1,123,777 [kWh / Mio €]
>> Amount of renewable energy with regard to total energy input [kWh] [kWh / Mio €]
>> Percentage of renewable energy with regard to total energy input [%]
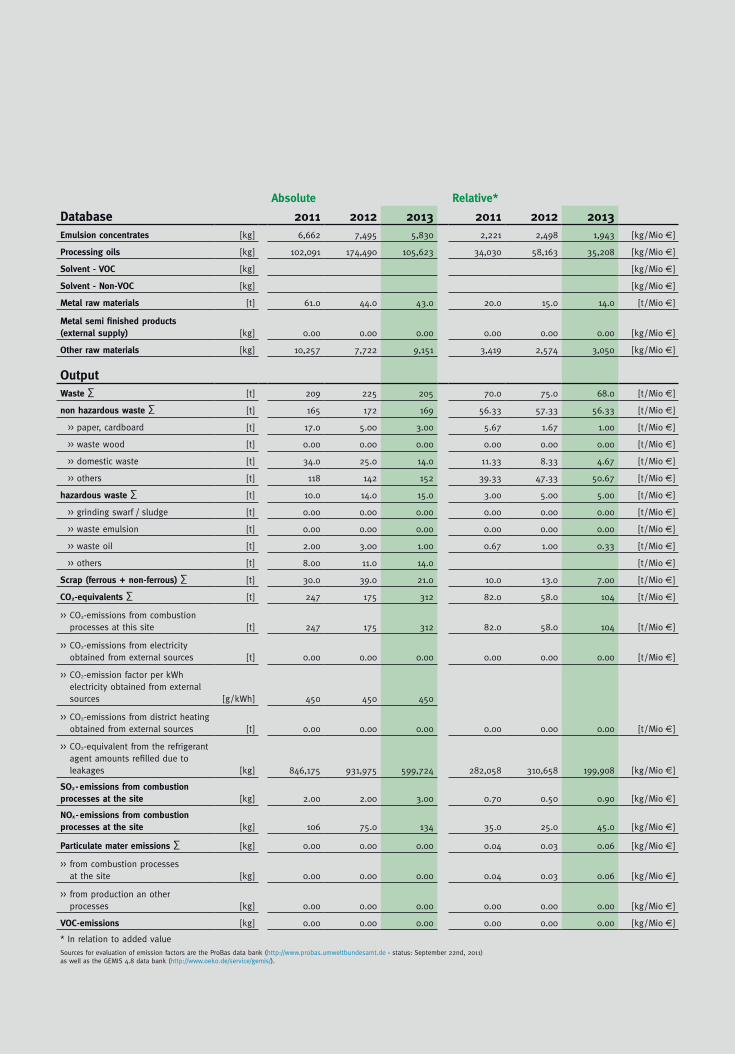
Absolute Relative*
Database 2011 2012 2013 2011 2012 2013Emulsion concentrates [kg] 6,662 7,495 5,830 2,221 2,498 1,943 [kg / Mio €]
Processing oils [kg] 102,091 174,490 105,623 34,030 58,163 35,208 [kg / Mio €]
Solvent - VOC [kg] [kg / Mio €]
Solvent - Non-VOC [kg] [kg / Mio €]
Metal raw materials [t] 61.0 44.0 43.0 20.0 15.0 14.0 [t / Mio €]
Metal semi finished products(external supply) [kg] 0.00 0.00 0.00 0.00 0.00 0.00 [kg / Mio €]
Other raw materials [kg] 10,257 7,722 9,151 3,419 2,574 3,050 [kg / Mio €]
OutputWaste ∑ [t] 209 225 205 70.0 75.0 68.0 [t / Mio €]
non hazardous waste ∑ [t] 165 172 169 56.33 57.33 56.33 [t / Mio €]
>> paper, cardboard [t] 17.0 5.00 3.00 5.67 1.67 1.00 [t / Mio €]
>> waste wood [t] 0.00 0.00 0.00 0.00 0.00 0.00 [t / Mio €]
>> domestic waste [t] 34.0 25.0 14.0 11.33 8.33 4.67 [t / Mio €]
>> others [t] 118 142 152 39.33 47.33 50.67 [t / Mio €]
hazardous waste ∑ [t] 10.0 14.0 15.0 3.00 5.00 5.00 [t / Mio €]
>> grinding swarf / sludge [t] 0.00 0.00 0.00 0.00 0.00 0.00 [t / Mio €]
>> waste emulsion [t] 0.00 0.00 0.00 0.00 0.00 0.00 [t / Mio €]
>> waste oil [t] 2.00 3.00 1.00 0.67 1.00 0.33 [t / Mio €]
>> others [t] 8.00 11.0 14.0 [t / Mio €]
Scrap (ferrous + non-ferrous) ∑ [t] 30.0 39.0 21.0 10.0 13.0 7.00 [t / Mio €]
CO2-equivalents ∑ [t] 247 175 312 82.0 58.0 104 [t / Mio €]
>> CO2emissions from combustion processes at this site [t] 247 175 312 82.0 58.0 104 [t / Mio €]
>> CO2emissions from electricity obtained from external sources [t] 0.00 0.00 0.00 0.00 0.00 0.00 [t / Mio €]
>> CO2emission factor per kWh electricity obtained from external sources [g / kWh] 450 450 450
>> CO2emissions from district heating obtained from external sources [t] 0.00 0.00 0.00 0.00 0.00 0.00 [t / Mio €]
>> CO2equivalent from the refrigerant agent amounts refilled due to leakages [kg] 846,175 931,975 599,724 282,058 310,658 199,908 [kg / Mio €]
SO2 - emissions from combustion processes at the site [kg] 2.00 2.00 3.00 0.70 0.50 0.90 [kg / Mio €]
NOx - emissions from combustionprocesses at the site [kg] 106 75.0 134 35.0 25.0 45.0 [kg / Mio €]
Particulate mater emissions ∑ [kg] 0.00 0.00 0.00 0.04 0.03 0.06 [kg / Mio €]
>> from combustion processes at the site [kg] 0.00 0.00 0.00 0.04 0.03 0.06 [kg / Mio €]
>> from production an other processes [kg] 0.00 0.00 0.00 0.00 0.00 0.00 [kg / Mio €]
VOC-emissions [kg] 0.00 0.00 0.00 0.00 0.00 0.00 [kg / Mio €]
* In relation to added valueSources for evaluation of emission factors are the ProBas data bank (http://www.probas.umweltbundesamt.de status: September 22nd, 2011) as well as the GEMIS 4.8 data bank (http://www.oeko.de/service/gemis/).

Input Notes on selected key performance indicators
Electricity Consumption Electrical consumption has gone up from 2012 to 2013
because we produced more product.
2012 kWh /Value added = 580.307 [kWh / Mio. €]
2013 kWh /Value added = 607.680 [kWh / Mio. €]
Natural Gas Consumption Natural gas consumption has gone up from 2012
to 2013 because our internal furnace was put back
online.
It is the number one consumer of natural gas for WPB.
Water Consumption Water consumption has sone up from 2012 to 2013
because we changed our central coolant system twice
in 2013.
[MWh] Electricity
2.000
1.800
1.600
1.400
2011 2012 2013
Electricity [MWh]
[MWh] Natural Gas
2.000
1.500
1.000
500
0
2011 2012 2013
Natural Gas [MWh]
[m3] Water
2.000.000
1.500.000
1.000.000
500.000
0
2011 2012 2013
Water [m3]

Output Notes on selected key performance indicators
NonHazardous Waste NonHazardous Waste has decreased in 2013 because
of process changes requiring less nonhazardous waste
products to be used.
Hazardous Waste Hazardous waste has increased over the past two
years due to the dismantling of the waste water treat
ment system.
Scrap Metal Scrap increase in 2012 was due to reduction in
inventory. Winsted Precision Ball’s scrap is removed to
a reputable scrap dealer where metal is recycled.
[Tons] NonHazardous Waste
175
170
165
160
2011 2012 2013
NonHazardous Waste [Tons]
[Tons] Scrap Metal
60
40
20
0
2011 2012 2013
Scrap Metal [Tons]
[Tons] Hazardous Waste
20
10
0
2011 2012 2013
Hazardous Waste [Tons]
Questions about environmental protection Questions about environmental protection and and safety at the location: safety at Schaeffler: Schaeffler Canada Inc.
Daren Roth Norbert Hörauf P.O.Box 640 Industriestraße 13 Stratford, ON. Canada N5A 6T2 91074 Herzogenaurach
Internet www.fag.com Internet www.schaeffler.com EMail [email protected] EMail [email protected]
Canada: In Germany: Phone 519 2713231 Phone 09132 822058 Fax 519 2738528 Fax 09132 82452058
From other countries: From other countries: Phone +011 519 2713231 Phone +49 9132 822058 Fax +011 519 2738528 Fax +49 9132 82452058
The structure and contents of this report correspond to the requirements stated in Annex IV of Regulation (EC) No. 1221 /2009 of the European Parliament and the Council dated November 25, 2009 regarding the voluntary participation of organizations in the ecomanagement and audit scheme (EMAS).
Moreover, the report contains information about issues pertaining to occupational safety, plant security and fire protection as well as general information on social benefits pr ovided by the company and this location.
© Schaeffler Technologies AG & Co. KG · 2014, September This publication or parts there of may not be reproduced without our permission.
Environmental Verifier’s Statement
The undersigned, Dipl.Phys. Reinhard Mirz, EMAS Environmental Verifier, registration number DEV0260, accredited and authorized for the area designated by NACE Code 25 and 29.32, confirms that his inspection of the site at 159 Colebrook River Road Winsted, CT USA has met all of the requirements stipulated by Regulation (EC) No. 1221 /2009 of the European Parliament and Council dated November 25, 2009 on the voluntary participation of organizations in an environmental management and audit scheme (EMAS) as indicated in the updated environmental statement (report entitled “Environmental Protection and Occupational Safety”) of by Winsted Precision Ball, registration number D15800016.
The signatures at the end of this statement confirm that>> The inspection and validation have been completed in full agreement with the requirements
stipulated in (EU) Regulation No. 1221 /2009>> The result of the inspection and validation confirms that no evidence of noncompliance with valid
environmental specifications has been found>> The data and information in the environmental statement (report entitled „Environmental Protection
and Occupational Safety“) for the site at 159 Colebrook River Road Winsted, CT USA, as part of Winsted Precision Ball represent a reliable, credible and true picture of all activities at this site within the area indicated in the environmental statement.
This statement cannot be equated to an EMAS registration. EMAS registration can be completed only by an authorized agency in accordance with Regulation (EC) No. 1221 /2009. This statement must not be used as an independent basis for informing the public.
Dipl.Phys. Reinhard Mirz Done at Winsted, on 07/09/2014
The next consolidated (entire) Environmental Statement will be submitted for validation in October / 2015 at the latest.In the years between, an annual update of the Environmental Statement will be compiled for validation by the environmental verifier.
Imp
ress
um
:
Her
ausg
eber
:S
iem
ens
AG
KS
pA
-/G
Sp
A-B
üro
, Erl
ang
en
Au
tore
n:
Dr.
Rai
ner
Sie
g, J
elen
a M
aric
Au
flag
e:6.
akt
ual
isie
rte
Au
flag
e
Bis
her
ers
chie
nen
eA
ufl
agen
:1.
Au
flag
e;M
ärz
1998
;3.
000
Stü
ck2.
Au
flag
e;M
ai19
99;
3.00
0 S
tück
3. A
ufl
age;
Jun
i20
03;
3.00
0 S
tück
4. A
ufl
age;
Jan
uar
2006
;1.
000
Stü
ck5.
Au
flag
e;O
kto
ber
2007
;O
rdn
erfo
rm6.
Au
flag
e;M
ai
2008
;O
rdn
erfo
rm
Ges
amth
erst
ellu
ng
: