scanning transmission x-ray microscopy study of microbial calcification
TRANSCRIPT
Geobiology (2004), 2, 249–259
© 2004 Blackwell Publishing Ltd 249
Blackwell Publishing, Ltd.ORIGINAL ARTICLESpectromicroscopy study of microbial calcification
Scanning transmission X-ray microscopy study of microbial calcificationK. BENZERARA,1 T. H. YOON,1 T. TYLISZCZAK,2 B. CONSTANTZ,3 A. M. SPORMANN4 AND
G. E. BROWN, JR1,5
1Surface and Aqueous Geochemistry Group, Department of Geological and Environmental Sciences, Stanford University, Stanford, CA 94305-2115, USA 2Lawrence Berkeley National Laboratory, Advanced Light Source, Berkeley, CA 94720, USA 3Skeletal Kinetics, 10201 Bubb Road, Cupertino, CA 95014, USA 4Departments of Civil & Environmental Engineering, of Biological Sciences, and of Geological & Environmental Sciences, Stanford University, Stanford, CA 94305, USA 5Stanford Synchrotron Radiation Laboratory, SLAC, 2575 Sand Hill Road, Menlo Park, CA 94025, USA
ABSTRACT
Calcium phosphates and calcium carbonates are among the most prevalent minerals involved in microbial fos-silization. Characterization of both the organic and mineral components in biomineralized samples is, however,usually difficult at the appropriate spatial resolution (i.e. at the submicrometer scale). Scanning transmission X-ray microscopy (STXM) was used to measure C K-edge, P L-edge, and Ca L-edge near-edge X-ray absorptionfine structure (NEXAFS) spectra of some calcium-containing minerals common in biomineralization processesand to study the experimental biomineralization by the model microorganism, Caulobacter crescentus. We showthat the Ca L2,3-edges for hydroxyapatite, calcite, vaterite, and aragonite are unique and can be used as probesto detect these different mineral phases. Using these results, we showed that C. crescentus cells, when culturedin the presence of high calcium concentration, precipitated carbonate hydroxyapatite. In parallel, we detectedproteins, polysaccharides, and nucleic acids in the mineralizing bacteria at the single-cell scale. Finally, we dis-cussed the utility of STXM for the study of natural fossilized microbial systems.
Received 02 November 2004; accepted 07 January 2005
Corresponding author: K. Benzerara, tel.: 1 650 723 4782; fax: 1 650 725 2199; e-mail: [email protected]
INTRODUCTION
Microbes are often associated with calcium-containingminerals in nature, but it is usually difficult to determine ifthese organisms are involved in mineral nucleation. Findingbiosignatures in minerals has been the goal of many recentstudies to detect microbial remnants in the fossil record (e.g.Mojzsis & Arrhenius, 1998; Blake et al., 2001; Sanchez-Navas& Martin-Algarra 2001). The same need arises in medicalsciences where identification of the organics mixed withminerals would help in understanding the origin of somediseases (e.g. Dorozhkin & Epple, 2002; Ghidoni, 2004;Trion & Van der Laarse, 2004). One example showing thesimilarity of issues in geobiology and medical science is thedebated existence of nanobacteria. Many studies have proposedthat very small microorganisms called nanobacteria, which aresmaller than the theoretical size limit for an autonomous viable
organism (Nealson, 1999), are involved in the formation ofcalculi (e.g. Kajander et al., 2003; Miller et al., 2004).Nanobacteria are also thought to have a potential role incarbonate and phosphate precipitation in natural systems,according to some studies (Folk, 1999). Some authors haveargued that these conclusions, which are usually based onmorphological observations, are incorrect, and they haveshown convincingly that precipitation of calcium phosphateson simple macromolecules can lead to the formation ofsimilar complex organo-mineral patterns with bacterial-likemorphologies (Vali et al., 2001).
The problem of distinguishing between these two pos-sibilities is in part methodological, as one needs to char-acterize both the mineral and the organic content of thesesubmicrometer-sized objects. Transmission electron microscopyis a unique technique for characterizing crystallized minerals atthe required spatial scale. However, characterization of organic
250 K. BENZERARA et al.
© 2004 Blackwell Publishing Ltd, Geobiology, 2, 249–259
molecules present in a nanometer-sized object is muchmore difficult. Here, we show how scanning transmissionX-ray microscopy (STXM) can be used to obtain high spatialand energy resolution near-edge X-ray absorption fine structure(NEXAFS) spectra at the C K-edge and the Ca L2,3-edge on boththe minerals and associated organics during biomineralizationby Caulobacter crescentus cells under laboratory conditions.This work builds on our recent STXM study of microenviron-ments associated with a fossilized microorganism involved inpyroxene weathering (Benzerara et al., 2005).
EXPERIMENTAL METHODS
Reference compound preparation
Calcite and aragonite powders were prepared from naturalsamples obtained from the Stanford University Research MineralCollection (CA, USA). Vaterite powders were synthesizedaccording to the method of Kralj et al. (1994). The same sampleswere previously used by Doyle et al. (2004) in a study of theeffect of carbonate coatings on magnetite surfaces on chromatereduction. Powdered samples of abiotically synthesized hydro-xyapatite were obtained from Riedel-de Haen (Germany). Thephase purity of the powders was checked by X-ray diffraction(XRD) and the powders were found to be monomineralic.These powders were suspended for a few seconds in Milli-Qgrade water, and one drop was deposited on the membrane ofa holey carbon-coated 200 mesh copper grid and dried in air.
Bacterial cultures
The Caulobacter crescentus CB15 strain was kindly providedby P. I. Entcheva and A. Spormann (Stanford University). C.crescentus is a Gram-negative α-proteobacterium found inmany oligotrophic natural environments (see Poindexter,1981 for a review of the natural distribution of Caulobacterspecies). Caulobacter sp. is also found in many sewage treat-ment waters rich in phosphate (Macrae & Smit, 1991). Thisbacterium was considered a useful model for a biomineral-ization and bioremediation study because its genome has beenrecently sequenced (Nierman et al., 2001) and extensive banksof mutants already exist, which offers the possibility of betterunderstanding the biochemical processes involved in microbialcalcification in the near future. Moreover, several studies arein progress to understand the resistance mechanisms of thismicroorganism to the toxicity of metals, in which, metalphosphate precipitation may potentially be one of thesemechanisms (e.g. Levinson et al., 1996).
C. crescentus cells were cultured in peptone yeast extractmedium (PYE), which is referred to here as ‘regular medium’and consists of bactotryptone (2 g L−1), yeast extract (1 g L−1),MgSO4 (1 mM), and CaCl2 (0.5 mM). The calcification mediumwas designed by adding CaCl2 to PYE to a final concentrationof 8 mM. Control tubes consisted of (a) the calcification
medium, prior to inoculation, where no carbonate or phos-phate precipitation was detected, and (b) the inoculated regularPYE growth medium. Two replicates of the three differentsamples were incubated under the same conditions at 30 °Cduring 20 days with continual shaking (200 r.p.m). AdditionalC. crescentus cultures in the regular PYE growth medium wereincubated for only 2 days. After culturing, liquid suspensionwere centrifuged and washed with a sterile ionic strength buffer(0.01 M NaNO3, pH = 7). One drop of each solution wasdeposited on a Si3N4 STXM sample holder and dried in air.
STXM observations and data analyses
STXM studies were performed at advanced light source (ALS)branch line 11.0.2.2 (Tyliszczak et al., 2004) with the synchro-tron storage ring operating at 1.9 GeV and 200–400 mAstored current. A 150 L mm−1 grating and 20 µm exit slit wereused for carbon K-edge imaging and spectroscopy, providinga theoretical energy resolution of 100 meV. A 1200 L mm−1
grating and 30 µm slit were used for calcium L2,3-edge meas-urements, providing a theoretical resolution of around 70 meV.Energy calibration was accomplished using the well-resolved3p Rydberg peak at 294.96 eV of gaseous CO2 for the C K-edgeand the L3 NEXAFS peak in the calcite Ca L-edge NEXAFSspectrum, which occurs at 349.3 eV (Rieger et al., 1986).
STXM is a transmission microscopy using a monochromatedX-ray beam produced by synchrotron radiation. Recent appli-cations to colloids are presented in Yoon et al. (2004). Theenergy of the beam can be varied by less than 0.1 eV incre-ments over a wide energy range (130–2100 eV). The beam isfocused on the sample using a condenser zone plate and a 2-D image is collected by scanning the sample stage at a fixedphoton energy. The image contrast results from differentialabsorption of X-rays depend on the chemical composition ofthe sample. Image stacks or line scans of reference Ca-carbonateand Ca-phosphate minerals and bacteria-mineral mixtureswere used to collect C K-edge and Ca L2,3-edge NEXAFSspectra. Image stacks or line scans were taken by scanning thesample in the x-y direction (image stack) or x direction (linescan) of selected sample areas at energy increments of 0.1 eVover the energy range of interest (280–305 eV for carbon,342–360 eV for calcium). Here, x refers to the horizontaldirection, y to the vertical direction, and the x-y plane to theplane perpendicular to the X-ray beam direction. The stackimage procedure thus consists of measuring the NEXAFSspectrum for a specific element on each pixel (one pixel can beas small as 30 nm) of the image. Counting times are of theorder of few milliseconds or less per pixel. Normalization andbackground correction of the Ca L2,3-edge and C K-edgeNEXAFS spectra were performed by dividing each spectrumby a second spectrum from a Ca- or C-free location on thesame sample. Maps of calcium and phosphorus distributionswere obtained by subtracting the image below the Ca or PL2,3-edge, respectively, from the image of the same area above
Spectromicroscopy study of microbial calcification 251
© 2004 Blackwell Publishing Ltd, Geobiology, 2, 249–259
the edge. AXIS 2000 software (version 2 1n) (Hitchcock,2000) was used to align image stacks and extract NEXAFSspectra from image stack or line scan measurements.
RESULTS
Ca L2,3 edge NEXAFS of reference compounds
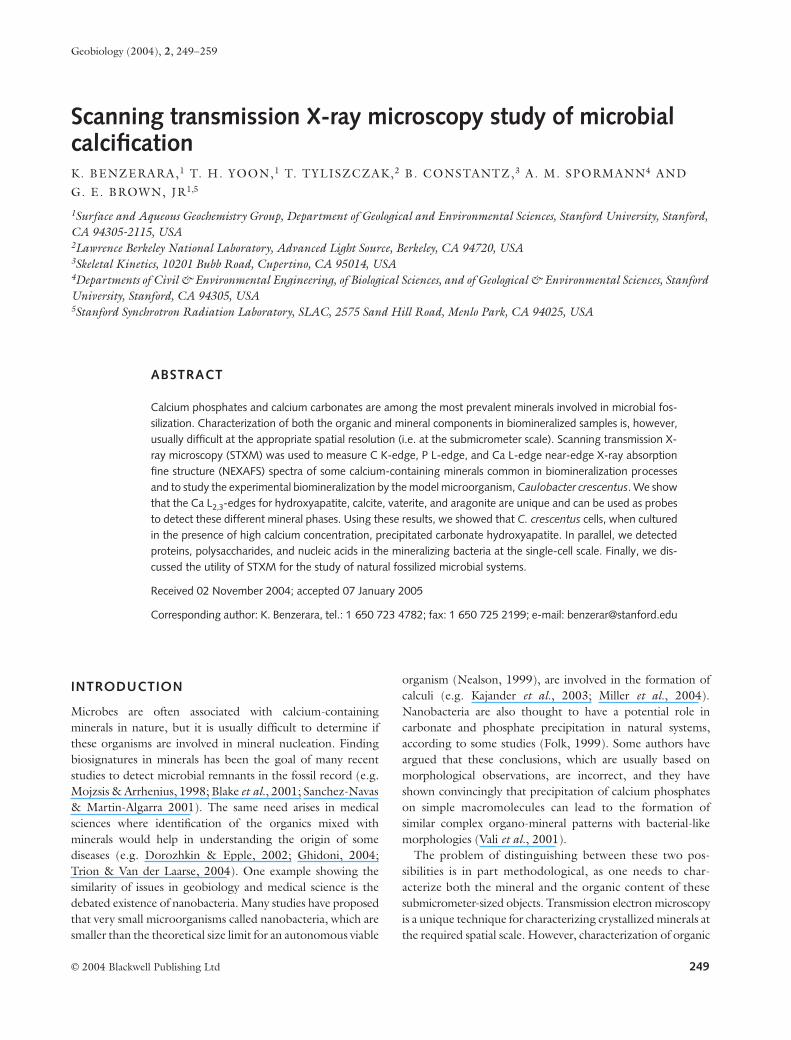
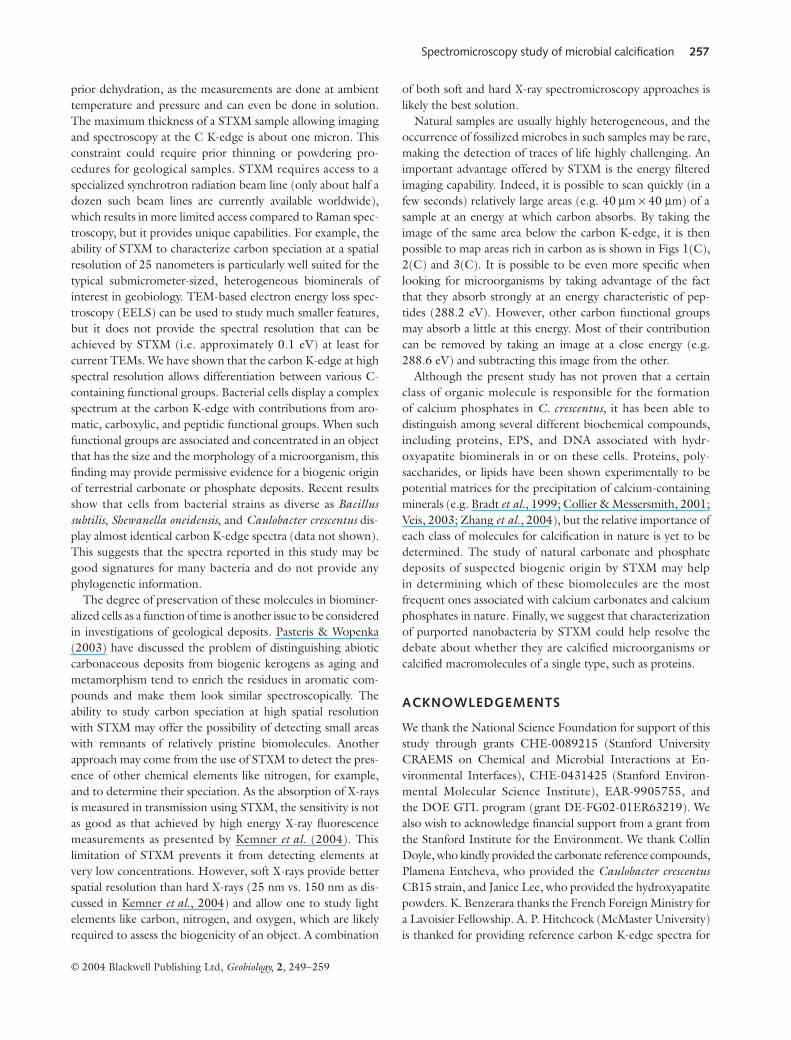
Figure 1 shows the image of reference hydroxyapatite particlesat different energies as well as the Ca L2,3-edge NEXAFSspectra of hydroxyapatite and the three most common calciumcarbonate polymorphs in biomineralized systems (i.e. calcite,aragonite and vaterite). Each STXM image was taken at a singleenergy and provides a spatial resolution of approximately 25nanometers. Two images were taken, respectively, at an energybelow the Ca L2,3-edge (approximately 347 eV) and above theedge (Figs 1A,B). By subtracting both images converted intooptical density (OD) units, it is possible to obtain a calciumdistribution map (Fig. 1C). This energy-filtered imagingprocedure is an interesting first step in locating specific
element of interest in a heterogeneous mixture of particles.Moreover, a semiquantitative estimate of calcium content canbe obtained, as the intensity of each pixel is directly relatedto the mass of calcium present in the pixel volume by therelation:
∆(O · D)X = µX · ρ · d
where µ is the X-ray mass absorption coefficient for calcium atthe energy X, ρ is the density in g m−3, and d the thickness ofthe sample (in m). It is moreover possible to measure the CaL2,3-edge NEXAFS spectrum for the same area. Spectra wererecorded on several particles for each mineral phase. Particlesselected for NEXAFS measurements had an approximate sizeof 500 nm and absorbed approximately 60% of the incidentbeam at 350 eV. The energy position of the L3-edge main peakof calcite was arbitrarily fixed at 349.3 eV, following Riegeret al. (1986), and the Ca L2,3 edge of calcite was used as anenergy calibration standard. The Ca L2,3-edge spectrum showstwo well resolved features (Fig. 1D) corresponding to the L3
Fig. 1 Spectromicroscopy on calcium-containingreference compounds. (A) STXM image ofhydroxyapatite particles at 343 eV (below the CaL2,3-edge). (B) STXM image of the same area at349.3 eV (i.e. at the L3 resonance energy). Particlesappear much darker, showing the presence ofcalcium. (C) Calcium map obtained by subtractionof (A) and (B) converted into optical density (OD)units. (D) Calcium L2,3-edge NEXAFS spectra ofhydroxyapatite (HAP), aragonite, vaterite, andcalcite. Vertical dotted lines show correlationsbetween HAP and aragonite as well as betweencalcite and vaterite.
252 K. BENZERARA et al.
© 2004 Blackwell Publishing Ltd, Geobiology, 2, 249–259
(349.3 eV) and L2 (∼352.6 eV) edges of Ca. These main edgefeatures do not show much variation in energy position amongthe different minerals examined here. However, the number,position, and intensity of other smaller peaks are specific to thedifferent mineral phases and can be used to distinguish amongthem. The energy positions of all the peaks as well as thecoordination numbers of calcium in the different mineralstandards are given in Table 1.
STXM study of biomineralization by Caulobacter crescentus
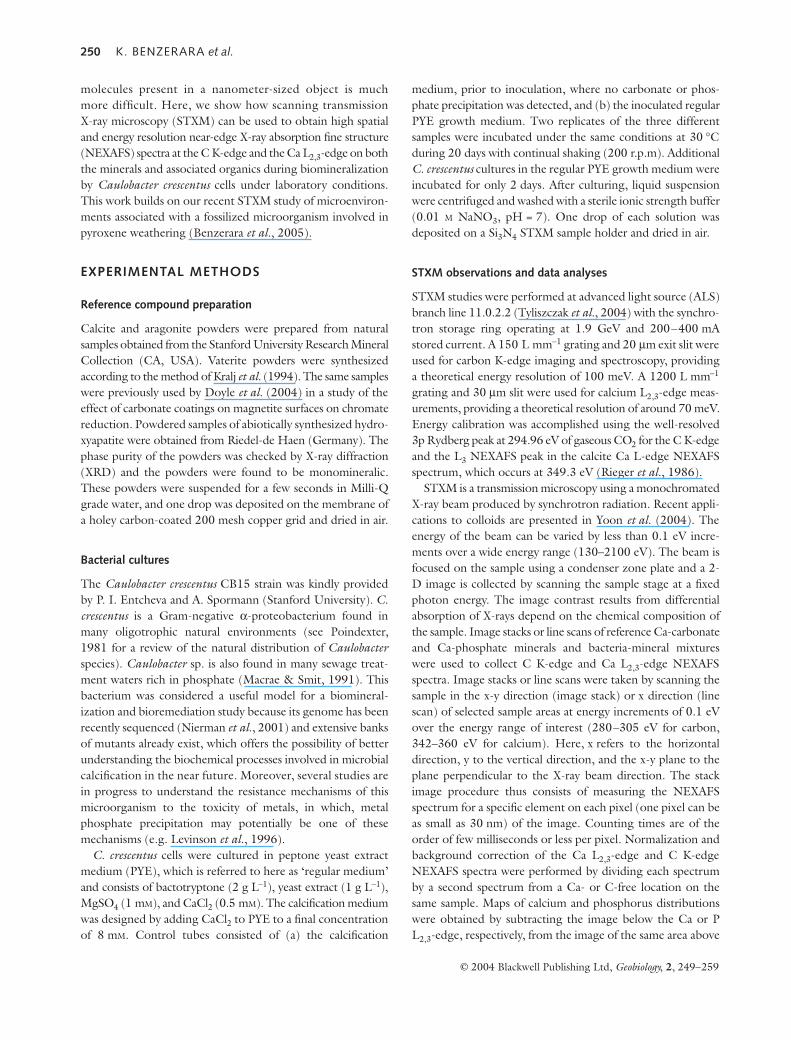
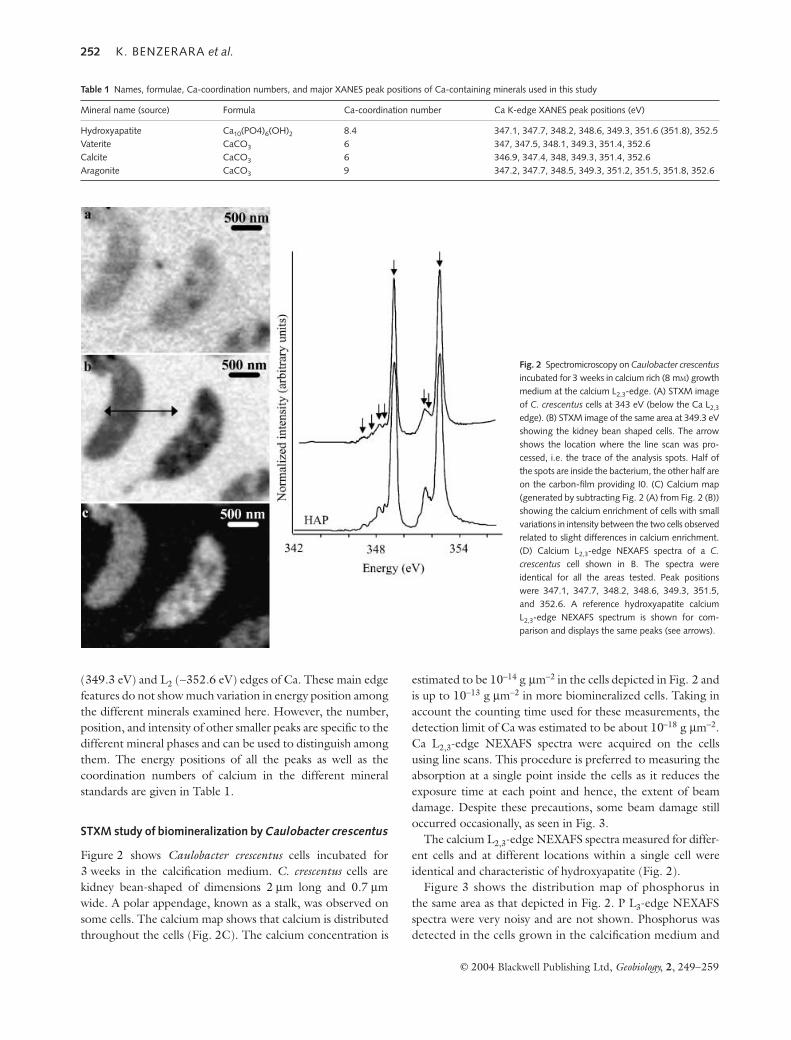
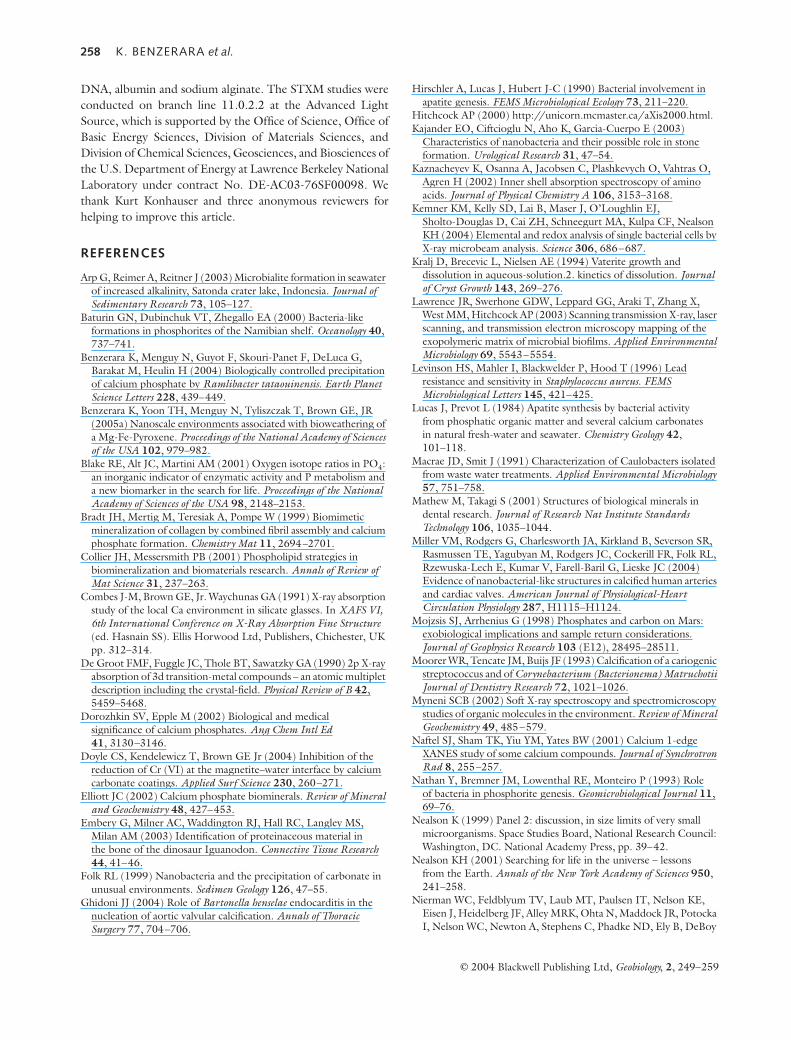
Figure 2 shows Caulobacter crescentus cells incubated for3 weeks in the calcification medium. C. crescentus cells arekidney bean-shaped of dimensions 2 µm long and 0.7 µmwide. A polar appendage, known as a stalk, was observed onsome cells. The calcium map shows that calcium is distributedthroughout the cells (Fig. 2C). The calcium concentration is
estimated to be 10−14 g µm−2 in the cells depicted in Fig. 2 andis up to 10−13 g µm−2 in more biomineralized cells. Taking inaccount the counting time used for these measurements, thedetection limit of Ca was estimated to be about 10−18 g µm−2.Ca L2,3-edge NEXAFS spectra were acquired on the cellsusing line scans. This procedure is preferred to measuring theabsorption at a single point inside the cells as it reduces theexposure time at each point and hence, the extent of beamdamage. Despite these precautions, some beam damage stilloccurred occasionally, as seen in Fig. 3.
The calcium L2,3-edge NEXAFS spectra measured for differ-ent cells and at different locations within a single cell wereidentical and characteristic of hydroxyapatite (Fig. 2).
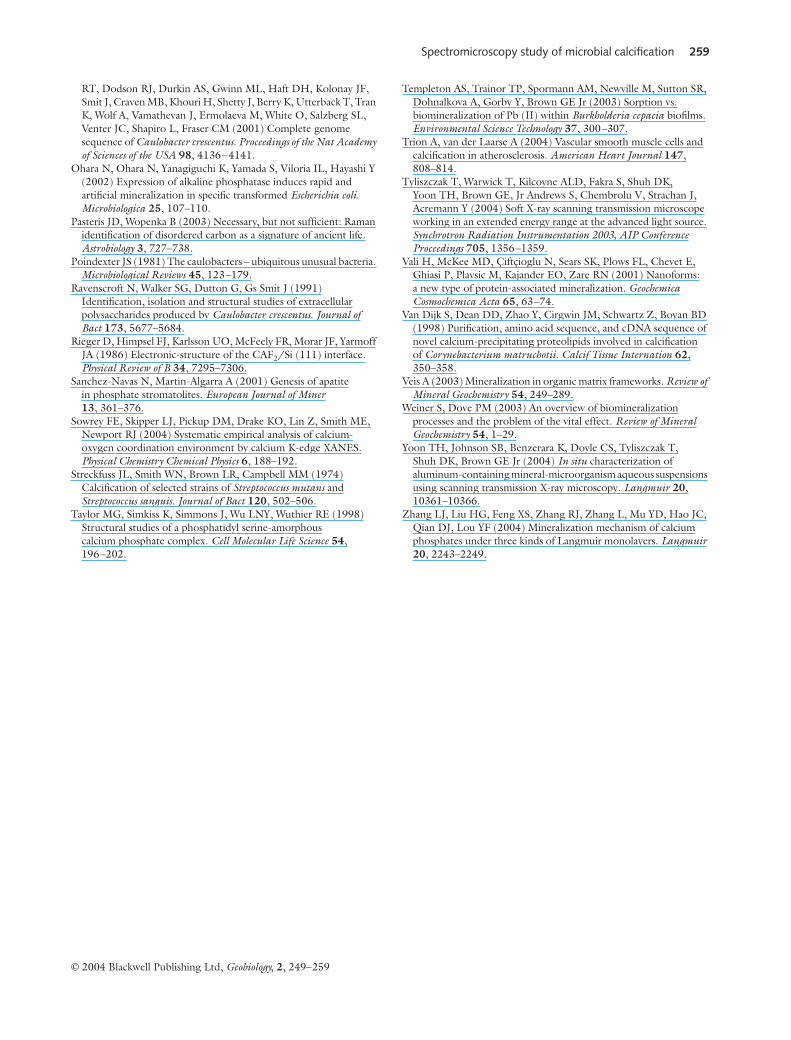
Figure 3 shows the distribution map of phosphorus inthe same area as that depicted in Fig. 2. P L3-edge NEXAFSspectra were very noisy and are not shown. Phosphorus wasdetected in the cells grown in the calcification medium and
Table 1 Names, formulae, Ca-coordination numbers, and major XANES peak positions of Ca-containing minerals used in this study
Mineral name (source) Formula Ca-coordination number Ca K-edge XANES peak positions (eV)
Hydroxyapatite Ca10(PO4)6(OH)2 8.4 347.1, 347.7, 348.2, 348.6, 349.3, 351.6 (351.8), 352.5Vaterite CaCO3 6 347, 347.5, 348.1, 349.3, 351.4, 352.6Calcite CaCO3 6 346.9, 347.4, 348, 349.3, 351.4, 352.6Aragonite CaCO3 9 347.2, 347.7, 348.5, 349.3, 351.2, 351.5, 351.8, 352.6
Fig. 2 Spectromicroscopy on Caulobacter crescentusincubated for 3 weeks in calcium rich (8 mM) growthmedium at the calcium L2,3-edge. (A) STXM imageof C. crescentus cells at 343 eV (below the Ca L2,3
edge). (B) STXM image of the same area at 349.3 eVshowing the kidney bean shaped cells. The arrowshows the location where the line scan was pro-cessed, i.e. the trace of the analysis spots. Half ofthe spots are inside the bacterium, the other half areon the carbon-film providing I0. (C) Calcium map(generated by subtracting Fig. 2 (A) from Fig. 2 (B))showing the calcium enrichment of cells with smallvariations in intensity between the two cells observedrelated to slight differences in calcium enrichment.(D) Calcium L2,3-edge NEXAFS spectra of a C.crescentus cell shown in B. The spectra wereidentical for all the areas tested. Peak positionswere 347.1, 347.7, 348.2, 348.6, 349.3, 351.5,and 352.6. A reference hydroxyapatite calciumL2,3-edge NEXAFS spectrum is shown for com-parison and displays the same peaks (see arrows).
Spectromicroscopy study of microbial calcification 253
© 2004 Blackwell Publishing Ltd, Geobiology, 2, 249–259
its concentration was estimated to be of the same order ofmagnitude as that of calcium (i.e. 10−14 g µm−2). More preciseestimation of the Ca/P ratio was not possible. Phosphorus isan important elemental constituent of cellular nucleic acidsand phospholipids; however, neither phosphorus nor calciumwas detected in C. crescentus cells cultured in the regular PYEgrowth medium using the same counting time (data not shown).This suggests that the phosphorus and calcium concentrationswere much lower in the cells under these conditions.
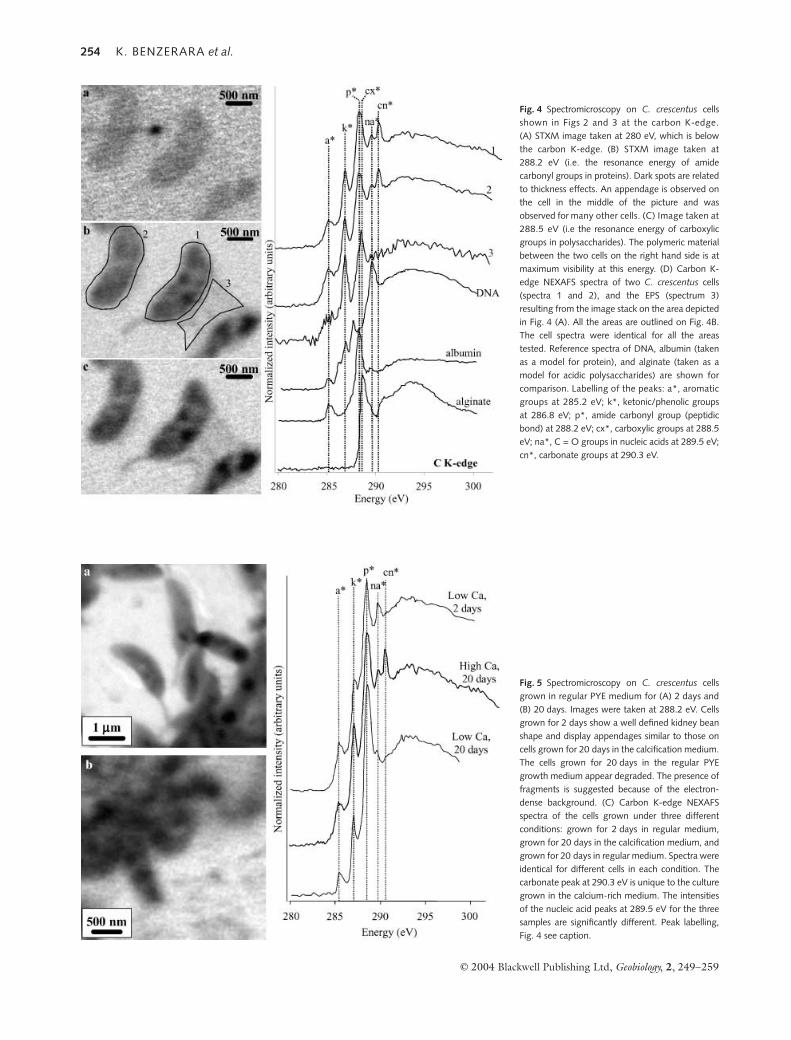
The carbon content of the mineralized cells was also char-acterized. Figure 4 shows C K-edge images of the same areastudied at the Ca and P L2,3-edges (see Figs 2 and 3) taken atan energy below the C K-edge (280 eV) (Fig. 4A) and at twodifferent energies above the C-K edge (288.2 eV and 288.5eV). Spectra were measured using the image stack procedure.The acquisition time at each energy step was 0.4 ms per pixel,which greatly reduces beam damage. Any area of interest inthe image can then be chosen during data processing to obtaina C K-edge NEXAFS spectrum. The carbon spectra of differ-ent cells are qualitatively similar and display at least five peaks,and likely more, as some peaks may overlap (Fig. 4). Using thereference spectra of Lawrence et al. (2003), these peaks can beassigned to different C-containing functional groups. Thepeaks observed in this study are at the same energy positionsas the corresponding peaks measured by Lawrence et al.(2003) but show an almost systematic 0.3 eV shift relative topeaks in the same compounds reported in the C K-edge spec-tral database of Myneni (2002). The first peak at 285.2 eV islikely related to aromatic groups in proteins (Kaznacheyevet al., 2002; Myneni, 2002). The peaks at 286.8 eV and 288.2 eVlikely correspond to phenolic groups or ketonic groups orboth (Myneni, 2002) and to amide carbonyl groups in pro-teins, respectively. However, the latter peak is much broaderthan that observed for albumin, suggesting that the 288.2 eVpeak observed for C. crescentus corresponds to a combinationof both protein amide groups and polysaccharide carboxylicgroups. The peak at 289.5 eV is at the same energy positionas that of the C = O groups in nucleic acids. Finally, the peakat 290.3 eV was observed only in C. crescentus cultured in thecalcification medium. This peak is indicative of the presence ofcarbonate groups.
A C-containing polymeric material bridging between twocells can be seen in Fig. 4C. The C K-edge NEXAFS spectrumfrom this area shows peaks at 286.9 and 288.5 eV. The latterpeak is slightly shifted towards higher energies relative to themain peak observed for the cells and is assigned to carboxylicgroups in polysaccharides based on comparison with referencespectra reported by Lawrence et al. (2003). This extracellularpolymer thus likely corresponds to exopolysaccharides (EPS),which have been shown to be produced by this strain (Raven-scroft et al., 1991). The peak at 286.9 eV, which is assigned tophenolic or ketonic groups, is thus also thought to be relatedto polysaccharides at least partly. No carbonate peak wasobserved in this area.
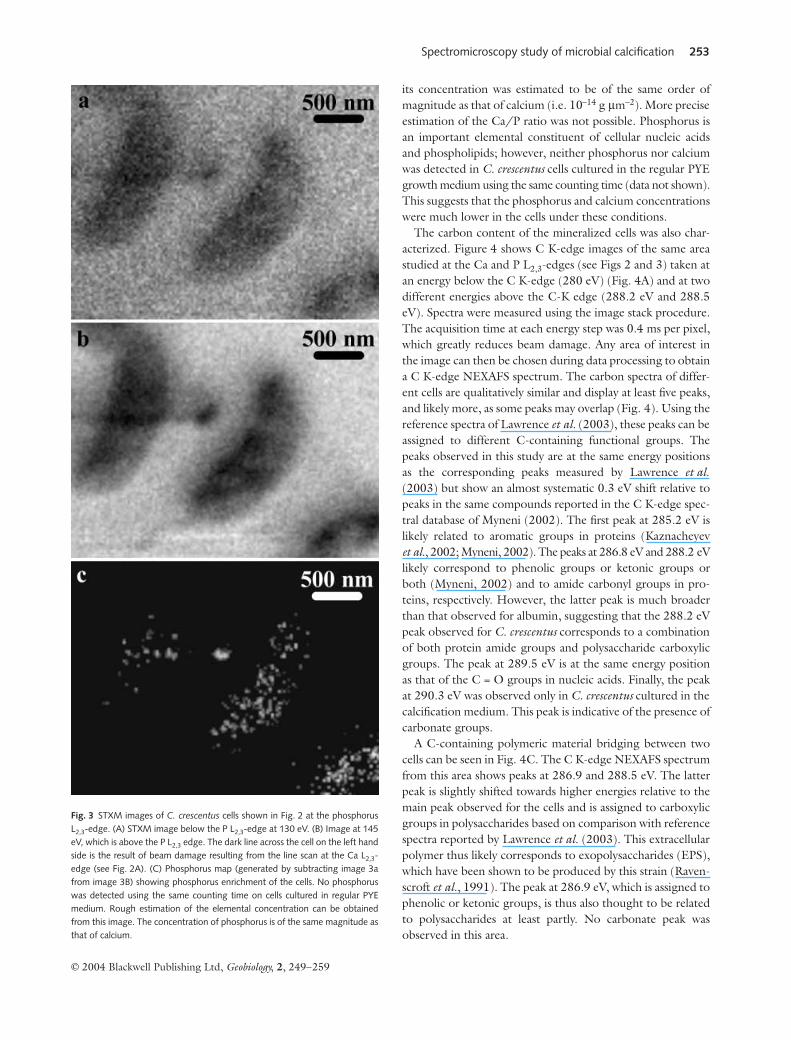
Fig. 3 STXM images of C. crescentus cells shown in Fig. 2 at the phosphorusL2,3-edge. (A) STXM image below the P L2,3-edge at 130 eV. (B) Image at 145eV, which is above the P L2,3 edge. The dark line across the cell on the left handside is the result of beam damage resulting from the line scan at the Ca L2,3-edge (see Fig. 2A). (C) Phosphorus map (generated by subtracting image 3afrom image 3B) showing phosphorus enrichment of the cells. No phosphoruswas detected using the same counting time on cells cultured in regular PYEmedium. Rough estimation of the elemental concentration can be obtainedfrom this image. The concentration of phosphorus is of the same magnitude asthat of calcium.
254 K. BENZERARA et al.
© 2004 Blackwell Publishing Ltd, Geobiology, 2, 249–259
Fig. 4 Spectromicroscopy on C. crescentus cellsshown in Figs 2 and 3 at the carbon K-edge.(A) STXM image taken at 280 eV, which is belowthe carbon K-edge. (B) STXM image taken at288.2 eV (i.e. the resonance energy of amidecarbonyl groups in proteins). Dark spots are relatedto thickness effects. An appendage is observed onthe cell in the middle of the picture and wasobserved for many other cells. (C) Image taken at288.5 eV (i.e the resonance energy of carboxylicgroups in polysaccharides). The polymeric materialbetween the two cells on the right hand side is atmaximum visibility at this energy. (D) Carbon K-edge NEXAFS spectra of two C. crescentus cells(spectra 1 and 2), and the EPS (spectrum 3)resulting from the image stack on the area depictedin Fig. 4 (A). All the areas are outlined on Fig. 4B.The cell spectra were identical for all the areastested. Reference spectra of DNA, albumin (takenas a model for protein), and alginate (taken as amodel for acidic polysaccharides) are shown forcomparison. Labelling of the peaks: a*, aromaticgroups at 285.2 eV; k*, ketonic/phenolic groupsat 286.8 eV; p*, amide carbonyl group (peptidicbond) at 288.2 eV; cx*, carboxylic groups at 288.5eV; na*, C = O groups in nucleic acids at 289.5 eV;cn*, carbonate groups at 290.3 eV.
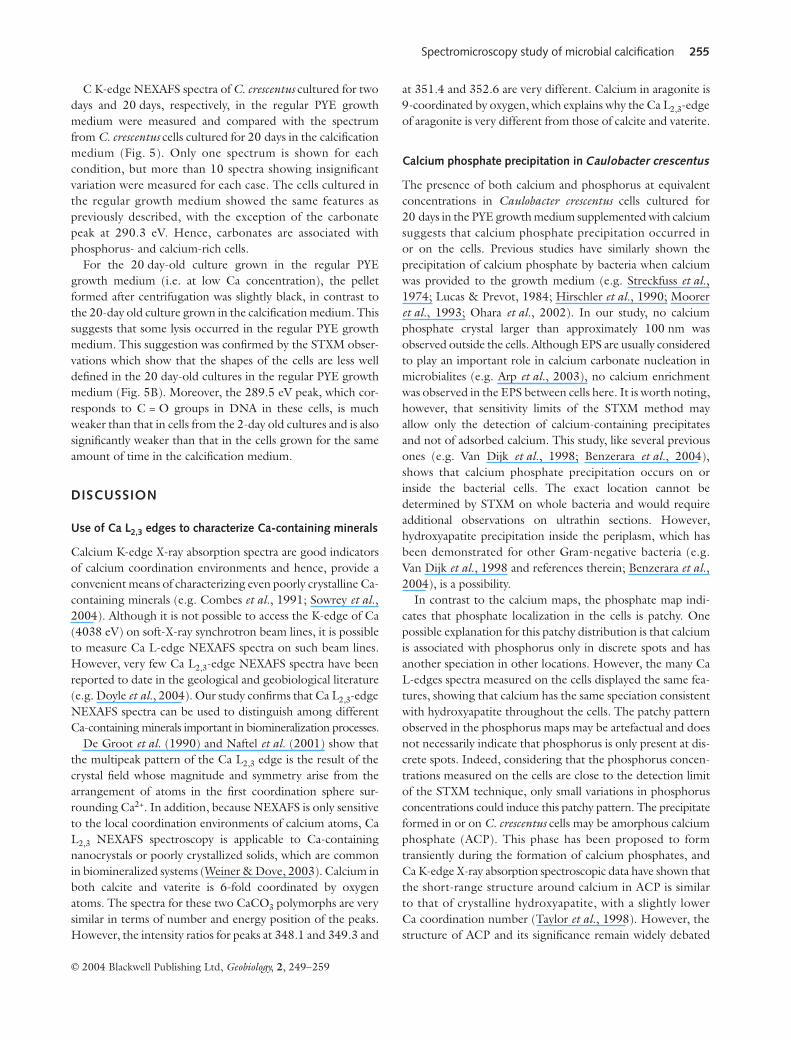
Fig. 5 Spectromicroscopy on C. crescentus cellsgrown in regular PYE medium for (A) 2 days and(B) 20 days. Images were taken at 288.2 eV. Cellsgrown for 2 days show a well defined kidney beanshape and display appendages similar to those oncells grown for 20 days in the calcification medium.The cells grown for 20 days in the regular PYEgrowth medium appear degraded. The presence offragments is suggested because of the electron-dense background. (C) Carbon K-edge NEXAFSspectra of the cells grown under three differentconditions: grown for 2 days in regular medium,grown for 20 days in the calcification medium, andgrown for 20 days in regular medium. Spectra wereidentical for different cells in each condition. Thecarbonate peak at 290.3 eV is unique to the culturegrown in the calcium-rich medium. The intensitiesof the nucleic acid peaks at 289.5 eV for the threesamples are significantly different. Peak labelling,Fig. 4 see caption.
Spectromicroscopy study of microbial calcification 255
© 2004 Blackwell Publishing Ltd, Geobiology, 2, 249–259
C K-edge NEXAFS spectra of C. crescentus cultured for twodays and 20 days, respectively, in the regular PYE growthmedium were measured and compared with the spectrumfrom C. crescentus cells cultured for 20 days in the calcificationmedium (Fig. 5). Only one spectrum is shown for eachcondition, but more than 10 spectra showing insignificantvariation were measured for each case. The cells cultured inthe regular growth medium showed the same features aspreviously described, with the exception of the carbonatepeak at 290.3 eV. Hence, carbonates are associated withphosphorus- and calcium-rich cells.
For the 20 day-old culture grown in the regular PYEgrowth medium (i.e. at low Ca concentration), the pelletformed after centrifugation was slightly black, in contrast tothe 20-day old culture grown in the calcification medium. Thissuggests that some lysis occurred in the regular PYE growthmedium. This suggestion was confirmed by the STXM obser-vations which show that the shapes of the cells are less welldefined in the 20 day-old cultures in the regular PYE growthmedium (Fig. 5B). Moreover, the 289.5 eV peak, which cor-responds to C = O groups in DNA in these cells, is muchweaker than that in cells from the 2-day old cultures and is alsosignificantly weaker than that in the cells grown for the sameamount of time in the calcification medium.
DISCUSSION
Use of Ca L2,3 edges to characterize Ca-containing minerals
Calcium K-edge X-ray absorption spectra are good indicatorsof calcium coordination environments and hence, provide aconvenient means of characterizing even poorly crystalline Ca-containing minerals (e.g. Combes et al., 1991; Sowrey et al.,2004). Although it is not possible to access the K-edge of Ca(4038 eV) on soft-X-ray synchrotron beam lines, it is possibleto measure Ca L-edge NEXAFS spectra on such beam lines.However, very few Ca L2,3-edge NEXAFS spectra have beenreported to date in the geological and geobiological literature(e.g. Doyle et al., 2004). Our study confirms that Ca L2,3-edgeNEXAFS spectra can be used to distinguish among differentCa-containing minerals important in biomineralization processes.
De Groot et al. (1990) and Naftel et al. (2001) show thatthe multipeak pattern of the Ca L2,3 edge is the result of thecrystal field whose magnitude and symmetry arise from thearrangement of atoms in the first coordination sphere sur-rounding Ca2+. In addition, because NEXAFS is only sensitiveto the local coordination environments of calcium atoms, CaL2,3 NEXAFS spectroscopy is applicable to Ca-containingnanocrystals or poorly crystallized solids, which are commonin biomineralized systems (Weiner & Dove, 2003). Calcium inboth calcite and vaterite is 6-fold coordinated by oxygenatoms. The spectra for these two CaCO3 polymorphs are verysimilar in terms of number and energy position of the peaks.However, the intensity ratios for peaks at 348.1 and 349.3 and
at 351.4 and 352.6 are very different. Calcium in aragonite is9-coordinated by oxygen, which explains why the Ca L2,3-edgeof aragonite is very different from those of calcite and vaterite.
Calcium phosphate precipitation in Caulobacter crescentus
The presence of both calcium and phosphorus at equivalentconcentrations in Caulobacter crescentus cells cultured for20 days in the PYE growth medium supplemented with calciumsuggests that calcium phosphate precipitation occurred inor on the cells. Previous studies have similarly shown theprecipitation of calcium phosphate by bacteria when calciumwas provided to the growth medium (e.g. Streckfuss et al.,1974; Lucas & Prevot, 1984; Hirschler et al., 1990; Mooreret al., 1993; Ohara et al., 2002). In our study, no calciumphosphate crystal larger than approximately 100 nm wasobserved outside the cells. Although EPS are usually consideredto play an important role in calcium carbonate nucleation inmicrobialites (e.g. Arp et al., 2003), no calcium enrichmentwas observed in the EPS between cells here. It is worth noting,however, that sensitivity limits of the STXM method mayallow only the detection of calcium-containing precipitatesand not of adsorbed calcium. This study, like several previousones (e.g. Van Dijk et al., 1998; Benzerara et al., 2004),shows that calcium phosphate precipitation occurs on orinside the bacterial cells. The exact location cannot bedetermined by STXM on whole bacteria and would requireadditional observations on ultrathin sections. However,hydroxyapatite precipitation inside the periplasm, which hasbeen demonstrated for other Gram-negative bacteria (e.g.Van Dijk et al., 1998 and references therein; Benzerara et al.,2004), is a possibility.
In contrast to the calcium maps, the phosphate map indi-cates that phosphate localization in the cells is patchy. Onepossible explanation for this patchy distribution is that calciumis associated with phosphorus only in discrete spots and hasanother speciation in other locations. However, the many CaL-edges spectra measured on the cells displayed the same fea-tures, showing that calcium has the same speciation consistentwith hydroxyapatite throughout the cells. The patchy patternobserved in the phosphorus maps may be artefactual and doesnot necessarily indicate that phosphorus is only present at dis-crete spots. Indeed, considering that the phosphorus concen-trations measured on the cells are close to the detection limitof the STXM technique, only small variations in phosphorusconcentrations could induce this patchy pattern. The precipitateformed in or on C. crescentus cells may be amorphous calciumphosphate (ACP). This phase has been proposed to formtransiently during the formation of calcium phosphates, andCa K-edge X-ray absorption spectroscopic data have shown thatthe short-range structure around calcium in ACP is similarto that of crystalline hydroxyapatite, with a slightly lowerCa coordination number (Taylor et al., 1998). However, thestructure of ACP and its significance remain widely debated
256 K. BENZERARA et al.
© 2004 Blackwell Publishing Ltd, Geobiology, 2, 249–259
(Dorozhkin & Epple, 2002). The observed Ca L2,3-edgespectra and the presence of carbonate taken together suggestthat the dominant precipitate in C. crescentus cells in our sam-ples is carbonate-containing hydroxyapatite, which is the mostabundant calcium phosphate biomineral (e.g. Elliott, 2002)and has been reported in previous studies of bacterial calciumphosphate precipitation (e.g. Ohara et al., 2002). The C K-edgedoes not actually provide information about the structuralsurroundings of carbonate groups. They could be presentin calcium carbonate crystals or in hydroxyapatite. STXMcannot distinguish between carbonate hydroxyapatite and ahydroxyapatite mixed with a very small amount of nanometer-sized calcium carbonates. Only transmission electron micro-scopy (TEM) would help address that issue.
However, indirect evidence argues against the presence ofcalcium carbonate in our experiments. For example, the pHof the growth medium (7.1) is low for calcium carbonateprecipitation to occur. Moreover, no calcium carbonate wasdetected at the calcium L-edge and no heterogeneity incarbonate distribution was detected at the carbon K-edge.Therefore, we conclude that no calcium carbonate larger than25 nanometers is present in or on the bacteria. It is likely, thus,that the carbonate groups detected in this study are incorpo-rated into the hydroxyapatite structure by substitution forphosphate groups and, to a lesser extent, OH-ions, as isusually inferred for hydroxyapatite (Mathew & Takagi, 2001).Although STXM is not able to characterize the crystallinity ofthe precipitates, it provides permissive evidence for the pres-ence of carbonate groups in the calcium phosphate precipitatewhich is almost unique at this submicrometer scale. The abilityof STXM to characterize the speciation of carbon in mineralizedcells provides a good signature for the presence of micro-organisms vs. simple macromolecules like proteins or poly-saccharides. C K-edge NEXAFS spectra of microorganismsshow four or five peaks corresponding to C-containing func-tional groups in the different biochemical compounds (e.g.proteins, polysaccharides, and nucleic acids) comprising C.crescentus cells. Although it may be theoretically possible todesign nonmicrobial organic mixtures in the lab displayingsuch a complex spectrum at the C K-edge, with some doubtregarding the peptide bond signal, we believe that the C K-edge spectrum of bacteria is likely unique relative to abioticsystems. The C K-edge spectrum does not, however, provideany information on the metabolic status of the cells, andwhether they are alive or dead has to be assessed by othertechniques. After 20 days of incubation in Ca-rich PYE growthmedium, the mineralized cells retain that biosignature andcan thus be unambiguously recognized. Although we cannotquantify precisely the amount of DNA and proteins remainingin the mineralized cells, the signal associated with these mole-cules is still high in the calcified cells and shows that more thantrace amounts remain.
Previous studies have proposed that proteins are preservedthrough geological time in dinosaur bones (e.g. Embery et al.,
2003), however, little is known about the impact of time,temperature and pressure on the preservation of differentbiochemical compounds in mineralized cells. The comparisonbetween C. crescentus cells grown for 20 days in the calcifica-tion medium and nonmineralized cells cultured for the sameperiod in regular PYE growth medium shows that nucleic acidsare more abundant in the former. Two possible mechanismscould explain this observation: (a) precipitation of calciumphosphates prevents the degradation of nucleic acids by nucle-ases released by the lysis of C. crescentus cells upon aging of thecultures; and (b) calcium at high concentration is toxic, whichresults in slower growth, delayed cell starvation, and thus,delayed lysis of the cells. In this study, we observed that C.crescentus cells cultured in the calcification medium grew moreslowly and were morphologically better preserved than thosegrown in the regular PYE growth medium. Whereas calciumtoxicity has rarely been proposed as a cause for calcium phos-phate precipitation, it is interesting to note that several studies,which have presented evidence for precipitation of lead phos-phate on or in bacteria, have interpreted this phenomenon asa resistance mechanism to lead toxicity (e.g. Levinson et al.,1996; Templeton et al., 2003).
C. crescentus was used in this study as a model for calcifiedbacterial cells without any claim that this bacterium is repre-sentative of the diversity of prokaryotes. The specific chemicalconditions that were used for the calcifying cultures such asthose of high concentration of calcium (comparable to theconcentration of calcium in modern seawater), and a highavailability of phosphorus, may not accurately mimic a widerange of Ca concentrations in natural environments. However,sewage treatment waters, which are rich in phosphate, whereinthe microbial mechanisms of phosphate removal are underinvestigation (Macrae & Smit, 1991), could be good ana-logues, although the presence of calcified Caulobacter sp. cellsin such an environment has not been verified.
Advantages and limitations of STXM in geobiology studies
This study aims to experimentally produce calcified microbialcells similar to those suspected to exist in the geologicalrecord (Nathan et al., 1993; Baturin et al., 2000), and, usingthese samples, to test the capabilities of STXM as ananalytical tool for inferring the biogenic origin of Ca-containing minerals. It is beyond the scope of this study toaddress the validity of the chemical signatures for biogenicity,and we direct the reader to Nealson (2001) and Pasteris &Wopenka (2003) and references therein for a more extensivediscussion of this topic. We believe, however, that chemicalcharacterization at the submicrometer scale is necessary toinfer the biogenicity of natural objects, including fossilizedmicroorganisms.
Like Raman spectroscopy, STXM offers the possibility tocharacterize both the mineral and the organic components ofa sample with minimal sample preparation and without any
Spectromicroscopy study of microbial calcification 257
© 2004 Blackwell Publishing Ltd, Geobiology, 2, 249–259
prior dehydration, as the measurements are done at ambienttemperature and pressure and can even be done in solution.The maximum thickness of a STXM sample allowing imagingand spectroscopy at the C K-edge is about one micron. Thisconstraint could require prior thinning or powdering pro-cedures for geological samples. STXM requires access to aspecialized synchrotron radiation beam line (only about half adozen such beam lines are currently available worldwide),which results in more limited access compared to Raman spec-troscopy, but it provides unique capabilities. For example, theability of STXM to characterize carbon speciation at a spatialresolution of 25 nanometers is particularly well suited for thetypical submicrometer-sized, heterogeneous biominerals ofinterest in geobiology. TEM-based electron energy loss spec-troscopy (EELS) can be used to study much smaller features,but it does not provide the spectral resolution that can beachieved by STXM (i.e. approximately 0.1 eV) at least forcurrent TEMs. We have shown that the carbon K-edge at highspectral resolution allows differentiation between various C-containing functional groups. Bacterial cells display a complexspectrum at the carbon K-edge with contributions from aro-matic, carboxylic, and peptidic functional groups. When suchfunctional groups are associated and concentrated in an objectthat has the size and the morphology of a microorganism, thisfinding may provide permissive evidence for a biogenic originof terrestrial carbonate or phosphate deposits. Recent resultsshow that cells from bacterial strains as diverse as Bacillussubtilis, Shewanella oneidensis, and Caulobacter crescentus dis-play almost identical carbon K-edge spectra (data not shown).This suggests that the spectra reported in this study may begood signatures for many bacteria and do not provide anyphylogenetic information.
The degree of preservation of these molecules in biominer-alized cells as a function of time is another issue to be consideredin investigations of geological deposits. Pasteris & Wopenka(2003) have discussed the problem of distinguishing abioticcarbonaceous deposits from biogenic kerogens as aging andmetamorphism tend to enrich the residues in aromatic com-pounds and make them look similar spectroscopically. Theability to study carbon speciation at high spatial resolutionwith STXM may offer the possibility of detecting small areaswith remnants of relatively pristine biomolecules. Anotherapproach may come from the use of STXM to detect the pres-ence of other chemical elements like nitrogen, for example,and to determine their speciation. As the absorption of X-raysis measured in transmission using STXM, the sensitivity is notas good as that achieved by high energy X-ray fluorescencemeasurements as presented by Kemner et al. (2004). Thislimitation of STXM prevents it from detecting elements atvery low concentrations. However, soft X-rays provide betterspatial resolution than hard X-rays (25 nm vs. 150 nm as dis-cussed in Kemner et al., 2004) and allow one to study lightelements like carbon, nitrogen, and oxygen, which are likelyrequired to assess the biogenicity of an object. A combination
of both soft and hard X-ray spectromicroscopy approaches islikely the best solution.
Natural samples are usually highly heterogeneous, and theoccurrence of fossilized microbes in such samples may be rare,making the detection of traces of life highly challenging. Animportant advantage offered by STXM is the energy filteredimaging capability. Indeed, it is possible to scan quickly (in afew seconds) relatively large areas (e.g. 40 µm × 40 µm) of asample at an energy at which carbon absorbs. By taking theimage of the same area below the carbon K-edge, it is thenpossible to map areas rich in carbon as is shown in Figs 1(C),2(C) and 3(C). It is possible to be even more specific whenlooking for microorganisms by taking advantage of the factthat they absorb strongly at an energy characteristic of pep-tides (288.2 eV). However, other carbon functional groupsmay absorb a little at this energy. Most of their contributioncan be removed by taking an image at a close energy (e.g.288.6 eV) and subtracting this image from the other.
Although the present study has not proven that a certainclass of organic molecule is responsible for the formationof calcium phosphates in C. crescentus, it has been able todistinguish among several different biochemical compounds,including proteins, EPS, and DNA associated with hydr-oxyapatite biominerals in or on these cells. Proteins, poly-saccharides, or lipids have been shown experimentally to bepotential matrices for the precipitation of calcium-containingminerals (e.g. Bradt et al., 1999; Collier & Messersmith, 2001;Veis, 2003; Zhang et al., 2004), but the relative importance ofeach class of molecules for calcification in nature is yet to bedetermined. The study of natural carbonate and phosphatedeposits of suspected biogenic origin by STXM may helpin determining which of these biomolecules are the mostfrequent ones associated with calcium carbonates and calciumphosphates in nature. Finally, we suggest that characterizationof purported nanobacteria by STXM could help resolve thedebate about whether they are calcified microorganisms orcalcified macromolecules of a single type, such as proteins.
ACKNOWLEDGEMENTS
We thank the National Science Foundation for support of thisstudy through grants CHE-0089215 (Stanford UniversityCRAEMS on Chemical and Microbial Interactions at En-vironmental Interfaces), CHE-0431425 (Stanford Environ-mental Molecular Science Institute), EAR-9905755, andthe DOE GTL program (grant DE-FG02-01ER63219). Wealso wish to acknowledge financial support from a grant fromthe Stanford Institute for the Environment. We thank CollinDoyle, who kindly provided the carbonate reference compounds,Plamena Entcheva, who provided the Caulobacter crescentusCB15 strain, and Janice Lee, who provided the hydroxyapatitepowders. K. Benzerara thanks the French Foreign Ministry fora Lavoisier Fellowship. A. P. Hitchcock (McMaster University)is thanked for providing reference carbon K-edge spectra for
258 K. BENZERARA et al.
© 2004 Blackwell Publishing Ltd, Geobiology, 2, 249–259
DNA, albumin and sodium alginate. The STXM studies wereconducted on branch line 11.0.2.2 at the Advanced LightSource, which is supported by the Office of Science, Office ofBasic Energy Sciences, Division of Materials Sciences, andDivision of Chemical Sciences, Geosciences, and Biosciences ofthe U.S. Department of Energy at Lawrence Berkeley NationalLaboratory under contract No. DE-AC03-76SF00098. Wethank Kurt Konhauser and three anonymous reviewers forhelping to improve this article.
REFERENCES
Arp G, Reimer A, Reitner J (2003) Microbialite formation in seawater of increased alkalinity, Satonda crater lake, Indonesia. Journal of Sedimentary Research 73, 105–127.
Baturin GN, Dubinchuk VT, Zhegallo EA (2000) Bacteria-like formations in phosphorites of the Namibian shelf. Oceanology 40, 737–741.
Benzerara K, Menguy N, Guyot F, Skouri-Panet F, DeLuca G, Barakat M, Heulin H (2004) Biologically controlled precipitation of calcium phosphate by Ramlibacter tataouinensis. Earth Planet Science Letters 228, 439–449.
Benzerara K, Yoon TH, Menguy N, Tyliszczak T, Brown GE, JR (2005a) Nanoscale environments associated with bioweathering of a Mg-Fe-Pyroxene. Proceedings of the National Academy of Sciences of the USA 102, 979–982.
Blake RE, Alt JC, Martini AM (2001) Oxygen isotope ratios in PO4: an inorganic indicator of enzymatic activity and P metabolism and a new biomarker in the search for life. Proceedings of the National Academy of Sciences of the USA 98, 2148–2153.
Bradt JH, Mertig M, Teresiak A, Pompe W (1999) Biomimetic mineralization of collagen by combined fibril assembly and calcium phosphate formation. Chemistry Mat 11, 2694–2701.
Collier JH, Messersmith PB (2001) Phospholipid strategies in biomineralization and biomaterials research. Annals of Review of Mat Science 31, 237–263.
Combes J-M, Brown GE, Jr. Waychunas GA (1991) X-ray absorption study of the local Ca environment in silicate glasses. In XAFS VI, 6th International Conference on X-Ray Absorption Fine Structure (ed. Hasnain SS). Ellis Horwood Ltd, Publishers, Chichester, UK pp. 312–314.
De Groot FMF, Fuggle JC, Thole BT, Sawatzky GA (1990) 2p X-ray absorption of 3d transition-metal compounds – an atomic multiplet description including the crystal-field. Physical Review of B 42, 5459–5468.
Dorozhkin SV, Epple M (2002) Biological and medical significance of calcium phosphates. Ang Chem Intl Ed 41, 3130–3146.
Doyle CS, Kendelewicz T, Brown GE Jr (2004) Inhibition of the reduction of Cr (VI) at the magnetite–water interface by calcium carbonate coatings. Applied Surf Science 230, 260–271.
Elliott JC (2002) Calcium phosphate biominerals. Review of Mineral and Geochemistry 48, 427–453.
Embery G, Milner AC, Waddington RJ, Hall RC, Langley MS, Milan AM (2003) Identification of proteinaceous material in the bone of the dinosaur Iguanodon. Connective Tissue Research 44, 41–46.
Folk RL (1999) Nanobacteria and the precipitation of carbonate in unusual environments. Sedimen Geology 126, 47–55.
Ghidoni JJ (2004) Role of Bartonella henselae endocarditis in the nucleation of aortic valvular calcification. Annals of Thoracic Surgery 77, 704–706.
Hirschler A, Lucas J, Hubert J-C (1990) Bacterial involvement in apatite genesis. FEMS Microbiological Ecology 73, 211–220.
Hitchcock AP (2000) http://unicorn.mcmaster.ca/aXis2000.html.Kajander EO, Ciftcioglu N, Aho K, Garcia-Cuerpo E (2003)
Characteristics of nanobacteria and their possible role in stone formation. Urological Research 31, 47–54.
Kaznacheyev K, Osanna A, Jacobsen C, Plashkevych O, Vahtras O, Agren H (2002) Inner shell absorption spectroscopy of amino acids. Journal of Physical Chemistry A 106, 3153–3168.
Kemner KM, Kelly SD, Lai B, Maser J, O’Loughlin EJ, Sholto-Douglas D, Cai ZH, Schneegurt MA, Kulpa CF, Nealson KH (2004) Elemental and redox analysis of single bacterial cells by X-ray microbeam analysis. Science 306, 686–687.
Kralj D, Brecevic L, Nielsen AE (1994) Vaterite growth and dissolution in aqueous-solution.2. kinetics of dissolution. Journal of Cryst Growth 143, 269–276.
Lawrence JR, Swerhone GDW, Leppard GG, Araki T, Zhang X, West MM, Hitchcock AP (2003) Scanning transmission X-ray, laser scanning, and transmission electron microscopy mapping of the exopolymeric matrix of microbial biofilms. Applied Environmental Microbiology 69, 5543–5554.
Levinson HS, Mahler I, Blackwelder P, Hood T (1996) Lead resistance and sensitivity in Staphylococcus aureus. FEMS Microbiological Letters 145, 421–425.
Lucas J, Prevot L (1984) Apatite synthesis by bacterial activity from phosphatic organic matter and several calcium carbonates in natural fresh-water and seawater. Chemistry Geology 42, 101–118.
Macrae JD, Smit J (1991) Characterization of Caulobacters isolated from waste water treatments. Applied Environmental Microbiology 57, 751–758.
Mathew M, Takagi S (2001) Structures of biological minerals in dental research. Journal of Research Nat Institute Standards Technology 106, 1035–1044.
Miller VM, Rodgers G, Charlesworth JA, Kirkland B, Severson SR, Rasmussen TE, Yagubyan M, Rodgers JC, Cockerill FR, Folk RL, Rzewuska-Lech E, Kumar V, Farell-Baril G, Lieske JC (2004) Evidence of nanobacterial-like structures in calcified human arteries and cardiac valves. American Journal of Physiological-Heart Circulation Physiology 287, H1115–H1124.
Mojzsis SJ, Arrhenius G (1998) Phosphates and carbon on Mars: exobiological implications and sample return considerations. Journal of Geophysics Research 103 (E12), 28495–28511.
Moorer WR, Tencate JM, Buijs JF (1993) Calcification of a cariogenic streptococcus and of Corynebacterium (Bacterionema) Matruchotii Journal of Dentistry Research 72, 1021–1026.
Myneni SCB (2002) Soft X-ray spectroscopy and spectromicroscopy studies of organic molecules in the environment. Review of Mineral Geochemistry 49, 485–579.
Naftel SJ, Sham TK, Yiu YM, Yates BW (2001) Calcium 1-edge XANES study of some calcium compounds. Journal of Synchrotron Rad 8, 255–257.
Nathan Y, Bremner JM, Lowenthal RE, Monteiro P (1993) Role of bacteria in phosphorite genesis. Geomicrobiological Journal 11, 69–76.
Nealson K (1999) Panel 2: discussion, in size limits of very small microorganisms. Space Studies Board, National Research Council: Washington, DC. National Academy Press, pp. 39–42.
Nealson KH (2001) Searching for life in the universe – lessons from the Earth. Annals of the New York Academy of Sciences 950, 241–258.
Nierman WC, Feldblyum TV, Laub MT, Paulsen IT, Nelson KE, Eisen J, Heidelberg JF, Alley MRK, Ohta N, Maddock JR, Potocka I, Nelson WC, Newton A, Stephens C, Phadke ND, Ely B, DeBoy
Spectromicroscopy study of microbial calcification 259
© 2004 Blackwell Publishing Ltd, Geobiology, 2, 249–259
RT, Dodson RJ, Durkin AS, Gwinn ML, Haft DH, Kolonay JF, Smit J, Craven MB, Khouri H, Shetty J, Berry K, Utterback T, Tran K, Wolf A, Vamathevan J, Ermolaeva M, White O, Salzberg SL, Venter JC, Shapiro L, Fraser CM (2001) Complete genome sequence of Caulobacter crescentus. Proceedings of the Nat Academy of Sciences of the USA 98, 4136–4141.
Ohara N, Ohara N, Yanagiguchi K, Yamada S, Viloria IL, Hayashi Y (2002) Expression of alkaline phosphatase induces rapid and artificial mineralization in specific transformed Escherichia coli. Microbiologica 25, 107–110.
Pasteris JD, Wopenka B (2003) Necessary, but not sufficient: Raman identification of disordered carbon as a signature of ancient life. Astrobiology 3, 727–738.
Poindexter JS (1981) The caulobacters – ubiquitous unusual bacteria. Microbiological Reviews 45, 123–179.
Ravenscroft N, Walker SG, Dutton G, Gs Smit J (1991) Identification, isolation and structural studies of extracellular polysaccharides produced by Caulobacter crescentus. Journal of Bact 173, 5677–5684.
Rieger D, Himpsel FJ, Karlsson UO, McFeely FR, Morar JF, Yarmoff JA (1986) Electronic-structure of the CAF2/Si (111) interface. Physical Review of B 34, 7295–7306.
Sanchez-Navas N, Martin-Algarra A (2001) Genesis of apatite in phosphate stromatolites. European Journal of Miner 13, 361–376.
Sowrey FE, Skipper LJ, Pickup DM, Drake KO, Lin Z, Smith ME, Newport RJ (2004) Systematic empirical analysis of calcium-oxygen coordination environment by calcium K-edge XANES. Physical Chemistry Chemical Physics 6, 188–192.
Streckfuss JL, Smith WN, Brown LR, Campbell MM (1974) Calcification of selected strains of Streptococcus mutans and Streptococcus sanguis. Journal of Bact 120, 502–506.
Taylor MG, Simkiss K, Simmons J, Wu LNY, Wuthier RE (1998) Structural studies of a phosphatidyl serine-amorphous calcium phosphate complex. Cell Molecular Life Science 54, 196–202.
Templeton AS, Trainor TP, Spormann AM, Newville M, Sutton SR, Dohnalkova A, Gorby Y, Brown GE Jr (2003) Sorption vs. biomineralization of Pb (II) within Burkholderia cepacia biofilms. Environmental Science Technology 37, 300–307.
Trion A, van der Laarse A (2004) Vascular smooth muscle cells and calcification in atherosclerosis. American Heart Journal 147, 808–814.
Tyliszczak T, Warwick T, Kilcoyne ALD, Fakra S, Shuh DK, Yoon TH, Brown GE, Jr Andrews S, Chembrolu V, Strachan J, Acremann Y (2004) Soft X-ray scanning transmission microscope working in an extended energy range at the advanced light source. Synchrotron Radiation Instrumentation 2003, AIP Conference Proceedings 705, 1356–1359.
Vali H, McKee MD, Çiftçioglu N, Sears SK, Plows FL, Chevet E, Ghiasi P, Plavsic M, Kajander EO, Zare RN (2001) Nanoforms: a new type of protein-associated mineralization. Geochemica Cosmochemica Acta 65, 63–74.
Van Dijk S, Dean DD, Zhao Y, Cirgwin JM, Schwartz Z, Boyan BD (1998) Purification, amino acid sequence, and cDNA sequence of novel calcium-precipitating proteolipids involved in calcification of Corynebacterium matruchotii. Calcif Tissue Internation 62, 350–358.
Veis A (2003) Mineralization in organic matrix frameworks. Review of Mineral Geochemistry 54, 249–289.
Weiner S, Dove PM (2003) An overview of biomineralization processes and the problem of the vital effect. Review of Mineral Geochemistry 54, 1–29.
Yoon TH, Johnson SB, Benzerara K, Doyle CS, Tyliszczak T, Shuh DK, Brown GE Jr (2004) In situ characterization of aluminum-containing mineral-microorganism aqueous suspensions using scanning transmission X-ray microscopy. Langmuir 20, 10361–10366.
Zhang LJ, Liu HG, Feng XS, Zhang RJ, Zhang L, Mu YD, Hao JC, Qian DJ, Lou YF (2004) Mineralization mechanism of calcium phosphates under three kinds of Langmuir monolayers. Langmuir 20, 2243–2249.