scanning acoustic microscopy investigation of frequency-dependent reflectance of acid- etched human...
TRANSCRIPT
1
Scanning acoustic microscopy investigation of frequency-
dependent reflectance of acid-etched human dentin using
homotopic measurements
Orestes Marangos1,3
, Anil Misra1,3
, Paulette Spencer2,3
, J. Lawrence Katz3
1Civil, Environmental and Architectural Engineering Department,
2Mechanical Engineering
Department, 3Bioengineering Research Center (BERC), University of Kansas, 1530 W. 15th
Street, Lawrence, KS 66045-7609
Accepted for publication in:
IEEE Transactions on UFFC(in print)
Corresponding Author:
Dr. Anil Misra
Professor, Civil, Environmental and Architectural Engineering Department
The University of Kansas
Learned Hall
1530 W. 15th Street
Lawrence, KS 66045-7609
Ph: (785) 864-1750
Fax: (785) 864-5631
Email: [email protected]
Running Title: Homotopic scanning acoustic microscopy of acid-etched human dentin
hal-0
0555
784,
ver
sion
1 -
14 J
an 2
011

2
Abstract
Composite restorations in modern restorative dentistry rely on the bond formed in the adhesive
infiltrated acid-etched dentin. The physical characteristics of etched dentin are, therefore, of
paramount interest. However, characterization of the acid-etched zone in its natural state is
fraught with problems stemming from a variety of sources including its narrow size, presence of
water, heterogeneity, and spatial scale dependency. We have developed a novel homotopic
(same location) measurement methodology utilizing scanning acoustic microscopy (SAM).
Homotopic measurements with SAM overcome the problems encountered by other
characterization/imaging methods. These measurements provide us with acoustic reflectance at
the same location of both the pre- and post-etched dentin in its natural state. We have applied
this methodology for in vitro measurements on dentin samples. Fourier spectra from acid-etched
dentin showed amplitude reduction and shifts of the central frequency that were location
dependent. Through calibration, the acoustic reflectance of acid-etched dentin was found to have
complex and non-monotonic frequency dependence. This data suggest that acid-etching of
dentin results in a near surface graded layer of varying thickness and property gradations. The
measurement methodology described in this paper can be applied to systematically characterize
mechanical properties of heterogeneous soft layers and interfaces in biological materials.
Keywords: acoustic microscopy; dentin; acid-etching; elasticity; acoustic reflectance; homotopic
hal-0
0555
784,
ver
sion
1 -
14 J
an 2
011

3
I. INTRODUCTION
The acid-etched human dentin surface plays a significant role in modern restorative
dentistry. Composite restorations rely on the bond formed in the adhesive infiltrated acid-etched
dentin. The knowledge of the physical characteristics of etched dentin is therefore critical for
understanding the bonding mechanism and behavior. However, the characterization of the acid-
etched zone presents significant challenges. Firstly, the high spatial heterogeneity induced by
etching, requires location-specific comparison to the dentin state prior to acid application.
Secondly, the physical properties are very sensitive to intrusive specimen preparation and
experimental conditions such as exposure to drying. Finally, scale-dependent physical properties
arising from the acid-etching regime need to be measured using probes that provide various
spatial resolutions. To address these problems, we performed homotopic measurements using
scanning acoustic microscope/microscopy (SAM) to characterize the acid-etched dentin surface.
The term homotopic (Greek homos = identical and topos = place) has been introduced recently
by the authors [1] to describe the methodology under which measurements of a set of material
properties, for example physical and mechanical properties, are performed at the same location
of the same sample. In SAM, measurements are performed in an aqueous environment, such that
the etched dentin is maintained in its near natural hydrated state. Since SAM is a non-destructive
technique, the dentin surface from the same specimen can be characterized before and after
etching. Moreover, homotopic measurements can be performed at different frequencies to reveal
the scale-dependent physical characteristics of heterogeneous substrates while avoiding spatial
mismatch when comparing measurements obtained before and after etching.
Here we describe the results obtained from SAM measurements of a dentin surface
before and after etching. Using SAM we are able to obtain the acoustic reflectance through
precise homotopic measurements at selected locations using two broadband transducers of
different central frequencies. Since SAM can be used over large regions at high resolutions,
measurements were obtained at micro-scale resolution over the whole etched dentin such that
different locations of the same substrate can be directly compared. These measurements show
for the first time that different locations of the same substrate have different etching behavior.
They also indicate that acid-etching of dentin results in severe alteration of its near-surface
composition and microstructure. The reflection coefficients from SAM measurements are found
hal-0
0555
784,
ver
sion
1 -
14 J
an 2
011

4
to have a complex frequency dependence, which suggests that acid-etched dentin can be
characterized as near surface graded layer of varying thickness and property gradations.
In the subsequent discussion, we first give a brief background of the significance of
dentin acid-etching, its characterization and the applicability of SAM. We then describe the
specific methodology used for data acquisition and analysis. Finally, we discuss the obtained
results.
II. BACKGROUND
A. Acid-Etched Dentin Role in Restorative Dentistry
Since its inception, the problem of bonding composite restorations to dentin has behaved
as the “Lernaean Hydra.” During dentin surface preparation, a layer of debris known as the
“smear layer” is produced that proved to be the culprit for the premature failure of early resin
composite restorations [2], [3]. In order to improve these restorations, a conditioning step before
adhesive application was suggested in which the dentin surface is exposed to a phosphoric acid
treatment for a short duration of few seconds [4]. Although the phosphoric acid-etching step
served its intended purpose of removing the smear layer from the dentin surface, it also
completely altered the near-surface of the exposed dentin creating a new and unknown substrate,
different from the native tissue. The unexpected outcome of the etching regime was the removal
of the mineral from the first few micrometers of dentin leaving behind a porous collagen scaffold
[5], [6]. The resulting inter-phase from the subsequent application of the dentin adhesive system
was a highly heterogeneous composite of collagen, mineral and adhesive monomer, known as
the “hybrid layer” [7]. Consequently, researchers in clinical dentistry have been working to
understand the effects that acid-etching imposes on dentin and its relationship to bonding
efficiency and to develop alternative conditioning techniques as well as adhesive formulations
that are compatible with the etched substrate.
B. Acid-Etched Dentin Characterization
A number of techniques have been used to investigate acid-etched dentin. High
resolution scanning electron microscopy (SEM) and transmission electron microscopy (TEM)
observations showed that the near-surface of acid-etched inter-tubular dentin was separated into
three distinct sub-layers [8]. The first layer was comprised of collapsed disorganized collagen
hal-0
0555
784,
ver
sion
1 -
14 J
an 2
011
5
that could potentially inhibit adhesive infiltration [2], [9], [10]. Beneath it, the collagen showed
partial structure with sparse instances of residual mineral. The third layer was a partially de-
mineralized zone that transitioned to the deeper native dentin. Attempts have been made to
quantify the dimensional changes that occur in dentin during demineralization and to relate them
to the mineral density distribution as a function of depth using Atomic Force Microscopy (AFM)
and X-ray tomography [5]. Their work, suggested that the tubule orifices become wider and the
mineral density distribution is affected by two different rates of demineralization. The extent of
demineralization of the acid-etched zone as well as the effects on the tubule orifice widening has
been shown to vary with the conditioner used, the concentration of the conditioner, time of
exposure and technique [11]-[13]. Furthermore, the extent of demineralization has been shown
to depend on the substrate as dentin may be sclerotic or affected by caries [14], [15].
The profile and degree of inter-tubular dentin demineralization under short-term
clinically relevant exposure to acid-etching has been most effectively shown using infrared and
micro-Raman spectroscopic techniques [16]-[21]. Results from these studies, have shown
clearly that the adhesives were unable to completely infiltrate the dentin etched-surface.
Roughness and surface recession of acid-etched dentin have been observed using AFM and
profilometry [11], [22], [23]. However, surface topography measurements do not provide
information regarding the changes in the subsurface alteration of composition and structure.
Mechanical property measurements of etched dentin are scarce. AFM-based indentation
has been used under small deformations to obtain the visco-elastic and elastic values of de-
mineralized dentin [24]. According to their work, the Young‟s modulus of elasticity of hydrated
de-mineralized dentin was, ~0.2 MPa, whereas that for de-hydrated de-mineralized dentin was
~2 GPa. Indentation studies are very challenging for substrates such as etched dentin and the
interaction of the indent with soft graded substrates is not well defined.
The above techniques are imperfect since they either alter the material state due to sample
preparation prior to imaging or the data interpretation is based upon models that ignore the
material complexity. Although these techniques provide highly localized measurements, they do
so over a very limited area. As a result the information of how the different regions of a
substrate are affected by the same treatment is obscured. In addition, these techniques preclude
pre- and post etching comparisons of the same locations.
hal-0
0555
784,
ver
sion
1 -
14 J
an 2
011

6
These imperfect characterization techniques have increased our qualitative understanding
of the morphological and ultra-structural characteristics of acid-etched dentin. However, there is
a big gap in our knowledge of the physical properties of acid-etched dentin. This gap is
confounded by the fact that natural materials have varying structure and composition at different
spatial scales which is ultimately responsible for how material properties manifest in
experimental measurements.
C. Scanning Acoustic Microscopy
Scanning acoustic microscopy appeared in the early 1970‟s as a new research technique
that could provide measurement of mechanical properties of a substrate at spatial resolutions
comparable to that of optical instruments [25]. Since then, it has received considerable attention
and has been used in numerous applications for imaging as well as quantitative characterization
[26], [27]. Applications of SAM to dental tissues have been limited. In the earliest efforts of
application of SAM to dental materials, carious enamel lesions were imaged at a spatial
resolution of approximately 4 m [28]-[29]. Even though the work was largely qualitative, the
sensitivity of SAM in detecting small changes in elastic properties of enamel and the existence of
an intimate relationship to the level of de-mineralization was recognized. The visco-elastic
properties of dental hard tissues have been investigated using line focus and point focus
objectives and it was found that the surface acoustic wave velocities and attenuations showed a
variation with frequency, position and direction for both enamel and dentin [30]. More recently,
SAM at 25-100 MHz was used for obtaining acoustic impedance images of teeth [31]. At 50
MHz, longitudinal wave velocities in dentin were measured using SAM in reflectance mode and
time of flight. In mantle dentin near the enamel the longitudinal wave velocities were found to
be 7% to 8% less than in bulk dentin [32]. SAM at 400 MHz was used to infer the mechanical
properties of mineralized, partially de-mineralized and completely de-mineralized dentin through
a series of calibration curves [33]-[34]. The effect of storage media on the acoustic properties of
enamel and dentin has been evaluated with SAM at 50 MHz [35]. None of these studies have
investigated the frequency-dependent reflectance of acid-etched human dentin.
The principle of acoustic microscopy is well-known. An acoustic wave-field is generated
by a piezoelectric element and focused onto a specimen by a lens. During SAM measurements,
the specimen is typically immersed in water (or other suitable coupling fluid). In reflection
hal-0
0555
784,
ver
sion
1 -
14 J
an 2
011

7
acoustic microscopy, the ultrasonic field interacts with the near-surface of the material in
question and part of it reflects back through the coupling medium to the lens. The lens redirects
the field which arrives back to the piezoelectric element. The deformation of the piezoelectric
element creates a potential difference which is displayed by an oscilloscope as a waveform.
Such waveforms are called A-Scans. The element and the lens are located in the same housing
which is termed the ultrasonic objective. In SAM, the objective is coupled with an x-y-z
positioning system that enables raster scan over the specimen surface. As the objective is
scanned over the specimen, an A-Scan signal is acquired for each scanned location and selected
signal parameters may then be displayed as a grayscale image, termed a C-Scan. A schematic
showing the SAM setup used is shown in Fig. 1.
The spatial resolution of the generated acoustic field is a function of the operating
frequency and the lens dimensions. Consequently, it is possible to successively interrogate finer
material volumes by using ultrasonic objectives of increasing frequency. The ability to
interrogate different material volumes allows for characterization of complex substrates with
varying microstructures. These substrates are known to exhibit dissipative properties that
manifest as a dispersion or spreading of acoustic pulses as they propagate through the thickness
of a material [36]. A related wave propagation phenomenon is the frequency dependence of
reflection coefficients. In this work, we exploit this acoustic wave/substrate interaction
phenomenon and the non-destructive capabilities of SAM to investigate the frequency-dependent
reflectance of the acoustic signals from acid-etched human dentin.
III. MATERIALS AND METHODS
A. Dentin Sample Preparation and Storage
A human unerupted 3rd molar with no visual caries was used under an institutional
review board (IRB) approved protocol. The project only involved teeth that were already
treatment planned for extraction for other reasons. The only exclusion criteria were teeth that
were fractured during extraction. The teeth were not identified by patient number or name. Each
patient signed a patient consent form when signing the treatment plan. The specimen preparation
proceeded as follows: first the root was sectioned perpendicular to its long axis to create a
surface for mounting the tooth on to a metal stub, subsequently, the occlusal crown was removed
and, finally a second section at the cervical third, right below the neck of the tooth was made
hal-0
0555
784,
ver
sion
1 -
14 J
an 2
011
8
resulting in an approximately 5 mm thick crown segment as shown in Fig. 2. We note that the
pulpal side of the crown segment was not ground in order to maintain the parallelism of the top
and bottom surfaces. The sectioning was performed using a H2O-cooled low-speed diamond saw
(Buehler, Lake Bluff, IL). To remove surface irregularities such as saw marks and the smear
layer caused by the diamond saw the specimen was polished successively by 600 and 1200 grit
size abrasive papers followed by a few passes with a polishing cloth (Buehler, Lake Bluff, IL).
An alternative protocol for removing the smear layer was evaluated which included micro-
toming approximately a 5 μm section from the surface. Micro-toming was evaluated, as
previous researchers have suggested that polishing has a tendency to alter the surface
microstructure by smearing the collagen and mineral [37]. We found that micro-toming
generally resulted in some damage of the dentin structure and even more at the vicinity of the
dentin-enamel junction (DEJ). In contrast, hand polishing using 600 to 1200 grit paper produced
uniform and smooth surfaces for SAM measurement. We also found that the results from SAM
were not affected provided the polishing was done by applying a light pressure and the surfaces
are rinsed clean promptly after polishing. For the acid-etching studies, the tooth was etched for
20 seconds using 35% phosphoric acid (H3PO4). The phosphoric acid was thoroughly rinsed
with distilled water. When the specimen was not used, it was stored in phosphate buffered saline
solution with 0.002% sodium azide, thus keeping it constantly hydrated.
B. SAM Calibration
Elastic property characterization using acoustic microscopy is typically based upon
surface acoustic wave velocity measurements. However, there are cases where the aperture of
the ultrasonic objective does not favor the generation of leaky Rayleigh waves or any other type
of surface waves from the specimen. In such cases one relies only on the reflected signal
amplitude to recover the elastic properties of the material. Numerous researchers have used
SAM in pulse-echo mode to directly measure material reflection coefficient and, consequently,
acoustic impedance [33]-[34], [38]-[41].
A commercially available SAM (WINSAM 100, Kramer Scientific Instruments GmbH,
Herborn, Germany) was used in pulse-echo mode. Two ultrasonic objectives were used, with
piezoelectric elements vibrating at resonant frequencies of 30 MHz (KSI PT30-002) and 110
MHz. In the subsequent discussion we will refer to the KSI PT30-002 objective as “Transducer
hal-0
0555
784,
ver
sion
1 -
14 J
an 2
011
9
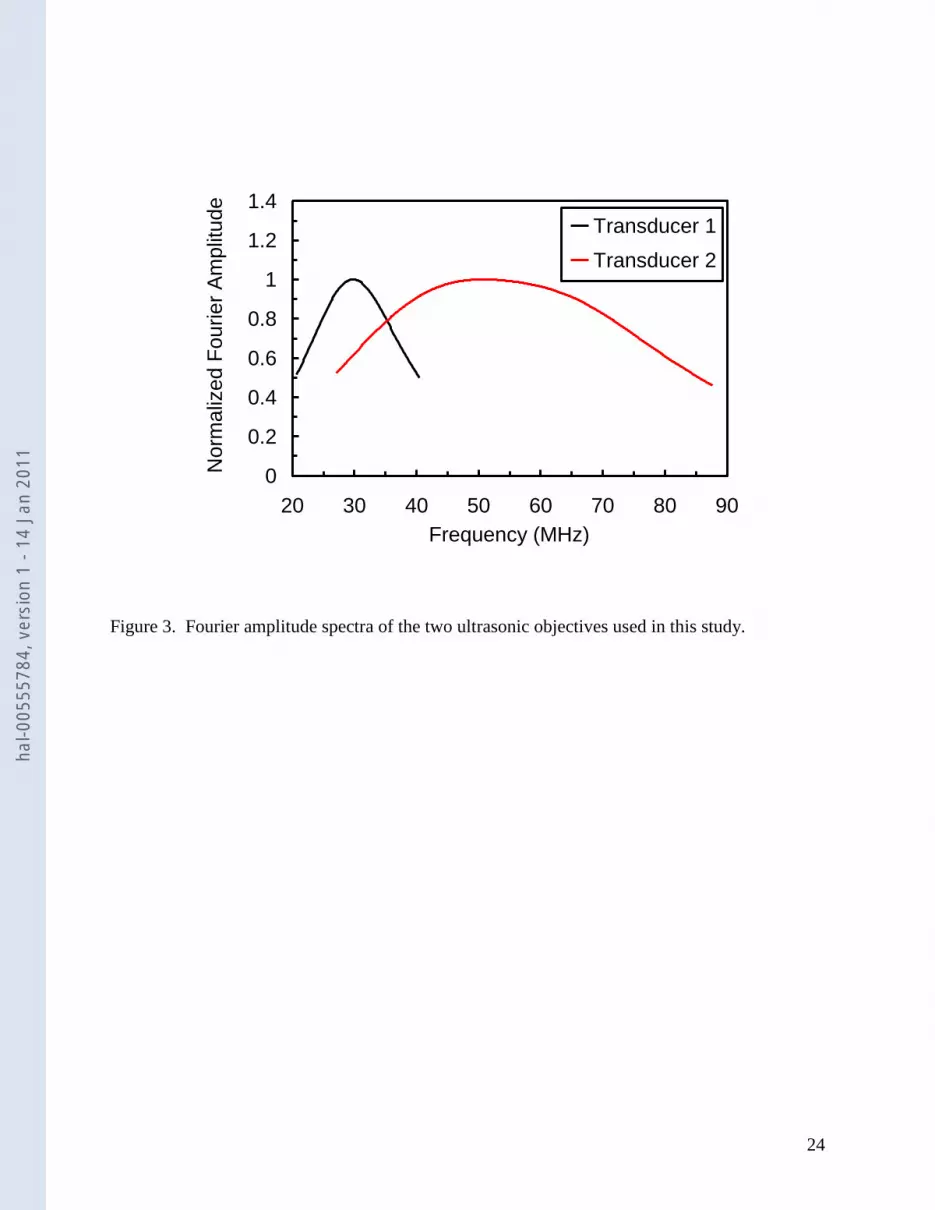
1” and the 110 MHz objective as “Transducer 2.” The transducer specifications are given in
Table I. To propagate the ultrasonic signal to the specimen, distilled water was used as the
coupling fluid. The temperature of the coupling fluid was monitored and was found to be 22-
24ºC. The Fourier amplitude spectra for the two objectives are shown in Fig. 3.
For soft materials, such as de-mineralized dentin, the reflected signal amplitude is weak
and high amplification settings have to be used to obtain measurable signals. This received
signal is influenced by the saturation effects of system electronics at high amplifications. The
accuracy of the calculated properties is greatly compromised if the saturation effects are not
properly considered. Therefore, calibration relationships were developed based upon a
methodology that can distinguish the effect of system electronics from the material response [1].
To obtain the calibration relationships, a set of materials was used that provided a wide range of
reflection coefficients. The reflection coefficients of these materials were independently
determined and juxtaposed with the corresponding Fourier amplitudes measured in SAM over
the frequencies spanning the -6 dB bandwidth of each objective. The resulting frequency-
dependent calibration relationships can be used to obtain the reflection coefficient of an
unknown material using the following best fit relationship:
W
mW
oR
VRa
R
RRaV
)(
1
1)(1 (1)
where V is the measured Fourier amplitude of the unknown substrate, VWm is the measured
Fourier amplitude of the tungsten target, R is the reflection coefficient of the unknown substrate,
RW is the reflection coefficient of the tungsten target, and a1() and ao() are frequency-
dependent fitting constants. The applicability of the calibration relationships to predict low
reflection coefficient (softer) materials that lie outside the range used for calibration was tested.
To that end, the reflection coefficients for LDPE and TPX®, which are low moduli polymeric
materials, were predicted and compared with those obtained through independent measurements.
We note that in acoustic wave propagation, the reflection coefficient is strictly defined as
the complex amplitude corresponding to a reflected plane wave. The focused pressure wave-
field that emanates from the ultrasonic objective in SAM can be considered as a superposition of
plane waves that are propagating at various directions of incidence. As these plane waves reflect
from the surface of the substrate they get modified by the substrate reflectance function, which in
general, is a function of both angle and frequency. Thus, the reflection coefficient that is
hal-0
0555
784,
ver
sion
1 -
14 J
an 2
011
10
obtained for the unknown substrate through the calibration is the magnitude of an average
reflection coefficient over all of the angles of incidence. This reflection coefficient varies from
zero to 1, where an interface with reflection coefficient of 1 is a perfect reflector.
C. Homotopic Measurement Protocol
Dentin substrates inherently vary from location to location and respond in a heterogeneous
manner to surface treatments. To characterize the heterogeneity of the acid- etching process, the
specimen was measured in SAM both before and after acid-etching. Since the etching process
could not be performed in situ, it was necessary that the specimen be moved and placed back in
SAM. Moreover, since multiple ultrasonic objectives were used, it was necessary for the lower
resolution measurement to contain the region measured with the higher resolution. Therefore, for
meaningful comparison between the pre- and post-acid-etched states of the specimen, an acquisition
protocol and location system was developed that allowed us to perform homotopic measurements
while moving the sample from its original position within SAM or using different objectives [42].
The homotopic measurement methodology used in this work, does not rely on image
matching and processing that is typically associated with methods such as image registration, data
fusion or data integration. The main drawback of these image-based methods is that the matching
of regions of interest (ROI) is performed directly on the images post-data acquisition. In these
methods, for images with a given pixel size (which are related to the resolution of the imaging
modality), the distances between locations in the ROI that have undergone rigid body motions are
generally not preserved. Thus the overlap of the ROI, and more importantly the overlap of the
material volumes represented by each pixel on the image, is not guaranteed. Clearly, if
homotopic measurements are not made and image-based methods are used instead, both, the
quantitative before and after comparison, and the comparison of information at different
resolutions, as that required in this study, can be highly erroneous.
The data acquisition was completed in two phases: (1) a pre-acid-etching phase and (2) a
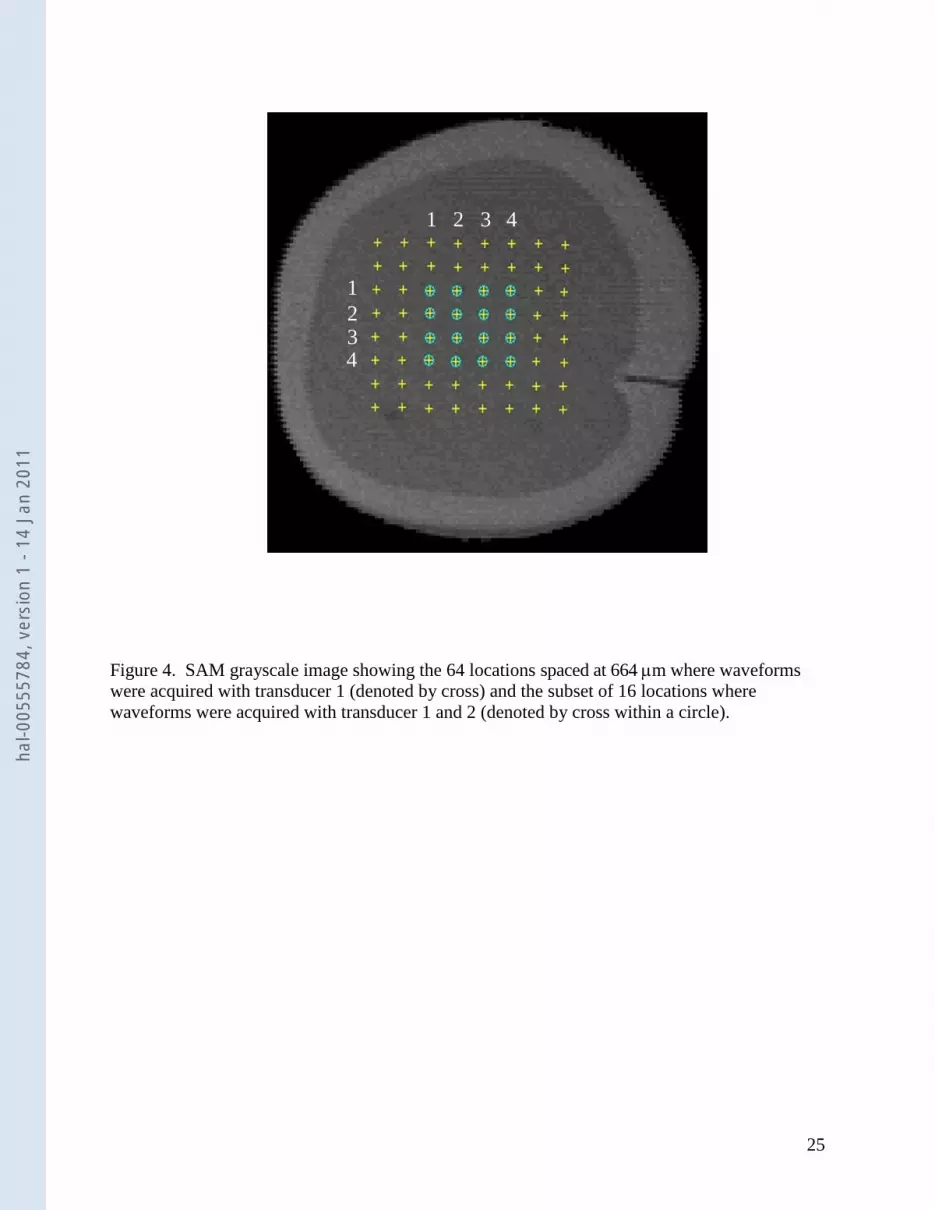
post-acid-etching phase. Before acid-etching, sixty four locations of interest were identified over
the specimen surface arranged as shown in Fig. 4 and spaced at 664 m. At each of the 64
locations, 32 waveforms were acquired. Care was taken so that the acoustic field was focused on all
of the selected locations. Transducer 1 was then replaced by transducer 2. Out of the 64 locations,
the central subset of 16 locations was selected and 32 waveforms were acquired over each of these
hal-0
0555
784,
ver
sion
1 -
14 J
an 2
011
11
Pre Acid Etching Post Acid Etching
locations. At completion of the pre-acid-etching phase, the specimen was removed from SAM and
acid-etched as described in the „Sample Preparation‟ section. After etching, the specimen was
placed again in SAM and the same procedure as the pre-acid-etching phase was followed. During
this process, images were used as guidance to recover the initially measured locations. Once the
point of interest was relocated the measurement was performed. This is a key distinction from the
image-based methods in which the measurements are done first and the attempt to match images
performed later. As discussed above, the image matching could lead to errors. Using our
homotopic measurement methodology, it was possible to relocate the point of interest with a
precision that is within 10% of the spatial resolution of the ultrasonic objective as determined by
repeated relocation of points of interests.
D. Data Analysis
Following data acquisition, the 32 waveforms acquired at each location were averaged,
gated and Fourier transformed. The amplification setting for the data acquired with transducer 1
was 6 dB whereas for transducer 2 the amplification setting was set to 24 dB. These
amplification settings were chosen so that the signal to noise ratio was sufficient while the
saturation effects due to the electronics were not excessive. The calibration relationships
corresponding to these gain settings were retrieved and by inverting Eq. 1, the measured Fourier
amplitudes were converted to reflection coefficients over the useful frequency bandwidth of each
transducer.
IV. RESULTS AND DISCUSSION
A. C-Scans and Waveforms
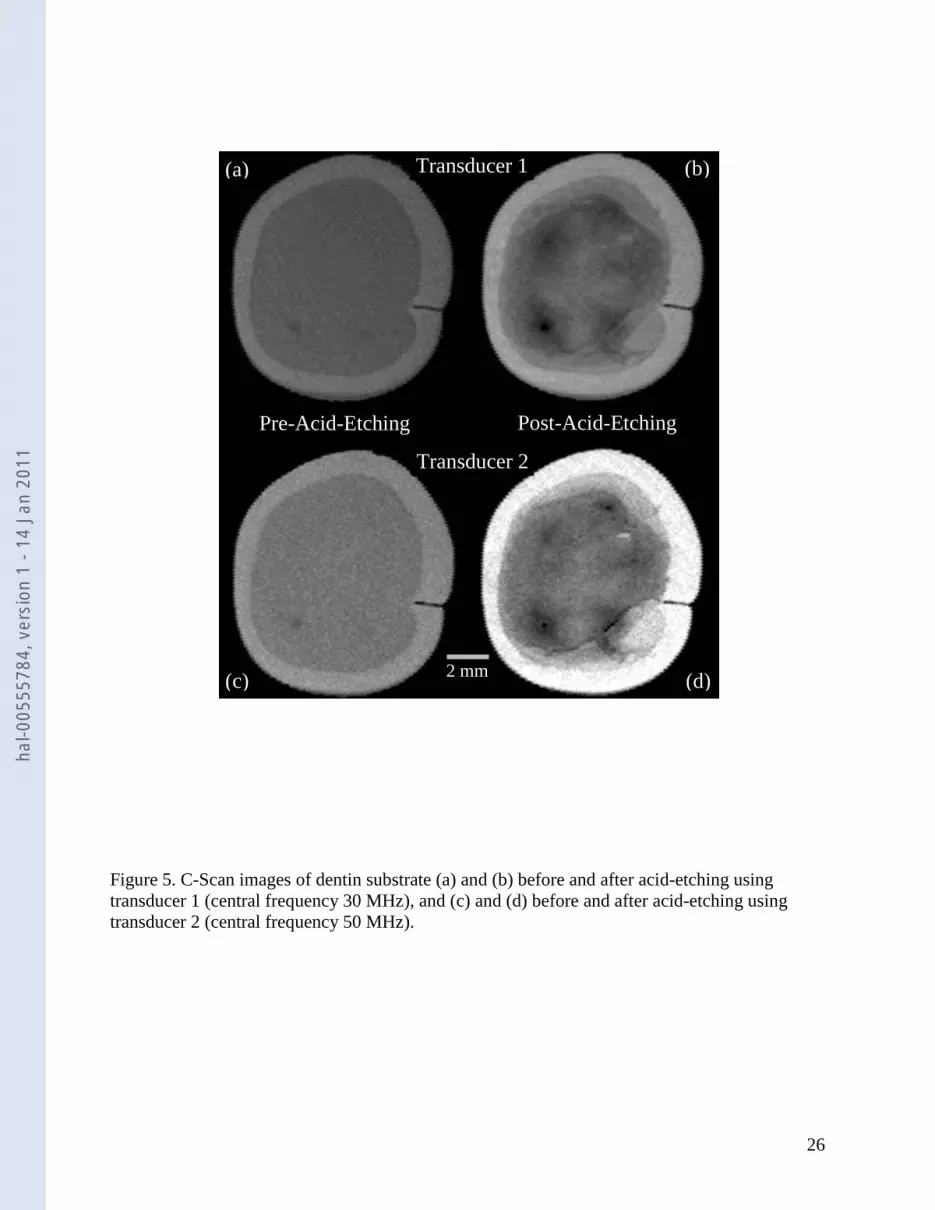
C-Scans for the pre- and post-acid-etching states for both transducers are compared in
Fig. 5. The brightness of the images was uniformly increased in order to highlight the alterations
due to acid-etching. In the images shown in Fig. 5, the outer lighter ring is the enamel, while in
the inner darker region is the dentin. Before acid-etching, the dentin surface was homogeneous
in terms of grayscale values. However, after acid-etching stark differences were observed. After
etching, different regions on the dentin surface appeared to have varying grayscale values, which
indicate a change of the reflectance of the substrate in a location dependent manner. The A-scan
hal-0
0555
784,
ver
sion
1 -
14 J
an 2
011

12
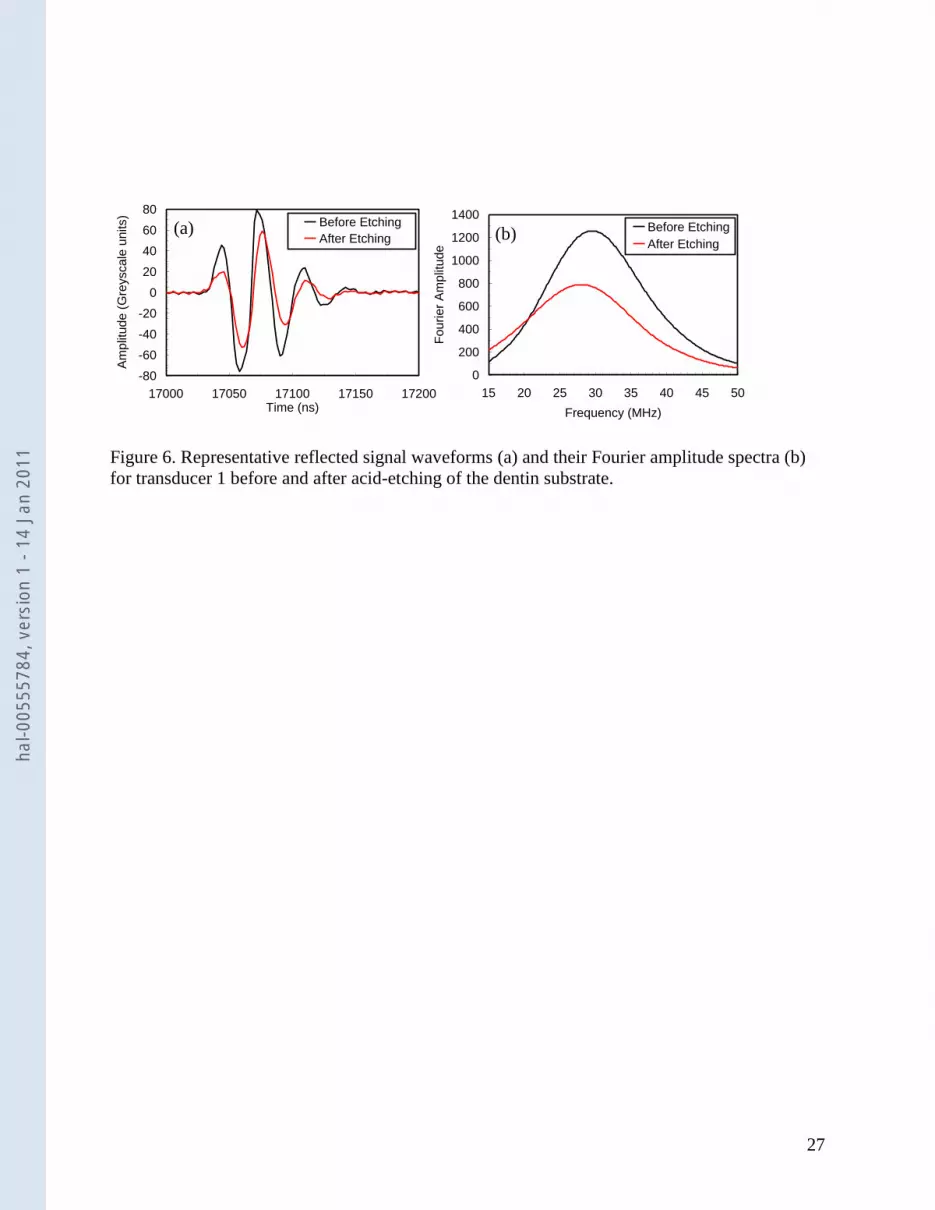
signal amplitudes after etching were significantly lower than before acid-etching at the same
locations, as shown in Fig. 6.
B. Fourier Amplitude Spectra
To further understand the differences between locations of the dentin substrate before and
after acid-etching, we examined the Fourier amplitude spectra of the subset of the sixteen
locations where waveforms were obtained from both transducers. Fourier amplitude spectra
from three selected locations following the grid-numbering scheme of Fig. 4 are shown in Fig. 7.
These three locations were chosen because they are representative of the observed frequency
dependence. The Fourier amplitude spectra from transducer 1, before etching, showed minor
differences. After etching however, a general reduction in the overall amplitude was observed
accompanied by a downshift of the peak frequency that differed depending upon the location.
For transducer 2, the Fourier amplitude spectra revealed remarkable differences. While before
etching the Fourier amplitudes were almost identical at all locations, after etching each location
showed a different frequency behavior. Although, a reduction of the Fourier amplitudes was
consistently observed, the frequency shift behavior was highly variable between locations. For
example, at location (1, 1), the peak frequency was up-shifted while at location (2, 4) the
amplitude spectrum exhibited a plateau over a large range of frequencies (35-60 MHz). At
location (3, 3) a downshift of the peak frequency was noted.
C. Reflection Coefficients
For quantitative comparison, the reflection coefficients as a function of frequency were
determined using Eq. 1 for the subset of the sixteen locations. Since the useful band-widths of
each transducer overlapped, as shown in Fig. 3, the reflection coefficients for all sixteen
locations were plotted as a function of frequency for both transducers on the same graph as
shown in Fig. 8. As a result, frequency-dependent reflection coefficients for the range of from
25 MHz to 70 MHz were obtained. As shown, all the locations after etching were generally
different in terms of their reflectance. For example, at a frequency of approximately 25 MHz,
the reflection coefficient ranged between 0.49 and 0.65. This is a significant difference
especially since the measurement error in the mean reflection coefficient is approximately 0.01
based upon an error analysis of Eq. 1 [43]. Similar range of the reflection coefficient amplitude
hal-0
0555
784,
ver
sion
1 -
14 J
an 2
011

13
was observed over all the frequencies of the combined result. Interestingly, in the range between
40 and 70 MHz, several locations showed a non-monotonic behavior in the amplitude of the
reflection coefficient.
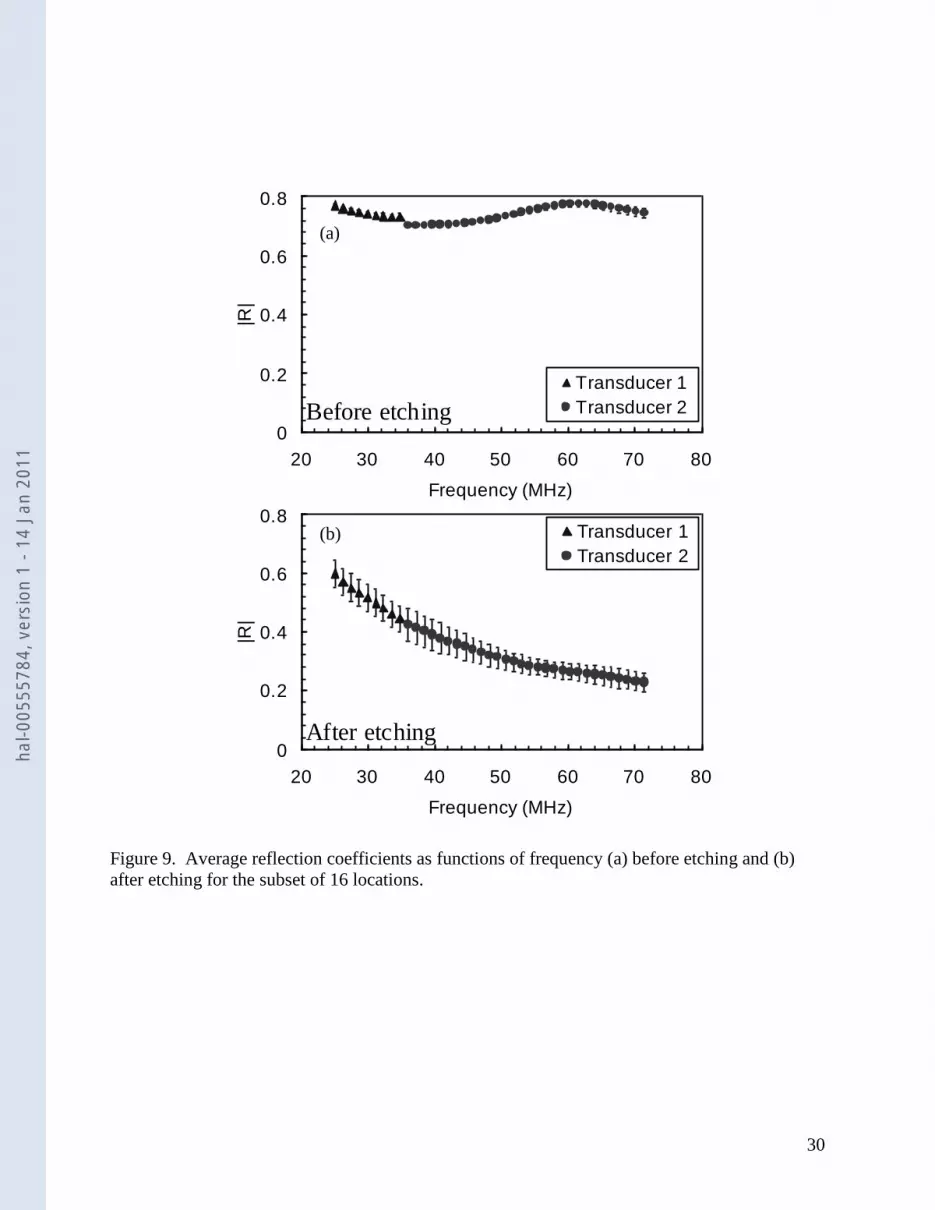
In Fig. 9, we plot the average reflection coefficient of the sixteen locations shown in Fig.
8. Each data point represents the spatial average of the 16 locations and the error bars show their
spatial standard deviations. The average reflection coefficients confirm our previous
observations. Before etching, the reflection coefficient was bounded between 0.7 and 0.8 over
the frequency range 25-70 MHz. The standard deviation at each frequency was less than 0.01.
However after etching, the average reflection coefficient showed a gradual reduction and ranged
between 0.6 and 0.2. At the same time, the spatial standard deviation increased to approximately
0.04 which indicates the location dependent reflectance. It is noteworthy that the average
behavior can be very misleading, since it obscures the phenomena that are location specific.
Since the reflection process involves interaction with a material volume of dimensions
comparable to an acoustic wavelength (wavelength in the coupling fluid for SAM, which is ~20-
75m for our testing), severe attenuation needs to occur in order for frequency dependence to be
detected. For example, it has been shown that for visco-elastic polymeric materials, the
contribution of attenuation to the reflection coefficients becomes important as the contrast
between the elastic reflection coefficients becomes small [44]. Significant attenuation in the
reflection can occur for substrates whose near-surface properties vary with depth as is expected
for acid-etched dentin, especially when the layer thickness is comparable to the acoustic
wavelength. Attenuation of reflectance can also occur in the presence of roughness [45] or
lateral microstructure. These attenuation mechanisms are sensitive to the acoustic wavelength of
the incident wave and the characteristic size of the graded layer or the surface roughness. For the
frequency (acoustic wavelength) range used in our SAM measurements, we expect that the
attenuation and the non-monotonic dependence of reflection coefficients on frequency can be
explained by the presence of near-surface graded layer. Surface roughness is likely to have a
small effect considering that etching induced mean roughness and surface recession have been
found to be less than 1 micron based upon AFM and conventional profilometry of de-
mineralized dentin [11], [22], [23], [46]. Theoretical models of ultrasonic wave propagation in
substrates with graded near-surface properties can be used to quantify property gradation as well
hal-0
0555
784,
ver
sion
1 -
14 J
an 2
011

14
as layer thickness or surface roughness. The theoretical analysis will be presented in a future
publication.
The spatial variability of the frequency-dependent attenuation behavior suggests that
depth and extent of etching is location-dependent, such that the result of etching can be described
as a layer of varying thickness (up to ~100m) and property gradations (from ~2 GPa of
demineralized collagen at the top to ~30 GPa of the native dentin at the bottom of the graded
layer). Such large spatial variability of etched dentin is likely to be explained by the native local
microstructural organization, including the shape, size and orientation of apatitic crystallites as
well as the diameter, orientation, and density of dentinal tubules. For the sample used in this
study, the central zone is likely to be further from the pulp chamber than the peripheral regions.
In this case the microstructural organization of the central zone is expected to be different than
that of the peripheral regions. Although the effect of the microstructural features before etching
is insignificant, post-etching the effect could be large due to the likely higher permeability and
etch potential of the peripheral region. From the clinical viewpoint, the adhesive is required to
infiltrate and bond in this highly variable environment. It is therefore not surprising to find
uninfiltrated, exposed collagen below the hybrid layer in composite restorations. The exposed
collagen becomes a weak link in the adhesive bonding of composite restorations [47].
V. CONCLUSION
The physical characteristics of etched dentin are of clinical interest since composite
restorations rely upon the bond formed by the etched dentin and adhesive. There are
considerable obstacles in characterization of the acid-etched zone in its natural state using
traditional imaging methods such as SEM, TEM and AFM. These techniques either alter the
material state due to sample preparation prior to imaging or their data interpretation is based
upon models that ignore the material complexity. In addition, these techniques do not provide
the mechanical properties. In this paper, we have described a novel homotopic (same location)
measurement methodology using scanning acoustic microscopy to characterize acid-etched
dentin. We find that SAM overcomes the problems encountered by other
imaging/characterization methods due to its non-destructive nature and the ability to perform
measurements in aqueous environment at a range of frequencies so as to reveal the scale-
dependent characteristics of the material. Furthermore, the homotopic measurement
hal-0
0555
784,
ver
sion
1 -
14 J
an 2
011
15
methodology utilized in this work allows meaningful comparison between two different states of
the same substrate, as is the case for acid-etched dentin. The homotopic measurement
methodology is essential when comparisons are performed with techniques capable of localized
measurements, such as SAM and indentation, or when quantitative multi-scalar characterizations
of heterogeneous medium are required. The homotopic measurement methodology differs
fundamentally from the image-based methods, such as image registration, data fusion and data
integration.
Using SAM, both C-scans as well as detailed waveforms were acquired from the same
dentin sample before and after acid-etching. These measurements provided us with acoustic
reflectance at the same location of the pre- and post-etched dentin surface over a range of
frequencies. We find that by performing the measurements over the chosen range of frequencies,
we can detect the near-surface graded nature of the acid etched dentin. Acoustic reflectance of
acid-etched dentin was found to have significant spatial variation and attenuation compared to
native dentin. These results show for the first time that different locations of the same substrate
can have vastly different etching behavior. Additionally, the observed frequency dependence
suggests that acid-etching of dentin results in a near surface graded layer of varying thickness
and property gradations. The attenuation behavior can be analyzed using theoretical methods to
potentially quantify property gradation as well as layer thickness.
There are clinical implications of this finding as the dental literature suggests that only
the first few microns of the etched dentin surface are eventually infiltrated by the dentin
adhesive. Thus, the dentin-adhesive bonding is a near-surface interaction of the adhesive and the
etched adherent, which is mostly de-mineralized dentin. Our results would then suggest that a
soft graded layer is present underneath the composite restoration. The contribution of this layer
to the eventual failure of the composite restoration is expected to be significant and deserves to
be investigated.
ACKNOWLEDGEMENTS
This research supported in part by: National Institutes of Health/ National Institute of Dental and
Craniofacial Research (R01DE014392-08 and 3R01DE014392-08S1).
hal-0
0555
784,
ver
sion
1 -
14 J
an 2
011

16
REFERENCES
[1] O. Marangos, A. Misra, P. Spencer, B. Bohaty, and J. L. Katz, “Physico-mechanical
properties determination using microscale homotopic measurements: Application to
sound and caries-affected primary tooth dentin,” Acta Biomater., vol. 5, no. 4, pp. 1338-
1348, May 2009.
[2] J. D. Eick, “Smear layer-materials surface,” Proc. Finn. Dent. Soc., vol. 88 Suppl 1, pp.
225-242, 1992.
[3] I. R. H. Kramer, and J. W. McLean, “Alterations in the staining reaction of dentine
resulting from a constituent of a new self-polymerizing resin,” Brit. Dent. J., vol. 93, pp.
150-153, 1952.
[4] M. G. Buonocore, “A simple method of increasing the adhesion of acrylic filling
materials to enamel surfaces,” J. Dent. Res., vol. 34, no. 6, pp. 849-853, Dec. 1955.
[5] J. H. Kinney, M. Balooch, D. L. Haupt, S. J. Marshall, and G. W. Marshall, “Mineral
distribution and dimensional changes in human dentin during demineralization,” J. Dent.
Res., vol. 74, no. 5, pp. 1179-1184, May 1995.
[6] D. H. Pashley, B. Ciucchi, H. Sano, and J. A. Horner, “Permeability of dentin to adhesive
agents,” Quintessence Int., vol. 24, no. 9, pp. 618-631, Sep. 1993.
[7] N. Nakabayashi, K. Kojima, and E. Masuhara, “The promotion of adhesion by the
infiltration of monomers into tooth substrates,” J. Biomed. Mater. Res., vol. 16, no. 3, pp.
265-273, 1982.
[8] B. Van Meerbeek, A. Dhem, M. Goret-Nicaise, M. Braem, P. Lambrechts, and G.
Vanherle, “Comparative SEM and TEM examination of the ultrastructure of the resin-
dentin interdiffusion zone,” J. Dent. Res., vol. 72, no. 2, pp. 495-501, Feb. 1993.
[9] N. Nakabayashi, M. Ashizawa, and M. Nakamura, “Identification of a resin-dentin hybrid
layer in vital human dentin created in vivo: Durable bonding to vital dentin,”
Quintessence Int., vol. 23, no. 2, pp. 135-141, Feb. 1992.
[10] P. Spencer, and J. R. Swafford, “Unprotected protein at the dentin-adhesive interface,”
Quintessence Int., vol. 30, no. 7, pp. 501-507, Jul. 1999.
[11] S. S. Oliveira, S. J. Marshall, J. F. Hilton, and G. W. Marshall, “Etching kinetics of a
self-etching primer,” Biomaterials, vol. 23, no. 20, pp. 4105-4112, Oct. 2002.
[12] A. H. Susin, L. S. Alves, G. P. de Melo, and T. L. Lenzi, “Comparative scanning electron
microscopic study of the effect of different dental conditioners on dentin
micromorphology,” J. Appl. Oral Sci., vol. 16, no. 2, pp. 100-105, Apr. 2008.
[13] Y. Wang, and P. Spencer, “Effect of acid etching time and technique on interfacial
characteristics of the adhesive-dentin bond using differential staining,” Eur. J. Oral Sci.,
vol. 112, no. 3, pp. 293-299, Jun. 2004.
[14] G. W. Marshall, Y. J. Chang, K. Saeki, S. A. Gansky, and S. J. Marshall, “Citric acid
etching of cervical sclerotic dentin lesions: An AFM study,” J. Biomed. Mater. Res., vol.
49, no. 3, pp. 338-344, Mar. 2000.
[15] G. W. Marshall, Y. J. Chang, S. A. Gansky, and S. J. Marshall, “Demineralization of
caries-affected transparent dentin by citric acid: An atomic force microscopy study,”
Dent. Mater., vol. 17, no. 1, pp. 45-52, Jan. 2001.
[16] R. Lemor, M. B. Kruger, D. M. Wieliczka, P. Spencer, and T. May, “Dentin etch
chemistry investigated by Raman and infrared spectroscopy,” J. Raman Spectrosc., vol.
31, no. 3, pp. 171-176, Mar. 2000.
hal-0
0555
784,
ver
sion
1 -
14 J
an 2
011
17
[17] A. Santini, and V. Miletic, “Quantitative micro-Raman assessment of dentine
demineralization, adhesive penetration, and degree of conversion of three dentine
bonding systems,” Eur. J. Oral Sci., vol. 116, no. 2, pp. 177-183, Apr. 2008.
[18] P. Spencer, Y. Wang, M. P. Walker, D. M. Wieliczka, and J. R. Swafford, “Interfacial
chemistry of the dentin/adhesive bond,” J. Dent. Res., vol. 79, no. 7, pp. 1458-1463, Jul.
2000.
[19] M. Suzuki, H. Kato, and S. Wakumoto, “Vibrational analysis by raman-spectroscopy of
the interface between dental adhesive resin and dentin,” J. Dent. Res., vol. 70, no. 7, pp.
1092-1097, Jul. 1991.
[20] Y. Wang, and P. Spencer, “Hybridization efficiency of the adhesive/dentin interface with
wet bonding,” J. Dent. Res., vol. 82, no. 2, pp. 141-145, Feb. 2003.
[21] D. M. Wieliczka, M. B. Kruger, and P. Spencer, “Raman imaging of dental adhesive
diffusion,” Appl. Spectrosc., vol. 51, no. 11, pp. 1593-1596, Nov. 1997.
[22] S. Y. Ma, J. Y. Cai, X. W. Zhan, and Y. Z. Wu, “Effects of etchant on the nanostructure
of dentin: an atomic force microscope study,” Scanning, vol. 31, no. 1, pp. 28-34, Jan.-
Feb. 2009.
[23] J. I. Rosales, G. W. Marshall, S. J. Marshall, L. G. Watanabe, M. Toledano, M. A.
Cabrerizo, and R. Osorio, “Acid-etching and hydration influence on dentin roughness and
wettability,” J. Dent. Res., vol. 78, no. 9, pp. 1554-1559, Sep. 1999.
[24] M. Balooch, I. C. Wu-Magidi, A. Balazs, A. S. Lundkvist, S. J. Marshall, G. W.
Marshall, W. J. Siekhaus, and J. H. Kinney, “Viscoelastic properties of demineralized
human dentin measured in water with atomic force microscope (AFM)-based
indentation,” J. Biomed. Mater. Res., vol. 40, no. 4, pp. 539-544, Jun. 1998.
[25] R. A. Lemons, and C. F. Quate, “Acoustic microscope-scanning version,” Appl. Phys.
Lett., vol. 24, no. 4, pp. 163-165, 1974.
[26] G. A. D. Briggs, Acoustic microscopy. Oxford, GBR: Clarendon, 1992.
[27] R. G. Maev, Acoustic microscopy: Fundamentals and applications. Weinheim, DEU:
Wiley-VCH, 2008.
[28] S. D. Peck, and G. A. D. Briggs, “A scanning acoustic microscope study of the small
caries lesion in human enamel,” Caries Res., vol. 20, no. 4, pp. 356-360, Jul.-Aug. 1986.
[29] S. D. Peck, J. M. Rowe, and G. A. D. Briggs, “Studies on sound and carious enamel with
the quantitative acoustic microscope,” J. Dent. Res., vol. 68, no. 2, pp. 107-112, Feb.
1989.
[30] J. Kushibiki, K. L. Ha, H. Kato, N. Chubachi, and F. Dunn, "Application of acoustic
microscopy to dental material characterization," in Proc. IEEE Ultrasonics Symp., 1987,
vol. 1, pp. 837-842.
[31] Y. P. Zheng, E. Y. Maeva, A. A. Denisov, and R. G. Maev, "Ultrasound imaging of
human teeth using a desktop scanning acoustic microscope," in Acoustical Imaging, vol.
24, H. Lee, ed. New York, NY: Kluwer Academic/Plenum, 2002, pp. 165-171.
[32] R. G. Maev, L. A. Denisova, E. Y. Maeva, and A. A. Denissov, “New data on histology
and physico-mechanical properties of human tooth tissue obtained with acoustic
microscopy,” Ultrasound. Med. Biol., vol. 28, no. 1, pp. 131-136, Jan. 2002.
[33] J. L. Katz, S. Bumrerraj, J. Dreyfuss, Y. Wang, and P. Spencer, “Micromechanics of the
dentin/adhesive interface,” J. Biomed. Mater. Res. B Appl. Biomater., vol. 58, no. 4, pp.
366-371, 2001.
hal-0
0555
784,
ver
sion
1 -
14 J
an 2
011

18
[34] J. L. Katz, P. Spencer, T. Nomura, A. Wagh, and Y. Wang, “Micromechanical properties
of demineralized dentin collagen with and without adhesive infiltration,” J. Biomed.
Mater. Res. A, vol. 66A, no. 1, pp. 120-128, 2003.
[35] K. Raum, K. Kempf, H. J. Hein, J. Schubert, and P. Maurer, “Preservation of microelastic
properties of dentin and tooth enamel in vitro - A scanning acoustic microscopy study,”
Dent. Mater., vol. 23, no. 10, pp. 1221-1228, Oct. 2007.
[36] J. Ophir, and P. Jaeger, “Spectral shifts of ultrasonic propagation through media with
nonlinear dispersive attenuation,” Ultrason. Imaging, vol. 4, no. 3, pp. 282-289, 1982.
[37] S. P. Ho, M. Balooch, S. J. Marshall, and G. W. Marshall, “Local properties of a
functionally graded interphase between cementum and dentin,” J. Biomed. Mater. Res. A,
vol. 70A, no. 3, pp. 480-489, Sep. 2004.
[38] S. Hirsekorn, S. Pangraz, G. Weides, and W. Arnold, “Measurement of elastic impedance
with high spatial resolution using acoustic microscopy,” Appl. Phys. Lett., vol. 67, no. 6,
pp. 745-747, Aug. 1995.
[39] S. Hirsekorn, S. Pangraz, G. Weides, and W. Arnold, “Measurement of elastic impedance
with high spatial resolution using acoustic microscopy (vol 67, pg 745, 1995),” Appl.
Phys. Lett., vol. 69, no. 14, pp. 2138-2138, Sep. 1996.
[40] M. Prasad, “Mapping impedance microstructures in rocks with acoustic microscopy,”
The Leading Edge, vol. 20, no. 2, pp. 172-179, Feb. 2001.
[41] K. Raum, K. V. Jenderka, A. Klemenz, and J. Brandt, “Multilayer analysis: Quantitative
scanning acoustic microscopy for tissue characterization at a microscopic scale,” IEEE
Trans. Ultrason. Ferroelectr. Freq. Control, vol. 50, no. 5, pp. 507-516, May 2003.
[42] O. Marangos, "Scanning acoustic microscopy modeling for micromechanical
measurements of complex substrates," Ph.D. dissertation, Dept. of Civil, Environmental
and Architectural Eng., Univ. Kansas, Lawrence, 2010.
[43] J. R. Taylor, An introduction to error analysis : The study of uncertainties in physical
measurements. Sausalito, CA: University Science Books, 1997.
[44] T. Bourbié, and A. Nur, “Effects of attenuation on reflections: Experimental test,” J.
Geophys. Res., vol. 89, no. B7, pp. 6197-6202, Jul. 1984.
[45] P. B. Nagy, and L. Adler, “Surface roughness induced attenuation of reflected and
transmitted ultrasonic waves,” J. Acoust. Soc. Am., vol. 82, no. 1, pp. 193-197, Jul. 1987.
[46] M. Toledano, R. Osorio, J. Perdigao, J. I. Rosales, J. Y. Thompson, and M. A. Cabrerizo-
Vilchez, “Effect of acid etching and collagen removal on dentin wettability and
roughness,” J. Biomed. Mater. Res. A, vol. 47, no. 2, pp. 198-203, Nov. 1999.
[47] Y. Nishitani, M. Yoshiyama, F. R. Tay, B. Wadgaonkar, J. Waller, K. Agee, and D. H.
Pashley, “Tensile strength of mineralized/demineralized human normal and carious
dentin,” J. Dent. Res., vol. 84, no. 11, pp. 1075-1078, Nov. 2005.
hal-0
0555
784,
ver
sion
1 -
14 J
an 2
011
19
List of Figures:
Figure 1. Schematic of SAM measurement setup.
Figure 2. (a) Schematic of the vertical section along the long axis of a 3rd
molar . The thick
horizontal lines indicate the slab that was sectioned for use in this work. (b) Optical image of the
3rd
molar slab.
Figure 3. Fourier amplitude spectra of the two ultrasonic objectives used in this study.
Figure 4. SAM grayscale image showing the 64 locations spaced at 664 m where waveforms
were acquired with transducer 1 (denoted by cross) and the subset of 16 locations where
waveforms were acquired with transducer 1 and 2 (denoted by cross within a circle).
Figure 5. C-Scan images of dentin substrate (a) and (b) before and after acid-etching using
transducer 1 (central frequency 30 MHz), and (c) and (d) before and after acid-etching using
transducer 2 (central frequency 50 MHz).
Figure 6. Representative reflected signal waveforms (a) and their Fourier amplitude spectra (b)
for transducer 1 before and after acid-etching of the dentin substrate.
Figure 7. Fourier amplitude spectra of reflected signal waveforms for 3 representative locations.
Figure 8. Reflection coefficients versus frequency for the subset of 16 locations post-etching.
Figure 9. Average reflection coefficients as functions of frequency (a) before etching and (b)
after etching for the subset of 16 locations.
hal-0
0555
784,
ver
sion
1 -
14 J
an 2
011

20
List of Tables:
Table I: Nominal specifications of ultrasonic objectives used
hal-0
0555
784,
ver
sion
1 -
14 J
an 2
011

21
Figure 1. Schematic of SAM measurement setup.
-100
-75
-50
-25
0
25
50
75
100
16000 16500 17000 17500 18000
Time (ns)
Sig
nal (G
reyscale
units)
output
Distilled H2O
X, Y, Z-axis motion
Z
X Y
specimen
Piezoelectric tranducer
A
B
I P R P R SV
T P T S
V
A
B
I P R P
T P T S
V
A-Scan
C-Scan
hal-0
0555
784,
ver
sion
1 -
14 J
an 2
011

22
output
Distilled H2O
X, Y, Z-axis motion
Z
X Y
specimen
Piezoelectric tranducer
A
B
I P R P R SV
T P T S
V
A
B
I P R P
T P T S
V
-100
-75
-50
-25
0
25
50
75
100
16000 16500 17000 17500 18000
Time (ns)
Sig
nal (G
reyscale
units)
A-Scan
C-Scan
hal-0
0555
784,
ver
sion
1 -
14 J
an 2
011

23
Figure 2. (a) Schematic of the vertical section along the long axis of a 3rd
molar . The thick
horizontal lines indicate the slab that was sectioned for use in this work. (b) Optical image of the
3rd
molar slab.
(b)
enamel dentin
(a)
pulp
enamel
dentin
hal-0
0555
784,
ver
sion
1 -
14 J
an 2
011
24
Figure 3. Fourier amplitude spectra of the two ultrasonic objectives used in this study.
0
0.2
0.4
0.6
0.8
1
1.2
1.4
20 30 40 50 60 70 80 90
Frequency (MHz)
Norm
aliz
ed F
ourier
Am
plit
ude
Transducer 1
Transducer 2
hal-0
0555
784,
ver
sion
1 -
14 J
an 2
011
25
Figure 4. SAM grayscale image showing the 64 locations spaced at 664 m where waveforms
were acquired with transducer 1 (denoted by cross) and the subset of 16 locations where
waveforms were acquired with transducer 1 and 2 (denoted by cross within a circle).
1 2 3 4
1
2 3 4
hal-0
0555
784,
ver
sion
1 -
14 J
an 2
011
26
Figure 5. C-Scan images of dentin substrate (a) and (b) before and after acid-etching using
transducer 1 (central frequency 30 MHz), and (c) and (d) before and after acid-etching using
transducer 2 (central frequency 50 MHz).
Pre-Acid-Etching Post-Acid-Etching
Transducer 1
Transducer 2
2 mm
(a) (b)
(c) (d)
hal-0
0555
784,
ver
sion
1 -
14 J
an 2
011
27
-80
-60
-40
-20
0
20
40
60
80
17000 17050 17100 17150 17200Time (ns)
Am
plit
ude (
Gre
yscale
units)
Before Etching
After Etching
0
200
400
600
800
1000
1200
1400
15 20 25 30 35 40 45 50
Frequency (MHz)
Fourier
Am
plit
ude
Before Etching
After Etching
Figure 6. Representative reflected signal waveforms (a) and their Fourier amplitude spectra (b)
for transducer 1 before and after acid-etching of the dentin substrate.
(a) (b)
hal-0
0555
784,
ver
sion
1 -
14 J
an 2
011

28
Figure 7. Fourier amplitude spectra of reflected signal waveforms for 3 representative locations.
Location (1, 1)
Transducer 2
0
300
600
900
1200
1500
10 20 30 40 50 60Frequency (MHz)
Fo
urie
r A
mp
litu
de
(a
rb. u
nits)
Before Etching
After Etching
Location (1, 1)
Transducer 1
0
100
200
300
400
500
10 20 30 40 50 60 70 80 90 100Frequency (MHz)
Fo
urie
r A
mp
litu
de
(a
rb. u
nits)
Before Etching
After Etching
Location (2, 4) Location (2, 4)
0
300
600
900
1200
1500
10 20 30 40 50 60Frequency (MHz)
Fo
urie
r A
mp
litu
de
(a
rb. u
nits)
Before Etching
After Etching
0
100
200
300
400
500
10 20 30 40 50 60 70 80 90 100Frequency (MHz)
Fo
urie
r A
mp
litu
de
(a
rb. u
nits)
Before Etching
After Etching
Location (3, 3) Location (3, 3)
0
300
600
900
1200
1500
10 20 30 40 50 60Frequency (MHz)
Fo
urie
r A
mp
litu
de
(a
rb. u
nits)
Before Etching
After Etching
0
100
200
300
400
500
10 20 30 40 50 60 70 80 90 100Frequency (MHz)
Fo
urie
r A
mp
litu
de
(a
rb. u
nits)
Before Etching
After Etching
(a) (b)
(c)
(e)
(d)
(f)
hal-0
0555
784,
ver
sion
1 -
14 J
an 2
011

29
0
0.1
0.2
0.3
0.4
0.5
0.6
0.7
10 20 30 40 50 60 70 80
Frequency (MHz)
|R|
Figure 8. Reflection coefficients versus frequency for the subset of 16 locations post-etching.
hal-0
0555
784,
ver
sion
1 -
14 J
an 2
011
30
Figure 9. Average reflection coefficients as functions of frequency (a) before etching and (b)
after etching for the subset of 16 locations.
0
0.2
0.4
0.6
0.8
20 30 40 50 60 70 80
Frequency (MHz)
|R|
Transducer 1
Transducer 2
0
0.2
0.4
0.6
0.8
20 30 40 50 60 70 80
Frequency (MHz)
|R|
Transducer 1
Transducer 2Before etching
After etching
(a)
(b)
hal-0
0555
784,
ver
sion
1 -
14 J
an 2
011

31
Table I – Nominal specifications of ultrasonic objectives used
Focal length
(mm)
Lateral resolution
(m)
Half-aperture angle
(degrees)
Frequency range at -6dB amplitude
(MHz)
Transducer 1 12.7 100 13.4 20.6 - 40.3 Transducer 2 8.0 50 10.0 27.1 – 87.5
hal-0
0555
784,
ver
sion
1 -
14 J
an 2
011