scaling supernova hydrodynamics to the laboratory
TRANSCRIPT
PHYSICS OF PLASMAS VOLUME 6, NUMBER 5 MAY 1999
Scaling supernova hydrodynamics to the laboratory *J. Kane†,a) and D. ArnettUniversity of Arizona, Tucson, Arizona 85721
B. A. Remington, S. G. Glendinning, and G. BazanLawrence Livermore National Laboratory, Livermore, California 94550
R. P. DrakeUniversity of Michigan, Ann Arbor, Michigan 48109-2143
B. A. FryxellASCI Flash Center, University of Chicago, Chicago, Illinois 60637
R. TeyssierCEA/DSM/DAPNIA/Service d’Astrophysique, Bat. 709 Centre d’Etudes de Saclay L’Orme des MerisiersF-91191 Gif-sur-Yvette Cedex, France
K. MooreHarvey Mudd College, Claremont, California 91711
~Received 19 November 1998; accepted 18 January 1999!
Supernova~SN! 1987A focused attention on the critical role of hydrodynamic instabilities in theevolution of supernovae. To test the modeling of these instabilities, we are developing laboratoryexperiments of hydrodynamic mixing under conditions relevant to supernovae. Initial results werereported in J. Kaneet al. @Astrophys. J.478, L75 ~1997! and B. A. Remingtonet al., Phys. Plasmas4, 1994 ~1997!#. The Nova laser is used to generate a 10–15 Mbar shock at the interface of atwo-layer planar target, which triggers perturbation growth due to the Richtmyer–Meshkovinstability, and to the Rayleigh–Taylor instability as the interface decelerates. This resembles thehydrodynamics of the He-H interface of a Type II supernova at intermediate times, up to a few3103 s. The scaling of hydrodynamics on microscopic laser scales to the SN-size scales ispresented. The experiment is modeled using the hydrodynamics codesHYADES @J. T. Larson and S.M. Lane, J. Quant. Spect. Rad. Trans.51, 179 ~1994!# and CALE @R. T. Barton, NumericalAstrophysics ~Jones and Bartlett, Boston, 1985!, pp. 482–497#, and the supernova codePROMETHEUS @P. R. Woodward and P. Collela, J. Comp. Phys.54, 115 ~1984!#. Results of theexperiments and simulations are presented. Analysis of the spike-and-bubble velocities usingpotential flow theory and Ott thin-shell theory is presented, as well as a study of 2D versus 3Ddifferences in perturbation growth at the He-H interface of SN 1987A. ©1999 American Instituteof Physics.@S1070-664X~99!93205-6#
ovthr–
--sres
bM
e-SNer at
l-e SN-
dally. 13,g ofry,ex-y-of
ity
g aor
I. INTRODUCTION
Observations of SN 1987A, a core collapse supern~SN! in the Large Magellanic Cloud, strongly suggestedoccurrence of material mixing driven by the RichtmyeMeshkov~RM! and Rayleigh–Taylor~RT! instabilities.1–5
The ‘‘Bochum event,’’6–8 and early detection of radioactive 56Co from the explosively burned oxygen layer, implied that the56Co had been mixed well into the outer layerDoppler broadening of the gamma-ray, optical, and infralines from 56Co, 56Ni, and 56Fe implied velocities in excesof 3000 km/s,9–11 whereas two-dimensional~2D! modelingto date predicts maximum velocities of<2000 km/s, sug-gesting that perhaps 3D hydrodynamics effects shouldconsidered. Given the fundamental role played by the R
*Paper F3I1.3 Bull. Am. Phys. Soc.43, 1702~1998!.†Invited speaker.a!Present address: Lawrence Livermore National Laboratory, LivermCalifornia 94550.
2061070-664X/99/6(5)/2065/7/$15.00
ae
.d
e
and RT instabilities in SN evolution, it is desirable to dvelop the means of testing the hydrodynamics of thecodes. We report here on experiments using the Nova lasLawrence Livermore National Laboratory~LLNL ! to test themodeling of compressible RM and RT instabilities at reevant pressures and under scaled conditions. We use thcode PROMETHEUSto model the experiment, and for comparison, the LLNL codeCALE. Initial results were presentein Refs. 12 and 13. For discussion of other astrophysicrelevant sets of experiments at the Nova laser, see Refs14, and 15. In the present paper we also discuss scalinthe hydrodynamics from supernovae to the laboratopresent an analysis of the hydrodynamic growth in theperiment in terms of theory for incompressible hydrodnamic instabilities, and report on numerical investigations2D versus 3D differences in the hydrodynamic instabilgrowth in SN 1987A.
We model the laser experiments and SN 1987A usincombination of codes:HYADES, CALE, andPROMETHEUS. The
e,
5 © 1999 American Institute of Physics
shock.
2066 Phys. Plasmas, Vol. 6, No. 5, May 1999 Kane et al.
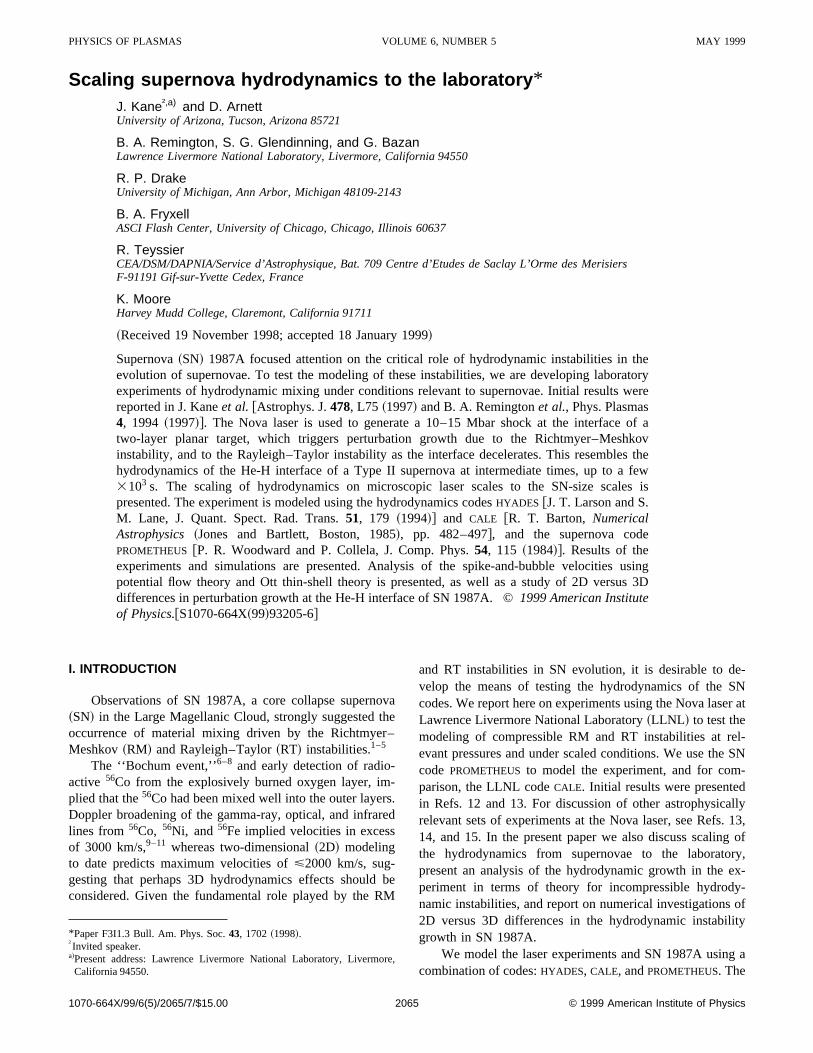
FIG. 1. ~a! Initial model for SN 1987A;~b! He-H interface velocity;~c! crossed density and pressure gradients at the He-H interface after passage of the
at
;
s
-ses;
ty
r
ss,
rW
N
ni
te
es
rlyd at
ardthe
t thelastsedter-
a-
e;
inri-and
pro-
the
endients
N
. I.
f
HYADES code ~see Ref. 16! is a 1D Lagrangian code withmultigroup radiation transport and tabular Equation of St~EOS!; CALE is a 2D Arbitrary Lagrangian Eulerian~ALE!code~see Ref. 17! with tabular EOS and interface trackingCALE allows both planar and cylindrical (r -z) geometry.PROMETHEUSis a multi-D hydrodynamics code which usethe Piecewise Parabolic Method~PPM; see Ref. 18!.PROMETHEUSallows planar, spherical, and cylindrical geometry, and can be run in 1D, 2D, or 3D. Ideal gas EOS is ufor all thePROMETHEUSsimulations of the laser experimentwe choose an adiabatic exponentg for each material in thetarget to best reproduce the 1D shock speed, and velocithe interface between the materials, as simulated byHYADES
and CALE using tabular EOS. We useHYADES to model theinput of laser energy into the target, before mapping toCALE
and PROMETHEUSand continuing the simulations in two othree dimensions~2D or 3D!. The versions ofCALE andPROMETHEUSthat we are using do not have radiation tranport. We use mainlyCALE to design the laser experimentbecause we can use tabular EOS withCALE. We usePROMETHEUSto do low resolution simulations of the lasetargets which have 3D features and require a 3D code.use PROMETHEUS in spherical geometry to simulate S1987A.
II. 1D SIMULATIONS OF SN AND LASER EXPERIMENT
Figure 1~a! shows a 20 solar mass model for the progetor of SN 1987A~see Ref. 19!. Using thePROMETHEUScode,which was described in Sec. I, we show in Fig. 1~b! the 1Dvelocity profile of the He-H interface during the intermediastages of the explosion, and in Fig. 1~c! the 1D pressure anddensity profiles 2000 s into the explosion. We consider th
e
d
of
-
e
-
e
intermediate stages of the explosion, which follow the eastages in which the core collapses and rebounds, to enabout 123103 to 153103 s, by which time the blast wavehas left the star and a rarefaction has moved back inwfrom the surface into the outer layers. For more details ofSN 1987A explosion, thePROMETHEUScode, and the simu-lations shown here, see Refs. 5, 12, 13, 18 and 20–22. AHe-H interface, the strong acceleration induced by the bwave, followed by the deceleration caused by the crospressure and density gradients, suggest that the He-H inface should exhibit strong RM and RT instability. Simultions in 2D withPROMETHEUSshow instabilities at the He-Hand He-O interfaces evolving well into the nonlinear regimsee Refs. 20–22.
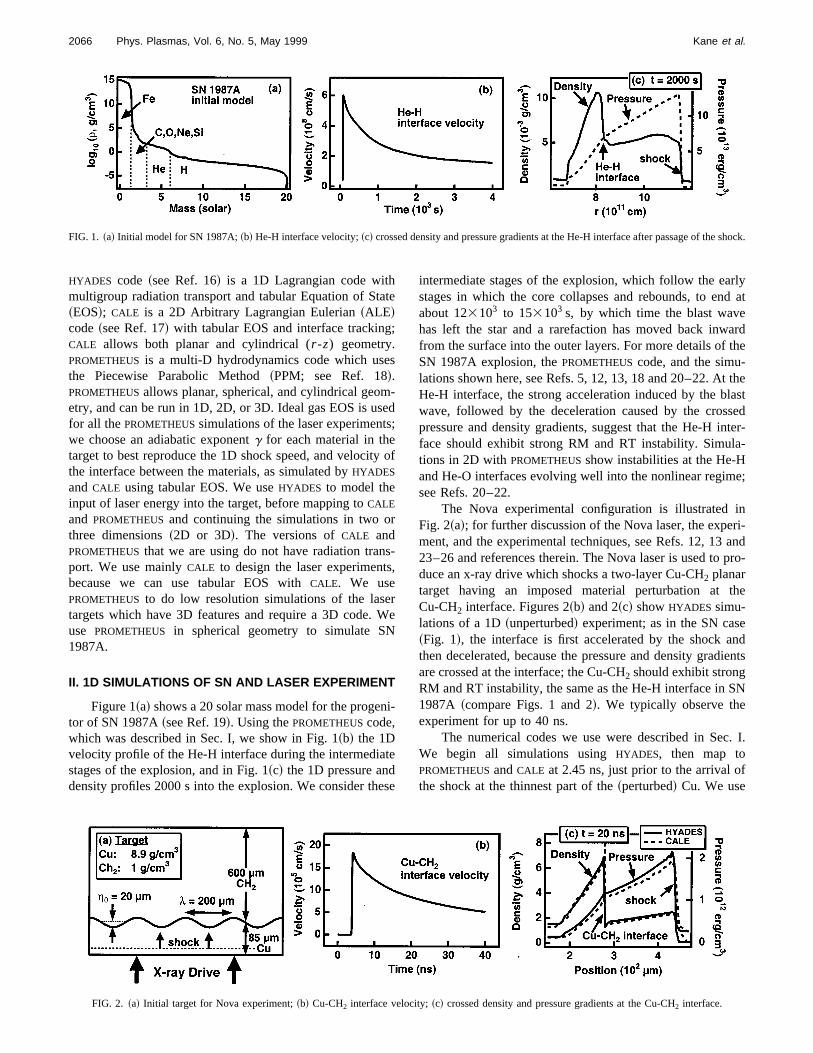
The Nova experimental configuration is illustratedFig. 2~a!; for further discussion of the Nova laser, the expement, and the experimental techniques, see Refs. 12, 1323–26 and references therein. The Nova laser is used toduce an x-ray drive which shocks a two-layer Cu-CH2 planartarget having an imposed material perturbation atCu-CH2 interface. Figures 2~b! and 2~c! showHYADES simu-lations of a 1D~unperturbed! experiment; as in the SN cas~Fig. 1!, the interface is first accelerated by the shock athen decelerated, because the pressure and density gradare crossed at the interface; the Cu-CH2 should exhibit strongRM and RT instability, the same as the He-H interface in S1987A ~compare Figs. 1 and 2!. We typically observe theexperiment for up to 40 ns.
The numerical codes we use were described in SecWe begin all simulations usingHYADES, then map toPROMETHEUSandCALE at 2.45 ns, just prior to the arrival othe shock at the thinnest part of the~perturbed! Cu. We use
FIG. 2. ~a! Initial target for Nova experiment;~b! Cu-CH2 interface velocity;~c! crossed density and pressure gradients at the Cu-CH2 interface.
s
dy
at-
ndteths
h
v
te2
eisdH
s-ere
tpso
oun
inw
wttext
ongf
d-fi-r
e
in-
s—
s atidsCu
hell
t-
om-inga-
sely.of
rbedellit as
as
g
ne
2067Phys. Plasmas, Vol. 6, No. 5, May 1999 Kane et al.
the measured x-ray radiation temperature,Tr(t), as the en-ergy input to HYADES, and the versions ofCALE andPROMETHEUSthat we are using do not have radiation tranport. As seen in Fig. 2~c!, CALE andHYADES agree well longafter the mapping, indicating that the experiment is hydronamics.
III. RESULTS AND 2D SIMULATIONS
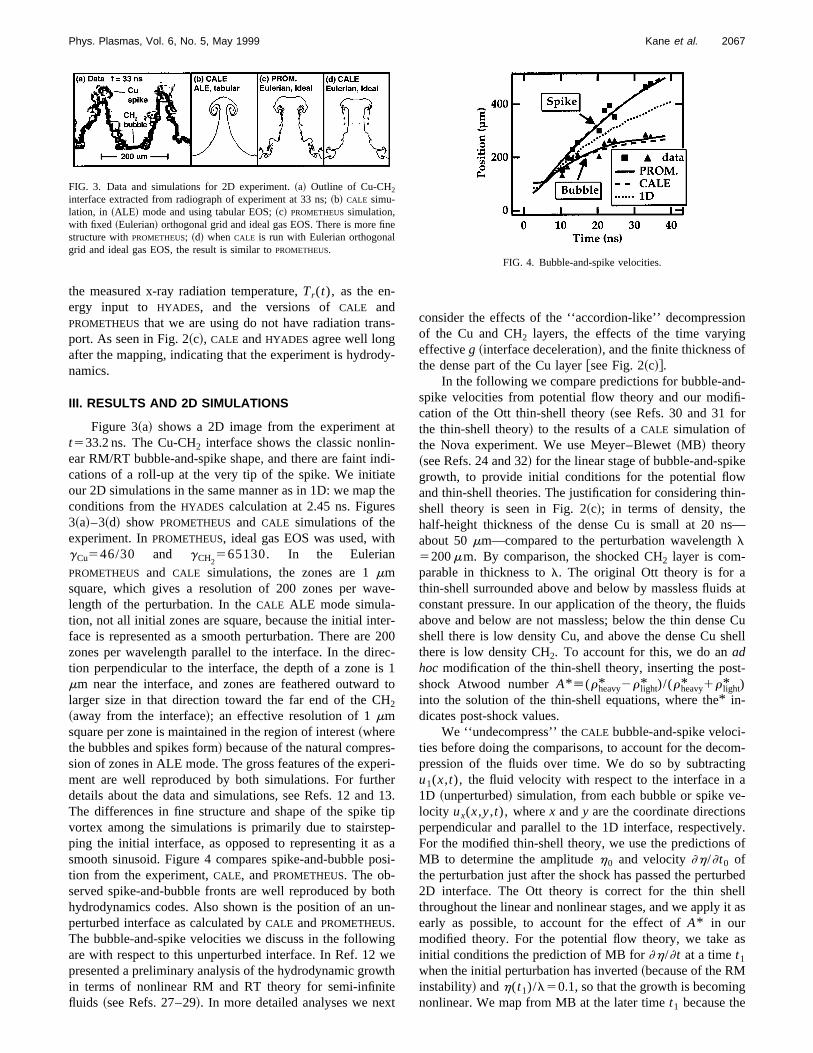
Figure 3~a! shows a 2D image from the experimentt533.2 ns. The Cu-CH2 interface shows the classic nonlinear RM/RT bubble-and-spike shape, and there are faint ications of a roll-up at the very tip of the spike. We initiaour 2D simulations in the same manner as in 1D: we mapconditions from theHYADES calculation at 2.45 ns. Figure3~a!–3~d! show PROMETHEUS and CALE simulations of theexperiment. InPROMETHEUS, ideal gas EOS was used, witgCu546/30 and gCH2
565130. In the EulerianPROMETHEUS and CALE simulations, the zones are 1mmsquare, which gives a resolution of 200 zones per walength of the perturbation. In theCALE ALE mode simula-tion, not all initial zones are square, because the initial inface is represented as a smooth perturbation. There arezones per wavelength parallel to the interface. In the dirtion perpendicular to the interface, the depth of a zonemm near the interface, and zones are feathered outwarlarger size in that direction toward the far end of the C2~away from the interface!; an effective resolution of 1mmsquare per zone is maintained in the region of interest~wherethe bubbles and spikes form! because of the natural compresion of zones in ALE mode. The gross features of the expment are well reproduced by both simulations. For furthdetails about the data and simulations, see Refs. 12 andThe differences in fine structure and shape of the spikevortex among the simulations is primarily due to stairsteping the initial interface, as opposed to representing it asmooth sinusoid. Figure 4 compares spike-and-bubble ption from the experiment,CALE, andPROMETHEUS. The ob-served spike-and-bubble fronts are well reproduced by bhydrodynamics codes. Also shown is the position of anperturbed interface as calculated byCALE andPROMETHEUS.The bubble-and-spike velocities we discuss in the followare with respect to this unperturbed interface. In Ref. 12presented a preliminary analysis of the hydrodynamic groin terms of nonlinear RM and RT theory for semi-infinifluids ~see Refs. 27–29!. In more detailed analyses we ne
FIG. 3. Data and simulations for 2D experiment.~a! Outline of Cu-CH2
interface extracted from radiograph of experiment at 33 ns;~b! CALE simu-lation, in ~ALE! mode and using tabular EOS;~c! PROMETHEUSsimulation,with fixed ~Eulerian! orthogonal grid and ideal gas EOS. There is more fistructure withPROMETHEUS; ~d! whenCALE is run with Eulerian orthogonalgrid and ideal gas EOS, the result is similar toPROMETHEUS.
-
-
i-
e
e-
r-00
c-1to
i-r13.ip-a
si-
th-
geh
consider the effects of the ‘‘accordion-like’’ decompressiof the Cu and CH2 layers, the effects of the time varyineffectiveg ~interface deceleration!, and the finite thickness othe dense part of the Cu layer@see Fig. 2~c!#.
In the following we compare predictions for bubble-anspike velocities from potential flow theory and our modication of the Ott thin-shell theory~see Refs. 30 and 31 fothe thin-shell theory! to the results of aCALE simulation ofthe Nova experiment. We use Meyer–Blewet~MB! theory~see Refs. 24 and 32! for the linear stage of bubble-and-spikgrowth, to provide initial conditions for the potential flowand thin-shell theories. The justification for considering thshell theory is seen in Fig. 2~c!; in terms of density, thehalf-height thickness of the dense Cu is small at 20 nabout 50mm—compared to the perturbation wavelengthl5200mm. By comparison, the shocked CH2 layer is com-parable in thickness tol. The original Ott theory is for athin-shell surrounded above and below by massless fluidconstant pressure. In our application of the theory, the fluabove and below are not massless; below the thin denseshell there is low density Cu, and above the dense Cu sthere is low density CH2. To account for this, we do anadhoc modification of the thin-shell theory, inserting the posshock Atwood numberA* [(rheavy* 2r light* )/(rheavy* 1r light* )into the solution of the thin-shell equations, where the* in-dicates post-shock values.
We ‘‘undecompress’’ theCALE bubble-and-spike veloci-ties before doing the comparisons, to account for the decpression of the fluids over time. We do so by subtractu1(x,t), the fluid velocity with respect to the interface in1D ~unperturbed! simulation, from each bubble or spike velocity ux(x,y,t), wherex andy are the coordinate directionperpendicular and parallel to the 1D interface, respectivFor the modified thin-shell theory, we use the predictionsMB to determine the amplitudeh0 and velocity]h/]t0 ofthe perturbation just after the shock has passed the pertu2D interface. The Ott theory is correct for the thin shthroughout the linear and nonlinear stages, and we applyearly as possible, to account for the effect ofA* in ourmodified theory. For the potential flow theory, we takeinitial conditions the prediction of MB for]h/]t at a timet1
when the initial perturbation has inverted~because of the RMinstability! andh(t1)/l50.1, so that the growth is becominnonlinear. We map from MB at the later timet1 because the
FIG. 4. Bubble-and-spike velocities.
hffi
tiome
sies
re
innd.rhese
ndnc
etht
enis
-
e
timfd
inwdatry
eo
ta
eera-M
tterwthal,om-hecityesct
heicalthe
omthe
ua-are
us
le
nal, leteuse
2068 Phys. Plasmas, Vol. 6, No. 5, May 1999 Kane et al.
drag-vs-buoyancy theory assumes that the perturbationsome ‘‘shape,’’ represented by drag and buoyancy coecients. In the laser experiment, the effective decelerag(t) of the interface is fit extremely well by the simple forg(t)5a/t, wheret50 is the time at which the shock hits th1D ~unperturbed interface!; for the correcta, we integrateg(t) over time to reproduce the interface velocity and potion. A value ofa'3.1mm/ns reproduces these trajectoriextremely well.
Following Refs. 30 and 31, the thin-shell equations a
x~j,t !52g~ t !z8~j,t !, z~j,t !52g~ t !x8~j,t !,
wherej is the Lagrangian coordinate of a point on the thshell, andx and z are the Eulerian coordinates parallel aperpendicular, respectively, to the unperturbed interfacehis original paper~Ref. 30!, Ott presented the solution foconstantg. In Ref. 31, Basko presented the solution for tcaseg(t)}1/t2. We present here the solution for the cag(t)5a/t, namely
x~j,t !5j1 f ~ t !cos~kj!, z~j,t !5z01 f ~ t !sin~kj!,
z0~ t !5g~ t !,
f ~ t !5A t
A* ka$a1I 1AA* kat2b1K1AA* kat%,
wherek52p/l is the wave number of the perturbation, aI 1 andK1 are the growing and damped modified Bessel futions, respectively. The two constantsa1 and b1 are set bythe amplitude and velocity of the initial perturbation. In thexact solution, with massless fluids above and below,post-shock Atwood numberA* is one. To crudely accounfor the arbitrary post-shock Atwood number, we insertA*back into theA51 solution, replacing all factors ofka withA* ka.
Following Refs. 28 and 29, the drag-vs-buoyancy pottial flow equation for the velocities of the bubble and spike
u~ t !5cbg~ t !2cDu~ t !2/l, ~1!
where the buoyancy coefficient iscb5A* /(11A* ) and thedrag coefficient iscD,bubble53p for the bubble andcD,spike
53p(12A* )/(11A* ) for the spike. We use MB, as described above, to determine the initial valueu(t1) and thenintegrate Eq.~1! over time.
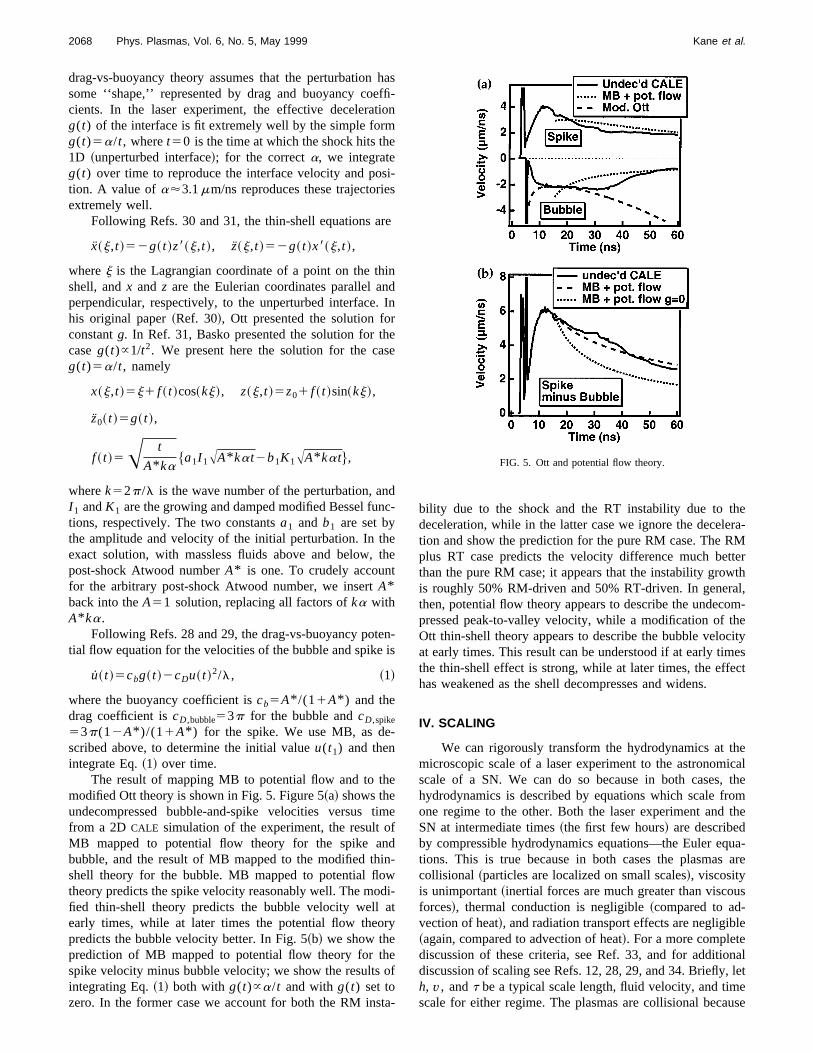
The result of mapping MB to potential flow and to thmodified Ott theory is shown in Fig. 5. Figure 5~a! shows theundecompressed bubble-and-spike velocities versusfrom a 2D CALE simulation of the experiment, the result oMB mapped to potential flow theory for the spike anbubble, and the result of MB mapped to the modified thshell theory for the bubble. MB mapped to potential flotheory predicts the spike velocity reasonably well. The mofied thin-shell theory predicts the bubble velocity wellearly times, while at later times the potential flow theopredicts the bubble velocity better. In Fig. 5~b! we show theprediction of MB mapped to potential flow theory for thspike velocity minus bubble velocity; we show the resultsintegrating Eq.~1! both with g(t)}a/t and withg(t) set tozero. In the former case we account for both the RM ins
as-n
-
In
-
e
-
e
-
i-
f
-
bility due to the shock and the RT instability due to thdeceleration, while in the latter case we ignore the deceltion and show the prediction for the pure RM case. The Rplus RT case predicts the velocity difference much bethan the pure RM case; it appears that the instability grois roughly 50% RM-driven and 50% RT-driven. In generthen, potential flow theory appears to describe the undecpressed peak-to-valley velocity, while a modification of tOtt thin-shell theory appears to describe the bubble veloat early times. This result can be understood if at early timthe thin-shell effect is strong, while at later times, the effehas weakened as the shell decompresses and widens.
IV. SCALING
We can rigorously transform the hydrodynamics at tmicroscopic scale of a laser experiment to the astronomscale of a SN. We can do so because in both cases,hydrodynamics is described by equations which scale frone regime to the other. Both the laser experiment andSN at intermediate times~the first few hours! are describedby compressible hydrodynamics equations—the Euler eqtions. This is true because in both cases the plasmascollisional ~particles are localized on small scales!, viscosityis unimportant~inertial forces are much greater than viscoforces!, thermal conduction is negligible~compared to ad-vection of heat!, and radiation transport effects are negligib~again, compared to advection of heat!. For a more completediscussion of these criteria, see Ref. 33, and for additiodiscussion of scaling see Refs. 12, 28, 29, and 34. Brieflyh, v, andt be a typical scale length, fluid velocity, and timscale for either regime. The plasmas are collisional beca
FIG. 5. Ott and potential flow theory.
ld
nesse
dh
ee
rr
a
,threia
o
tet
iffin
eu
ibro
vv
lainedivelu-d inr-ntorth
ameandan3D
heli-to
in
-
3Ds-
al,ce3D
-
2069Phys. Plasmas, Vol. 6, No. 5, May 1999 Kane et al.
the ratiol c /h is small, wherel c is the collisional mean freepath; for the SN,l c /h,2310212, and for the laser,l c /h,131026. Viscosity is unimportant because the Reynonumber Re[hv/n is very large (@103), wheren is the domi-nant viscosity. For the SN, photon viscosity dominates aRe.1013; for the laser experiment, ion viscosity dominatand Re.23105. Thermal conduction is negligible becauthe Peclet number Pe[hv/x@1, wherex is the thermal dif-fusivity. In both cases, magnetic fields are unimportant anxis the thermal diffusivity for unmagnetized electrons. For tSN, Pe.1011; for the laser experiment, Pe.2.53103. Thatradiation transport is unimportant in both cases can be sby considering either the photon Peclet number Pg
[hv/xg , wherexg is the thermal diffusivity for photons, othe ratiotR /t, wheretR is the radiation cooling time. Fothe SN, Peg.53104; for the laser experiment,tR /t.500.
The Euler equations~see Ref. 35!,
]
]tr1¹•~rv!50
]
]t~rv!1¹~P1rv2!50
]
]t~rE!1¹•@~rE1P!v#50,
where
E5u1 12 v2,
u being the internal energy, are invariant under any sctransformation that preserves the quantity~space/time!3~density/pressure!1/2, i.e., r5a•r1 , P5b•P1 , h5c•h1 , t5(a/b)1/2ct1 , whereh is a typical scale lengthand a, b, and c are constants. We assume here that inregimes of interest, the equations of state are modeledsonably well by polytropic gas laws with comparable adbatic exponents~for further details, see Ref. 31!. In the He-Hlayer of the SN at a timet151600 s, we haver15531023 g/cm3, P15100 Mbar, andh151012cm. In the com-pressible laser experiments, we haver54 g/cm3, P51 Mbar, andh5200mm. We use the transformation tfind the remaining undetermined quantity,t, the characteris-tic time scale for the compressible laser experiment. Demining the constants of the transformation, we find thaa5r/r1583102, b5P/P151022, and c5h/h152310214. Thus the density, pressure, and spatial scales dby 2, 2, and 14 orders of magnitude, respectively. Applythe transformation, we find that a typical scale timet is 20ms, by which time the degree of instability growth in thlaser experiment is indeed similar to what we see in a simlation of the He-H layer of the SN on a time scale of'103 s.Thus for the case of compressible hydrodynamics descrby the Euler equation, we can scale the hydrodynamics fthe laser experiment to the SN.
V. 2D VS 3D HYDRO
We are beginning experimental investigations of 2D3D SN-relevant hydrodynamics in experiments on the No
s
d
e
en
le
ea--
r-
erg
-
edm
sa
and Omega lasers. 2D vs 3D differences could help expwhy 2D simulations of SN 1987A underpredict the observ56Co velocities. 3D numerical simulations are very expensto carry out routinely, and intractable at the higher resotions used in 2D simulations such as the ones presenteFigs. 3~c!–3~d!. However, a laser experiment with a 3D peturbation is no more difficult to perform than an experimewith a 2D perturbation, and thus offers a useful tool fstudying SN-relevant hydro. In the linear regime, the growrates of a 3D perturbation and a 2D perturbation are the swhen both perturbations have the same wave number,the 3D perturbation grows faster in the nonlinear regime ththe 2D perturbation, because the growth saturates later in~see Ref. 36 and references therein!. The later saturation in3D is explained by drag-vs-buoyancy arguments~see Refs.28, 29, and 37!. In both the linear and nonlinear regimes, tterm ‘‘growth’’ means the time rate of change of the amptude of the perturbation, either from unperturbed interfacebubble or spike tip, or from bubble to spike tip. Growththe linear regime is typically described by a growth rate~seeRef. 36, for example!, and we quantify growth in the nonlinear regime by velocities of the bubble-and-spike tips.
We are currently investigating both ‘‘dimple’’~J0
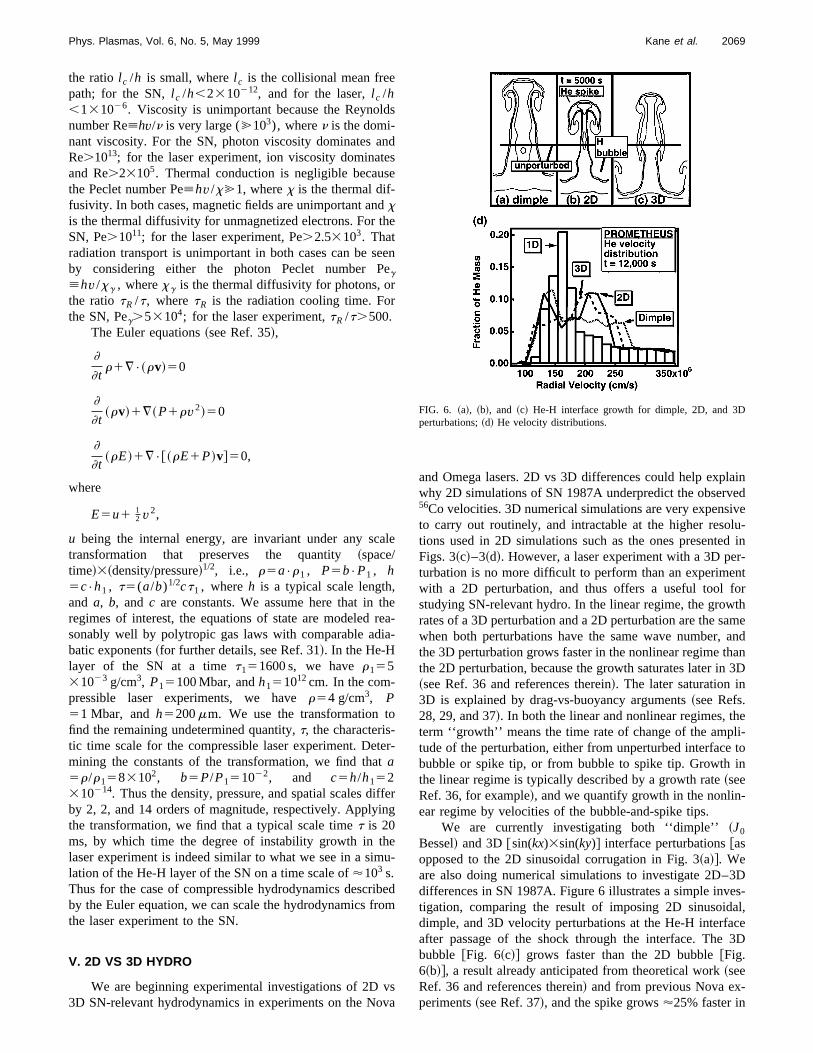
Bessel! and 3D@sin(kx)3sin(ky)# interface perturbations@asopposed to the 2D sinusoidal corrugation in Fig. 3~a!#. Weare also doing numerical simulations to investigate 2D–differences in SN 1987A. Figure 6 illustrates a simple invetigation, comparing the result of imposing 2D sinusoiddimple, and 3D velocity perturbations at the He-H interfaafter passage of the shock through the interface. Thebubble @Fig. 6~c!# grows faster than the 2D [email protected]~b!#, a result already anticipated from theoretical work~seeRef. 36 and references therein! and from previous Nova experiments~see Ref. 37!, and the spike grows'25% faster in
FIG. 6. ~a!, ~b!, and ~c! He-H interface growth for dimple, 2D, and 3Dperturbations;~d! He velocity distributions.
dre
thr-
heion
re
n
th-s
eus
ic
2Dthith
rive.
ans-,
i-sselD
atege-
ers.
her-
.tni-
;n y
ed
2070 Phys. Plasmas, Vol. 6, No. 5, May 1999 Kane et al.
3D. The dimple spike@Fig. 6~a!# grows significantly fasterthan the 2D spike, while the dimple bubble ring, which halower initial amplitude than the 2D bubble, grows moslowly than the 2D bubble. Figure 6~d! shows the distribu-tion by mass of the He velocities at 12 000 s, by which timthe blast wave has exited the star. The broadening ofvelocity profiles in the He layer for the 3D and dimple peturbations is evident. The H layer is'20% He by mass inthe initial model, so the He at the higher velocities is in touter layer of the star and has a similar velocity distributin all cases.
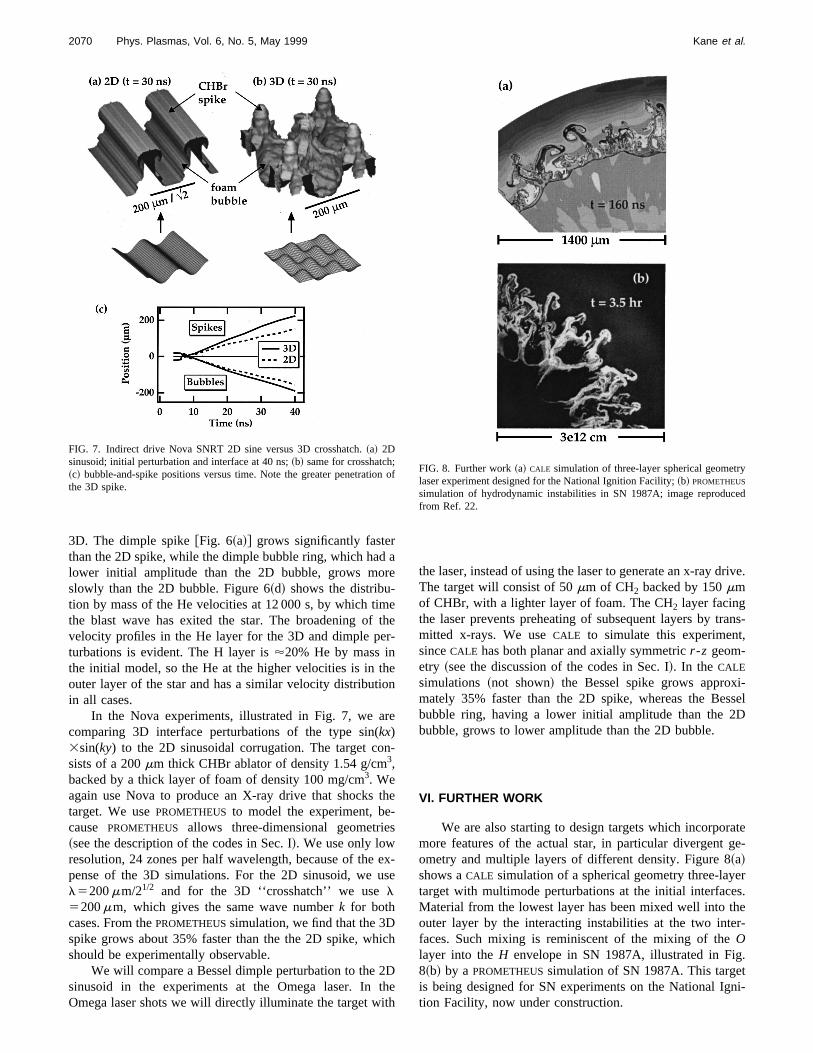
In the Nova experiments, illustrated in Fig. 7, we acomparing 3D interface perturbations of the type sin(kx)3sin(ky) to the 2D sinusoidal corrugation. The target cosists of a 200mm thick CHBr ablator of density 1.54 g/cm3,backed by a thick layer of foam of density 100 mg/cm3. Weagain use Nova to produce an X-ray drive that shockstarget. We usePROMETHEUS to model the experiment, because PROMETHEUS allows three-dimensional geometrie~see the description of the codes in Sec. I!. We use only lowresolution, 24 zones per half wavelength, because of thepense of the 3D simulations. For the 2D sinusoid, wel5200mm/21/2 and for the 3D ‘‘crosshatch’’ we usel5200mm, which gives the same wave numberk for bothcases. From thePROMETHEUSsimulation, we find that the 3Dspike grows about 35% faster than the the 2D spike, whshould be experimentally observable.
We will compare a Bessel dimple perturbation to thesinusoid in the experiments at the Omega laser. InOmega laser shots we will directly illuminate the target w
FIG. 7. Indirect drive Nova SNRT 2D sine versus 3D crosshatch.~a! 2Dsinusoid; initial perturbation and interface at 40 ns;~b! same for crosshatch~c! bubble-and-spike positions versus time. Note the greater penetratiothe 3D spike.
a
ee
-
e
x-e
h
e
the laser, instead of using the laser to generate an x-ray dThe target will consist of 50mm of CH2 backed by 150mmof CHBr, with a lighter layer of foam. The CH2 layer facingthe laser prevents preheating of subsequent layers by trmitted x-rays. We useCALE to simulate this experimentsinceCALE has both planar and axially symmetricr -z geom-etry ~see the discussion of the codes in Sec. I!. In the CALE
simulations ~not shown! the Bessel spike grows approxmately 35% faster than the 2D spike, whereas the Bebubble ring, having a lower initial amplitude than the 2bubble, grows to lower amplitude than the 2D bubble.
VI. FURTHER WORK
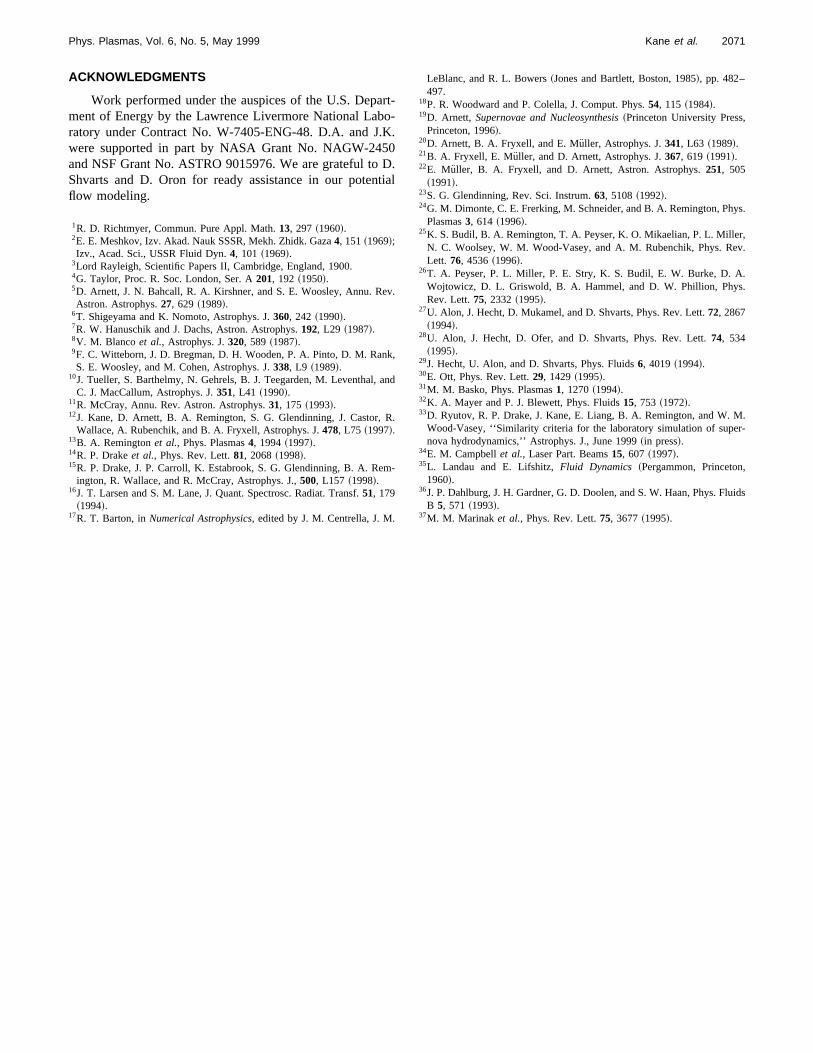
We are also starting to design targets which incorpormore features of the actual star, in particular divergentometry and multiple layers of different density. Figure 8~a!shows aCALE simulation of a spherical geometry three-laytarget with multimode perturbations at the initial interfaceMaterial from the lowest layer has been mixed well into touter layer by the interacting instabilities at the two intefaces. Such mixing is reminiscent of the mixing of theOlayer into theH envelope in SN 1987A, illustrated in Fig8~b! by a PROMETHEUSsimulation of SN 1987A. This targeis being designed for SN experiments on the National Igtion Facility, now under construction.
ofFIG. 8. Further work~a! CALE simulation of three-layer spherical geometrlaser experiment designed for the National Ignition Facility;~b! PROMETHEUS
simulation of hydrodynamic instabilities in SN 1987A; image reproducfrom Ref. 22.
aroK0Dti
ev
nk
an
R
m
.
,
ys.
r,v.
.
.
M.r-
,
uids
2071Phys. Plasmas, Vol. 6, No. 5, May 1999 Kane et al.
ACKNOWLEDGMENTS
Work performed under the auspices of the U.S. Depment of Energy by the Lawrence Livermore National Labratory under Contract No. W-7405-ENG-48. D.A. and J.were supported in part by NASA Grant No. NAGW-245and NSF Grant No. ASTRO 9015976. We are grateful toShvarts and D. Oron for ready assistance in our potenflow modeling.
1R. D. Richtmyer, Commun. Pure Appl. Math.13, 297 ~1960!.2E. E. Meshkov, Izv. Akad. Nauk SSSR, Mekh. Zhidk. Gaza4, 151~1969!;Izv., Acad. Sci., USSR Fluid Dyn.4, 101 ~1969!.
3Lord Rayleigh, Scientific Papers II, Cambridge, England, 1900.4G. Taylor, Proc. R. Soc. London, Ser. A201, 192 ~1950!.5D. Arnett, J. N. Bahcall, R. A. Kirshner, and S. E. Woosley, Annu. RAstron. Astrophys.27, 629 ~1989!.
6T. Shigeyama and K. Nomoto, Astrophys. J.360, 242 ~1990!.7R. W. Hanuschik and J. Dachs, Astron. Astrophys.192, L29 ~1987!.8V. M. Blanco et al., Astrophys. J.320, 589 ~1987!.9F. C. Witteborn, J. D. Bregman, D. H. Wooden, P. A. Pinto, D. M. RaS. E. Woosley, and M. Cohen, Astrophys. J.338, L9 ~1989!.
10J. Tueller, S. Barthelmy, N. Gehrels, B. J. Teegarden, M. Leventhal,C. J. MacCallum, Astrophys. J.351, L41 ~1990!.
11R. McCray, Annu. Rev. Astron. Astrophys.31, 175 ~1993!.12J. Kane, D. Arnett, B. A. Remington, S. G. Glendinning, J. Castor,
Wallace, A. Rubenchik, and B. A. Fryxell, Astrophys. J.478, L75 ~1997!.13B. A. Remingtonet al., Phys. Plasmas4, 1994~1997!.14R. P. Drakeet al., Phys. Rev. Lett.81, 2068~1998!.15R. P. Drake, J. P. Carroll, K. Estabrook, S. G. Glendinning, B. A. Re
ington, R. Wallace, and R. McCray, Astrophys. J.,500, L157 ~1998!.16J. T. Larsen and S. M. Lane, J. Quant. Spectrosc. Radiat. Transf.51, 179
~1994!.17R. T. Barton, inNumerical Astrophysics, edited by J. M. Centrella, J. M
t--.
.al
.
,
d
.
-
LeBlanc, and R. L. Bowers~Jones and Bartlett, Boston, 1985!, pp. 482–497.
18P. R. Woodward and P. Colella, J. Comput. Phys.54, 115 ~1984!.19D. Arnett, Supernovae and Nucleosynthesis~Princeton University Press
Princeton, 1996!.20D. Arnett, B. A. Fryxell, and E. Mu¨ller, Astrophys. J.341, L63 ~1989!.21B. A. Fryxell, E. Muller, and D. Arnett, Astrophys. J.367, 619 ~1991!.22E. Muller, B. A. Fryxell, and D. Arnett, Astron. Astrophys.251, 505
~1991!.23S. G. Glendinning, Rev. Sci. Instrum.63, 5108~1992!.24G. M. Dimonte, C. E. Frerking, M. Schneider, and B. A. Remington, Ph
Plasmas3, 614 ~1996!.25K. S. Budil, B. A. Remington, T. A. Peyser, K. O. Mikaelian, P. L. Mille
N. C. Woolsey, W. M. Wood-Vasey, and A. M. Rubenchik, Phys. ReLett. 76, 4536~1996!.
26T. A. Peyser, P. L. Miller, P. E. Stry, K. S. Budil, E. W. Burke, D. AWojtowicz, D. L. Griswold, B. A. Hammel, and D. W. Phillion, PhysRev. Lett.75, 2332~1995!.
27U. Alon, J. Hecht, D. Mukamel, and D. Shvarts, Phys. Rev. Lett.72, 2867~1994!.
28U. Alon, J. Hecht, D. Ofer, and D. Shvarts, Phys. Rev. Lett.74, 534~1995!.
29J. Hecht, U. Alon, and D. Shvarts, Phys. Fluids6, 4019~1994!.30E. Ott, Phys. Rev. Lett.29, 1429~1995!.31M. M. Basko, Phys. Plasmas1, 1270~1994!.32K. A. Mayer and P. J. Blewett, Phys. Fluids15, 753 ~1972!.33D. Ryutov, R. P. Drake, J. Kane, E. Liang, B. A. Remington, and W.
Wood-Vasey, ‘‘Similarity criteria for the laboratory simulation of supenova hydrodynamics,’’ Astrophys. J., June 1999~in press!.
34E. M. Campbellet al., Laser Part. Beams15, 607 ~1997!.35L. Landau and E. Lifshitz,Fluid Dynamics ~Pergammon, Princeton
1960!.36J. P. Dahlburg, J. H. Gardner, G. D. Doolen, and S. W. Haan, Phys. Fl
B 5, 571 ~1993!.37M. M. Marinak et al., Phys. Rev. Lett.75, 3677~1995!.