satb1 family protein expressed during early erythroid differentiation modifies globin gene...
TRANSCRIPT
doi:10.1182/blood-2004-08-2988Prepublished online December 23, 2004;
T NoguchiJie Wen, Suming Huang, Heather Rogers, Liliane A Dickinson, Terumi Kohwi-Shigematsu and Constance modifies globin gene expressionSATB1 family protein expressed during early erythroid differentiation
(1174 articles)Red Cells � (3132 articles)Hematopoiesis and Stem Cells �
(1086 articles)Gene Expression �Articles on similar topics can be found in the following Blood collections
http://bloodjournal.hematologylibrary.org/site/misc/rights.xhtml#repub_requestsInformation about reproducing this article in parts or in its entirety may be found online at:
http://bloodjournal.hematologylibrary.org/site/misc/rights.xhtml#reprintsInformation about ordering reprints may be found online at:
http://bloodjournal.hematologylibrary.org/site/subscriptions/index.xhtmlInformation about subscriptions and ASH membership may be found online at:
digital object identifier (DOIs) and date of initial publication. theindexed by PubMed from initial publication. Citations to Advance online articles must include
final publication). Advance online articles are citable and establish publication priority; they areappeared in the paper journal (edited, typeset versions may be posted when available prior to Advance online articles have been peer reviewed and accepted for publication but have not yet
Copyright 2011 by The American Society of Hematology; all rights reserved.20036.the American Society of Hematology, 2021 L St, NW, Suite 900, Washington DC Blood (print ISSN 0006-4971, online ISSN 1528-0020), is published weekly by
For personal use only. by guest on June 8, 2013. bloodjournal.hematologylibrary.orgFrom
1
SATB1 family protein expressed during early erythroid differentiation modifies
globin gene expression
Jie Wen1, Suming Huang2, Heather Rogers1, Liliane A. Dickinson 3,
Terumi Kohwi-Shigematsu3 and Constance Tom Noguchi1
1Laboratory of Chemical BiologyAnd
2Laboratory of Molecular BiologyNational Institute of Diabetes and Digestive and Kidney Diseases
National Institutes of Health, Bethesda, MDAnd
3Department of Cell and Molecular Biology, Lawrence Berkeley National Laboratory,1 Cyclotron Road, Berkeley, CA
Running title: SATB1 modifies globin gene expression
Address for correspondence:Constance Tom Noguchi, Ph. D. Laboratory of Chemical BiologyNational Institutes of Diabetes and Digestive and Kidney DiseasesNational Institutes of HealthBuilding 10, Room 9N30710 CENTER DR MSC 1822BETHESDA, MD 20892-1822Tele: 301-496-1163FAX: 301-402-0101E-mail: [email protected]
Blood First Edition Paper, prepublished online December 23, 2004; DOI 10.1182/blood-2004-08-2988
Copyright © 2004 American Society of Hematology
For personal use only. by guest on June 8, 2013. bloodjournal.hematologylibrary.orgFrom
2
ABSTRACT
SATB1 nuclear protein, expressed predominantly in T-cells, regulates genes
through targeting chromatin remodeling during T-cell maturation. Here we show SATB1
family protein induction during early human adult erythroid progenitor cell
differentiation concomitant with ε-globin expression. Erythroid differentiation of human
erythroleukemia K562 cells by hemin simultaneously increases γ-globin and
downregulates SATB1 family protein and ε-globin gene expression. Chromatin
immunoprecipitation (ChIP) using anti-SATB1 antibody shows selective binding in vivo
in the β-globin cluster to the hypersensitive site 2 (HS2) in the locus control region
(LCR) and to the ε-globin promoter. SATB1 overexpression increases ε-globin and
decreases γ-globin gene expression accompanied by histone hyperacetylation and
hypomethylation in chromatin from the ε-globin promoter and HS2, and histone
hypoacetylation and hypermethylation associated with the γ-globin promoter. In K562
cells SATB1 family protein forms a complex with CREB-binding protein (CBP)
important in transcriptional activation. In co-transfection experiments, increase in ε-
promoter activity by SATB1 was amplified by CBP and blocked by E1A, a CBP
inhibitor. Our results suggest that SATB1 can upregulate the ε-globin gene by interaction
with specific sites in the β-globin cluster and imply that SATB1 family protein expressed
in the erythroid progenitor cells may have a role in globin gene expression during early
erythroid differentiation.
KEYWORDS: Red cells, Regulation of globin gene expression, Transcription factors,
SATB1, Histone Modification
For personal use only. by guest on June 8, 2013. bloodjournal.hematologylibrary.orgFrom
3
INTRODUCTION
The human β-globin gene cluster on chromosome 11 consists of five
developmentally specific genes for embryonic (ε), fetal (Gγ, Aγ) and adult (δ, β) globins.
A strong enhancer, located in the far upstream region of the cluster called the locus
control region (LCR), contains five DNase I hypersensitive (HS) sites, and is able to
enhance tissue-specific globin gene expression and provide a high level of transcription
activity from human globin gene constructs in transgenic mice. Transcription factors such
as EKLF, GATA-1 and NF-E2, that bind to the LCR and other regulatory elements, and
promoters in the globin gene locus, have been reported to regulate chromatin histone
acetylation by associating with histone acetyltransferases 1-3. The LCR is required to
increase the rate of transcription, but may be dispensable for formation of an open
chromatin domain of a downstream active globin gene in erythroid cells 4,5. For globin
gene expression, spatial organization of the β-globin cluster requires special interactions
between distal transcriptional elements in the LCR and downstream active globin genes.
Some developmental specificity between individual hypersensitive sites in the LCR and
downstream globin genes is evident such as the interaction between HS2 and ε-globin for
transcription activation 6.
Complex packaging of eukaryotic chromosomes in nuclei creates chromatin loops
and matrix/scaffold attachment regions (MARs/SARs; the term MARs is used here),
originally identified as genomic DNA fragments that remain tightly associated with salt-
extracted and DNase 1 digested nuclei, have been postulated to be localized at the base of
chromatin loops 7. MARs identified by such criteria often contain a base-unpairing region
(BUR), the DNA bases of which become continuously unpaired when subjected to
negative superhelical strain 8,9. Many candidate MARs in the β-globin cluster appear to
be in regions of mass binding sites for transcription factors, some of which are
developmental stage-specific 10,11. MARs found flanking the ε- or γ-globin genes or
For personal use only. by guest on June 8, 2013. bloodjournal.hematologylibrary.orgFrom
4
within the β-globin second intervening sequence (IVS2) have been proposed as
regulatory elements for specific globin gene expression or hemoglobin switching 12-16.
SATB1 binds to double-stranded BUR sequences, specifically recognizing a
specialized DNA context (an ATC sequence context), characterized by a cluster of
sequence stretches with well mixed As and Ts but either Cs or Gs exclusively on one
strand (designated as ATC sequences) 17. SATB1 has roles in tissue-specific organization
of DNA sequences, in regulation of gene expression by acting as a “landing platform” for
chromatin remodeling enzymes, and in designation of the region-specific histone
modification in vivo 18,19. In vitro studies have indicated that SATB1 family protein can
bind to some of the MARs in the β-globin gene cluster 12,14,15. Here, we show that
overexpression of SATB1 in K562 cells induces hemoglobin and globin gene expression
concomitant with changes in chromatin structure, and that SATB1 interacts directly with
MARs in vivo in the β-globin cluster at LCR HS2 and at the ε-globin promoter region.
These data suggest that during early erythroid development SATB1 may provide
previously unknown mechanism underlying differential globin gene regulation.
For personal use only. by guest on June 8, 2013. bloodjournal.hematologylibrary.orgFrom
5
MATERIAL AND METHODS
Cell culture
Human erythroleukemia K562 cells (American Type Culture Collection,
Manassas, VA) were cultured in RPMI 1650/10% FBS 20. Human primary erythroid
progenitor cells were purified using Ficoll-Hypaque (BioWhittaker, Walkersville, MD)
from blood obtained from consenting normal volunteers through the NIH Department of
Transfusion Medicine and cultured as described 21. Approval was obtained from the
National Institutes of Health institutional review board for these studies. Informed
consent was provided according to the Declaration of Helsinki.
Cell transfection
A SATB1 expression vector was constructed by excising SATB1 cDNA (EcoR1)
from pECHAT1146 17, ligating into pIRES2-EGFP (Clontech, Palo Alto, CA) to give
pEGFP/SATB1, and accuracy confirmed by DNA sequencing. For stable cell lines,
pEGFP/SATB1 or pIRES2-EGFP was transfected by electroporation into K562 cells 22.
Clones were selected using geneticin (500 µg/ml) (Gibco, Grand Island, NY). For
reporter gene assays, 5.0 X 10⁵ HeLa cells or 5.0 X 10⁶ K562 cells were transfected using
Superfect reagent (Qiagen, Valencia, CA). After 72 hr, cells were harvested and assayed.
PSV-β-Galactosidase (Promega, Madison, WI) was co-transfected for normalization of
transfection efficiency. CBP (RSVCBP), E1A and a mutant E1A (E1A∆2-36), and
SATB1 (pEGFP/SATB1) expression vectors were used for co-transfection with reporter
gene constructs. pEGFP/SATB1 was transfected into primary erythroid progenitor cells
by electroporation.
Reporter gene construction
The ε-globin promoter with the 5’ flanking Mε MAR (-445 to +17) or without (-
365 to +17) was inserted between the KpnI and Hind III sites of the reporter vector
For personal use only. by guest on June 8, 2013. bloodjournal.hematologylibrary.orgFrom
6
pREP4/Luc (from Keji Zhao), an episomal vector containing the Epstein-Barr virus
replication origin and encoding nuclear antigen EBNA-1 required for replication 23, to
create pREP4/ε or pREP4/∆ε. The mutation of Mε MAR was created using sense and
antisense Mε MAR mutant oligonucleotides
(GACGGTACCGGGGTAGGGGGAGAGGGGCGCCGGTATCTAGAGGC) and ligation
of the annealed oligonucleotides to the ε-promoter. The HS-2 enhancer region with or
without the HS2-M1 MAR binding site (with MAR: 8244-8862; without MAR: 8461-
8862) was inserted upstream of the ε-globin promoter in pREP4/ε between the Xba1 and
BglII sites to create pREP4/HS2-ε and pREP4/∆HS2-ε. Mutation of HS2-M1 MAR was
created by synthesis of sense and antisense HS2-M1 MAR mutant oligonucleotides
(CGCTCTAGACAGAGCACAGGAGAAGGAAGGGGGAGGGGGGAGGGGGGTACCT
GG).
RNA isolation and quantitative RT-PCR analysis
Total RNA was isolated and first-strand cDNA was synthesized using MuLV
reverse transcriptase and oligo-d (T)16 (PE Applied Biosystems, Foster City, CA). For
quantitative real-time PCR analysis, gene-specific primers and fluorescent labeled
TaqMan probes (6-carboxy fluorescein (FAM) as the 5' fluorescent reporter,
tetramethylrhodamine (TAMRA) as 3' end quencher) were used in a 7700 Sequence
Detector (Applied Biosystems, Foster City, CA) as described 24. All results were
normalized to human β-actin.
Western blot analysis
Cell lysates were obtained by adding RIPA buffer (10 mM Tris HCl, 1 mM
EDTA, 0.1% SDS, 0.1% Na3VO4, 1% Triton-X 100) and protease inhibitor (Roche
Diagnostics GmbH Mannheim, Germany) into the cell pellet, incubated on ice for 30 min
and centrifuged at 13000 rpm for 10 min. The protein sample was run on NuPAGE TM 4-
For personal use only. by guest on June 8, 2013. bloodjournal.hematologylibrary.orgFrom
7
12% Bis-Tris Gel (Invitrogen, Carlsbad, CA) for 1 hr at 200 V. Protein was transferred to
nitrocellulose by standard methods. The blot was blocked with 5% nonfat milk in TTBS
buffer (Tween 20 Tris buffered saline) for 1 hr at room temperature, probed with primary
antibody for 1 hr at room temperature, washed in TTBS buffer, probed with HRP-
conjugated secondary antibody for 1 hr at room temperature, and rinsed in TTBS buffer
for chemiluminescent detection.
Nuclear extract isolation and DNA binding assay
K562 and K562/SATB1 nuclear extracts were prepared for electromobility shift
assay (EMSA). Nuclei were extracted from washed cells using hypotonic buffer (10 mM
HEPES, 1.5 mM MgCl2, 10 mM KCl, 0.5 mM DTT, and 0.5 mM PMSF) and
centrifuged. The cytoplasm containing supernatant was discarded, the pellet resuspended
in 2X volume of extraction buffer (20 mM HEPES, 25% glycerol, 0.42 M NaCl, 1.5 mM
MgCl2, 0.2 mM EDTA, 0.5 mM DTT, 0.5 mM PMSF), placed on ice for 30 min and
centrifuged (10,000rpm; 10 min), and the supernatant containing the nuclear extract
collected. For EMSA, DNA probes were labeled with γ-32P-ATP by reaction with T4
polynucleotide kinase (New England BioLabs Inc., Beverly, MA). Probe binding to
nuclear extract was carried out at room temperature for 30 min in binding buffer (20 mM
Tris HCL (pH 8), 100 mM NaCl, 1 mM EDTA, 5% NP-40, 10 mM dithiothreitol and 0.1
mg/µl bovine serum albumin). DNA-protein complexes were visualized using
electrophoresis in a 4% non-denaturing polyacrylamide gel and autoradiography. For
GATA-1 EMSA, reaction buffer contained 10 nM HEPES, 50 nM potassium glutamate,
5 mM MgCl2, 1 mM EDTA, 2 mM dithiothreitol, 5% glycerol and 1 µg of poly(dI-dC).
Chromatin immunoprecipitation
Chromatin extracts were prepared as described 25. In brief, 2 X 10⁷ cells were
fixed with formaldehyde and incubated at 37 ºC for 3 min, washed in PBS, resuspended
For personal use only. by guest on June 8, 2013. bloodjournal.hematologylibrary.orgFrom
8
in 15 ml of Triton buffer (0.1 M Tris HCl, 0.05 M EDTA, 0.01 M EGTA, 0.25% Triton
X-100) and incubated for 15 min. Triton-washed cells were centrifuged (1000 rpm for 5
min), resuspended in 15 ml of NaCl buffer (0.1 M Tris HCl, 0.01 M EGTA, 0.05 M
EDTA, 5 M NaCl) and incubated for an additional 15 min. The samples were
centrifuged, resuspended in 1 ml of sonication buffer (0.1 M Tris HCl, 0.05 M EDTA,
0.01 M EGTA, 1% SDS) and sonicated for 10 bursts of 10 seconds. Cell debris was
removed by centrifugation (13,000 rpm for 5 min) and supernatant stored at –80 ºC as
chromatin extracts. For ChIP analysis, specific antibodies against SATB1, acetylated or
methylated isoforms of histone 3 and 4 (Upstate biotechnology, Lake Placid, NY) or
preimmune serum and 40 µl of protein A-Sepharose suspension were added to the
chromatin extract, incubated at 4 ºC over night, and washed. Bound and input chromatin
samples were placed in 0.5% (wt/vol) SDS and incubated overnight at 65 ºC to reverse
the formaldehyde cross-linking. DNA was further purified by phenol-chloroform
extraction and ethanol precipitated using glycogen (10 µg) as a carrier.
For DNA sequence specific quantification by real-time PCR, primers and
fluorescent-labeled TaqMan probes were used. DNA (2 ng) from the ChIP selected (IP)
fraction and 2 ng of genomic DNA as a reference control (Ref) were used as templates.
Using sequence specific primers and Taqman probes for quantitative real-time PCR, at
low amplification the threshold cycle number (Ct) is directly proportional to the amount
of corresponding specific DNA in the sample and is in the linear range. Each cycle
represents a 2X amplification of the amount of product. Enrichment of the specific
sequences in IP was compared with Ref and calculated from the difference of the
threshold cycle number (Ct) for the respective DNA pools. Specifically, IP/Ref = 2 (Ct (Ref)
– Ct (IP)) is used to determine the fold difference 26.
For personal use only. by guest on June 8, 2013. bloodjournal.hematologylibrary.orgFrom
9
Co-immunoprecipitation
K562 nuclear extract (100 µg) was incubated with SATB1 or CBP antibodies, or
preimmune serum and protein A-Agarose (Santa Cruz, Biotechnology Inc., Santa Cruz,
California) in 1 ml of binding buffer (0.5% NP-40, 10 mM Tris HCL, 150 mM NaCl, 2
mM EDTA, 10% glycerol, Protease inhibitor) for 3 hr at 5°C. The reaction mixture was
briefly centrifuged, the pellet washed in 1 ml binding buffer three times at 5°C for 5 min.,
and the immunoprecipitated SATB1/CBP or CBP/SATB1 complexes were separated on a
polycrylamide gel. Anti-SATB1 or anti-CBP antibody was used for Western blot analysis
of bound proteins.
Treatment with antisense oligonucleotide
SATB1 sense and antisense oligonucleotides flanking the translation start site (5’-
GCCTCGTTCAAATGATCCATACTCAGTC-3’) were synthesized with a
phosphorothioate backbone and purified by HPLC (Synthegen, Houston, TX). Fresh
antisense or sense (control) oligonucleotide was added to the primary erythroid
progenitor cells at day 1 and day 3 of phase II culture and the cells harvest at day 5.
Statistical methods
Statistical analysis was carried out by standard methods. Error bars used
throughout indicate standard deviation about the mean.
For personal use only. by guest on June 8, 2013. bloodjournal.hematologylibrary.orgFrom
10
RESULTS
SATB1 increases embryonic globin production
To investigate the influence of SATB1 on globin gene regulation, a SATB1
expression vector was stably transfected into K562 cells which endogenously express a
low level (compared with T-lymphocytes) of SATB1 (or its isoform) 14,27, to generate
K562/SATB1. Western blotting confirmed the increase in SATB1 expression (Figure
1A). Surprisingly, a red cell pellet clearly indicated a marked elevation in hemoglobin
production in the K562/SATB1 cells without hemin (Figure 1A). Benzidine staining
shows hemoglobinization increasing from 4% (control K562 population) to 48% in the
K562/SATB1 cells (Figure 1B). Additional stable K562/SATB1 clones were isolated and
analyzed. SATB1 levels, determined by Western blotting, correlated with hemoglobin
production measured spectrophotometrically (Figure 1C). Since globin expression is
primarily transcriptionally regulated, quantification of globin mRNA reflects the amount
of globin produced. Globin gene expression was determined using gene specific primers
and Taqman probes (Table 1). K562 cells express predominantly γ- and ε-, and low levels
of β-globin mRNA (Figure 1D). Quantitative RT-PCR analysis indicated that
overexpression of SATB1 increased ε-globin transcripts to 250% compared to stable
transfection with the vector control (mock) and reduced γ-globin transcripts while leaving
β-globin unchanged (Figure 1D). Induction of corresponding hemoglobin was confirmed
by HPLC. SATB1 increased ε-globin gene expression in a dose-dependent manner
(Figure 1E).
We previously showed that increasing GATA-1 in K562 cells decreases ε-globin
expression, while increasing GATA-2 increases ε- and γ-globin expression 28. SATB1 did
not affect GATA-1 or GATA-2 production. Western blot analysis of K562, K562/SATB1
and K562 mock cells showed comparable amounts of GATA-1 and GATA-2 (Figure 1F).
EMSA determined GATA-1 binding in nuclear extract from K562 cells and several
clones of K562/SATB1 cells and indicated that increasing SATB1 only modestly affected
For personal use only. by guest on June 8, 2013. bloodjournal.hematologylibrary.orgFrom
11
GATA-1 binding to DNA in K562/SATB1 clones (Figure 1G, lanes 8-11), compared to
the reported 10-fold or more increase by hemin 29-31. As controls for GATA-1 binding,
cold probe (G) and GATA-1 antibody (αG) displaced GATA-1 binding, while a mutant
GATA-1 competitor (∆G) had no effect (Figure 1G, lanes 1 –7).
Hemin-induced erythroid differentiation
Hemin induction of K562 cell erythroid differentiation increases hemoglobin
production and γ-globin gene expression 32. Using hemin induced K562 nuclear extract
for EMSA, protein binding to the SATB1 probe (S), Wt (25)7, consisting of the core
sequence of the base unpairing region (BUR) from the immunoglobulin heavy-chain
enhancer (5’-(TCTTTAATTTCTAATATATTTAGAA)7-3’) 17 was found to markedly
decrease after a 72 hour hemin exposure (Figure 2A). Western blotting confirmed a
reduction in protein detected using the anti-SATB1 antibody with hemin treatment
(Figure 2B). Although the predicted molecular mass of SATB1 is 85.9 kDa, SATB1 from
thymus (T-lymphocytes) migrates at 103 kDa on SDS-polyacrilamide gels 33, and the
detected protein in K562 cells migrates faster at 96 kDa, suggesting a modified or
isoform of SATB1 protein in erythroid cells 27. Quantification of globin transcripts in
these K562 cells revealed the expected increase in γ-globin mRNA reaching 9-fold and a
decrease in ε-globin mRNA by 8-fold, after 96 hours of hemin induction (Figure 2C).
Hence, during erythroid differentiation of K562 cells by hemin, induction of γ-globin
transcription and hemoglobin production proceeds with a decrease in anti-SATB1
immunoreactive protein and ε-globin gene expression. The decrease in ε-globin
expression following hemin induction is consistent with the late passage of the K562
cells used in this study, and is in contrast with the induction of ε-globin expression
observed in earlier passages of K562 cells 32,34.
For personal use only. by guest on June 8, 2013. bloodjournal.hematologylibrary.orgFrom
12
SATB1 interacts with MARs localized in the β-globin cluster in vivo
To identify new SATB1 binding sites in the β-globin locus in addition to those
previously reported in this region, we examined SATB1 binding to potential MAR
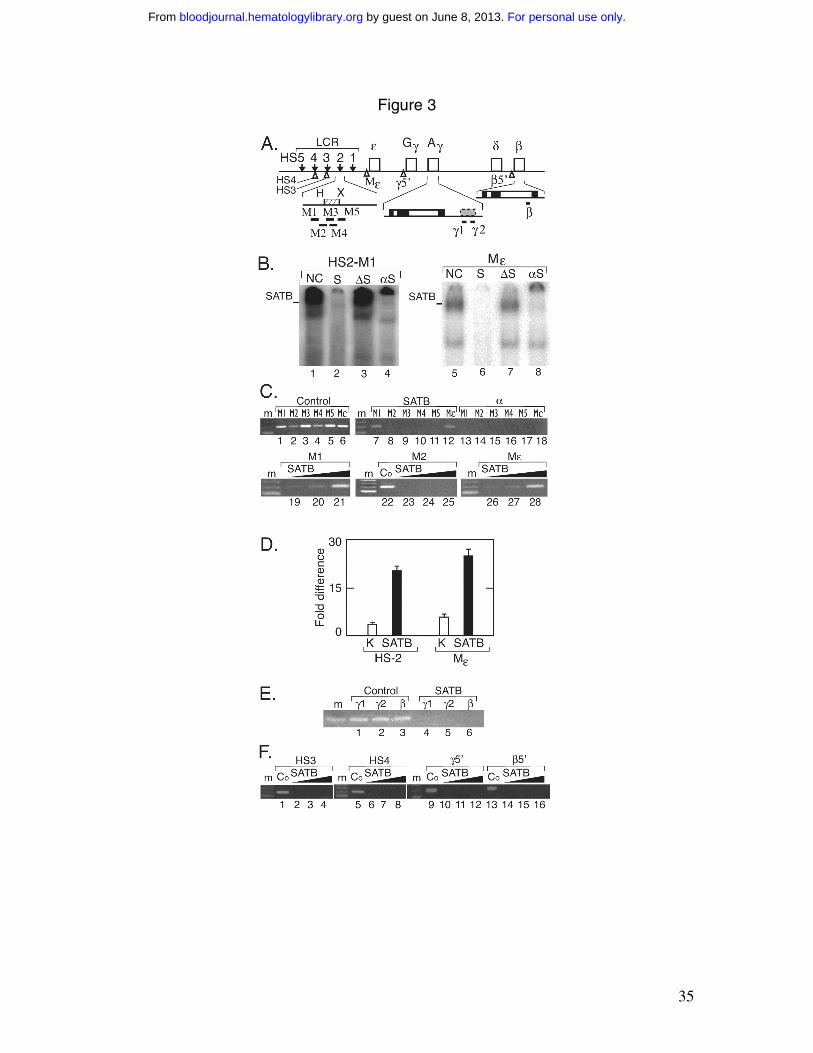
sequences from HS2 and the 5’ flanking region of the ε-globin gene (Figure 3A) 13. Using
the potential MAR at the 5’ region of HS2 (HS2-M1:
CATTATAATTAACTGTTATTTTTTA, located 158 bp upstream of Hind III in the HS2
core) as a DNA probe for EMSA, we observed a slow migrating band from the K562
nuclear extract (Figure 3B lanes 1-4). This band was competed by the SATB1 binding
sequence Wt (25)7) (S) 17, and by SATB1 antibody (αS), but not by a mutated SATB1
binding competitor (∆S), mut (24)8 (5’-(TCTTTAATTTCTACTGCTTTAGAA)8-3’) 17.
We also observed SATB1 binding to Mε, the 5’ ε-globin (
TTCCTATTTTGAGATTTGCTCCTTT) located 392 bp 5’ flanking the ε-globin
proximal promoter (Figure 3B lanes 5-8). The slow migrating SATB1 band was
competed by the SATB1 competitor and the SATB1 antibody, but not by the mutant
competitor.
ChIP assay was used to assess SATB1 binding in living cells. SATB1-bound
chromatin complexes from K562 cells were isolated using the anti-SATB1 antibody. We
examined binding in vivo to ATC sequence rich regions previously reported to bind to
SATB1 in vitro or to nuclear matrix proteins as well as selected ATC sequence-rich
regions from γ-globin 5’ (39081-39310), β-globin 5’ (60661-60870), HS4 (853-1525),
HS3 (4239-4909) and HS2 (M1 (8127-8327), M2 (8346-8546), M3 (8525-8725), M4
(8579-8797), and M5 (8832-9032)) (Figure 3A). Specific primer pairs and corresponding
probes (Table 1) were used for quantitative real-time PCR analyses of chromatin
fragments immunoprecipitated with the anti-SATB1 antibody (SATB1-ChIP DNA). All
primer pairs yielded PCR products with control genomic DNA (Figure 3C, E and F).
With SATB1-ChIP DNA, only HS2-M1 and Mε produced PCR products indicating
SATB1 binding in vivo at these sites (Figure 3C lanes 7 and 12). No PCR products were
For personal use only. by guest on June 8, 2013. bloodjournal.hematologylibrary.orgFrom
13
produced using pre-immune serum (Figure 3C lanes 13-18). Increasing amounts of
SATB1-ChIP DNA produced corresponding increases in PCR products for HS2-M1 and
Mε (19149-19346) in the ε-globin 5’ but not HS2-M2 primer pairs (Figure 3C lanes 19-
28). Quantitative real-time PCR demonstrated an increased binding of M1 and Mε to
SATB1 in the K562/SATB1 cells compared with K562 cells (Figure 3D). No binding of
SATB1 was observed for MARs in the 3’ Aγ-globin enhancer region (γ1 (41334-41441)
and γ2 (41549-41654)) or in the β-globin IVS2 (63006-63114) (Figure 3E), showing that
SATB1 binding in vitro to the 3’ Aγ-globin enhancer or β-globin IVS2 does not correlate
with binding in living cells. In addition, no binding of SATB1 was observed for other
ATC sequence-rich regions localized at HS3, HS4, Aγ-globin 5’ (-386 bp), and β-globin
5’ (-1526 bp) (Figure 3F).
SATB1 enhances transcriptional activity via binding to specific MARs
SATB1 activation of ε-globin transcription is mediated in part by its direct effect
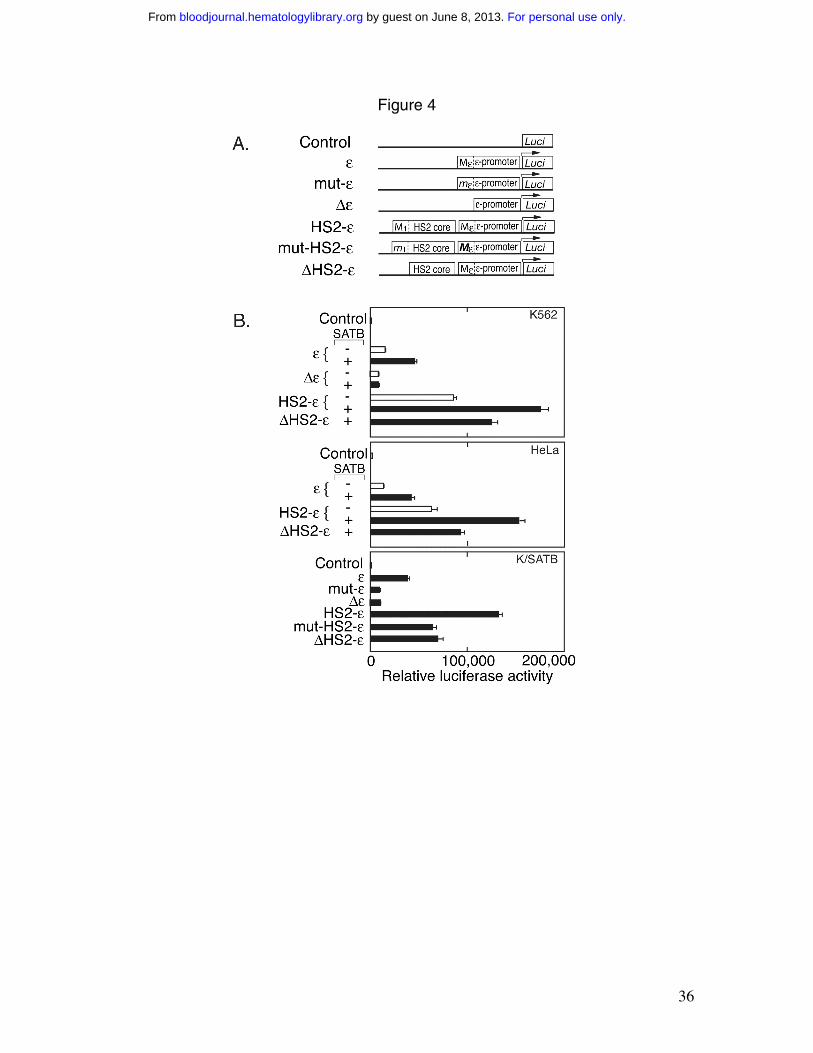
on the ε-globin proximal promoter. The ε-globin promoter region with flanking Mε-MAR
was cloned into the pREP4/Luc episomal reporter vector to produce pREP4/ε (Figure
4A). pREP4/Luc does not integrate stably into the genome, but rather propagates as an
episome and displays appropriate nucleosomal chromatin structure 35. Analysis of these
pREP4/Luc-derived constructs in K562 cells revealed a 3-fold increase in luciferase
activity by cotransfection of the SATB1 expression construct (pEGFP/SATB1) with
pREP4/ε (Figure 4B). Deletion of Mε-MAR (pREP4/∆ε) reduced luciferase activity by
about two-fold, and cotransfection of pEGFP/SATB1 had no effect on pREP4/∆ε
activity. HS2 containing the 5’ SATB1 binding site M1 was inserted into pREP4/ε to
create pREP4/HS2-ε. HS2-ε increased ε-globin promoter activity, which was further
enhanced by cotransfection with pEGFP/SATB1. With increased SATB1 expression,
deletion of M1 MAR in HS-2 (∆HS2-ε) reduced transcription activity to 0.7the level of
HS2-ε . The effect of SATB1 did not appear to depend on the presence of erythroid-
For personal use only. by guest on June 8, 2013. bloodjournal.hematologylibrary.orgFrom
14
specific transcription factors such as GATA-1 or NF-E2, as indicated by analysis of these
pREP4/Luc derived constructs in HeLa cells that do not express endogenous SATB1
(Figure 4B). Cotransfection of pEGFP/SATB1 and pREP4/ε in HeLa cells led to
increased reporter activity comparable to the increase observed in K562 cells.
pEGFP/SATB1 cotransfection led to the two- fold increase in reporter activity of
pREP4/HS2-ε in HeLa cells with a 2/3 decreased in reporter activity for the M1 MAR-
deleted pREP4/∆HS2-ε compared with pREP4/HS2-ε. These data provide evidence for a
direct effect of SATB1 on ε-globin promoter activity, mediated by the SATB1 binding
Mε and on the enhancing effect of HS2, mediated by M1 MAR in the 5’ region of HS2.
These constructs were further analyzed in K562/SATB1 cells with elevated
SATB1 expression (Figure 1B). Additional constructs were examined including direct
mutation of Mε in pREP4/ε to give pREP4/mut-ε, and mutation of M1 in pREP4/HS2-ε
to give pREP4/mut-HS2-ε. Transfection of pREP4/εinto K562/SATB1 cells resulted in
robust transcription activity. This activity decreased by mutation of Mε in pREP4/mut-ε
and was comparable to the reduction obtained with pREP4/∆ε. Addition of HS2
(pREP4/HS2-ε) increased transcription activity by 3.4-fold compared with pREP4/ε.The
effect of mutating HS2-M1 was comparable to deletion of HS2-M1, and the transcription
activity of pREP4/mut-HS2-ε and pREP4/∆HS2-ε was reduced to about 0.5 that of
pREP4/HS2-ε. These results in the K562/SATB1 cells are comparable to those obtained
for cotransfection of the reporter gene with the SATB1 expression vector in the control
K562 cells.
SATB1 overexpression contributes to the formation of active chromatin structure at
specific loci in the β-globin cluster
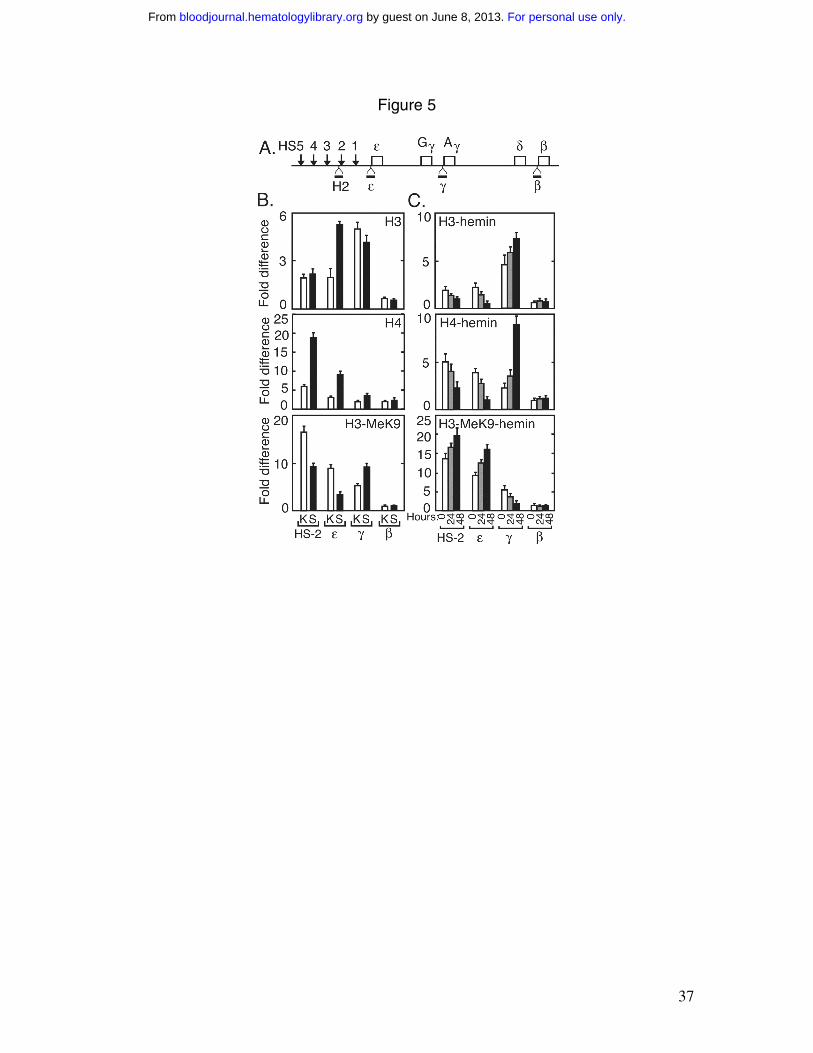
We determined the acetylation and methylation states of core histones in HS2 and
ε-globin, γ-globin, and β-globin promoters in the K562/SATB1 cells, where the SATB1
level are elevated. Antibodies against acetylated isoforms of histone 3 and 4 were used
For personal use only. by guest on June 8, 2013. bloodjournal.hematologylibrary.orgFrom
15
for ChIP analysis. Primers and Taqman probes, specific for the HS2 enhancer core
sequence, ε-globin, γ-globin, and β-globin promoters (Figure 5A), were used for
quantitative real-time PCR (Table 1). In K562/SATB1 cells, histone H3 acetylation in the
ε-globin promoter increased by two-fold compared with control K562 cells with a small
decrease or no change observed for γ-globin and β-globin promoters (Figure 5B). Histone
H4 acetylation in HS2 and the ε-globin promoter increased about three-fold compared
with the control K562 cells and more modest (2-fold or less) or no changes were
observed for the γ-globin and β-globin promoters. Methylation of histone H3 at lysine 9
(H3-MeK9) decreased 2-fold in HS2 and the ε-globin promoter, and increased 2-fold in
the γ-globin promoter (Figure 5B). Histone acetylation associates with actively
transcribed genes and the hyperacetylation in HS2 and the ε-globin promoter may be
indicative of a preferential shift of HS2 and ε-globin to a more transcriptionally active
state in the K562/SATB1 cells. H3-MeK9 is linked to a less active transcriptional state,
and the changes in H3-MeK9 provide further evidence for a shift of HS-2 and the ε-
globin promoter to a more transcriptionally active state. SATB1 reduces γ-globin
expression, and may be indicative of the increase in H3-MeK9 associated with the γ-
globin promoter offsetting the modest increase in histone H4 acetylation to reduce
transcription activation of γ-globin relative to ε-globin gene expression.
Hemin induction decreases SATB1 immunoreactive protein with concomitant
decreasing ε-globin expression and increasing γ-globin expression. ChIP analysis showed
that hemin induction decreased histones H3 and H4 acetylation in chromatin associated
with HS2 by 2-fold, and with the ε-globin promoter by 3- to 4-fold following 48 hours of
hemin induction (Figure 5C). These changes in addition to increases in associated H3-
MeK9, are indicative of a shift of HS2 and the ε-globin promoter to a less
transcriptionally active state, consistent with the reduced expression. Conversely, hemin
increases H3 and H4 acetylation and decreases H3-MeK9 in chromatin associated with
For personal use only. by guest on June 8, 2013. bloodjournal.hematologylibrary.orgFrom
16
the γ-globin promoter, as expected for transcription activation and the marked increase in
γ-globin expression (Figure 5C).
CBP increases SATB1 transcriptional activity
CBP/p300 is known to interact with a variety of DNA-binding transcription
factors and to possess intrinsic histone acetyltransferase activity 36,37. CBP cooperates
with GATA-1 and is required for erythroid differentiation 38. Using
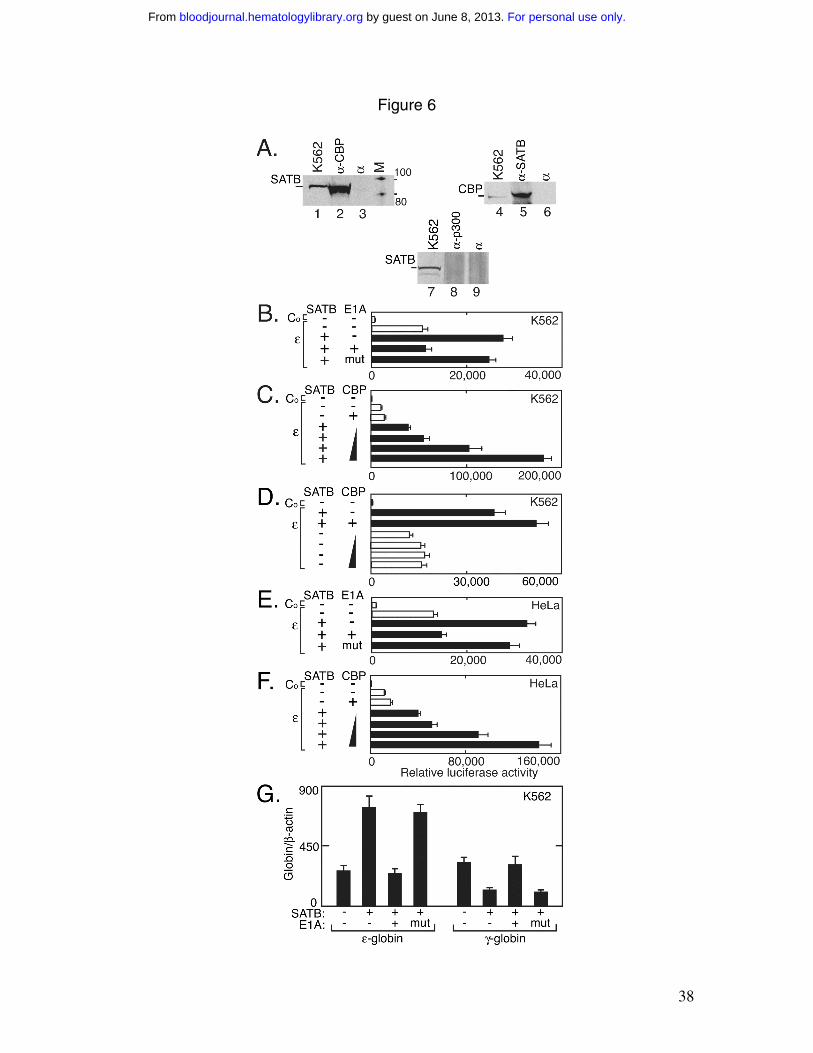
coimmunoprecipitation analysis and antibodies specific for SATB1 and CBP, we found
that a complex containing CBP and SATB1 in K562 cells could be immunoprecipitated
by both CBP and SATB1 specific antibodies but not by preimmune serum (Figure 6A,
lanes 1-6). In contrast, no SATB1 and p300 protein complex in K562 cells was detected
(Figure 6, lane 8). E1A is known to be able to repress CBP transcriptional activity and
has been used to test the requirement of CBP 39. In K562 cells, cotransfection of
pEGFP/SATB1 and an E1A expression vector with pREP4/ε abrogated the increase in
reporter gene activity observed with cotransfection of pEGFP/SATB1 alone with
pREP4/ε (Figure 6B). There was no inhibition of luciferase activity when using the
mutant E1A∆2-36. In the presence of SATB1, CBP exhibited a dose dependent increase
in pREP4/ε reporter gene activity (Figure 6C), while cotransfection of increasing
amounts of the CBP expression construct with the pREP4/ε reporter gene in the absence
of pEGFP/SATB1 showed little change in transcription activity (Figure 6D). These
results provide evidence that SATB1 and the transcription coactivator, CBP, are in the
same protein complex that is functionally important for ε-globin expression and that CBP
enhances SATB1-mediated transcriptional activity. Reporter gene assays in HeLa cells
exhibited comparable inhibition by E1A of SATB1 activity on the ε-globin promoter with
no effect on the mutant E1A∆2-36 (Figure 6E). The dose dependent enhancement by
CBP of SATB1 activation of the ε-globin promoter was also observed in HeLa cells
(Figure 6F) providing additional evidence for participation of SATB1 and CBP in a
For personal use only. by guest on June 8, 2013. bloodjournal.hematologylibrary.orgFrom
17
protein complex that contributes to ε-globin promoter activity. Further support for
cooperation between CBP and SATB1 for ε-globin activation is given by the ability of
E1A but not mutant E1A∆2-36 to abrogate the increase in endogenous ε-globin
expression by SATB1 (Figure 6G). Interestingly, E1A also inhibits the SATB1 decrease
of endogenous γ-globin expression.
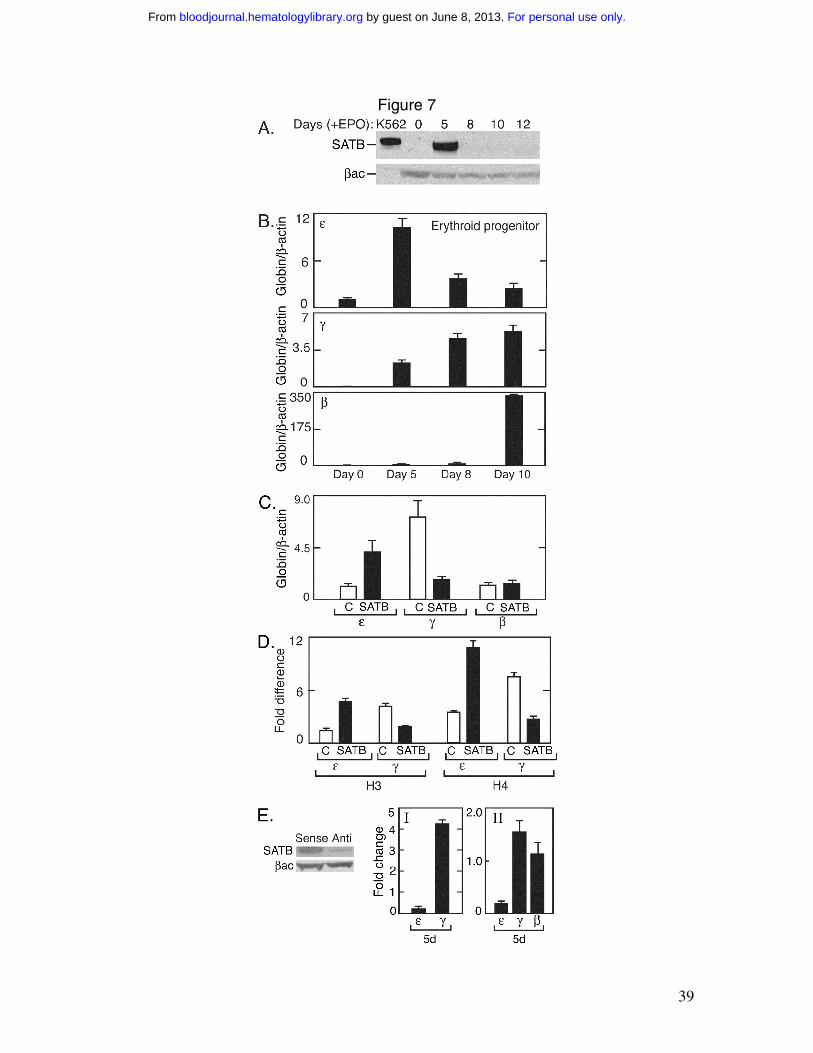
Human primary erythroid protenitor cells
To determine expression of SATB1 during erythroid differentiation of human
adult erythroid progenitor cells, human primary hematopoietic progenitor cells were
isolated from peripheral blood and stimulated for erythroid differentiation. Western
blotting with anti-SATB1 antibody detected protein early during erythroid differentiation
at day 5 of erythropoietin stimulation (Figure 7A). By day 8 with erythropoietin, this
protein band was markedly decreased to low levels. We have previously shown ε-globin
gene activation during early adult erythropoiesis 20. Analysis of β-like globins in these
cultures revealed that the peak ε-globin expression at day 5 following erythropoietin
stimulation coincided with the peak in reactivity to anti-SATB1 antibody and markedly
decreased by day 8 of erythropoietin stimulation, while γ-globin expression continued to
increase (Figure 7B). The induction of β-globin gene expression followed and then
surpassed γ-globin gene expression late in erythroid differentiation (Figure 7B). These
data show a possible correlation between ε-globin gene expression and SATB1 family
protein expression.
To investigate the effect of SATB1 on globin gene transcription, a SATB1
expression vector was transfected into human primary adult erythroid progenitor cells,
and the cells were harvested at day 8. Maintaining SATB1 expression at a high level
beyond day 5 resulted in an increase in ε-globin expression (3-fold) with a reduction in γ-
globin expression (3-fold) (Figure 7C). These changes in ε-globin and γ-globin
expression are concomitant with increases in histone H3 and H4 acetylation in the ε-
For personal use only. by guest on June 8, 2013. bloodjournal.hematologylibrary.orgFrom
18
globin promoter and with decreases in histone H3 and H4 acetylation in the γ-globin
promoter (Figure 7D). These data suggest that, as observed in K562 cells, manipulation
of the SATB1 level during differentiation of adult early erythroid progenitor cells can
alter chromatin associated with ε-globin and γ-globin and change the balance of globin
gene expression, particularly between ε-globin and γ-globin. To down regulate SATB1
family protein expression, a SATB1 antisense oligonucleotide was synthesized.
Transfection into cells down regulated anti-SATB1 immunoreactive protein when
compared with the sense control (Figure 7E). As observed with hemin induction in K562
cells, the antisense oligonucleotide resulted in a decrease in SATB1, a decrease in ε-
globin, and an increase in γ-globin expression compared with the sense control (Figure
7E).
For personal use only. by guest on June 8, 2013. bloodjournal.hematologylibrary.orgFrom
19
DISCUSSION
SATB1 is required for coordinating gene expression during T-cell development 40
and can target multiple chromatin-remodeling complexes to specific genomic sites in
order to regulate chromatin structure 18. We found that SATB1 family protein which is
expressed in K562 cells 27 is down regulated by hemin induction which is concomitant
with increased γ-globin expression and decreased ε-globin expression. Conversely,
increased SATB1 expression in transfected K562 cells results in activation of ε-globin
and a decrease in γ-globin expression, with a marked induction of total hemoglobin
production in the absence of hemin.
Transcription factors, such as GATA-1 and NF-E2, and EKLF for β-globin
expression, can interact specifically within the β-globin cluster at the LCR and down
stream globin genes, and can associate with histone acetylases to modify chromatin
structure to activate globin gene transcription. In vivo SATB1 binding genomic sites are
tightly associated with the base of chromatin loops 41. Linkage between SATB1 and
globin gene expression was initially suggested by the discovery of SATB1 binding sites
localized to important regulatory regions within the β-globin cluster. These sites include
MARs or ATC sequence-rich regions in HS2 (but not HS3 or HS4) and in the
downstream ε-, γ- and β-globin genes 12,14,15,42,43. It has been suggested that SATB1 may
participate in a dynamic process to mediate looping of the β-globin locus to achieve
transcriptional control, advancing the notion that SATB1 binding to MARs may facilitate
the remodeling of local chromatin structure and may bring distal regulatory elements in
close proximity to promoters 16. We screened these potential MARs or SATB1-binding
regions 12,14,15,42,43 and found that SATB1 bound in vivo to HS2 (M1) and the ε-globin
promoter Mε, but did not bind to previously reported in vitro binding sites in the 3’ γ-
globin enhancer or β-IVS2 or to ATC sequence- rich regions in HS3, HS4 or the 5’
region of the γ- or β-globin genes. HS2 was the first hypersensitive site identified in the
For personal use only. by guest on June 8, 2013. bloodjournal.hematologylibrary.orgFrom
20
LCR with erythroid-specific developmental-stage-independent enhancer activity 44 and
HS2, but not HS3 or HS4, activates transcription of the ε-globin gene in K562 cells in
studies using chromatinized episomes 45,46. The data presented here suggest a role for
SATB1 in globin gene regulation by selective activation of ε-globin transcription. This
activation is mediated in part via the formation of a complex containing SATB1 and CBP
to increase ε-globin expression.
SATB1 orchestrates gene expression by recruiting chromatin modifiers and
regulating region-specific histone modification 18,19. In the K562/SATB1 cells, ε-globin
expression increases concomitant with the formation of a permissive chromatin state in
HS-2 and the ε-promoter, characterized by increased histone H3 and H4 acetylation and a
decreased H3-MeK9 in these regions. A decrease in γ-globin expression in the
K562/SATB1 cells is accompanied by an increase in H3 MeK9, but little or no change in
histones H3 and H4 acetylation. With hemin induction in K562 cells resulting in a
decrease in SATB1 family protein expression, the converse was observed: decreased
expression of ε-globin was accompanied by a change in histone modification toward that
representing silent chromatin, while increased expression of γ-globin was associated with
a shift toward a more active chromatin state. Interestingly, these data suggest a reciprocal
relationship between ε- and γ-globin gene expression during early-stage erythroid
differentiation.
Increased ε-globin expression in K562/SATB1 cells is mediated in part via ε-
promoter activation dependent on the presence of an intact Mε motif, demonstrated by the
episomal pREP4/ε reporter gene assay. Further enhancement of ε-promoter activity by
HS2 with an intact HS2-M1 motif in the presence of SATB1 identifies this motif as
another functionally important SATB1-binding site. The contribution of SATB1 to ε-
globin activation, via interaction with HS2 and the ε-globin promoter, may relate to
previously described developmental stage-specific epigenetic changes that occur prior to
recruitment of NF-E2 binding to Mafk-recognition elements (MAREs) in HS2, and to
For personal use only. by guest on June 8, 2013. bloodjournal.hematologylibrary.orgFrom

21
high-level transcription activation of downstream globin genes 47-50. Reporter gene
analysis in HeLa cells indicates that SATB1 activation of ε-globin promoter activity does
not depend on other erythroid transcription factors such as GATA-1 or NF-E2. Together,
these underscore the importance of chromatin modification in gene expression and the
potential role for SATB1 during erythroid differentiation.
CBP/p300 is a cofactor for many erythroid-specific transcription factors, such as
GATA-1, NF-E2 and EKLF, and can bridge activators with TBP or pol II or other
components of the basal transcription machinery 1,37,38,51. We found that SATB1 and CBP
are part of a protein complex that is important for ε-globin activation but does not appear
to require other erythroid transcription factors. While CBP alone has minimal effect on ε-
globin promoter activity, CBP augments SATB1 activation of the ε-globin promoter.
Conversely, E1A blocks SATB1 induction of ε-globin gene expression. Adenoviral E1A
is a viral oncoprotein that can physically interact with cellular proteins, including
CBP/p300, YY1 and SWI/SNF complexes, to affect cellular proliferation and
differentiation, and can inhibit erythroid differentiation through sequestering CBP/p300
39. Similar augmentation by CBP and suppression by E1A of SATB1 activation of the ε-
promoter were also observed in HeLa cells indicating that other erythroid-specific factors
are dispensable for this activity. Although in T-cells, SATB1 appears to interact with
p300 but not CBP52, a complex containing SATB1 and p300 was not detected in K562
cells.
A variety of processes regulate globin gene expression, including activator
binding to regulatory regions, recruitment of basal transcription factors to the promoter,
and chromatin remodeling. Therefore, the study of SATB1 interacting with the β-globin
cluster through specific binding offers an additional mechanism to be considered for
modification of globin gene expression and for possible chromatin remodeling in
erythroid cells. Manipulation of the SATB1 protein level affects both ε- and γ-globin
gene expression in K562 cells and in primary human adult hematopoietic progenitor cell
For personal use only. by guest on June 8, 2013. bloodjournal.hematologylibrary.orgFrom
22
cultures, providing further evidence for a reciprocal relationship between ε- and γ-globin
expression during early erythroid differentiation. The data presented here provide
evidence that SATB1 family protein has a role in activation of the β-globin cluster,
especially the ε-globin gene, mediated by interaction with HS2 and the ε−globin
promoter. The potential for SATB1 manipulation to affect fetal hemoglobin production in
adult erythroid progenitor cells awaits further study.
Acknowledgments: We thank Dr. Keji Zhao for pREP4/Luc vector and Dr. Emory
Bresnick and Dr. Alan Schechter for helpful discussion.
For personal use only. by guest on June 8, 2013. bloodjournal.hematologylibrary.orgFrom
23
Reference:
1. Letting DL, Rakowski C, Weiss MJ, Blobel GA. Formation of a tissue-specific histone acetylation pattern by the hematopoietic transcription factor GATA-1. Mol Cell Biol. 2003;23:1334-1340
2. Hung HL, Kim AY, Hong W, Rakowski C, Blobel GA. Stimulation of NF-E2 DNA binding by CREB-binding protein (CBP)-mediated acetylation. J Biol Chem. 2001;276:10715-10721
3. Zhang W, Bieker JJ. Acetylation and modulation of erythroid Kruppel-like factor (EKLF) activity by interaction with histone acetyltransferases. Proc Natl Acad Sci U S A. 1998;95:9855-9860
4. Bender MA, Bulger M, Close J, Groudine M. Beta-globin gene switching and DNase I sensitivity of the endogenous beta-globin locus in mice do not require the locus control region. Mol Cell. 2000;5:387-393
5. Schubeler D, Groudine M, Bender MA. The murine beta-globin locus control region regulates the rate of transcription but not the hyperacetylation of histones at the active genes. Proc Natl Acad Sci U S A. 2001;98:11432-11437
6. Gui CY, Dean A. Acetylation of a specific promoter nucleosome accompanies activation of the epsilon-globin gene by beta-globin locus control region HS2. Mol Cell Biol. 2001;21:1155-1163
7. Nelson WG, Pienta KJ, Barrack ER, Coffey DS. The role of the nuclear matrix in the organization and function of DNA. Annu Rev Biophys Biophys Chem. 1986;15:457-475
8. Kohwi-Shigematsu T, Kohwi Y. Torsional stress stabilizes extended base unpairing in suppressor sites flanking immunoglobulin heavy chain enhancer. Biochemistry. 1990;29:9551-9560.
9. Bode J, Kohwi Y, Dickinson L, Joh T, Klehr D, Mielke C, Kohwi-Shigematsu T. Biological significance of unwinding capability of nuclear matrix- associating DNAs. Science. 1992;255:195-197.
10. Walter WR, Singh GB, Krawetz SA. MARs mission update. Biochem Biophys Res Commun. 1998;242:419-422.
11. Boulikas T. Homeodomain protein binding sites, inverted repeats, and nuclear matrix attachment regions along the human beta-globin gene complex. J Cell Biochem. 1993;52:23-36.
12. Case SS, Huber P, Lloyd JA. The gammaPE complex contains both SATB1 and HOXB2 and has positive and negative roles in human gamma-globin gene regulation. DNA Cell Biol. 1999;18:805-817.
13. Yan ZJ, Qian RL. The 5'-flanking cis-acting elements of the human epsilon-globin gene associates with the nuclear matrix and binds to the nuclear matrix proteins. Cell Res. 1998;8:209-218.
14. Cunningham JM, Purucker ME, Jane SM, Safer B, Vanin EF, Ney PA, Lowrey CH, Nienhuis AW. The regulatory element 3' to the A gamma-globin gene binds to the nuclear matrix and interacts with special A-T-rich binding protein 1 (SATB1), an SAR/MAR-associating region DNA binding protein. Blood. 1994;84:1298-1308.
15. Jackson CE, O'Neill D, Bank A. Nuclear factor binding sites in human beta globin IVS2. J Biol Chem. 1995;270:28448-28456
For personal use only. by guest on June 8, 2013. bloodjournal.hematologylibrary.orgFrom
24
16. Ostermeier GC, Liu Z, Martins RP, Bharadwaj RR, Ellis J, Draghici S, Krawetz SA. Nuclear matrix association of the human beta-globin locus utilizing a novel approach to quantitative real-time PCR. Nucleic Acids Res. 2003;31:3257-3266
17. Dickinson LA, Joh T, Kohwi Y, Kohwi-Shigematsu T. A tissue-specific MAR/SAR DNA-binding protein with unusual binding site recognition. Cell. 1992;70:631-645.
18. Yasui D, Miyano M, Cai S, Varga-Weisz P, Kohwi-Shigematsu T. SATB1 targets chromatin remodelling to regulate genes over long distances. Nature. 2002;419:641-645.
19. Cai S, Han HJ, Kohwi-Shigematsu T. Tissue-specific nuclear architecture and gene expession regulated by SATB1. Nat Genet. 2003;34:42-51
20. Kollia P, Fibach E, Najjar SM, Schechter AN, Noguchi CT. Modifications of RNA processing modulate the expression of hemoglobin genes. Proc Natl Acad Sci U S A. 1996;93:5693-5698
21. Fibach E. Techniques for studying stimulation of fetal hemoglobin production in human erythroid cultures. Hemoglobin. 1998;22:445-458
22. Francastel C, Poindessous-Jazat V, Augery-Bourget Y, Robert-Lezenes J. NF-E2p18/mafK is required in DMSO-induced differentiation of Friend erythroleukemia cells by enhancing NF-E2 activity. Leukemia. 1997;11:273-280
23. Liu R, Liu H, Chen X, Kirby M, Brown PO, Zhao K. Regulation of CSF1 promoter by the SWI/SNF-like BAF complex. Cell. 2001;106:309-318
24. Ogilvie M, Yu X, Nicolas-Metral V, Pulido SM, Liu C, Ruegg UT, Noguchi CT. Erythropoietin stimulates proliferation and interferes with differentiation of myoblasts. J Biol Chem. 2000;275:39754-39761
25. Fernandez LA, Winkler M, Grosschedl R. Matrix attachment region-dependent function of the immunoglobulin mu enhancer involves histone acetylation at a distance without changes in enhancer occupancy. Mol Cell Biol. 2001;21:196-208.
26. Litt MD, Simpson M, Gaszner M, Allis CD, Felsenfeld G. Correlation between histone lysine methylation and developmental changes at the chicken beta-globin locus. Science. 2001;293:2453-2455
27. Dickinson LA, Kohwi-Shigematsu T. Nucleolin is a matrix attachment region DNA-binding protein that specifically recognizes a region with high base-unpairing potential. Mol Cell Biol. 1995;15:456-465.
28. Ikonomi P, Noguchi CT, Miller W, Kassahun H, Hardison R, Schechter AN. Levels of GATA-1/GATA-2 transcription factors modulate expression of embryonic and fetal hemoglobins. Gene. 2000;261:277-287
29. Partington GA, Patient RK. Phosphorylation of GATA-1 increases its DNA-binding affinity and is correlated with induction of human K562 erythroleukaemia cells. Nucleic Acids Res. 1999;27:1168-1175
30. Zhang P, Zhang X, Iwama A, Yu C, Smith KA, Mueller BU, Narravula S, Torbett BE, Orkin SH, Tenen DG. PU.1 inhibits GATA-1 function and erythroid differentiation by blocking GATA-1 DNA binding. Blood. 2000;96:2641-2648
31. Yi Z, Wang Z, Li H, Liu M. Inhibitory effect of tellimagrandin I on chemically induced differentiation of human leukemia K562 cells. Toxicol Lett. 2004;147:109-119
For personal use only. by guest on June 8, 2013. bloodjournal.hematologylibrary.orgFrom
25
32. Rowley PT, Ohlsson-Wilhelm BM, Wisniewski L, Lozzio CB, Lozzio BB. K562 human leukemia cell passages differ in embryonic globin gene expression. Leuk Res. 1984;8:45-54
33. Nakagomi K, Kohwi Y, Dickinson LA, Kohwi-Shigematsu T. A novel DNA-binding motif in the nuclear matrix attachment DNA-binding protein SATB1. Mol Cell Biol. 1994;14:1852-1860
34. Dean A, Erard F, Schneider AP, Schechter AN. Induction of hemoglobin accumulation in human K562 cells by hemin is reversible. Science. 1981;212:459-461
35. van der Vlag J, den Blaauwen JL, Sewalt RG, van Driel R, Otte AP. Transcriptional repression mediated by polycomb group proteins and other chromatin-associated repressors is selectively blocked by insulators. J Biol Chem. 2000;275:697-704
36. Arany Z, Sellers WR, Livingston DM, Eckner R. E1A-associated p300 and CREB-associated CBP belong to a conserved family of coactivators. Cell. 1994;77:799-800
37. Ogryzko VV, Schiltz RL, Russanova V, Howard BH, Nakatani Y. The transcriptional coactivators p300 and CBP are histone acetyltransferases. Cell. 1996;87:953-959.
38. Blobel GA, Nakajima T, Eckner R, Montminy M, Orkin SH. CREB-binding protein cooperates with transcription factor GATA-1 and is required for erythroid differentiation. Proc Natl Acad Sci U S A. 1998;95:2061-2066
39. Sang N, Caro J, Giordano A. Adenoviral E1A: everlasting tool, versatile applications, continuous contributions and new hypotheses. Front Biosci. 2002;7:d407-413
40. Alvarez JD, Yasui DH, Niida H, Joh T, Loh DY, Kohwi-Shigematsu T. The MAR-binding protein SATB1 orchestrates temporal and spatial expression of multiple genes during T-cell development. Genes Dev. 2000;14:521-535.
41. de Belle I, Cai S, Kohwi-Shigematsu T. The genomic sequences bound to special AT-rich sequence-binding protein 1 (SATB1) in vivo in Jurkat T cells are tightly associated with the nuclear matrix at the bases of the chromatin loops. J Cell Biol. 1998;141:335-348.
42. Yan ZJ, Qian RL. The 5'-flanking cis-acting elements of the human epsilon-globin gene associates with the nuclear matrix and binds to the nuclear matrix proteins. Cell Res. 1998;8:209-218
43. Zhang SB, Qian RL. The interaction between the human beta-globin locus control region and nuclear matrix. Cell Res. 2002;12:411-416
44. Tuan DY, Solomon WB, London IM, Lee DP. An erythroid-specific, developmental-stage-independent enhancer far upstream of the human "beta-like globin" genes. Proc Natl Acad Sci U S A. 1989;86:2554-2558
45. Gong QH, McDowell JC, Dean A. Essential role of NF-E2 in remodeling of chromatin structure and transcriptional activation of the epsilon-globin gene in vivo by 5' hypersensitive site 2 of the beta-globin locus control region. Mol Cell Biol. 1996;16:6055-6064
46. Jackson DA, McDowell JC, Dean A. Beta-globin locus control region HS2 and HS3 interact structurally and functionally. Nucleic Acids Res. 2003;31:1180-1190
For personal use only. by guest on June 8, 2013. bloodjournal.hematologylibrary.orgFrom

26
47. Bottardi S, Aumont A, Grosveld F, Milot E. Developmental stage-specific epigenetic control of human beta-globin gene expression is potentiated in hematopoietic progenitor cells prior to their transcriptional activation. Blood. 2003;102:3989-3997
48. Sawado T, Halow J, Bender MA, Groudine M. The beta -globin locus control region (LCR) functions primarily by enhancing the transition from transcription initiation to elongation. Genes Dev. 2003;17:1009-1018
49. Sawado T, Igarashi K, Groudine M. Activation of beta-major globin gene transcription is associated with recruitment of NF-E2 to the beta-globin LCR and gene promoter. Proc Natl Acad Sci U S A. 2001;98:10226-10231
50. Johnson KD, Grass JA, Boyer ME, Kiekhaefer CM, Blobel GA, Weiss MJ, Bresnick EH. Cooperative activities of hematopoietic regulators recruit RNA polymerase II to a tissue-specific chromatin domain. Proc Natl Acad Sci U S A. 2002;99:11760-11765
51. Blobel GA. CBP and p300: versatile coregulators with important roles in hematopoietic gene expression. J Leukoc Biol. 2002;71:545-556
52. Fujii Y, Kumatori A, Nakamura M. SATB1 makes a complex with p300 and represses gp91(phox) promoter activity. Microbiol Immunol. 2003;47:803-811
For personal use only. by guest on June 8, 2013. bloodjournal.hematologylibrary.orgFrom

27
Table 1 PCR Primers and Probes
PCR Product
Forward Primer Reverse Primer Probe
β-globin CTCATGGCA AGAAAGTGCTCG AATTCTTTGCCAAAGTGATGG G FAMCGTGGATCCTGAGAACTTCAGGCTCCT-TAMRA
γ-globin GGCAACCTGTCCTCTGCCTC GAAATGGATTGCCAAAACGG FAMCAAGCTCCTGGGAATGTGCTGGTG-TAMRA
ε-globin CAAGCCCGCCTTTGCTAA TTGCCAAAGTGAGTAGCCAGAA FAMACTTCAAGCTCCTGGGTAACGTGATGGTGATTAT-TAMRA
HS2 core sequence
TTCCAGCATCCTCATCTCTGA TCACATTCTGTCTCAGGCATC FAMCAGCCTAGAGTGATGACTCCTATC-TAMRA
HS3 core sequence
TATGTATGGGTCAGTGGTCT CCCTGCTTAGGAGCTTAATC
HS4 core sequence
AAGGGGTGGACTCCAGAGAC CTCCTGACTTTCTGTCTAGT
ε-promoter TTTTAAGTACCATGGAGAACAGG
ATGAAATGACACCATATCAGATAC
FAMGGACACAGGTCAGCCTTGACCA-TAMRA
γ-promoter GAGATTGACAAGAACAGTTTGAC
ATCCAGTGAGGCCAGGGGC FAMCCTAGTCCAGACGCCATGGGTCAT-TAMRA
β-promoter TGCTTACCAAGCTGTGATTCC AACGGCAGACTTCTCCTCAGG FAMAGCCAGTGCCAGAAGAGCCAAGGA-TAMRA
γΑ-3’enhancer MAR 1
AGAAATGAATCAGCAGAGGCTCA
CATTTTGATCTCACAGTGCTGGTC
γΑ-3’enhancer MAR 2
GGATGGTTCTTAATGAAGGGAAAGT
AAGTGCCATTAGAAATAGTATTCCTCCT
γΑ-5’MAR CCTGGTATCCTCTATGATGGGA CAAGGCTATTGGTCAAGGCA
β-5’MAR ATAACTAGAAATAGAGGATCCAGTT
CTGAATCCTGCCCCTACCTGGAA
β-globin IVS MAR
CTCCCTACTTTATTTTCTTTTATTTTTAATTGATAC
CCCTGATTTGGTCAATATGTGTACAC
ε-globin promoter Mε-MAR
AACTGTCACCACCTTTAAGGCA TGCAGATAGATGAGGAGCCAAC FAMTGCTCCTTTATATGAGGCTTTCTTG-TAMRA
HS2-M1 MAR
TGCCTCTACAAAAAGTACAAAAATTAGC
CCCCACAAGAGTCCAAGTAAAAA
FAMATGGTGGTGTGCACCTGTAATCC-TAMRA
HS2-M2 MAR
TATTCTTATTTATGATTCAAGCACT
TCATGCTTGGACTATGGGAGGTCA
HS2-M3 MAR
ACCCCCGCCTTCTGGTT ACTCAGGTGGTCAGCTTCTCCT
HS2-M4 MAR
GGATGCCTGAGACAGAATGTGAC
CGGTTCCTGTTCCATATCCTTGTT
HS2-M5 MAR
AGAAGCGGCAGAATCAGGC CCCGTATGTGAGCATGTGTCC
For personal use only. by guest on June 8, 2013. bloodjournal.hematologylibrary.orgFrom
28
FIGURE LEGENDS:
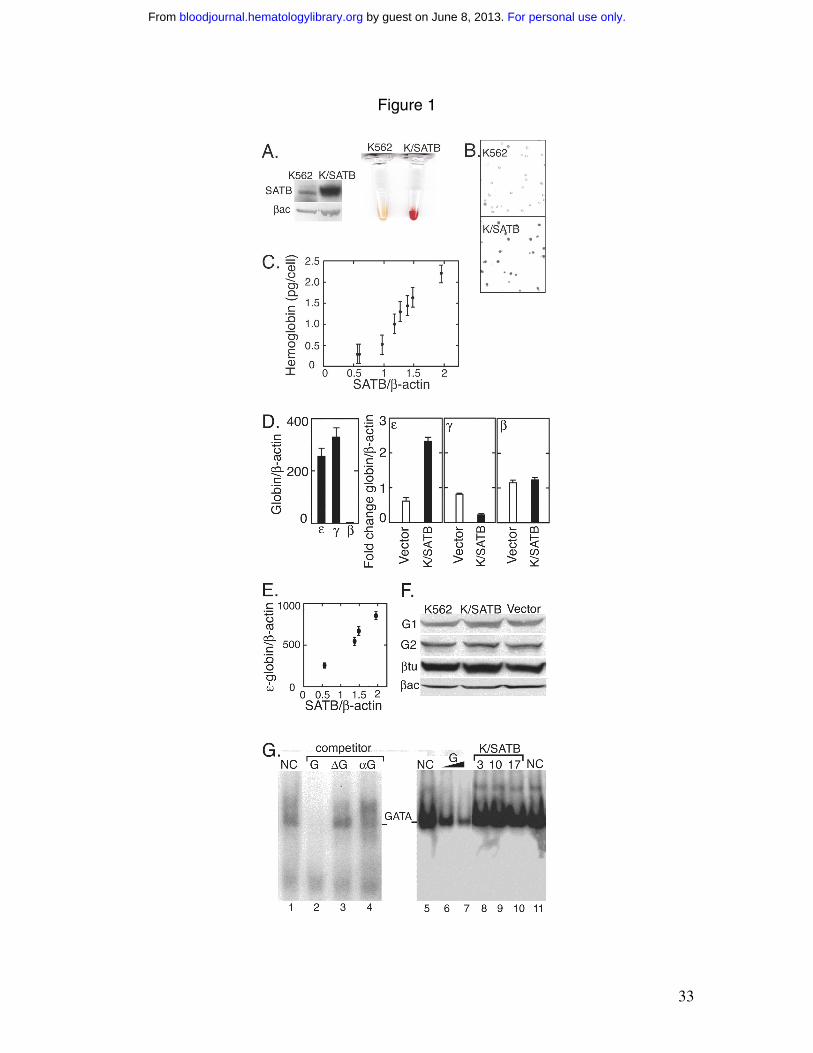
Figure 1. SATB1 increases hemoglobin expression. A) Western blotting for K562 cells
and K562/SATB1 (K/SATB) cells using anti-SATB1 antibody with β-actin (βac) as a
loading control and corresponding cell pellets are shown. B) Benzidine staining for K562
and K562/SATB1 (K/SATB) cells is shown. C) Hemoglobin production (pg/cell) in
stable K562/SATB1 clones are plotted versus the protein level determined by Western
blotting with anti-SATB1 antibody (SATB) and normalized to β-actin. D) K562 cell
mRNA expression was determined for ε-globin , γ-globin and β-globin as indicated (left
panel) and normalized to β-actin. Globin gene expression was also determined for
K562/SATB1 cells (filled bar) and cells stably transfected with a vector control (open
bar) (right panels as indicated). E) For K562/SATB1 clones, ε-globin expression
normalized to β-actin is plotted versus the protein level determined by Western blotting
with anti-SATB1 antibody (SATB) normalized to β-actin. F) Western blotting shows the
expression of GATA-1 (G1) and GATA-2 (G2) in K562 and K562/SATB1 cells and in
cells stably transfected with the control vector. Loading controls are β-tubulin (βtu) and
β-actin (βac). G) A GATA-1 DNA probe and nuclear extracts from K562 cells (lanes 1
to 7, and 11), and from K562/SATB1 clones #3 (lane 8), #10 (lane 9) and #17 (lane 10)
expressing 3 to 4 fold increase in SATB1 were used for EMSA. GATA-1 binding was
competed by DNA containing a GATA-1 binding motif (G; lane 2) with increasing
amounts of competitor (lane 6, 60X and lane 7, 120X) and anti-GATA-1 antibody (αG;
lane 4). but not by a mutated GATA-1 motif (∆G; lane 3). NC indicates no specific
competitor added.
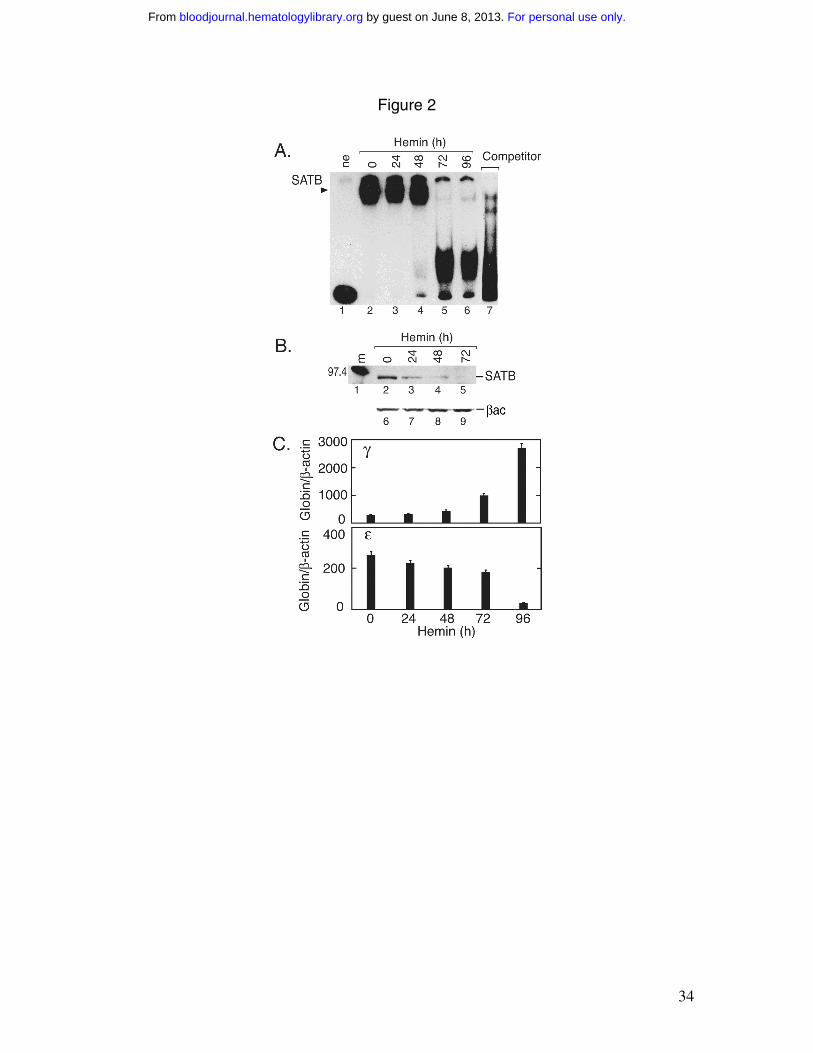
Figure 2. Hemin induction of K562 cells. A) A DNA SATB1 probe (Wt (25)7) 17 used
for EMSA shows a high molecular weight band (SATB) from K562 extract. The radio-
For personal use only. by guest on June 8, 2013. bloodjournal.hematologylibrary.orgFrom
29
labeled probe was incubated with no extract (ne, lane 1) or K562 extract before and after
hemin induction, indicated in hours (Lanes 2 to 6). Lane 7 contains uninduced K562 cell
extract and cold probe as competitor. The large faster migrating band in lanes 5 to 7
represents non-specific binding. B) Western blotting using anti-SATB1 serum and 5 µg
protein of K562 cell extract following hemin induction indicated in hours (lanes 2 to 5)
shows the 96 KDa band up to 48 hours after hemin induction. As loading control, β-actin
(βac) is also indicated (lanes 6 to 9). Lane 1 contains molecular weight markers. C) γ-
and ε-globin mRNA from K562 cells were quantified before and after hemin induction
indicated in hours. Results were normalized to the level of β-actin mRNA.
Figure 3. In vivo binding of SATB1 family protein to MARs in the β-globin cluster.
A) Specific primer pairs for potential MARs for HS4, HS3, HS2 (M1 to M5), Mε, γ5’, γ1
and γ2 in the 3’ Aγ-globin enhancer, β5’, and β-globin IVS2 are indicated. Hind III (H)
and Xba I (X) restriction enzyme sites flank the HS2 core. B) Probes corresponding to
HS2-M1 (lanes 1 to 4) and Mε (lanes 5 to 8) MARs were incubated with K562 nuclear
extract to assess in vitro SATB1 family protein binding using as competitors, no
competitor (NC; lanes 1 and 5), SATB1 binding motif (S; lanes 2 and 6), mutation of the
SATB1 binding motif mut (24)8 17 (∆S; lanes 3 and 7), and anti-SATB1 antibody (αS;
lanes 4 and 8). C) To assess in vivo SATB1 family protein binding, specific primers that
could amplify genomic DNA (0.01 µg) (control lanes 1 to 6; m indicates 100 bp ladder)
were used for ChIP analysis. ChIP DNA selected using anti-SATB1 antibody (SATB;
lanes 7 to 12) or preimmune serum (α; lanes 13 to 18) was amplified and produced a
specific PCR product corresponding to M1 (lane 1) and Mε (lane 6). Dilutions of SATB1
selected ChIP DNA at 10 pg, 100 pg and 1 ng, respectively and primer pairs for M1
(lanes 19 to 21), M2 (23 to 25) and Με MARs (lanes 26 to 28) were used for PCR
amplification (genomic control Co; lane 22). D) Quantification of anti-SATB1 antibody
selected ChIP DNA is shown for M1 and Mε MARs in K562 (K, open bar) and
For personal use only. by guest on June 8, 2013. bloodjournal.hematologylibrary.orgFrom
30
K562/SATB1 (SATB, filled bar) cells. E) Primer pairs for MARs in the γ- and β-globin
genes used to amplify anti-SATB1 antibody selected ChIP DNA as indicated (lanes 4 to
6) shows no specific PCR products in contrast to the genomic DNA control (lanes 1 to 3).
F) Primer pairs for proposed MARs in HS3 (lanes 1 to 4), HS4 (lanes 5 to 8), the γ-globin
promoter (γ5’) (lanes 9 to 12) and the β-globin promoter (β5’) (lanes 13 to 16) were used
to amplify anti-SATB1 antibody selected ChIP DNA as indicated. DNA used
corresponded to genomic control (Co), and 10 pg, 100 pg and 1 µg of SATB1 selected
ChIP DNA for lanes 1 to 4, 5 to 8, 9 to 12, and 13 to 16, respectively.
Figure 4. Reporter gene assay of ε constructs. A) The ε-promoter with the SATB1
binding site Mε was cloned 5’ of the luciferase reporter gene in pREP4/Luc. Mε is
mutated in mut-ε and deleted in ∆ε. HS-2 with the SATB1 binding site M1 was cloned 5’
of the ε-promoter to give HS2-ε. M1 is mutated in mut-HS2-ε and deleted in ∆HS2-ε. B)
The luciferase activity was determined after transfection of the reporter gene construct
into K562, HeLa and K562/SATB1 (K/SATB) cells with (solid bar) or without (open bar)
cotransfection with a SATB1 expression vector as indicated. The promoterless
pREP4/Luc construct was included as a negative control. Error bars represent standard
deviation from independent experiments (n=3).
Figure 5. Histone modifications by SATB1 in K562/SATB1 cells. A) ChIP DNA
isolated using specific anti-acetylated and anti-methylated histone antibodies was
subjected to quantitative real-time PCR analysis using specific primer pairs and TaqMan
probes for HS2 and the ε-, γ- and β-globin promoters as indicated. B) ChIP DNA isolated
with antibodies specific for acetylated histone H3 (H3) and acetylated histone H4 (H4),
and histone H3 methylated at lysine 9 (H3-MeK9) from K562 (K, open bar) and
K562/SATB1 (S, filled bar) cells were analyzed. ChIP analysis was repeated following
For personal use only. by guest on June 8, 2013. bloodjournal.hematologylibrary.orgFrom
31
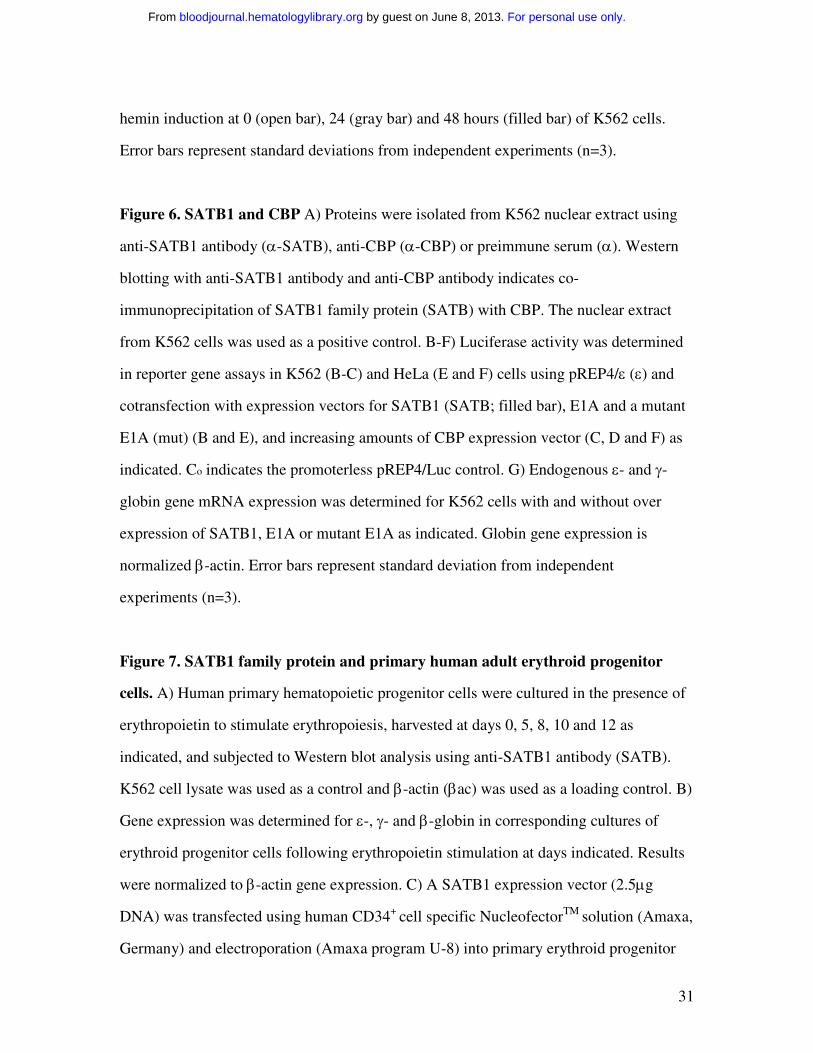
hemin induction at 0 (open bar), 24 (gray bar) and 48 hours (filled bar) of K562 cells.
Error bars represent standard deviations from independent experiments (n=3).
Figure 6. SATB1 and CBP A) Proteins were isolated from K562 nuclear extract using
anti-SATB1 antibody (α-SATB), anti-CBP (α-CBP) or preimmune serum (α). Western
blotting with anti-SATB1 antibody and anti-CBP antibody indicates co-
immunoprecipitation of SATB1 family protein (SATB) with CBP. The nuclear extract
from K562 cells was used as a positive control. B-F) Luciferase activity was determined
in reporter gene assays in K562 (B-C) and HeLa (E and F) cells using pREP4/ε (ε) and
cotransfection with expression vectors for SATB1 (SATB; filled bar), E1A and a mutant
E1A (mut) (B and E), and increasing amounts of CBP expression vector (C, D and F) as
indicated. Co indicates the promoterless pREP4/Luc control. G) Endogenous ε- and γ-
globin gene mRNA expression was determined for K562 cells with and without over
expression of SATB1, E1A or mutant E1A as indicated. Globin gene expression is
normalized β-actin. Error bars represent standard deviation from independent
experiments (n=3).
Figure 7. SATB1 family protein and primary human adult erythroid progenitor
cells. A) Human primary hematopoietic progenitor cells were cultured in the presence of
erythropoietin to stimulate erythropoiesis, harvested at days 0, 5, 8, 10 and 12 as
indicated, and subjected to Western blot analysis using anti-SATB1 antibody (SATB).
K562 cell lysate was used as a control and β-actin (βac) was used as a loading control. B)
Gene expression was determined for ε-, γ- and β-globin in corresponding cultures of
erythroid progenitor cells following erythropoietin stimulation at days indicated. Results
were normalized to β-actin gene expression. C) A SATB1 expression vector (2.5µg
DNA) was transfected using human CD34+ cell specific NucleofectorTM solution (Amaxa,
Germany) and electroporation (Amaxa program U-8) into primary erythroid progenitor
For personal use only. by guest on June 8, 2013. bloodjournal.hematologylibrary.orgFrom
32
cultures after 5 days stimulation with erythropoietin (1U/ml). Cells were harvested at day
8 and ε-, γ- and β-globin gene expression was determined by from SATB1 over
expressing cells (solid bar) compared with control (open bar). D) ChIP DNA from
primary erythroid progenitor cells with (filled bars) and without (open bars) SATB1 over
expression was isolated using antibodies specific for acetylated histone H3 (H3) and
acetylated histone H4 (H4). Quantitative real-time PCR analysis using primers and
TaqMan probes specific for the ε-globin and γ-globin promoters indicated the amount of
associated acetylated histones. E) Antisense oligonucleotide was used to down regulate
SATB1 family protein expression compared with the sense oligonucleotide shown in the
Western blot using anti-SATB1 antibody and β-actin as a control. Primary erythroid
progenitor cell cultures were treated with antisense oligonucleotide and ε- and γ-globin
gene expression measured. The results are given as fold change relative to the sense
oligonucleotide control. Error bars represent standard deviation from independent
measurements (n=3).
For personal use only. by guest on June 8, 2013. bloodjournal.hematologylibrary.orgFrom
33
Figure 1
For personal use only. by guest on June 8, 2013. bloodjournal.hematologylibrary.orgFrom
34
Figure 2
For personal use only. by guest on June 8, 2013. bloodjournal.hematologylibrary.orgFrom
35
Figure 3
For personal use only. by guest on June 8, 2013. bloodjournal.hematologylibrary.orgFrom
36
Figure 4
For personal use only. by guest on June 8, 2013. bloodjournal.hematologylibrary.orgFrom
37
Figure 5
For personal use only. by guest on June 8, 2013. bloodjournal.hematologylibrary.orgFrom
38
Figure 6
For personal use only. by guest on June 8, 2013. bloodjournal.hematologylibrary.orgFrom
39
Figure 7
For personal use only. by guest on June 8, 2013. bloodjournal.hematologylibrary.orgFrom