s chand and company limited - nse
TRANSCRIPT

-!-~
S Chand And Company Limited T
S.CHAND GROUP
Reqistered Office: A-27, 2nd Floor, Mohan Co-Operative Industrial Estate, New Delhi - 110044, India.
P:+91 11 4973 1800 I F:+91 11 4973 1801 I E: [email protected] I www.schandgroup.com
To
Listing Department
BSE Limited
Phiroze Jeejeebhoy Towers, Dalal Street,
Mumbai, Maharashtra 40000 I
Dear Sir,
Date: August I 0, 2019
To
Listing Department,
National Stock Exchange oflndia Limited
Exchange Plaza, C-1, Block G, Sandra Kurla
Complex, Sandra (E), Mumbai, Maharashtra 400051
Re: Investors Presentation-Financial Results-OJ and FY 2019-20-pursuant to Regulation 30 of The SEBI (Listing Obligations and Disclosure Requirements) Regulations, 2015
The presentation for the analysts and investors for the conference call scheduled to be held on Tuesday,
August 13, 20 I 9 at I :00 P.M. to discuss the financial results for the quarter ended June 30, 20 I 9 is attached herewith.
The Company shall also disseminate the above information on the website of the Company 1.e. www.schandgroup.com.
Jagdeep Singh Company Secretary & Compliance Officer Membership No.: A15028 Address: A-27, 2nd Floor, Mohan Co-operative Industrial Estate, New Delhi-I 10044
CIN No. L22219DL 1970PLC00S400

S. Chand and Company Limited
Q1 – FY2019-20
Investor Update
10th August, 2019
www.schandgroup.com
~ =;=-S.CHAND
GROUP

SUMMARY
• QUARTER IN NUMBERS• KEY HIGHLIGHTS – Q1FY20• WORKING CAPITAL CYCLE – TURNAROUND VISIBLE IN
METRICS• WORKING CAPITAL CYCLE - HIGHEST IMPACT ON METRICS
IN PAST 4 YEARS• NEW EDUCATION POLICY – BIG POSITIVE GOING AHEAD• COST SAVINGS MEASURES MAKING AN IMPACT IN Q1 –
MORE TO FOLLOW IN Q2• S CHAND 3.0 – TARGET HIGHER FREE CASH FLOWS IN
FY20• CONSOLIDATED FINANCIAL PERFORMANCE• DIGITAL INITIATIVES - UPDATE• SHAREHOLDING STRUCTURE• GOING AHEAD• ANNEXURES
2www.schandgroup.com
• ~ -F S.CHAND
GROUP

QUARTER IN NUMBERS
3
6%
Sales Growth (YoY %)
73%
Increase in Gross
Margins (Rs m)
43%
Reduction in EBITDA
Losses (YoY %)
24%
Reduction in PAT Losses (YoY %)
30%Reduction in
Sales returns (YoY %)
28%Collection
Efficiency (vs. 20% in Q1FY19)
12%Reduction in
Net Working Capital in Q1FY20 (Days)
5%QoQ
Reduction in Inventory
(Rs m)
www.schandgroup.com
• ~ -F S.CHAND
GROUP

KEY HIGHLIGHTS – Q1FY20
• Financial Highlights – On track to achieve improved profitability by reducing losses
• Consolidated Revenue from Operations stood at Rs 613m for the April-June quarter, up 6% YoY
• Gross Margins increased to Rs307m (vs. Rs178m in Q1FY19), up 73% YoY
• Consolidated EBITDA loss reduced to Rs276m vs. Loss of Rs488m in Q1FY19 - Reduction of EBITDA loss by 43%
• Consolidated PAT loss reduced to Rs378m vs. Loss of Rs498m in Q1FY19 - Reduction of PAT loss by 24%
• Operating Parameters - Strong focus on improving balance sheet metrics yielding results
• Trade Receivables
• Receivables reduced to Rs3,202m in Q1FY20 vs. Rs4,446 as of Q4FY19. In terms of receivable days, it stood at
221 days (vs. 311 days in Q4FY19), a reduction of 90 days during Q1FY20 (vs. reduction of 62 days in Q1FY19).
• Strong reduction in debtors during Q1 translates into an improved 28% collection efficiency for Q1FY20 (vs. 20%
in Q1FY19). Do keep in mind that this collection in Q1 is against a much lower previous year receivables balance
of Rs4,446m (FY19) vs. Rs6,312m (FY18). This is the highest collection efficiency during Q1 since last 4 years.
• Inventory reduced to Rs1,949m (vs Q4FY19: Rs2,048m) during Q1.
• Net Working Capital reduced to 280 days (vs. 317 days in Q4FY19) which is a reduction of 37 days (vs. reduction of
22 days in Q1FY19).
4www.schandgroup.com
• ~ -F S.CHAND
GROUP
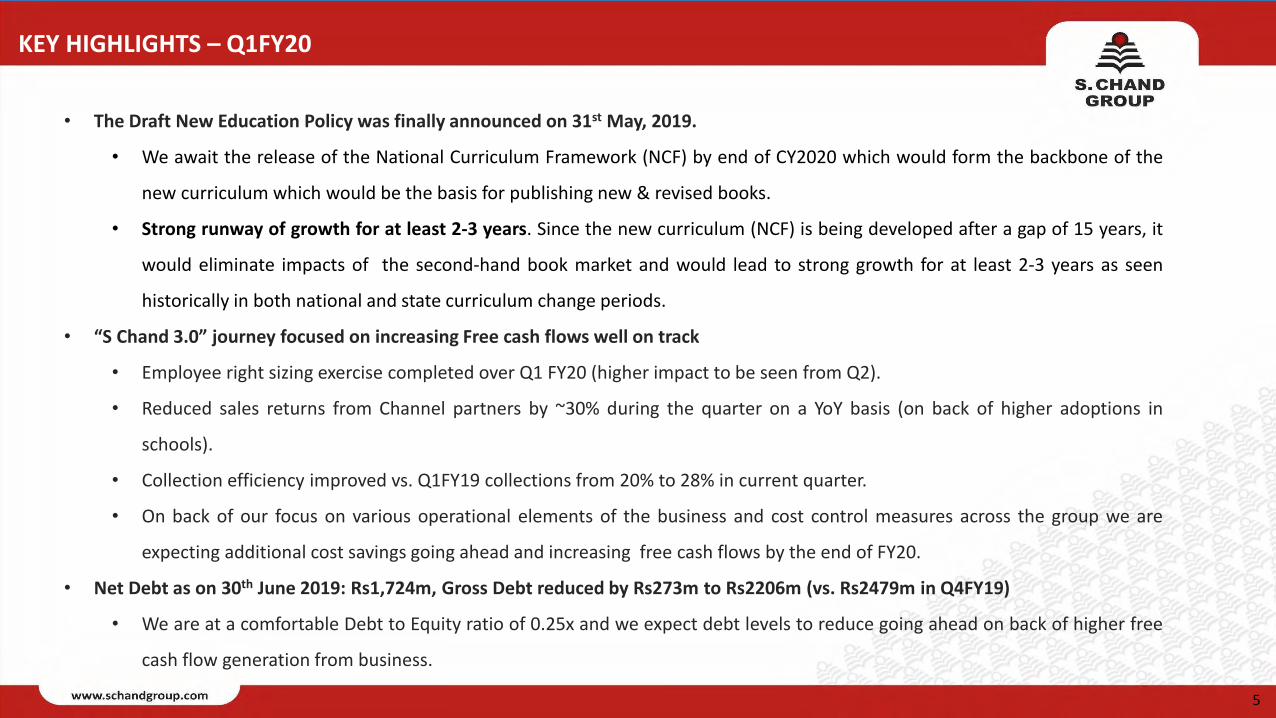
• The Draft New Education Policy was finally announced on 31st May, 2019.
• We await the release of the National Curriculum Framework (NCF) by end of CY2020 which would form the backbone of the
new curriculum which would be the basis for publishing new & revised books.
• Strong runway of growth for at least 2-3 years. Since the new curriculum (NCF) is being developed after a gap of 15 years, it
would eliminate impacts of the second-hand book market and would lead to strong growth for at least 2-3 years as seen
historically in both national and state curriculum change periods.
• “S Chand 3.0” journey focused on increasing Free cash flows well on track
• Employee right sizing exercise completed over Q1 FY20 (higher impact to be seen from Q2).
• Reduced sales returns from Channel partners by ~30% during the quarter on a YoY basis (on back of higher adoptions in
schools).
• Collection efficiency improved vs. Q1FY19 collections from 20% to 28% in current quarter.
• On back of our focus on various operational elements of the business and cost control measures across the group we are
expecting additional cost savings going ahead and increasing free cash flows by the end of FY20.
• Net Debt as on 30th June 2019: Rs1,724m, Gross Debt reduced by Rs273m to Rs2206m (vs. Rs2479m in Q4FY19)
• We are at a comfortable Debt to Equity ratio of 0.25x and we expect debt levels to reduce going ahead on back of higher free
cash flow generation from business.
5
KEY HIGHLIGHTS – Q1FY20
www.schandgroup.com
• ~ -F S.CHAND
GROUP

• Debtors reduced to Rs3,202m as of Q1FY20 from Rs4,446m in Q4FY19. Receivable days reduced by 90 days to 221 days (vs. 311 in Q4FY19) which is
the highest reduction during Q1 in the past 4 years.
• Inventory decreased to Rs1,949m as of 1QFY20 (vs. Rs2,048 in Q4FY19) on back of rationalization of stock levels.
• We expect our focus on receivable collection and inventory rationalization to reduce working capital in the coming quarters.
WORKING CAPITAL CYCLE – TURNAROUND VISIBLE IN METRICS
We expect our focus on collection and working capital metrics to deliver strong benefits going ahead.
260
204
151 144
290
228
182
160
311
221
250
237
207
186
253 235
202
224
317
280
100
150
200
250
300
350
Q4FY17 Q1FY18 Q2FY18 Q3FY18 Q4FY18 Q1FY19 Q2FY19 Q3FY19 Q4FY19 Q1FY20
Receivable Days and Net Working Capital Days (Consolidated)
Recievable Days Net Working Capital Days
6www.schandgroup.com
• ~ -F S.CHAND
GROUP
• Highest reduction seen in receivables and Net Working Capital days over the past 4 years.
• This improvement is on back of our renewed focus on improving our collection efficiency and focus on effective working capital management.
WORKING CAPITAL CYCLE – HIGHEST IMPACT IN METRICS IN PAST 4 YEARS
We expect our focus on collection and working capital metrics to deliver strong benefits going ahead.
7
17
8
22
37
-
20
40
Q1FY17 Q1FY18 Q1FY19 Q1FY20
Reduction in Net Working Capital days in Q1 (Days)
70
53
62
90
40
60
80
100
Q1FY17 Q1FY18 Q1FY19 Q1FY20
Reduction in Receivable days in Q1 (Days)
•
www.schandgroup.com
• ~ -F S.CHAND
GROUP
NEW EDUCATION POLICY – BIG POSITIVE GOING AHEAD
8
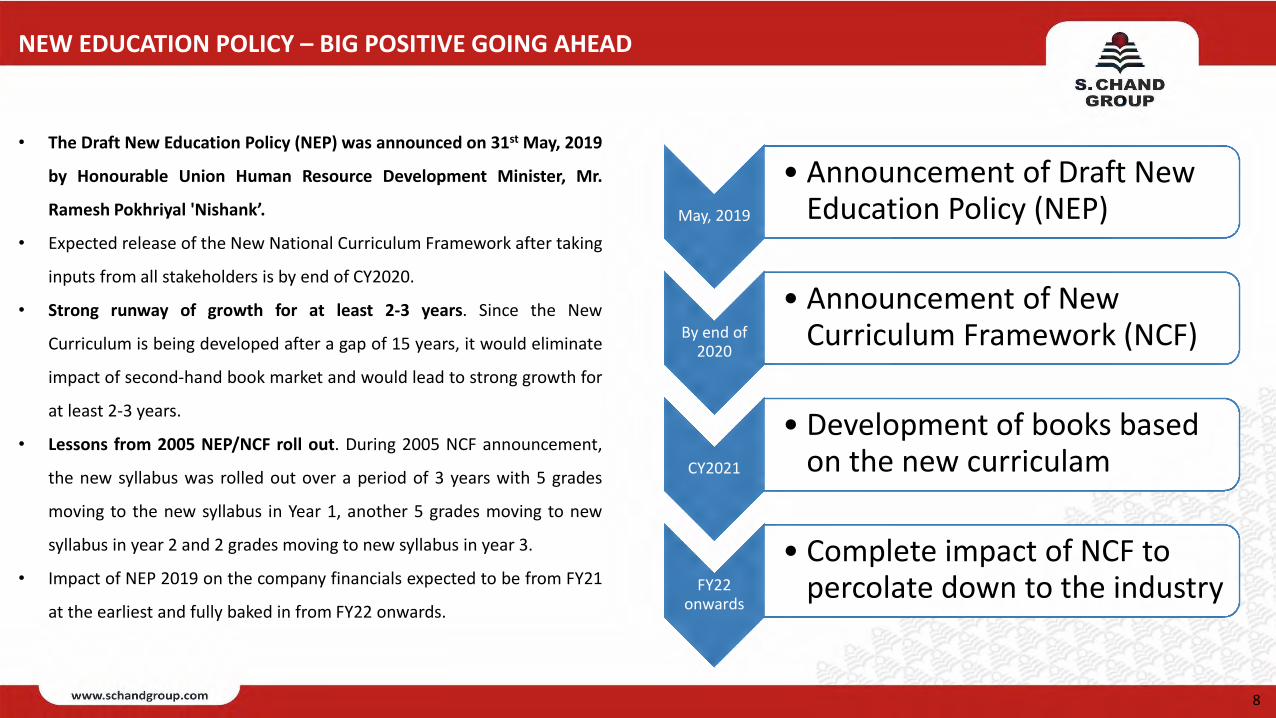
• The Draft New Education Policy (NEP) was announced on 31st May, 2019
by Honourable Union Human Resource Development Minister, Mr.
Ramesh Pokhriyal 'Nishank’.
• Expected release of the New National Curriculum Framework after taking
inputs from all stakeholders is by end of CY2020.
• Strong runway of growth for at least 2-3 years. Since the New
Curriculum is being developed after a gap of 15 years, it would eliminate
impact of second-hand book market and would lead to strong growth for
at least 2-3 years.
• Lessons from 2005 NEP/NCF roll out. During 2005 NCF announcement,
the new syllabus was rolled out over a period of 3 years with 5 grades
moving to the new syllabus in Year 1, another 5 grades moving to new
syllabus in year 2 and 2 grades moving to new syllabus in year 3.
• Impact of NEP 2019 on the company financials expected to be from FY21
at the earliest and fully baked in from FY22 onwards.
May, 2019
• Announcement of Draft New Education Policy (NEP)
By end of 2020
• Announcement of New Curriculum Framework (NCF)
CY2021
• Development of books based on the new curriculam
FY22 onwards
• Complete impact of NCF to percolate down to the industry
www.schandgroup.com
• ~ -F S.CHAND
GROUP

COST SAVINGS MEASURES MAKING AN IMPACT IN Q1 – MORE TO FOLLOW IN Q2
9
• The organization has been right sized by over 400 employees in the last 6 months. Partial benefits reflected in current quarter financials. Annualized Impact of ~ Rs.250-300 Mn
Employee Costs
• Consolidation of warehouses and offices across the country completed. Over 25 locations offices and warehouses restructured and to operate from Regional Hubs . Annualized Impact ~ Rs. 80-100 Mn
• Consolidation of warehouses and better freight/courier management using analytics to optimize inventory routing and reduced delivery times.
Numbers of Offices & Warehouse/Rentals Rationalization
• Rationalization of other expenses – Annualized Impact ~ 75-100Mn
• Increased usage of technology to reduce spends on internal meetings, travel and events.
• Events rationalized based on ROI
Evaluation of Internal Expenses and eliminating dispensable spends
• Going into FY20, we are looking to improve contribution per MT of paper consumed.
• Working on realignment of grammage and size of paper consumed depending upon titles/markets/subjects/end product pricing.
Raw Material
• We have renegotiated certain royalty agreements with Authors for royalty as per current market practises and dynamics.
Royalty
Cost Saving exercise completed during Q1FY20, partial impact visible. Full benefits to flow in from Q2 onwards.•
www.schandgroup.com

S CHAND 3.0 – TARGET HIGHER FREE CASH FLOWS IN FY20
10
• Right Sizing of our employee base by over 400 employees
• Rationalization of number of offices and consolidation of warehouses at over 25 locations
• Focus on manpower optimization through shared services across group companies.
• Renegotiations of all major operational cost items to bring costs lower.
Lowering operating costs
• Focusing on better terms with channel partners, improved velocity of collection, sale productivity metrics etc.
• Focus on higher margin products.
• Tightening of discounting structure.
Working with higher quality channel partners
• Focus on portfolio of faster moving titles.
• Warehouse consolidation at 15 locations.
• Rationalizing number of SKU’s.
• Eliminating print of titles which do not meet sales threshold limits.
Lower Inventory levels
• Prioritizing our channel partners based on historic receivable efficiency.
• Strict escalation of delay in receivable collection from channel partners in the appropriate manner.
• Dealer loyalty program launched.
• Best-selling titles being sold against reduced credit / advance payment.
Faster Receivables collection cycle
www.schandgroup.com
• ~ -F S.CHAND
------------- GROUP

CONSOLIDATED FINANCIAL PERFORMANCE
S Chand 3.0 program of cost reduction showing its benefits in Q1. We expect more benefits to flow through from Q2 onwards leading to higher cash flows for the company.
11
(₹ in millions) Q1FY20 Q1FY19 Y-o-Y% Q4FY19 FY19
Revenue from operations 613 577 6% 4,491 5,220
Other income 24 25 (4)% 42 116
Total income 637 601 6% 4,534 5,336
Cost of published goods/materials consumed 198 256 (23)% 921 2,094
Purchases of traded goods 13 17 (23)% 56 154
(Increase)/decrease in inventories of finished goods and WIP 61 74 (18)% 567 (440)
Publication expenses 57 77 (25)% 227 448
Gross Margin 307 178 73% 2,763 3,081
Gross Margin (%) 48% 30% n.a 61% 58%
Selling and distribution expenses 105 136 (22)% 244 884
Employee benefits expenses 314 357 (12)% 384 1,511
Other expenses 164 173 (6)% 265 881
EBITDA (276) (488) (43)% 1,870 (195)
EBITDA margin % (43)% (81)% n.a 41% (4)%
Finance cost 84 54 54% 90 272
Depreciation and amortization expense 88 55 61% 60 237
Profit/(loss) before share of loss in associates, exceptional items and tax (447) (597) (25)% 1,719 (705)
Share of profit/(loss) in associates (4) (5) (21)% 5 (14)
Exceptional items (refer note 11) - (58) (100)% 51 (233)
Profit/(loss) before tax (452) (660) (32)% 1,775 (953)
Tax (73) (162) (55)% 560 (283)
Profit/(loss) for the year (378) (498) (24)% 1,215 (669)
Earnings/(loss) per equity share (in ₹) (for discontinued and continuing
operations)
1) Basic (10.8) (14.3) (24)% 34.7 (19.1)
2) Diluted (10.8) (14.3) (24)% 34.7 (19.1)
.. www.schandgroup.com
• ~ -F S.CHAND
GROUP

DIGITAL INITIATIVES – UPDATE
12
• Launched Learnflix on the Android platform, our
all-in-one learning platform for the Gen X student.
• Started Test marketing of Smart K – Our
curriculum product for play schools in the NCR
region during the quarter.
• Our digital offerings include-:
• Destination Success – Enabling Digital
classrooms
• Mylestone – School Curriculum
• Nuri Nori, Risekids, Smart K - Early Learning
• Test Coach – Book assisted mobile mock
exam App
www.schandgroup.com
Engaging Videos, QuiuH and eBooks
Personalized Learning
Learn at your own pace anytime anywhere
Photosynthesis I Importance, Process, & Reactions In Plants
Without Oxygen .....
Engaging Videos
Learn every concept visually for a better foundation
• ~ ----F S.CHAND
GROUP
C-.,,Hc.....d
Ch,,pt~THU c_,_i.d
Concepts
Synthdic ftbt"H --CJ:t CorNCIAM"""'
cs:,--.a ....... -
~empt«!~
JIS
316
RHtt.,..l
··-Focussed Analytics
Master your weak areas with focussed analytics
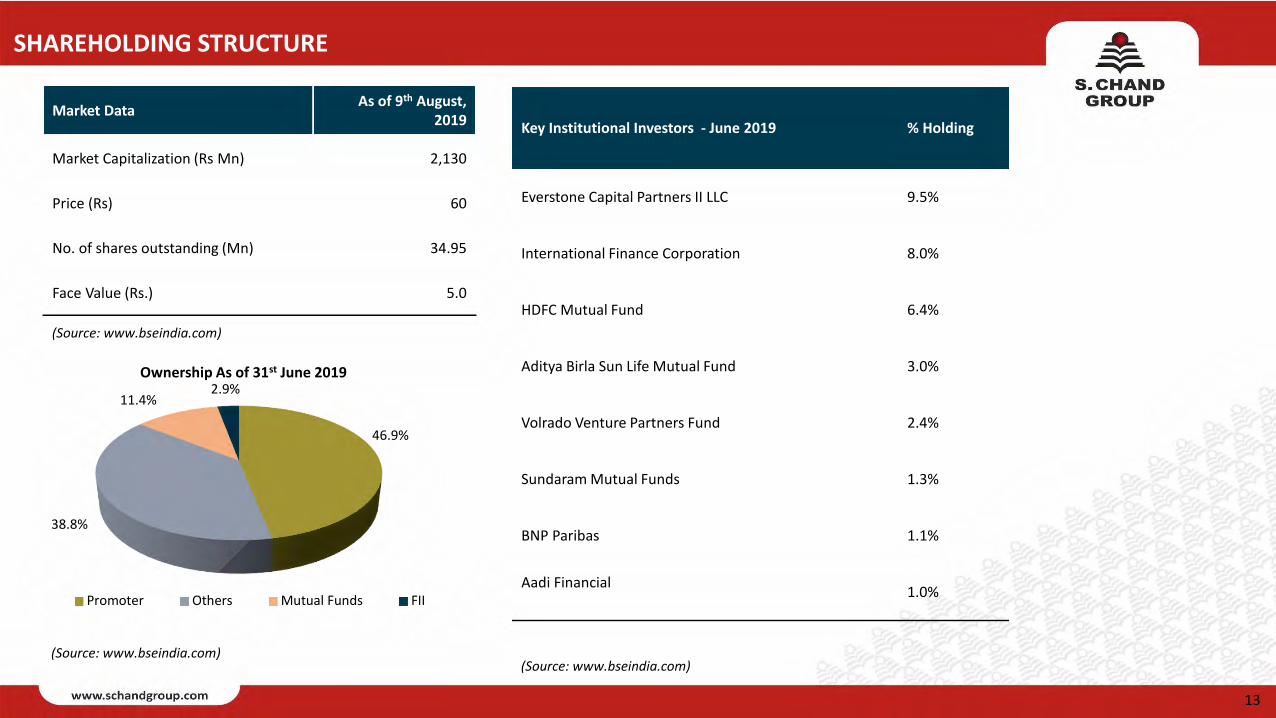
Key Institutional Investors - June 2019 % Holding
Everstone Capital Partners II LLC 9.5%
International Finance Corporation 8.0%
HDFC Mutual Fund 6.4%
Aditya Birla Sun Life Mutual Fund 3.0%
Volrado Venture Partners Fund 2.4%
Sundaram Mutual Funds 1.3%
BNP Paribas 1.1%
Aadi Financial 1.0%
Market DataAs of 9th August,
2019
Market Capitalization (Rs Mn) 2,130
Price (Rs) 60
No. of shares outstanding (Mn) 34.95
Face Value (Rs.) 5.0
46.9%
38.8%
11.4%2.9%
Ownership As of 31st June 2019
Promoter Others Mutual Funds FII
(Source: www.bseindia.com)
(Source: www.bseindia.com)(Source: www.bseindia.com)
SHAREHOLDING STRUCTURE
13
■ ■ ■
www.schandgroup.com
■
• ~ -F S.CHAND
GROUP
GOING AHEAD
• FY20
• EBITDA to FCF generation ratio of over 50%.
• 35%-40% lower Sales returns from Channel Partners vs. FY19.
• Improved working capital metrics from better terms of trade with channel partners and inventory rationalization.
• Medium term – 3 years
• Debt free in 3 years from the increased focus on free cash flows.
• Increasing the share of Digital & Services segment to 20- 25% over the next 3 years
14www.schandgroup.com
• ~ -F S.CHAND
GROUP
Annexure:
- China vs India – A Case Study in Education Sector
- Indian Education Sector -Overview
- S Chand Group
15www.schandgroup.com
• ~ -F S.CHAND
GROUP
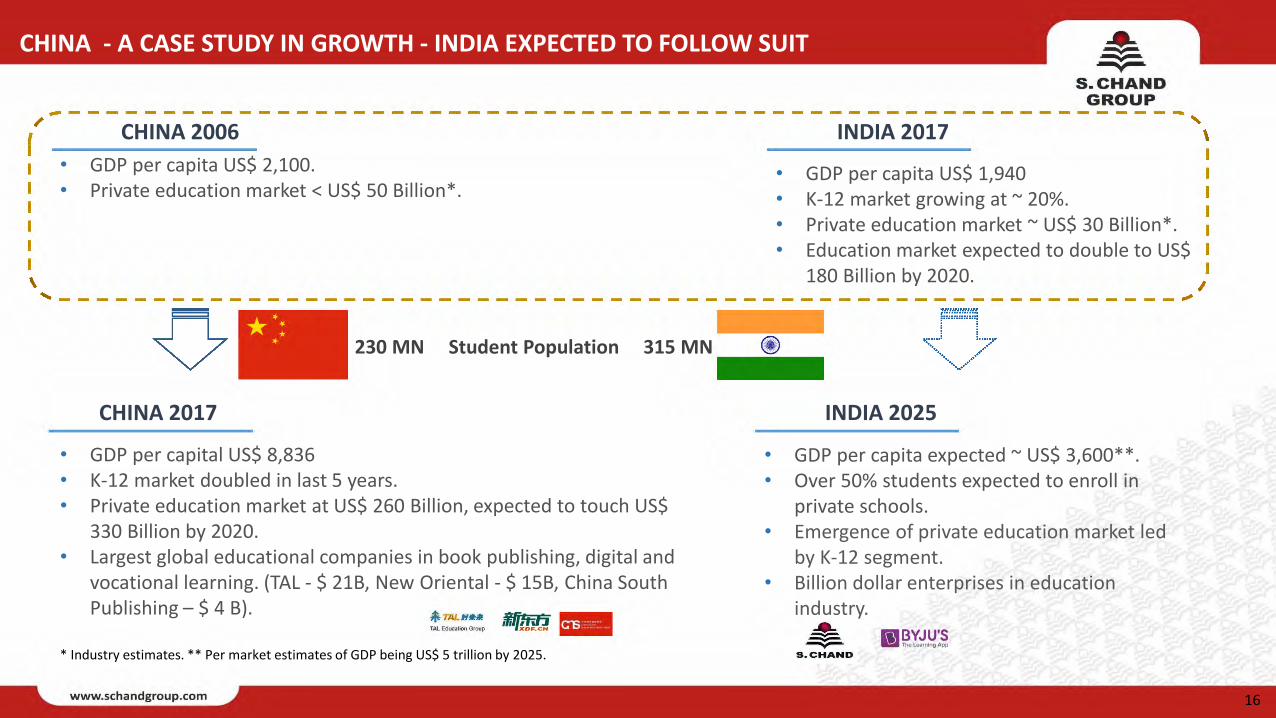
CHINA - A CASE STUDY IN GROWTH - INDIA EXPECTED TO FOLLOW SUIT
• GDP per capita US$ 2,100.• Private education market < US$ 50 Billion*.
CHINA 2006
CHINA 2017
INDIA 2017
• GDP per capital US$ 8,836• K-12 market doubled in last 5 years.• Private education market at US$ 260 Billion, expected to touch US$
330 Billion by 2020.• Largest global educational companies in book publishing, digital and
vocational learning. (TAL - $ 21B, New Oriental - $ 15B, China South Publishing – $ 4 B).
* Industry estimates. ** Per market estimates of GDP being US$ 5 trillion by 2025.
• GDP per capita US$ 1,940• K-12 market growing at ~ 20%.• Private education market ~ US$ 30 Billion*.• Education market expected to double to US$
180 Billion by 2020.
INDIA 2025
• GDP per capita expected ~ US$ 3,600**.• Over 50% students expected to enroll in
private schools.• Emergence of private education market led
by K-12 segment.• Billion dollar enterprises in education
industry.
230 MN Student Population 315 MN
16
• ~ --vS.CHAND
GROUP ;~-----------------------------------------------------------, I --------- --------- ~
I I I I
I I I I \ I '~----------------------------------------------------------;
• *::
TAL Education Group mff!,-Ji
XDll='. CN
www.schandgroup.com
~ ~
S.CHAND
'f'IINIINIUi-
~(/~
(Source: Technopak Research Report. Technopak Outlook on India’s Schooling Segment June 2017. Nielsen: India Book Market Report 2015)
US$90 BN Market Size for the Indian Education Sector
50
15
8
5
52
6
India educationsector
Formal Education Segment
o US$65 BN
o Comprises both K-12 schools and higher education institutions (colleges, engineering institutes, etc.).
o Regulated segment, institutions cannot be set up on a ‘for profit’ basis.
Informal Education Segment
o US$20 BN
o Comprises of test prep, tutoring, early education and vocational training.
o Less regulated; no restrictions on profit distribution.
1.6 1.9 2.3
2.7 3.2
FY2011 FY2012 FY2013 FY2014 FY2015
(K-12 ancillary market, US$ in billion)
K-12
Higher Education
Test prep
Vocational
Tutoring
Early education S. Chand operates in this segment (K-12/ Higher Education content).
➢ Supports formal and informal education segments.
• Comprises of content, digital content & services like curriculum management.
• Mostly caters to K-12 & higher education institutions.
➢ Less regulated; no restrictions on profit distribution.
➢ K-12 ancillary market is a fast growing segment.
➢ Robust growth drivers.
• Eligible K-12 population of about 296 MN students in age group 6 to 17 years.
• Private unaided schools increased at average rate of 10.4% during 2011-15.
• India has largest education system in the world with over 750 Universities & 35,000 colleges.
➢ Highly fragmented segment providing room for growth.
US$6 BN Ancillary Education Segment
INDIAN EDUCATION SECTOR - LARGE & GROWING ADDRESSABLE OPPORTUNITY
17www.schandgro up.com
£ -F
S.CHAND GROUP

113 127 133 121 111
348
188
66
9% 11% 11% 10% 9%
29%
16%
6%
-30%
-20%
-10%
0%
10%
20%
30%
40%
0
50
100
150
200
250
300
350
400
450
500
0 to 4 5 to 9 10 to 14 15 to 19 20 to 24 25 to 44 45 to 64 above 65
No. of people (mn) Percentage of total people
Age-wise population distribution in India : S. Chand target market
Potential Market of 492 MN = 41% of total population
• Gross enrolment ratio and students completing primary &secondary education gradually improving in India.
• Falling dropout rates and increased girls participation led toimprovement in literacy rate.
• Government promoting education through various schemes withbudgetary support.
Literacy rate improving with higher participation from students
S. Chand well positioned to benefit from sector tailwinds
5.6%
4.7%4.3%
0.00%
1.00%
2.00%
3.00%
4.00%
5.00%
6.00%
7.00%
8.00%
9.00%
10.00%
2012 2013 2014
Decrease in drop-out rates for primary education in India
(Source: IBEF Report)
(Source: Nielsen Report)
Estimated Population
Level of Education % 2017 (MN) % 2022 (MN)
Illiterate 20% 269 18% 250
Literate but no formal schooling 2% 27 1% 14
School - Up to 5th standard 35% 471 36% 501
School - Up to 10th standard 18% 242 18% 250
School - Up to 12th standard 11% 148 11% 153
Some college but not graduate 5% 67 5% 70
Graduate 6% 81 7% 97
Postgraduate 3% 40 4% 56
Literate 80% 1076 82% 1141
Total 100% 1345 100% 1391
(Source: Technopak’s Outlook on India Schooling Segment)
INDIAN EDUCATION SECTOR: INFLECTION POINT, STRONG POTENTIAL
18
I I I I I - -
-
www.schandgroup.com
I •
•
• ~ -F S.CHAND
GROUP
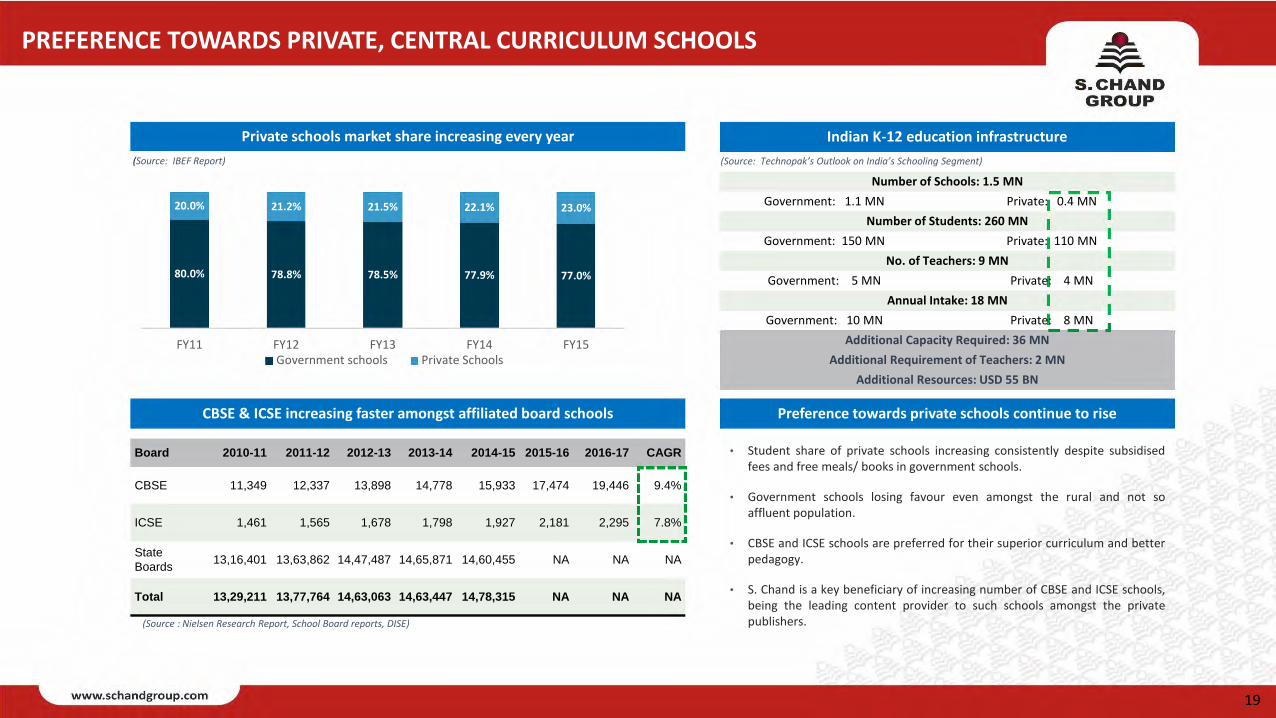
Private schools market share increasing every year
80.0% 78.8% 78.5% 77.9% 77.0%
20.0% 21.2% 21.5% 22.1% 23.0%
0%
20%
40%
60%
80%
100%
120%
FY11 FY12 FY13 FY14 FY15Government schools Private Schools
• Student share of private schools increasing consistently despite subsidisedfees and free meals/ books in government schools.
• Government schools losing favour even amongst the rural and not soaffluent population.
• CBSE and ICSE schools are preferred for their superior curriculum and betterpedagogy.
• S. Chand is a key beneficiary of increasing number of CBSE and ICSE schools,being the leading content provider to such schools amongst the privatepublishers.
CBSE & ICSE increasing faster amongst affiliated board schools
Board 2010-11 2011-12 2012-13 2013-14 2014-15 2015-16 2016-17 CAGR
CBSE 11,349 12,337 13,898 14,778 15,933 17,474 19,446 9.4%
ICSE 1,461 1,565 1,678 1,798 1,927 2,181 2,295 7.8%
State
Boards13,16,401 13,63,862 14,47,487 14,65,871 14,60,455 NA NA NA
Total 13,29,211 13,77,764 14,63,063 14,63,447 14,78,315 NA NA NA
(Source : Nielsen Research Report, School Board reports, DISE)
Preference towards private schools continue to rise
Indian K-12 education infrastructure
Number of Schools: 1.5 MN
Government: 1.1 MN Private: 0.4 MN
Number of Students: 260 MN
Government: 150 MN Private: 110 MN
No. of Teachers: 9 MN
Government: 5 MN Private: 4 MN
Annual Intake: 18 MN
Government: 10 MN Private: 8 MN
Additional Capacity Required: 36 MN
Additional Requirement of Teachers: 2 MN
Additional Resources: USD 55 BN
(Source: Technopak’s Outlook on India’s Schooling Segment)(Source: IBEF Report)
PREFERENCE TOWARDS PRIVATE, CENTRAL CURRICULUM SCHOOLS
19
■
www.schandgroup.com
■
I I I I I I ~---.a
• ~ -F S.CHAND
GROUP
- - - , I I I I I I I I I I I I I
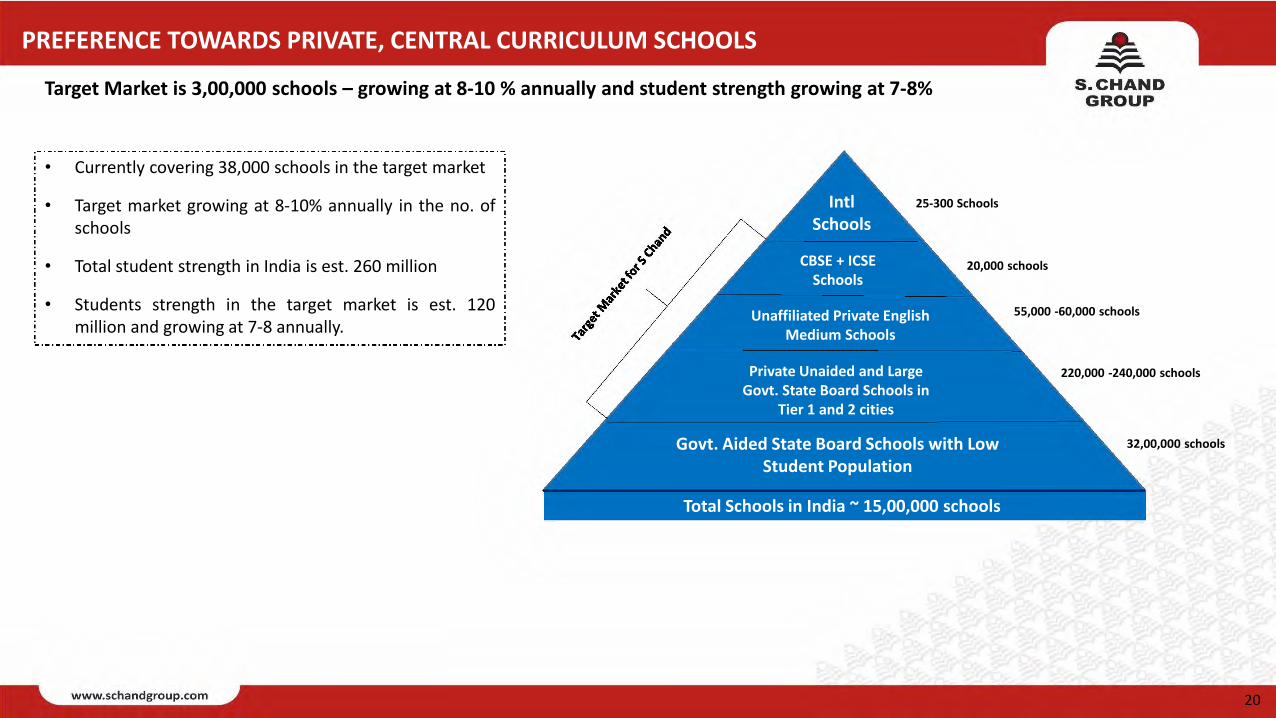
PREFERENCE TOWARDS PRIVATE, CENTRAL CURRICULUM SCHOOLS
Intl Schools
CBSE + ICSE Schools
Unaffiliated Private English Medium Schools
Private Unaided and Large Govt. State Board Schools in
Tier 1 and 2 cities
Govt. Aided State Board Schools with Low Student Population
25-300 Schools
20,000 schools
55,000 -60,000 schools
220,000 -240,000 schools
32,00,000 schools
Total Schools in India ~ 15,00,000 schools
• Currently covering 38,000 schools in the target market
• Target market growing at 8-10% annually in the no. ofschools
• Total student strength in India is est. 260 million
• Students strength in the target market is est. 120million and growing at 7-8 annually.
Target Market is 3,00,000 schools – growing at 8-10 % annually and student strength growing at 7-8%
20www.schandgroup.com
• ~ -F S.CHAND
GROUP

Strong content, multiple best-sellers.
➢ Offerings spanning entire the education spectrum
o Early learning
o K-12
o Higher education
➢ Pan-India sales and distribution network driving deep market reach.
➢ Presence in Central (CBSE, ICSE) and State Board affiliated schools across India.
Delivering content, services and solutions…
…across the education continuum
…with Pan India reach
Portfolio of brands focused on print / digital content.
➢ Long operating history of over seven decades.
➢ High brand equity across multiple brands.
➢ Strong author relationships.
➢ Keeping pace with time - transition from print into digital content and services.
80
Years of operating history
Active book titles
Author relationships
~ 2,400
10,000+
90 TPD
Print Capacity in number of sheets
S CHAND GROUP - LEADER IN INDIAN EDUCATION CONTENT
21
~ ~ I
=F-S.CHAND VIKAS
my/estone l---, .. ~-•
www.schandgroup.com
~-~ !lU MAOHUl3UN® ,1W\Al"-\W\TI
IIOll'SE
-=,
mYstudygear ---
~ =;=, S.CHAND
GROUP
chhaya prakashani 171lltd.
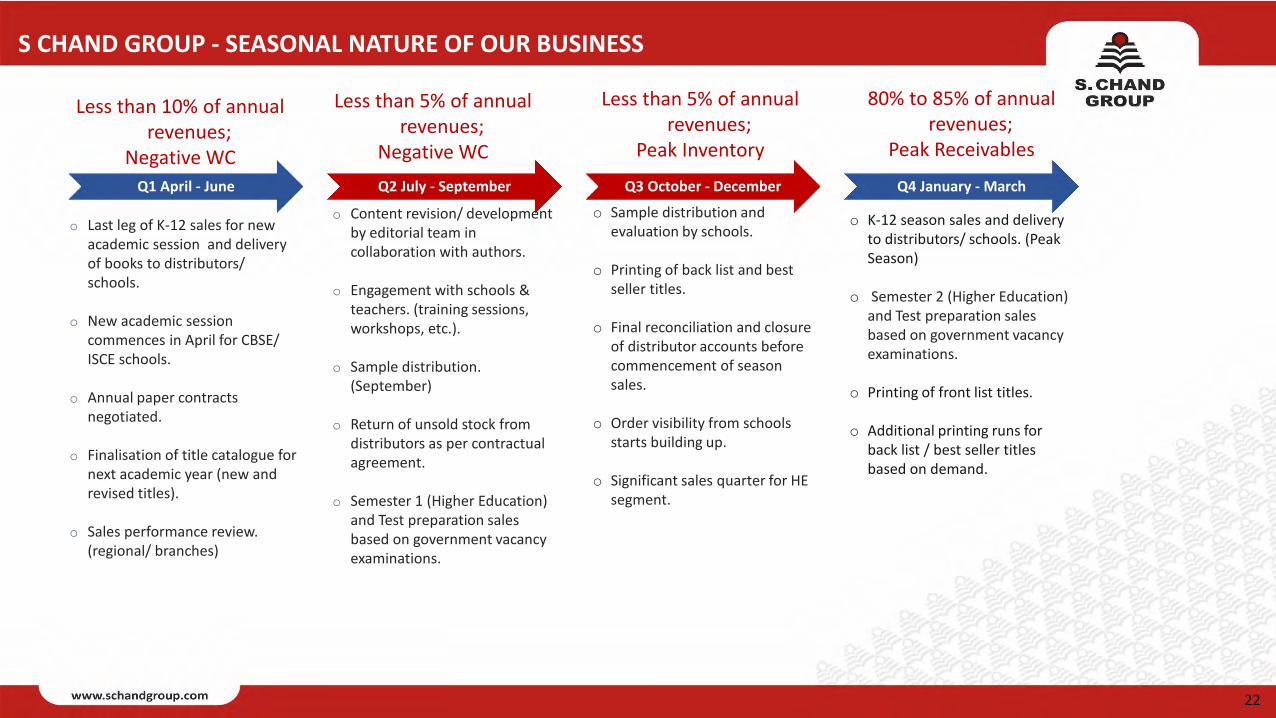
Q1 April - June Q2 July - September Q3 October - December Q4 January - March
o Last leg of K-12 sales for new academic session and delivery of books to distributors/ schools.
o New academic session commences in April for CBSE/ ISCE schools.
o Annual paper contracts negotiated.
o Finalisation of title catalogue for next academic year (new and revised titles).
o Sales performance review. (regional/ branches)
o Content revision/ development by editorial team in collaboration with authors.
o Engagement with schools & teachers. (training sessions, workshops, etc.).
o Sample distribution. (September)
o Return of unsold stock from distributors as per contractual agreement.
o Semester 1 (Higher Education) and Test preparation sales based on government vacancy examinations.
o Sample distribution and evaluation by schools.
o Printing of back list and best seller titles.
o Final reconciliation and closure of distributor accounts before commencement of season sales.
o Order visibility from schools starts building up.
o Significant sales quarter for HE segment.
o K-12 season sales and delivery to distributors/ schools. (Peak Season)
o Semester 2 (Higher Education) and Test preparation sales based on government vacancy examinations.
o Printing of front list titles.
o Additional printing runs for back list / best seller titles based on demand.
80% to 85% of annual revenues;
Peak Receivables
Less than 5% of annual revenues;
Peak Inventory
Less than 10% of annual revenues;
Negative WC
Less than 5% of annual revenues;
Negative WC
S CHAND GROUP - SEASONAL NATURE OF OUR BUSINESS
22www.schandgroup.com
• ~ -F S.CHAND
GROUP

Connecting with Learners
• Art of Book making tour of the Printing Facilities
• Mystudygear App / VRX App / Learnflix App / Test Coach App
• Social Media
Connecting with Teachers with
• Teacher Conclaves and Awards
• Over 2000 Workshops
• The Progressive Teacher magazine
Connecting with School Leadership
• Best Practices in Education Tour to Finland
• The Progressive School magazine
Connecting with Channel Partners
• Dealer Meets , Events and Awards
• Monthly mailer “Sampark”
Increasing Brand presence
• Brand Ambassador
• Strategic Advertising
S CHAND GROUP - POWERFUL BRAND CONNECT
23www.schandgroup.com
• ~ ----;----S. CHAND
GROUP

In-House (Revenue Stream)
• Offerings include digital classroom learning solutions,
learning management systems and curriculum
management which contribute to the revenue streams in
the business.
• Approximated Investments is Rs1300 million.
S CHAND GROUP - DIGITAL INITIATIVES – SYNERGIES TO THE CORE BUSINESS
Digital Investments (Inorganic)
• Focused on investing in early stage digital companies.
• Total investments in digital investee companies is approx.Rs.300m.
• Currently, Investment portfolio commands a valuation ofaround 2X as per the last funding rounds for respectivecompanies.
• Focus is on establishing synergies with core businessalong with investment returns.
24
... my estone
• Runway 10 Flll\Jre
DIGITALLY ENABLED LEARNING
DESTINATION SUCCESS INSPIRES LEARNING
www.schandgroup.com
Intellitab Smartivit• • ~Irr ~ IGNITOR
-=i
mYstudygear flip~loss
• ~ -F S.CHAND
GROUP

Disclaimer
This presentation and the following discussion may contain “forward looking statements”by S. Chand & Company Limited (“S. Chand” or the Company) that are not historical innature. These forward looking statements, which may include statements relating to futureresults of operations, financial condition, business prospects, plans and objectives, arebased on the current beliefs, assumptions, expectations, estimates, and projections of themanagement of S. Chand about the business, industry and markets in which S. Chandoperates.
These statements are not guarantees of future performance, and are subject to known andunknown risks, uncertainties, and other factors, some of which are beyond S. Chand’scontrol and difficult to predict, that could cause actual results, performance orachievements to differ materially from those in the forward looking statements. Suchstatements are not, and should not be construed, as a representation as to futureperformance or achievements of S. Chand.
In particular, such statements should not be regarded as a projection of future performanceof S. Chand. It should be noted that the actual performance or achievements of S. Chand may vary significantly from such statements.
Saurabh MittalChief Finance OfficerContact No : +91 11 4973 1800Email : [email protected]
Atul SoniHead – Investor RelationsContact No : +91 11 4973 1800Email : [email protected]
Corporate/Registered Office: A-27, 2nd Floor, Mohan Co-operative Industrial Estate, New Delhi 110044
25
S.CHAND® GROUP
a knowledge corporation
www.schandgroup.com
• ~ -F S.CHAND
GROUP