kamdhenu limited - nse
TRANSCRIPT
To,
DHENU
GROUP
The Manager- Listing
KAMDHENU LIMITED 2nd Floor, Tower - A, Building No. 9, DLF Cyber City, Phase - Ill, Gurugram PIN: 122002, (Haryana) Phone: - 0124 - 4604500, Fax: 0124 - 4218524 E-mail: [email protected], website: www.kamdhenulimited.com
lih November, 2019
To,
National Stock Exchange of India Limited, Exchange Plaza, Bandra Kurla Complex, Bandra(E}, Mumbai-400 051
The Manager- Listing BSE Limited, Phiroze Jeejeebhoy Towers, Dalal Street, Mumbai- 400 001
REF: Security Code: KAMDHENU Ref: Security Code: 532741
Subject: Intimation of Kamdhenu Limited Investor Presentation November, 2019
Sir/Madam,
In compliance with Regulation 30 of SEBI (Listing Obligations and Disclosure Requirements)
Regulations, 2015, please find enclosed herewith Kamdhenu Limited Investor
Presentation November, 2019 of the Company regarding performance of the Company for
the Quarter and Half Year ended on 30th September, 2019.
Please take the same on record.
Thanking you, Yours faithfully,
For�
ited,
(Jogeswar Mohanty) Company Secretary M. No. ACS23247
Regd. Office: L-311, Khasra No. 724, Street No. 7, Mahipalpur Extension, New Delhi - 37, Phone 011 - 26784596, CIN: L27101DL 1994PLC134282
INVESTOR PRESENTATIONNovember 2019
2
Safe Harbor
This presentation and the accompanying slides (the “Presentation”), which have been prepared by Kamdhenu Limited (the “Company”), have been prepared solely
for information purposes and do not constitute any offer, recommendation or invitation to purchase or subscribe for any securities, and shall not form the basis or
be relied on in connection with any contract or binding commitment what so ever. No offering of securities of the Company will be made except by means of a
statutory offering document containing detailed information about the Company.
This Presentation has been prepared by the Company based on information and data which the Company considers reliable, but the Company makes no
representation or warranty, express or implied, whatsoever, and no reliance shall be placed on, the truth, accuracy, completeness, fairness and reasonableness of
the contents of this Presentation. This Presentation may not be all inclusive and may not contain all of the information that you may consider material. Any liability
in respect of the contents of, or any omission from, this Presentation is expressly excluded
Certain matters discussed in this Presentation may contain statements regarding the Company’s market opportunity and business prospects that are individually and
collectively forward-looking statements. Such forward-looking statements are not guarantees of future performance and are subject to known and unknown risks,
uncertainties and assumptions that are difficult to predict. These risks and uncertainties include, but are not limited to, the performance of the Indian economy and
of the economies of various international markets, the performance of the industry in India and world-wide, competition, the company’s ability to successfully
implement its strategy, the Company’s future levels of growth and expansion, technological implementation, changes and advancements, changes in revenue,
income or cash flows, the Company’s market preferences and its exposure to market risks, as well as other risks. The Company’s actual results, levels of activity,
performance or achievements could differ materially and adversely from results expressed in or implied by this Presentation. The Company assumes no obligation to
update any forward-looking information contained in this Presentation. Any forward-looking statements and projections made by third parties included in this
Presentation are not adopted by the Company and the Company is not responsible for such third party statements and projections.
Q2 & H1 FY20 Financial Highlights
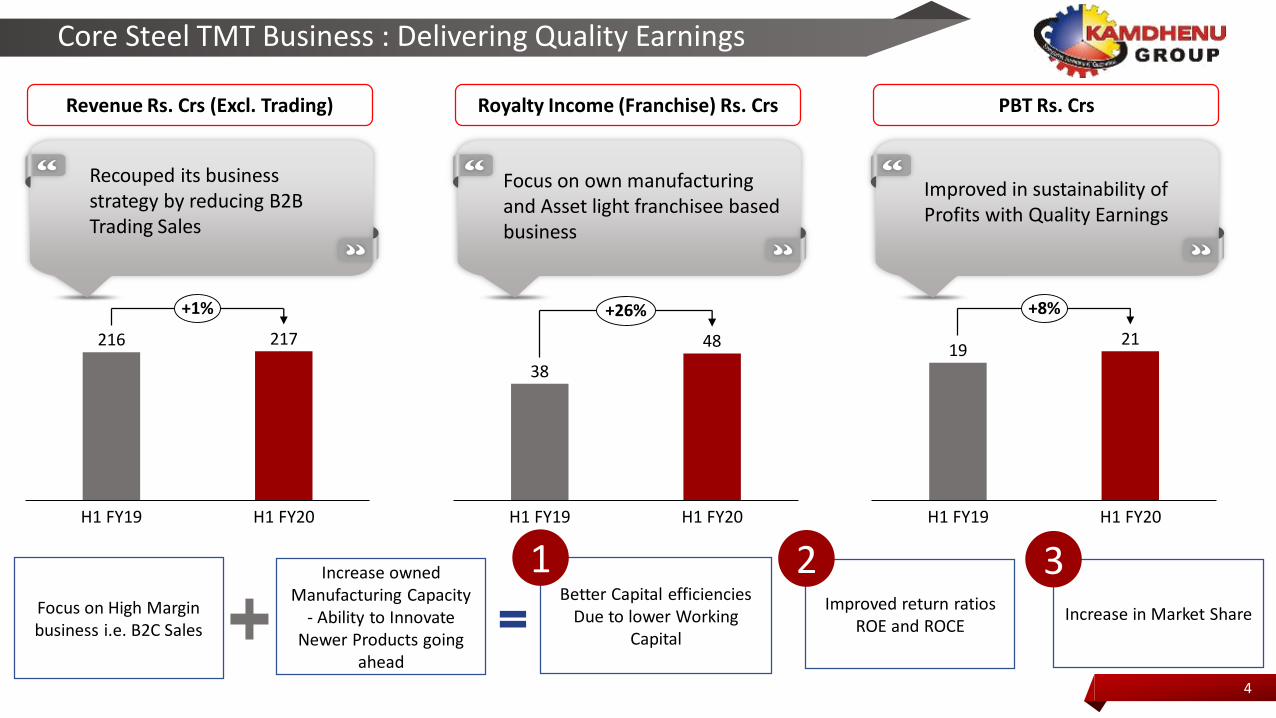
Core Steel TMT Business : Delivering Quality Earnings
4
Revenue Rs. Crs (Excl. Trading)
216 217
H1 FY19 H1 FY20
+1%
Recouped its business strategy by reducing B2B Trading Sales
Royalty Income (Franchise) Rs. Crs
Focus on own manufacturing and Asset light franchisee based business
PBT Rs. Crs
38
48
H1 FY19 H1 FY20
+26%
1921
H1 FY20H1 FY19
+8%
Improved in sustainability of Profits with Quality Earnings
Focus on High Margin business i.e. B2C Sales
Increase owned Manufacturing Capacity
- Ability to Innovate Newer Products going
ahead
Better Capital efficiencies Due to lower Working
Capital
Improved return ratios ROE and ROCE
Increase in Market Share
1 2 3
5
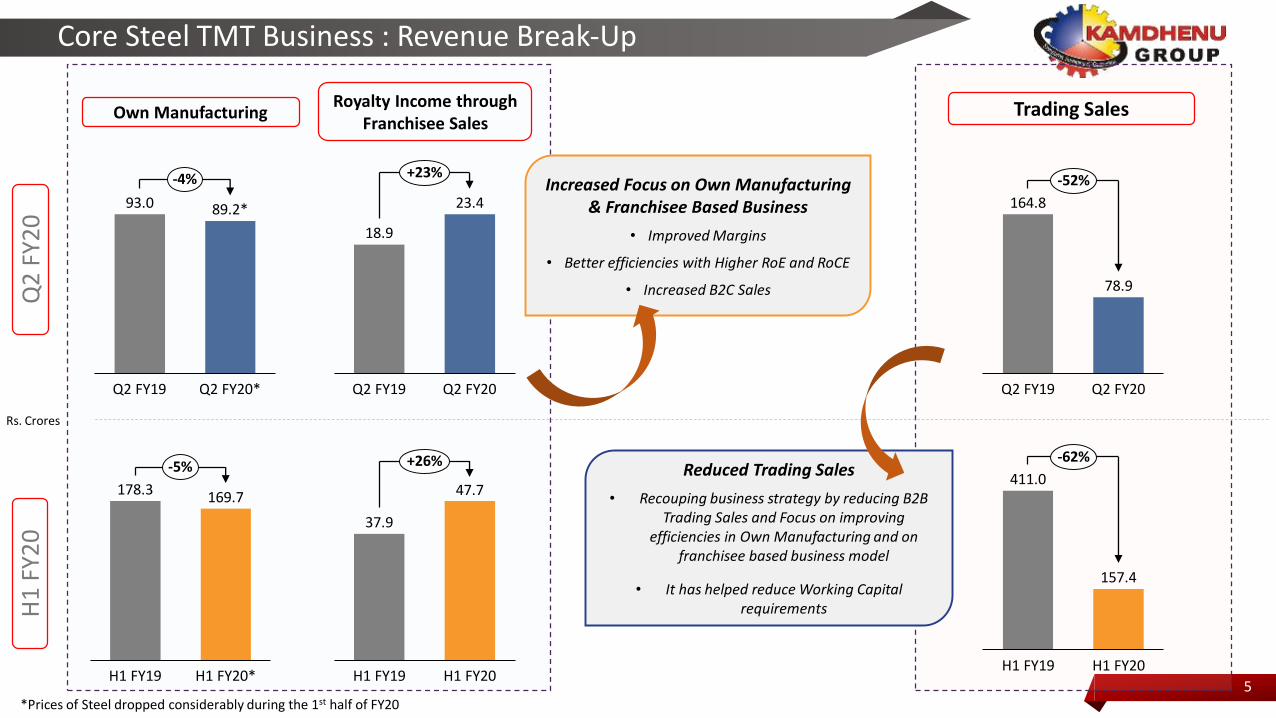
Core Steel TMT Business : Revenue Break-Up
93.0
Q2 FY19 Q2 FY20*
89.2*
-4%
Own Manufacturing Trading Sales
Rs. Crores
Royalty Income through Franchisee Sales
18.9
23.4
Q2 FY20Q2 FY19
+23%
178.3 169.7
H1 FY19 H1 FY20*
-5%
37.9
47.7
H1 FY19 H1 FY20
+26%
Increased Focus on Own Manufacturing & Franchisee Based Business
• Improved Margins
• Better efficiencies with Higher RoE and RoCE
• Increased B2C SalesQ2
FY2
0H
1 F
Y20
164.8
78.9
Q2 FY19 Q2 FY20
-52%
411.0
157.4
H1 FY19 H1 FY20
-62%Reduced Trading Sales
• Recouping business strategy by reducing B2B Trading Sales and Focus on improving
efficiencies in Own Manufacturing and on franchisee based business model
• It has helped reduce Working Capital requirements
*Prices of Steel dropped considerably during the 1st half of FY20
6
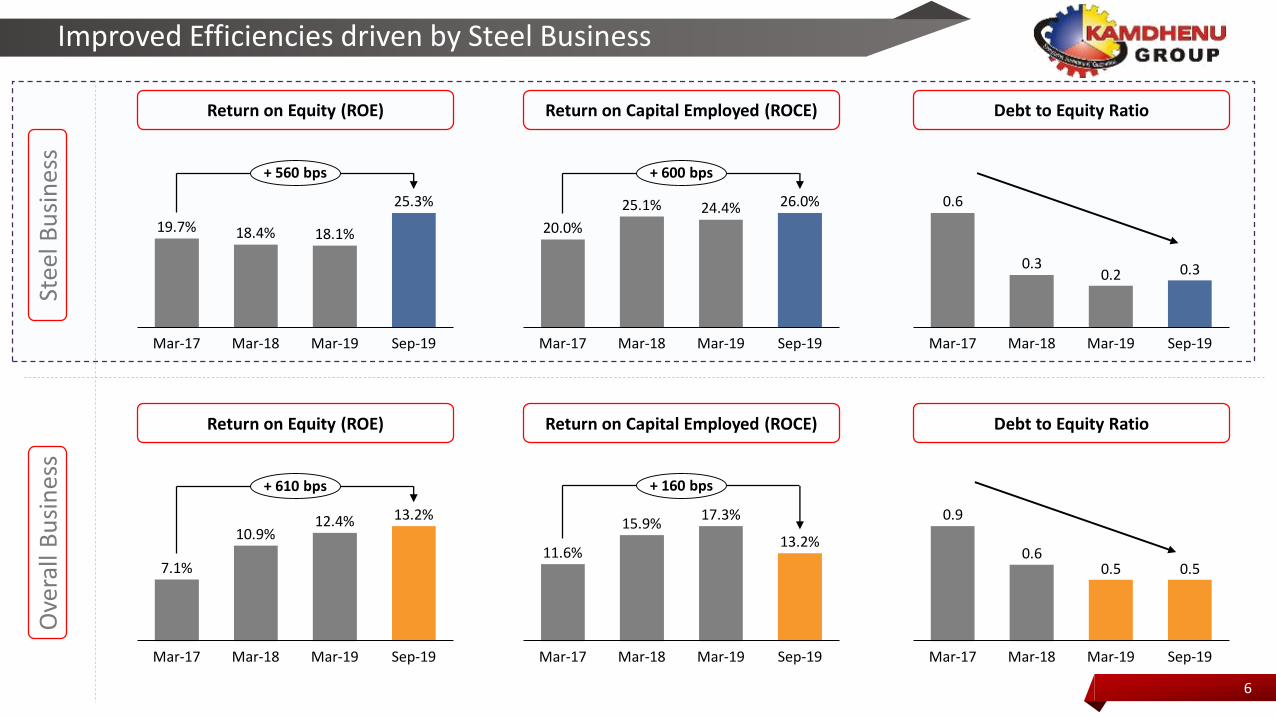
Improved Efficiencies driven by Steel Business
Mar-17 Mar-18 Sep-19Mar-19
19.7% 18.4% 18.1%
25.3%
+ 560 bps
Return on Equity (ROE)
Mar-19 Sep-19Mar-17
25.1%
Mar-18
20.0%24.4% 26.0%
+ 600 bps
Return on Capital Employed (ROCE)
0.6
0.30.2 0.3
Mar-17 Mar-18 Sep-19Mar-19
Debt to Equity Ratio
Mar-17 Mar-18 Mar-19 Sep-19
7.1%
10.9%12.4% 13.2%
+ 610 bps
Return on Equity (ROE)
Mar-17 Mar-18 Mar-19 Sep-19
15.9%13.2%
11.6%
17.3%
+ 160 bps
Return on Capital Employed (ROCE)
0.9
0.60.5 0.5
Mar-19 Sep-19Mar-17 Mar-18
Debt to Equity Ratio
Stee
l Bu
sin
ess
Ove
rall
Bu
sin
ess
7
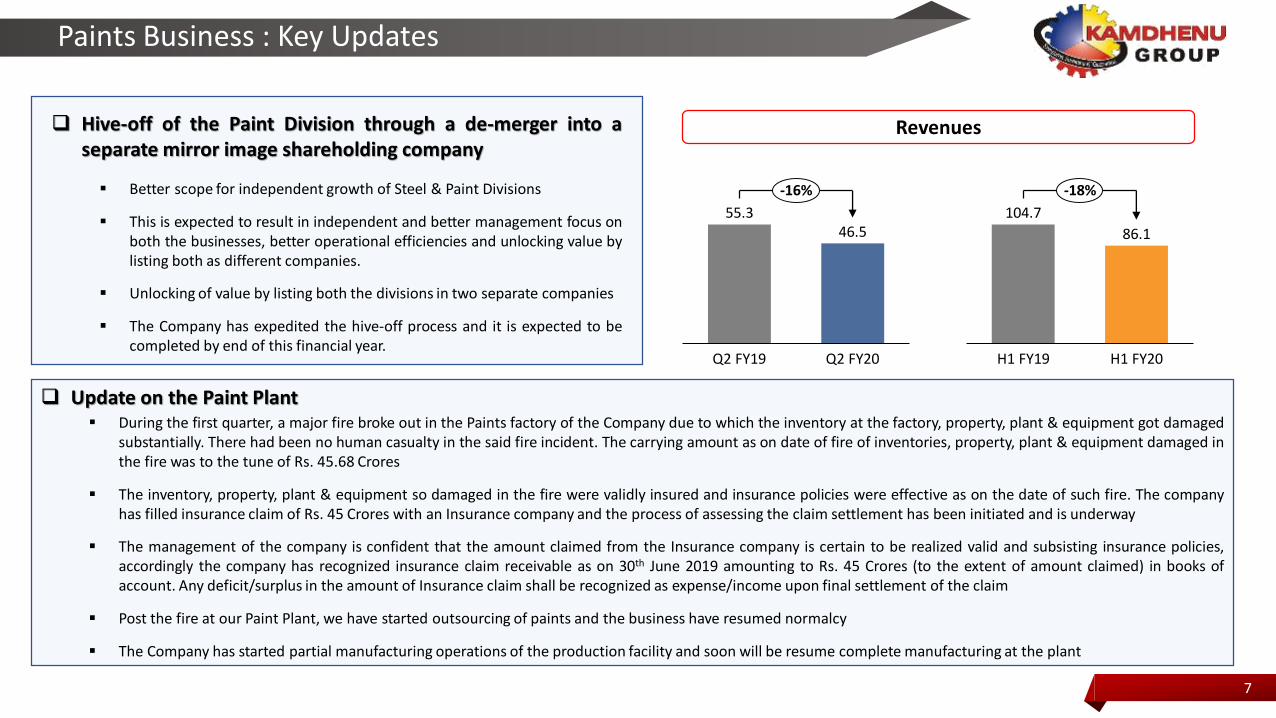
Paints Business : Key Updates
❑ Hive-off of the Paint Division through a de-merger into aseparate mirror image shareholding company
▪ Better scope for independent growth of Steel & Paint Divisions
▪ This is expected to result in independent and better management focus onboth the businesses, better operational efficiencies and unlocking value bylisting both as different companies.
▪ Unlocking of value by listing both the divisions in two separate companies
▪ The Company has expedited the hive-off process and it is expected to becompleted by end of this financial year.
55.346.5
Q2 FY19 Q2 FY20
-16%
Revenues
104.7
86.1
H1 FY19 H1 FY20
-18%
❑ Update on the Paint Plant▪ During the first quarter, a major fire broke out in the Paints factory of the Company due to which the inventory at the factory, property, plant & equipment got damaged
substantially. There had been no human casualty in the said fire incident. The carrying amount as on date of fire of inventories, property, plant & equipment damaged inthe fire was to the tune of Rs. 45.68 Crores
▪ The inventory, property, plant & equipment so damaged in the fire were validly insured and insurance policies were effective as on the date of such fire. The companyhas filled insurance claim of Rs. 45 Crores with an Insurance company and the process of assessing the claim settlement has been initiated and is underway
▪ The management of the company is confident that the amount claimed from the Insurance company is certain to be realized valid and subsisting insurance policies,accordingly the company has recognized insurance claim receivable as on 30th June 2019 amounting to Rs. 45 Crores (to the extent of amount claimed) in books ofaccount. Any deficit/surplus in the amount of Insurance claim shall be recognized as expense/income upon final settlement of the claim
▪ Post the fire at our Paint Plant, we have started outsourcing of paints and the business have resumed normalcy
▪ The Company has started partial manufacturing operations of the production facility and soon will be resume complete manufacturing at the plant
8
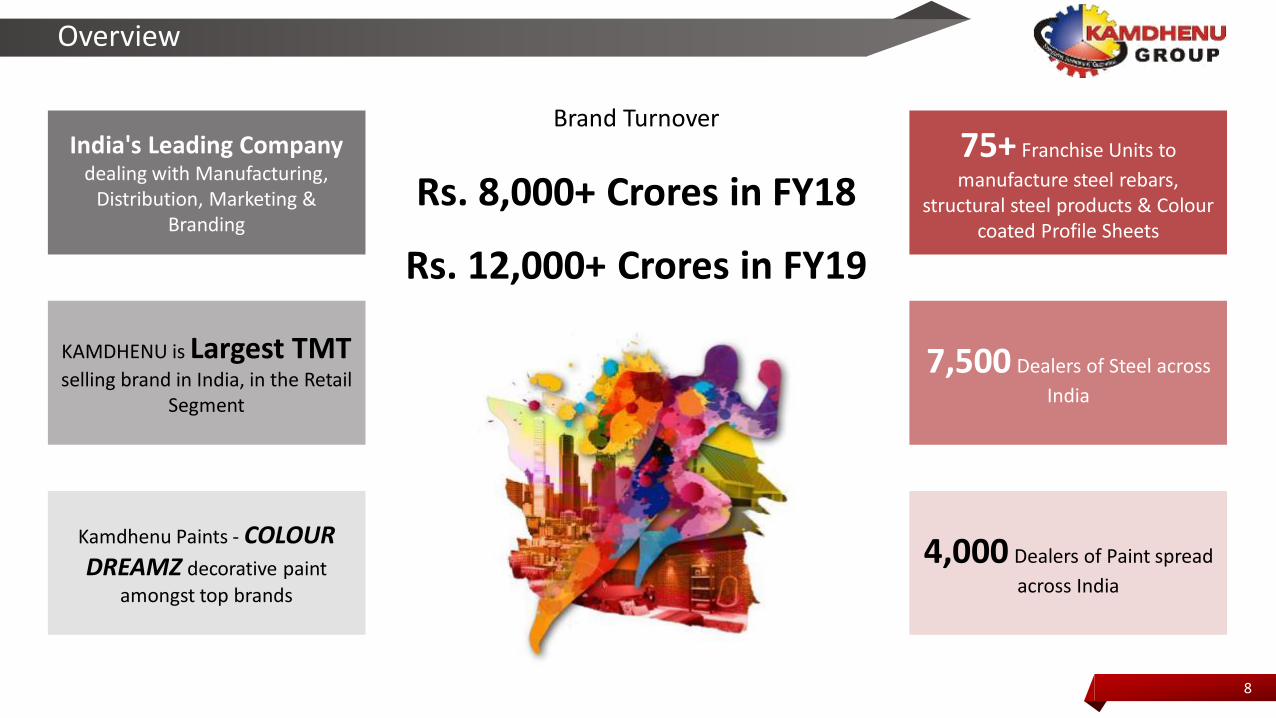
Overview
India's Leading Companydealing with Manufacturing,
Distribution, Marketing & Branding
KAMDHENU is Largest TMT selling brand in India, in the Retail
Segment
Kamdhenu Paints - COLOUR DREAMZ decorative paint
amongst top brands
75+ Franchise Units to
manufacture steel rebars, structural steel products & Colour
coated Profile Sheets
7,500 Dealers of Steel across
India
4,000 Dealers of Paint spread
across India
Brand Turnover
Rs. 8,000+ Crores in FY18
Rs. 12,000+ Crores in FY19
9
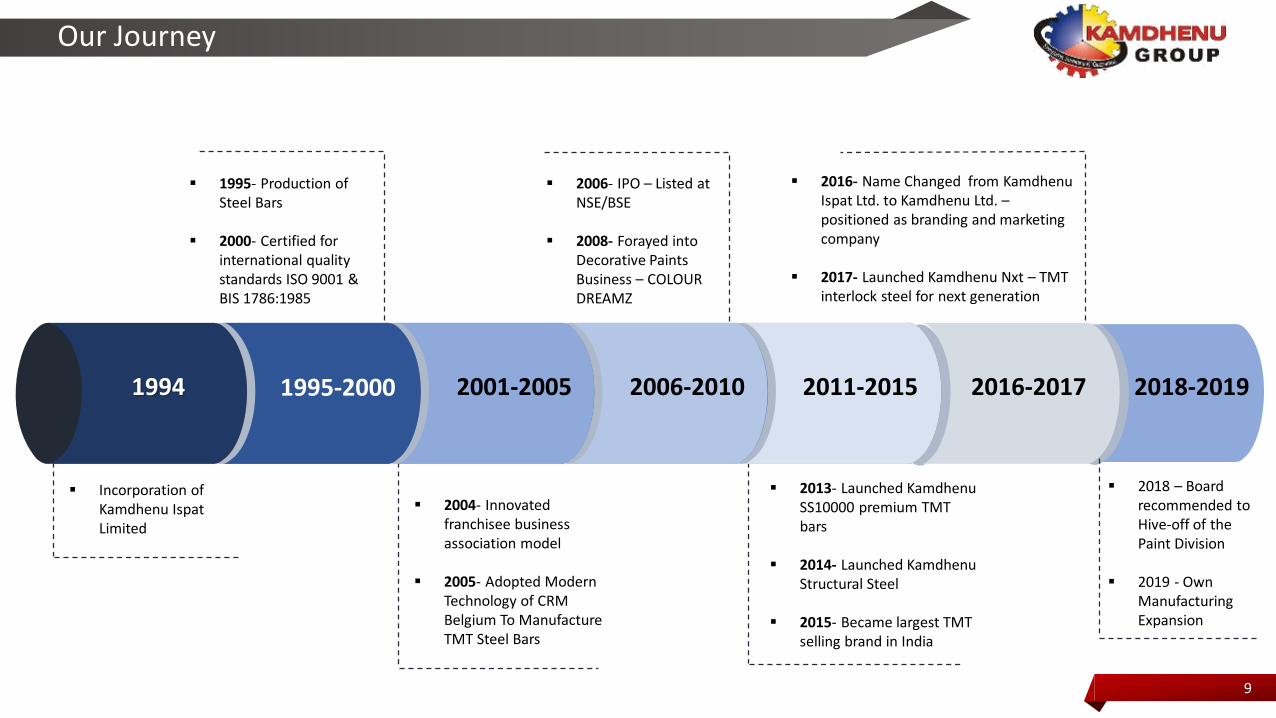
Our Journey
▪ 1995- Production of Steel Bars
▪ 2000- Certified for international quality standards ISO 9001 & BIS 1786:1985
▪ 2006- IPO – Listed at NSE/BSE
▪ 2008- Forayed into Decorative Paints Business – COLOUR DREAMZ
▪ Incorporation of Kamdhenu Ispat Limited
▪ 2004- Innovated franchisee business association model
▪ 2005- Adopted Modern Technology of CRM Belgium To Manufacture TMT Steel Bars
▪ 2013- Launched Kamdhenu SS10000 premium TMT bars
▪ 2014- Launched Kamdhenu Structural Steel
▪ 2015- Became largest TMT selling brand in India
1994 1995-2000 2001-2005 2006-2010 2011-2015 2016-2017
▪ 2016- Name Changed from Kamdhenu Ispat Ltd. to Kamdhenu Ltd. –positioned as branding and marketing company
▪ 2017- Launched Kamdhenu Nxt – TMT interlock steel for next generation
▪ 2018 – Board recommended to Hive-off of the Paint Division
▪ 2019 - Own Manufacturing Expansion
2018-2019
Unique Business Model
11
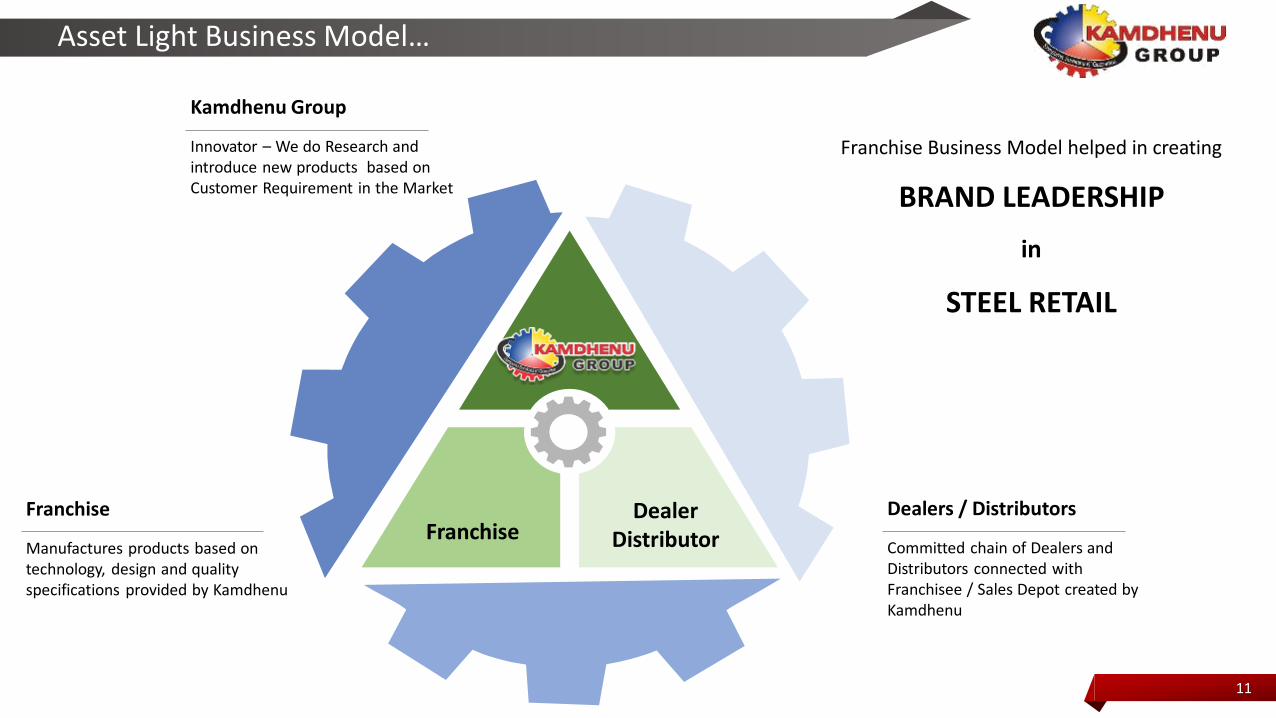
Asset Light Business Model…
Kamdhenu Group
Innovator – We do Research and introduce new products based on Customer Requirement in the Market
FranchiseDealer
Distributor
Franchise
Manufactures products based on technology, design and quality specifications provided by Kamdhenu
Dealers / Distributors
Committed chain of Dealers and Distributors connected with Franchisee / Sales Depot created by Kamdhenu
Franchise Business Model helped in creating
BRAND LEADERSHIP
in
STEEL RETAIL
12
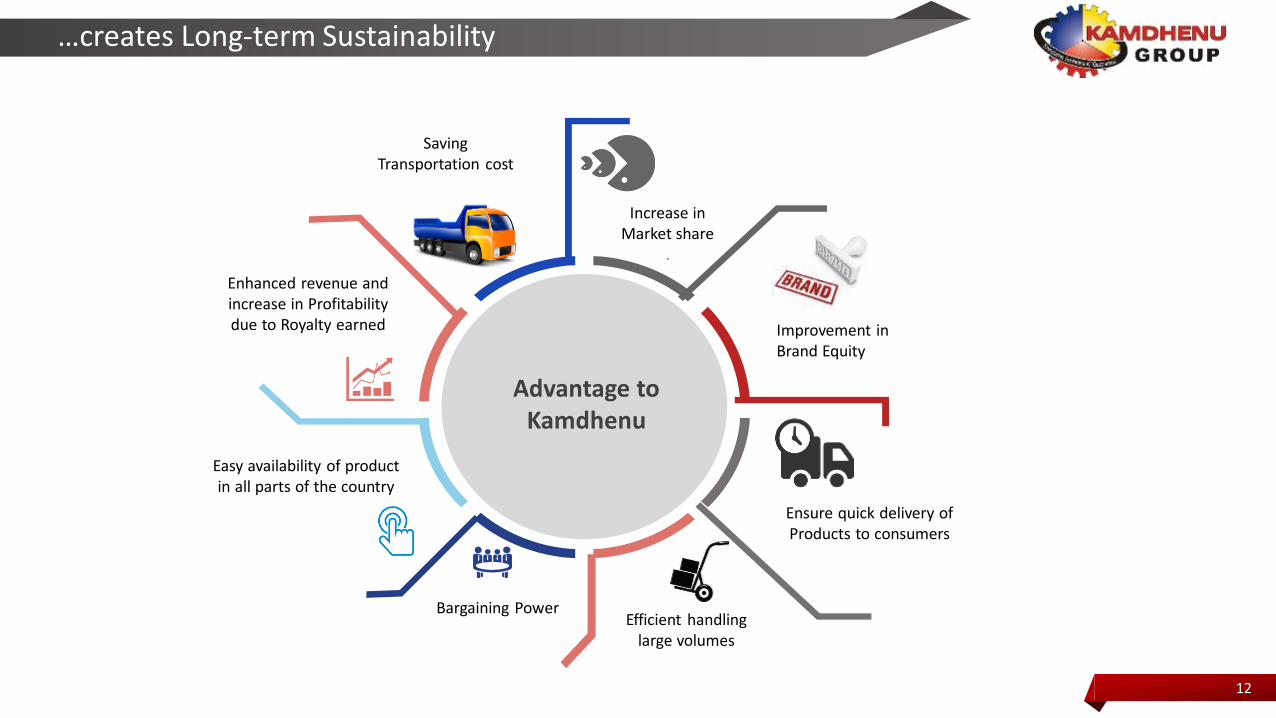
…creates Long-term Sustainability
Efficient handling large volumes
Enhanced revenue and increase in Profitability due to Royalty earned
Bargaining Power
Improvement in Brand Equity
Ensure quick delivery of Products to consumers
Saving Transportation cost
Easy availability of product in all parts of the country
Advantage to Kamdhenu
Increase in Market share
.
13
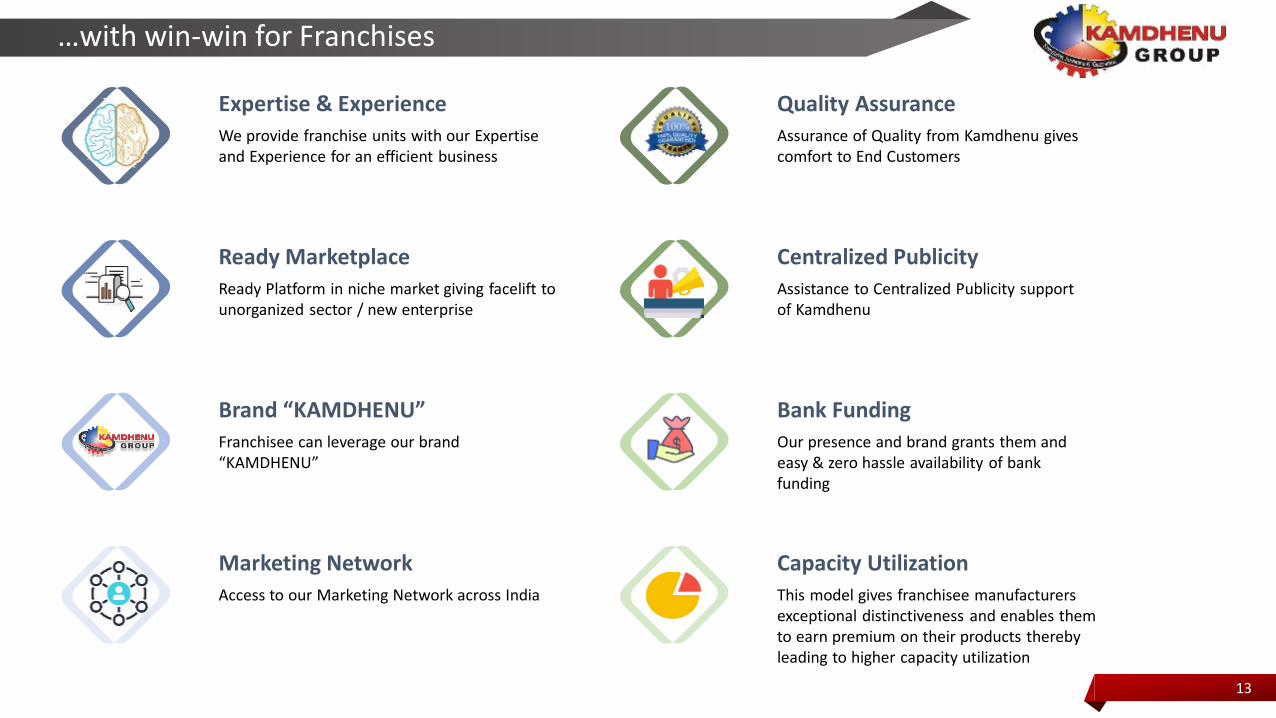
…with win-win for Franchises
Expertise & Experience
We provide franchise units with our Expertise and Experience for an efficient business
Brand “KAMDHENU”
Franchisee can leverage our brand “KAMDHENU”
Ready Marketplace
Ready Platform in niche market giving facelift to unorganized sector / new enterprise
Marketing Network
Access to our Marketing Network across India
Quality Assurance
Assurance of Quality from Kamdhenu gives comfort to End Customers
Bank Funding
Our presence and brand grants them and easy & zero hassle availability of bank funding
Centralized Publicity
Assistance to Centralized Publicity support of Kamdhenu
Capacity Utilization
This model gives franchisee manufacturers exceptional distinctiveness and enables them to earn premium on their products thereby leading to higher capacity utilization
14
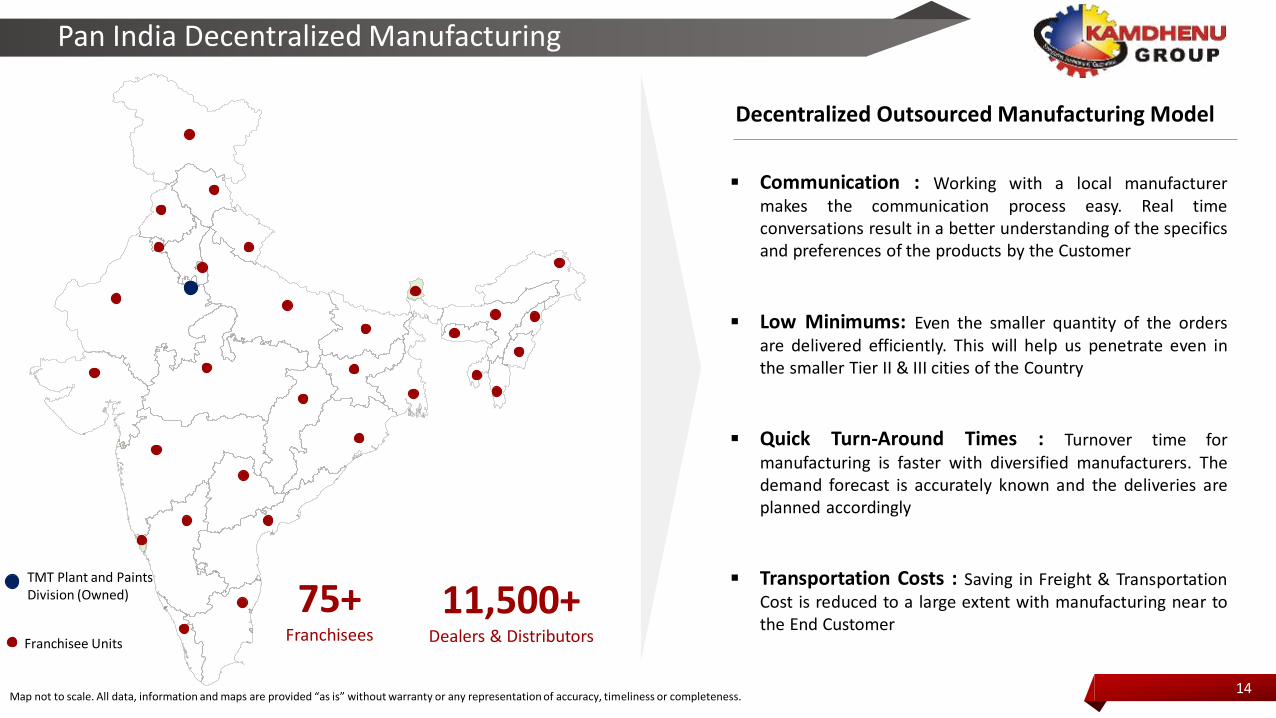
Pan India Decentralized Manufacturing
▪ Communication : Working with a local manufacturermakes the communication process easy. Real timeconversations result in a better understanding of the specificsand preferences of the products by the Customer
▪ Low Minimums: Even the smaller quantity of the ordersare delivered efficiently. This will help us penetrate even inthe smaller Tier II & III cities of the Country
▪ Quick Turn-Around Times : Turnover time formanufacturing is faster with diversified manufacturers. Thedemand forecast is accurately known and the deliveries areplanned accordingly
▪ Transportation Costs : Saving in Freight & TransportationCost is reduced to a large extent with manufacturing near tothe End Customer
Map not to scale. All data, information and maps are provided “as is” without warranty or any representation of accuracy, timeliness or completeness.
TMT Plant and Paints Division (Owned)
Franchisee Units
75+Franchisees
11,500+Dealers & Distributors
Decentralized Outsourced Manufacturing Model
15
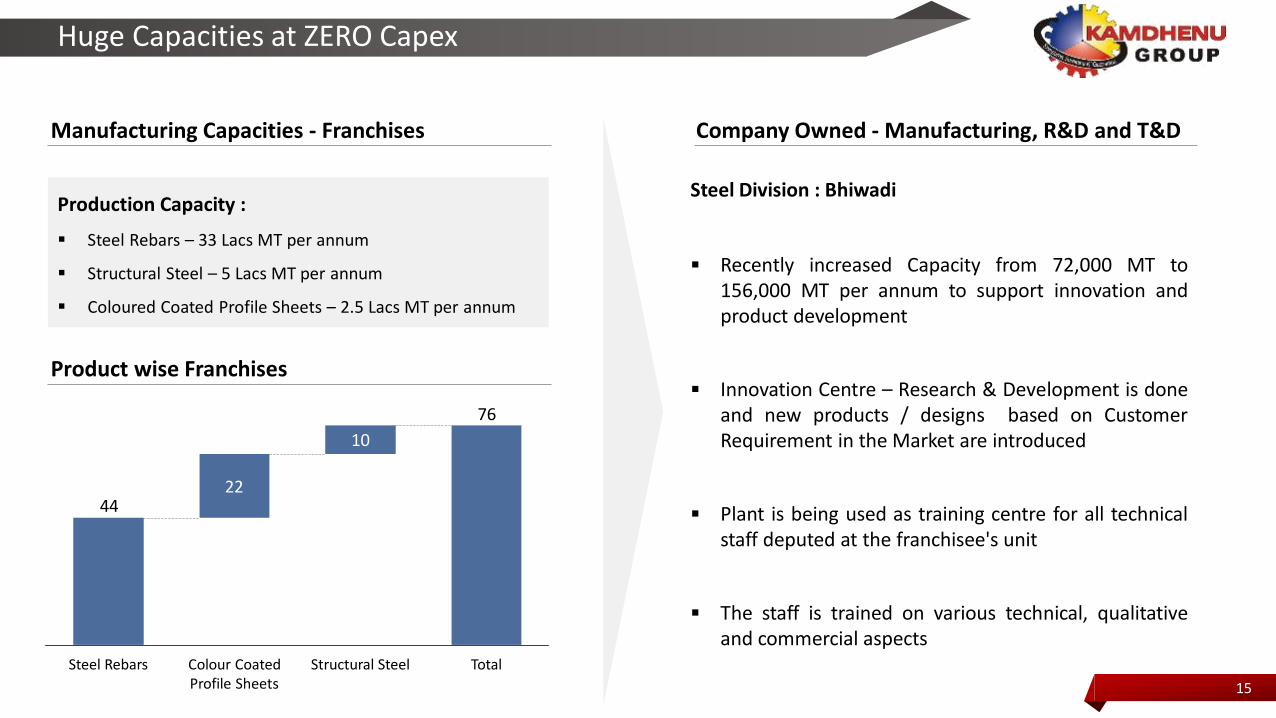
Huge Capacities at ZERO Capex
Manufacturing Capacities - Franchises
Production Capacity :
▪ Steel Rebars – 33 Lacs MT per annum
▪ Structural Steel – 5 Lacs MT per annum
▪ Coloured Coated Profile Sheets – 2.5 Lacs MT per annum
Steel Division : Bhiwadi
▪ Recently increased Capacity from 72,000 MT to156,000 MT per annum to support innovation andproduct development
▪ Innovation Centre – Research & Development is doneand new products / designs based on CustomerRequirement in the Market are introduced
▪ Plant is being used as training centre for all technicalstaff deputed at the franchisee's unit
▪ The staff is trained on various technical, qualitativeand commercial aspects
Company Owned - Manufacturing, R&D and T&D
76
44
10
22
Colour Coated Profile Sheets
TotalStructural SteelSteel Rebars
Product wise Franchises

Branded Product Portfolio
17
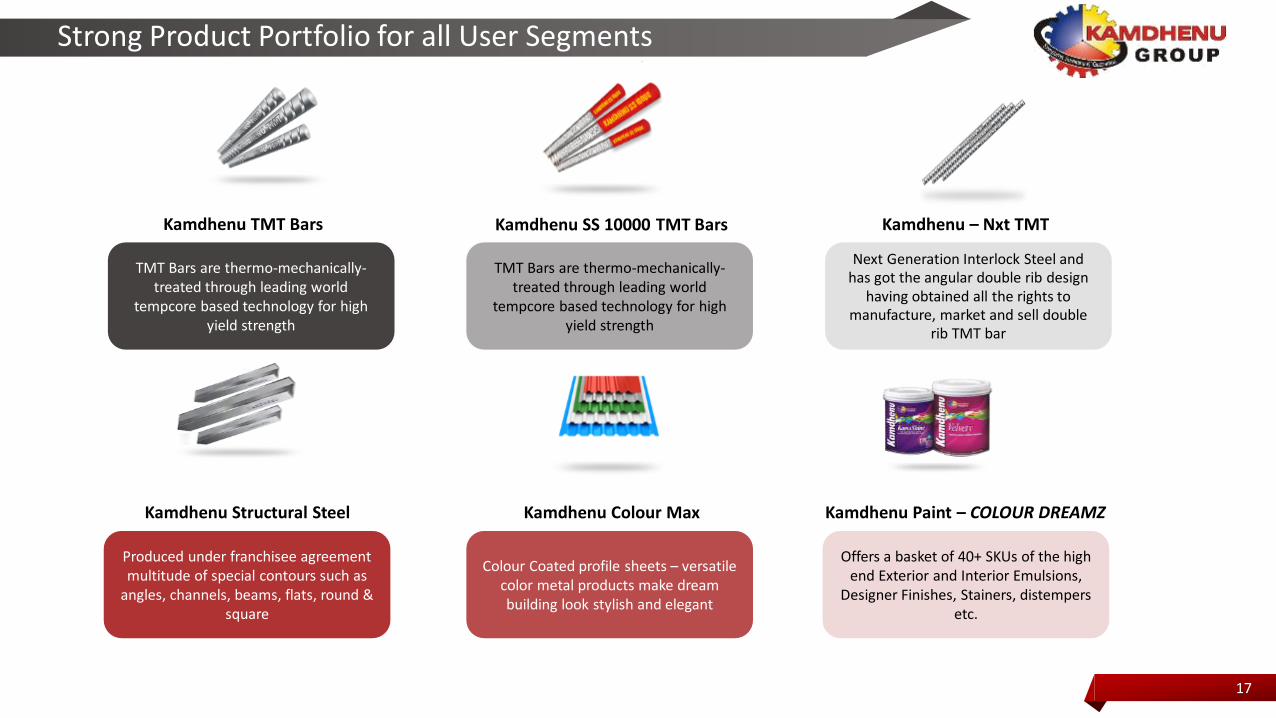
Strong Product Portfolio for all User Segments
Kamdhenu TMT Bars Kamdhenu SS 10000 TMT Bars Kamdhenu – Nxt TMT
TMT Bars are thermo-mechanically-treated through leading world
tempcore based technology for high yield strength
TMT Bars are thermo-mechanically-treated through leading world
tempcore based technology for high yield strength
Next Generation Interlock Steel and has got the angular double rib design
having obtained all the rights to manufacture, market and sell double
rib TMT bar
Produced under franchisee agreement multitude of special contours such as
angles, channels, beams, flats, round & square
Colour Coated profile sheets – versatile color metal products make dream building look stylish and elegant
Offers a basket of 40+ SKUs of the high end Exterior and Interior Emulsions,
Designer Finishes, Stainers, distempers etc.
Kamdhenu Structural Steel Kamdhenu Colour Max Kamdhenu Paint – COLOUR DREAMZ
BRAND
18
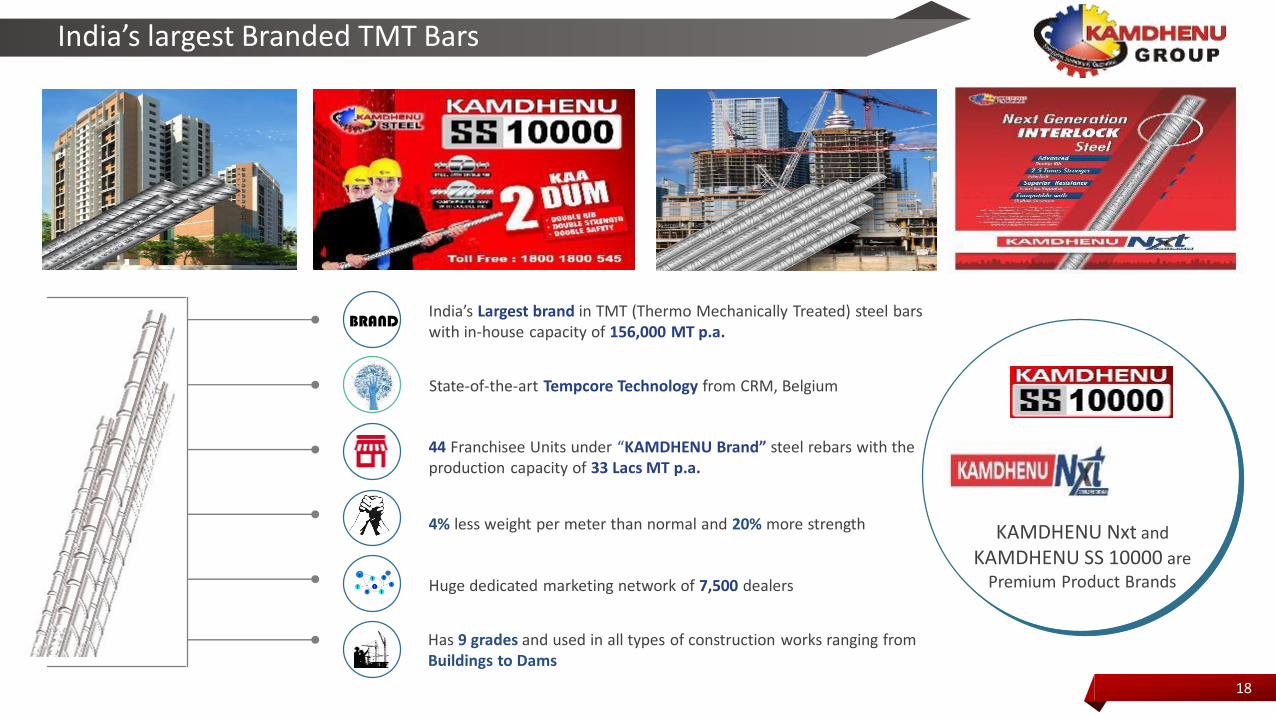
India’s largest Branded TMT Bars
KAMDHENU Nxt and
KAMDHENU SS 10000 are
Premium Product Brands
India’s Largest brand in TMT (Thermo Mechanically Treated) steel bars with in-house capacity of 156,000 MT p.a.
4% less weight per meter than normal and 20% more strength
44 Franchisee Units under “KAMDHENU Brand” steel rebars with the production capacity of 33 Lacs MT p.a.
State-of-the-art Tempcore Technology from CRM, Belgium
Huge dedicated marketing network of 7,500 dealers
Has 9 grades and used in all types of construction works ranging from Buildings to Dams
19
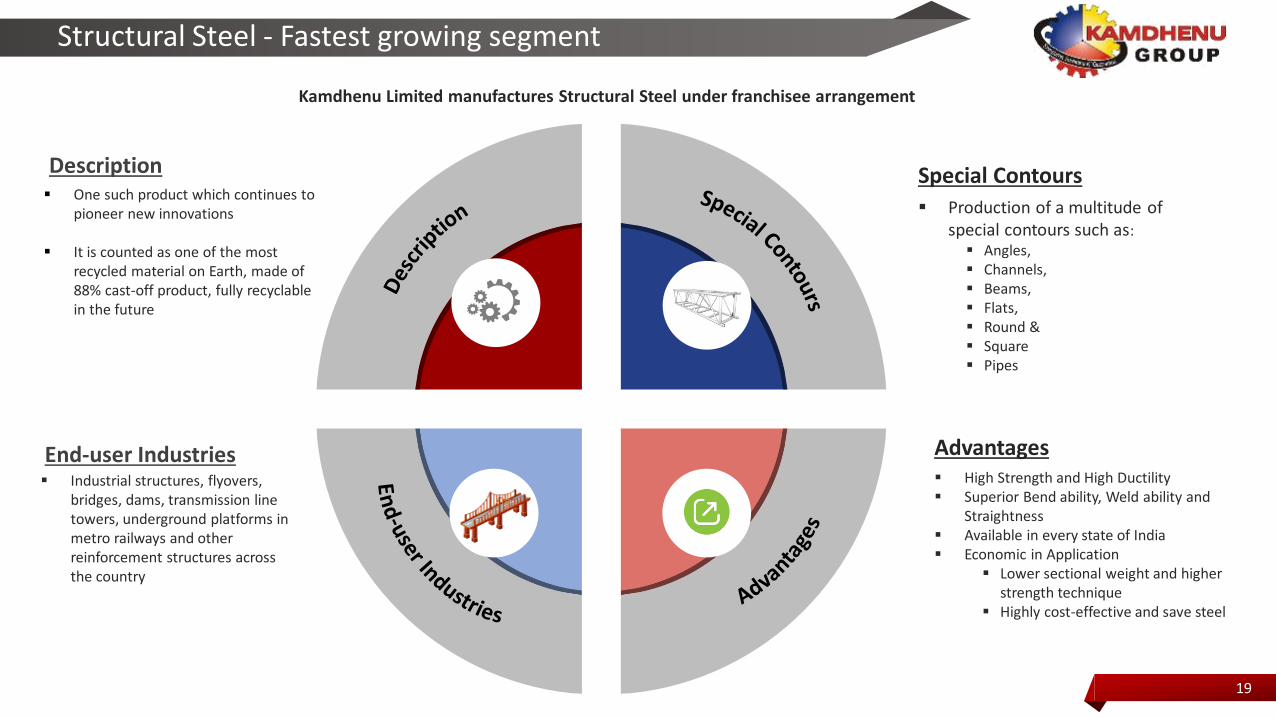
Structural Steel - Fastest growing segment
▪ One such product which continues to pioneer new innovations
▪ It is counted as one of the most recycled material on Earth, made of 88% cast-off product, fully recyclable in the future
Description
▪ Industrial structures, flyovers, bridges, dams, transmission line towers, underground platforms in metro railways and other reinforcement structures across the country
End-user Industries
▪ Production of a multitude of special contours such as:▪ Angles, ▪ Channels,▪ Beams,▪ Flats, ▪ Round & ▪ Square▪ Pipes
Special Contours
Kamdhenu Limited manufactures Structural Steel under franchisee arrangement
▪ High Strength and High Ductility▪ Superior Bend ability, Weld ability and
Straightness▪ Available in every state of India▪ Economic in Application
▪ Lower sectional weight and higher strength technique
▪ Highly cost-effective and save steel
Advantages
20
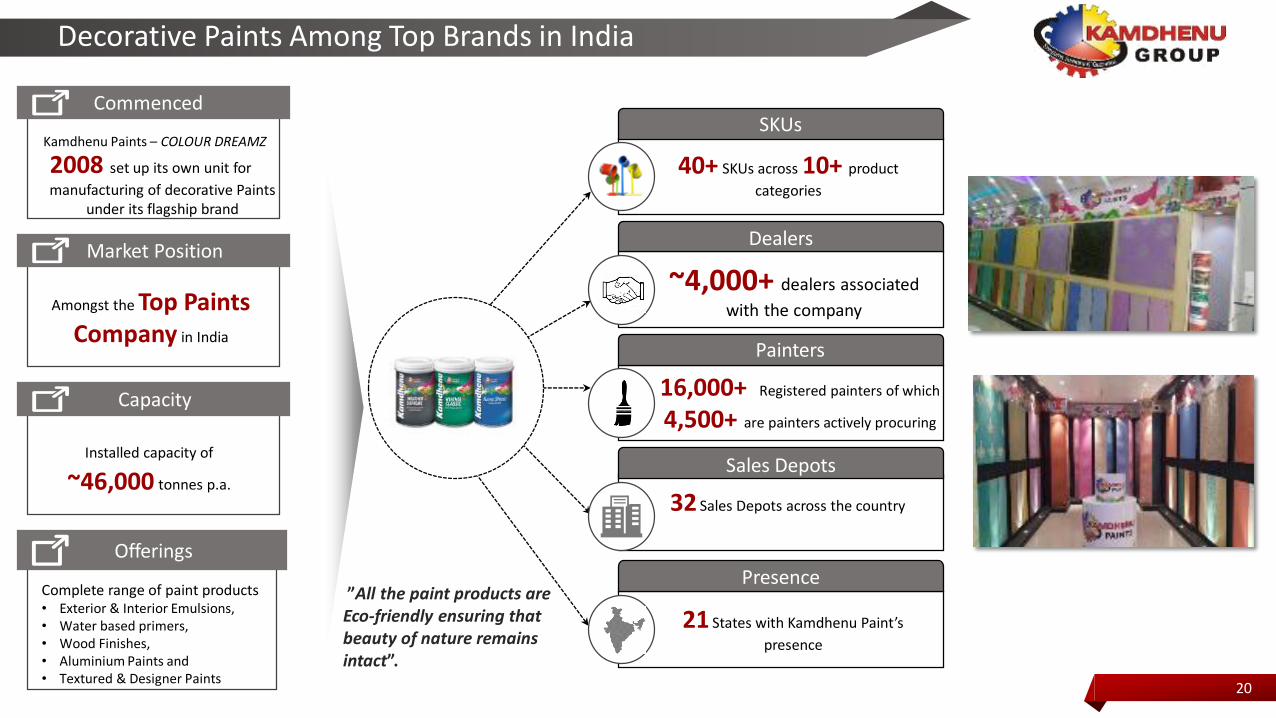
Decorative Paints Among Top Brands in India
Commenced
2008 set up its own unit for
manufacturing of decorative Paints under its flagship brand
Market Position
Amongst the Top Paints Company in India
Offerings
Complete range of paint products • Exterior & Interior Emulsions, • Water based primers,• Wood Finishes,• Aluminium Paints and• Textured & Designer Paints
”All the paint products are Eco-friendly ensuring that beauty of nature remains intact”.
SKUs
Presence
Sales Depots
Painters
Dealers
40+ SKUs across 10+ product
categories
~4,000+ dealers associated
with the company
16,000+ Registered painters of which
4,500+ are painters actively procuring
32 Sales Depots across the country
21 States with Kamdhenu Paint’s
presence
Capacity
Installed capacity of
~46,000 tonnes p.a.
Kamdhenu Paints – COLOUR DREAMZ
21
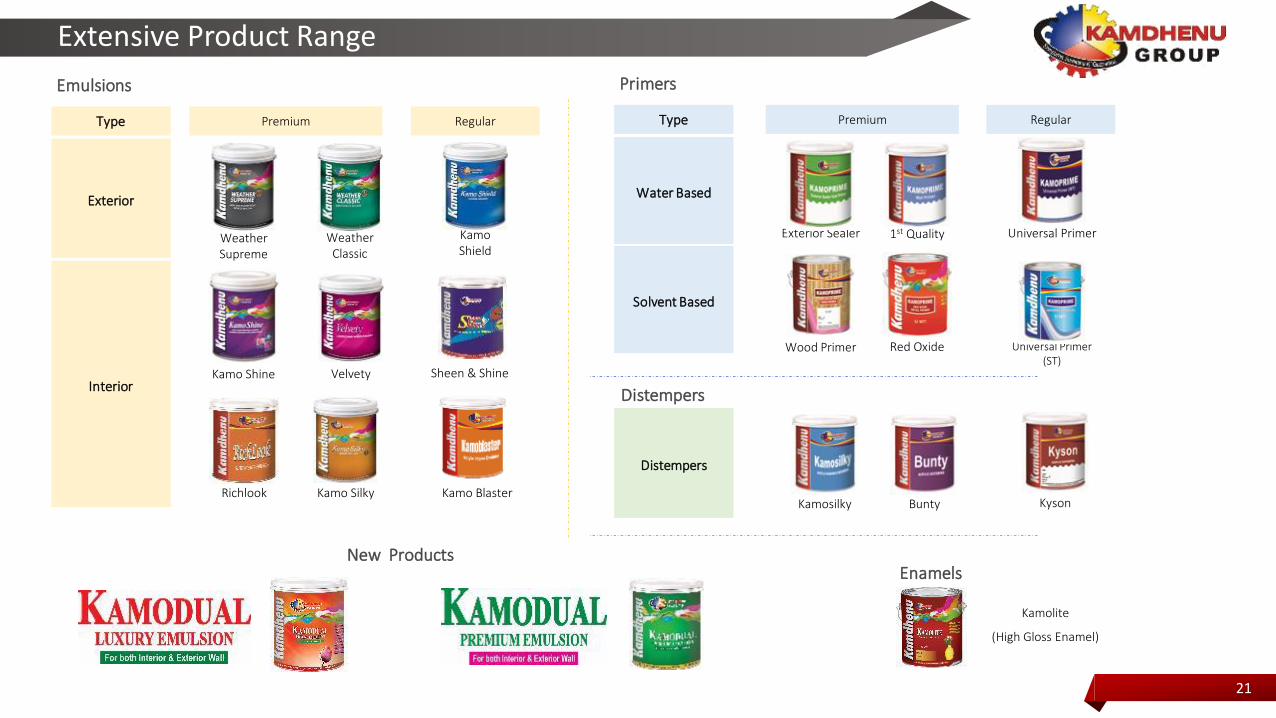
Extensive Product Range
Exterior
Interior
Premium Regular
Kamo Shield
Kamo Silky
Weather Supreme
Weather Classic
Velvety
Richlook
Sheen & Shine
Kamolite
(High Gloss Enamel)
Type
Water Based
Premium RegularType
Solvent Based
Distempers
Kamosilky Bunty Kyson
Emulsions Primers
Distempers
Enamels
Kamo Shine
Wood Primer
Exterior Sealer 1st Quality
Red Oxide Universal Primer (ST)
Universal Primer
Kamo Blaster
New Products
22
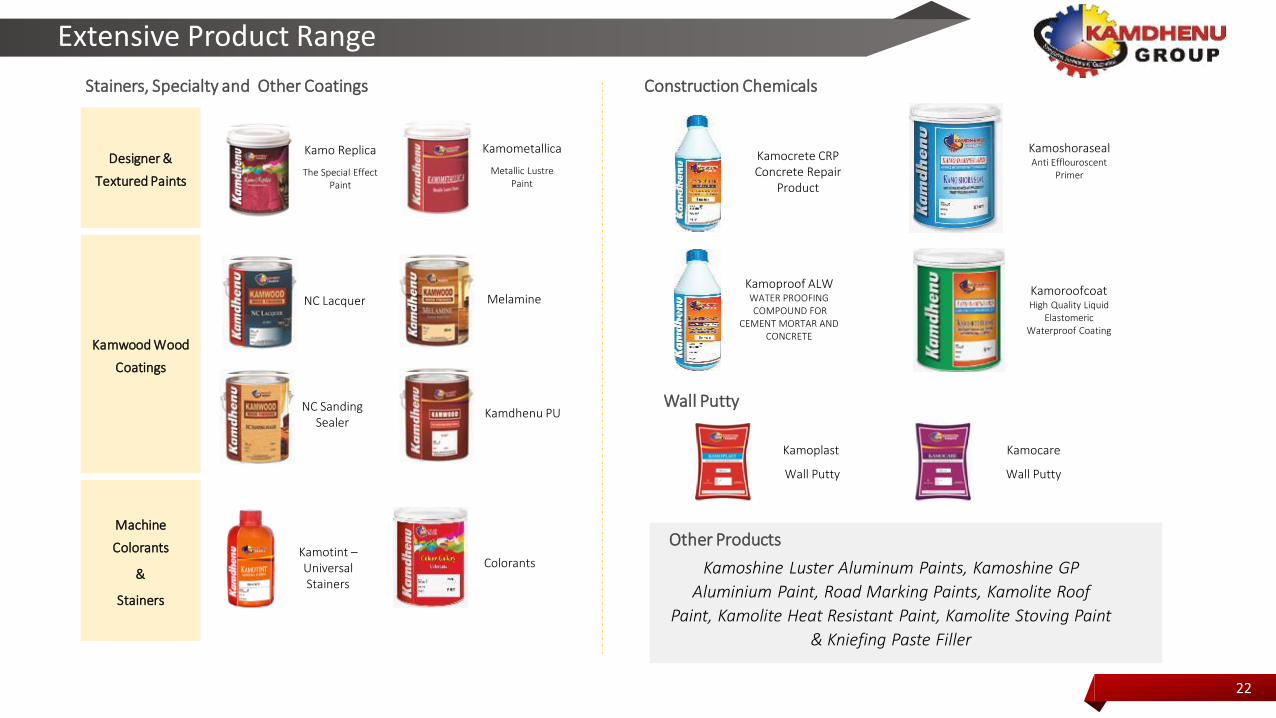
Extensive Product Range
Stainers, Specialty and Other Coatings Construction Chemicals
Melamine NC Lacquer
NC Sanding Sealer
Kamdhenu PU
Other Products
Kamoshine Luster Aluminum Paints, Kamoshine GP
Aluminium Paint, Road Marking Paints, Kamolite Roof
Paint, Kamolite Heat Resistant Paint, Kamolite Stoving Paint
& Kniefing Paste Filler
KamoshorasealAnti Efflouroscent
Primer
KamoroofcoatHigh Quality Liquid
Elastomeric Waterproof Coating
Kamotint –Universal Stainers
Kamo Replica
The Special Effect Paint
Kamometallica
Metallic LustrePaint
Designer &
Textured Paints
Kamwood Wood
Coatings
Machine
Colorants
&
Stainers
Colorants
Kamoproof ALWWATER PROOFINGCOMPOUND FOR
CEMENT MORTAR AND CONCRETE
Kamocrete CRPConcrete Repair
Product
Kamoplast
Wall Putty
Kamocare
Wall Putty
Wall Putty
23
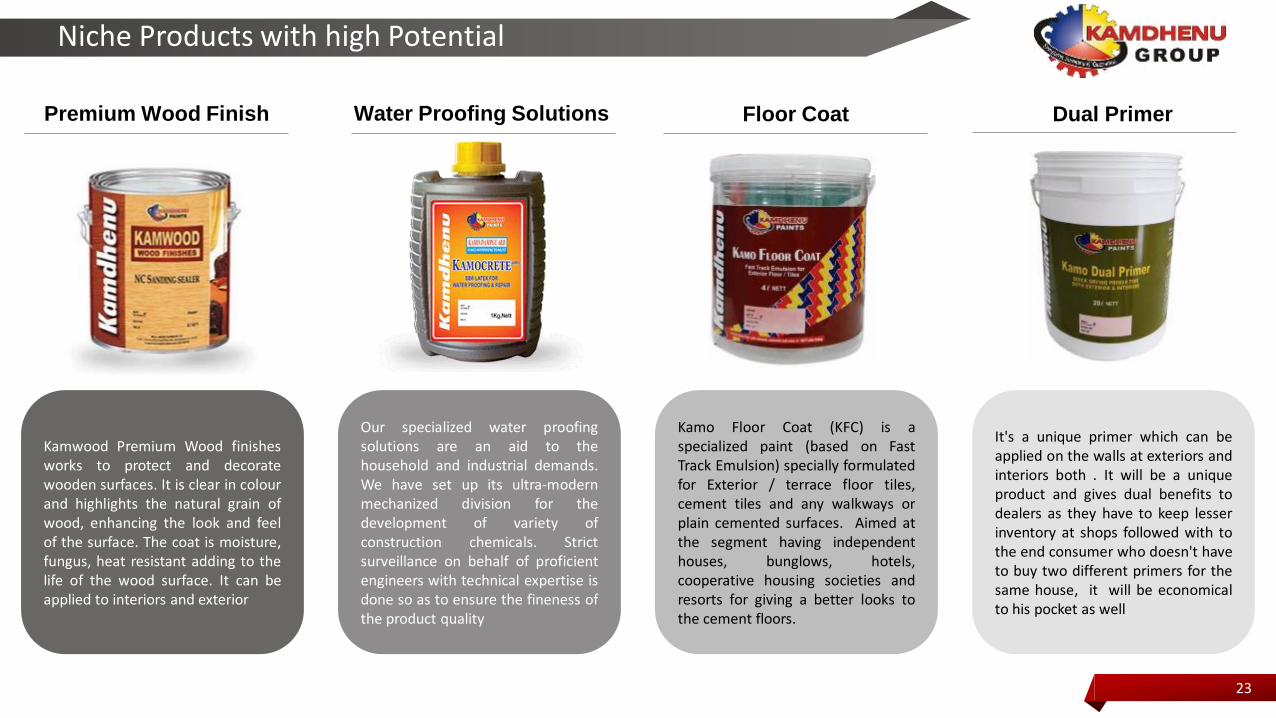
Niche Products with high Potential
Kamwood Premium Wood finishesworks to protect and decoratewooden surfaces. It is clear in colourand highlights the natural grain ofwood, enhancing the look and feelof the surface. The coat is moisture,fungus, heat resistant adding to thelife of the wood surface. It can beapplied to interiors and exterior
Our specialized water proofingsolutions are an aid to thehousehold and industrial demands.We have set up its ultra-modernmechanized division for thedevelopment of variety ofconstruction chemicals. Strictsurveillance on behalf of proficientengineers with technical expertise isdone so as to ensure the fineness ofthe product quality
Kamo Floor Coat (KFC) is aspecialized paint (based on FastTrack Emulsion) specially formulatedfor Exterior / terrace floor tiles,cement tiles and any walkways orplain cemented surfaces. Aimed atthe segment having independenthouses, bunglows, hotels,cooperative housing societies andresorts for giving a better looks tothe cement floors.
It's a unique primer which can beapplied on the walls at exteriors andinteriors both . It will be a uniqueproduct and gives dual benefits todealers as they have to keep lesserinventory at shops followed with tothe end consumer who doesn't haveto buy two different primers for thesame house, it will be economicalto his pocket as well
Premium Wood Finish Water Proofing Solutions Floor Coat Dual Primer
Brand “KAMDHENU”
25
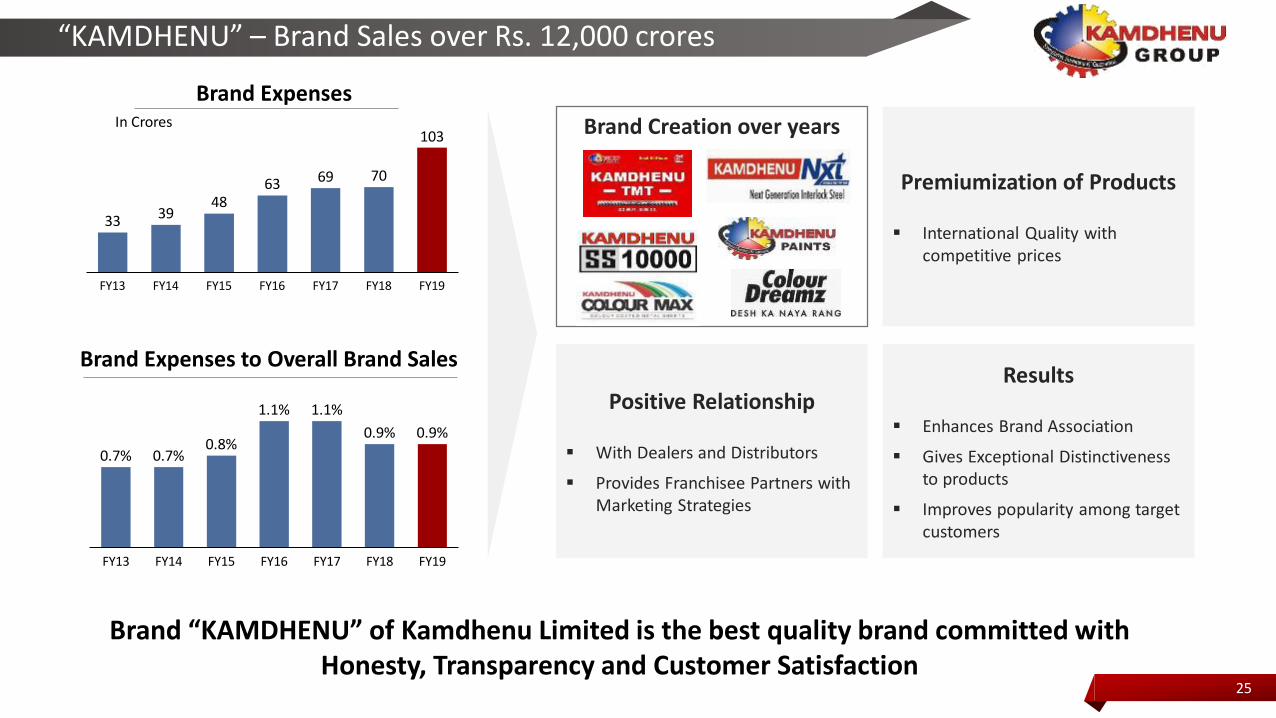
“KAMDHENU” – Brand Sales over Rs. 12,000 crores
Brand Expenses
33 3948
63 69 70
103
FY15 FY19FY16FY13 FY14 FY17 FY18
Brand Expenses to Overall Brand Sales
FY18FY17FY13 FY14 FY15 FY16
0.9%
FY19
0.7% 0.7%0.8%
1.1% 1.1%
0.9%
Brand Creation over years
Premiumization of Products
▪ International Quality with competitive prices
Positive Relationship
▪ With Dealers and Distributors
▪ Provides Franchisee Partners with Marketing Strategies
Results
▪ Enhances Brand Association
▪ Gives Exceptional Distinctiveness to products
▪ Improves popularity among target customers
In Crores
Brand “KAMDHENU” of Kamdhenu Limited is the best quality brand committed with Honesty, Transparency and Customer Satisfaction
26
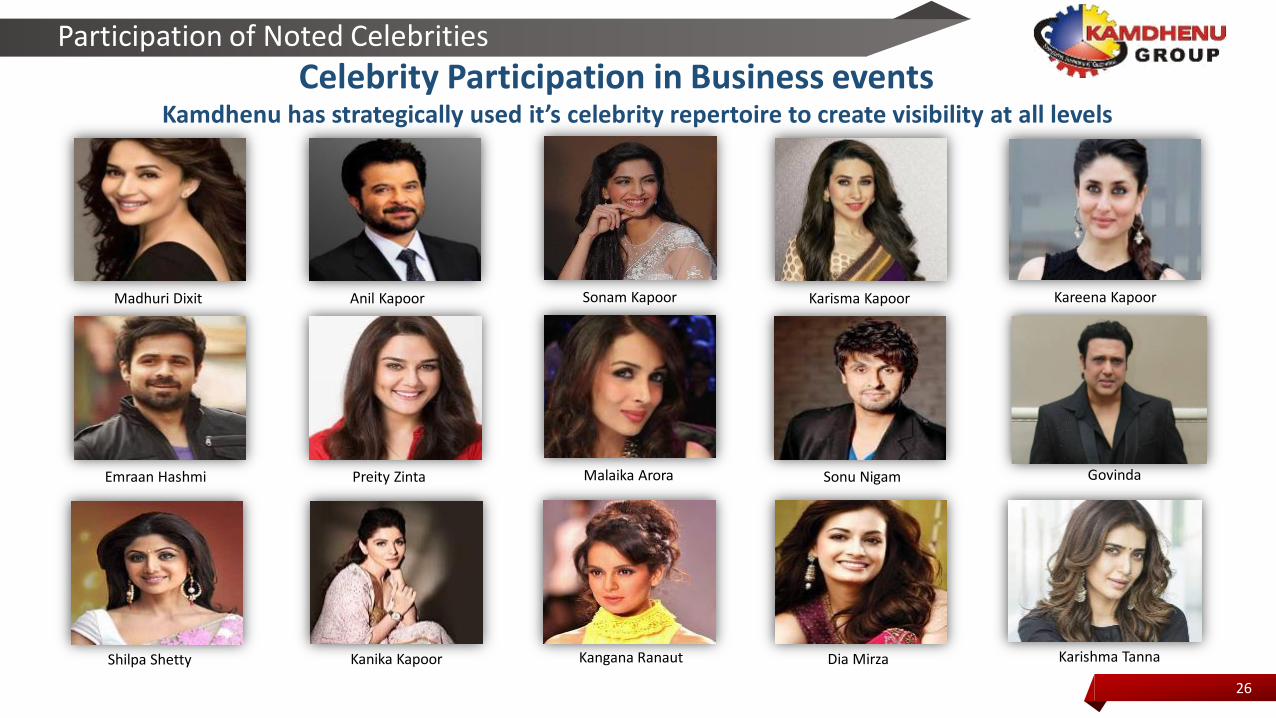
Participation of Noted Celebrities
Dia Mirza
Sonu NigamMalaika Arora
Karisma Kapoor
Kamdhenu has strategically used it’s celebrity repertoire to create visibility at all levels
Shilpa Shetty Kanika Kapoor Kangana Ranaut
Celebrity Participation in Business events
Preity ZintaEmraan Hashmi
Sonam KapoorAnil KapoorMadhuri Dixit
Govinda
Kareena Kapoor
Karishma Tanna
27
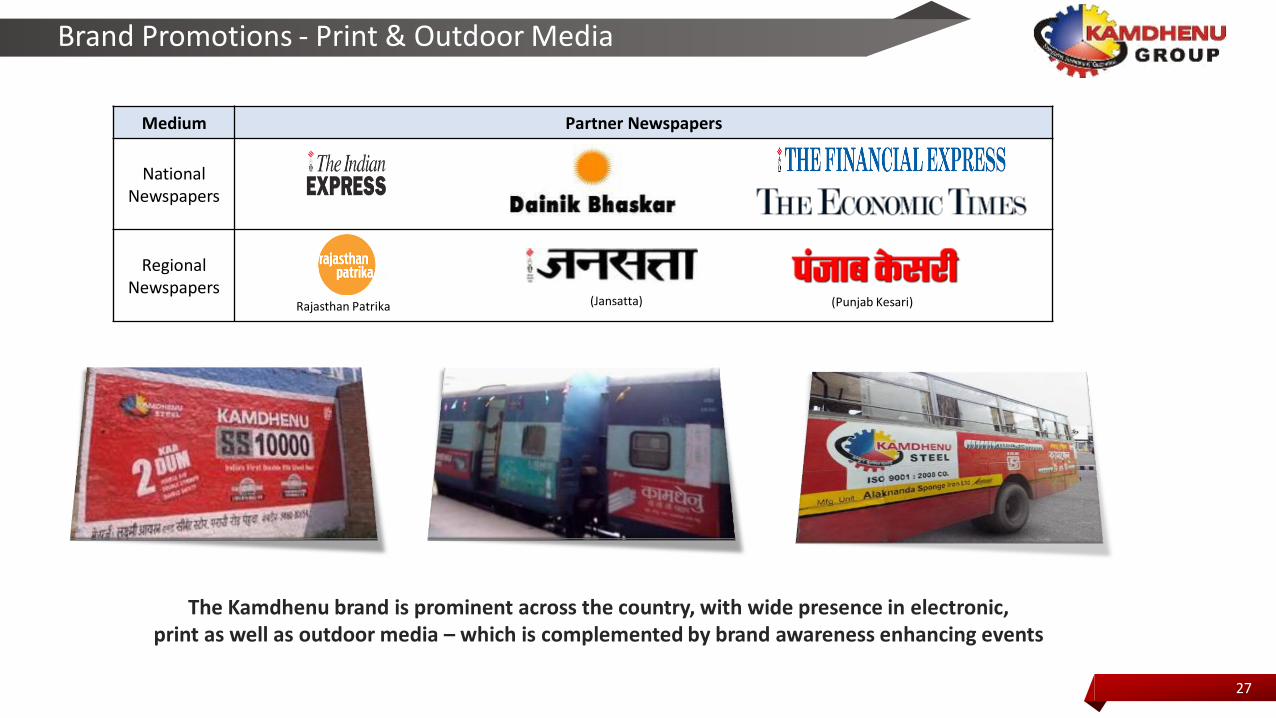
Brand Promotions - Print & Outdoor Media
Medium Partner Newspapers
NationalNewspapers
Regional Newspapers
Rajasthan Patrika (Punjab Kesari)(Jansatta)
The Kamdhenu brand is prominent across the country, with wide presence in electronic, print as well as outdoor media – which is complemented by brand awareness enhancing events
28
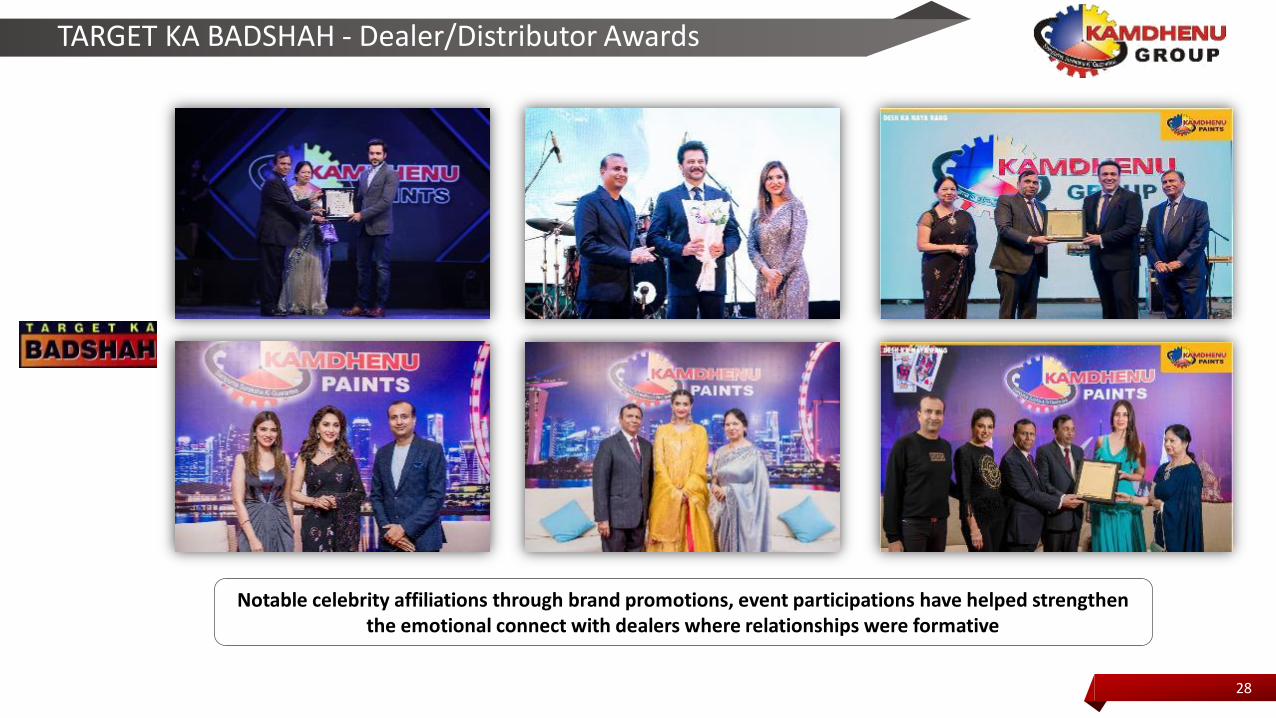
TARGET KA BADSHAH - Dealer/Distributor Awards
Notable celebrity affiliations through brand promotions, event participations have helped strengthen the emotional connect with dealers where relationships were formative
29
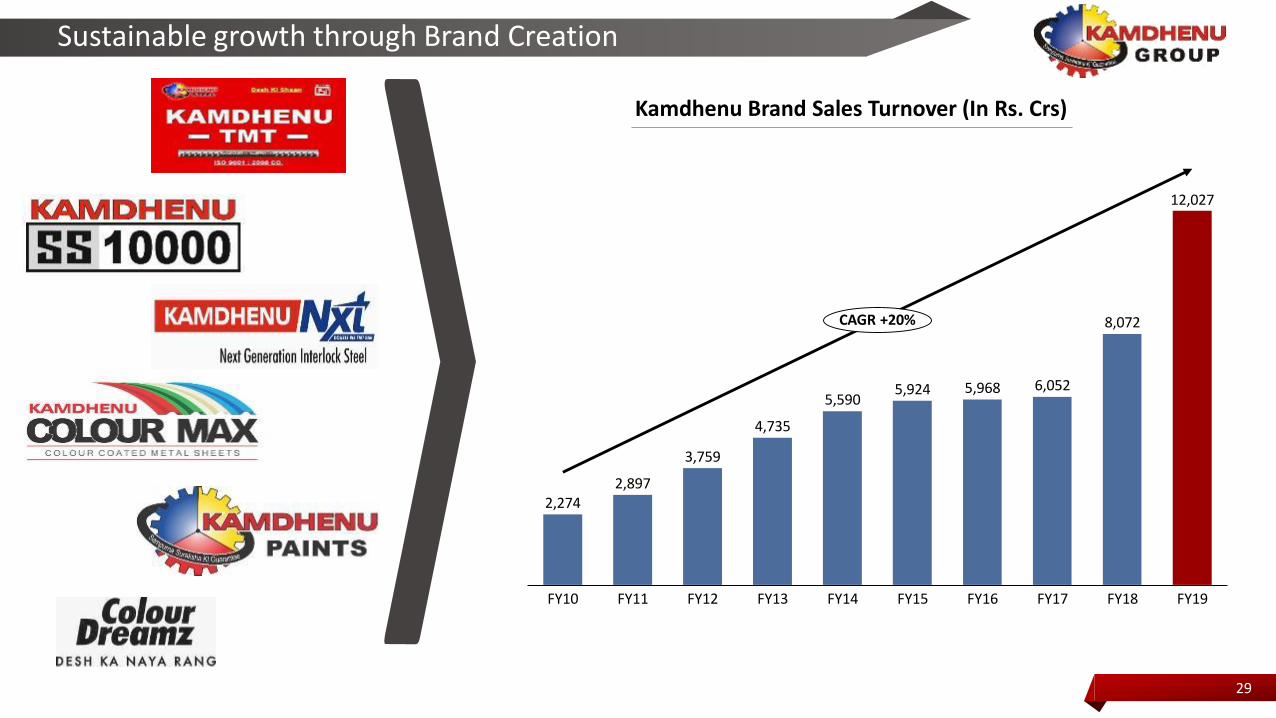
2,2742,897
3,759
4,735
5,5905,924 5,968 6,052
8,072
12,027
FY17FY13FY11FY10 FY12 FY14 FY15 FY16 FY18 FY19
CAGR +20%
Sustainable growth through Brand Creation
Kamdhenu Brand Sales Turnover (In Rs. Crs)
Vision 2022
31
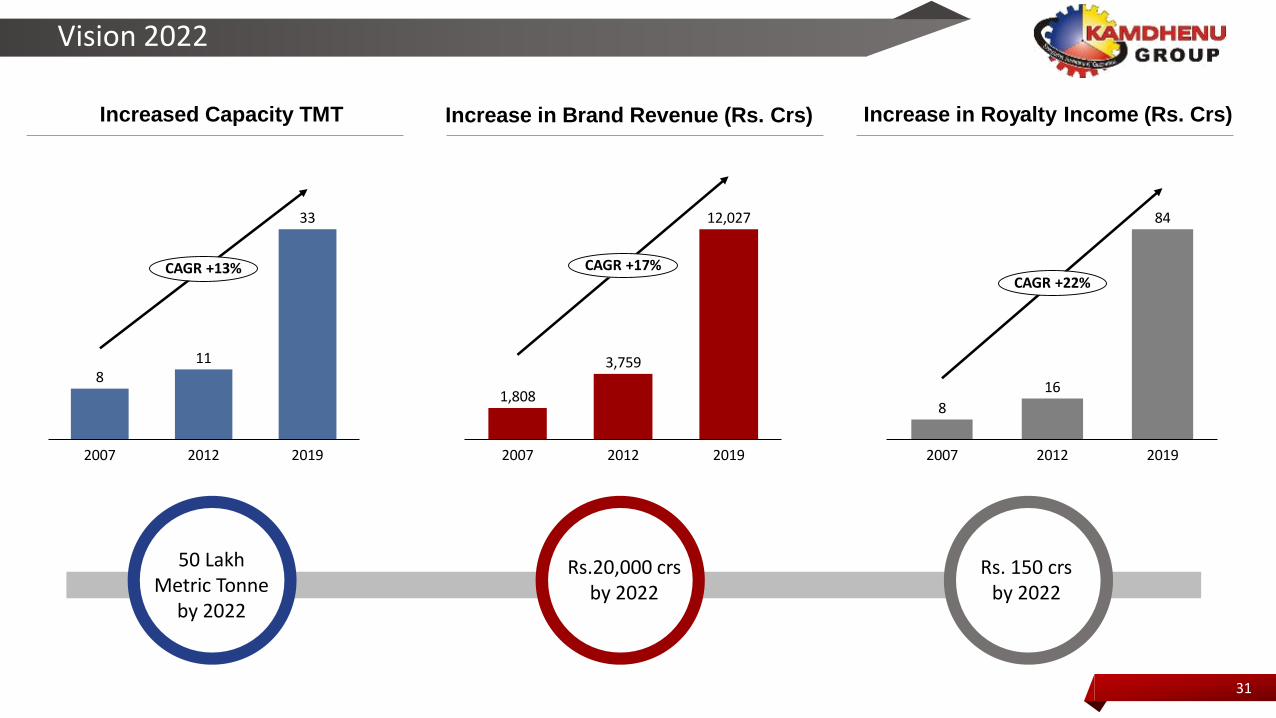
Vision 2022
Increased Capacity TMT Increase in Royalty Income (Rs. Crs)
811
33
20122007 2019
CAGR +13%
8
16
84
20122007 2019
CAGR +22%
Increase in Brand Revenue (Rs. Crs)
1,808
3,759
12,027
2007 2012 2019
CAGR +17%
50 Lakh Metric Tonne
by 2022
Rs.20,000 crs by 2022
Rs. 150 crs by 2022
32
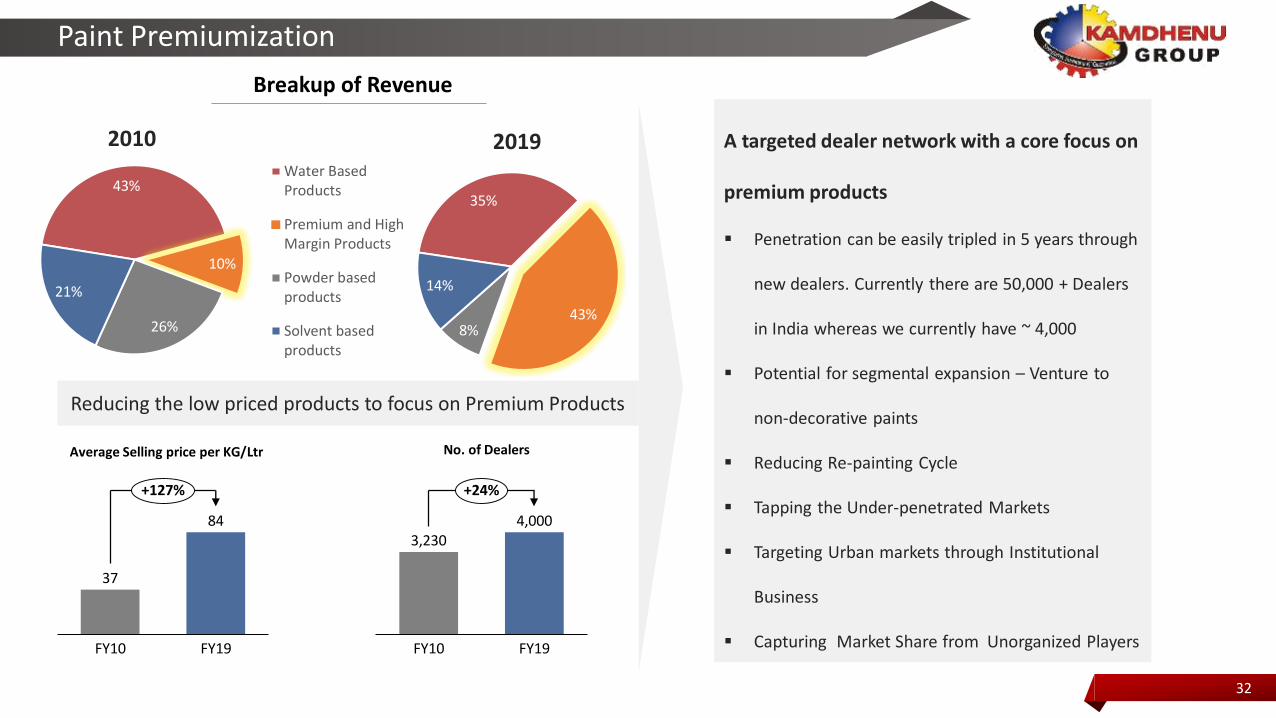
37
84
FY10 FY19
+127%
3,2304,000
FY10 FY19
+24%
Average Selling price per KG/Ltr No. of Dealers
Breakup of Revenue
Reducing the low priced products to focus on Premium Products
A targeted dealer network with a core focus on
premium products
▪ Penetration can be easily tripled in 5 years through
new dealers. Currently there are 50,000 + Dealers
in India whereas we currently have ~ 4,000
▪ Potential for segmental expansion – Venture to
non-decorative paints
▪ Reducing Re-painting Cycle
▪ Tapping the Under-penetrated Markets
▪ Targeting Urban markets through Institutional
Business
▪ Capturing Market Share from Unorganized Players
Paint Premiumization
2010 2019
43%
10%
26%
21%
35%
43%8%
14%
Water BasedProducts
Premium and HighMargin Products
Powder basedproducts
Solvent basedproducts
33
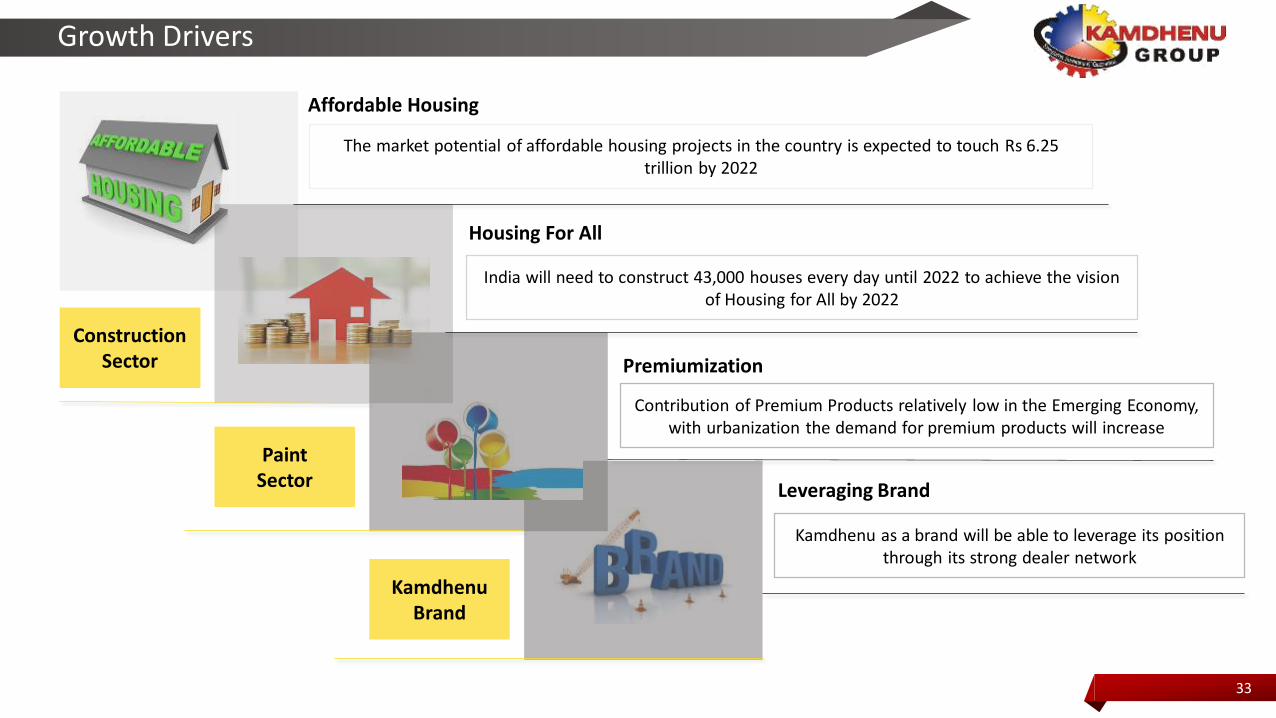
Growth Drivers
Affordable Housing
The market potential of affordable housing projects in the country is expected to touch Rs 6.25 trillion by 2022
India will need to construct 43,000 houses every day until 2022 to achieve the vision of Housing for All by 2022
Housing For All
Contribution of Premium Products relatively low in the Emerging Economy, with urbanization the demand for premium products will increase
Construction Sector
PaintSector
Premiumization
Kamdhenu as a brand will be able to leverage its position through its strong dealer network
Leveraging Brand
Kamdhenu Brand

Management Team
35
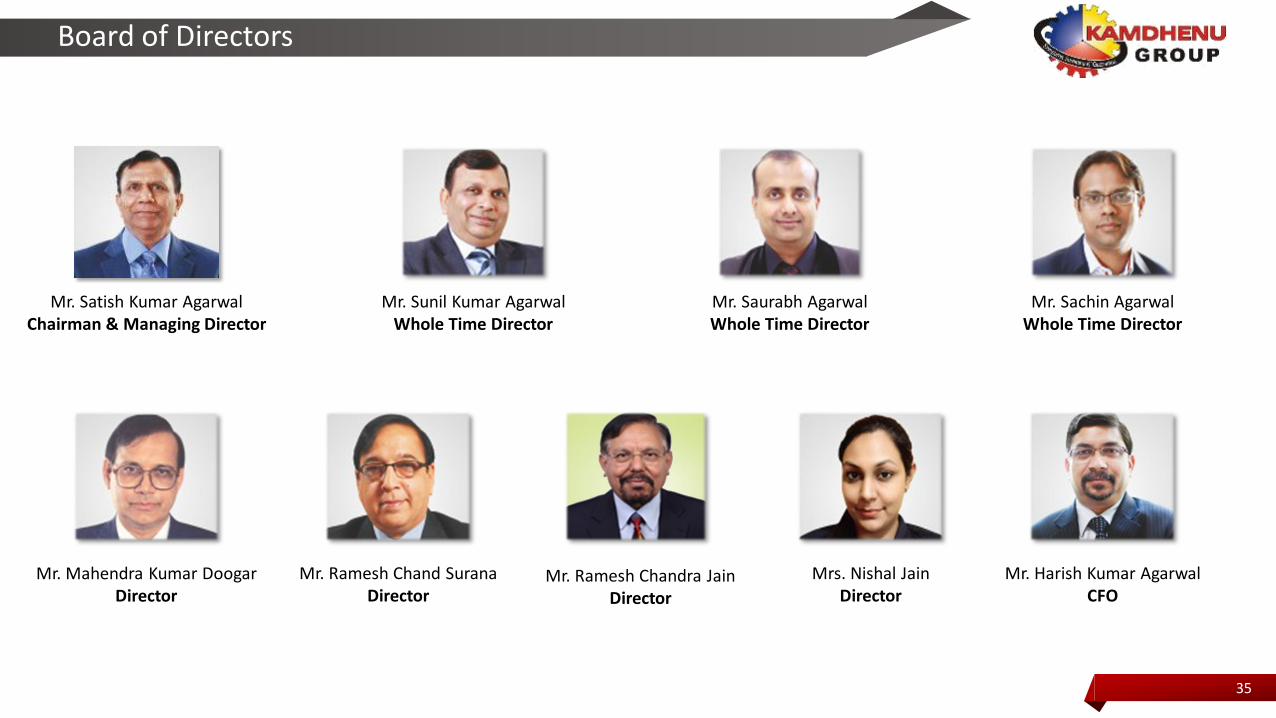
Board of Directors
Mr. Satish Kumar AgarwalChairman & Managing Director
Mr. Sunil Kumar AgarwalWhole Time Director
Mr. Saurabh AgarwalWhole Time Director
Mr. Sachin AgarwalWhole Time Director
Mr. Mahendra Kumar DoogarDirector
Mr. Ramesh Chand SuranaDirector
Mrs. Nishal JainDirector
Mr. Harish Kumar AgarwalCFO
Mr. Ramesh Chandra JainDirector
36
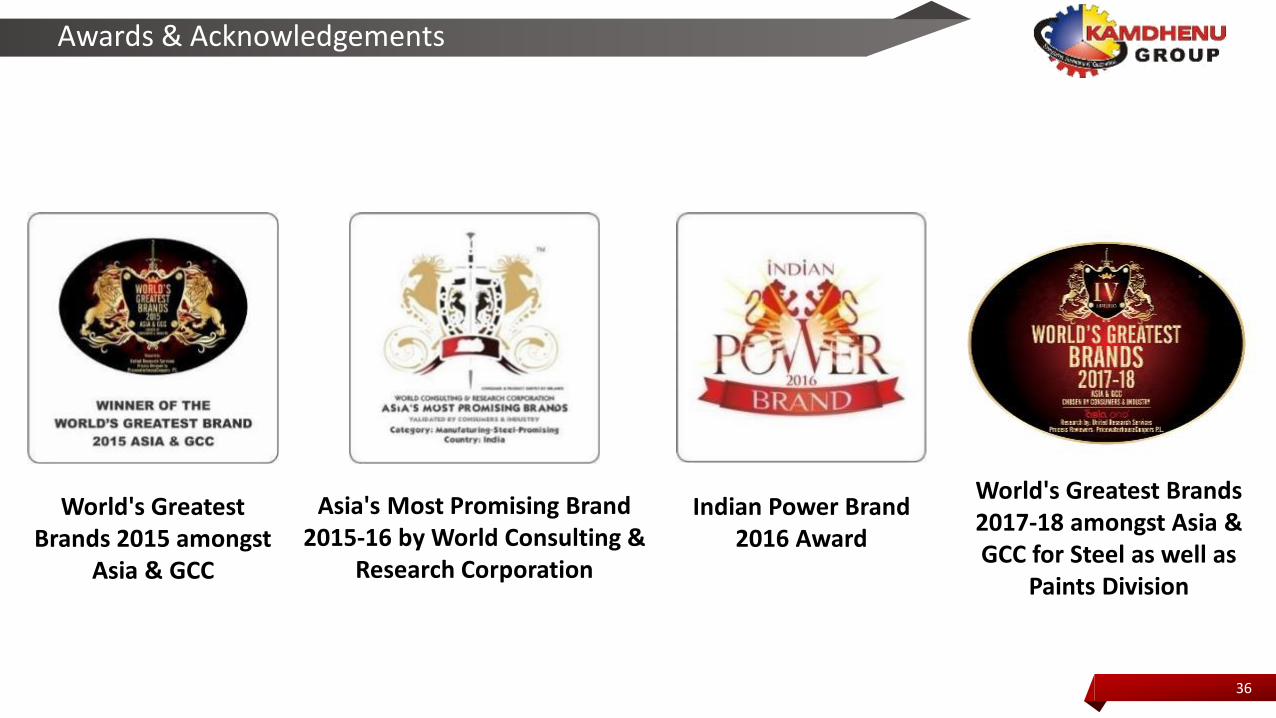
Awards & Acknowledgements
World's Greatest Brands 2015 amongst
Asia & GCC
Asia's Most Promising Brand 2015-16 by World Consulting &
Research Corporation
Indian Power Brand 2016 Award
World's Greatest Brands 2017-18 amongst Asia & GCC for Steel as well as
Paints Division
Financials
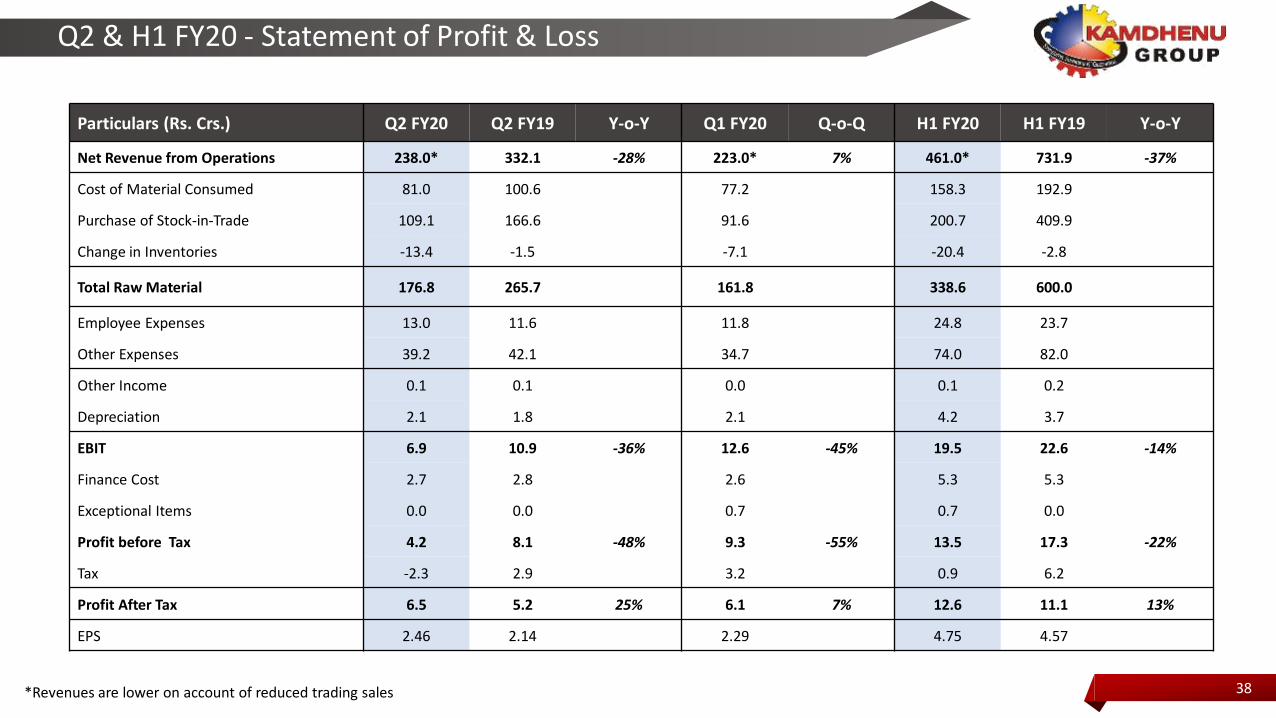
Q2 & H1 FY20 - Statement of Profit & Loss
38
Particulars (Rs. Crs.) Q2 FY20 Q2 FY19 Y-o-Y Q1 FY20 Q-o-Q H1 FY20 H1 FY19 Y-o-Y
Net Revenue from Operations 238.0* 332.1 -28% 223.0* 7% 461.0* 731.9 -37%
Cost of Material Consumed 81.0 100.6 77.2 158.3 192.9
Purchase of Stock-in-Trade 109.1 166.6 91.6 200.7 409.9
Change in Inventories -13.4 -1.5 -7.1 -20.4 -2.8
Total Raw Material 176.8 265.7 161.8 338.6 600.0
Employee Expenses 13.0 11.6 11.8 24.8 23.7
Other Expenses 39.2 42.1 34.7 74.0 82.0
Other Income 0.1 0.1 0.0 0.1 0.2
Depreciation 2.1 1.8 2.1 4.2 3.7
EBIT 6.9 10.9 -36% 12.6 -45% 19.5 22.6 -14%
Finance Cost 2.7 2.8 2.6 5.3 5.3
Exceptional Items 0.0 0.0 0.7 0.7 0.0
Profit before Tax 4.2 8.1 -48% 9.3 -55% 13.5 17.3 -22%
Tax -2.3 2.9 3.2 0.9 6.2
Profit After Tax 6.5 5.2 25% 6.1 7% 12.6 11.1 13%
EPS 2.46 2.14 2.29 4.75 4.57
*Revenues are lower on account of reduced trading sales
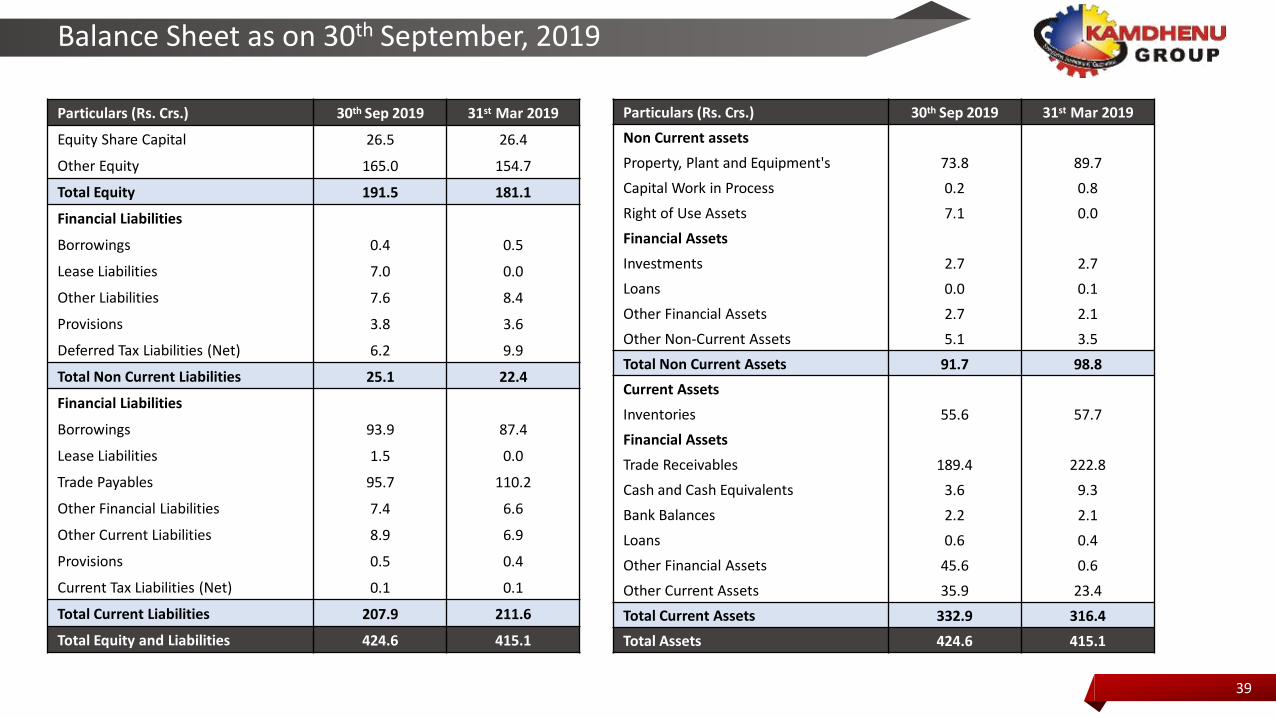
Balance Sheet as on 30th September, 2019
39
Particulars (Rs. Crs.) 30th Sep 2019 31st Mar 2019
Equity Share Capital 26.5 26.4
Other Equity 165.0 154.7
Total Equity 191.5 181.1
Financial Liabilities
Borrowings 0.4 0.5
Lease Liabilities 7.0 0.0
Other Liabilities 7.6 8.4
Provisions 3.8 3.6
Deferred Tax Liabilities (Net) 6.2 9.9
Total Non Current Liabilities 25.1 22.4
Financial Liabilities
Borrowings 93.9 87.4
Lease Liabilities 1.5 0.0
Trade Payables 95.7 110.2
Other Financial Liabilities 7.4 6.6
Other Current Liabilities 8.9 6.9
Provisions 0.5 0.4
Current Tax Liabilities (Net) 0.1 0.1
Total Current Liabilities 207.9 211.6
Total Equity and Liabilities 424.6 415.1
Particulars (Rs. Crs.) 30th Sep 2019 31st Mar 2019
Non Current assets
Property, Plant and Equipment's 73.8 89.7
Capital Work in Process 0.2 0.8
Right of Use Assets 7.1 0.0
Financial Assets
Investments 2.7 2.7
Loans 0.0 0.1
Other Financial Assets 2.7 2.1
Other Non-Current Assets 5.1 3.5
Total Non Current Assets 91.7 98.8
Current Assets
Inventories 55.6 57.7
Financial Assets
Trade Receivables 189.4 222.8
Cash and Cash Equivalents 3.6 9.3
Bank Balances 2.2 2.1
Loans 0.6 0.4
Other Financial Assets 45.6 0.6
Other Current Assets 35.9 23.4
Total Current Assets 332.9 316.4
Total Assets 424.6 415.1
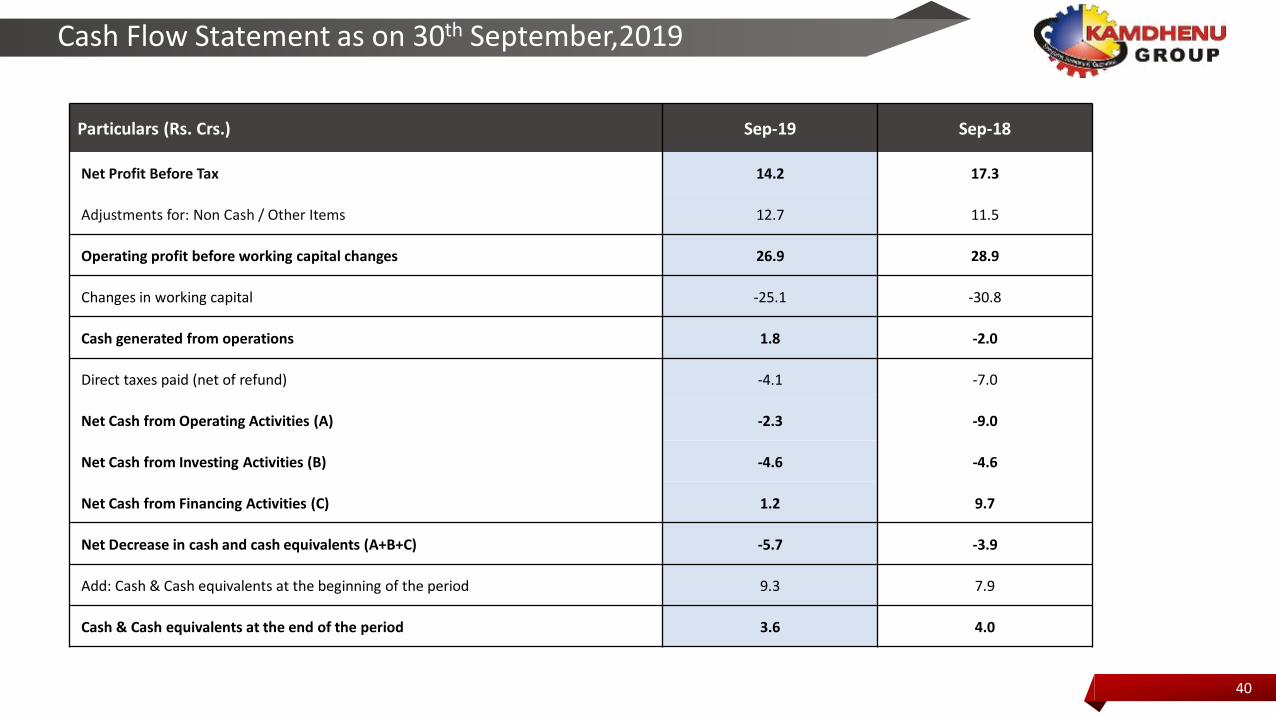
Cash Flow Statement as on 30th September,2019
40
Particulars (Rs. Crs.) Sep-19 Sep-18
Net Profit Before Tax 14.2 17.3
Adjustments for: Non Cash / Other Items 12.7 11.5
Operating profit before working capital changes 26.9 28.9
Changes in working capital -25.1 -30.8
Cash generated from operations 1.8 -2.0
Direct taxes paid (net of refund) -4.1 -7.0
Net Cash from Operating Activities (A) -2.3 -9.0
Net Cash from Investing Activities (B) -4.6 -4.6
Net Cash from Financing Activities (C) 1.2 9.7
Net Decrease in cash and cash equivalents (A+B+C) -5.7 -3.9
Add: Cash & Cash equivalents at the beginning of the period 9.3 7.9
Cash & Cash equivalents at the end of the period 3.6 4.0
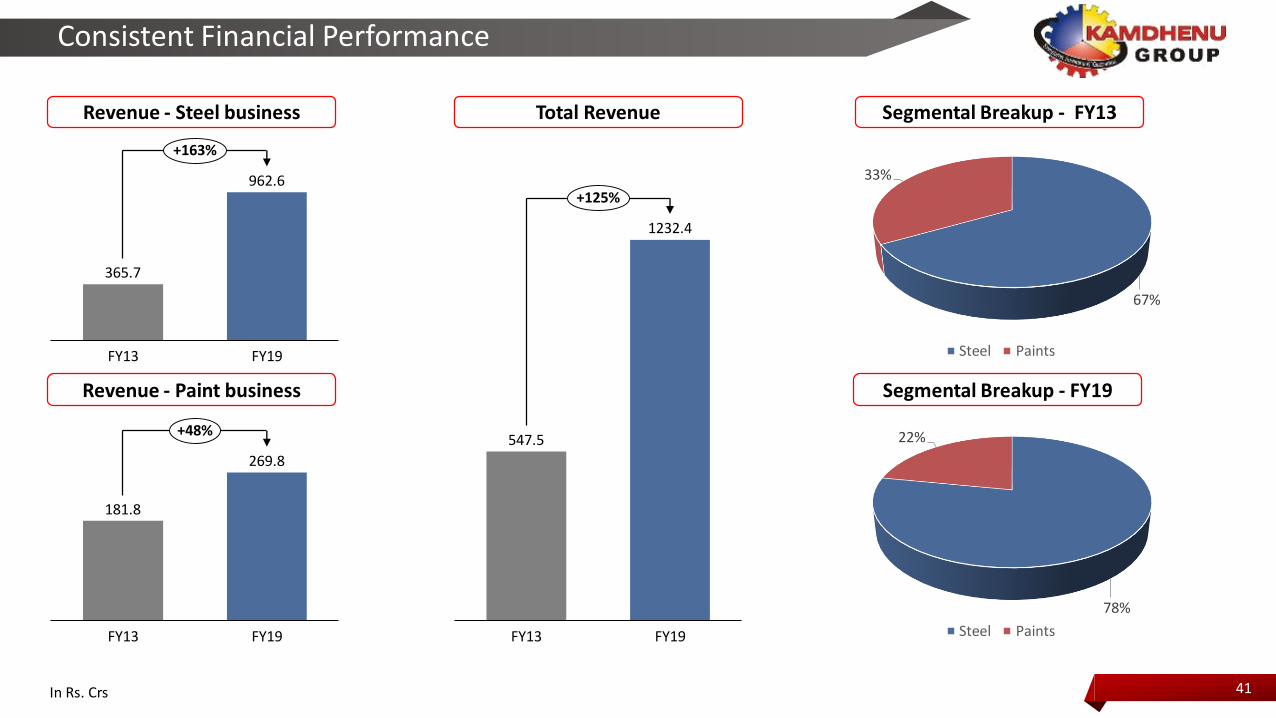
Consistent Financial Performance
547.5
1232.4
FY13 FY19
+125%
Revenue - Steel business
41
Segmental Breakup - FY13Total Revenue
Segmental Breakup - FY19Revenue - Paint business
365.7
962.6
FY13 FY19
+163%
181.8
269.8
FY13 FY19
+48%
67%
33%
Steel Paints
78%
22%
Steel Paints
In Rs. Crs
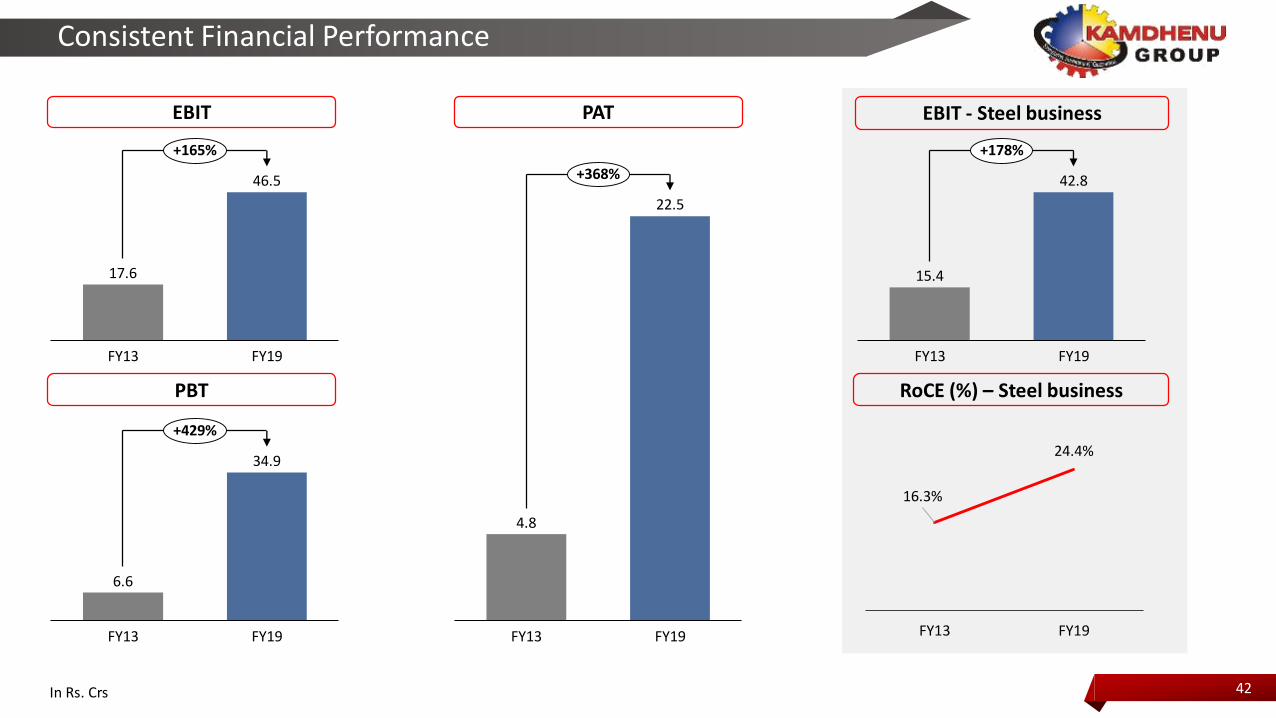
Consistent Financial Performance
4.8
22.5
FY19FY13
+368%
In Rs. Crs
EBIT
42
EBIT - Steel businessPAT
RoCE (%) – Steel businessPBT
6.6
34.9
FY19FY13
+429%
15.4
42.8
FY13 FY19
+178%
16.3%
24.4%
FY13 FY19
17.6
46.5
FY13 FY19
+165%
43
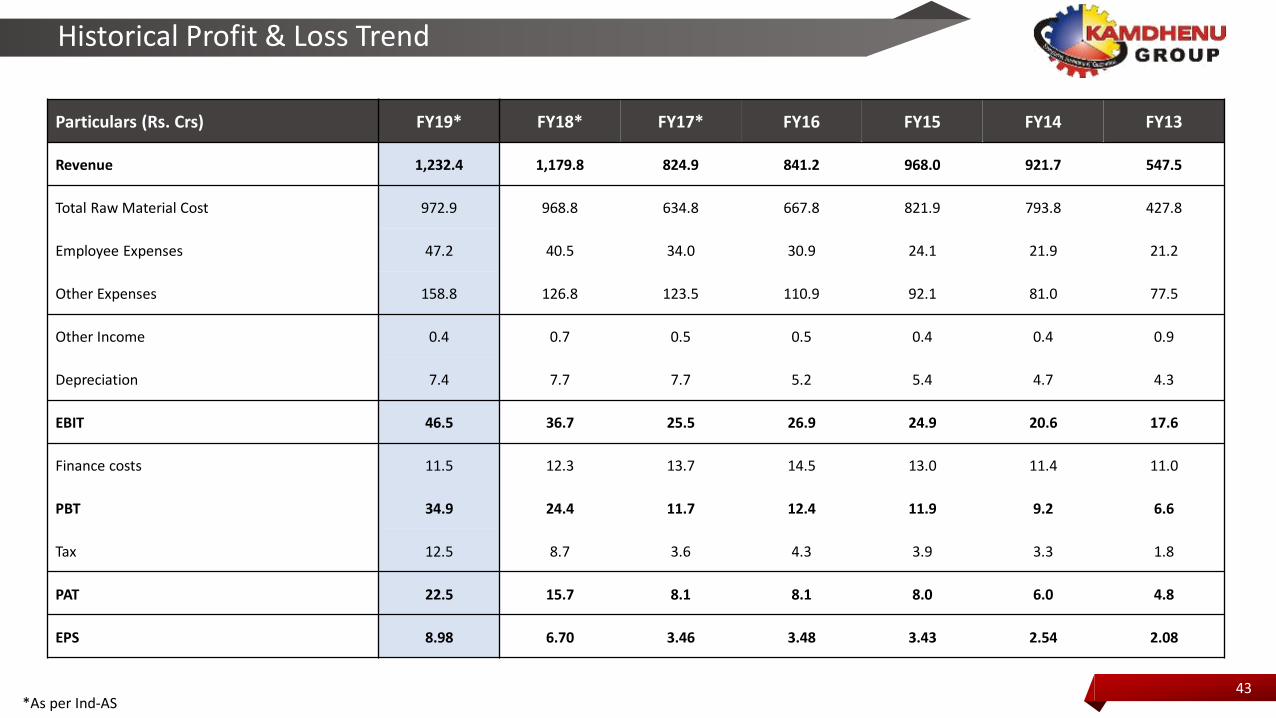
Historical Profit & Loss Trend
Particulars (Rs. Crs) FY19* FY18* FY17* FY16 FY15 FY14 FY13
Revenue 1,232.4 1,179.8 824.9 841.2 968.0 921.7 547.5
Total Raw Material Cost 972.9 968.8 634.8 667.8 821.9 793.8 427.8
Employee Expenses 47.2 40.5 34.0 30.9 24.1 21.9 21.2
Other Expenses 158.8 126.8 123.5 110.9 92.1 81.0 77.5
Other Income 0.4 0.7 0.5 0.5 0.4 0.4 0.9
Depreciation 7.4 7.7 7.7 5.2 5.4 4.7 4.3
EBIT 46.5 36.7 25.5 26.9 24.9 20.6 17.6
Finance costs 11.5 12.3 13.7 14.5 13.0 11.4 11.0
PBT 34.9 24.4 11.7 12.4 11.9 9.2 6.6
Tax 12.5 8.7 3.6 4.3 3.9 3.3 1.8
PAT 22.5 15.7 8.1 8.1 8.0 6.0 4.8
EPS 8.98 6.70 3.46 3.48 3.43 2.54 2.08
*As per Ind-AS
For further Information, please contact :
CIN: L27101DL1994PLC134282
Mr. Harish Kumar AgarwalGroup CFO & Head-Legal
www.kamdhenulimited.com
CIN: U74140MH2010PTC204285
Mr. Deven Dhruva / Mr. Rohan Adhiya+91 9833373300 / +91 9833219522
[email protected] / [email protected]
www.sgapl.net
44