capital market - nse
TRANSCRIPT
www.nseindia.com
Capital Market ISMR 76
Capital Market
Introduction
After the securities are issued in the primary market, they are traded in the secondary market by the investors. The stock exchanges along with a host of other intermediaries provide the necessary platform for trading in secondary market and also for clearing and settlement. The securities are traded, cleared and settled within the regulatory framework prescribed by the Exchanges and the SEBI. The Exchange has laid down rules and guidelines for various intermediaries with regards to the admission and Fee structure for Trading Members, listing criteria and listing fees for companies.
With the increased application of information technology, the trading platforms of stock exchanges are accessible from anywhere in the country through their trading terminals. The trading platforms are also accessible through internet. In a geographically widespread country like India, this has signifi cantly expanded the reach of the exchanges.
Trading MechanismNSE was the fi rst stock exchange in the country set up as a national exchange having nation-wide access with fully automated screen based trading system. Today, NSE has become the largest exchange in India with approximately 67% of the trading volumes on it. It is one of the very few exchanges in the world to also have adopted anonymous order matching system. The member punches in the NEAT system, the details of his order such as the quantities and prices of securities at which he desires to transact. The transaction is executed as soon as it fi nds a matching sale or buy order from a counter party. All the orders are electronically matched on a price/time priority basis. This has resulted in a considerable reduction in time spent, cost and risk of error, as well as frauds, resulting in improved operational effi ciency. It allows for faster incorporation of price sensitive information into prevailing prices, as the market participants can see the full market on real time basis. This increases informational effi ciency and makes the market more transparent. Further, the system allows a large number of participants, irrespective of their geographical locations, to trade with one another simultaneously, improving the depth and liquidity of the market. A single consolidated order book for each stock displays, on a real time basis, buy and sell orders originating from all over the country. The book stores only limit orders, which are orders to buy or sell shares at a stated quantity and stated price and are executed only if the price quantity conditions match. Thus, the NEAT system provides an Open Electronic Consolidated Limit Order Book (OECLOB), which ensures full anonymity by accepting orders, big or small, from members without revealing their identity. The NEAT System also provides equal access to all the investors. A perfect audit trail, which helps to resolve disputes by logging in the trade execution process in entirety, is also provided. Technology was used to carry the trading platform from the trading hall of stock exchanges to the premises of brokers. NSE carried the trading platform further to the PCs at the residence of investors through the Internet .
TrendsAll the 19 Stock Exchanges in India have been demutualised under the Corporatisation and Demutualisation Scheme of SEBI. More than 99 % of the turnover however is mainly from NSE and BSE. The coherent contribution of the Cash Market segment in the Indian Securities Market continued during the fi scal 2007-08. This segment witnessed a phenomenal growth of 76.80 % in the trading volumes (BSE and NSE) in comparison to the previous fi scal. The Nifty and Sensex posted a year on year returns of 19.68 % and 23.89 % respectively.
www.nseindia.com
Capital Market ISMR77
Policy DevelopmentsOver the past years the Government and the market regulators have taken several policy measures to improve the operations of the stock exchanges and market intermediaries. The measures are aimed at improving the market infrastructure and upgradation of risk containment, so as to protect the interest of the investors. The recent policy developments (April 2008 to August 2008) pertaining to trading of securities are enumerated below.
I Short selling and securities lending and borrowing
Pursuant to the recommendations of the Secondary Market Advisory Committee (SMAC) of SEBI and the decision of the SEBI Board, it was decided to permit all classes of investors to short sell. Accordingly the broad frame work for the same was provided vide SEBI circular SEBI/ MRD/DoP/SE/Dep/Cir- 14 /2007 dated December 20, 2007.
It was also decided in consultation with Government of India and SEBI, to permit Foreign Institutional Investors (FIIs) registered with SEBI and sub-accounts of FIIs to short sell, lend and borrow equity shares of Indian companies. Short selling, lending and borrowing of equity shares of Indian companies would be subject to such conditions as may be prescribed in that behalf by the Reserve Bank and the SEBI / other regulatory agencies from time to time.
The above permission would be subjected to the following conditions:
(i) The FII participation in short selling as well as borrowing / lending of equity shares would be subject to the current FDI policy and short selling of equity shares by FIIs would not be permitted for equity shares which are in the ban list and / or caution list of Reserve Bank.
(ii) Borrowing of equity shares by FIIs would only be for the purpose of delivery into short sale.
(iii) The margin / collateral would be maintained by FIIs only in the form of cash. No interest would be paid to the FII on such margin/collateral.
The designated custodian banks would separately report all transactions pertaining to short selling of equity shares and lending and borrowing of equity shares by FIIs in their daily reporting with a suitable remark (short sold / lent / borrowed equity shares) for the purpose of monitoring by RBI
Thereafter it was decided to operationalise Short selling and securities lending and borrowing from Monday, April 21, 2008.
II. Introduction of Direct Market Access facility
Direct Market Access (DMA) is a facility which allows brokers to offer clients direct access to the exchange trading system through the broker’s infrastructure without manual intervention by the broker. Some of the advantages offered by DMA are direct control of clients over orders, faster execution of client orders, reduced risk of errors associated with manual order entry, greater transparency, increased liquidity, lower impact costs for large orders, better audit trails and better use of hedging and arbitrage opportunities through the use of decision support tools / algorithms for trading. While ensuring conformity with the provisions of the Securities Contract (Regulations) Act, 1956 (42 of 1956), Stock Exchanges are required facilitate Direct Market Access for investors subject to the following conditions:
1. Application for Direct Market Access (DMA) facility
• Brokers interested to offer DMA facility would be required to apply to the respective stock exchanges giving details of the software and systems proposed to be used, which should be duly certifi ed by a Security Auditor as reliable.
• The stock exchange would have to grant approval or reject the application as the case may be, and communicate its decision to the member within 30 calendar days of the date of completed application submitted to the exchange.
www.nseindia.com
Capital Market ISMR 78
• The stock exchange, before giving permission to brokers to offer DMA facility would have to ensure the fulfi llment of the applicable conditions
2. Operational specifi cations
• All DMA orders are required to be routed to the exchange trading system through the broker’s trading system. The broker’s server routing DMA orders to the exchange trading system should be located in India.
• The broker are required to ensure sound audit trail for all DMA orders and trades, and be able to provide identifi cation of actual user-id for all such orders and trades. The audit trail data should available for at least 5 years.
• Exchanges should be able to identify and distinguish DMA orders and trades from other orders and trades. Exchanges should maintain statistical data on DMA trades and provide information on the same to SEBI on a need basis.
• The DMA system should have suffi cient security features including password protection for the user ID, automatic expiry of passwords at the end of a reasonable duration, and reinitialisation of access on entering fresh passwords.
• Brokers would be required to follow the similar logic/priorities used by the Exchange to treat DMA client orders. Brokers would have to maintain all activities/ alerts log with audit trail facility. The DMA Server should have internally generated unique numbering for all such client order/trades.
• A systems audit of the DMA systems and software should be periodically carried out by the broker as may be specifi ed by the exchange and certifi cate in this regard should be submitted to the exchange.
• The exchanges and brokers would have to provide for adequate systems and procedures to handle the DMA trades.
3. Client Authorization and Broker – Client agreement
• Exchanges should specify from time to time the categories of investors to whom the DMA facility can be extended. Initially, the permission is restricted to institutional clients.
• Brokers should specifi cally authorize clients for providing DMA facility after fulfi lling Know Your Client requirements and carrying out due diligence regarding clients’ credit worthiness, risk taking ability, track record of compliance and fi nancial soundness.
• Brokers should ensure that only those clients who are deemed fi t and proper for this facility are allowed access to the DMA facility. Brokers should maintain proper records of such due diligence. Individual users at the client end would also be authorized by the broker based on minimum criteria. The records of user details, user-id and such authorization would be maintained by the broker. Details of all user-ids activated for DMA should be provided by the broker to the exchange.
• The broker should enter into a specifi c agreement with the clients for whom they permit DMA facility. This agreement should include the following safeguards:
a) The client shall use the DMA facility only to execute his own trades and shall not use it for transactions on behalf of any other person / entity.
b) Electronic/Automated Risk management at the broker’s level before release of order to the Exchange system. The client should agree to be bound by the various limits that the broker should impose for usage of the DMA facility.
c) Right to withdraw DMA facility if the limits set up are breached or for any other such concerns
d) Withdrawal of DMA facility on account of any misuse or on instructions from SEBI/Exchange.
www.nseindia.com
Capital Market ISMR79
Exchanges should prepare a model agreement for this purpose. The broker’s agreement with clients should not have any clause that is less stringent/contrary to the conditions stipulated in the model agreement.
4. Risk Management
The broker should ensure that trading limits/ exposure limits/ position limits are set for all DMA clients based on risk assessment, credit quality and available margins of the client. The broker system should have appropriate authority levels to ensure that the limits can be set up only by persons authorized by the risk / compliance manager.
The broker should ensure that all DMA orders are routed through electronic/automated risk management systems of the broker to carry out appropriate validations of all risk parameters including Quantity Limits, Price Range Checks, Order Value, and Credit Checks before the orders are released to the Exchange. All DMA orders should be subjected to the following limits:
a) Order quantity / order value limit in terms of price and quantity specifi ed for the client.
b) All the position limits which are specifi ed in the derivatives segment as applicable.
c) Net position that can be outstanding so as to fully cover the risk emanating from the trades with the available margins of the specifi c client.
d) Appropriate limits for securities which are subject to FII limits as specifi ed by RBI.
The broker may provide for additional risk management parameters as they may consider appropriate.
5. Broker to be liable for DMA trades
The broker should be fully responsible and liable for all orders emanating through their DMA systems. It shall be the responsibility of the broker to ensure that only clients who fulfi ll the eligibility criteria are permitted to use the DMA facility
6. Cross Trades
Brokers using DMA facility for routing client orders should not be allowed to cross trades of their clients with each other. All orders must be offered to the market for matching.
7. Other legal provisions
In addition to the requirements mentioned above, all existing obligations of the broker as per current regulations and circulars should continue without change. Exchanges may also like to specify additional safeguards / conditions as they may deem fi t for allowing DMA facilities to their brokers.
Market Design1€
Stock ExchangesAt the end of March 2008, there were 19 stock exchanges registered with SEBI having a total of 8,517 registered brokers and 43,874 registered sub-brokers trading on them (Annexure 4-1). The stock exchanges need to be recognized under the Securities Contracts (Regulation) Act, 1956. There are 19 stock exchanges in India. The Securities and Exchange Board of India (SEBI), has approved and notifi ed the Corporatisation and Demutualisation Scheme of 19 Stock Exchanges. BSE has successfully completed the process of Demutualisation in terms of The BSE (Corporatisation and Demutualisation) Scheme, 2005 on May 16, 2007. NSE since inception has adopted a demutualised structure and its model of demutualization compares well with the international models of demutualised stock exchanges as seen from (Table 4-1).
1 € While an attempt has been made to present market design for the entire Indian Securities Market, the trading mechanism and such other ex-change – specifi c elements have been explained on the model adopted by NSE. The market developments have been explained, mostly for the two largest stock exchanges, viz NSE and BSE. Wherever data permits, an all-India picture has been presented.
www.nseindia.com
Capital Market ISMR 80
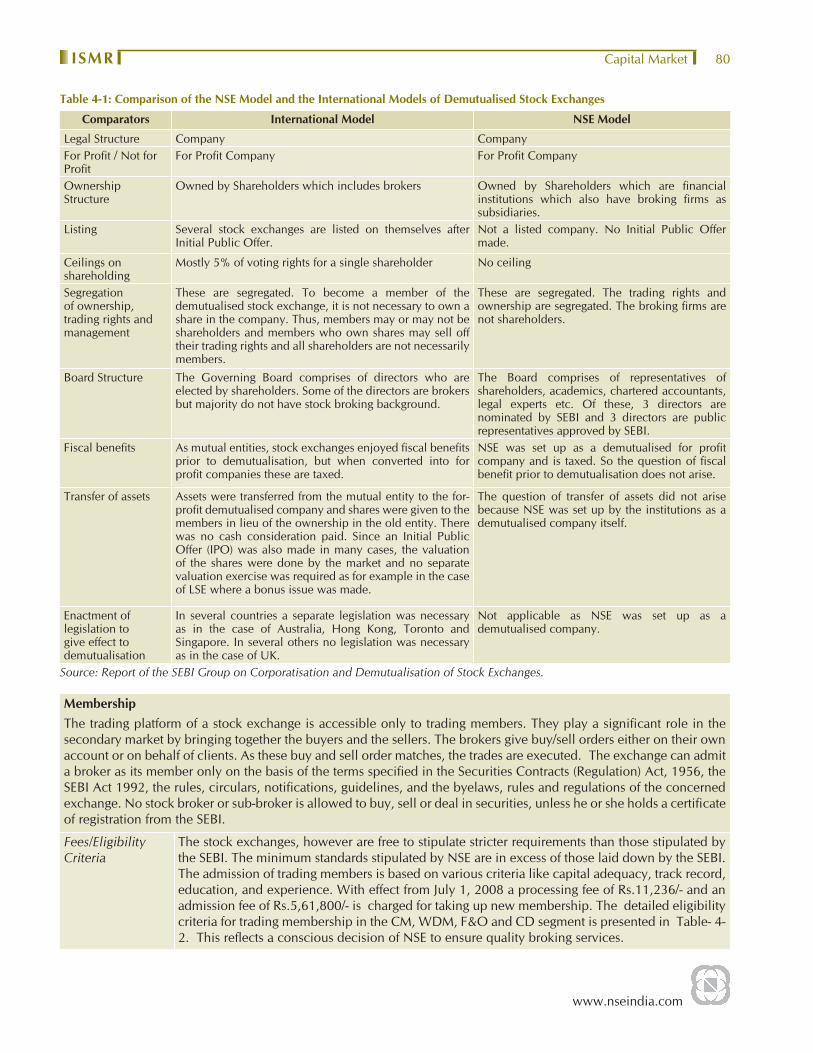
Table 4-1: Comparison of the NSE Model and the International Models of Demutualised Stock Exchanges
Comparators International Model NSE Model
Legal Structure Company CompanyFor Profi t / Not for Profi t
For Profi t Company For Profi t Company
Ownership Structure
Owned by Shareholders which includes brokers Owned by Shareholders which are fi nancial institutions which also have broking fi rms as subsidiaries.
Listing Several stock exchanges are listed on themselves after Initial Public Offer.
Not a listed company. No Initial Public Offer made.
Ceilings on shareholding
Mostly 5% of voting rights for a single shareholder No ceiling
Segregation of ownership, trading rights and management
These are segregated. To become a member of the demutualised stock exchange, it is not necessary to own a share in the company. Thus, members may or may not be shareholders and members who own shares may sell off their trading rights and all shareholders are not necessarily members.
These are segregated. The trading rights and ownership are segregated. The broking fi rms are not shareholders.
Board Structure The Governing Board comprises of directors who are elected by shareholders. Some of the directors are brokers but majority do not have stock broking background.
The Board comprises of representatives of shareholders, academics, chartered accountants, legal experts etc. Of these, 3 directors are nominated by SEBI and 3 directors are public representatives approved by SEBI.
Fiscal benefi ts As mutual entities, stock exchanges enjoyed fi scal benefi ts prior to demutualisation, but when converted into for profi t companies these are taxed.
NSE was set up as a demutualised for profi t company and is taxed. So the question of fi scal benefi t prior to demutualisation does not arise.
Transfer of assets Assets were transferred from the mutual entity to the for-profi t demutualised company and shares were given to the members in lieu of the ownership in the old entity. There was no cash consideration paid. Since an Initial Public Offer (IPO) was also made in many cases, the valuation of the shares were done by the market and no separate valuation exercise was required as for example in the case of LSE where a bonus issue was made.
The question of transfer of assets did not arise because NSE was set up by the institutions as a demutualised company itself.
Enactment of legislation to give effect to demutualisation
In several countries a separate legislation was necessary as in the case of Australia, Hong Kong, Toronto and Singapore. In several others no legislation was necessary as in the case of UK.
Not applicable as NSE was set up as a demutualised company.
Source: Report of the SEBI Group on Corporatisation and Demutualisation of Stock Exchanges.
MembershipThe trading platform of a stock exchange is accessible only to trading members. They play a signifi cant role in the secondary market by bringing together the buyers and the sellers. The brokers give buy/sell orders either on their own account or on behalf of clients. As these buy and sell order matches, the trades are executed. The exchange can admit a broker as its member only on the basis of the terms specifi ed in the Securities Contracts (Regulation) Act, 1956, the SEBI Act 1992, the rules, circulars, notifi cations, guidelines, and the byelaws, rules and regulations of the concerned exchange. No stock broker or sub-broker is allowed to buy, sell or deal in securities, unless he or she holds a certifi cate of registration from the SEBI.
Fees/Eligibility Criteria
The stock exchanges, however are free to stipulate stricter requirements than those stipulated by the SEBI. The minimum standards stipulated by NSE are in excess of those laid down by the SEBI. The admission of trading members is based on various criteria like capital adequacy, track record, education, and experience. With effect from July 1, 2008 a processing fee of Rs.11,236/- and an admission fee of Rs.5,61,800/- is charged for taking up new membership. The detailed eligibility criteria for trading membership in the CM, WDM, F&O and CD segment is presented in Table- 4-2. This refl ects a conscious decision of NSE to ensure quality broking services.
www.nseindia.com
Capital Market ISMR81
Corporatisation No of Brokers and Sub brokers
The authorities have been encouraging corporatisation of the broking industry. As a result, a number of brokers-proprietor fi rms and partnership fi rms have converted themselves into corporates. As of end March 2008, 4,190 brokers, accounting for nearly 44.17 % of total brokers have become corporate entities. Amongst those registered with NSE around 92.03 % of them were corporatised, followed by BSE with 81.08 % corporate brokers.During 2007-08, 218 new brokers were registered with SEBI, whereas 174 were membership cases of reconciliation/cancellation/surrenderAs at end-March 2008, there were 44,074 sub-brokers registered with SEBI, as compared with 27,540 sub-brokers as at end of previous year. NSE and BSE together constituted 97.02% of the total sub-brokers.
Listing of Securities : Listing means formal admission of a security to the trading platform of a stock exchange. Listing of securities on the domestic stock exchanges is governed by the provisions in the
• Companies Act, 1956, • Securities Contracts (Regulation) Act, 1956 (SC(R)A), • Securities Contracts (Regulation) Rules (SC(R)R), 1957, • Circulars/guidelines issued by Central Government and SEBI. • Rules, bye-laws and regulations of the concerned stock exchange and by the listing agreement entered into by
the issuer and the stock exchange. A number of requirements, under the SC(R)R, the byelaws, the listing agreement have to be continuously complied with by the issuers to ensure continuous listing of its securities. The listing agreement also stipulates the disclosures that have to be made by the companies. In addition, the corporate governance practices enumerated in the agreement have to be followed. The Exchange is required to monitor the compliance with requirements. In case a company fails to comply with the requirements, then trading of its security would be suspended for a specifi ed period, or withdrawal/delisting, in addition to penalty as prescribed in the SC(R)A
Key provisions of Various Acts governing the listing of securities
• The Companies Act, 1956 requires a company intending to issue securities to the public to seek permission from one or more recognised stock exchanges for its listing. If the permission is not granted by all the stock exchanges before the expiry of 10 weeks from the closure of the issue, then the allotment of securities would be void. Also, a company may prefer to appeal against refusal of a stock exchange to list its securities to the Securities Appellate Tribunal (SAT). The prospectus should state the names of the stock exchanges, where the securities are proposed to be listed.
• The byelaws of the exchanges stipulates norms for the listing of securities. All listed companies are under obligation to comply with the conditions of listing agreement with the stock exchange where their securities are listed.
• According to the Securities Contract Regulation Act 1956, for any security to be listed on any recognized stock exchange, it has to fulfi ll the eligibility criteria and comply with the regulations made by SEBI.
• The Securities Contract (Regulation) Act, 1956 prescribe requirements with respect to the listing of securities on a recognised stock exchange and empowers SEBI to waive or relax the strict enforcement of any or all of requirements with respect to listing prescribed by these rules.
• The listing agreement states that the issuer should agree to adhere to the agreement of listing, except for a written permission from SEBI. As a precondition for the security to remain listed, an issuer should comply with the conditions as may be prescribed by the Exchange. Further, the securities are listed on the Exchange at its discretion, as the Exchange has the right to suspend or remove from the list the said securities at any time and for any reason, which it considers appropriate.
www.nseindia.com
Capital Market ISMR 82
• As per SEBI provision, the basic norms of listing on the stock exchanges should be uniform across the exchanges. However, the stock exchanges can prescribe additional norms over and above the minimum, which should be part of their byelaws. SEBI has been issuing guidelines/circulars prescribing certain norms to be included in the listing agreement and to be complied by the companies. The listing requirements for companies in the CM segment of NSE are presented in ( Table 4-3).
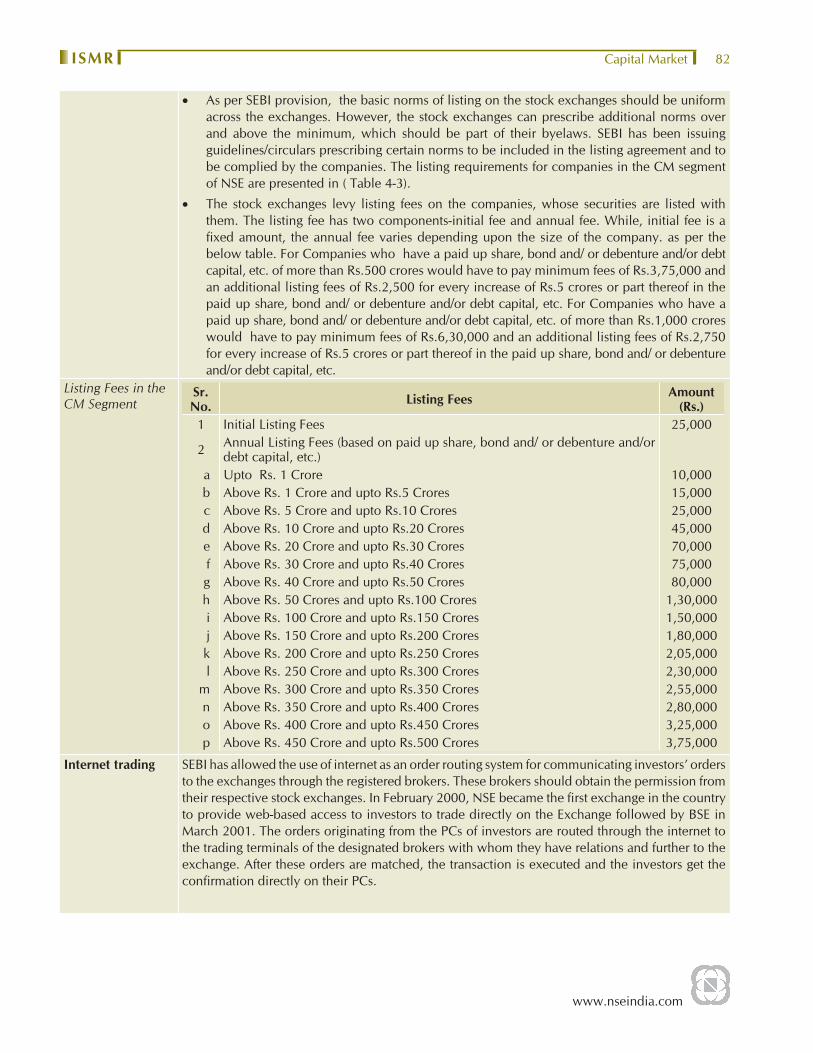
• The stock exchanges levy listing fees on the companies, whose securities are listed with them. The listing fee has two components-initial fee and annual fee. While, initial fee is a fi xed amount, the annual fee varies depending upon the size of the company. as per the below table. For Companies who have a paid up share, bond and/ or debenture and/or debt capital, etc. of more than Rs.500 crores would have to pay minimum fees of Rs.3,75,000 and an additional listing fees of Rs.2,500 for every increase of Rs.5 crores or part thereof in the paid up share, bond and/ or debenture and/or debt capital, etc. For Companies who have a paid up share, bond and/ or debenture and/or debt capital, etc. of more than Rs.1,000 crores would have to pay minimum fees of Rs.6,30,000 and an additional listing fees of Rs.2,750 for every increase of Rs.5 crores or part thereof in the paid up share, bond and/ or debenture and/or debt capital, etc.
Listing Fees in the CM Segment
Sr. No. Listing Fees Amount
(Rs.)1 Initial Listing Fees 25,000
2 Annual Listing Fees (based on paid up share, bond and/ or debenture and/or debt capital, etc.)
a Upto Rs. 1 Crore 10,000b Above Rs. 1 Crore and upto Rs.5 Crores 15,000c Above Rs. 5 Crore and upto Rs.10 Crores 25,000d Above Rs. 10 Crore and upto Rs.20 Crores 45,000e Above Rs. 20 Crore and upto Rs.30 Crores 70,000f Above Rs. 30 Crore and upto Rs.40 Crores 75,000g Above Rs. 40 Crore and upto Rs.50 Crores 80,000h Above Rs. 50 Crores and upto Rs.100 Crores 1,30,000i Above Rs. 100 Crore and upto Rs.150 Crores 1,50,000j Above Rs. 150 Crore and upto Rs.200 Crores 1,80,000k Above Rs. 200 Crore and upto Rs.250 Crores 2,05,000l Above Rs. 250 Crore and upto Rs.300 Crores 2,30,000
m Above Rs. 300 Crore and upto Rs.350 Crores 2,55,000n Above Rs. 350 Crore and upto Rs.400 Crores 2,80,000o Above Rs. 400 Crore and upto Rs.450 Crores 3,25,000p Above Rs. 450 Crore and upto Rs.500 Crores 3,75,000
Internet trading SEBI has allowed the use of internet as an order routing system for communicating investors’ orders to the exchanges through the registered brokers. These brokers should obtain the permission from their respective stock exchanges. In February 2000, NSE became the fi rst exchange in the country to provide web-based access to investors to trade directly on the Exchange followed by BSE in March 2001. The orders originating from the PCs of investors are routed through the internet to the trading terminals of the designated brokers with whom they have relations and further to the exchange. After these orders are matched, the transaction is executed and the investors get the confi rmation directly on their PCs.
www.nseindia.com
Capital Market ISMR83
Trading Regulations
Insider Trading
Insider Trading is considered as an offence and is hence prohibited as per the SEBI (Prohibition of Insider Trading) Regulations, 1992. The same was amended in the year 2003. The act prohibits an insider from dealing (on his behalf or on behalf of any other person) in securities of a company listed on any stock exchange, when in possession of any unpublished price sensitive information. Further, it has also prohibited any insider from communicating, counseling or procuring directly or indirectly any unpublished price sensitive information to any person who while in possession of such unpublished price sensitive information should not deal in securities. Price sensitive information means any information which is related directly or indirectly to a company and which if published is likely to materially affect the price of securities of a company. It includes information like periodical fi nancial results of the company, intended declaration of dividends (both interim and fi nal), issue of securities or buy-back of securities, any major expansion plans or execution of new projects, amalgamation, merger or takeovers, disposal of the whole or substantial part of the undertaking and signifi cant changes in policies, plans or operations of the company. SEBI is empowered to investigate on the basis of any complaint received from the investors, intermediaries or any other person on any matter having a bearing on the allegations of insider trading. SEBI can also investigate suo motu upon its own knowledge or information in its
Unfair Trade Practices
The SEBI (Prohibition of Fraudulent and Unfair Trade Practices relating to the Securities Market) Regulations 2003 enable SEBI to investigate into cases of market manipulation and fraudulent and unfair trade practices. The regulations specifi cally prohibit fraudulent dealings, market manipulations, misleading statements to induce sale or purchase of securities, unfair trade practices relating to securities. When SEBI has reasonable ground to believe that the transaction in securities are being dealt within a manner detrimental to the investor or the securities market in violation of these regulations and when any intermediary has violated the rules and regulations under the act then it can order to investigate the affairs of such intermediary or persons associated with the securities market. Based on the report of the investigating offi cer, SEBI can initiate action for suspension or cancellation of registration of an intermediary.
TakeoversThe restructuring of companies through takeover is governed by SEBI (Substantial Acquisition of shares and Takeover) Regulations, 1997. These regulations were formulated so that the process of acquisition and takeovers is carried out in a well-defi ned and orderly manner following the fairness and transparency.
The SEBI (Substantial Acquisition of shares and Takeover) Regulations, 1997
Chapter II ‘Disclosures of shareholding and control in a listed company’ of the SEBI (Substantial Acquisition of Shares and Takeovers) Regulations, 1997
In context of this regulation ‘acquirer’ is defi ned as a person who directly or indirectly acquires or agrees to acquire shares or voting rights in the target company or acquires or agrees to acquires ‘control’ over the target company, either by himself or with any person acting in concert with the acquirer. The term ‘control’ includes right to appoint majority of the directors or to control the management or policy decisions exercisable by any person or persons acting individually or in concert, directly or indirectly, including by virtue of their shareholding or management rights or shareholders agreements or voting agreements or in any other manner. This implies that where there are two or more persons in control over the target company, the cesser of any one of such persons from such control should not be deemed to be in control of management. Certain categories of persons are required to disclose their shareholding and/or control in a listed company to that company. Such companies, in turn, are required to disclose such details to the stock exchanges where shares of the company are listed. In case of acquisition of 5 percent and more share or voting rights of a company, an acquirer would have to disclose at every stage the aggregate of his shareholding or voting rights in that company to the company and to the stock exchange where shares of the target company are listed. No acquirer either by himself or through/with persons acting in concert with him should acquire, additional shares or voting rights unless such acquirer makes a public announcement to acquire shares in accordance with the regulations. As per the regulations, the mandatory public offer is triggered on:
www.nseindia.com
Capital Market ISMR 84
• Limit of 15 percent or more but less than 55 percent of the shares or voting rights in a company.
• Limit of 55 percent or more but less than 75 percent of the shares. In a case where the target company had obtained listing of its shares by making an offer of at least ten percent of issue size to the public in terms of the relevant clause mentioned in the Securities Contracts (Regulations) Rules 1957 or in terms of any relaxation granted from strict enforcement of the said rule, then the limit would be 90 percent instead of 75 percent. Further, if the acquire (holding 55 % more but less than 75 percent) is desirous of consolidating his holding while ensuring that the public shareholding in the target company does not fall below the minimum level permitted in the listing agreement, he may do so only by making a public announcement in accordance with these regulations.
Irrespective of whether or not there has been any acquisition of shares or voting rights in a company, no acquirer should acquire control over the target company, unless such person makes a public announcement to acquire shares and acquires such shares in accordance with the regulations.The regulations give enough scope for existing shareholders to consolidate and also cover the scenario of indirect acquisition of control. The applications for takeovers are scrutinised by the Takeover Panel constituted by the SEBI.
Buy Back Buy Back is done by the company with the purpose to improve liquidity in its shares and enhance the shareholders’ wealth. Under the SEBI (Buy Back of Securities) Regulations, 1998, a company is permitted to buy back its shares or other specifi ed securities by any of the following methods:-• From the existing security holders on a proportionate basis through the tender offer• From the open market through (i) book building process (ii) stock exchange• From odd-lot holders.The company has to disclose the pre and post-buy back holding of the promoters. To ensure completion of the buy back process speedily, the regulations have stipulated time limit for each step. For example in the cases of purchases through tender offer an offer for buy back should not remain open for more than 30 days. The company should complete the verifi cations of the offers received within 15 days of the closure of the offer and shares or other specifi ed securities. The payment for accepted securities has to be made within 7 days of the completion of verifi cation and bought back shares have to be extinguished and physically destroyed within 7 days of the date of the payment. Further, the company making an offer for buy back will have to open an escrow account on the same lines as provided in takeover regulations.
Circuit Breakers Volatility in stock prices is a cause of concern for both the policy makers and the investors. To curb excessive volatility, SEBI has prescribed a system of circuit breakers. The circuit breakers bring about a nation-wide coordinated halt in trading on all the equity and equity derivatives markets. An index based market-wide circuit breaker system applies at three stages of the index movement either way at 10%, 15% and 20%. The breakers are triggered by movement of either Nifty 50 or Sensex, whichever is breached earlier (discussed in details in chapter 5). Further, the NSE views entries of non-genuine orders with utmost seriousness as this has market-wide repercussion. It may suo-moto cancel the orders in the absence of any immediate confi rmation from the members that these orders are genuine or for any other reason as it may deem fi t. As an additional measure of safety, individual scrip-wise price bands has been fi xed as below:• Daily price bands of 2% (either way) on a set of specifi ed securities, • Daily price bands of 5% (either way) on a set of specifi ed securities, • Price bands of 20% (either way) on all remaining securities (including debentures, warrants,
preference shares etc which are traded on CM segment of NSE), • Daily price bands of 10% (either way) on specifi ed securities,• No price bands are applicable on scrips on which derivative products are available or on
scrips included in indices on which derivatives products are available.

www.nseindia.com
Capital Market ISMR85
For auction market the price bands of 20% are applicable. In order to prevent members from entering orders at non-genuine prices in these securities, the Exchange has fi xed operating range of 20% for such securities.
Demat Trading
Statistics NSDL & CDSL
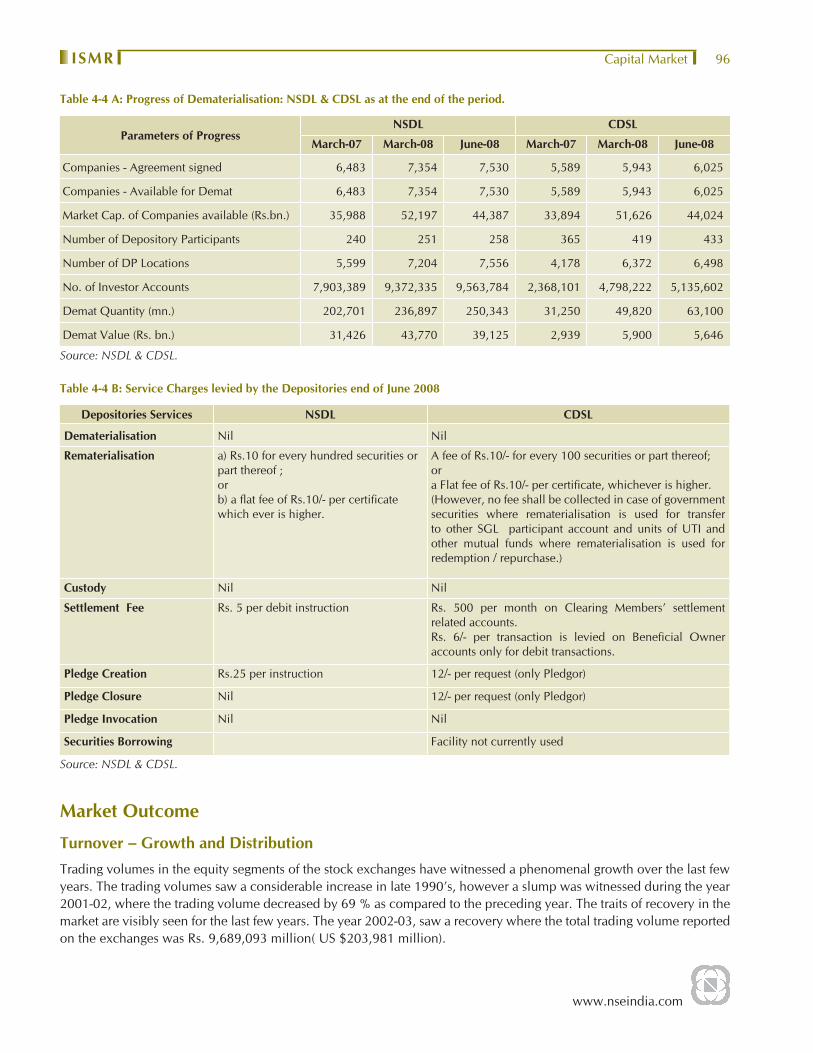
A depository holds securities in dematerialized form. It maintains ownership records of securities in a book entry form, and also effects transfer of ownership through book entry. Though, the investors have a right to hold securities in either physical or demat form, SEBI has made it compulsory that trading in securities should be only in dematerialised form. This was initially introduced for institutional investors and was later extended to all investors. Starting with twelve scrips on January 15, 1998, all investors are required to mandatorily trade in dematerialized form. The companies, which fail to establish connectivity with both the depositories on the scheduled date as announced by SEBI, then their securities are traded on the ‘trade for trade’ settlement window of the exchanges. At the end of March 2008, the number of companies connected to NSDL and CDSL were 7,354 and 5,943 respectively. The number of dematerialised securities have increased from 233.95 billion at the end of March 2007 to 286.72 billion at the end of March 2008. During the same period the value of dematerialised securities has increased by 26.59 % from Rs.34,365 billion (US $ 788 billion) to Rs.49,670 billion (US $ 1,243 billion). Since the introduction of the depository system, dematerialisation has progressed at a fast pace and has gained acceptance amongst the market participants. All actively traded scrips are held, traded and settled in demat form. The details of progress in dematerialisation in two depositories, viz. NSDL and CDSL, as at the end of March 2008 and June 2008 are presented in (Table 4-4A). The Depositories in India provide depository services to investors through Depository Participants (DPs). The Depositories do not charge the investors directly, but charge their DPs who in turn charge the clients. DPs are free to have their own charge structure for their clients. However, as per SEBI directive, DPs cannot charge investors towards opening of a Benefi ciary Owner (BO) account (except statutory charges), credit of securities into BO account and custody charges. It may be added that the depositories have been reducing its charges along with the growth in volumes. The charges levied on DPs by NSDL and CDSL are presented in (Table 4-4 B).
Charges for Services
As per SEBI Regulations, every stockbroker, on the basis of his total turnover, is required to pay annual turnover charges, which are to be collected by the stock exchanges. In order to share the benefi ts of effi ciency, NSE has been reducing the transaction charges over a period of time. A member is required to pay the exchange, transaction charges at the rate of 0.0035% (Rs. 3.5 per Rs. 1 lakh) of the turnover. Trading members are also required to pay securities transaction tax (STT) on all delivery based transaction at the rate of 0.125% (payable by both buyer and seller) and in case of non-delivery transactions at the rate of 0.025% for equities payable by the seller only). The maximum brokerage chargeable by trading member in respect of trades effected in the securities admitted to dealing on the CM segment of the Exchange is fi xed at 2.5% of the contract price, exclusive of statutory levies like, securities transaction tax, SEBI turnover fee, service tax and stamp duty. However, the brokerage charges as low as 0.15% are also observed in the marketStamp duties are payable as per the rates prescribed by the relevant states. In Maharashtra, for brokers having registered offi ce in Maharashtra, it is charged at @ Re. 1 for every Rs. 10,000 or part thereof (i.e. 0.01%) of the value of security at the time of purchase/sale as the case may be. However, if the securities are not delivered, it is levied at @ 20 paise for every Rs. 10,000 or part thereof (i.e. 0.002%).As per the Finance Bill, 2008 Stock Exchanges and Clearing House Services would be charging a service tax on services rendered by them in relation to assisting, regulating or controlling the business of buying, selling or dealing in securities and including services provided in relation to trading, processing, clearing and settlement of transactions in securities , goods and forward contracts w.e.f 16th May, 2008.
www.nseindia.com
Capital Market ISMR 86
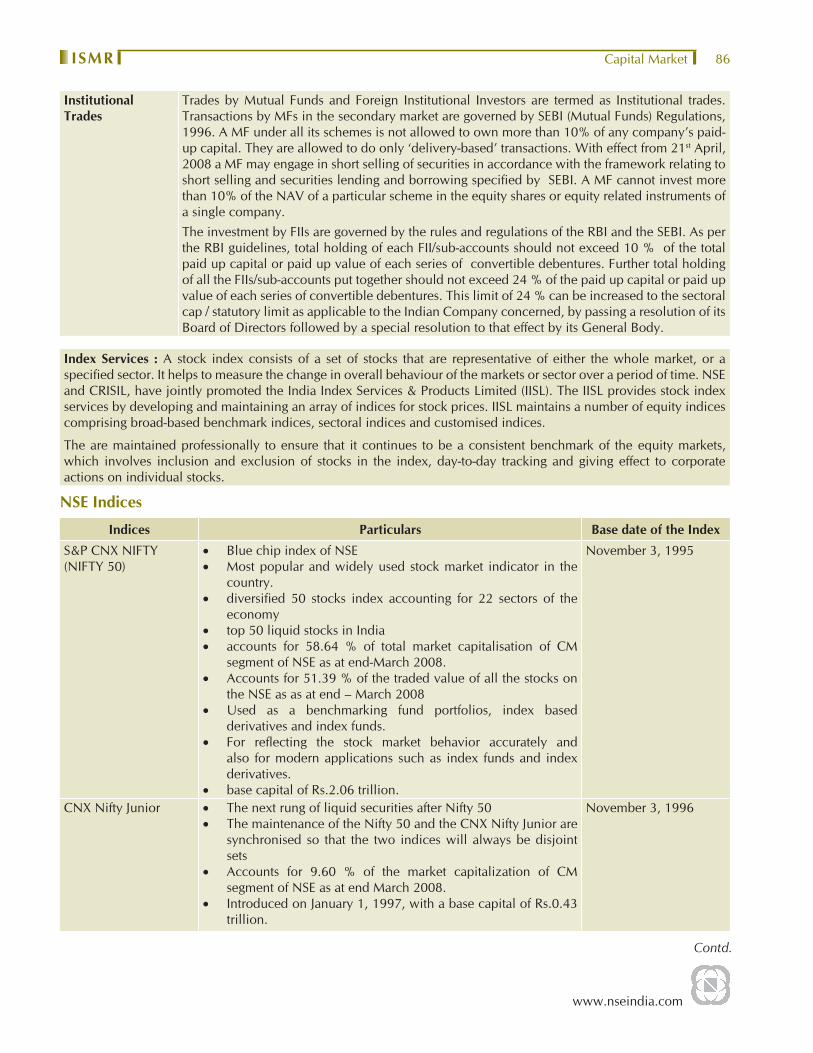
Institutional Trades
Trades by Mutual Funds and Foreign Institutional Investors are termed as Institutional trades. Transactions by MFs in the secondary market are governed by SEBI (Mutual Funds) Regulations, 1996. A MF under all its schemes is not allowed to own more than 10% of any company’s paid-up capital. They are allowed to do only ‘delivery-based’ transactions. With effect from 21st April, 2008 a MF may engage in short selling of securities in accordance with the framework relating to short selling and securities lending and borrowing specifi ed by SEBI. A MF cannot invest more than 10% of the NAV of a particular scheme in the equity shares or equity related instruments of a single company. The investment by FIIs are governed by the rules and regulations of the RBI and the SEBI. As per the RBI guidelines, total holding of each FII/sub-accounts should not exceed 10 % of the total paid up capital or paid up value of each series of convertible debentures. Further total holding of all the FIIs/sub-accounts put together should not exceed 24 % of the paid up capital or paid up value of each series of convertible debentures. This limit of 24 % can be increased to the sectoral cap / statutory limit as applicable to the Indian Company concerned, by passing a resolution of its Board of Directors followed by a special resolution to that effect by its General Body.
Index Services : A stock index consists of a set of stocks that are representative of either the whole market, or a specifi ed sector. It helps to measure the change in overall behaviour of the markets or sector over a period of time. NSE and CRISIL, have jointly promoted the India Index Services & Products Limited (IISL). The IISL provides stock index services by developing and maintaining an array of indices for stock prices. IISL maintains a number of equity indices comprising broad-based benchmark indices, sectoral indices and customised indices.
The are maintained professionally to ensure that it continues to be a consistent benchmark of the equity markets, which involves inclusion and exclusion of stocks in the index, day-to-day tracking and giving effect to corporate actions on individual stocks.
NSE Indices
Indices Particulars Base date of the IndexS&P CNX NIFTY (NIFTY 50)
• Blue chip index of NSE • Most popular and widely used stock market indicator in the
country.• diversifi ed 50 stocks index accounting for 22 sectors of the
economy• top 50 liquid stocks in India• accounts for 58.64 % of total market capitalisation of CM
segment of NSE as at end-March 2008. • Accounts for 51.39 % of the traded value of all the stocks on
the NSE as as at end – March 2008• Used as a benchmarking fund portfolios, index based
derivatives and index funds.• For refl ecting the stock market behavior accurately and
also for modern applications such as index funds and index derivatives.
• base capital of Rs.2.06 trillion.
November 3, 1995
CNX Nifty Junior • The next rung of liquid securities after Nifty 50• The maintenance of the Nifty 50 and the CNX Nifty Junior are
synchronised so that the two indices will always be disjoint sets
• Accounts for 9.60 % of the market capitalization of CM segment of NSE as at end March 2008.
• Introduced on January 1, 1997, with a base capital of Rs.0.43 trillion.
November 3, 1996
Contd.
www.nseindia.com
Capital Market ISMR87
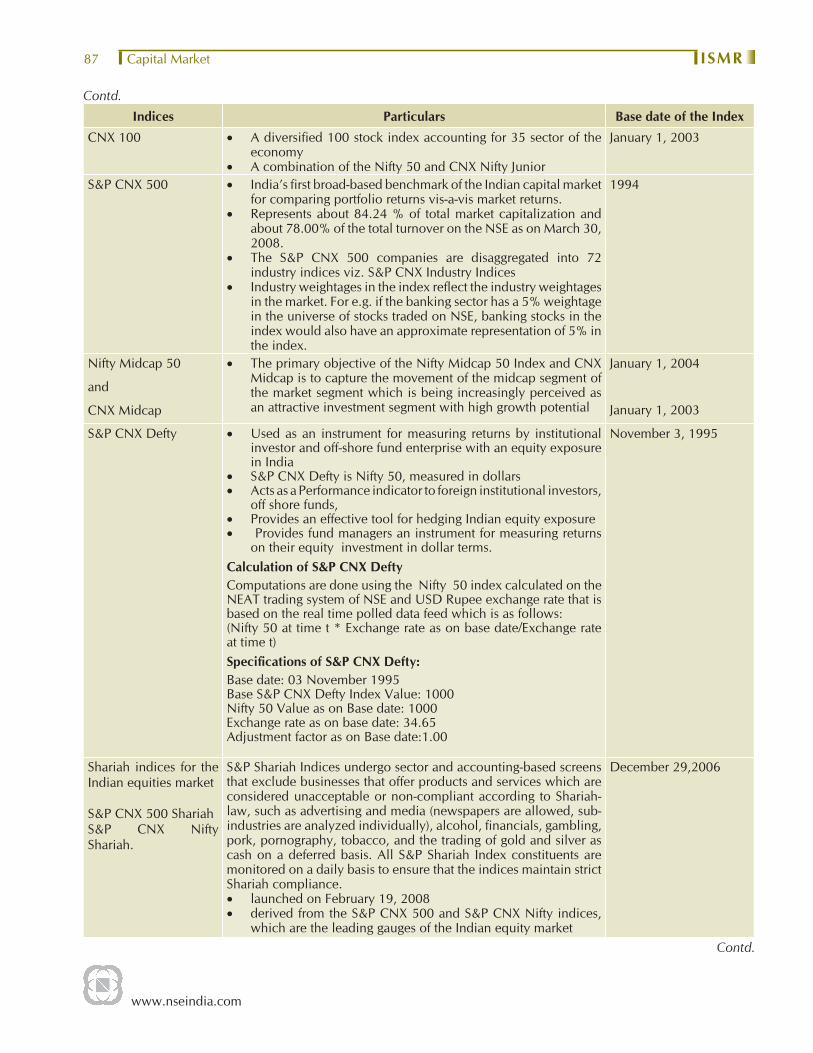
Indices Particulars Base date of the IndexCNX 100 • A diversifi ed 100 stock index accounting for 35 sector of the
economy• A combination of the Nifty 50 and CNX Nifty Junior
January 1, 2003
S&P CNX 500 • India’s fi rst broad-based benchmark of the Indian capital market for comparing portfolio returns vis-a-vis market returns.
• Represents about 84.24 % of total market capitalization and about 78.00% of the total turnover on the NSE as on March 30, 2008.
• The S&P CNX 500 companies are disaggregated into 72 industry indices viz. S&P CNX Industry Indices
• Industry weightages in the index refl ect the industry weightages in the market. For e.g. if the banking sector has a 5% weightage in the universe of stocks traded on NSE, banking stocks in the index would also have an approximate representation of 5% in the index.
1994
Nifty Midcap 50
and
CNX Midcap
• The primary objective of the Nifty Midcap 50 Index and CNX Midcap is to capture the movement of the midcap segment of the market segment which is being increasingly perceived as an attractive investment segment with high growth potential
January 1, 2004
January 1, 2003
S&P CNX Defty • Used as an instrument for measuring returns by institutional investor and off-shore fund enterprise with an equity exposure in India
• S&P CNX Defty is Nifty 50, measured in dollars• Acts as a Performance indicator to foreign institutional investors,
off shore funds, • Provides an effective tool for hedging Indian equity exposure • Provides fund managers an instrument for measuring returns
on their equity investment in dollar terms. Calculation of S&P CNX DeftyComputations are done using the Nifty 50 index calculated on the NEAT trading system of NSE and USD Rupee exchange rate that is based on the real time polled data feed which is as follows: (Nifty 50 at time t * Exchange rate as on base date/Exchange rate at time t)Specifi cations of S&P CNX Defty:Base date: 03 November 1995Base S&P CNX Defty Index Value: 1000 Nifty 50 Value as on Base date: 1000 Exchange rate as on base date: 34.65 Adjustment factor as on Base date:1.00
November 3, 1995
Shariah indices for the Indian equities market
S&P CNX 500 Shariah S&P CNX Nifty Shariah.
S&P Shariah Indices undergo sector and accounting-based screens that exclude businesses that offer products and services which are considered unacceptable or non-compliant according to Shariah-law, such as advertising and media (newspapers are allowed, sub-industries are analyzed individually), alcohol, fi nancials, gambling, pork, pornography, tobacco, and the trading of gold and silver as cash on a deferred basis. All S&P Shariah Index constituents are monitored on a daily basis to ensure that the indices maintain strict Shariah compliance.• launched on February 19, 2008• derived from the S&P CNX 500 and S&P CNX Nifty indices,
which are the leading gauges of the Indian equity market
December 29,2006
Contd.
Contd.
www.nseindia.com
Capital Market ISMR 88
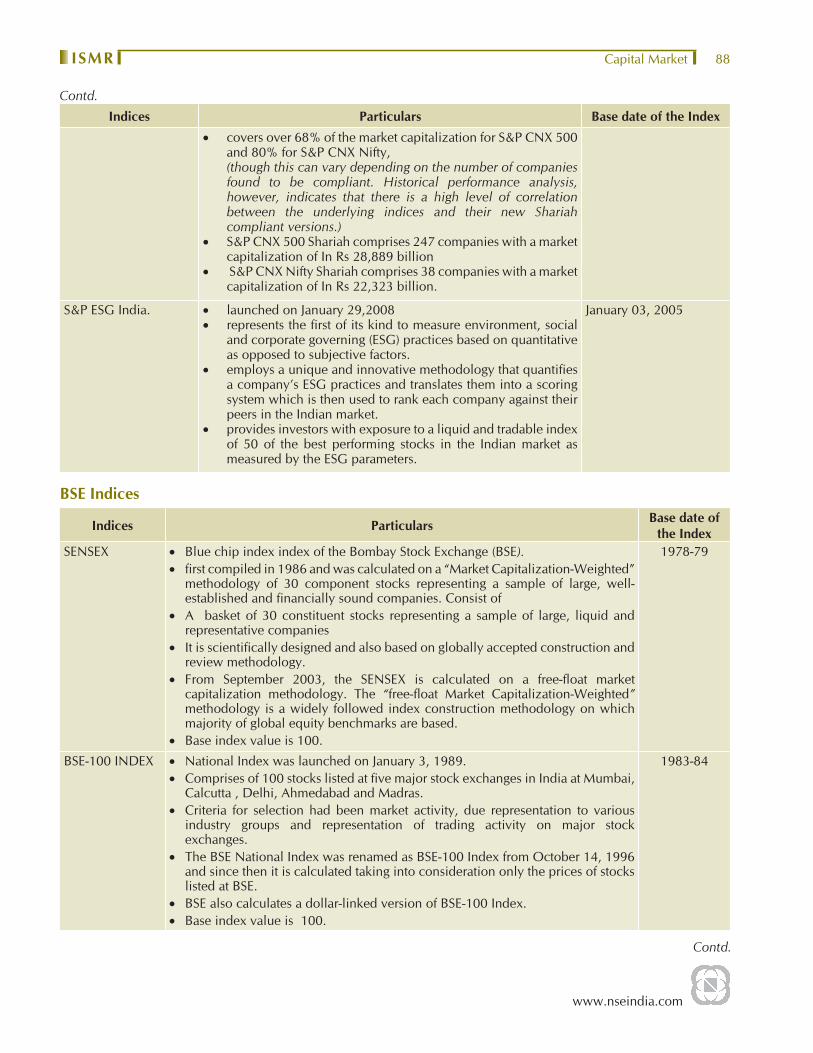
Indices Particulars Base date of the Index• covers over 68% of the market capitalization for S&P CNX 500
and 80% for S&P CNX Nifty,(though this can vary depending on the number of companies found to be compliant. Historical performance analysis, however, indicates that there is a high level of correlation between the underlying indices and their new Shariah compliant versions.)
• S&P CNX 500 Shariah comprises 247 companies with a market capitalization of In Rs 28,889 billion
• S&P CNX Nifty Shariah comprises 38 companies with a market capitalization of In Rs 22,323 billion.
S&P ESG India. • launched on January 29,2008 • represents the fi rst of its kind to measure environment, social
and corporate governing (ESG) practices based on quantitative as opposed to subjective factors.
• employs a unique and innovative methodology that quantifi es a company’s ESG practices and translates them into a scoring system which is then used to rank each company against their peers in the Indian market.
• provides investors with exposure to a liquid and tradable index of 50 of the best performing stocks in the Indian market as measured by the ESG parameters.
January 03, 2005
BSE Indices
Indices Particulars Base date of the Index
SENSEX • Blue chip index index of the Bombay Stock Exchange (BSE). • fi rst compiled in 1986 and was calculated on a “Market Capitalization-Weighted”
methodology of 30 component stocks representing a sample of large, well-established and fi nancially sound companies. Consist of
• A basket of 30 constituent stocks representing a sample of large, liquid and representative companies
• It is scientifi cally designed and also based on globally accepted construction and review methodology.
• From September 2003, the SENSEX is calculated on a free-fl oat market capitalization methodology. The “free-fl oat Market Capitalization-Weighted” methodology is a widely followed index construction methodology on which majority of global equity benchmarks are based.
• Base index value is 100.
1978-79
BSE-100 INDEX • National Index was launched on January 3, 1989. • Comprises of 100 stocks listed at fi ve major stock exchanges in India at Mumbai,
Calcutta , Delhi, Ahmedabad and Madras. • Criteria for selection had been market activity, due representation to various
industry groups and representation of trading activity on major stock exchanges.
• The BSE National Index was renamed as BSE-100 Index from October 14, 1996 and since then it is calculated taking into consideration only the prices of stocks listed at BSE.
• BSE also calculates a dollar-linked version of BSE-100 Index.• Base index value is 100.
1983-84
Contd.
Contd.
www.nseindia.com
Capital Market ISMR89
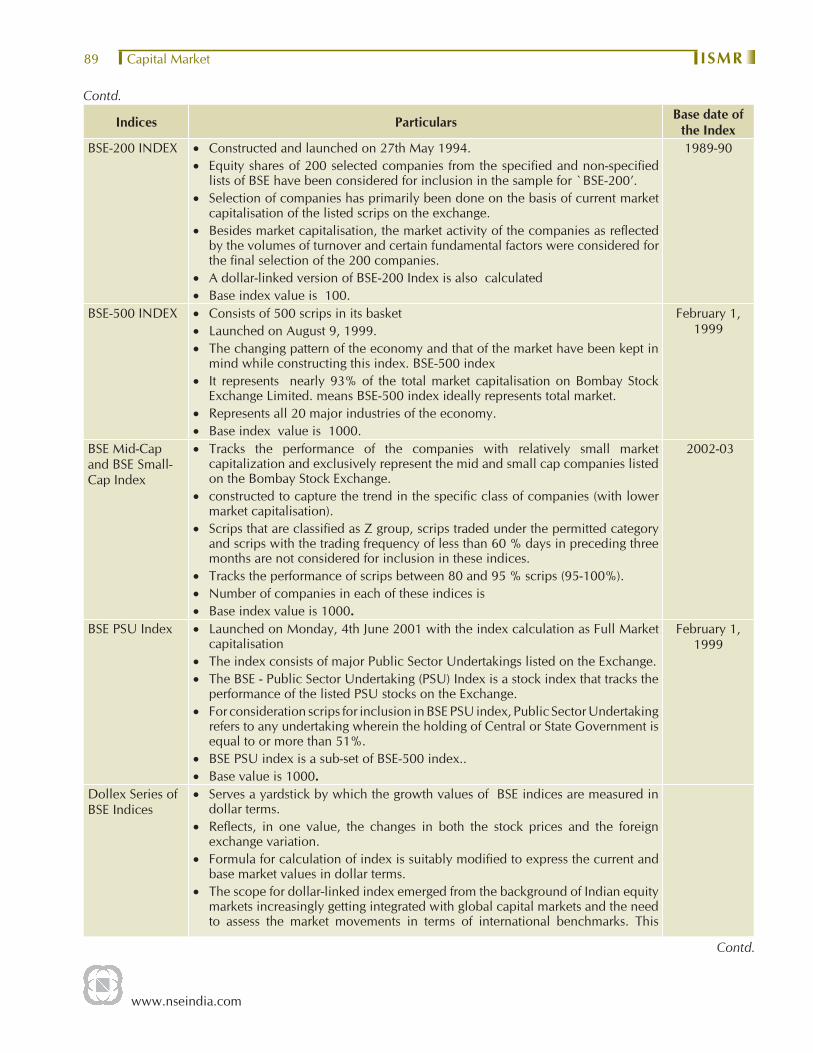
Indices Particulars Base date of the Index
BSE-200 INDEX • Constructed and launched on 27th May 1994. • Equity shares of 200 selected companies from the specifi ed and non-specifi ed
lists of BSE have been considered for inclusion in the sample for `BSE-200’. • Selection of companies has primarily been done on the basis of current market
capitalisation of the listed scrips on the exchange. • Besides market capitalisation, the market activity of the companies as refl ected
by the volumes of turnover and certain fundamental factors were considered for the fi nal selection of the 200 companies.
• A dollar-linked version of BSE-200 Index is also calculated • Base index value is 100.
1989-90
BSE-500 INDEX • Consists of 500 scrips in its basket• Launched on August 9, 1999. • The changing pattern of the economy and that of the market have been kept in
mind while constructing this index. BSE-500 index • It represents nearly 93% of the total market capitalisation on Bombay Stock
Exchange Limited. means BSE-500 index ideally represents total market. • Represents all 20 major industries of the economy. • Base index value is 1000.
February 1, 1999
BSE Mid-Cap and BSE Small-Cap Index
• Tracks the performance of the companies with relatively small market capitalization and exclusively represent the mid and small cap companies listed on the Bombay Stock Exchange.
• constructed to capture the trend in the specifi c class of companies (with lower market capitalisation).
• Scrips that are classifi ed as Z group, scrips traded under the permitted category and scrips with the trading frequency of less than 60 % days in preceding three months are not considered for inclusion in these indices.
• Tracks the performance of scrips between 80 and 95 % scrips (95-100%). • Number of companies in each of these indices is • Base index value is 1000.
2002-03
BSE PSU Index • Launched on Monday, 4th June 2001 with the index calculation as Full Market capitalisation
• The index consists of major Public Sector Undertakings listed on the Exchange. • The BSE - Public Sector Undertaking (PSU) Index is a stock index that tracks the
performance of the listed PSU stocks on the Exchange. • For consideration scrips for inclusion in BSE PSU index, Public Sector Undertaking
refers to any undertaking wherein the holding of Central or State Government is equal to or more than 51%.
• BSE PSU index is a sub-set of BSE-500 index.. • Base value is 1000.
February 1, 1999
Dollex Series of BSE Indices
• Serves a yardstick by which the growth values of BSE indices are measured in dollar terms.
• Refl ects, in one value, the changes in both the stock prices and the foreign exchange variation.
• Formula for calculation of index is suitably modifi ed to express the current and base market values in dollar terms.
• The scope for dollar-linked index emerged from the background of Indian equity markets increasingly getting integrated with global capital markets and the need to assess the market movements in terms of international benchmarks. This
Contd.
Contd.
www.nseindia.com
Capital Market ISMR 90
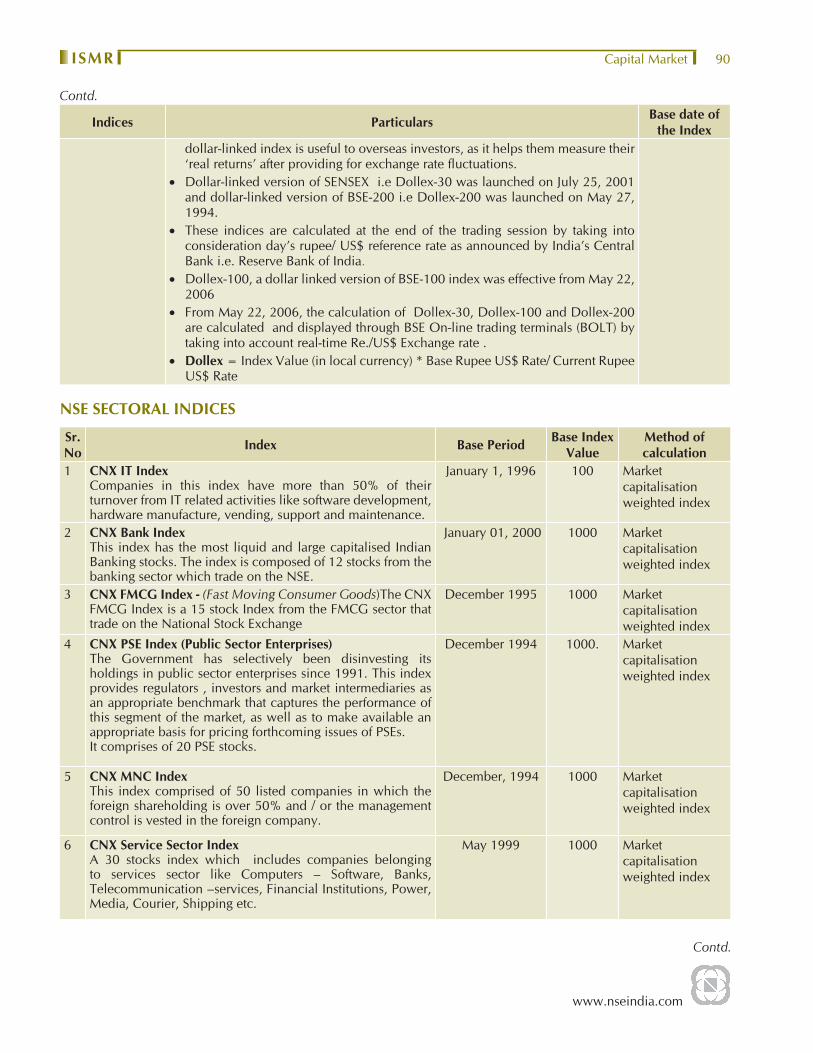
Indices Particulars Base date of the Index
dollar-linked index is useful to overseas investors, as it helps them measure their ‘real returns’ after providing for exchange rate fl uctuations.
• Dollar-linked version of SENSEX i.e Dollex-30 was launched on July 25, 2001 and dollar-linked version of BSE-200 i.e Dollex-200 was launched on May 27, 1994.
• These indices are calculated at the end of the trading session by taking into consideration day’s rupee/ US$ reference rate as announced by India’s Central Bank i.e. Reserve Bank of India.
• Dollex-100, a dollar linked version of BSE-100 index was effective from May 22, 2006
• From May 22, 2006, the calculation of Dollex-30, Dollex-100 and Dollex-200 are calculated and displayed through BSE On-line trading terminals (BOLT) by taking into account real-time Re./US$ Exchange rate .
• Dollex = Index Value (in local currency) * Base Rupee US$ Rate/ Current Rupee US$ Rate
NSE SECTORAL INDICES
Sr. No Index Base Period Base Index
ValueMethod of calculation
1 CNX IT IndexCompanies in this index have more than 50% of their turnover from IT related activities like software development, hardware manufacture, vending, support and maintenance.
January 1, 1996 100 Market capitalisation weighted index
2 CNX Bank IndexThis index has the most liquid and large capitalised Indian Banking stocks. The index is composed of 12 stocks from the banking sector which trade on the NSE.
January 01, 2000 1000 Market capitalisation weighted index
3 CNX FMCG Index - (Fast Moving Consumer Goods)The CNX FMCG Index is a 15 stock Index from the FMCG sector that trade on the National Stock Exchange
December 1995 1000 Market capitalisation weighted index
4 CNX PSE Index (Public Sector Enterprises)The Government has selectively been disinvesting its holdings in public sector enterprises since 1991. This index provides regulators , investors and market intermediaries as an appropriate benchmark that captures the performance of this segment of the market, as well as to make available an appropriate basis for pricing forthcoming issues of PSEs.It comprises of 20 PSE stocks.
December 1994 1000. Market capitalisation weighted index
5 CNX MNC IndexThis index comprised of 50 listed companies in which the foreign shareholding is over 50% and / or the management control is vested in the foreign company.
December, 1994 1000 Market capitalisation weighted index
6 CNX Service Sector IndexA 30 stocks index which includes companies belonging to services sector like Computers – Software, Banks, Telecommunication –services, Financial Institutions, Power, Media, Courier, Shipping etc.
May 1999 1000 Market capitalisation weighted index
Contd.
Contd.
www.nseindia.com
Capital Market ISMR91
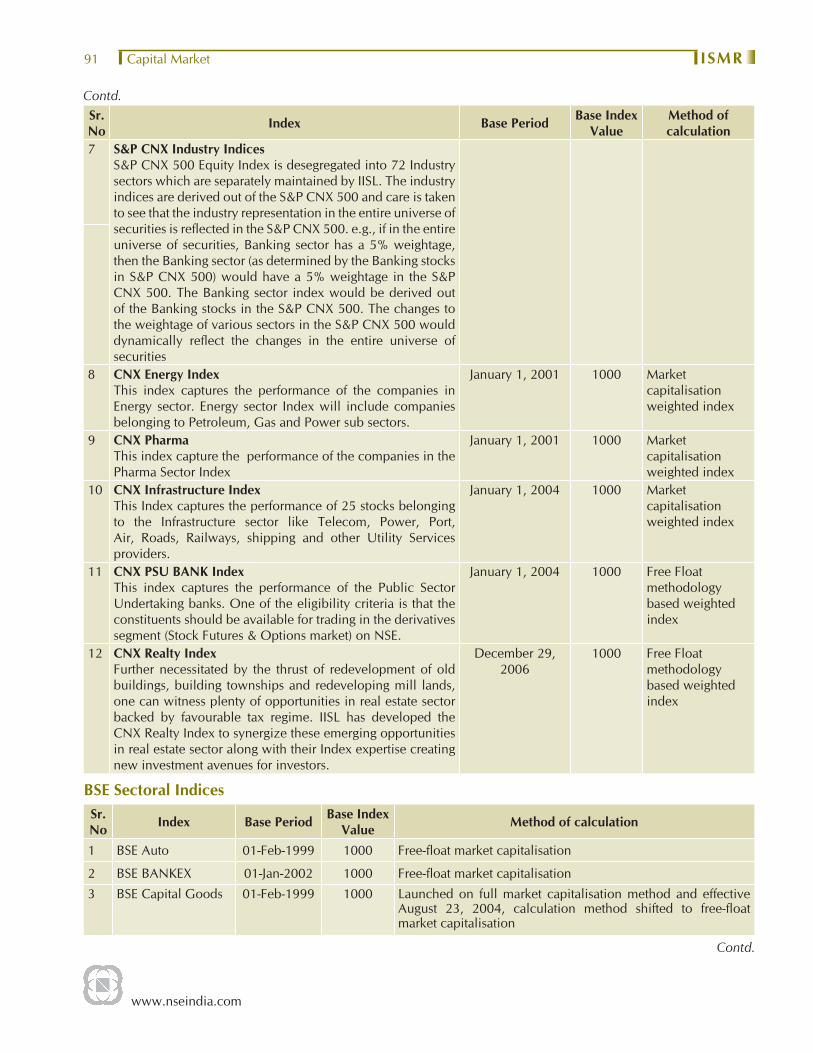
Sr. No Index Base Period Base Index
ValueMethod of calculation
7 S&P CNX Industry IndicesS&P CNX 500 Equity Index is desegregated into 72 Industry sectors which are separately maintained by IISL. The industry indices are derived out of the S&P CNX 500 and care is taken to see that the industry representation in the entire universe of securities is refl ected in the S&P CNX 500. e.g., if in the entire universe of securities, Banking sector has a 5% weightage, then the Banking sector (as determined by the Banking stocks in S&P CNX 500) would have a 5% weightage in the S&P CNX 500. The Banking sector index would be derived out of the Banking stocks in the S&P CNX 500. The changes to the weightage of various sectors in the S&P CNX 500 would dynamically refl ect the changes in the entire universe of securities
8 CNX Energy IndexThis index captures the performance of the companies in Energy sector. Energy sector Index will include companies belonging to Petroleum, Gas and Power sub sectors.
January 1, 2001 1000 Market capitalisation weighted index
9 CNX Pharma This index capture the performance of the companies in the Pharma Sector Index
January 1, 2001 1000 Market capitalisation weighted index
10 CNX Infrastructure IndexThis Index captures the performance of 25 stocks belonging to the Infrastructure sector like Telecom, Power, Port, Air, Roads, Railways, shipping and other Utility Services providers.
January 1, 2004 1000 Market capitalisation weighted index
11 CNX PSU BANK IndexThis index captures the performance of the Public Sector Undertaking banks. One of the eligibility criteria is that the constituents should be available for trading in the derivatives segment (Stock Futures & Options market) on NSE.
January 1, 2004 1000 Free Float methodology based weighted index
12 CNX Realty Index Further necessitated by the thrust of redevelopment of old buildings, building townships and redeveloping mill lands, one can witness plenty of opportunities in real estate sector backed by favourable tax regime. IISL has developed the CNX Realty Index to synergize these emerging opportunities in real estate sector along with their Index expertise creating new investment avenues for investors.
December 29, 2006
1000 Free Float methodology based weighted index
BSE Sectoral Indices Sr. No Index Base Period Base Index
Value Method of calculation
1 BSE Auto 01-Feb-1999 1000 Free-fl oat market capitalisation
2 BSE BANKEX 01-Jan-2002 1000 Free-fl oat market capitalisation
3 BSE Capital Goods 01-Feb-1999 1000 Launched on full market capitalisation method and effective August 23, 2004, calculation method shifted to free-fl oat market capitalisation
Contd.
Contd.
www.nseindia.com
Capital Market ISMR 92
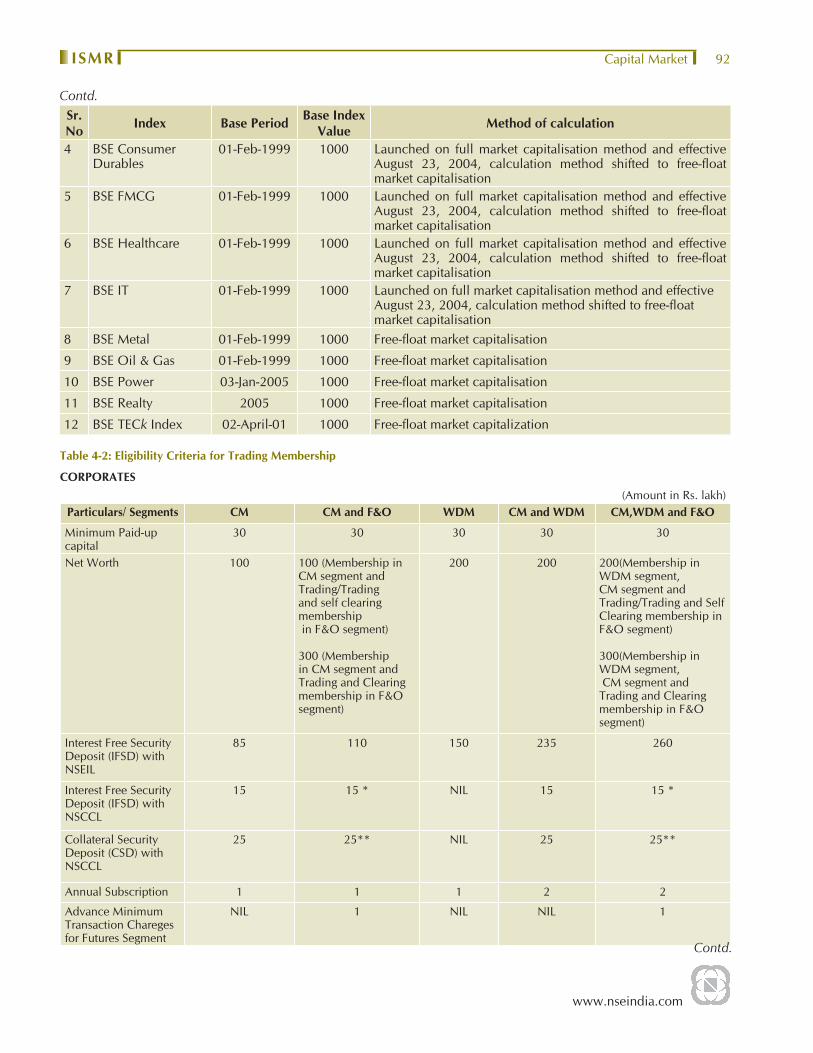
Sr. No Index Base Period Base Index
Value Method of calculation
4 BSE Consumer Durables
01-Feb-1999 1000 Launched on full market capitalisation method and effective August 23, 2004, calculation method shifted to free-fl oat market capitalisation
5 BSE FMCG 01-Feb-1999 1000 Launched on full market capitalisation method and effective August 23, 2004, calculation method shifted to free-fl oat market capitalisation
6 BSE Healthcare 01-Feb-1999 1000 Launched on full market capitalisation method and effective August 23, 2004, calculation method shifted to free-fl oat market capitalisation
7 BSE IT 01-Feb-1999 1000 Launched on full market capitalisation method and effective August 23, 2004, calculation method shifted to free-fl oat market capitalisation
8 BSE Metal 01-Feb-1999 1000 Free-fl oat market capitalisation
9 BSE Oil & Gas 01-Feb-1999 1000 Free-fl oat market capitalisation
10 BSE Power 03-Jan-2005 1000 Free-fl oat market capitalisation
11 BSE Realty 2005 1000 Free-fl oat market capitalisation
12 BSE TECk Index 02-April-01 1000 Free-fl oat market capitalization
Table 4-2: Eligibility Criteria for Trading Membership
CORPORATES(Amount in Rs. lakh)
Particulars/ Segments CM CM and F&O WDM CM and WDM CM,WDM and F&O
Minimum Paid-up capital
30 30 30 30 30
Net Worth 100 100 (Membership in CM segment and Trading/Trading and self clearing membership in F&O segment)
300 (Membership in CM segment and Trading and Clearing membership in F&O segment)
200 200 200(Membership in WDM segment, CM segment and Trading/Trading and Self Clearing membership in F&O segment)
300(Membership in WDM segment, CM segment andTrading and Clearing membership in F&O segment)
Interest Free Security Deposit (IFSD) with NSEIL
85 110 150 235 260
Interest Free Security Deposit (IFSD) with NSCCL
15 15 * NIL 15 15 *
Collateral Security Deposit (CSD) with NSCCL
25 25** NIL 25 25**
Annual Subscription 1 1 1 2 2
Advance Minimum Transaction Chareges for Futures Segment
NIL 1 NIL NIL 1
Contd.
Contd.
www.nseindia.com
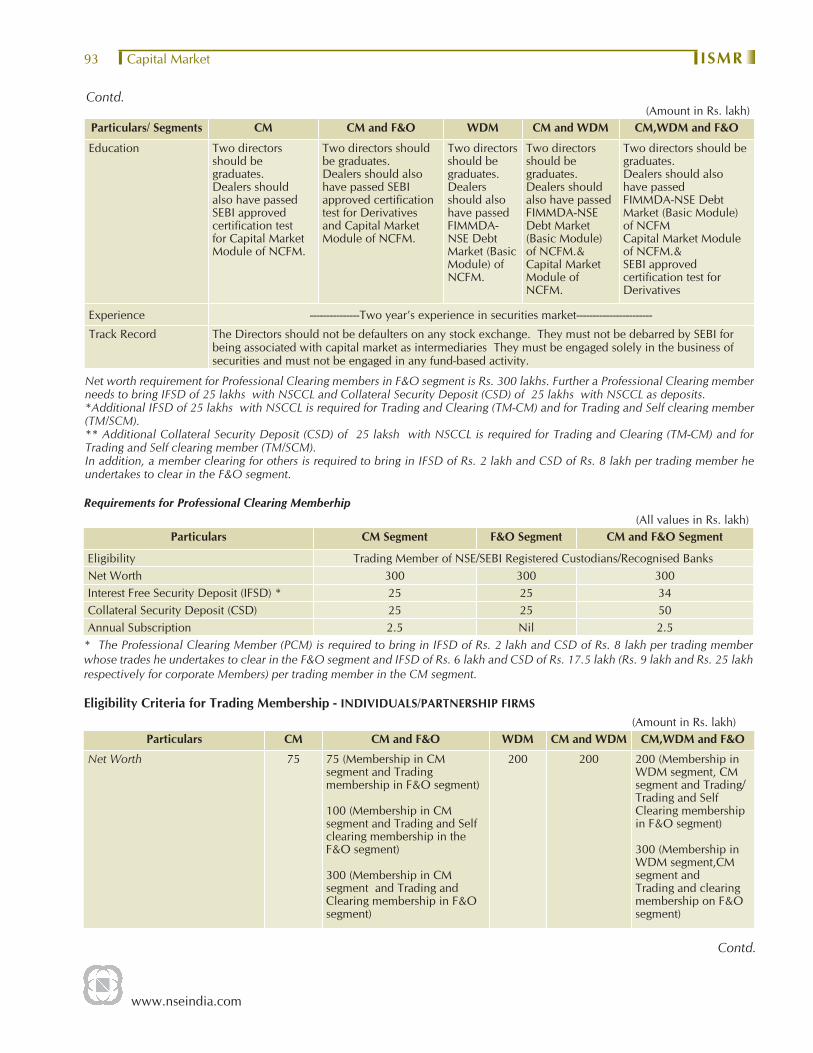
Capital Market ISMR93
(Amount in Rs. lakh)Particulars/ Segments CM CM and F&O WDM CM and WDM CM,WDM and F&O
Education Two directors should be graduates. Dealers should also have passed SEBI approved certifi cation test for Capital Market Module of NCFM.
Two directors should be graduates. Dealers should also have passed SEBI approved certifi cation test for Derivatives and Capital Market Module of NCFM.
Two directors should be graduates. Dealers should also have passed FIMMDA-NSE Debt Market (Basic Module) of NCFM.
Two directors should be graduates. Dealers should also have passed FIMMDA-NSE Debt Market (Basic Module) of NCFM.&Capital Market Module of NCFM.
Two directors should be graduates. Dealers should also have passed FIMMDA-NSE Debt Market (Basic Module) of NCFMCapital Market Module of NCFM.&SEBI approved certifi cation test for Derivatives
Experience ---------------Two year’s experience in securities market-----------------------
Track Record The Directors should not be defaulters on any stock exchange. They must not be debarred by SEBI for being associated with capital market as intermediaries They must be engaged solely in the business of securities and must not be engaged in any fund-based activity.
Net worth requirement for Professional Clearing members in F&O segment is Rs. 300 lakhs. Further a Professional Clearing member needs to bring IFSD of 25 lakhs with NSCCL and Collateral Security Deposit (CSD) of 25 lakhs with NSCCL as deposits.*Additional IFSD of 25 lakhs with NSCCL is required for Trading and Clearing (TM-CM) and for Trading and Self clearing member (TM/SCM).** Additional Collateral Security Deposit (CSD) of 25 laksh with NSCCL is required for Trading and Clearing (TM-CM) and for Trading and Self clearing member (TM/SCM).In addition, a member clearing for others is required to bring in IFSD of Rs. 2 lakh and CSD of Rs. 8 lakh per trading member he undertakes to clear in the F&O segment.
Requirements for Professional Clearing Memberhip(All values in Rs. lakh)
Particulars CM Segment F&O Segment CM and F&O Segment
Eligibility Trading Member of NSE/SEBI Registered Custodians/Recognised BanksNet Worth 300 300 300Interest Free Security Deposit (IFSD) * 25 25 34Collateral Security Deposit (CSD) 25 25 50Annual Subscription 2.5 Nil 2.5
* The Professional Clearing Member (PCM) is required to bring in IFSD of Rs. 2 lakh and CSD of Rs. 8 lakh per trading member whose trades he undertakes to clear in the F&O segment and IFSD of Rs. 6 lakh and CSD of Rs. 17.5 lakh (Rs. 9 lakh and Rs. 25 lakh respectively for corporate Members) per trading member in the CM segment.
Eligibility Criteria for Trading Membership - INDIVIDUALS/PARTNERSHIP FIRMS(Amount in Rs. lakh)
Particulars CM CM and F&O WDM CM and WDM CM,WDM and F&O
Net Worth 75 75 (Membership in CM segment and Trading membership in F&O segment)
100 (Membership in CM segment and Trading and Self clearing membership in the F&O segment)
300 (Membership in CM segment and Trading and Clearing membership in F&O segment)
200 200 200 (Membership in WDM segment, CM segment and Trading/Trading and Self Clearing membership in F&O segment)
300 (Membership in WDM segment,CM segment and Trading and clearing membership on F&O segment)
Contd.
Contd.
www.nseindia.com
Capital Market ISMR 94
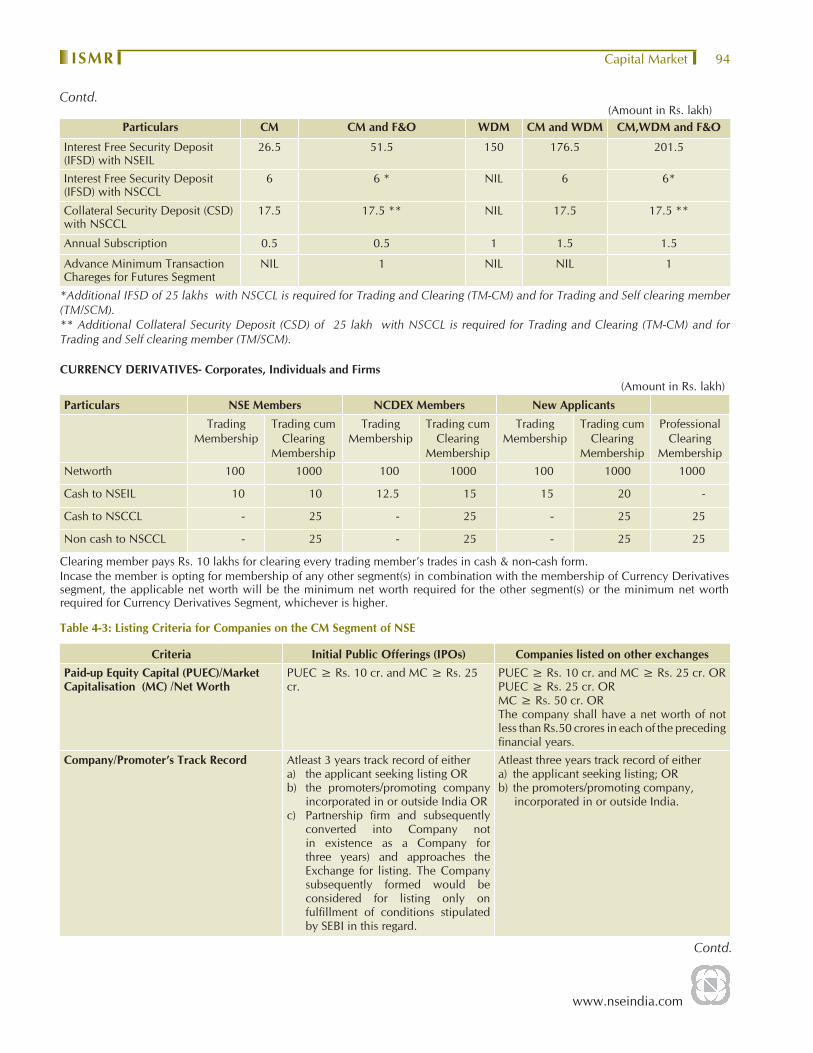
(Amount in Rs. lakh)Particulars CM CM and F&O WDM CM and WDM CM,WDM and F&O
Interest Free Security Deposit (IFSD) with NSEIL
26.5 51.5 150 176.5 201.5
Interest Free Security Deposit (IFSD) with NSCCL
6 6 * NIL 6 6*
Collateral Security Deposit (CSD) with NSCCL
17.5 17.5 ** NIL 17.5 17.5 **
Annual Subscription 0.5 0.5 1 1.5 1.5
Advance Minimum Transaction Chareges for Futures Segment
NIL 1 NIL NIL 1
*Additional IFSD of 25 lakhs with NSCCL is required for Trading and Clearing (TM-CM) and for Trading and Self clearing member (TM/SCM).** Additional Collateral Security Deposit (CSD) of 25 lakh with NSCCL is required for Trading and Clearing (TM-CM) and for Trading and Self clearing member (TM/SCM).
CURRENCY DERIVATIVES- Corporates, Individuals and Firms(Amount in Rs. lakh)
Particulars NSE Members NCDEX Members New ApplicantsTrading
MembershipTrading cum
Clearing Membership
Trading Membership
Trading cum Clearing
Membership
Trading Membership
Trading cum Clearing
Membership
Professional Clearing
MembershipNetworth 100 1000 100 1000 100 1000 1000
Cash to NSEIL 10 10 12.5 15 15 20 -
Cash to NSCCL - 25 - 25 - 25 25
Non cash to NSCCL - 25 - 25 - 25 25
Clearing member pays Rs. 10 lakhs for clearing every trading member’s trades in cash & non-cash form.Incase the member is opting for membership of any other segment(s) in combination with the membership of Currency Derivatives segment, the applicable net worth will be the minimum net worth required for the other segment(s) or the minimum net worth required for Currency Derivatives Segment, whichever is higher.
Table 4-3: Listing Criteria for Companies on the CM Segment of NSE
Criteria Initial Public Offerings (IPOs) Companies listed on other exchangesPaid-up Equity Capital (PUEC)/Market Capitalisation (MC) /Net Worth
PUEC ≥ Rs. 10 cr. and MC ≥ Rs. 25 cr.
PUEC ≥ Rs. 10 cr. and MC ≥ Rs. 25 cr. OR PUEC ≥ Rs. 25 cr. ORMC ≥ Rs. 50 cr. OR The company shall have a net worth of not less than Rs.50 crores in each of the preceding fi nancial years.
Company/Promoter’s Track Record Atleast 3 years track record of eithera) the applicant seeking listing OR b) the promoters/promoting company
incorporated in or outside India OR c) Partnership fi rm and subsequently
converted into Company not in existence as a Company for three years) and approaches the Exchange for listing. The Company subsequently formed would be considered for listing only on fulfi llment of conditions stipulated by SEBI in this regard.
Atleast three years track record of eithera) the applicant seeking listing; ORb) the promoters/promoting company,
incorporated in or outside India.
Contd.
Contd.

www.nseindia.com
Capital Market ISMR95
Criteria Initial Public Offerings (IPOs) Companies listed on other exchangesDividend Record / Net worth / Distributable Profi ts
-- Dividend paid in at least 2 out of the last 3 fi nancial years immediately preceding the year in which the application has been made OR The networth of the applicants atleast Rs.50 crores OR The applicant has distributable profi ts in at least two out of the last three fi nancial years.
Listing Listed on any other stock exchange for at least last three years OR listed on the exchange having nationwide trading terminals for at least one year.
Other Requirements (a) No disciplinary action by other stock exchanges/regulatory authority in past 3 yrs.
(b) Satisfactory redressal mechanism for investor grievances,
(c) distribution of shareholding and (d) details of llitigation record of the
promoting company, if any.(e) Track record of Directors of the
Company
(a) No disciplinary action by other stock exchanges/regulatory authority in past 3 yrs.
(b) Satisfactory redressal mechanism for investor grievances,
(c) distribution of shareholding and (d) details of llitigation record of the
promoting company, if any.(e) Track record of Directors of the
Company(f) Change in control of a Company/
Utilisation of funds raised from publicNote: 1. (a) In case of IPOs, Paid up Equity Capital means post issue paid up equity capital.
(b) In case of Existing companies listed on other exchanges, the existing paid up equity capital as well as the paid up equity capital after the proposed issue for which listing is sought shall be taken into account.
2. (a) In case of IPOs, market capitalisation is the product of the issue price and the post-issue number of equity shares.
(b) In case of case of Existing companies listed on other stock exchanges the market capitalisation shall be calculated by using a 12 month moving average of the market capitalisation over a period of six months immediately preceding the date of application. For the purpose of calculating the market capitalisation over a 12 month period, the average of the weekly high and low of the closing prices of the shares as quoted on the National Stock Exchange during the last twelve months and if the shares are not traded on the National Stock Exchange such average price on any of the recognised Stock Exchanges where those shares are frequently traded shall be taken into account while determining market capitalisation after making necessary adjustments for Corporate Action such as Rights / Bonus Issue/Split.
3. In case of Existing companies listed on other stock exchanges, the requirement of Rs.25 crores market capital shall not be applicable to listing of securities issued by Government Companies, Public Sector Undertakings, Financial Institutions, Nationalised Banks, Statutory Corporations and Banking Companies who are otherwise bound to adhere to all the relevant statutes, guidelines, circulars, clarifi cations etc. that may be issued by various regulatory authorities from time to time
4. Net worth means paid-up equity capital + reserves excluding revaluation reserve - miscellaneous expenses not written off - negative balance in profi t and loss account to the extent not set off.
5. Promoters mean one or more persons with minimum 3 years of experience of each of them in the same line of business and shall be holding at least 20 % of the post issue equity share capital individually or severally.
6. In case a company approaches the Exchange for listing within six months of an IPO, the securities may be considered as eligible for listing if they were otherwise eligible for listing at the time of the IPO. If the company approaches the Exchange for listing after six months of an IPO, the norms for existing listed companies may be applied and market capitalisation be computed based on the period from the IPO to the time of listing.
Contd.
www.nseindia.com
Capital Market ISMR 96
Table 4-4 A: Progress of Dematerialisation: NSDL & CDSL as at the end of the period.
Parameters of ProgressNSDL CDSL
March-07 March-08 June-08 March-07 March-08 June-08
Companies - Agreement signed 6,483 7,354 7,530 5,589 5,943 6,025
Companies - Available for Demat 6,483 7,354 7,530 5,589 5,943 6,025
Market Cap. of Companies available (Rs.bn.) 35,988 52,197 44,387 33,894 51,626 44,024
Number of Depository Participants 240 251 258 365 419 433
Number of DP Locations 5,599 7,204 7,556 4,178 6,372 6,498
No. of Investor Accounts 7,903,389 9,372,335 9,563,784 2,368,101 4,798,222 5,135,602
Demat Quantity (mn.) 202,701 236,897 250,343 31,250 49,820 63,100
Demat Value (Rs. bn.) 31,426 43,770 39,125 2,939 5,900 5,646
Source: NSDL & CDSL.
Table 4-4 B: Service Charges levied by the Depositories end of June 2008
Depositories Services NSDL CDSL
Dematerialisation Nil Nil
Rematerialisation a) Rs.10 for every hundred securities or part thereof ;orb) a fl at fee of Rs.10/- per certifi cate which ever is higher.
A fee of Rs.10/- for every 100 securities or part thereof; ora Flat fee of Rs.10/- per certifi cate, whichever is higher. (However, no fee shall be collected in case of government securities where rematerialisation is used for transfer to other SGL participant account and units of UTI and other mutual funds where rematerialisation is used for redemption / repurchase.)
Custody Nil Nil
Settlement Fee Rs. 5 per debit instruction Rs. 500 per month on Clearing Members’ settlement related accounts.Rs. 6/- per transaction is levied on Benefi cial Owner accounts only for debit transactions.
Pledge Creation Rs.25 per instruction 12/- per request (only Pledgor)
Pledge Closure Nil 12/- per request (only Pledgor)
Pledge Invocation Nil Nil
Securities Borrowing Facility not currently used
Source: NSDL & CDSL.
Market Outcome
Turnover – Growth and Distribution
Trading volumes in the equity segments of the stock exchanges have witnessed a phenomenal growth over the last few years. The trading volumes saw a considerable increase in late 1990’s, however a slump was witnessed during the year 2001-02, where the trading volume decreased by 69 % as compared to the preceding year. The traits of recovery in the market are visibly seen for the last few years. The year 2002-03, saw a recovery where the total trading volume reported on the exchanges was Rs. 9,689,093 million( US $203,981 million).

www.nseindia.com
Capital Market ISMR97
During 2003-04, the trading volumes registered an year-on-year increase of 67 % to Rs.16,204,974 million (US $ 373, 473 million). The volumes further increased from Rs.16,668,963 million (US $ 381,005 million) in 2004-05 to Rs.23,901,030 million (US $ 535,777 million) in 2005-06. The fi scal 2006-07, also witnessed an increase in the trading volumes which amounted to Rs. 29,330,590 million (US$ 672,874 million). In percentage terms there has been a growth of 22.46 % in 2006-07 over the previous year’s volume.
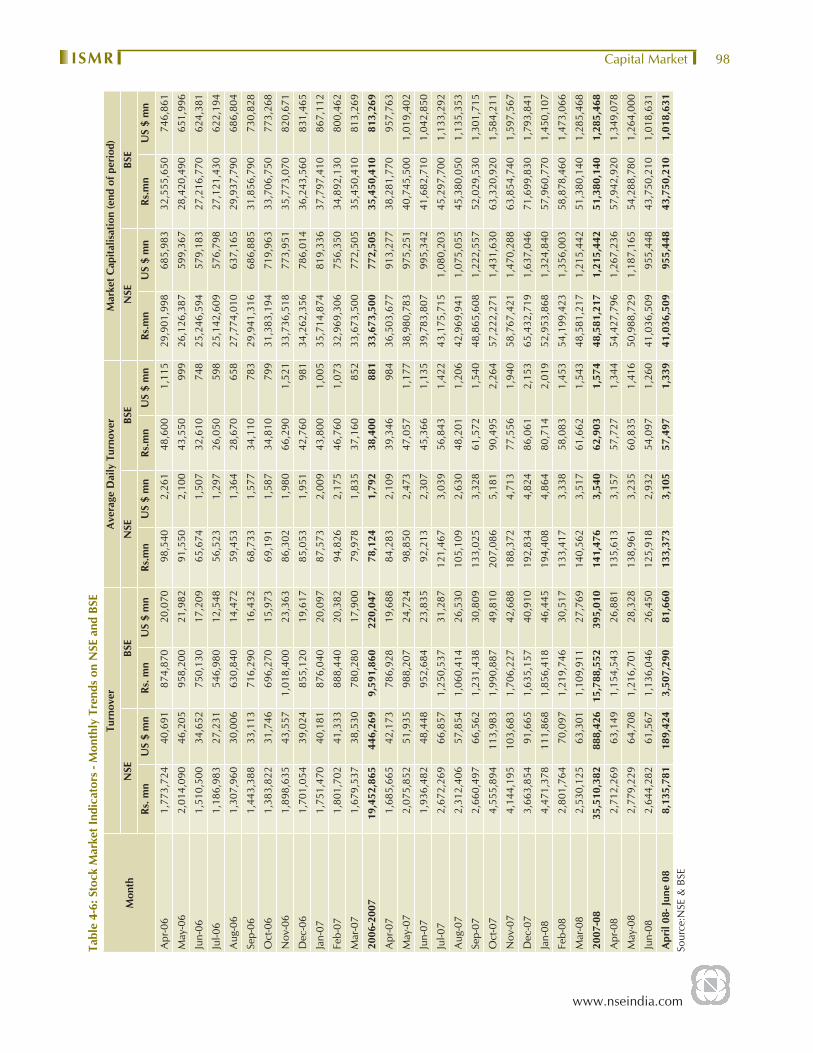
The trading value of the CM segment on NSE showed year-on-year increase of 82.55 % from Rs. 19,452,865 million (US $ 446,269 million) in 2006-07 to Rs.35,510,382 million (US $ 888,426 million) during 2007-08. The volumes soared mainly during the months of October 2007 to January 2008. (Table 4-5 & Table 4-6). The daily turnover on NSE averaged around Rs.141,476 million (US$ 3,540 million) in 2007-08 and continued at the same level of Rs. 133,373 million (US $ 3,105 million) during the fi rst quarter of the fi scal 2008-09).
Table 4-5: Capital Market Market Turnover on Stock Exchanges in India
Stock Exchanges Capital Market Turnover
Share in Turnover (%)2006-07 2007-08
(Rs. mn.) (US $ million) (Rs. mn.) (US $ million) 2006-07 2007-081 NSE 19,452,865 446,269 35,510,380 888,426 67.01 69.22
2 BSE 9,561,850 219,359 15,788,570 395,011 32.94 30.77
3 Calcutta 6,940 159 0 0 0.02 0.00
4 Uttar Pradesh 7,990 183 4,750 119 0.03 0.01
5 Ahmedabad 0 0 0 0 0 0.00
6 Delhi 0 0 0 0 0 0.00
7 Pune 0 0 0 0 0 0.00
8 Ludhiana 0 0 0 0 0 0.00
9 Bangalore 0 0 0 0 0 0.00
10 ICSE 0 0 0 0 0 0.00
11 Madras 12 0.28 0 0 0.00004 0.00
12 Madhya Pradesh 0 0 0 0 0 0.00
13 Vadodara 0 0 0 0 0 0.00
14 OTCEI 0 0 0 0 0 0.00
15 Gauhati 0 0 0 0 0 0.00
16 Cochin 0 0 0 0 0 0.00
17 Bhubaneshwar 0 0 0 0 0 0.00
18 Coimbatore 0 0 0 0 0 0.00
19 Jaipur 0 0 0 0 0 0.00
Total 29,030,577 665,992 51,303,700 1,283,555 100.00 100.00
NSE and BSE, were the only two stock exchange which reported signifi cant trading volumes. With the exception of Uttar Pradesh Stock Exchange, all other stock exchanges did not report any trading volumes during 2007-08. NSE consolidated its position as the market leader by contributing about 69.22% of the total turnover in India. Since its inception in 1994, NSE has emerged as the favoured exchange among trading members. The consistent increase in popularity of NSE is clearly evident from (Annexure 4-2), which presents the business growth of CM segment of NSE. Not only in the national arena, but also in the international markets, NSE has been successful in creating a niche for
www.nseindia.com
Capital Market ISMR 98
Tabl
e 4-
6: S
tock
Mar
ket I
ndic
ator
s - M
onth
ly T
rend
s on
NSE
and
BSE
Mon
th
Turn
over
Ave
rage
Dai
ly T
urno
ver
Mar
ket C
apita
lisat
ion
(end
of p
erio
d)
NSE
BSE
NSE
BSE
NSE
BSE
Rs. m
nU
S $
mn
Rs. m
nU
S $
mn
Rs.m
nU
S $
mn
Rs.m
nU
S $
mn
Rs.m
nU
S $
mn
Rs.m
nU
S $
mn
Apr
-06
1,77
3,72
4 4
0,69
1 8
74,8
70
20,
070
98,5
40 2
,261
4
8,60
0 1
,115
2
9,90
1,99
8 6
85,9
83
32,
555,
650
746
,861
May
-06
2,01
4,09
0 4
6,20
5 9
58,2
00
21,
982
91,5
50 2
,100
4
3,55
0 9
99
26,
126,
387
599
,367
2
8,42
0,49
0 6
51,9
96
Jun-
061,
510,
500
34,
652
750
,130
1
7,20
9 65
,674
1,5
07
32,
610
748
2
5,24
6,59
4 5
79,1
83
27,
216,
770
624
,381
Jul-0
61,
186,
983
27,
231
546
,980
1
2,54
8 56
,523
1,2
97
26,
050
598
2
5,14
2,60
9 5
76,7
98
27,
121,
430
622
,194
Aug
-06
1,30
7,96
0 3
0,00
6 6
30,8
40
14,
472
59,4
53 1
,364
2
8,67
0 6
58
27,
774,
010
637
,165
2
9,93
7,79
0 6
86,8
04
Sep-
061,
443,
388
33,
113
716
,290
1
6,43
2 68
,733
1,5
77
34,
110
783
2
9,94
1,31
6 6
86,8
85
31,
856,
790
730
,828
Oct
-06
1,38
3,82
2 3
1,74
6 6
96,2
70
15,
973
69,1
91 1
,587
3
4,81
0 7
99
31,
383,
194
719
,963
3
3,70
6,75
0 7
73,2
68
Nov
-06
1,89
8,63
5 4
3,55
7 1
,018
,400
2
3,36
3 86
,302
1,9
80
66,
290
1,5
21
33,
736,
518
773
,951
3
5,77
3,07
0 8
20,6
71
Dec
-06
1,70
1,05
4 3
9,02
4 8
55,1
20
19,
617
85,0
53 1
,951
4
2,76
0 9
81
34,
262,
356
786
,014
3
6,24
3,56
0 8
31,4
65
Jan-
071,
751,
470
40,
181
876
,040
2
0,09
7 87
,573
2,0
09
43,
800
1,0
05
35,
714,
874
819
,336
3
7,79
7,41
0 8
67,1
12
Feb-
071,
801,
702
41,
333
888
,440
2
0,38
2 94
,826
2,1
75
46,
760
1,0
73
32,
969,
306
756
,350
3
4,89
2,13
0 8
00,4
62
Mar
-07
1,67
9,53
7 3
8,53
0 7
80,2
80
17,
900
79,9
78 1
,835
3
7,16
0 8
52
33,
673,
500
772
,505
3
5,45
0,41
0 8
13,2
69
2006
-200
719
,452
,865
446
,269
9
,591
,860
2
20,0
47
78,1
24 1
,792
3
8,40
0 8
81
33,
673,
500
772
,505
3
5,45
0,41
0 8
13,2
69
Apr
-07
1,6
85,6
65
42,1
7378
6,92
8 1
9,68
8 84
,283
2,1
09
39,
346
984
3
6,50
3,67
7 9
13,2
77
38,
281,
770
957
,763
May
-07
2,0
75,8
52
51,9
35 9
88,2
07
24,
724
98,8
50 2
,473
4
7,05
7 1
,177
3
8,98
0,78
3 9
75,2
51
40,
745,
500
1,0
19,4
02
Jun-
07 1
,936
,482
48
,448
952
,684
2
3,83
5 92
,213
2,3
07
45,
366
1,1
35
39,
783,
807
995
,342
4
1,68
2,71
0 1
,042
,850
Jul-0
7 2
,672
,269
66
,857
1,2
50,5
37
31,
287
121,
467
3,0
39
56,
843
1,4
22
43,
175,
715
1,0
80,2
03
45,
297,
700
1,1
33,2
92
Aug
-07
2,3
12,4
06
57,8
54 1
,060
,414
2
6,53
0 10
5,10
9 2
,630
4
8,20
1 1
,206
4
2,96
9,94
1 1
,075
,055
4
5,38
0,05
0 1
,135
,353
Sep-
07 2
,660
,497
66
,562
1,2
31,4
38
30,
809
133,
025
3,3
28
61,
572
1,5
40
48,
865,
608
1,2
22,5
57
52,
029,
530
1,3
01,7
15
Oct
-07
4,5
55,8
94
113,
983
1,9
90,8
87
49,
810
207,
086
5,1
81
90,
495
2,2
64
57,
222,
271
1,4
31,6
30
63,
320,
920
1,5
84,2
11
Nov
-07
4,1
44,1
95
103,
683
1,7
06,2
27
42,
688
188,
372
4,7
13
77,
556
1,9
40
58,
767,
421
1,4
70,2
88
63,
854,
740
1,5
97,5
67
Dec
-07
3,6
63,8
54
91,6
65 1
,635
,157
4
0,91
0 19
2,83
4 4
,824
8
6,06
1 2
,153
6
5,43
2,71
9 1
,637
,046
7
1,69
9,83
0 1
,793
,841
Jan-
08 4
,471
,378
11
1,86
8 1
,856
,418
4
6,44
5 19
4,40
8 4
,864
8
0,71
4 2
,019
5
2,95
3,86
8 1
,324
,840
5
7,96
0,77
0 1
,450
,107
Feb-
08 2
,801
,764
70
,097
1,2
19,7
46
30,
517
133,
417
3,3
38
58,
083
1,4
53
54,
199,
423
1,3
56,0
03
58,
878,
460
1,4
73,0
66
Mar
-08
2,5
30,1
25
63,3
01 1
,109
,911
2
7,76
9 14
0,56
2 3
,517
6
1,66
2 1
,543
4
8,58
1,21
7 1
,215
,442
5
1,38
0,14
0 1
,285
,468
2007
-08
35,5
10,3
8288
8,42
615
,788
,552
395,
010
141,
476
3,5
40
62,
903
1,5
74
48,
581,
217
1,2
15,4
42
51,
380,
140
1,2
85,4
68
Apr
-08
2,7
12,2
69
63,1
49 1
,154
,543
2
6,88
1 1
35,6
13
3,1
57
57,
727
1,3
44
54,
427,
796
1,2
67,2
36
57,
942,
920
1,3
49,0
78
May
-08
2,7
79,2
29
64,7
08 1
,216
,701
2
8,32
8 1
38,9
61
3,2
35
60,
835
1,4
16
50,
988,
729
1,1
87,1
65
54,
288,
780
1,2
64,0
00
Jun-
08 2
,644
,282
61
,567
1,1
36,0
46
26,
450
125
,918
2
,932
5
4,09
7 1
,260
4
1,03
6,50
9 9
55,4
48
43,
750,
210
1,0
18,6
31
Apr
il 08
- Jun
e 08
8,1
35,7
81
189,
424
3,50
7,29
081
,660
133
,373
3
,105
5
7,49
7 1
,339
4
1,03
6,50
9 9
55,4
48
43,
750,
210
1,0
18,6
31
Sour
ce:N
SE &
BSE
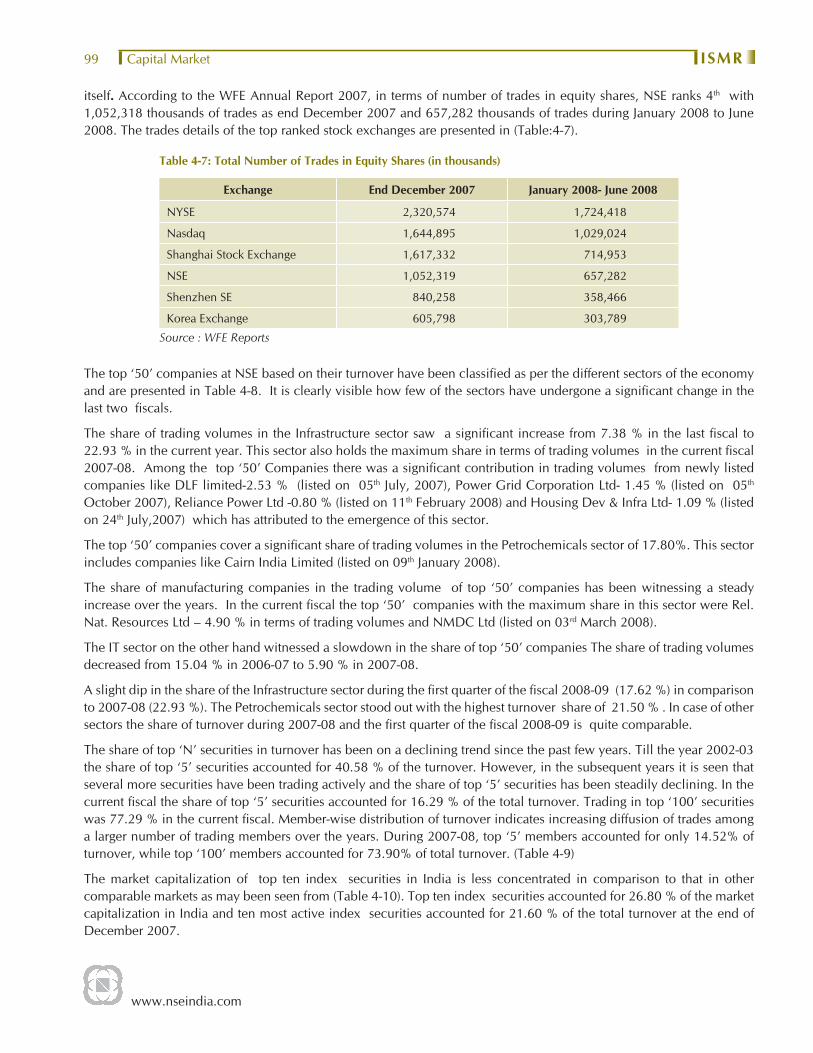
www.nseindia.com
Capital Market ISMR99
itself. According to the WFE Annual Report 2007, in terms of number of trades in equity shares, NSE ranks 4th with 1,052,318 thousands of trades as end December 2007 and 657,282 thousands of trades during January 2008 to June 2008. The trades details of the top ranked stock exchanges are presented in (Table:4-7).
Table 4-7: Total Number of Trades in Equity Shares (in thousands)
Exchange End December 2007 January 2008- June 2008
NYSE 2,320,574 1,724,418
Nasdaq 1,644,895 1,029,024
Shanghai Stock Exchange 1,617,332 714,953
NSE 1,052,319 657,282
Shenzhen SE 840,258 358,466
Korea Exchange 605,798 303,789
Source : WFE Reports
The top ‘50’ companies at NSE based on their turnover have been classifi ed as per the different sectors of the economy and are presented in Table 4-8. It is clearly visible how few of the sectors have undergone a signifi cant change in the last two fi scals.
The share of trading volumes in the Infrastructure sector saw a signifi cant increase from 7.38 % in the last fi scal to 22.93 % in the current year. This sector also holds the maximum share in terms of trading volumes in the current fi scal 2007-08. Among the top ‘50’ Companies there was a signifi cant contribution in trading volumes from newly listed companies like DLF limited-2.53 % (listed on 05th July, 2007), Power Grid Corporation Ltd- 1.45 % (listed on 05th October 2007), Reliance Power Ltd -0.80 % (listed on 11th February 2008) and Housing Dev & Infra Ltd- 1.09 % (listed on 24th July,2007) which has attributed to the emergence of this sector.
The top ‘50’ companies cover a signifi cant share of trading volumes in the Petrochemicals sector of 17.80%. This sector includes companies like Cairn India Limited (listed on 09th January 2008).
The share of manufacturing companies in the trading volume of top ‘50’ companies has been witnessing a steady increase over the years. In the current fi scal the top ‘50’ companies with the maximum share in this sector were Rel. Nat. Resources Ltd – 4.90 % in terms of trading volumes and NMDC Ltd (listed on 03rd March 2008).
The IT sector on the other hand witnessed a slowdown in the share of top ‘50’ companies The share of trading volumes decreased from 15.04 % in 2006-07 to 5.90 % in 2007-08.
A slight dip in the share of the Infrastructure sector during the fi rst quarter of the fi scal 2008-09 (17.62 %) in comparison to 2007-08 (22.93 %). The Petrochemicals sector stood out with the highest turnover share of 21.50 % . In case of other sectors the share of turnover during 2007-08 and the fi rst quarter of the fi scal 2008-09 is quite comparable.
The share of top ‘N’ securities in turnover has been on a declining trend since the past few years. Till the year 2002-03 the share of top ‘5’ securities accounted for 40.58 % of the turnover. However, in the subsequent years it is seen that several more securities have been trading actively and the share of top ‘5’ securities has been steadily declining. In the current fi scal the share of top ‘5’ securities accounted for 16.29 % of the total turnover. Trading in top ‘100’ securities was 77.29 % in the current fi scal. Member-wise distribution of turnover indicates increasing diffusion of trades among a larger number of trading members over the years. During 2007-08, top ‘5’ members accounted for only 14.52% of turnover, while top ‘100’ members accounted for 73.90% of total turnover. (Table 4-9)
The market capitalization of top ten index securities in India is less concentrated in comparison to that in other comparable markets as may been seen from (Table 4-10). Top ten index securities accounted for 26.80 % of the market capitalization in India and ten most active index securities accounted for 21.60 % of the total turnover at the end of December 2007.
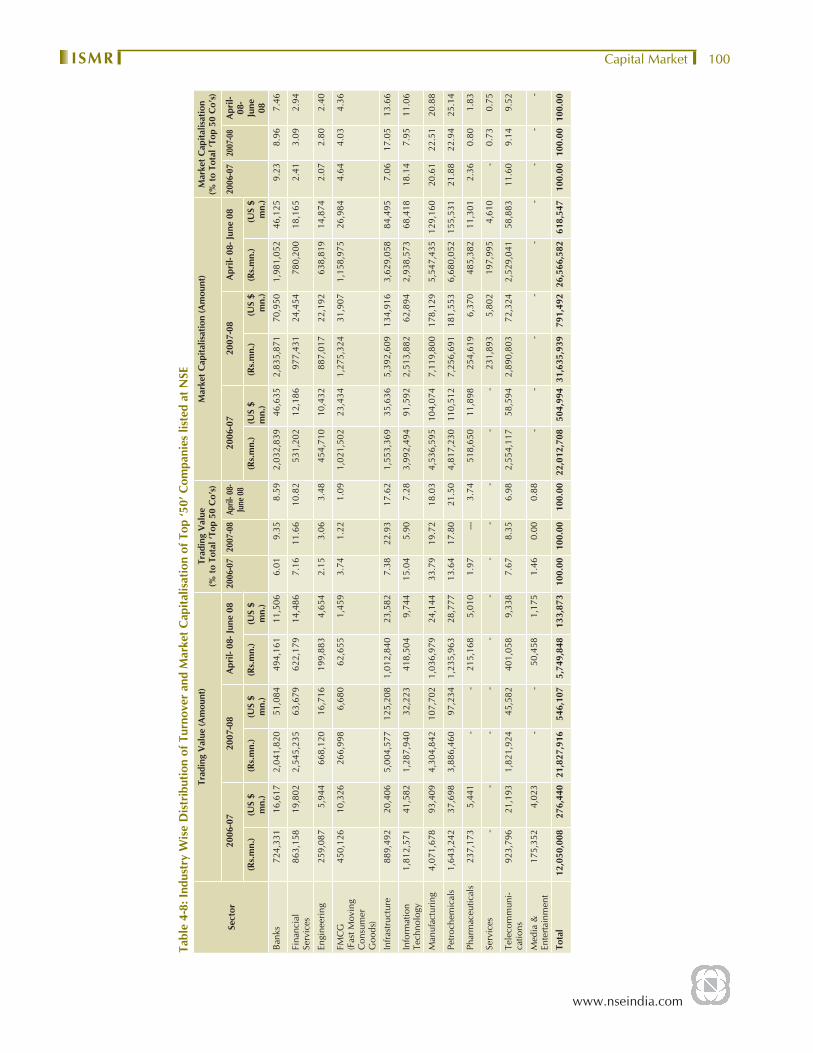
www.nseindia.com
Capital Market ISMR 100
Tabl
e 4-
8: In
dust
ry W
ise
Dis
trib
utio
n of
Tur
nove
r an
d M
arke
t Cap
italis
atio
n of
Top
‘50’
Com
pani
es li
sted
at N
SE
Sect
or
Trad
ing
Val
ue (A
mou
nt)
Trad
ing
Val
ue
(% to
Tot
al ‘T
op 5
0 C
o’s)
Mar
ket C
apita
lisat
ion
(Am
ount
)M
arke
t Cap
italis
atio
n(%
to T
otal
‘Top
50
Co’
s)
200
6-07
2007
-08
Apr
il- 0
8- Ju
ne 0
820
06-0
720
07-0
8Ap
ril- 0
8-Ju
ne 0
820
06-0
720
07-0
8A
pril-
08-
June
08
2006
-07
2007
-08
Apr
il-08
- Ju
ne
08(R
s.m
n.)
(US
$ m
n.)
(Rs.
mn.
)(U
S $
mn.
)(R
s.m
n.)
(US
$ m
n.)
(Rs.
mn.
)(U
S $
mn.
)(R
s.m
n.)
(US
$ m
n.)
(Rs.
mn.
)(U
S $
mn.
)
Bank
s 7
24,3
31
16,
617
2,0
41,8
20
51,
084
494
,161
1
1,50
6 6.
019.
358.
59 2
,032
,839
4
6,63
5 2
,835
,871
7
0,95
0 1
,981
,052
4
6,12
5 9.
238.
967.
46
Fina
ncia
l Se
rvic
es 8
63,1
58
19,
802
2,5
45,2
35
63,
679
622
,179
1
4,48
6 7.
1611
.66
10.8
2 5
31,2
02
12,
186
977
,431
2
4,45
4 7
80,2
00
18,
165
2.41
3.09
2.94
Engi
neer
ing
259
,087
5
,944
6
68,1
20
16,
716
199
,883
4
,654
2.
153.
063.
48 4
54,7
10
10,
432
887
,017
2
2,19
2 6
38,8
19
14,
874
2.07
2.80
2.40
FMC
G(F
ast M
ovin
g C
onsu
mer
G
oods
)
450
,126
1
0,32
6 2
66,9
98
6,6
80
62,
655
1,4
59
3.74
1.22
1.09
1,0
21,5
02
23,
434
1,2
75,3
24
31,
907
1,1
58,9
75
26,
984
4.64
4.03
4.36
Infra
stru
ctur
e 8
89,4
92
20,
406
5,0
04,5
77
125
,208
1
,012
,840
2
3,58
2 7.
3822
.93
17.6
2 1
,553
,369
3
5,63
6 5
,392
,609
1
34,9
16
3,6
29,0
58
84,
495
7.06
17.0
513
.66
Info
rmat
ion
Tech
nolo
gy 1
,812
,571
4
1,58
2 1
,287
,940
3
2,22
3 4
18,5
04
9,7
44
15.0
45.
907.
28 3
,992
,494
9
1,59
2 2
,513
,882
6
2,89
4 2
,938
,573
6
8,41
8 18
.14
7.95
11.0
6
Man
ufac
turin
g 4
,071
,678
9
3,40
9 4
,304
,842
1
07,7
02
1,0
36,9
79
24,
144
33.7
919
.72
18.0
3 4
,536
,595
10
4,07
4 7
,119
,800
1
78,1
29
5,5
47,4
35
129,
160
20.6
122
.51
20.8
8
Petro
chem
ical
s 1
,643
,242
3
7,69
8 3
,886
,460
9
7,23
4 1
,235
,963
2
8,77
7 13
.64
17.8
021
.50
4,8
17,2
30
110,
512
7,2
56,6
91
181
,553
6
,680
,052
15
5,53
1 21
.88
22.9
425
.14
Phar
mac
eutic
als
237
,173
5
,441
-
- 2
15,1
68
5,0
10
1.97
---
3.74
518
,650
1
1,89
8 2
54,6
19
6,3
70
485
,382
1
1,30
1 2.
360.
801.
83
Serv
ices
- -
- -
- -
- -
- -
- 2
31,8
93
5,8
02
197
,995
4
,610
-
0.73
0.75
Tele
com
mun
i-ca
tions
923
,796
2
1,19
3 1
,821
,924
4
5,58
2 4
01,0
58
9,3
38
7.67
8.35
6.98
2,5
54,1
17
58,
594
2,8
90,8
03
72,
324
2,5
29,0
41
58,
883
11.6
09.
149.
52
Med
ia &
En
terta
inm
ent
175
,352
4
,023
-
- 5
0,45
8 1
,175
1.
460.
000.
88 -
- -
- -
- -
- -
Tota
l12
,050
,008
2
76,4
40
21,8
27,9
16
546
,107
5,
749,
848
133
,873
1
00.0
0 10
0.00
10
0.00
22,
012,
708
504
,994
31,
635,
939
791
,492
26
,566
,582
61
8,54
7 10
0.00
100.
0010
0.00
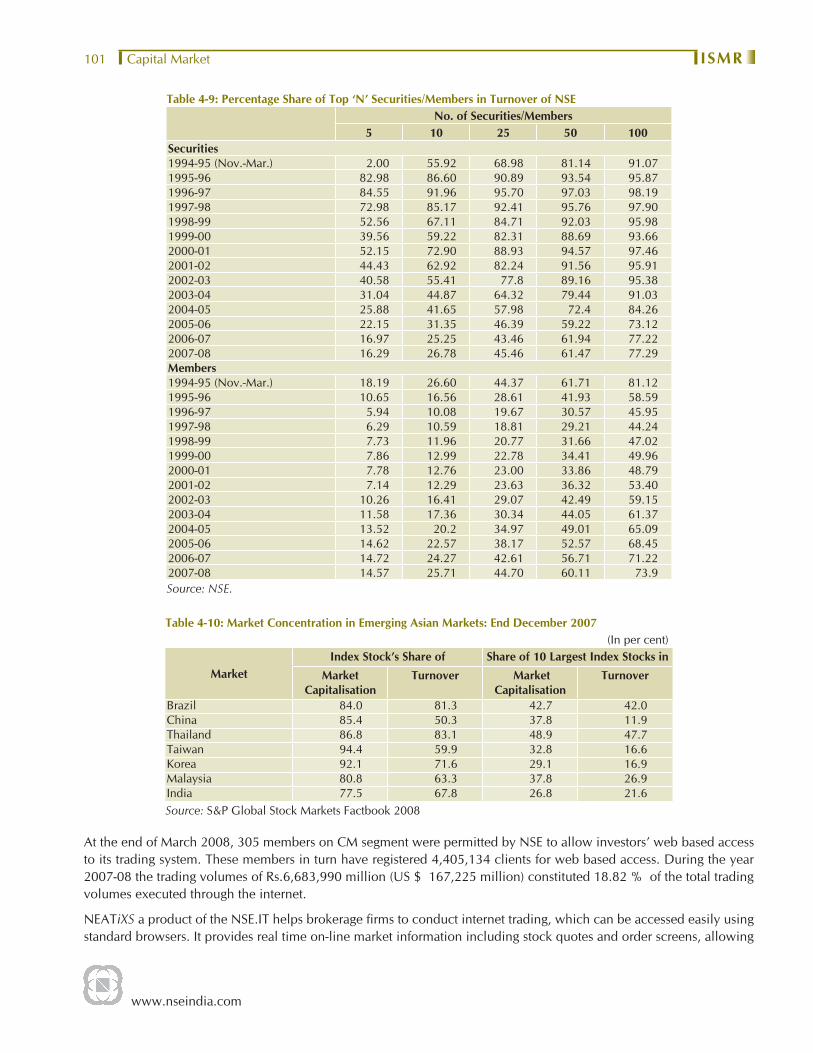
www.nseindia.com
Capital Market ISMR101
Table 4-9: Percentage Share of Top ‘N’ Securities/Members in Turnover of NSENo. of Securities/Members
5 10 25 50 100Securities1994-95 (Nov.-Mar.) 2.00 55.92 68.98 81.14 91.071995-96 82.98 86.60 90.89 93.54 95.871996-97 84.55 91.96 95.70 97.03 98.191997-98 72.98 85.17 92.41 95.76 97.901998-99 52.56 67.11 84.71 92.03 95.981999-00 39.56 59.22 82.31 88.69 93.662000-01 52.15 72.90 88.93 94.57 97.462001-02 44.43 62.92 82.24 91.56 95.912002-03 40.58 55.41 77.8 89.16 95.382003-04 31.04 44.87 64.32 79.44 91.032004-05 25.88 41.65 57.98 72.4 84.262005-06 22.15 31.35 46.39 59.22 73.122006-07 16.97 25.25 43.46 61.94 77.222007-08 16.29 26.78 45.46 61.47 77.29Members1994-95 (Nov.-Mar.) 18.19 26.60 44.37 61.71 81.121995-96 10.65 16.56 28.61 41.93 58.591996-97 5.94 10.08 19.67 30.57 45.951997-98 6.29 10.59 18.81 29.21 44.241998-99 7.73 11.96 20.77 31.66 47.021999-00 7.86 12.99 22.78 34.41 49.962000-01 7.78 12.76 23.00 33.86 48.792001-02 7.14 12.29 23.63 36.32 53.402002-03 10.26 16.41 29.07 42.49 59.152003-04 11.58 17.36 30.34 44.05 61.372004-05 13.52 20.2 34.97 49.01 65.092005-06 14.62 22.57 38.17 52.57 68.452006-07 14.72 24.27 42.61 56.71 71.222007-08 14.57 25.71 44.70 60.11 73.9Source: NSE.
Table 4-10: Market Concentration in Emerging Asian Markets: End December 2007(In per cent)
MarketIndex Stock’s Share of Share of 10 Largest Index Stocks in
Market Capitalisation
Turnover Market Capitalisation
Turnover
Brazil 84.0 81.3 42.7 42.0China 85.4 50.3 37.8 11.9Thailand 86.8 83.1 48.9 47.7Taiwan 94.4 59.9 32.8 16.6Korea 92.1 71.6 29.1 16.9Malaysia 80.8 63.3 37.8 26.9India 77.5 67.8 26.8 21.6Source: S&P Global Stock Markets Factbook 2008
At the end of March 2008, 305 members on CM segment were permitted by NSE to allow investors’ web based access to its trading system. These members in turn have registered 4,405,134 clients for web based access. During the year 2007-08 the trading volumes of Rs.6,683,990 million (US $ 167,225 million) constituted 18.82 % of the total trading volumes executed through the internet.
NEATiXS a product of the NSE.IT helps brokerage fi rms to conduct internet trading, which can be accessed easily using standard browsers. It provides real time on-line market information including stock quotes and order screens, allowing
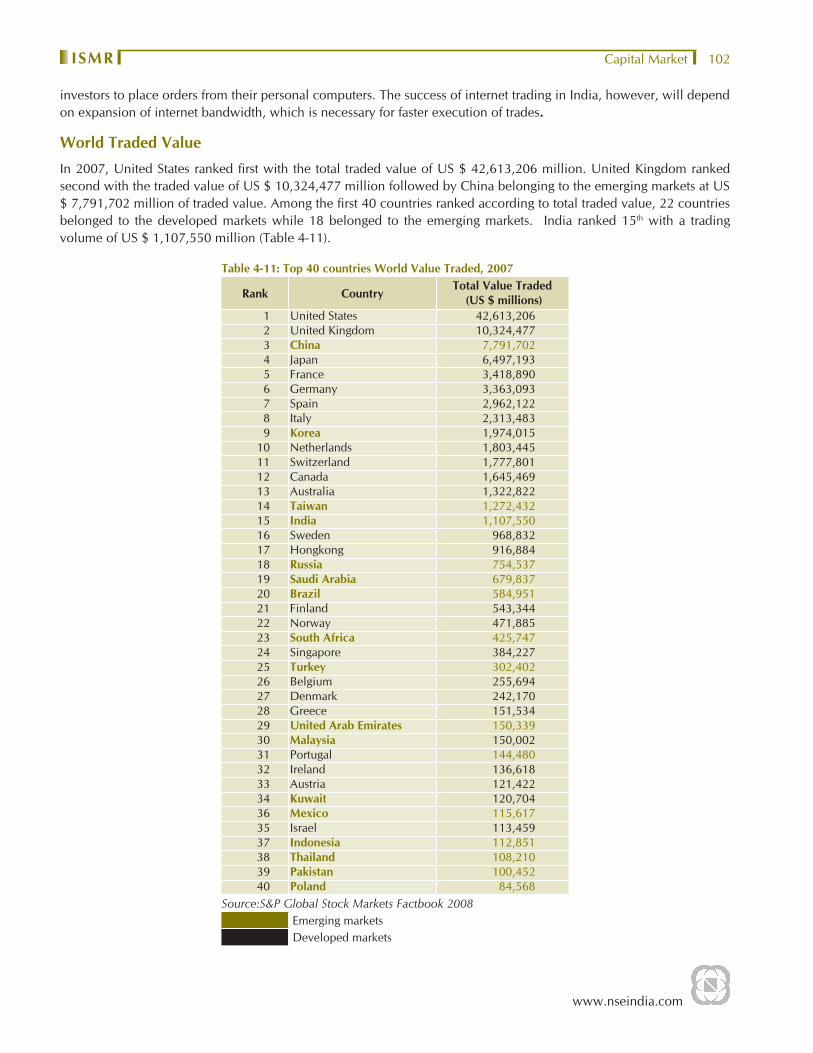
www.nseindia.com
Capital Market ISMR 102
investors to place orders from their personal computers. The success of internet trading in India, however, will depend on expansion of internet bandwidth, which is necessary for faster execution of trades.
World Traded Value
In 2007, United States ranked fi rst with the total traded value of US $ 42,613,206 million. United Kingdom ranked second with the traded value of US $ 10,324,477 million followed by China belonging to the emerging markets at US $ 7,791,702 million of traded value. Among the fi rst 40 countries ranked according to total traded value, 22 countries belonged to the developed markets while 18 belonged to the emerging markets. India ranked 15th with a trading volume of US $ 1,107,550 million (Table 4-11).
Table 4-11: Top 40 countries World Value Traded, 2007
Rank CountryTotal Value Traded
(US $ millions)1 United States 42,613,206 2 United Kingdom 10,324,477 3 China 7,791,702 4 Japan 6,497,193 5 France 3,418,890 6 Germany 3,363,093 7 Spain 2,962,122 8 Italy 2,313,483 9 Korea 1,974,015
10 Netherlands 1,803,445 11 Switzerland 1,777,801 12 Canada 1,645,469 13 Australia 1,322,822 14 Taiwan 1,272,432 15 India 1,107,550 16 Sweden 968,832 17 Hongkong 916,884 18 Russia 754,537 19 Saudi Arabia 679,837 20 Brazil 584,951 21 Finland 543,344 22 Norway 471,885 23 South Africa 425,747 24 Singapore 384,227 25 Turkey 302,402 26 Belgium 255,694 27 Denmark 242,170 28 Greece 151,534 29 United Arab Emirates 150,339 30 Malaysia 150,002 31 Portugal 144,480 32 Ireland 136,618 33 Austria 121,422 34 Kuwait 120,704 36 Mexico 115,617 35 Israel 113,459 37 Indonesia 112,851 38 Thailand 108,210 39 Pakistan 100,452 40 Poland 84,568
Source:S&P Global Stock Markets Factbook 2008Emerging marketsDeveloped markets
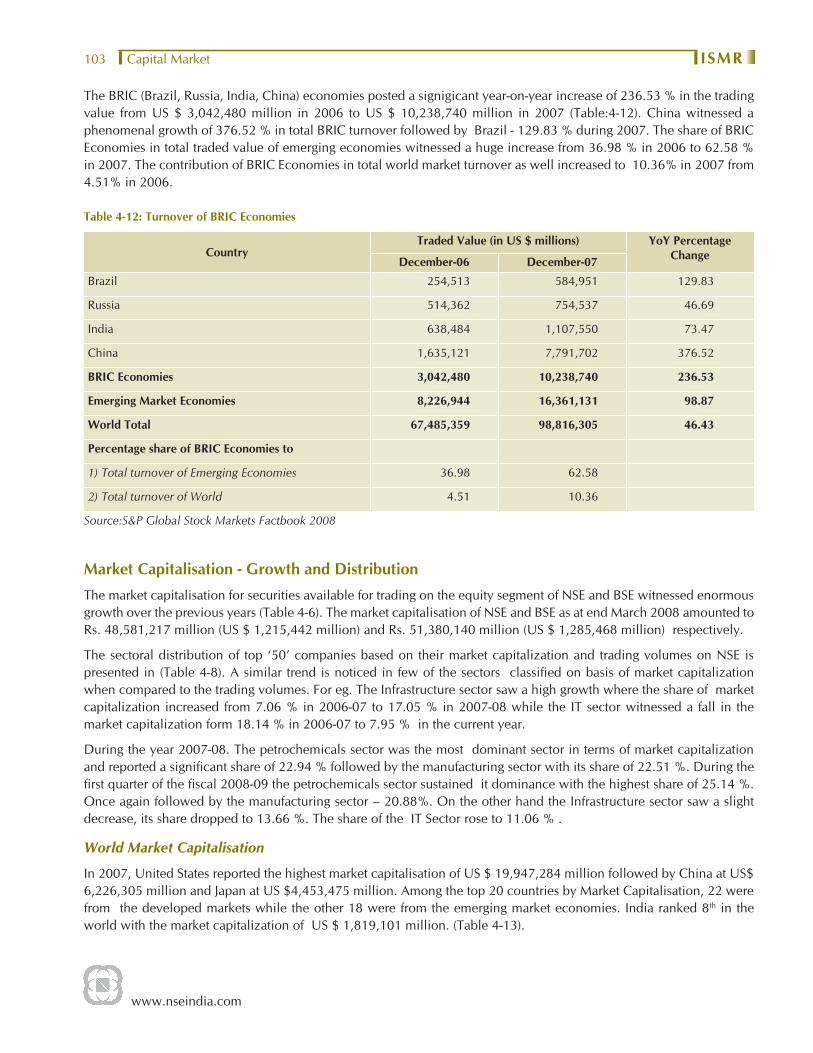
www.nseindia.com
Capital Market ISMR103
The BRIC (Brazil, Russia, India, China) economies posted a signigicant year-on-year increase of 236.53 % in the trading value from US $ 3,042,480 million in 2006 to US $ 10,238,740 million in 2007 (Table:4-12). China witnessed a phenomenal growth of 376.52 % in total BRIC turnover followed by Brazil - 129.83 % during 2007. The share of BRIC Economies in total traded value of emerging economies witnessed a huge increase from 36.98 % in 2006 to 62.58 % in 2007. The contribution of BRIC Economies in total world market turnover as well increased to 10.36% in 2007 from 4.51% in 2006.
Table 4-12: Turnover of BRIC Economies
CountryTraded Value (in US $ millions) YoY Percentage
Change December-06 December-07
Brazil 254,513 584,951 129.83
Russia 514,362 754,537 46.69
India 638,484 1,107,550 73.47
China 1,635,121 7,791,702 376.52
BRIC Economies 3,042,480 10,238,740 236.53
Emerging Market Economies 8,226,944 16,361,131 98.87
World Total 67,485,359 98,816,305 46.43
Percentage share of BRIC Economies to
1) Total turnover of Emerging Economies 36.98 62.58
2) Total turnover of World 4.51 10.36
Source:S&P Global Stock Markets Factbook 2008
Market Capitalisation - Growth and Distribution
The market capitalisation for securities available for trading on the equity segment of NSE and BSE witnessed enormous growth over the previous years (Table 4-6). The market capitalisation of NSE and BSE as at end March 2008 amounted to Rs. 48,581,217 million (US $ 1,215,442 million) and Rs. 51,380,140 million (US $ 1,285,468 million) respectively.
The sectoral distribution of top ‘50’ companies based on their market capitalization and trading volumes on NSE is presented in (Table 4-8). A similar trend is noticed in few of the sectors classifi ed on basis of market capitalization when compared to the trading volumes. For eg. The Infrastructure sector saw a high growth where the share of market capitalization increased from 7.06 % in 2006-07 to 17.05 % in 2007-08 while the IT sector witnessed a fall in the market capitalization form 18.14 % in 2006-07 to 7.95 % in the current year.
During the year 2007-08. The petrochemicals sector was the most dominant sector in terms of market capitalization and reported a signifi cant share of 22.94 % followed by the manufacturing sector with its share of 22.51 %. During the fi rst quarter of the fi scal 2008-09 the petrochemicals sector sustained it dominance with the highest share of 25.14 %. Once again followed by the manufacturing sector – 20.88%. On the other hand the Infrastructure sector saw a slight decrease, its share dropped to 13.66 %. The share of the IT Sector rose to 11.06 % .
World Market Capitalisation
In 2007, United States reported the highest market capitalisation of US $ 19,947,284 million followed by China at US$ 6,226,305 million and Japan at US $4,453,475 million. Among the top 20 countries by Market Capitalisation, 22 were from the developed markets while the other 18 were from the emerging market economies. India ranked 8th in the world with the market capitalization of US $ 1,819,101 million. (Table 4-13).
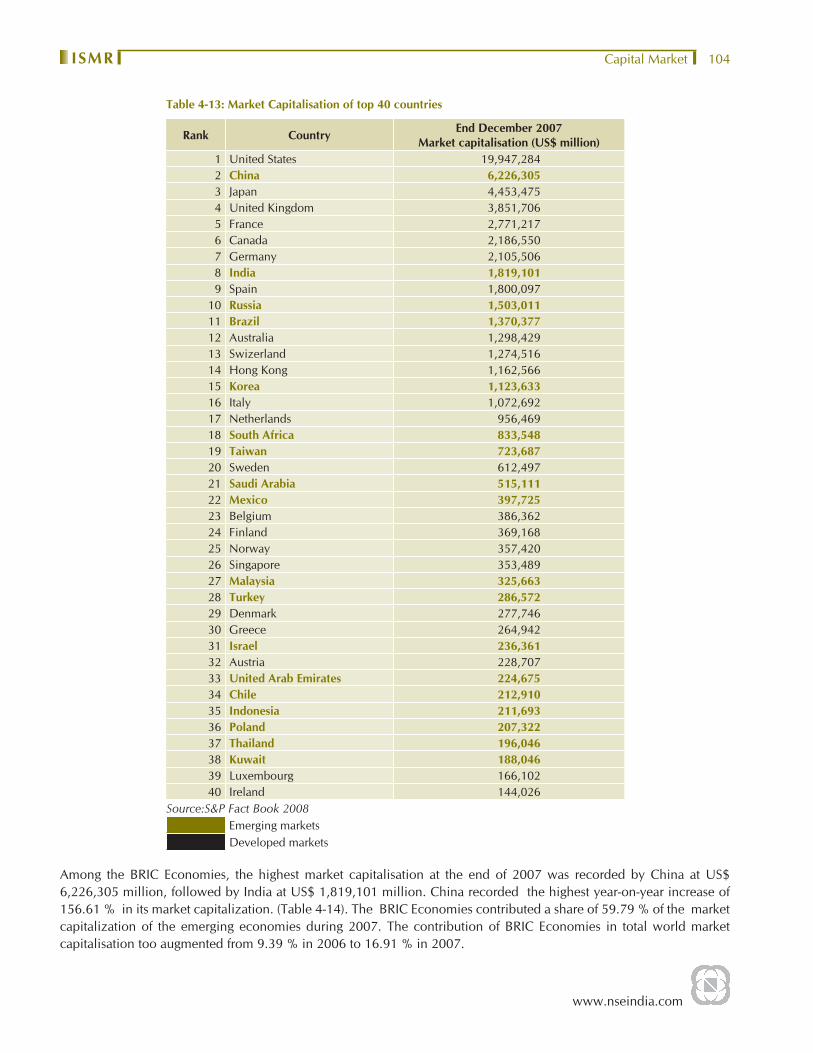
www.nseindia.com
Capital Market ISMR 104
Table 4-13: Market Capitalisation of top 40 countries
Rank Country End December 2007Market capitalisation (US$ million)
1 United States 19,947,284 2 China 6,226,305 3 Japan 4,453,475 4 United Kingdom 3,851,706 5 France 2,771,217 6 Canada 2,186,550 7 Germany 2,105,506 8 India 1,819,101 9 Spain 1,800,097
10 Russia 1,503,011 11 Brazil 1,370,377 12 Australia 1,298,429 13 Swizerland 1,274,516 14 Hong Kong 1,162,566 15 Korea 1,123,633 16 Italy 1,072,692 17 Netherlands 956,469 18 South Africa 833,548 19 Taiwan 723,687 20 Sweden 612,497 21 Saudi Arabia 515,111 22 Mexico 397,725 23 Belgium 386,362 24 Finland 369,168 25 Norway 357,420 26 Singapore 353,489 27 Malaysia 325,663 28 Turkey 286,572 29 Denmark 277,746 30 Greece 264,942 31 Israel 236,361 32 Austria 228,707 33 United Arab Emirates 224,675 34 Chile 212,910 35 Indonesia 211,693 36 Poland 207,322 37 Thailand 196,046 38 Kuwait 188,046 39 Luxembourg 166,102 40 Ireland 144,026
Source:S&P Fact Book 2008Emerging marketsDeveloped markets
Among the BRIC Economies, the highest market capitalisation at the end of 2007 was recorded by China at US$ 6,226,305 million, followed by India at US$ 1,819,101 million. China recorded the highest year-on-year increase of 156.61 % in its market capitalization. (Table 4-14). The BRIC Economies contributed a share of 59.79 % of the market capitalization of the emerging economies during 2007. The contribution of BRIC Economies in total world market capitalisation too augmented from 9.39 % in 2006 to 16.91 % in 2007.
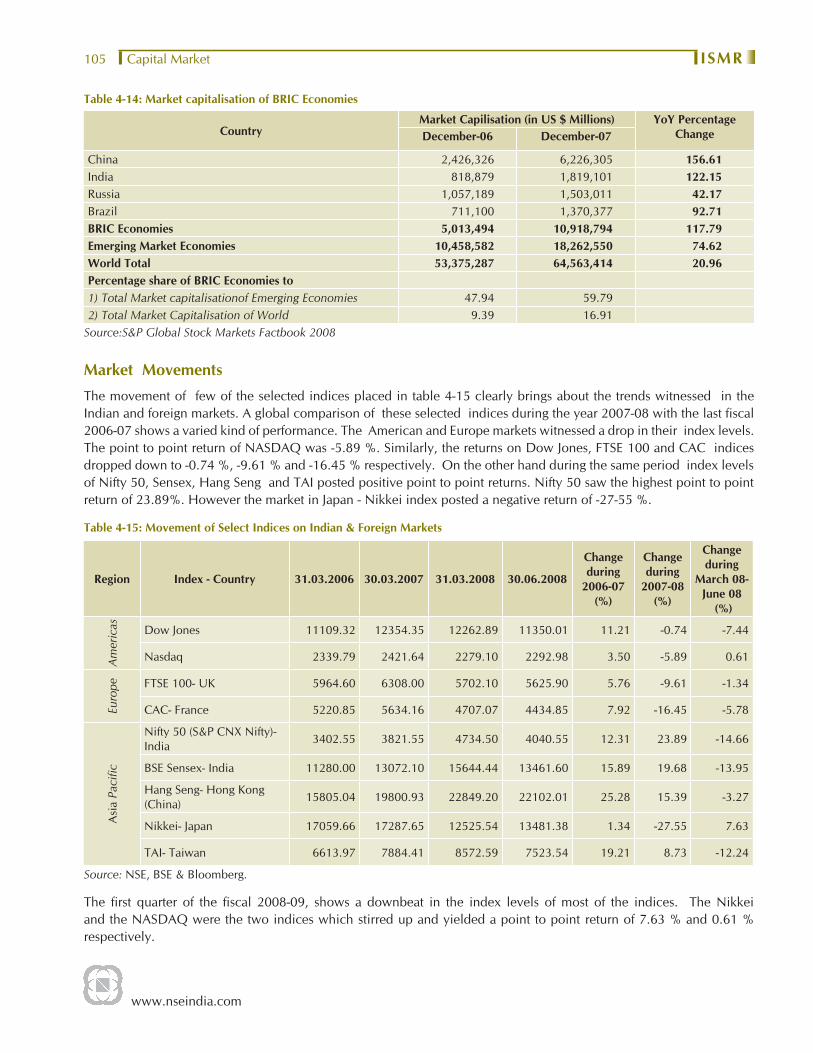
www.nseindia.com
Capital Market ISMR105
Table 4-14: Market capitalisation of BRIC Economies
CountryMarket Capilisation (in US $ Millions) YoY Percentage
Change December-06 December-07
China 2,426,326 6,226,305 156.61 India 818,879 1,819,101 122.15 Russia 1,057,189 1,503,011 42.17 Brazil 711,100 1,370,377 92.71 BRIC Economies 5,013,494 10,918,794 117.79 Emerging Market Economies 10,458,582 18,262,550 74.62 World Total 53,375,287 64,563,414 20.96 Percentage share of BRIC Economies to1) Total Market capitalisationof Emerging Economies 47.94 59.792) Total Market Capitalisation of World 9.39 16.91
Source:S&P Global Stock Markets Factbook 2008
Market Movements
The movement of few of the selected indices placed in table 4-15 clearly brings about the trends witnessed in the Indian and foreign markets. A global comparison of these selected indices during the year 2007-08 with the last fi scal 2006-07 shows a varied kind of performance. The American and Europe markets witnessed a drop in their index levels. The point to point return of NASDAQ was -5.89 %. Similarly, the returns on Dow Jones, FTSE 100 and CAC indices dropped down to -0.74 %, -9.61 % and -16.45 % respectively. On the other hand during the same period index levels of Nifty 50, Sensex, Hang Seng and TAI posted positive point to point returns. Nifty 50 saw the highest point to point return of 23.89%. However the market in Japan - Nikkei index posted a negative return of -27-55 %.
Table 4-15: Movement of Select Indices on Indian & Foreign Markets
Region Index - Country 31.03.2006 30.03.2007 31.03.2008 30.06.2008
Change during
2006-07 (%)
Change during
2007-08 (%)
Change during
March 08-June 08
(%)
Am
eric
as Dow Jones 11109.32 12354.35 12262.89 11350.01 11.21 -0.74 -7.44
Nasdaq 2339.79 2421.64 2279.10 2292.98 3.50 -5.89 0.61
Euro
pe FTSE 100- UK 5964.60 6308.00 5702.10 5625.90 5.76 -9.61 -1.34
CAC- France 5220.85 5634.16 4707.07 4434.85 7.92 -16.45 -5.78
Asi
a Pa
cifi c
Nifty 50 (S&P CNX Nifty)- India
3402.55 3821.55 4734.50 4040.55 12.31 23.89 -14.66
BSE Sensex- India 11280.00 13072.10 15644.44 13461.60 15.89 19.68 -13.95
Hang Seng- Hong Kong (China)
15805.04 19800.93 22849.20 22102.01 25.28 15.39 -3.27
Nikkei- Japan 17059.66 17287.65 12525.54 13481.38 1.34 -27.55 7.63
TAI- Taiwan 6613.97 7884.41 8572.59 7523.54 19.21 8.73 -12.24
Source: NSE, BSE & Bloomberg.
The fi rst quarter of the fi scal 2008-09, shows a downbeat in the index levels of most of the indices. The Nikkei and the NASDAQ were the two indices which stirred up and yielded a point to point return of 7.63 % and 0.61 % respectively.
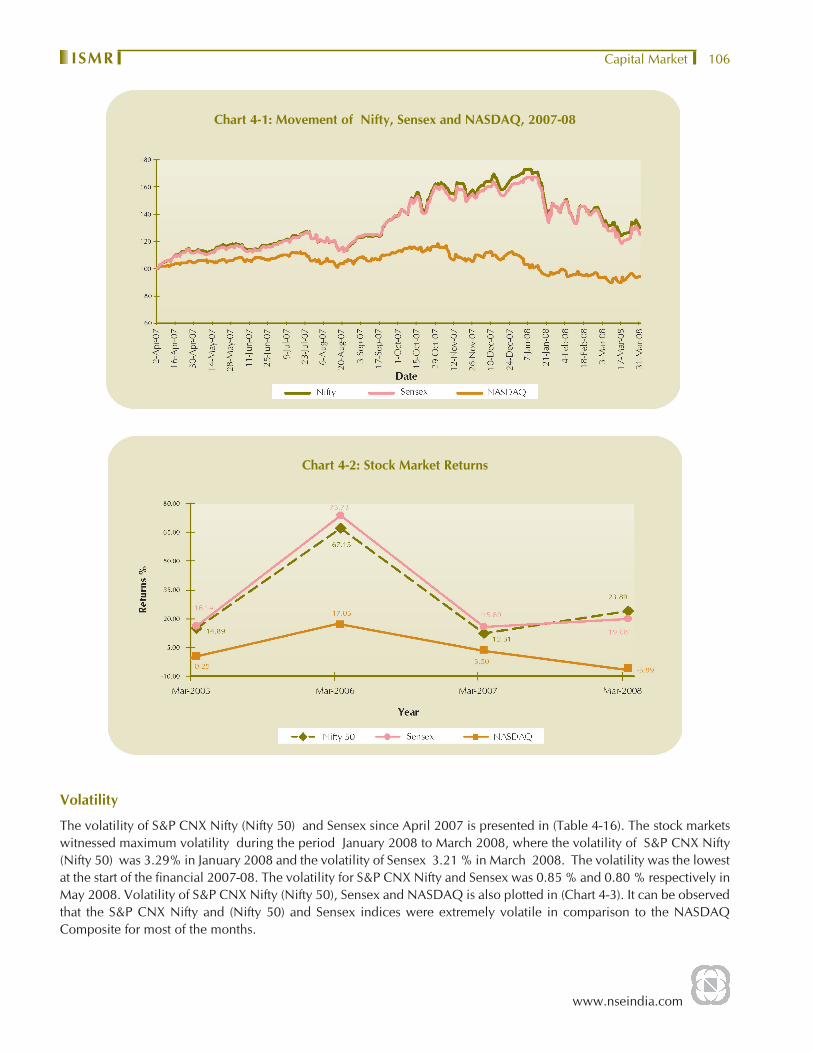
www.nseindia.com
Capital Market ISMR 106
Chart 4-1: Movement of Nifty, Sensex and NASDAQ, 2007-08
Chart 4-2: Stock Market Returns
Volatility
The volatility of S&P CNX Nifty (Nifty 50) and Sensex since April 2007 is presented in (Table 4-16). The stock markets witnessed maximum volatility during the period January 2008 to March 2008, where the volatility of S&P CNX Nifty (Nifty 50) was 3.29% in January 2008 and the volatility of Sensex 3.21 % in March 2008. The volatility was the lowest at the start of the fi nancial 2007-08. The volatility for S&P CNX Nifty and Sensex was 0.85 % and 0.80 % respectively in May 2008. Volatility of S&P CNX Nifty (Nifty 50), Sensex and NASDAQ is also plotted in (Chart 4-3). It can be observed that the S&P CNX Nifty and (Nifty 50) and Sensex indices were extremely volatile in comparison to the NASDAQ Composite for most of the months.
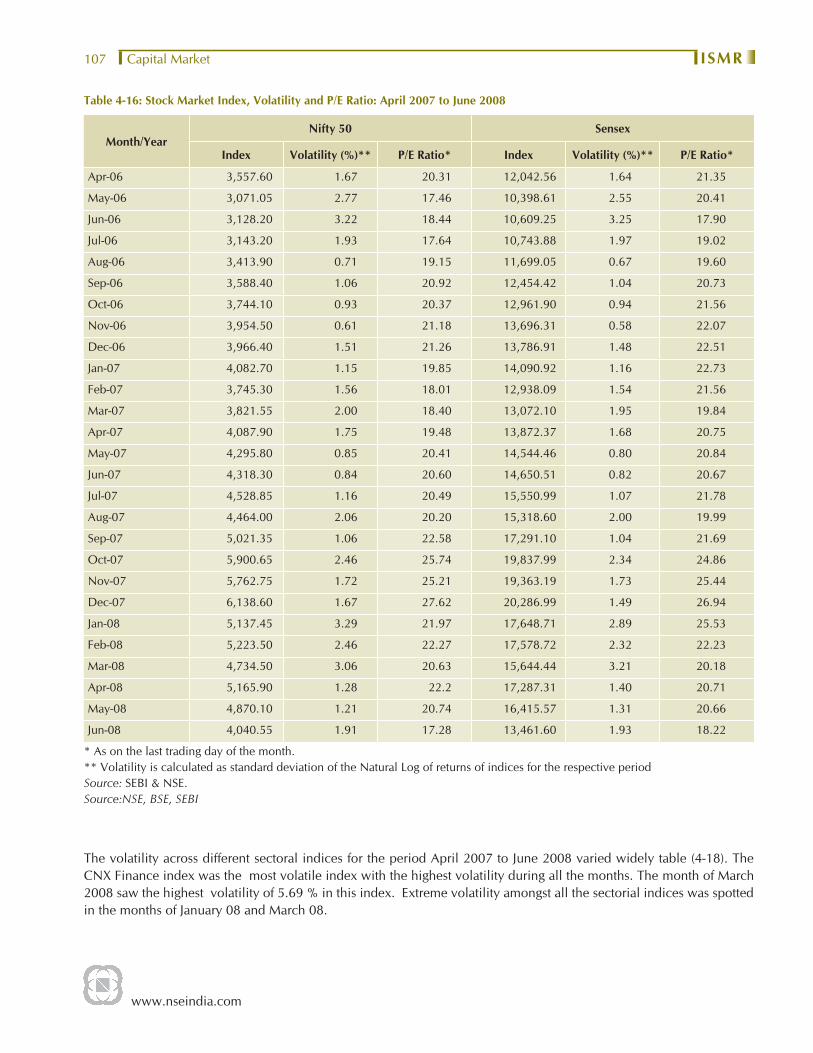
www.nseindia.com
Capital Market ISMR107
Table 4-16: Stock Market Index, Volatility and P/E Ratio: April 2007 to June 2008
Month/YearNifty 50 Sensex
Index Volatility (%)** P/E Ratio* Index Volatility (%)** P/E Ratio*
Apr-06 3,557.60 1.67 20.31 12,042.56 1.64 21.35
May-06 3,071.05 2.77 17.46 10,398.61 2.55 20.41
Jun-06 3,128.20 3.22 18.44 10,609.25 3.25 17.90
Jul-06 3,143.20 1.93 17.64 10,743.88 1.97 19.02
Aug-06 3,413.90 0.71 19.15 11,699.05 0.67 19.60
Sep-06 3,588.40 1.06 20.92 12,454.42 1.04 20.73
Oct-06 3,744.10 0.93 20.37 12,961.90 0.94 21.56
Nov-06 3,954.50 0.61 21.18 13,696.31 0.58 22.07
Dec-06 3,966.40 1.51 21.26 13,786.91 1.48 22.51
Jan-07 4,082.70 1.15 19.85 14,090.92 1.16 22.73
Feb-07 3,745.30 1.56 18.01 12,938.09 1.54 21.56
Mar-07 3,821.55 2.00 18.40 13,072.10 1.95 19.84
Apr-07 4,087.90 1.75 19.48 13,872.37 1.68 20.75
May-07 4,295.80 0.85 20.41 14,544.46 0.80 20.84
Jun-07 4,318.30 0.84 20.60 14,650.51 0.82 20.67
Jul-07 4,528.85 1.16 20.49 15,550.99 1.07 21.78
Aug-07 4,464.00 2.06 20.20 15,318.60 2.00 19.99
Sep-07 5,021.35 1.06 22.58 17,291.10 1.04 21.69
Oct-07 5,900.65 2.46 25.74 19,837.99 2.34 24.86
Nov-07 5,762.75 1.72 25.21 19,363.19 1.73 25.44
Dec-07 6,138.60 1.67 27.62 20,286.99 1.49 26.94
Jan-08 5,137.45 3.29 21.97 17,648.71 2.89 25.53
Feb-08 5,223.50 2.46 22.27 17,578.72 2.32 22.23
Mar-08 4,734.50 3.06 20.63 15,644.44 3.21 20.18
Apr-08 5,165.90 1.28 22.2 17,287.31 1.40 20.71
May-08 4,870.10 1.21 20.74 16,415.57 1.31 20.66
Jun-08 4,040.55 1.91 17.28 13,461.60 1.93 18.22
* As on the last trading day of the month.** Volatility is calculated as standard deviation of the Natural Log of returns of indices for the respective periodSource: SEBI & NSE.Source:NSE, BSE, SEBI
The volatility across different sectoral indices for the period April 2007 to June 2008 varied widely table (4-18). The CNX Finance index was the most volatile index with the highest volatility during all the months. The month of March 2008 saw the highest volatility of 5.69 % in this index. Extreme volatility amongst all the sectorial indices was spotted in the months of January 08 and March 08.
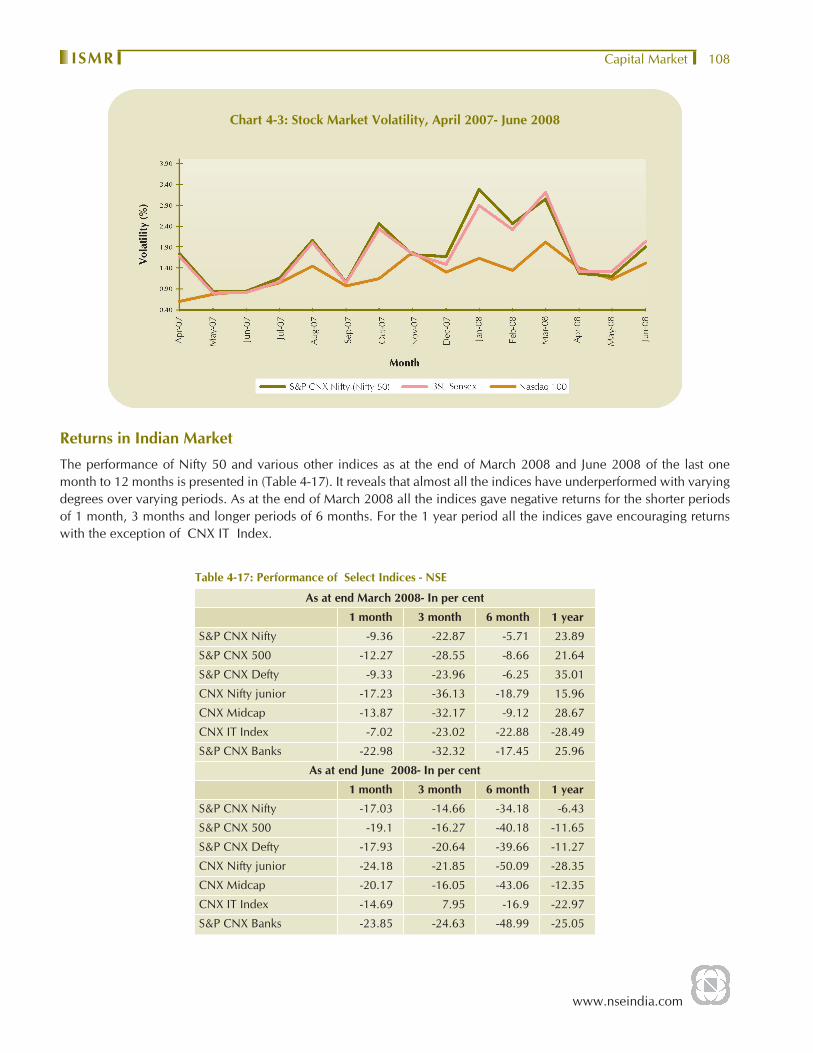
www.nseindia.com
Capital Market ISMR 108
Chart 4-3: Stock Market Volatility, April 2007- June 2008
Returns in Indian Market
The performance of Nifty 50 and various other indices as at the end of March 2008 and June 2008 of the last one month to 12 months is presented in (Table 4-17). It reveals that almost all the indices have underperformed with varying degrees over varying periods. As at the end of March 2008 all the indices gave negative returns for the shorter periods of 1 month, 3 months and longer periods of 6 months. For the 1 year period all the indices gave encouraging returns with the exception of CNX IT Index.
Table 4-17: Performance of Select Indices - NSE
As at end March 2008- In per cent
1 month 3 month 6 month 1 year
S&P CNX Nifty -9.36 -22.87 -5.71 23.89
S&P CNX 500 -12.27 -28.55 -8.66 21.64
S&P CNX Defty -9.33 -23.96 -6.25 35.01
CNX Nifty junior -17.23 -36.13 -18.79 15.96
CNX Midcap -13.87 -32.17 -9.12 28.67
CNX IT Index -7.02 -23.02 -22.88 -28.49
S&P CNX Banks -22.98 -32.32 -17.45 25.96
As at end June 2008- In per cent
1 month 3 month 6 month 1 year
S&P CNX Nifty -17.03 -14.66 -34.18 -6.43
S&P CNX 500 -19.1 -16.27 -40.18 -11.65
S&P CNX Defty -17.93 -20.64 -39.66 -11.27
CNX Nifty junior -24.18 -21.85 -50.09 -28.35
CNX Midcap -20.17 -16.05 -43.06 -12.35
CNX IT Index -14.69 7.95 -16.9 -22.97
S&P CNX Banks -23.85 -24.63 -48.99 -25.05
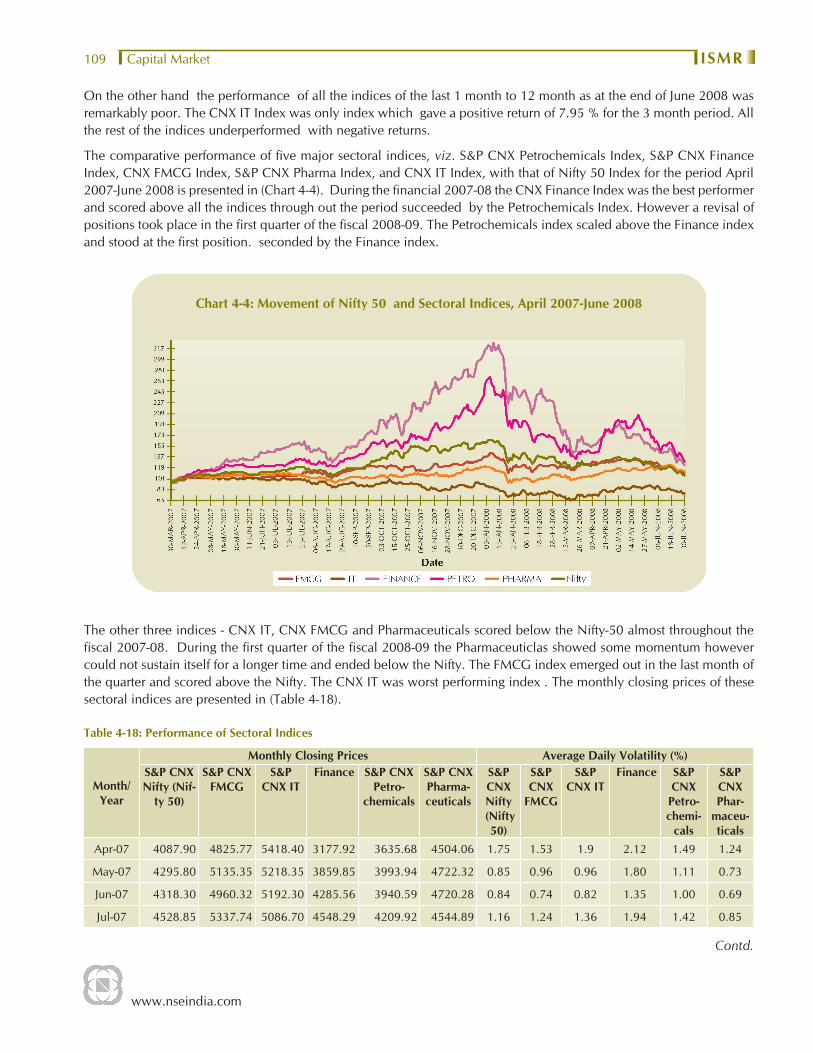
www.nseindia.com
Capital Market ISMR109
On the other hand the performance of all the indices of the last 1 month to 12 month as at the end of June 2008 was remarkably poor. The CNX IT Index was only index which gave a positive return of 7.95 % for the 3 month period. All the rest of the indices underperformed with negative returns.
The comparative performance of fi ve major sectoral indices, viz. S&P CNX Petrochemicals Index, S&P CNX Finance Index, CNX FMCG Index, S&P CNX Pharma Index, and CNX IT Index, with that of Nifty 50 Index for the period April 2007-June 2008 is presented in (Chart 4-4). During the fi nancial 2007-08 the CNX Finance Index was the best performer and scored above all the indices through out the period succeeded by the Petrochemicals Index. However a revisal of positions took place in the fi rst quarter of the fi scal 2008-09. The Petrochemicals index scaled above the Finance index and stood at the fi rst position. seconded by the Finance index.
Chart 4-4: Movement of Nifty 50 and Sectoral Indices, April 2007-June 2008
The other three indices - CNX IT, CNX FMCG and Pharmaceuticals scored below the Nifty-50 almost throughout the fi scal 2007-08. During the fi rst quarter of the fi scal 2008-09 the Pharmaceuticlas showed some momentum however could not sustain itself for a longer time and ended below the Nifty. The FMCG index emerged out in the last month of the quarter and scored above the Nifty. The CNX IT was worst performing index . The monthly closing prices of these sectoral indices are presented in (Table 4-18).
Table 4-18: Performance of Sectoral Indices
Month/ Year
Monthly Closing Prices Average Daily Volatility (%)S&P CNX Nifty (Nif-
ty 50)
S&P CNX FMCG
S&P CNX IT
Finance S&P CNX Petro-
chemicals
S&P CNX Pharma-ceuticals
S&P CNX Nifty
(Nifty 50)
S&P CNX
FMCG
S&P CNX IT
Finance S&P CNX
Petro-chemi-
cals
S&P CNX Phar-
maceu-ticals
Apr-07 4087.90 4825.77 5418.40 3177.92 3635.68 4504.06 1.75 1.53 1.9 2.12 1.49 1.24
May-07 4295.80 5135.35 5218.35 3859.85 3993.94 4722.32 0.85 0.96 0.96 1.80 1.11 0.73
Jun-07 4318.30 4960.32 5192.30 4285.56 3940.59 4720.28 0.84 0.74 0.82 1.35 1.00 0.69
Jul-07 4528.85 5337.74 5086.70 4548.29 4209.92 4544.89 1.16 1.24 1.36 1.94 1.42 0.85
Contd.
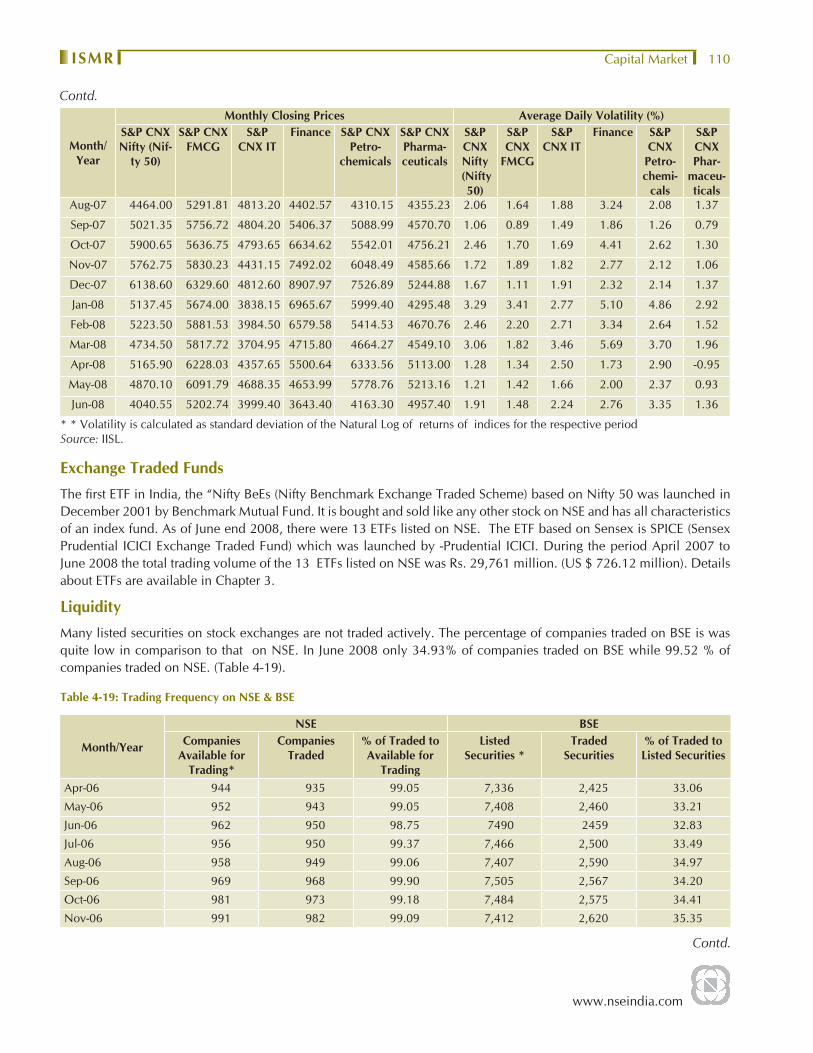
www.nseindia.com
Capital Market ISMR 110
Month/ Year
Monthly Closing Prices Average Daily Volatility (%)S&P CNX Nifty (Nif-
ty 50)
S&P CNX FMCG
S&P CNX IT
Finance S&P CNX Petro-
chemicals
S&P CNX Pharma-ceuticals
S&P CNX Nifty
(Nifty 50)
S&P CNX
FMCG
S&P CNX IT
Finance S&P CNX
Petro-chemi-
cals
S&P CNX Phar-
maceu-ticals
Aug-07 4464.00 5291.81 4813.20 4402.57 4310.15 4355.23 2.06 1.64 1.88 3.24 2.08 1.37
Sep-07 5021.35 5756.72 4804.20 5406.37 5088.99 4570.70 1.06 0.89 1.49 1.86 1.26 0.79
Oct-07 5900.65 5636.75 4793.65 6634.62 5542.01 4756.21 2.46 1.70 1.69 4.41 2.62 1.30
Nov-07 5762.75 5830.23 4431.15 7492.02 6048.49 4585.66 1.72 1.89 1.82 2.77 2.12 1.06
Dec-07 6138.60 6329.60 4812.60 8907.97 7526.89 5244.88 1.67 1.11 1.91 2.32 2.14 1.37
Jan-08 5137.45 5674.00 3838.15 6965.67 5999.40 4295.48 3.29 3.41 2.77 5.10 4.86 2.92
Feb-08 5223.50 5881.53 3984.50 6579.58 5414.53 4670.76 2.46 2.20 2.71 3.34 2.64 1.52
Mar-08 4734.50 5817.72 3704.95 4715.80 4664.27 4549.10 3.06 1.82 3.46 5.69 3.70 1.96
Apr-08 5165.90 6228.03 4357.65 5500.64 6333.56 5113.00 1.28 1.34 2.50 1.73 2.90 -0.95
May-08 4870.10 6091.79 4688.35 4653.99 5778.76 5213.16 1.21 1.42 1.66 2.00 2.37 0.93
Jun-08 4040.55 5202.74 3999.40 3643.40 4163.30 4957.40 1.91 1.48 2.24 2.76 3.35 1.36
* * Volatility is calculated as standard deviation of the Natural Log of returns of indices for the respective periodSource: IISL.
Exchange Traded Funds
The fi rst ETF in India, the “Nifty BeEs (Nifty Benchmark Exchange Traded Scheme) based on Nifty 50 was launched in December 2001 by Benchmark Mutual Fund. It is bought and sold like any other stock on NSE and has all characteristics of an index fund. As of June end 2008, there were 13 ETFs listed on NSE. The ETF based on Sensex is SPICE (Sensex Prudential ICICI Exchange Traded Fund) which was launched by -Prudential ICICI. During the period April 2007 to June 2008 the total trading volume of the 13 ETFs listed on NSE was Rs. 29,761 million. (US $ 726.12 million). Details about ETFs are available in Chapter 3.
Liquidity
Many listed securities on stock exchanges are not traded actively. The percentage of companies traded on BSE is was quite low in comparison to that on NSE. In June 2008 only 34.93% of companies traded on BSE while 99.52 % of companies traded on NSE. (Table 4-19).
Table 4-19: Trading Frequency on NSE & BSE
Month/Year
NSE BSECompanies
Available for Trading*
Companies Traded
% of Traded to Available for
Trading
Listed Securities *
Traded Securities
% of Traded to Listed Securities
Apr-06 944 935 99.05 7,336 2,425 33.06
May-06 952 943 99.05 7,408 2,460 33.21
Jun-06 962 950 98.75 7490 2459 32.83
Jul-06 956 950 99.37 7,466 2,500 33.49
Aug-06 958 949 99.06 7,407 2,590 34.97
Sep-06 969 968 99.90 7,505 2,567 34.20
Oct-06 981 973 99.18 7,484 2,575 34.41
Nov-06 991 982 99.09 7,412 2,620 35.35
Contd.
Contd.
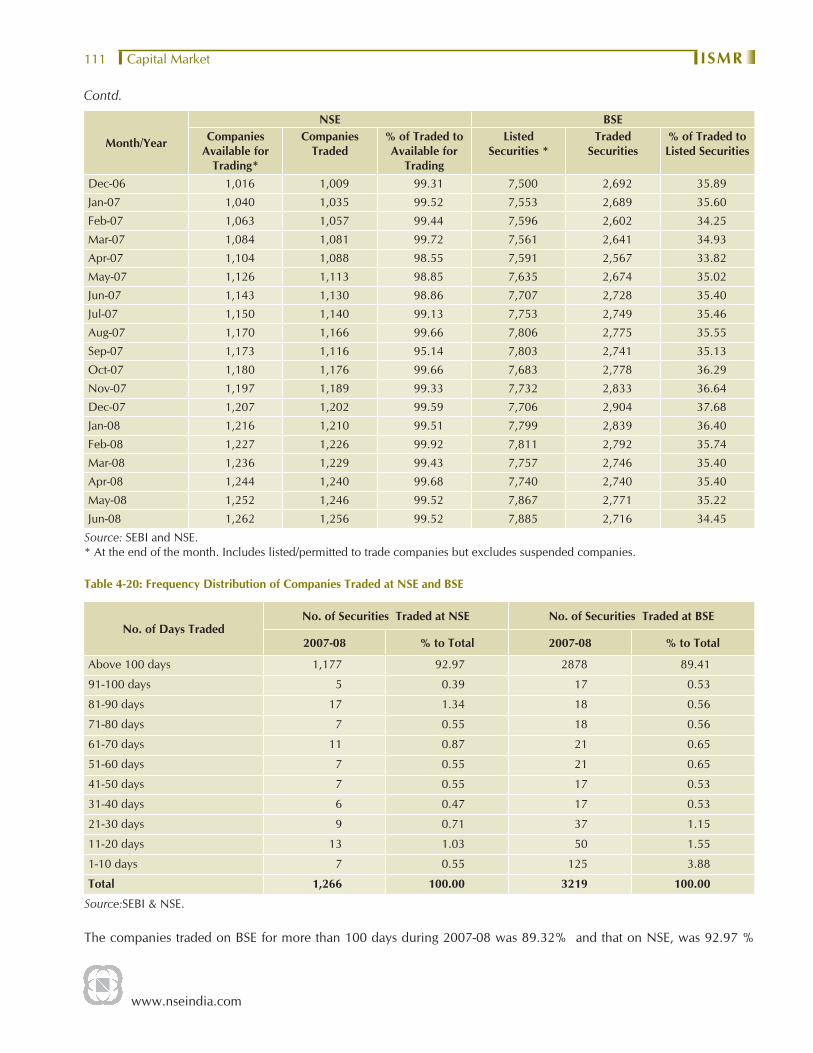
www.nseindia.com
Capital Market ISMR111
Month/Year
NSE BSECompanies
Available for Trading*
Companies Traded
% of Traded to Available for
Trading
Listed Securities *
Traded Securities
% of Traded to Listed Securities
Dec-06 1,016 1,009 99.31 7,500 2,692 35.89
Jan-07 1,040 1,035 99.52 7,553 2,689 35.60
Feb-07 1,063 1,057 99.44 7,596 2,602 34.25
Mar-07 1,084 1,081 99.72 7,561 2,641 34.93
Apr-07 1,104 1,088 98.55 7,591 2,567 33.82
May-07 1,126 1,113 98.85 7,635 2,674 35.02
Jun-07 1,143 1,130 98.86 7,707 2,728 35.40
Jul-07 1,150 1,140 99.13 7,753 2,749 35.46
Aug-07 1,170 1,166 99.66 7,806 2,775 35.55
Sep-07 1,173 1,116 95.14 7,803 2,741 35.13
Oct-07 1,180 1,176 99.66 7,683 2,778 36.29
Nov-07 1,197 1,189 99.33 7,732 2,833 36.64
Dec-07 1,207 1,202 99.59 7,706 2,904 37.68
Jan-08 1,216 1,210 99.51 7,799 2,839 36.40
Feb-08 1,227 1,226 99.92 7,811 2,792 35.74
Mar-08 1,236 1,229 99.43 7,757 2,746 35.40
Apr-08 1,244 1,240 99.68 7,740 2,740 35.40
May-08 1,252 1,246 99.52 7,867 2,771 35.22
Jun-08 1,262 1,256 99.52 7,885 2,716 34.45
Source: SEBI and NSE.* At the end of the month. Includes listed/permitted to trade companies but excludes suspended companies.
Table 4-20: Frequency Distribution of Companies Traded at NSE and BSE
No. of Days TradedNo. of Securities Traded at NSE No. of Securities Traded at BSE
2007-08 % to Total 2007-08 % to Total
Above 100 days 1,177 92.97 2878 89.41
91-100 days 5 0.39 17 0.53
81-90 days 17 1.34 18 0.56
71-80 days 7 0.55 18 0.56
61-70 days 11 0.87 21 0.65
51-60 days 7 0.55 21 0.65
41-50 days 7 0.55 17 0.53
31-40 days 6 0.47 17 0.53
21-30 days 9 0.71 37 1.15
11-20 days 13 1.03 50 1.55
1-10 days 7 0.55 125 3.88
Total 1,266 100.00 3219 100.00
Source:SEBI & NSE.
The companies traded on BSE for more than 100 days during 2007-08 was 89.32% and that on NSE, was 92.97 %
Contd.
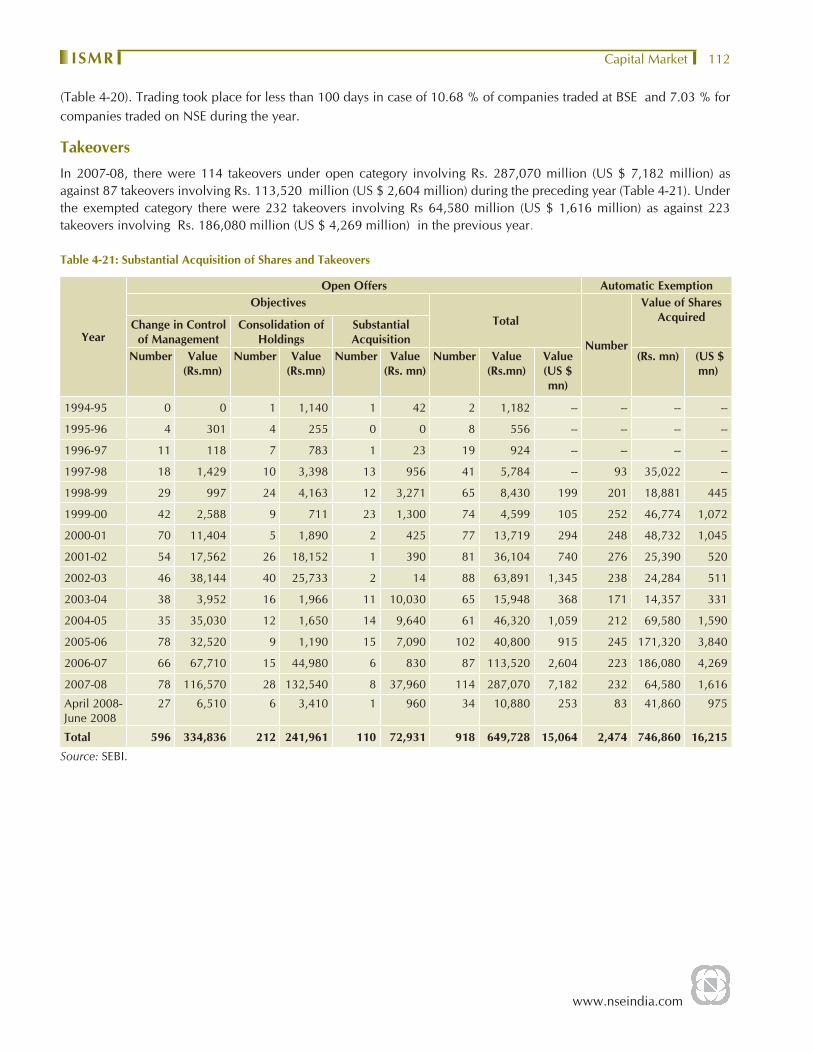
www.nseindia.com
Capital Market ISMR 112
(Table 4-20). Trading took place for less than 100 days in case of 10.68 % of companies traded at BSE and 7.03 % for companies traded on NSE during the year.
Takeovers
In 2007-08, there were 114 takeovers under open category involving Rs. 287,070 million (US $ 7,182 million) as against 87 takeovers involving Rs. 113,520 million (US $ 2,604 million) during the preceding year (Table 4-21). Under the exempted category there were 232 takeovers involving Rs 64,580 million (US $ 1,616 million) as against 223 takeovers involving Rs. 186,080 million (US $ 4,269 million) in the previous year.
Table 4-21: Substantial Acquisition of Shares and Takeovers
Year
Open Offers Automatic ExemptionObjectives
Total
Number
Value of Shares AcquiredChange in Control
of ManagementConsolidation of
HoldingsSubstantial Acquisition
Number Value(Rs.mn)
Number Value(Rs.mn)
Number Value(Rs. mn)
Number Value(Rs.mn)
Value(US $ mn)
(Rs. mn) (US $ mn)
1994-95 0 0 1 1,140 1 42 2 1,182 -- -- -- --
1995-96 4 301 4 255 0 0 8 556 -- -- -- --
1996-97 11 118 7 783 1 23 19 924 -- -- -- --
1997-98 18 1,429 10 3,398 13 956 41 5,784 -- 93 35,022 --
1998-99 29 997 24 4,163 12 3,271 65 8,430 199 201 18,881 445
1999-00 42 2,588 9 711 23 1,300 74 4,599 105 252 46,774 1,072
2000-01 70 11,404 5 1,890 2 425 77 13,719 294 248 48,732 1,045
2001-02 54 17,562 26 18,152 1 390 81 36,104 740 276 25,390 520
2002-03 46 38,144 40 25,733 2 14 88 63,891 1,345 238 24,284 511
2003-04 38 3,952 16 1,966 11 10,030 65 15,948 368 171 14,357 331
2004-05 35 35,030 12 1,650 14 9,640 61 46,320 1,059 212 69,580 1,590
2005-06 78 32,520 9 1,190 15 7,090 102 40,800 915 245 171,320 3,840
2006-07 66 67,710 15 44,980 6 830 87 113,520 2,604 223 186,080 4,269
2007-08 78 116,570 28 132,540 8 37,960 114 287,070 7,182 232 64,580 1,616
April 2008- June 2008
27 6,510 6 3,410 1 960 34 10,880 253 83 41,860 975
Total 596 334,836 212 241,961 110 72,931 918 649,728 15,064 2,474 746,860 16,215
Source: SEBI.
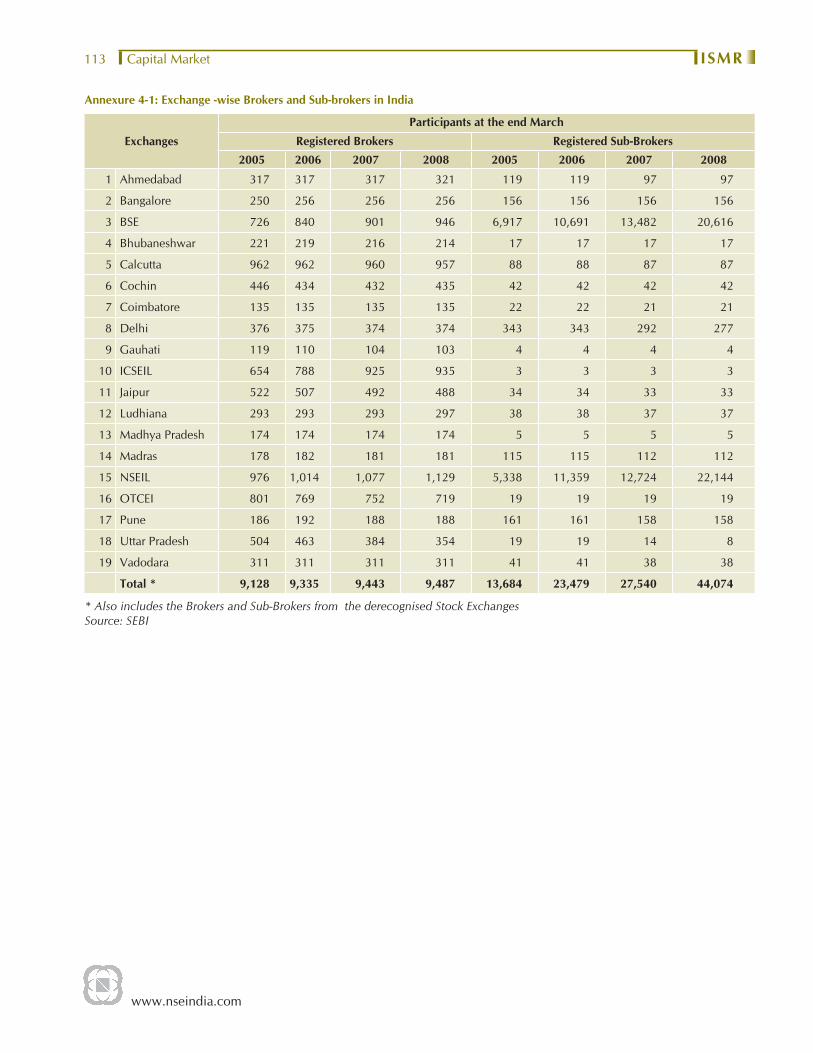
www.nseindia.com
Capital Market ISMR113
Annexure 4-1: Exchange -wise Brokers and Sub-brokers in India
Exchanges
Participants at the end March
Registered Brokers Registered Sub-Brokers2005 2006 2007 2008 2005 2006 2007 2008
1 Ahmedabad 317 317 317 321 119 119 97 97
2 Bangalore 250 256 256 256 156 156 156 156
3 BSE 726 840 901 946 6,917 10,691 13,482 20,616
4 Bhubaneshwar 221 219 216 214 17 17 17 17
5 Calcutta 962 962 960 957 88 88 87 87
6 Cochin 446 434 432 435 42 42 42 42
7 Coimbatore 135 135 135 135 22 22 21 21
8 Delhi 376 375 374 374 343 343 292 277
9 Gauhati 119 110 104 103 4 4 4 4
10 ICSEIL 654 788 925 935 3 3 3 3
11 Jaipur 522 507 492 488 34 34 33 33
12 Ludhiana 293 293 293 297 38 38 37 37
13 Madhya Pradesh 174 174 174 174 5 5 5 5
14 Madras 178 182 181 181 115 115 112 112
15 NSEIL 976 1,014 1,077 1,129 5,338 11,359 12,724 22,144
16 OTCEI 801 769 752 719 19 19 19 19
17 Pune 186 192 188 188 161 161 158 158
18 Uttar Pradesh 504 463 384 354 19 19 14 8
19 Vadodara 311 311 311 311 41 41 38 38
Total * 9,128 9,335 9,443 9,487 13,684 23,479 27,540 44,074
* Also includes the Brokers and Sub-Brokers from the derecognised Stock ExchangesSource: SEBI
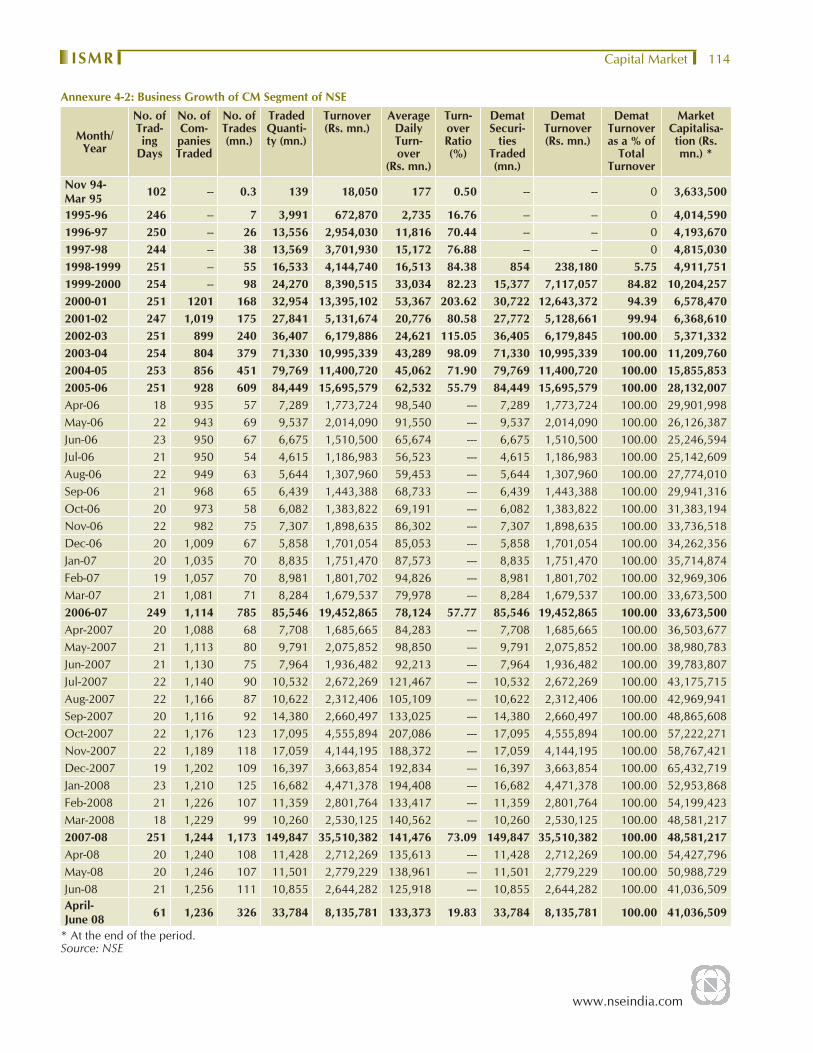
www.nseindia.com
Capital Market ISMR 114
Annexure 4-2: Business Growth of CM Segment of NSE
Month/Year
No. of Trad-ing
Days
No. of Com-panies Traded
No. of Trades (mn.)
Traded Quanti-ty (mn.)
Turnover (Rs. mn.)
Average Daily Turn-over
(Rs. mn.)
Turn-over Ratio (%)
Demat Securi-
ties Traded (mn.)
Demat Turnover (Rs. mn.)
Demat Turnover as a % of
Total Turnover
Market Capitalisa-tion (Rs. mn.) *
Nov 94-Mar 95 102 -- 0.3 139 18,050 177 0.50 -- -- 0 3,633,500
1995-96 246 -- 7 3,991 672,870 2,735 16.76 -- -- 0 4,014,5901996-97 250 -- 26 13,556 2,954,030 11,816 70.44 -- -- 0 4,193,6701997-98 244 -- 38 13,569 3,701,930 15,172 76.88 -- -- 0 4,815,0301998-1999 251 -- 55 16,533 4,144,740 16,513 84.38 854 238,180 5.75 4,911,7511999-2000 254 -- 98 24,270 8,390,515 33,034 82.23 15,377 7,117,057 84.82 10,204,2572000-01 251 1201 168 32,954 13,395,102 53,367 203.62 30,722 12,643,372 94.39 6,578,4702001-02 247 1,019 175 27,841 5,131,674 20,776 80.58 27,772 5,128,661 99.94 6,368,6102002-03 251 899 240 36,407 6,179,886 24,621 115.05 36,405 6,179,845 100.00 5,371,3322003-04 254 804 379 71,330 10,995,339 43,289 98.09 71,330 10,995,339 100.00 11,209,7602004-05 253 856 451 79,769 11,400,720 45,062 71.90 79,769 11,400,720 100.00 15,855,8532005-06 251 928 609 84,449 15,695,579 62,532 55.79 84,449 15,695,579 100.00 28,132,007Apr-06 18 935 57 7,289 1,773,724 98,540 --- 7,289 1,773,724 100.00 29,901,998May-06 22 943 69 9,537 2,014,090 91,550 --- 9,537 2,014,090 100.00 26,126,387Jun-06 23 950 67 6,675 1,510,500 65,674 --- 6,675 1,510,500 100.00 25,246,594Jul-06 21 950 54 4,615 1,186,983 56,523 --- 4,615 1,186,983 100.00 25,142,609Aug-06 22 949 63 5,644 1,307,960 59,453 --- 5,644 1,307,960 100.00 27,774,010Sep-06 21 968 65 6,439 1,443,388 68,733 --- 6,439 1,443,388 100.00 29,941,316Oct-06 20 973 58 6,082 1,383,822 69,191 --- 6,082 1,383,822 100.00 31,383,194Nov-06 22 982 75 7,307 1,898,635 86,302 --- 7,307 1,898,635 100.00 33,736,518Dec-06 20 1,009 67 5,858 1,701,054 85,053 --- 5,858 1,701,054 100.00 34,262,356Jan-07 20 1,035 70 8,835 1,751,470 87,573 --- 8,835 1,751,470 100.00 35,714,874Feb-07 19 1,057 70 8,981 1,801,702 94,826 --- 8,981 1,801,702 100.00 32,969,306Mar-07 21 1,081 71 8,284 1,679,537 79,978 --- 8,284 1,679,537 100.00 33,673,500 2006-07 249 1,114 785 85,546 19,452,865 78,124 57.77 85,546 19,452,865 100.00 33,673,500Apr-2007 20 1,088 68 7,708 1,685,665 84,283 --- 7,708 1,685,665 100.00 36,503,677May-2007 21 1,113 80 9,791 2,075,852 98,850 --- 9,791 2,075,852 100.00 38,980,783Jun-2007 21 1,130 75 7,964 1,936,482 92,213 --- 7,964 1,936,482 100.00 39,783,807Jul-2007 22 1,140 90 10,532 2,672,269 121,467 --- 10,532 2,672,269 100.00 43,175,715Aug-2007 22 1,166 87 10,622 2,312,406 105,109 --- 10,622 2,312,406 100.00 42,969,941Sep-2007 20 1,116 92 14,380 2,660,497 133,025 --- 14,380 2,660,497 100.00 48,865,608Oct-2007 22 1,176 123 17,095 4,555,894 207,086 --- 17,095 4,555,894 100.00 57,222,271Nov-2007 22 1,189 118 17,059 4,144,195 188,372 --- 17,059 4,144,195 100.00 58,767,421Dec-2007 19 1,202 109 16,397 3,663,854 192,834 --- 16,397 3,663,854 100.00 65,432,719Jan-2008 23 1,210 125 16,682 4,471,378 194,408 --- 16,682 4,471,378 100.00 52,953,868Feb-2008 21 1,226 107 11,359 2,801,764 133,417 --- 11,359 2,801,764 100.00 54,199,423Mar-2008 18 1,229 99 10,260 2,530,125 140,562 --- 10,260 2,530,125 100.00 48,581,2172007-08 251 1,244 1,173 149,847 35,510,382 141,476 73.09 149,847 35,510,382 100.00 48,581,217Apr-08 20 1,240 108 11,428 2,712,269 135,613 --- 11,428 2,712,269 100.00 54,427,796May-08 20 1,246 107 11,501 2,779,229 138,961 --- 11,501 2,779,229 100.00 50,988,729Jun-08 21 1,256 111 10,855 2,644,282 125,918 --- 10,855 2,644,282 100.00 41,036,509April- June 08 61 1,236 326 33,784 8,135,781 133,373 19.83 33,784 8,135,781 100.00 41,036,509
* At the end of the period.Source: NSE
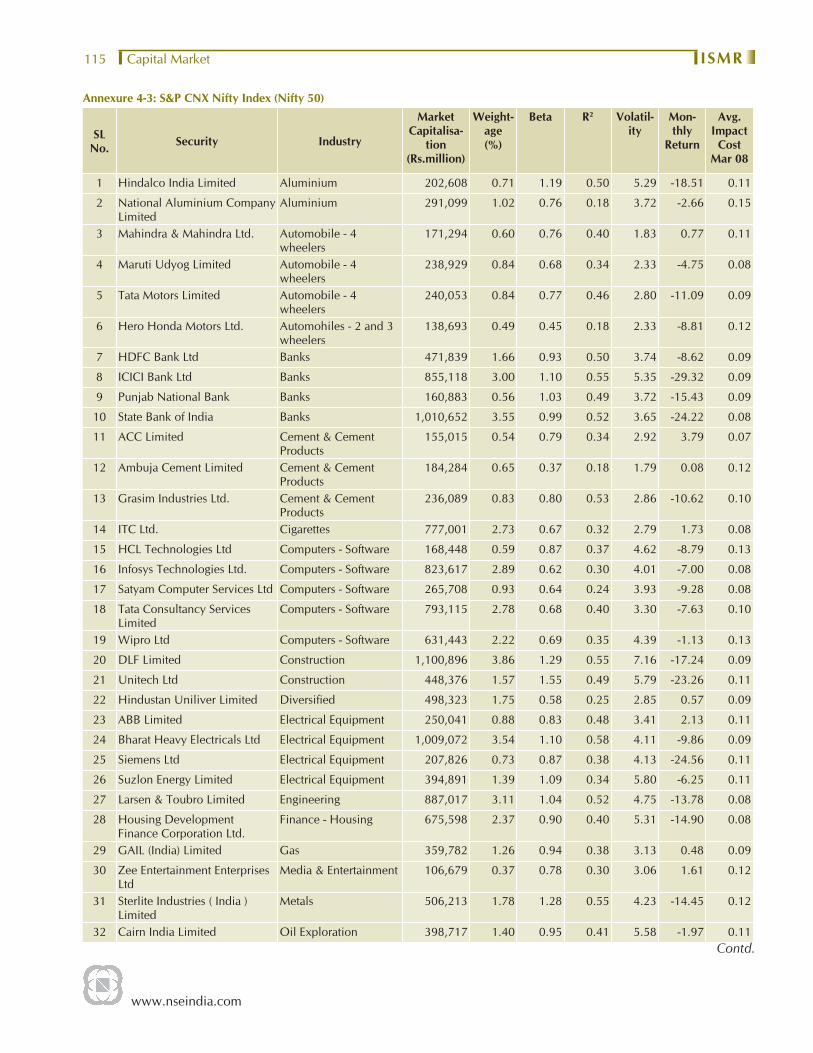
www.nseindia.com
Capital Market ISMR115
Annexure 4-3: S&P CNX Nifty Index (Nifty 50)
SL No. Security Industry
Market Capitalisa-
tion(Rs.million)
Weight-age(%)
Beta R2 Volatil-ity
Mon-thly
Return
Avg. Impact
Cost Mar 08
1 Hindalco India Limited Aluminium 202,608 0.71 1.19 0.50 5.29 -18.51 0.11
2 National Aluminium Company Limited
Aluminium 291,099 1.02 0.76 0.18 3.72 -2.66 0.15
3 Mahindra & Mahindra Ltd. Automobile - 4 wheelers
171,294 0.60 0.76 0.40 1.83 0.77 0.11
4 Maruti Udyog Limited Automobile - 4 wheelers
238,929 0.84 0.68 0.34 2.33 -4.75 0.08
5 Tata Motors Limited Automobile - 4 wheelers
240,053 0.84 0.77 0.46 2.80 -11.09 0.09
6 Hero Honda Motors Ltd. Automohiles - 2 and 3 wheelers
138,693 0.49 0.45 0.18 2.33 -8.81 0.12
7 HDFC Bank Ltd Banks 471,839 1.66 0.93 0.50 3.74 -8.62 0.09
8 ICICI Bank Ltd Banks 855,118 3.00 1.10 0.55 5.35 -29.32 0.09
9 Punjab National Bank Banks 160,883 0.56 1.03 0.49 3.72 -15.43 0.09
10 State Bank of India Banks 1,010,652 3.55 0.99 0.52 3.65 -24.22 0.08
11 ACC Limited Cement & Cement Products
155,015 0.54 0.79 0.34 2.92 3.79 0.07
12 Ambuja Cement Limited Cement & Cement Products
184,284 0.65 0.37 0.18 1.79 0.08 0.12
13 Grasim Industries Ltd. Cement & Cement Products
236,089 0.83 0.80 0.53 2.86 -10.62 0.10
14 ITC Ltd. Cigarettes 777,001 2.73 0.67 0.32 2.79 1.73 0.08
15 HCL Technologies Ltd Computers - Software 168,448 0.59 0.87 0.37 4.62 -8.79 0.13
16 Infosys Technologies Ltd. Computers - Software 823,617 2.89 0.62 0.30 4.01 -7.00 0.08
17 Satyam Computer Services Ltd Computers - Software 265,708 0.93 0.64 0.24 3.93 -9.28 0.08
18 Tata Consultancy Services Limited
Computers - Software 793,115 2.78 0.68 0.40 3.30 -7.63 0.10
19 Wipro Ltd Computers - Software 631,443 2.22 0.69 0.35 4.39 -1.13 0.13
20 DLF Limited Construction 1,100,896 3.86 1.29 0.55 7.16 -17.24 0.09
21 Unitech Ltd Construction 448,376 1.57 1.55 0.49 5.79 -23.26 0.11
22 Hindustan Uniliver Limited Diversifi ed 498,323 1.75 0.58 0.25 2.85 0.57 0.09
23 ABB Limited Electrical Equipment 250,041 0.88 0.83 0.48 3.41 2.13 0.11
24 Bharat Heavy Electricals Ltd Electrical Equipment 1,009,072 3.54 1.10 0.58 4.11 -9.86 0.09
25 Siemens Ltd Electrical Equipment 207,826 0.73 0.87 0.38 4.13 -24.56 0.11
26 Suzlon Energy Limited Electrical Equipment 394,891 1.39 1.09 0.34 5.80 -6.25 0.11
27 Larsen & Toubro Limited Engineering 887,017 3.11 1.04 0.52 4.75 -13.78 0.08
28 Housing Development Finance Corporation Ltd.
Finance - Housing 675,598 2.37 0.90 0.40 5.31 -14.90 0.08
29 GAIL (India) Limited Gas 359,782 1.26 0.94 0.38 3.13 0.48 0.09
30 Zee Entertainment Enterprises Ltd
Media & Entertainment 106,679 0.37 0.78 0.30 3.06 1.61 0.12
31 Sterlite Industries ( India ) Limited
Metals 506,213 1.78 1.28 0.55 4.23 -14.45 0.12
32 Cairn India Limited Oil Exploration 398,717 1.40 0.95 0.41 5.58 -1.97 0.11Contd.
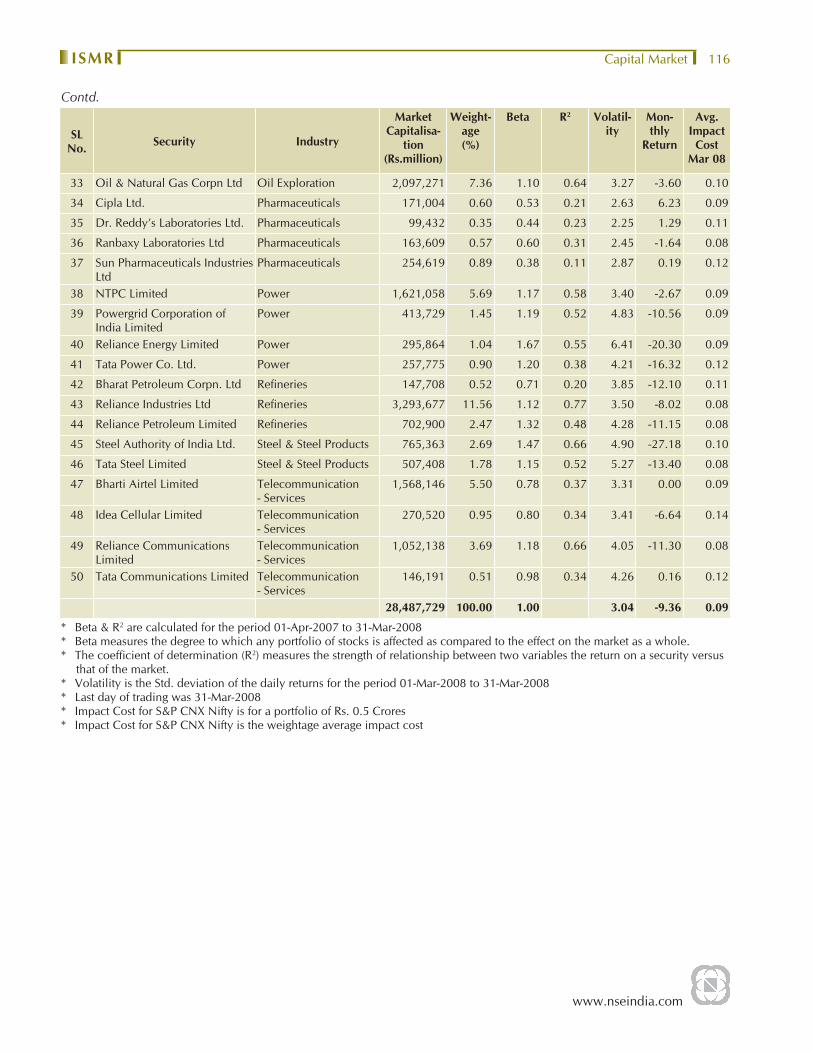
www.nseindia.com
Capital Market ISMR 116
SL No. Security Industry
Market Capitalisa-
tion(Rs.million)
Weight-age(%)
Beta R2 Volatil-ity
Mon-thly
Return
Avg. Impact
Cost Mar 08
33 Oil & Natural Gas Corpn Ltd Oil Exploration 2,097,271 7.36 1.10 0.64 3.27 -3.60 0.10
34 Cipla Ltd. Pharmaceuticals 171,004 0.60 0.53 0.21 2.63 6.23 0.09
35 Dr. Reddy’s Laboratories Ltd. Pharmaceuticals 99,432 0.35 0.44 0.23 2.25 1.29 0.11
36 Ranbaxy Laboratories Ltd Pharmaceuticals 163,609 0.57 0.60 0.31 2.45 -1.64 0.08
37 Sun Pharmaceuticals Industries Ltd
Pharmaceuticals 254,619 0.89 0.38 0.11 2.87 0.19 0.12
38 NTPC Limited Power 1,621,058 5.69 1.17 0.58 3.40 -2.67 0.09
39 Powergrid Corporation of India Limited
Power 413,729 1.45 1.19 0.52 4.83 -10.56 0.09
40 Reliance Energy Limited Power 295,864 1.04 1.67 0.55 6.41 -20.30 0.09
41 Tata Power Co. Ltd. Power 257,775 0.90 1.20 0.38 4.21 -16.32 0.12
42 Bharat Petroleum Corpn. Ltd Refi neries 147,708 0.52 0.71 0.20 3.85 -12.10 0.11
43 Reliance Industries Ltd Refi neries 3,293,677 11.56 1.12 0.77 3.50 -8.02 0.08
44 Reliance Petroleum Limited Refi neries 702,900 2.47 1.32 0.48 4.28 -11.15 0.08
45 Steel Authority of India Ltd. Steel & Steel Products 765,363 2.69 1.47 0.66 4.90 -27.18 0.10
46 Tata Steel Limited Steel & Steel Products 507,408 1.78 1.15 0.52 5.27 -13.40 0.08
47 Bharti Airtel Limited Telecommunication - Services
1,568,146 5.50 0.78 0.37 3.31 0.00 0.09
48 Idea Cellular Limited Telecommunication - Services
270,520 0.95 0.80 0.34 3.41 -6.64 0.14
49 Reliance Communications Limited
Telecommunication - Services
1,052,138 3.69 1.18 0.66 4.05 -11.30 0.08
50 Tata Communications Limited Telecommunication - Services
146,191 0.51 0.98 0.34 4.26 0.16 0.12
28,487,729 100.00 1.00 3.04 -9.36 0.09
* Beta & R2 are calculated for the period 01-Apr-2007 to 31-Mar-2008* Beta measures the degree to which any portfolio of stocks is affected as compared to the effect on the market as a whole.* The coeffi cient of determination (R2) measures the strength of relationship between two variables the return on a security versus
that of the market.* Volatility is the Std. deviation of the daily returns for the period 01-Mar-2008 to 31-Mar-2008* Last day of trading was 31-Mar-2008* Impact Cost for S&P CNX Nifty is for a portfolio of Rs. 0.5 Crores * Impact Cost for S&P CNX Nifty is the weightage average impact cost
Contd.