rns number : 8333g drax group plc 29 july 2021 29 july
TRANSCRIPT
28/07/2021 announcement2210124.html
file:///C:/Users/fensomb/AppData/Local/Microsoft/Windows/INetCache/IE/ITFHD74A/announcement2210124.html 1/49
RNS Number : 8333GDrax Group PLC29 July 2021
29 July 2021DRAX GROUP PLC (Symbol: DRX)
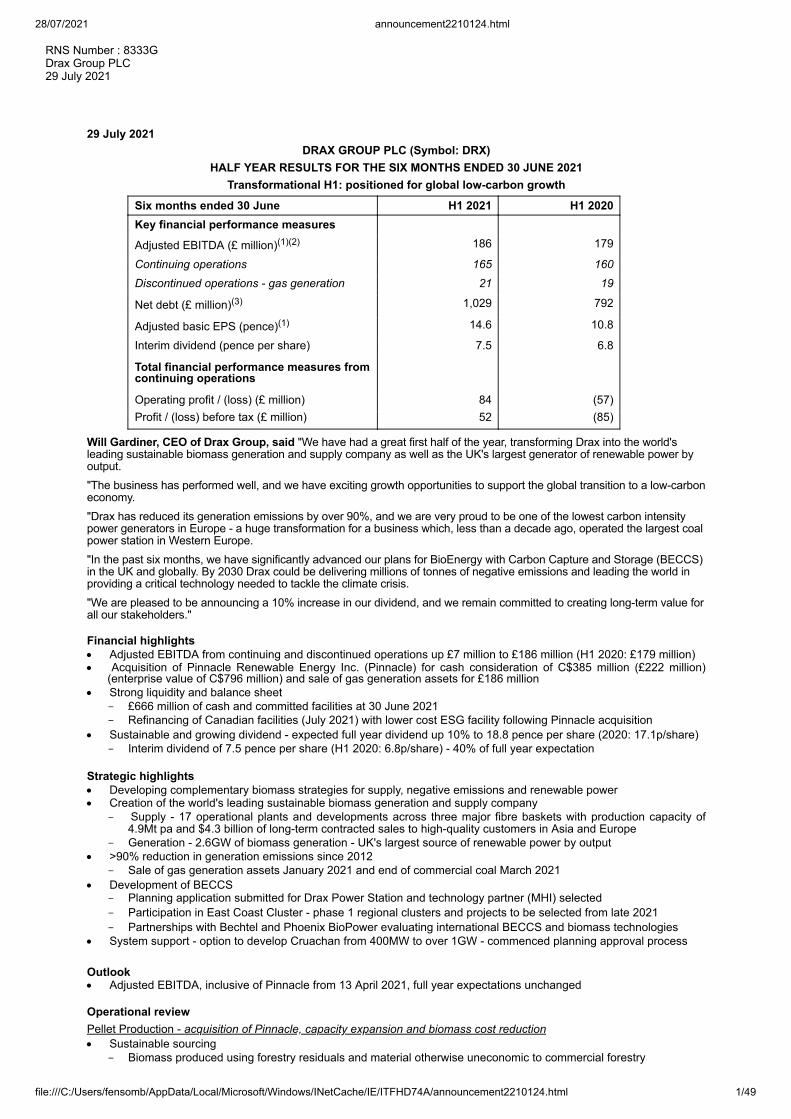
HALF YEAR RESULTS FOR THE SIX MONTHS ENDED 30 JUNE 2021Transformational H1: positioned for global low-carbon growth
Six months ended 30 June H1 2021 H1 2020Key financial performance measures
Adjusted EBITDA (£ million)(1)(2) 186 179
Continuing operations 165 160Discontinued operations - gas generation 21 19
Net debt (£ million)(3) 1,029 792
Adjusted basic EPS (pence)(1) 14.6 10.8
Interim dividend (pence per share) 7.5 6.8
Total financial performance measures fromcontinuing operations
Operating profit / (loss) (£ million) 84 (57)Profit / (loss) before tax (£ million) 52 (85)
Will Gardiner, CEO of Drax Group, said "We have had a great first half of the year, transforming Drax into the world'sleading sustainable biomass generation and supply company as well as the UK's largest generator of renewable power byoutput."The business has performed well, and we have exciting growth opportunities to support the global transition to a low-carboneconomy."Drax has reduced its generation emissions by over 90%, and we are very proud to be one of the lowest carbon intensitypower generators in Europe - a huge transformation for a business which, less than a decade ago, operated the largest coalpower station in Western Europe."In the past six months, we have significantly advanced our plans for BioEnergy with Carbon Capture and Storage (BECCS)in the UK and globally. By 2030 Drax could be delivering millions of tonnes of negative emissions and leading the world inproviding a critical technology needed to tackle the climate crisis."We are pleased to be announcing a 10% increase in our dividend, and we remain committed to creating long-term value forall our stakeholders." Financial highlights· Adjusted EBITDA from continuing and discontinued operations up £7 million to £186 million (H1 2020: £179 million)· Acquisition of Pinnacle Renewable Energy Inc. (Pinnacle) for cash consideration of C$385 million (£222 million)
(enterprise value of C$796 million) and sale of gas generation assets for £186 million· Strong liquidity and balance sheet
- £666 million of cash and committed facilities at 30 June 2021- Refinancing of Canadian facilities (July 2021) with lower cost ESG facility following Pinnacle acquisition
· Sustainable and growing dividend - expected full year dividend up 10% to 18.8 pence per share (2020: 17.1p/share)- Interim dividend of 7.5 pence per share (H1 2020: 6.8p/share) - 40% of full year expectation
Strategic highlights· Developing complementary biomass strategies for supply, negative emissions and renewable power· Creation of the world's leading sustainable biomass generation and supply company
- Supply - 17 operational plants and developments across three major fibre baskets with production capacity of4.9Mt pa and $4.3 billion of long-term contracted sales to high-quality customers in Asia and Europe
- Generation - 2.6GW of biomass generation - UK's largest source of renewable power by output· >90% reduction in generation emissions since 2012
- Sale of gas generation assets January 2021 and end of commercial coal March 2021· Development of BECCS
- Planning application submitted for Drax Power Station and technology partner (MHI) selected- Participation in East Coast Cluster - phase 1 regional clusters and projects to be selected from late 2021- Partnerships with Bechtel and Phoenix BioPower evaluating international BECCS and biomass technologies
· System support - option to develop Cruachan from 400MW to over 1GW - commenced planning approval process Outlook· Adjusted EBITDA, inclusive of Pinnacle from 13 April 2021, full year expectations unchanged
Operational reviewPellet Production - acquisition of Pinnacle, capacity expansion and biomass cost reduction· Sustainable sourcing
- Biomass produced using forestry residuals and material otherwise uneconomic to commercial forestry
28/07/2021 announcement2210124.html
file:///C:/Users/fensomb/AppData/Local/Microsoft/Windows/INetCache/IE/ITFHD74A/announcement2210124.html 2/49
- Science-based sustainability policy fully compliant with current UK and EU law on sustainable sourcing andaligned with UN guidelines for carbon accounting
- All woody biomass verified and audited against FSC®(4), PEFC or SBP requirements· Adjusted EBITDA (including Pinnacle since 13 April 2021) up 60% to £40 million (H1 2020: £25 million)
- Pellet production up 70% to 1.3Mt (H1 2020: 0.8Mt)- Cost of production down 8% to $141/t(5) (H1 2020: $154/t(5))
· Near-term developments in US Southeast (2021-22)- Commissioning of LaSalle expansion, Demopolis and first satellite plant in H2
· Other opportunities for growth and cost reduction- Increased production capacity, supply of biomass to third parties and expansion of fuel envelope to include lower
cost biomass Generation - flexible and renewable generation· 12% of UK's renewable electricity, strong operational performance and system support services· Adjusted EBITDA down 14% to £185 million (H1 2020: £214 million)
- Biomass - Lower achieved power prices and higher GBP cost of biomass reflecting historical power and FXhedging
- Strong system support (balancing mechanism, Ancillary Services and optimisation) of £70 million (H1 2020: £66million) - additional coal operations and continued good hydro and pumped storage performance
- Coal - utilisation of residual coal stock in Q1 2021 and capture of higher power prices· Pumped storage / hydro - good operational and system support performance
- £34 million of Adjusted EBITDA (Cruachan, Lanark, Galloway schemes and Daldowie) (H1 2020: £35 million)· Ongoing cost reductions to support operating model for biomass at Drax Power Station from 2027
- End of commercial coal operations in March, formal closure September 2022 - reduction in fixed cost base- Major planned outage for biomass CfD unit - August to November 2021 - including third turbine upgrade
delivering improved thermal efficiency and lower maintenance cost, supporting lower cost biomass operations- Trials to expand range of lower cost biomass fuels - up to 35% load achieved in test runs on one unit
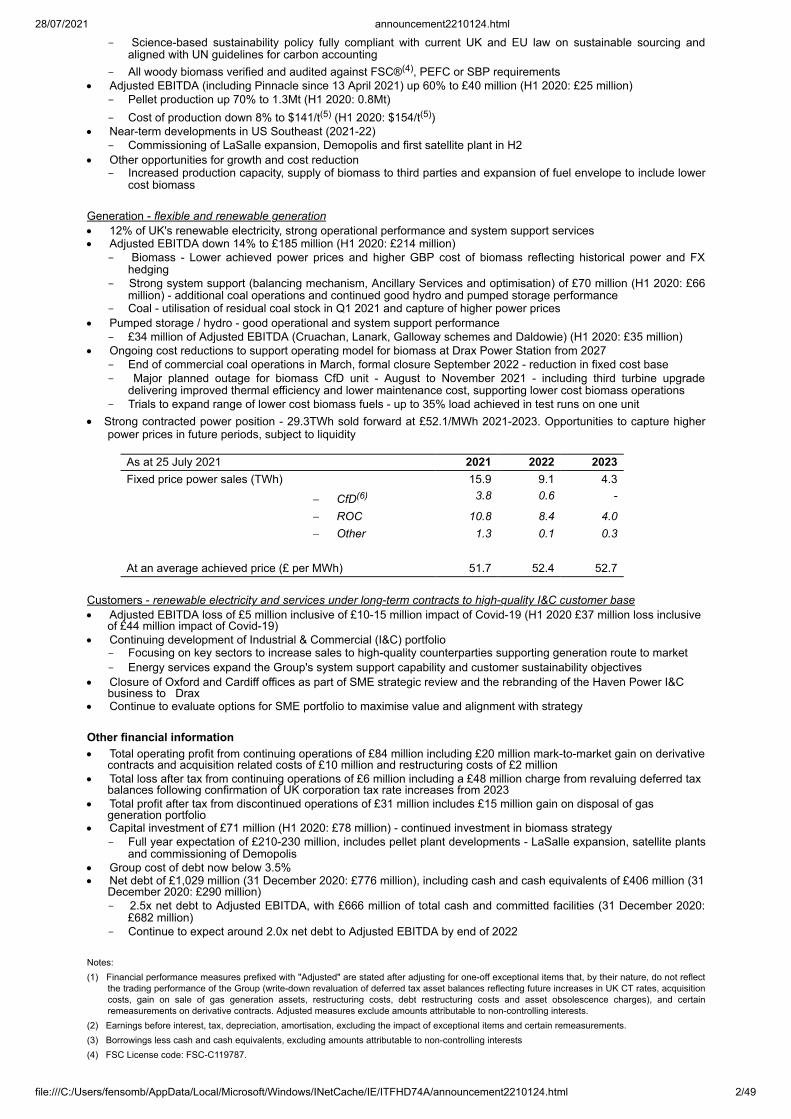
· Strong contracted power position - 29.3TWh sold forward at £52.1/MWh 2021-2023. Opportunities to capture higherpower prices in future periods, subject to liquidity
As at 25 July 2021 2021 2022 2023Fixed price power sales (TWh) 15.9 9.1 4.3
- CfD(6) 3.8 0.6 -
- ROC 10.8 8.4 4.0- Other 1.3 0.1 0.3
At an average achieved price (£ per MWh) 51.7 52.4 52.7
Customers - renewable electricity and services under long-term contracts to high-quality I&C customer base· Adjusted EBITDA loss of £5 million inclusive of £10-15 million impact of Covid-19 (H1 2020 £37 million loss inclusive
of £44 million impact of Covid-19)· Continuing development of Industrial & Commercial (I&C) portfolio
- Focusing on key sectors to increase sales to high-quality counterparties supporting generation route to market- Energy services expand the Group's system support capability and customer sustainability objectives
· Closure of Oxford and Cardiff offices as part of SME strategic review and the rebranding of the Haven Power I&Cbusiness to Drax
· Continue to evaluate options for SME portfolio to maximise value and alignment with strategy Other financial information· Total operating profit from continuing operations of £84 million including £20 million mark-to-market gain on derivative
contracts and acquisition related costs of £10 million and restructuring costs of £2 million· Total loss after tax from continuing operations of £6 million including a £48 million charge from revaluing deferred tax
balances following confirmation of UK corporation tax rate increases from 2023· Total profit after tax from discontinued operations of £31 million includes £15 million gain on disposal of gas
generation portfolio· Capital investment of £71 million (H1 2020: £78 million) - continued investment in biomass strategy
- Full year expectation of £210-230 million, includes pellet plant developments - LaSalle expansion, satellite plantsand commissioning of Demopolis
· Group cost of debt now below 3.5%· Net debt of £1,029 million (31 December 2020: £776 million), including cash and cash equivalents of £406 million (31
December 2020: £290 million)- 2.5x net debt to Adjusted EBITDA, with £666 million of total cash and committed facilities (31 December 2020:
£682 million)- Continue to expect around 2.0x net debt to Adjusted EBITDA by end of 2022
Notes:(1) Financial performance measures prefixed with "Adjusted" are stated after adjusting for one-off exceptional items that, by their nature, do not reflect
the trading performance of the Group (write-down revaluation of deferred tax asset balances reflecting future increases in UK CT rates, acquisitioncosts, gain on sale of gas generation assets, restructuring costs, debt restructuring costs and asset obsolescence charges), and certainremeasurements on derivative contracts. Adjusted measures exclude amounts attributable to non-controlling interests.
(2) Earnings before interest, tax, depreciation, amortisation, excluding the impact of exceptional items and certain remeasurements.(3) Borrowings less cash and cash equivalents, excluding amounts attributable to non-controlling interests(4) FSC License code: FSC-C119787.
28/07/2021 announcement2210124.html
file:///C:/Users/fensomb/AppData/Local/Microsoft/Windows/INetCache/IE/ITFHD74A/announcement2210124.html 3/49
(5) Cost of production in Pellet Production - raw fibre, processing into a wood pellet, delivery to Drax port facilities in US and Canada, loading to vesselfor shipment to UK and overheads - Free on Board (FOB). Cost of ocean freight, UK port and rail cost reflected in Generation business accounts inaddition to price paid to Pellet Production for the wood pellet.
(6) CfD unit typically operates as a baseload unit, with power sold forward against a season ahead reference price. The CfD counterparty pays thedifference between the season ahead reference price and the strike price. The result of this mechanism is that the CfD unit is expected to run abaseload or similar generation profile, meaning that the underlying expected level of generation is higher than that reflected in the contractedposition table.
Forward Looking StatementsThis announcement may contain certain statements, expectations, statistics, projections and other information that are ormay be forward-looking. The accuracy and completeness of all such statements, including, without limitation, statementsregarding the future financial position, strategy, projected costs, plans, beliefs and objectives for the management of futureoperations of Drax Group plc ("Drax") and its subsidiaries (the "Group"), including the integration of Pinnacle RenewableEnergy Inc ("Pinnacle") as part of Drax, are not warranted or guaranteed. By their nature, forward-looking statements involverisk and uncertainty because they relate to events and depend on circumstances that may occur in the future. Although Draxbelieves that the statements, expectations, statistics and projections and other information reflected in such statements arereasonable, they reflect Drax's current view and no assurance can be given that they will prove to be correct. Such eventsand statements involve risks and uncertainties. Actual results and outcomes may differ materially from those expressed orimplied by those forward-looking statements. There are a number of factors, many of which are beyond the control of theGroup, which could cause actual results and developments to differ materially from those expressed or implied by suchforward-looking statements. These include, but are not limited to, factors such as: future revenues being lower thanexpected; increasing competitive pressures in the industry; target dates for the commissioning of plants not being achieved,the expected returns from the acquisition of Pinnacle not being fully realised (for example due to one or more risks asidentified in the circular issued to shareholders in connection with the acquisition arising) capital investments being delayedand/or general economic conditions or conditions affecting the relevant industry, both domestically and internationally, beingless favourable than expected. We do not intend to publicly update or revise these projections or other forward-lookingstatements to reflect events or circumstances after the date hereof, and we do not assume any responsibility for doing so.
Results presentation and webcast arrangements
Management will host a webcast presentation for analysts and investors at 9:00am (UK Time), Thursday 29 July 2021.
The presentation can be accessed remotely via a live webcast link, as detailed below. After the meeting, the webcastrecording will be made available and access details of this recording are also set out below.
A copy of the presentation will be made available from 7:00am (UK time) on Thursday 29 July 2021 for downloadat: www.drax.com>>investors>>announcements-events-reports>>presentations or use thelink https://www.drax.com/investors/announcements-events-reports/presentations/
Event Title: Drax Group plc: Half Year ResultsEvent Date: Thursday 29 July 2021 9:00am (UK time) Webcast Live Event Link: https://secure.emincote.com/client/drax/drax015 Conference call and pre-register Link: https://secure.emincote.com/client/drax/drax015/vip_connect Start Date: Thursday 29 July 2021Delete Date: Thursday 31 December 2021Archive Link: https://secure.emincote.com/client/drax/drax015
For further information, please contact: [email protected]
Website: www.drax.com CEO Business ReviewIntroduction
The world must act now to address the climate crisis and limit global warming to below 1.5 degrees Celsius. We need morerenewable energy, more flexible energy systems to make best use of intermittent wind and solar energy, and crucially,carbon negative technologies to remove carbon from the atmosphere, helping offset the harder to abate areas, such asagriculture and aviation. Biomass has a critical role to play in meeting these needs and Drax is leading the way and in doingso creating global opportunities for growth.
Our purpose is to enable a zero carbon, lower cost energy future and this drives our commitment to address climate change.Through the actions the business has taken to develop its renewable portfolio and reduce fossil fuel consumption, theGroup's carbon emissions from generation are now amongst the lowest of any power generator in Europe - a 90% reduction
28/07/2021 announcement2210124.html
file:///C:/Users/fensomb/AppData/Local/Microsoft/Windows/INetCache/IE/ITFHD74A/announcement2210124.html 4/49
since 2012. We are the UK's largest source of renewable power by output and have an ambition to become carbon negativecompany by 2030.
Strategically, the first half of 2021 was pivotal for the Group, ending commercial coal generation, selling our existing gasgeneration business to VPI Generation Limited for £186 million and acquiring Pinnacle Renewable Energy Inc. (Pinnacle), aleading Canadian renewable energy company, for cash consideration of £222 million (enterprise value of C$796 million).
Through our production and use of sustainable biomass, we are developing three long-term and complementary strategicopportunities for the Group - the sale of biomass to third parties under long-term contracts and self-supply, flexiblerenewable electricity generation, and removing greenhouse gases from the atmosphere - negative emissions - usingBioEnergy Carbon Capture and Storage (BECCS).
Bioenergy is Europe's largest source of renewable energy, and we believe a critical component of the response to climatechange. We must ensure the world's forests are used in a sustainable way to fight climate change, and biomass plays itsrole in that, supporting forest health, forest growth and the removal of carbon from the atmosphere. The biomass we make,sell, and use for power generation is comprised of the residues from the forest products industry and typically includesmaterial such as sawdust. We do not source wood that would otherwise have been used for sawtimber or other high valuelong term carbon stores. This would be unsustainable, and our Responsible Sourcing Policy prohibits us from doing so.
The UK's Climate Change Committee (CCC) has set out what is required for the country to achieve its legally bindingobjective of being net zero by 2050, identifying a requirement for around 60 million tonnes per year of negative emissionsfrom greenhouse gas removal technologies. This includes an important role for BECCS, which is recognised by the CCCand UK Government as the only solution for large-scale negative emissions which includes renewable power and systemsupport benefits.
More recently the EU noted continued support for sustainable biomass through the development of its third RenewableEnergy Directive and plans to reduce greenhouse gas emissions by at least 55% across the continent. In Japan, thegovernment has approved 8GW of biomass and we expect a greater role for bioenergy associated with a new target toreduce greenhouse gases by 50% by 2030.
We believe BECCS can become a world leading, UK-led and exportable solution for large-scale negative emissions. Arecent report by the Coalition for Negative Emissions identified a global opportunity for two to four billion tonnes of negativeemissions from BECCS (using a strict sourcing criteria to ensure only sustainable biomass is used), which is necessary tolimit global warming in line with the aims of the Paris Agreement. To that end we are developing options for UK andinternational markets.
As we advance our strategy, we expect to deliver higher quality earnings, create opportunities for growth aligned with theUK's legally binding objective to become carbon neutral by 2050 and we remain committed to a sustainable and growingdividend.
Acquisition of Pinnacle
The acquisition of Pinnacle in April 2021 transformed the Group's supply chain, making Drax the world's leading sustainablebiomass generation and supply business. It advanced our strategic objective by increasing production capacity, reducingcost and creating a platform for growth in third-party supply.
As Pinnacle's largest customer, we know the company well and are delighted to welcome around 500 employees as newcolleagues, under the leadership of Andrea Johnston, Pinnacle's CFO. We look forward to working closely with our newcolleagues to learn from their expertise in low-cost pellet production and the commercial management of third-party supplycontracts.
Since the acquisition, our programme of work towards integration has progressed well with a high level of collaboration fromall colleagues. We are focused on the safe, efficient and sustainable production of biomass, investing where necessary toapply our safety and operational standards across the Group.
Combining Pinnacle with our existing assets, we now operate 13 pellet plants plus four sites under development in the USSoutheast, with total nameplate production capacity of 4.9 million tonnes per annum once commissioned. These plants aregeographically diverse and sited in three major fibre baskets (British Columbia and Alberta, Canada, and the US Southeast)with access to four deep water ports providing routes to markets in the UK, Asia and the rest of mainland Europe.
Third-party supply of biomass to customers is an important opportunity for the Group. Through Pinnacle, Drax now has $4.3billion of contracts with high-quality customers in the UK, Asia and the rest of mainland Europe, providing diversified long-term revenues outside of the UK. The location of our production capacity on the west coast of Canada makes it ideallysituated to supply growing demand in Asia, where we now have long-term contracts with customers in Japan and Korea.
We expect these markets to grow as sustainable biomass is used to decarbonise other economies and we are excited bythe potential this offers the Group.
We include Pinnacle in our H1 results from the date of acquisition on 13 April 2021.
Summary of H1 2021
Through the first half of 2021 we have continued our work as a Task Force on Climate-Related Financial Disclosures(TCFD) Supporter. We are developing science-based targets and identifying opportunities for further abatement of carbonemissions in our supply chain. Recognising the strong environmental credentials of the Group, in April 2021 Drax became aconstituent of the S&P Clean Energy Index and most recently in June, a constituent of the Active Net Zero Clean EnergyIndex.
Adjusted EBITDA of £186 million from continuing and discontinued operations represents a 4% increase compared to H12020 (£179 million). We believe that this was a solid performance which reflected increased production of lower costbiomass, the acquisition of Pinnacle and an improvement in the Customers business following the easing of lockdownrestrictions in the UK, offsetting additional biomass cost in Generation.
28/07/2021 announcement2210124.html
file:///C:/Users/fensomb/AppData/Local/Microsoft/Windows/INetCache/IE/ITFHD74A/announcement2210124.html 5/49
Our balance sheet is strong with cash and total committed facilities of £666 million at 30 June 2021 and we continue toexpect to return to our long-term target of around 2.0x net debt to Adjusted EBITDA by the end of 2022.
We have continued to progress our option for BECCS in the UK with the commencement of a planning consultation processand the selection of a technology partner - Mitsubishi Heavy Industries (MHI). We expect further details on the selection ofregional carbon capture clusters and individual projects in the second half of 2021.
Safety remains our primary focus and in the first half of 2021 the Total Recordable Incident Rate was 0.14 (H1 2020: 0.32).This is a good performance which reflects our ongoing focus on the delivery of safe, reliable and compliant operations. Wecontinue to operate Covid-19 secure workplaces, following relevant jurisdiction guidance and remain committed to ourprogramme to promote our colleagues' wellbeing.
We expect to propose a dividend for the 2021 financial year of £75 million, a 10% increase on 2020, consistent with ourpolicy to pay a dividend which is sustainable and expected to grow as the strategy delivers an increasing proportion of stableearnings and cash flows. As has been our practice since we initiated the policy in 2017, 40% of the expected full yeardividend will be paid for the first six months of 2021 (£30 million, 7.5 pence per share).
H1 operational performance
Pellet Production
In North America, our Pellet Production operations reported Adjusted EBITDA of £40 million, up 60% (H1 2020: £25 million),reflecting higher levels of production from existing operations, ongoing cost reduction plans and the acquisition of Pinnacle.
Pellet production was 1.3Mt, an increase of 70% (H1 2020: 0.8Mt), which reflects the commissioning of additional capacityat Morehouse in addition to Pinnacle. Approximately 0.9Mt of this production was for Drax and 0.4Mt for sale to third partiesunder established long-term contracts.
The Free On Board (FOB) production cost was $141/t across the enlarged portfolio, a reduction of 8% (H1 2020: $154/t),which reflects our ongoing programme of cost reduction and supply chain improvements, and the addition of lower costPinnacle production.
We expect to deliver increased capacity and further savings in the second half of 2021, associated with the continuedimprovement of existing sites, the expansion of LaSalle, commissioning of Demopolis and the ongoing development ofsatellite plants. The overall impact of these expansions once complete will be to increase nameplate production capacity to4.9Mt, expected by the end of 2022, and allow greater utilisation of lower cost sawmill residues whilst leveraging our existinginfrastructure in the US Southeast.
In July 2021, we experienced a small and contained fire at our Westview port facility in Prince Rupert, British Columbia. Noone was injured but operations have been suspended temporarily to allow for repairs. Separately, forest fires in the regionhave led to restrictions on rail lines with the result that pellet production and exports in Canada have been restricted in July.To date the forest fires have not directly impacted our sites, though we remain alert in order safeguard our people andoperations. Through our enlarged and diversified supply chain we have been able to manage and limit the impact on ourown operations and those of our customers and continue to monitor potential for change which could impact our businessand that of our customers.
Generation
The portfolio produced 6% of the UK's electricity between April 2020 and April 2021 (the most recent period for which data isavailable) and 12% of the UK's renewable electricity over the same period, making Drax the largest renewable generator byoutput.
Adjusted EBITDA of £185 million from continuing and discontinued operations, was a decrease of 14% versus the first halfof 2020 (£214 million). This principally reflects lower achieved power prices for biomass generation and a higher cost ofbiomass fuel reflecting historic forward power and foreign exchange hedging.
Our UK biomass supply chain has remained robust in the past 18 months, successfully managing the impact of Covid-19.However, in recent months we have seen a small increase in the number of rail delivery cancellations owing to driveravailability as a result of Covid-19 restrictions and transfer plant reliability issues, which we have managed through theflexibility of our ROC generating units, buying back power positions and reprofiling generation from the first to the secondhalf of the year. Biomass availability was 88% (H1 2020: 87%), including a very strong performance from the CfD unit withavailability of 97% offsetting a small increase in the forced outage rate on the ROC units, mainly associated with boiler tubeleaks and mill availability, resulting in additional buying back of power positions at higher prices.
During the summer we expect to complete a major planned outage on the CfD biomass unit, which includes the third in aseries of high-pressure turbine upgrades. Once completed we expect the unit to benefit from thermal efficiencyimprovements and lower maintenance costs, incrementally reducing the cost of biomass.
Our Scottish hydro operations - Cruachan Pumped Storage Power Station (Cruachan), and the Lanark and Galloway hydroschemes - have continued to perform well. These assets provide renewable electricity, system support services, peak powergeneration and Capacity Market income. Taken together with the Daldowie energy from waste plant, Adjusted EBITDA was£34 million (H1 2020: £35 million).
System support services (Balancing Market, ancillary services and portfolio optimisation) are an important part of theGroup's strategy. System Support Services and Optimisation - our measure of performance in the provision of theseservices - was a gross profit of £70 million, a small increase on the first six months of 2020 (£66 million). This result reflectscoal operations during the first three months of 2021 before closure of commercial coal operations and a good performancefrom our hydro and pumped storage assets which alongside biomass continue to represent the majority of our earnings inthis growing market.
While power prices remain an important driver of the Group's earnings, by focusing on flexible and renewable generation, itsimportance has reduced. We also maintain a strong forward power sales position, with 2021 fully contracted.
In March 2021, Drax secured Capacity Market agreements for its hydro and pumped storage assets providing revenues ofaround £10 million in the delivery period October 2024 to September 2025. The Group also secured 15-year agreements for
28/07/2021 announcement2210124.html
file:///C:/Users/fensomb/AppData/Local/Microsoft/Windows/INetCache/IE/ITFHD74A/announcement2210124.html 6/49
three new 299MW Open Cycle Gas Turbine (OCGT) projects in England and Wales for delivery between 2024 and 2039.We are continuing to evaluate options for these projects, including their potential sale.
Customers
Our Customers business reported an Adjusted EBITDA loss of £5 million (H1 2020: £37 million loss). This is a significantimprovement on the first half of 2020, which was impacted by Covid-19 - principally in the SME business. The impact ofCovid-19 was in the region of £10-15 million compared to £44 million in H1 2020.
The SME supply business continued to be affected by Covid-19 restrictions in the first half of 2021 and we are continuing toexplore operational and strategic options for this segment of the business.
Looking forwards, we see a fundamental and valuable role in supporting the decarbonisation of British Industrial &Commercial (I&C) businesses through the supply of renewable energy, asset optimisation, Electric Vehicle services andcarbon offset certificates now, and in the future negative carbon power. To capture this opportunity, we are engaged inrestructuring the Customers business, streamlining our operations with the closure of offices in Oxford and Cardiff and therebranding of the Haven Power I&C business to Drax.
The Group's I&C supply business performed well with significant growth in the contracted sales position to high-qualitycustomers. In the last 12 months we've increased the future volume of the I&C committed contract book by 27%, signinghigh quality customers in our target segments. This includes three major customer wins since the start of the year, with acombined annual supply volume of c.3TWh per year from 2022. The implied customer demand for renewable powerexceeds the generated volumes in the UK and we are well positioned with our own portfolio, as a premium for renewablepower emerges. Our development of decarbonisation propositions is targeted at six key industries: transport, agriculture,manufacturing, utilities, public sector and education. We can support their decarbonisation at the same time as connectingcustomer-side demand to system stability revenues and we believe this approach can support long-term growth.
Biomass strategy
The Group is continuing to target control of 5Mt of self-supply capacity and to reduce the cost of biomass to £50/MWh by2027. The acquisition of Pinnacle has accelerated our progress to fulfilling these objectives and by 2022 we expect to haveannualised production capacity of 4.9Mt - with 2.0Mt contracted to third parties and 2.9Mt available for self-supply - whilecontinuing to reduce cost.
We intend to deliver further savings through the optimisation of existing biomass operations, greater utilisation of sawmillresidues and the use of other lower cost renewable feedstocks, such as agricultural residues. In this regard, during the firsthalf of 2021 Drax Power Station completed trials of four different low-cost biomass materials. One of these materialsrepresented 35% of the fuel mix on one biomass unit during test runs. This is a significant increase, although there remainsmuch work to do.
These expansion and cost reduction initiatives underpin the development of three long-term and complementary strategicopportunities for biomass - third-party supply, BECCS and biomass generation.
Third-party supply
We expect global demand for wood pellets to increase in the current decade, as other countries develop decarbonisationprogrammes that include sustainable biomass. Whilst there is an abundance of unprocessed biomass material globallywhich can be sustainably sourced, there remains limited capacity to convert these materials into energy dense pellets, whichhave a low-carbon footprint and lower cost associated with transportation.
With continued demand growth in Europe and Asia this decade (Hawkins Wright: The Outlook for Wood Pellets, SecondQuarter 2021) and the need for biomass expansion to support BECCS (Coalition for Negative Emissions) the globalopportunity for biomass supply is significant.
Drax now has immediate access to new markets, long-term contracts for third-party supply and the expertise to develop newcommercial relationships.
BECCS
Drax aims to become a carbon negative company by 2030, using BECCS. Through combining carbon capture and storage(CCS) with the existing biomass generation units at Drax Power Station, we believe we can remove four million tonnes ofcarbon from the atmosphere each year from 2027 and eight million by 2030. Drax Power Station is in the Humber region, anarea with the highest absolute level of carbon emissions in the UK, owing to the number of industrial sites located there. Thismakes the region a natural location for large-scale carbon capture and storage infrastructure for energy and industry. We area participant in the East Coast Cluster (the Humber and Teesside regions combined), which is participating in the UKGovernment's cluster selection competition, which we believe can bring new investment, new jobs and world-leading andexportable negative emissions technologies to the UK.
In the second half of 2021, against a backdrop of the COP26 summit, the UK Government is expected to select at least tworegions to take forward for the development of CCS infrastructure and individual projects, such as Drax, with which it willenter into discussions regarding the specific commercial arrangements for clusters and projects. Confirmation of supportwould allow us to commence a full engineering and design study with a final investment decision in 2024.
We expect deliverability to be an important part of the UK Government's selection criteria and the technology to deliver post-combustion BECCS exists and is proven at scale. In June 2021, Drax announced MHI as its technology partner for thedevelopment of the first two BECCS units at Drax Power Station, following trials of MHI's technology which commenced inthe second half of 2020.
In addition, we are progressing innovative technology options, including C-Capture - a partnership with Drax, LeedsUniversity, IP Group and BP - which has developed an organic solvent which could be used for BECCS and deliversignificant long-term cost savings for future projects.
Outside of the UK, in June 2021, we announced an agreement with Bechtel, a leading global engineering company, toexplore options and locations to develop new-build BECCS plants across the globe, including North America. We are also
28/07/2021 announcement2210124.html
file:///C:/Users/fensomb/AppData/Local/Microsoft/Windows/INetCache/IE/ITFHD74A/announcement2210124.html 7/49
working with Phoenix BioPower to identify opportunities to deliver improvements to the thermal efficiency of new-buildBECCS, which could result in a material reduction in costs.
Biomass generation
The UK needs more renewable electricity and Drax Power Station is the largest single source of renewable electricity in theUK by output. It is also an important source of system support services, which becomes more important as the powersystem becomes increasingly reliant on intermittent renewables, such as wind and solar. Through improved operationalefficiency and reduced operating costs, associated with ending coal generation, we are continuing to enhance theopportunity for a long-term biomass generation model at Drax Power Station.
Biomass sustainability
When sustainably sourced, biomass is renewable, and sustainably sourced biomass is an important part of both UK andEuropean renewable energy policy.
The legal frameworks and science which underpins this assessment is clear. Carbon emitted in the generation of renewableelectricity is absorbed by and accounted for in the growth of forest stock. This is based on well-established principles set outby the Intergovernmental Panel on Climate Change, a UN body which reconfirmed its long-standing position on sustainablysourced biomass in 2019. This interpretation is reflected in the European Union's second Renewable Energy Directive(REDII) and Taxonomy rules, which mirror REDII.
In July 2021, the European Commission began the development of REDIII. We expect this process to reflect increasedambition around renewable energy and decarbonisation in Europe including the continued evolution of rules aroundsustainable biomass sourcing. As a user and supplier of sustainable biomass we welcome robust standards and lookforward to contributing to the development of REDIII.
In the US Southeast, the source for most of our biomass, increased demand for wood fibre has directly contributed toincreased growth and protection of forests. Inventories have increased by over 90% since 1950 as a result of which morecarbon is stored year after year, despite harvests also increasing.
Our forestry commitments are based on the latest available science from Forest Research, the UK's principal organisationfor forest science. Our responsible resourcing policy aims to ensure we only source biomass that makes a net positivecontribution to climate change, protects and enhances biodiversity and has a positive social impact on local communities.
All of our woody biomass supplies and suppliers are verified and audited against Forestry Stewardship Council® (FSC)(licence number C119787), Programme for the Endorsement of Forest Certification (PEFC) and Sustainable BiomassProgram (SBP) requirements. We are externally audited and independently assured on an annual basis.
Our policy goes beyond compliance, and an Independent Advisory Board (IAB), chaired by Sir John Beddington, providesguidance and independent oversight on the sourcing choices we make. The advice and scrutiny from the IAB meansstakeholders can be assured that Drax will keep our policies under review and that the biomass we use takes account of thelatest scientific research and best practice.
Other developments
We are continuing to develop a long-term option for the expansion of Cruachan, which could create a 1GW pumped storagepower station (currently 0.4GW) and commenced a planning application process in June 2021. Its location, flexible operatingmodes and ability to store power from wind generation, in addition to providing a full range of system support services,makes it strategically important to the UK power system and aligned with its future needs. Any investment decision will bedependent on the right regulatory support.
Outlook
Our expectations for full-year Adjusted EBITDA remain unchanged, assuming good operational availability for the remainderof 2021 and no additional significant impact from Covid-19 in the second half of the year. These assumptions also underpinour expectation for the full year dividend.
In Pellet Production, we are focused on the continued production of good quality pellets at the lowest cost as well ascommissioning additional sites, and expect to deliver further cost savings in the second half of 2021.
In Generation, we expect to complete the major planned outage at Drax Power Station, whilst providing high levels offlexible renewable electricity to the UK power system.
In Customers, we are focused on opportunities to develop our I&C business, including a rebranding of this business to Draxand we continue to assess options for SME.
Drax has repositioned itself in the last decade from a single site fossil fuel generator to the world's leading sustainablebiomass generation and supply business, with growth opportunities aligned with the need for more renewables, negativeemissions and more flexible energy systems.
Our principal focus remains the expansion of our biomass options and we are making good progress with the delivery of ourstrategy. We will build on this as we continue to play an important role in our markets as well as realising our purpose ofenabling a zero carbon, lower cost energy future.
Group Financial Review
H1 2021 Highlights
28/07/2021 announcement2210124.html
file:///C:/Users/fensomb/AppData/Local/Microsoft/Windows/INetCache/IE/ITFHD74A/announcement2210124.html 8/49
Robust financial performance - delivering £186 million of Adjusted EBITDA from continuing and discontinued operations, anincrease of 4% compared to £179 million in the same period of 2020.
· Completion of acquisition of Pinnacle Renewable Energy Inc. (Pinnacle) for cash consideration of C$385 / £222 million (enterprisevalue of C$796 million).
· Sale of CCGT portfolio for initial cash consideration of £186 million, net gain on disposal of £9 million and strong returns ahead ofWACC.
· Ratio of Net Debt to Adjusted EBITDA from continuing and discontinued operations for the rolling 12-month period ended 30 June2021 of 2.5x. On track to deliver 2.0x by the end of 2022.
· Total Operating Profit from continuing operations of £84 million includes derivative remeasurement gains of £20 million, acquisitionand integration costs of £10 million and restructuring costs of £2 million.
· Total loss after tax from continuing operations of £6 million includes £48 million charge from revaluing deferred tax balancesfollowing announcement of future UK tax rate changes.
· Cash generated from operations of £138 million with strong underlying cash conversion before unwinding of prior period liquiditybenefits and one-time working capital impact of Pinnacle acquisition and CCGT disposal.
· Strong liquidity - with total cash and committed facilities of £666 million at 30 June 2021.
· 10% increase in interim dividend to £30 million or 7.5 pence per share.
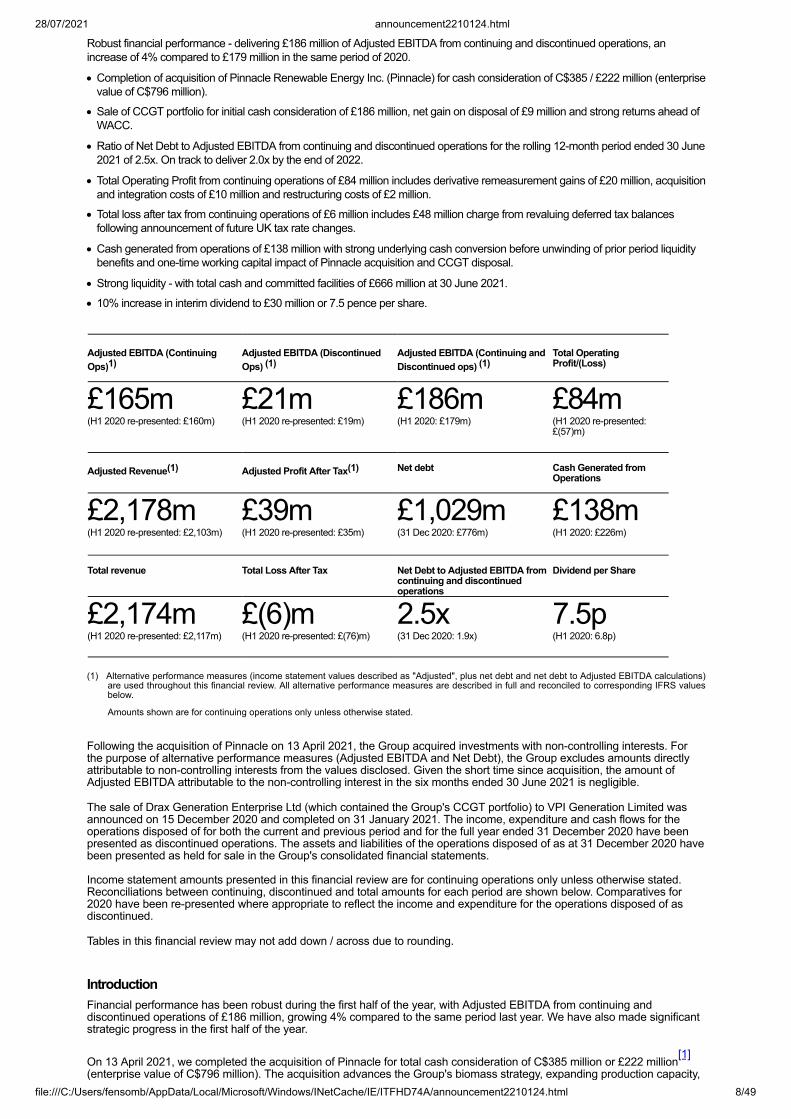
Adjusted EBITDA (ContinuingOps)1)
Adjusted EBITDA (DiscontinuedOps) (1)
Adjusted EBITDA (Continuing andDiscontinued ops) (1)
Total OperatingProfit/(Loss)
£165m(H1 2020 re-presented: £160m)
£21m(H1 2020 re-presented: £19m)
£186m(H1 2020: £179m)
£84m(H1 2020 re-presented:£(57)m)
Adjusted Revenue(1) Adjusted Profit After Tax(1) Net debt Cash Generated fromOperations
£2,178m(H1 2020 re-presented: £2,103m)
£39m(H1 2020 re-presented: £35m)
£1,029m(31 Dec 2020: £776m)
£138m(H1 2020: £226m)
Total revenue Total Loss After Tax Net Debt to Adjusted EBITDA fromcontinuing and discontinuedoperations
Dividend per Share
£2,174m(H1 2020 re-presented: £2,117m)
£(6)m(H1 2020 re-presented: £(76)m)
2.5x(31 Dec 2020: 1.9x)
7.5p(H1 2020: 6.8p)
(1) Alternative performance measures (income statement values described as "Adjusted", plus net debt and net debt to Adjusted EBITDA calculations)are used throughout this financial review. All alternative performance measures are described in full and reconciled to corresponding IFRS valuesbelow.
Amounts shown are for continuing operations only unless otherwise stated.
Following the acquisition of Pinnacle on 13 April 2021, the Group acquired investments with non-controlling interests. Forthe purpose of alternative performance measures (Adjusted EBITDA and Net Debt), the Group excludes amounts directlyattributable to non-controlling interests from the values disclosed. Given the short time since acquisition, the amount ofAdjusted EBITDA attributable to the non-controlling interest in the six months ended 30 June 2021 is negligible.
The sale of Drax Generation Enterprise Ltd (which contained the Group's CCGT portfolio) to VPI Generation Limited wasannounced on 15 December 2020 and completed on 31 January 2021. The income, expenditure and cash flows for theoperations disposed of for both the current and previous period and for the full year ended 31 December 2020 have beenpresented as discontinued operations. The assets and liabilities of the operations disposed of as at 31 December 2020 havebeen presented as held for sale in the Group's consolidated financial statements.
Income statement amounts presented in this financial review are for continuing operations only unless otherwise stated.Reconciliations between continuing, discontinued and total amounts for each period are shown below. Comparatives for2020 have been re-presented where appropriate to reflect the income and expenditure for the operations disposed of asdiscontinued.
Tables in this financial review may not add down / across due to rounding.
IntroductionFinancial performance has been robust during the first half of the year, with Adjusted EBITDA from continuing anddiscontinued operations of £186 million, growing 4% compared to the same period last year. We have also made significantstrategic progress in the first half of the year.
On 13 April 2021, we completed the acquisition of Pinnacle for total cash consideration of C$385 million or £222 million[1]
(enterprise value of C$796 million). The acquisition advances the Group's biomass strategy, expanding production capacity,
28/07/2021 announcement2210124.html
file:///C:/Users/fensomb/AppData/Local/Microsoft/Windows/INetCache/IE/ITFHD74A/announcement2210124.html 9/49
reducing the average cost of biomass production and creating a platform to expand third-party biomass sales.
Provisional goodwill, translated at the balance sheet date, of £163 million associated with the acquisition has beenrecognised in the Condensed consolidated balance sheet. Amounts will be finalised over the 12-month period postacquisition, but we do not expect material changes. The results of Pinnacle have been presented as part of the Group'sPellet Production segment and are in line with our expectations for the period post-acquisition to 30 June 2021.
On 31 January 2021, we completed the disposal of our portfolio of CCGT power stations to VPI Generation Limited. Theinitial cash consideration in respect of the disposal was £188 million with contingent consideration of £29m still outstanding,resulting in a net accounting profit on disposal of £9 million and a strong return on the assets over our period of ownership.The receipt of the contingent consideration is dependent on the development of options associated with the Damhead Creeksite. The completion accounts in respect of the transaction were finalised in July 2021 to give final consideration, beforecontingent consideration, of £186 million, with no change to the profit on disposal.
During the period, Adjusted EBITDA from continuing and discontinued operations for Generation of £185 million reducedcompared to £214 million in the first half of 2020, reflecting weaker year-on-year hedged power prices and hedged foreignexchange rates. We hedge power prices out to approximately two years in advance and therefore achieved power prices inthe period reflect hedges placed primarily in 2019 and 2020 when prices were lower than they are currently. We hedgeforeign exchange rates on a quarterly basis up to approximately five years in advance and the hedged GBP rate for theperiod is reflective of the period of significant uncertainty in advance of the Brexit vote in June 2016.
Our CfD unit will come offline in the summer for its planned maintenance outage and as a result the contribution to theGroup's financial performance from Generation will be reduced in the second half of the year.
We have seen an improvement in our Customers business year-on-year, following the impact of Covid-19 in 2020. AnAdjusted EBITDA loss of £5 million in the six months ended 30 June 2021 includes a £10 - £15 million detrimental impactfrom Covid-19. In the six months ended 30 June 2020, an Adjusted EBITDA loss of £37 million included £44 million ofCovid-19 impact.
We have seen a strong recovery in demand in the I&C supply business, with electricity supplied above pre-Covid levels,however SME supply remains significantly lower, both due to the restrictions in place during the period associated with thepandemic and as a result of the tighter customer credit criteria we have implemented. Overall volumes supplied increased to9.0TWh in the period from 8.8TWh in the first half of 2020. We are continuing to review operational and strategic options forthe SME business.
In Pellet Production, we continue to make good progress with our biomass cost reduction initiatives and the acquisition ofPinnacle contributed to a reduction in the cost per tonne in the first half of 2021, when compared to 2020, of 8%.
Total central costs increased to £31 million when compared to £23 million for the six months ended 30 June 2020, driven byan increased investment in Innovation and BECCS. Further, in the six months ended 30 June 2020 we recorded lowervariable employee costs reflecting the impact of Covid-19 on expectations for the full year.
Total operating profit for the period of £84 million is significantly higher than the equivalent period last year, inclusive ofderivative remeasurement gains of £20 million. The operating loss of £57 million for the first six months of 2020 includedasset obsolescence charges associated with coal closure of £224 million, partially offset by derivative remeasurement gainsof £94 million.
Our liquidity position remains strong, with available cash and committed facilities at 30 June 2021 of £666 million (31December 2020: £682 million). In February 2021, the outstanding commitments under the infrastructure term loan facilitiesagreed in 2020, totalling £45 million and €95 million, were drawn down in full. Net debt at 30 June 2021 was £1,029 million,resulting in a net debt to Adjusted EBITDA ratio for the rolling 12-month period ended 30 June 2021 of 2.5x. We expect thisto increase to 3.0x by the end of 2021, before returning to around 2.0x by the end of 2022.
Total cash generated from operations in the period was £138 million (six months ended 30 June 2020: £226 million). Thereduction compared to the first six months of 2020 principally reflects the actions taken in the six months ended 30 June2020 to reinforce liquidity and working capital through the onset of the Covid-19 pandemic, with resulting working capitaloutflows in the six months ended 30 June 2021 including those associated with the rebasing of financial instruments.Excluding this, and the working capital impact associated with the disposal of the CCGT portfolio and the vertical integrationof Pinnacle, Adjusted EBITDA cash conversion was close to 100% in both periods.
We remain committed to payment of a sustainable and growing dividend. The Board has resolved to pay an interim dividendin respect of the six months ended 30 June 2021 of 7.5 pence per share (six months ended 30 June 2020: 6.8 pence pershare), representing 40% of the expected full year dividend.
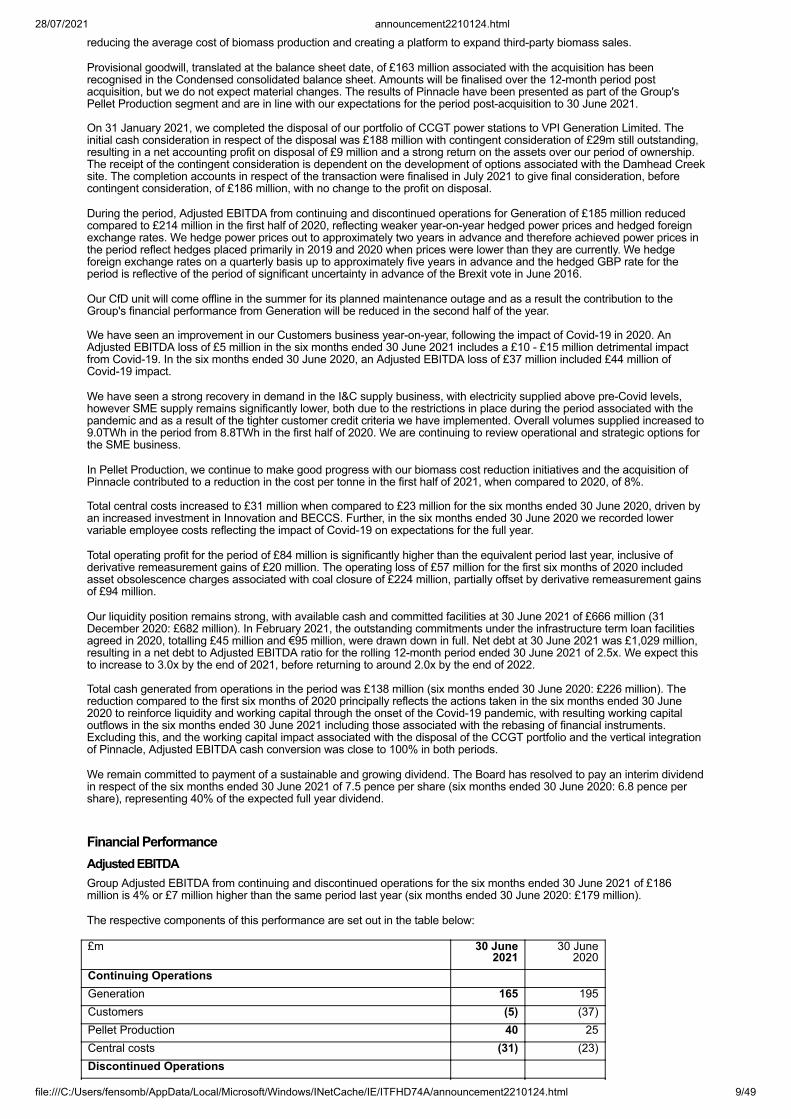
Financial PerformanceAdjusted EBITDAGroup Adjusted EBITDA from continuing and discontinued operations for the six months ended 30 June 2021 of £186million is 4% or £7 million higher than the same period last year (six months ended 30 June 2020: £179 million).
The respective components of this performance are set out in the table below:
£m 30 June2021
30 June2020
Continuing Operations Generation 165 195Customers (5) (37)Pellet Production 40 25Central costs (31) (23)Discontinued Operations
28/07/2021 announcement2210124.html
file:///C:/Users/fensomb/AppData/Local/Microsoft/Windows/INetCache/IE/ITFHD74A/announcement2210124.html 10/49
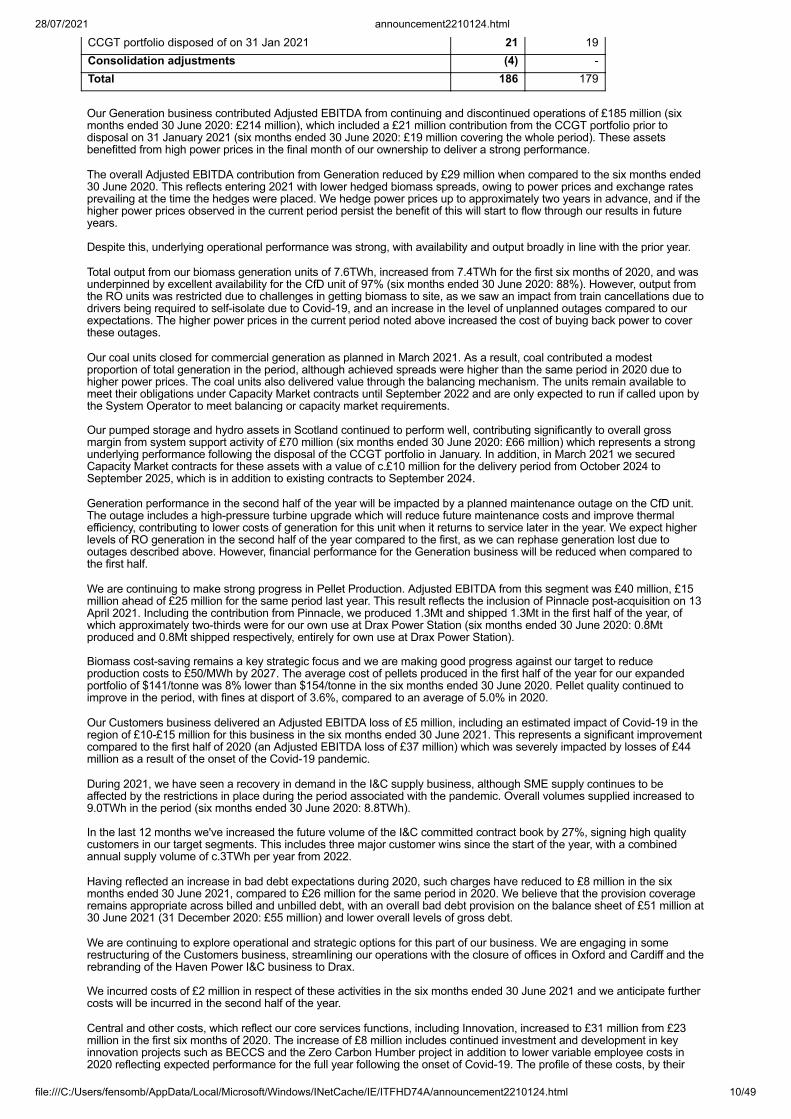
CCGT portfolio disposed of on 31 Jan 2021 21 19Consolidation adjustments (4) -Total 186 179 Our Generation business contributed Adjusted EBITDA from continuing and discontinued operations of £185 million (sixmonths ended 30 June 2020: £214 million), which included a £21 million contribution from the CCGT portfolio prior todisposal on 31 January 2021 (six months ended 30 June 2020: £19 million covering the whole period). These assetsbenefitted from high power prices in the final month of our ownership to deliver a strong performance.
The overall Adjusted EBITDA contribution from Generation reduced by £29 million when compared to the six months ended30 June 2020. This reflects entering 2021 with lower hedged biomass spreads, owing to power prices and exchange ratesprevailing at the time the hedges were placed. We hedge power prices up to approximately two years in advance, and if thehigher power prices observed in the current period persist the benefit of this will start to flow through our results in futureyears.
Despite this, underlying operational performance was strong, with availability and output broadly in line with the prior year.
Total output from our biomass generation units of 7.6TWh, increased from 7.4TWh for the first six months of 2020, and wasunderpinned by excellent availability for the CfD unit of 97% (six months ended 30 June 2020: 88%). However, output fromthe RO units was restricted due to challenges in getting biomass to site, as we saw an impact from train cancellations due todrivers being required to self-isolate due to Covid-19, and an increase in the level of unplanned outages compared to ourexpectations. The higher power prices in the current period noted above increased the cost of buying back power to coverthese outages.
Our coal units closed for commercial generation as planned in March 2021. As a result, coal contributed a modestproportion of total generation in the period, although achieved spreads were higher than the same period in 2020 due tohigher power prices. The coal units also delivered value through the balancing mechanism. The units remain available tomeet their obligations under Capacity Market contracts until September 2022 and are only expected to run if called upon bythe System Operator to meet balancing or capacity market requirements.
Our pumped storage and hydro assets in Scotland continued to perform well, contributing significantly to overall grossmargin from system support activity of £70 million (six months ended 30 June 2020: £66 million) which represents a strongunderlying performance following the disposal of the CCGT portfolio in January. In addition, in March 2021 we securedCapacity Market contracts for these assets with a value of c.£10 million for the delivery period from October 2024 toSeptember 2025, which is in addition to existing contracts to September 2024.
Generation performance in the second half of the year will be impacted by a planned maintenance outage on the CfD unit.The outage includes a high-pressure turbine upgrade which will reduce future maintenance costs and improve thermalefficiency, contributing to lower costs of generation for this unit when it returns to service later in the year. We expect higherlevels of RO generation in the second half of the year compared to the first, as we can rephase generation lost due tooutages described above. However, financial performance for the Generation business will be reduced when compared tothe first half.
We are continuing to make strong progress in Pellet Production. Adjusted EBITDA from this segment was £40 million, £15million ahead of £25 million for the same period last year. This result reflects the inclusion of Pinnacle post-acquisition on 13April 2021. Including the contribution from Pinnacle, we produced 1.3Mt and shipped 1.3Mt in the first half of the year, ofwhich approximately two-thirds were for our own use at Drax Power Station (six months ended 30 June 2020: 0.8Mtproduced and 0.8Mt shipped respectively, entirely for own use at Drax Power Station).
Biomass cost-saving remains a key strategic focus and we are making good progress against our target to reduceproduction costs to £50/MWh by 2027. The average cost of pellets produced in the first half of the year for our expandedportfolio of $141/tonne was 8% lower than $154/tonne in the six months ended 30 June 2020. Pellet quality continued toimprove in the period, with fines at disport of 3.6%, compared to an average of 5.0% in 2020.
Our Customers business delivered an Adjusted EBITDA loss of £5 million, including an estimated impact of Covid-19 in theregion of £10-£15 million for this business in the six months ended 30 June 2021. This represents a significant improvementcompared to the first half of 2020 (an Adjusted EBITDA loss of £37 million) which was severely impacted by losses of £44million as a result of the onset of the Covid-19 pandemic.
During 2021, we have seen a recovery in demand in the I&C supply business, although SME supply continues to beaffected by the restrictions in place during the period associated with the pandemic. Overall volumes supplied increased to9.0TWh in the period (six months ended 30 June 2020: 8.8TWh).
In the last 12 months we've increased the future volume of the I&C committed contract book by 27%, signing high qualitycustomers in our target segments. This includes three major customer wins since the start of the year, with a combinedannual supply volume of c.3TWh per year from 2022.
Having reflected an increase in bad debt expectations during 2020, such charges have reduced to £8 million in the sixmonths ended 30 June 2021, compared to £26 million for the same period in 2020. We believe that the provision coverageremains appropriate across billed and unbilled debt, with an overall bad debt provision on the balance sheet of £51 million at30 June 2021 (31 December 2020: £55 million) and lower overall levels of gross debt.
We are continuing to explore operational and strategic options for this part of our business. We are engaging in somerestructuring of the Customers business, streamlining our operations with the closure of offices in Oxford and Cardiff and therebranding of the Haven Power I&C business to Drax.
We incurred costs of £2 million in respect of these activities in the six months ended 30 June 2021 and we anticipate furthercosts will be incurred in the second half of the year.
Central and other costs, which reflect our core services functions, including Innovation, increased to £31 million from £23million in the first six months of 2020. The increase of £8 million includes continued investment and development in keyinnovation projects such as BECCS and the Zero Carbon Humber project in addition to lower variable employee costs in2020 reflecting expected performance for the full year following the onset of Covid-19. The profile of these costs, by their
28/07/2021 announcement2210124.html
file:///C:/Users/fensomb/AppData/Local/Microsoft/Windows/INetCache/IE/ITFHD74A/announcement2210124.html 11/49
nature, is not uniform across the year. Nonetheless, we continue to expect that full year costs for core services will remainbroadly in line with 2020, with an increase in costs in Innovation and capital projects as we progress our strategy.
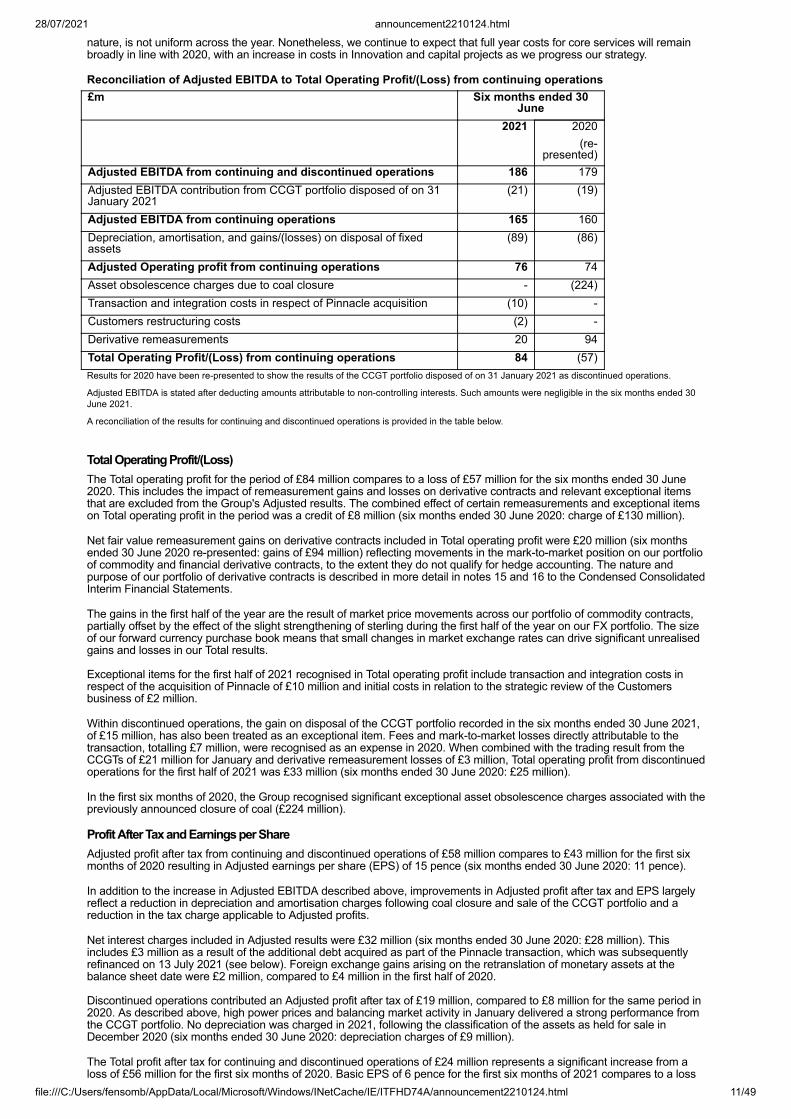
Reconciliation of Adjusted EBITDA to Total Operating Profit/(Loss) from continuing operations£m Six months ended 30
June 2021 2020
(re-presented)
Adjusted EBITDA from continuing and discontinued operations 186 179Adjusted EBITDA contribution from CCGT portfolio disposed of on 31January 2021
(21) (19)
Adjusted EBITDA from continuing operations 165 160Depreciation, amortisation, and gains/(losses) on disposal of fixedassets
(89) (86)
Adjusted Operating profit from continuing operations 76 74Asset obsolescence charges due to coal closure - (224)Transaction and integration costs in respect of Pinnacle acquisition (10) -Customers restructuring costs (2) -Derivative remeasurements 20 94Total Operating Profit/(Loss) from continuing operations 84 (57)Results for 2020 have been re-presented to show the results of the CCGT portfolio disposed of on 31 January 2021 as discontinued operations.
Adjusted EBITDA is stated after deducting amounts attributable to non-controlling interests. Such amounts were negligible in the six months ended 30June 2021.
A reconciliation of the results for continuing and discontinued operations is provided in the table below.
Total Operating Profit/(Loss)The Total operating profit for the period of £84 million compares to a loss of £57 million for the six months ended 30 June2020. This includes the impact of remeasurement gains and losses on derivative contracts and relevant exceptional itemsthat are excluded from the Group's Adjusted results. The combined effect of certain remeasurements and exceptional itemson Total operating profit in the period was a credit of £8 million (six months ended 30 June 2020: charge of £130 million).
Net fair value remeasurement gains on derivative contracts included in Total operating profit were £20 million (six monthsended 30 June 2020 re-presented: gains of £94 million) reflecting movements in the mark-to-market position on our portfolioof commodity and financial derivative contracts, to the extent they do not qualify for hedge accounting. The nature andpurpose of our portfolio of derivative contracts is described in more detail in notes 15 and 16 to the Condensed ConsolidatedInterim Financial Statements.
The gains in the first half of the year are the result of market price movements across our portfolio of commodity contracts,partially offset by the effect of the slight strengthening of sterling during the first half of the year on our FX portfolio. The sizeof our forward currency purchase book means that small changes in market exchange rates can drive significant unrealisedgains and losses in our Total results.
Exceptional items for the first half of 2021 recognised in Total operating profit include transaction and integration costs inrespect of the acquisition of Pinnacle of £10 million and initial costs in relation to the strategic review of the Customersbusiness of £2 million.
Within discontinued operations, the gain on disposal of the CCGT portfolio recorded in the six months ended 30 June 2021,of £15 million, has also been treated as an exceptional item. Fees and mark-to-market losses directly attributable to thetransaction, totalling £7 million, were recognised as an expense in 2020. When combined with the trading result from theCCGTs of £21 million for January and derivative remeasurement losses of £3 million, Total operating profit from discontinuedoperations for the first half of 2021 was £33 million (six months ended 30 June 2020: £25 million).
In the first six months of 2020, the Group recognised significant exceptional asset obsolescence charges associated with thepreviously announced closure of coal (£224 million).
Profit After Tax and Earnings per ShareAdjusted profit after tax from continuing and discontinued operations of £58 million compares to £43 million for the first sixmonths of 2020 resulting in Adjusted earnings per share (EPS) of 15 pence (six months ended 30 June 2020: 11 pence).
In addition to the increase in Adjusted EBITDA described above, improvements in Adjusted profit after tax and EPS largelyreflect a reduction in depreciation and amortisation charges following coal closure and sale of the CCGT portfolio and areduction in the tax charge applicable to Adjusted profits.
Net interest charges included in Adjusted results were £32 million (six months ended 30 June 2020: £28 million). Thisincludes £3 million as a result of the additional debt acquired as part of the Pinnacle transaction, which was subsequentlyrefinanced on 13 July 2021 (see below). Foreign exchange gains arising on the retranslation of monetary assets at thebalance sheet date were £2 million, compared to £4 million in the first half of 2020.
Discontinued operations contributed an Adjusted profit after tax of £19 million, compared to £8 million for the same period in2020. As described above, high power prices and balancing market activity in January delivered a strong performance fromthe CCGT portfolio. No depreciation was charged in 2021, following the classification of the assets as held for sale inDecember 2020 (six months ended 30 June 2020: depreciation charges of £9 million).
The Total profit after tax for continuing and discontinued operations of £24 million represents a significant increase from aloss of £56 million for the first six months of 2020. Basic EPS of 6 pence for the first six months of 2021 compares to a loss

28/07/2021 announcement2210124.html
file:///C:/Users/fensomb/AppData/Local/Microsoft/Windows/INetCache/IE/ITFHD74A/announcement2210124.html 12/49
of 14 pence for the first six months of 2020.
Total profit after tax includes remeasurements on derivative contracts and exceptional items, as described above, net of thetax impact associated with these items.
The total tax charge for the period was £58 million (six months ended 30 June 2020: credit of £10 million) and is comprisedof a tax charge of £5 million on Adjusted pre-tax profits and a tax charge of £53 million in relation to derivativeremeasurements and exceptional items. The tax charge for exceptional items includes a non-cash charge of £48 million dueto revaluation of deferred tax balances following the increase in UK corporation tax rates from 19% to 25% with effect fromApril 2023. Reflecting the size and scale of the charge, it has been treated as an exceptional item in the CondensedConsolidated Interim Financial Statements. The tax charge in relation to discontinued operations was £2 million.
Total profit after tax includes remeasurements on derivative contracts and exceptional items, as described above, net of thetax impact associated with these items.
The effective tax rate applicable to the Group's Adjusted pre-tax profits from continuing operations, before taking intoaccount the effect of changes in tax rates, of 11% (six months ended 30 June 2020: 13%) is lower than the standard rate ofcorporation tax in the UK and takes into account the effect of higher tax rates in overseas jurisdictions. For interim periods,the effective tax rate is based on our forecast tax rate for the full year, which benefits from patent box and the "super-deduction" for qualifying plant and machinery expenditure that was announced in March 2021.
Adjusted Results from Continuing and Discontinued Operations for the six months ended 30 June 2021£m Continuing
OperationsDiscontinued
OperationsContinuing and
DiscontinuedOperations
Revenue 2,178 52 2,229Cost of Sales (1,807) (32) (1,838)Adjusted Gross Profit 371 20 391Operating expenses (198) - (197)Impairment losses on tradereceivables
(8) - (8)
Depreciation & Amortisation (89) - (89)Adjusted Operating Profit 76 21 97Net finance charges (32) - (32)Adjusted Profit before tax 44 21 65Taxation (5) (2) (7)Adjusted Profit after tax 39 19 58Impact of exceptional itemsand certain remeasurements
(45) 12 (33)
Total (Loss)/ Profit aftertax
(6) 31 24
Adjusted EBITDA 165 21 186Depreciation andamortisation
(89) - (89)
Adjusted Operating Profit 76 21 97Derivative remeasurements 20 (4) 16Gain on disposal of CCGTportfolio
- 15 15
Transaction and integrationcosts in respect of Pinnacleacquisition
(10) - (10)
Customers restructuringcosts
(2) - (2)
Total Operating Profit 84 33 116Adjusted EBITDA is stated after deducting amounts attributable to non-controlling interests. Such amounts were negligible in the six months ended 30June 2021.
See notes 6 and 10 to the Condensed Consolidated Interim Financial Statements for further information.
Capital ExpenditureWe maintain a disciplined approach to capital expenditure, with all significant projects subject to appraisal and prioritisationby a Capital Committee prior to approval. This committee ensures our overall adherence to our capital allocation policy andmaintenance of an appropriate net debt to Adjusted EBITDA profile.
Total capital expenditure of £71 million in the first half of 2021 was lower than £78 million in the first six months of 2020.
Key developments in the period include progress with the expansion at our La Salle pellet plant, which will increaseproduction capacity by 150kt per annum when it is commissioned in the third quarter of 2021, investment in the newDemopolis pellet plant acquired as part of the Pinnacle transaction, which is expected to come online in the second half ofthe year, and further investment in our OCGT projects after three of the projects achieved Capacity Market contracts inMarch 2021.
28/07/2021 announcement2210124.html
file:///C:/Users/fensomb/AppData/Local/Microsoft/Windows/INetCache/IE/ITFHD74A/announcement2210124.html 13/49
The overall reduction year-on-year principally reflects the timing of further expansion spend in Pellet Production. Followingthe acquisition of Pinnacle, we are assessing investment opportunities across the enlarged Pellet Production business andas a result the timing of some capital expenditure has been deferred to the second half of 2021.
We expect capital expenditure for the full year to be between £210 and £230 million.
Cash and Net DebtA strong focus on cash flow discipline is underpinned by prudent risk management which provides protection in times ofeconomic uncertainty and a strong platform from which to execute our strategy.
Our liquidity position remains strong. The Group had available cash and committed facilities of £666 million at 30 June 2021,a small decrease from £682 million at 31 December 2020. This excludes approximately £48 million of Canadian committedfacilities available at 30 June 2021 that were taken on as part of the Pinnacle acquisition that were refinanced on 13 July2021.
Cash generated from operations in the six months ended 30 June 2021 was £138 million (six months ended 30 June 2020:£226 million) before interest and tax payments. The reduction compared to the previous period is predominantly the result ofoutflows related to the unwind of cash benefits associated with action taken in the first half of 2020 as we released cash toreinforce liquidity in the early part of the Covid-19 pandemic. The largest component of this was associated with the rebasingof derivative contracts, which was a net cash outflow of £27 million, compared to an inflow of £40 million for the six monthsended 30 June 2020. When taken alongside the one-time impacts on working capital as a result of acquiring Pinnacle anddisposing of the CCGT portfolio, our underlying Adjusted EBITDA to operating cash flow conversion rate remains strong, ataround 100% in both periods.
Net cash generated from operating activities in the period was £115 million (six months ended 30 June 2020: £168 million),after interest paid of £31 million (six months ended 30 June 2020: £27 million) and a tax refund of £8 million (six monthsended 30 June 2020: taxes paid of £32 million). The tax refund largely reflects the return of overpayments in relation toprevious years. The introduction of the "super-deduction" in the 2021 Finance Act is expected to result in minimalcorporation tax payable by the Group in 2021 and 2022.
The overall net cash inflow for the period was £116 million (six months ended 30 June 2020: inflow of £71 million), after cashpayments for capital expenditure of £63 million (six months ended 30 June 2020: £59 million), dividend payments of £41million (six months ended 30 June 2020: £38 million), net proceeds from new borrowings and repayments of existingfacilities of £125 million (six months ended 30 June 2020: £nil) and a net cash outflow in respect of acquisitions anddisposals, net of fees and cash acquired and disposed of £18 million (six months ended 30 June 2020: £nil).
As a result, closing cash at 30 June 2021 was £406 million (31 December 2020: £290 million). As described in further detailbelow, during July 2021 we concluded the buy-out of a minority interest in Alabama Pellets LLC for cash consideration ofUS$30 million and utilised approximately C$130 million of existing cash reserves in part repayment of borrowings in thewider refinancing of debt facilities acquired as part of the Pinnacle transaction.
During 2020, the Group entered into a new infrastructure term loan facilities agreement with committed funds in both sterling(£98 million) and euro (€127 million) with a range of maturities between 2024 and 2030. £45 million and €95 millionremained undrawn under these facilities at 31 December 2020, with both subsequently drawn down in February 2021.
Total borrowings at 30 June 2021, net of deferred financing costs, were £1,434 million (31 December 2020: £1,066 million),resulting in net debt at 30 June 2021 of £1,029 million (31 December 2020: £776 million), after adjusting for amountsattributable to non-controlling interests. As in previous periods, our calculation of net debt excludes lease liabilities, see note14 of the Condensed Consolidated Interim Financial Statements for further information.
Our net debt to Adjusted EBITDA ratio, based on reported Adjusted EBITDA for the last 12 months of £419 million, was 2.5xat 30 June 2021 compared to 1.9x at 31 December 2020, reflecting the Pinnacle acquisition and CCGT divestment. Weexpect a ratio of approximately 3.0x at the end of 2021, driven by capital expenditure being weighted to the second half ofthe year, the minority interest buy-out in July 2021 and the impact of the CfD unit outage as described above, beforereturning to around 2.0x by the end of 2022.
On 13 July 2021, the Group completed the refinancing of the Canadian dollar facilities it acquired as part of the acquisition ofPinnacle in April 2021, which had a cost of over 5.5%. The new facilities include a C$300 million term loan and C$10 millionrevolving credit facility (RCF). The facilities mature in 2024, diversify the Group's sources of funds, further reduce theGroup's all-in cost of debt to below 3.5%, and include an embedded ESG component which adjusts the margin payablebased on the Group's carbon intensity measured against an annual benchmark. These new facilities, alongside existingcash reserves, refinanced the approximately C$435 million drawn under the acquired facilities at the refinancing date.
In addition to cash on hand, the Group has access to a £300 million ESG RCF, available to manage low points in the cashcycle, which expires in 2025. No cash has been drawn under the RCF for over three years. Available cash on hand andcommitted undrawn facilities provide substantial headroom over our short-term liquidity requirements.
Net cash released from working capital was £4 million (six months ended 30 June 2020: £18 million released from workingcapital), which includes one-off outflows because of cash absorbed by the vertical integration of Pinnacle and disposal of theCCGT portfolio.
As described above, in previous periods the Group has rebased several foreign currency contracts as a cost-effectivemeans of accessing additional liquidity, which resulted in a working capital benefit. That benefit has fully unwound at 30 June2021 (total cash released from rebased foreign currency trades still outstanding at 31 December 2020 was £24 million). Asimilar exercise for cross-currency swaps resulted in cash released from outstanding trades at 30 June 2021 of £54 million(31 December 2020: £57 million). The overall net outflow associated with rebasing activity in the six months ended 30 June2021 was therefore £27 million.
Historically, cash from ROCs has typically been realised several months after the ROC was earned, at the end of the ROCcompliance period; however, the Group is able to limit the overall impact of ROCs on working capital by making separatesales and purchases in the compliance period. During the first half of 2021, such transactions generated a net cash outflowof £34 million due to more purchases than sales in the period, contributing to an overall working capital outflow from ROCsof £268 million as the level of ROC assets held on the balance sheet also increased due to generation in the period. The
28/07/2021 announcement2210124.html
file:///C:/Users/fensomb/AppData/Local/Microsoft/Windows/INetCache/IE/ITFHD74A/announcement2210124.html 14/49
Group also has access to facilities enabling it to sell ROC trade receivables arising on a non-recourse basis. Utilisation ofthese facilities at 30 June 2021 was £49 million (31 December 2020: £nil).
In addition, the Group has access to a £200 million receivables monetisation facility, which accelerates associated cashflows and mitigates exposure to credit risk, as well as a number of payment facilities to leverage scale and efficiencies intransaction processing. We also facilitate a supply chain financing scheme, which enables certain suppliers to accelerateliquidity and which supports the wider working capital efficiency of the Group. There are no changes to the Group's paymentterms under this arrangement, nor would there be if the arrangement was to fall away. More information in respect of cashand liquidity is set out in note 13 to the Condensed Consolidated Interim Financial Statements.
We hold a large portfolio of forward and option contracts for various commodities and financial products. These contractsare held to de-risk the business, by protecting the sterling value of future cash flows in relation to the sale of power orpurchase of key commodities. We manage our exposures in accordance with our trading and risk management policies.These policies provide flexibility to optimise our trading position, working capital and liquidity when market conditions allow,whilst ensuring downside protection and prudent risk management are maintained. We continue to monitor opportunities onan ongoing basis.
DistributionsThe Group remains committed to its established capital allocation policy, through which it aims to maintain a strong balancesheet; invest in the core business; pay a sustainable and growing dividend and return surplus capital beyond investmentrequirements to shareholders.
At the Annual General Meeting on 21 April 2021, shareholders approved payment of a final dividend for the year ended31 December 2020 of 10.3 pence per share (£41 million). The final dividend was paid on 14 May 2021.
On 28 July, the Board resolved to pay an interim dividend for the six months ended 30 June 2021 of 7.5 pence per share(£30 million), representing 40% of the expected full year dividend. The interim dividend will be paid on 8 October 2021 with arecord date of 27 August 2021.
The Board expects to recommend a full year dividend of £75 million with regards to the 2021 financial year.
The Board is confident that this level of dividend is sustainable and expects it to grow as the implementation of the businessstrategy generates an increasing proportion of stable earnings and cash flows. In determining the rate of growth in dividendsthe Board will take account of future investment opportunities and the less predictable cash flows from the Group'scommodity-based businesses. If there is a build-up of capital in excess of the Group's investment needs the Board willconsider the most appropriate mechanism to return this to shareholders.
Other InformationSale of CCGT PortfolioOn 31 January 2021, the Group completed the sale of its CCGT portfolio to VPI Generation Limited for cash consideration ofup to £193 million, subject to customary adjustments. This included £29 million of contingent consideration associated withthe option to develop the site at Damhead Creek. The sale price represents a return over the Group's period of ownershipsignificantly ahead of the Group's weighted average cost of capital.
The Group received initial consideration of £188 million in February 2021, which included £24 million in respect of customaryworking capital adjustments. A completion accounts process concluded in July 2021, subsequent to the balance sheet date,that finalised working capital adjustments at £22 million, amending the initial consideration to £186 million.
The Group realised a profit on disposal of £15 million in the Condensed consolidated income statement for the six monthsended 30 June 2021. This includes an assessment of the fair value of the contingent consideration, which remains unpaid atthe date of this report. In addition, we incurred £3 million of transaction costs and £3 million of associated mark-to-marketlosses that were expensed to the income statement in 2020, giving an overall net gain on disposal of £9 million. See note 11to the Condensed Consolidated Interim Financial Statements for further information.
In the Condensed Consolidated Interim Financial Statements, the results of the CCGT portfolio for the period prior todisposal in 2021 (Adjusted revenue of £52 million, Adjusted EBITDA of £21 million and Adjusted profit after tax of £19million), have been presented as discontinued operations. The gain on disposal and derivative remeasurements associatedwith the portfolio have also been presented within discontinued operations as exceptional items. The Condensedconsolidated income statement for the six months ended 30 June 2020 has been re-presented to show the results for theCCGT portfolio on a consistent basis as discontinued operations. See note 10 to the Condensed Consolidated InterimFinancial Statements for further detail.
Acquisition of Pinnacle Renewable Energy Inc.On 8 February 2021, the Group announced the proposed acquisition of 100% of the issued share capital of Pinnacle at aprice of C$11.30 per share.
The acquisition subsequently completed on 13 April 2021. Total consideration, paid in Canadian dollars on the completiondate, amounted to C$385 million. Transaction and integration costs of £10 million have been recognised in the Condensedconsolidated income statement as an exceptional item.
Following the acquisition, the Group now controls 13 operational pellet plants, with satellite development projects and afurther plant under construction. This will result in a total nameplate capacity of 4.9 million tonnes per annum once alldevelopments are commissioned. The acquisition supports the Group's strategic objectives by increasing productioncapacity, reducing biomass production costs and creating a platform for growth in third-party supply. Furthermore, thetransaction transforms the Group's supply chain and positions the Group as the world's leading sustainable biomassgeneration and supply business.
Financial information in respect of the acquisition, including the fair value of assets and liabilities acquired and an initialcalculation of goodwill, plus information regarding minority interests, is included in note 11 to the Condensed Consolidated

28/07/2021 announcement2210124.html
file:///C:/Users/fensomb/AppData/Local/Microsoft/Windows/INetCache/IE/ITFHD74A/announcement2210124.html 15/49
Interim Financial Statements. Given the limited time between completion of the acquisition and the approval of this report, allvalues in relation to the acquisition of Pinnacle are provisional.
Subsequent to the balance sheet date, on 13 July 2021, the Group acquired a 20% minority interest in Alabama Pellets LLC(a non-wholly owned subsidiary of Pinnacle) from The Westervelt Company for US$30 million cash consideration. Theacquisition increases the Group's interest in Alabama Pellets LLC, which owns the Aliceville and Demopolis pellet plants,with a combined capacity of 660kt per annum, from 70% to 90%.
Going ConcernWe continue to monitor and assess developments and the potential future impact of the Covid-19 pandemic on ouroperations and financial performance. As described above, our financial performance in the first half of 2021 was robust,delivering improved profitability and cash flow compared to the same period last year.
In addition, we have maintained a strong balance sheet with a net debt to Adjusted EBITDA from continuing anddiscontinued operations ratio of 2.5x at 30 June 2021. Post the acquisition of Pinnacle this ratio is expected to increase to3.0x by the end of 2021 but we remain on track to return to our long-term target of around 2.0x by the end of 2022.
Our financing platform is stable, with the majority of our principal debt repayments due from 2025 onwards and significantliquidity headroom available from both committed and uncommitted facilities.
Looking forward, our business plan for the remainder of the current year and beyond reflects our central assumptionsregarding the likely duration of impacts from the Covid-19 pandemic and the nature of associated restrictions such as socialdistancing. These factors, combined with wider macroeconomic considerations, can affect the demand for, and price of,power. We continue to expect an ongoing impact, when compared to pre-Covid expectations, in our Customers business,due to the reduction in demand and increased bad debt risk described above.
The Group refreshes its business plan and forecasts throughout the year, including scenario modelling designed to test theresilience of the Group's financial position and performance to a number of downside scenarios. Based on its review of thelatest forecast, the Board is satisfied that the Group has sufficient headroom in its available cash and committed facilities,when combined with available mitigating actions, to be able to meet its liabilities as they fall due for the foreseeable futureacross a range of scenarios.
Consequently, the directors have a reasonable expectation that the Group will continue in existence for the next 12 monthsand therefore, have adopted the going concern basis when preparing the Condensed Consolidated Interim FinancialStatements.
The contents of the Business and Financial reviews were approved by the Board on 28 July 2021.
Principal risks and uncertaintiesThe Group's financial and operating performance is subject to various risks and uncertainties. Several of these risks are notdirectly within the Group's control, such as the wider economic and political environment. We seek to manage and addressthe potential impact of the risks faced by the Group in accordance with policies approved by the Board and management,applying the Group's risk management framework. The Board monitors the risks and uncertainties, considering the changesto those risks over time, the possible measures to mitigate such risks and the approach which might be taken in managingresidual risks to the Group.
The Board, as part of its half year processes, considered reports from management reviewing the principal risks anduncertainties and how these might evolve during the second half of 2021. This review took account of the ongoing Covid-19pandemic, the potential adverse effects of Brexit and the acquisition of Pinnacle Renewable Energy Inc. (Pinnacle) on 13April 2021.
Following this review the Board is satisfied that the Group's principal risks remain materially unchanged. These are:
1. Environment, health and safety2. Political and regulatory3. Strategic4. Biomass acceptability5. Plant operations6. Trading and commodity7. Information systems and security8. Climate change9. People
As was detailed in the Shareholder Circular, there were a number of risks identified in relation to the acquisition andintegration of Pinnacle. Actions are already being taken to integrate Pinnacle into the Group's standard operatingprocedures. Actions are also in progress to provide for appropriate mitigation of integration risks which will continue throughthe second half of the year.
Further details of the Group's principal risks and uncertainties can be found on pages 66 - 77 of the 2020 Annual Report andAccounts, which is available at www.drax.com.
Covid-19The ongoing Covid-19 pandemic continues to have a significant impact on many aspects of society and the global economy,and the duration and depth of the impacts remain uncertain. The resulting market environment in 2020 led to a significant
28/07/2021 announcement2210124.html
file:///C:/Users/fensomb/AppData/Local/Microsoft/Windows/INetCache/IE/ITFHD74A/announcement2210124.html 16/49
reduction in demand for power and an increase in the costs of selling pre-contracted power back into the market. Althoughtrading has now normalised for our Generation business, we continue to see an impact on our Customers business, withongoing risk of business failure and bad debt in the smaller businesses we supply. Against this backdrop we have continuedto make good progress with our strategy, whilst delivering robust trading and operational performance.
The effective return to the Group's sites for those people who have been working from home will be a key focus during thesecond half of the year, requiring consideration of people's safety and wellbeing, across quite different circumstances.Despite having now operated in a world with Covid-19 since March 2020, the risks posed to the business, whilst betterunderstood and being mitigated, still remain. However, amended work practices have been well embedded for over a year.The arrival of vaccines and the availability of rapid testing have been positive developments, but the emergence of newvariants means that it is necessary to remain vigilant and continue to implement mitigations at our offices and sites,responding to changes in government guidance. An increase in the number of operational colleagues, or those in our supplychain, required to self-isolate as a result of Track and Trace alerts or testing positive for Covid-19 could heighten businesscontinuity risk and will continue to be monitored. The impact of Covid-19 on each principal risk and the mitigating actionsadopted in response to the risk have been recorded in the underlying risk registers. The Board continues to have regularengagement with management on the Group's response to these risks in order to assess, monitor and promptly respond toany evolving impact of Covid-19 on our operations and business, including impacts for all our stakeholders.
BrexitThe Group's ongoing focus continues to be to ensure that our business mitigates any adverse effects to its operationsfollowing the adoption of the Free Trade Agreement (FTA) throughout the grace period to 31 December 2021. In particular,the Group developed contingency plans to respond to the revised approach to carbon emissions trading post 1 January2021 to allow it to effectively meet the Group's regulatory requirements and manage the financial exposure. We are closelymonitoring the ongoing implementation of a UK carbon allowances trading scheme. There have been no furtherdevelopments in the first half of 2021 that would suggest a significant change in the range or severity of risks faced by thebusiness as a result of Brexit. Therefore, it has been agreed that Brexit will now be considered as part of the business-as-usual risks monitored by the business and not reported on separately.
Acquisition of Pinnacle Renewable Energy Inc.As part of the Group's strategy to build a long-term future for sustainable biomass, Drax completed the acquisition ofPinnacle on 13 April 2021. An Integration Management Office (IMO) was established pre-completion to plan activitiesrequired from pre-close through to post-acquisition for each functional area. The IMO set out the guiding principles ofintegration, the culture, the approach to ways of working and the roles and responsibilities within the enlarged Group.
An integration governance structure has been implemented including a Steering Committee attended by seniorrepresentatives from each functional area as well as the Group CEO and CFO. There is an established process for keyrisks, issues, and actions to be reported to senior management to consider. Where additional resourcing or investment isconsidered necessary to respond to any of these areas, there is a process for it to be assessed and appropriately provided.Regular all-parties calls provide the opportunity for ongoing reporting and to share key updates. Several of the functionalareas have now transitioned from project management provided by the IMO to business-as-usual leads, following successfulcompletion of integration actions. The Steering Committee continues to monitor the implementation of Drax controls,processes, and ethics and compliance programmes into the new business.
As communicated in the Shareholder Circular, there are risks associated with the acquisition of Pinnacle which impact theoverall risk profile of the Group. The Group's exposure to environment, health and safety (HSE) risks has expanded due tothe significant increase in the number of operational sites. A review of current Pinnacle operations has been conducted.Notwithstanding the Covid-19 international travel restrictions, this included visits to all sites, supported by contractors andthose able to travel in the US and Canada. Action plans are being established at site level to address immediate prioritiesand a HSE project is in progress, with additional capital investment already approved to be implemented in 2021. Asexplained in the Shareholder Circular, the Group's status as UK critical national infrastructure may mean Pinnacle becomesthe subject of new and potentially more sophisticated cyber security threats. These threats, and the controls that regulatorsexpect us to have in place to mitigate them, are continually developing. Additional measures are being reviewed tostrengthen Pinnacle networks and business resilience around disaster recovery and network infrastructure. Pinnacleoperates in higher gross risk jurisdictions, has higher risk customers and suppliers, and joint venture partnerships wherePinnacle is responsible for business ethics compliance. Interim due diligence processes for both customers and suppliershave been implemented, ahead of instigating enduring processes.
Under the governance of the IMO, integration activities are ongoing to embed permanent processes and controls to robustlymitigate these risks. During the intervening period interim remediations have been established to monitor and report onthese increased risks.
Directors' Responsibility StatementWe confirm that to the best of our knowledge:a) The condensed set of financial statements has been prepared in accordance with IAS 34 "Interim Financial Reporting";b) The interim management report includes a fair review of the information required by DTR 4.2.7R (indication ofimportant events during the first six months and description of principal risks and uncertainties for the remaining sixmonths of the year); andc) The interim management report includes a fair review of the information required by DTR 4.2.8R (disclosure of relatedparty transactions and changes therein). By order of the Board Will GardinerChief Executive Officer28 July 2021
28/07/2021 announcement2210124.html
file:///C:/Users/fensomb/AppData/Local/Microsoft/Windows/INetCache/IE/ITFHD74A/announcement2210124.html 17/49
Condensed Consolidated Interim Financial Statements
IntroductionThe Condensed Consolidated Interim Financial Statements provide information about the financial performance(Condensed consolidated income statement), financial position (Condensed consolidated balance sheet), and cash flows(Condensed consolidated cash flow statement) of Drax Group plc (the Company) together with all of the entities controlledby the Company (collectively, the Group).
The notes to the financial statements provide additional information on certain items in the Condensed consolidated incomestatement, Condensed consolidated balance sheet and Condensed consolidated cash flow statement. In general, theadditional information in the notes to the financial statements is required by International Financial Reporting Standards(IFRS), other regulations or management judgement to facilitate increased understanding of the condensed primarystatements.
Basis of preparationThe Condensed Consolidated Interim Financial Statements have been prepared using accounting policies consistent withIFRS as adopted by the UK and in accordance with IAS 34 'Interim Financial Reporting'. The information provided in respectof the year ended 31 December 2020 does not constitute statutory accounts as defined in Section 434 of the Companies Act2006 but is derived from those accounts. A copy of the statutory accounts for that year has been delivered to the Registrarof Companies. The auditor's report on those accounts was not qualified, did not draw attention to any matters by way ofemphasis and did not contain statements under Section 498(2) or (3) of the Companies Act 2006.
The Condensed Consolidated Interim Financial Statements have been prepared on the going concern basis and on thehistorical cost basis, except for certain assets and liabilities that have been measured at fair value (principally derivativefinancial instruments) and the assets and liabilities of the Group's defined benefit pension schemes (measured at fair valueand using the projected unit credit method respectively).
The impact of Covid-19 on the application of the going concern basis is discussed in further detail in the Group FinancialReview.
Income statement amounts referred to herein are for continuing operations unless otherwise stated. Results fromdiscontinued operations are set out in note 10. Reconciliations of Adjusted EBITDA between continuing, discontinued, andcombined amounts for each period are shown in note 6.
The Condensed Consolidated Interim Financial Statements were approved by the Board on 28 July 2021.
Adoption of new and revised accounting standardsThe accounting policies adopted in the preparation of the Condensed Consolidated Interim Financial Statements areconsistent with those followed in the preparation of the Group's Annual Report and Accounts for the year ended 31December 2020, except for the adoption of new standards, interpretations and amendments effective as of 1 January 2021.The adoption of new standards, interpretations and amendments in the current year has not had a material impact. TheGroup has not early-adopted any other standard, interpretation or amendment that has been issued but is not yet effective at30 June 2021.
A full listing of new standards, interpretations and pronouncements under IFRS applicable to these CondensedConsolidated Interim Financial Statements is presented in note 22.
Judgements and estimatesWith the exception of the specific matters set out below, the significant judgements and key sources of estimationuncertainty applicable to the preparation of the Condensed Consolidated Interim Financial Statements are the same asthose described on pages 151-153 of the Group's 2020 Annual Report and Accounts. In each case, judgements have beenapplied consistently and estimates made using a consistent methodology, with inputs and assumptions updated to reflectthe Group's latest forecasts and prevailing market conditions at the balance sheet date as appropriate.
In addition, during the six months ended 30 June 2021, the Group made the following significant judgements in the processof applying the Group's accounting policies in the Condensed Consolidated Interim Financial Statements:
Fair value of acquired assets and liabilitiesThe Group acquired Pinnacle Renewable Energy Inc. (Pinnacle), a major producer of compressed bioenergy pellets, on 13April 2021. The assets and liabilities of the acquired business have been recognised at fair value in the Group's Condensedconsolidated balance sheet. The key judgements made in this process are set out below.The fair value of property, plant and equipment has been calculated based on a depreciated replacement cost (DRC)method. Estimating the DRC of operational pellet plants is inherently subjective as assumptions need to be made aboutinput costs, the condition of the assets, and the functional and economic obsolescence of the assets. This process resultedin a net increase in the value of property, plant and equipment acquired, when compared to their pre-acquisition bookvalues, of C$40.8 million.Pinnacle's pre-existing long-term supply contracts with customers have also been recognised at fair value. The fair value ofthese contracts has been calculated using a multi-period excess earnings model, taking into account contract margins andfunctional charges. The analysis assumes that existing contracts are not renewed at the end of their current term. Thisassumption was based on the long duration of these contracts and the developing nature of the market for bioenergypellets. Future renewals will depend on factors such as market conditions and the requirement and availability ofappropriate support mechanisms in jurisdictions where the Group's customers operate. The application of these
28/07/2021 announcement2210124.html
file:///C:/Users/fensomb/AppData/Local/Microsoft/Windows/INetCache/IE/ITFHD74A/announcement2210124.html 18/49
assumptions resulted in a fair value for the previously unrecognised acquired contracts of C$62.1 million, which is beingamortised over the weighted average useful life of the contracts of ten years. Had a different assumption been made inrespect of contract renewals, this value could have been materially higher with an equivalent reduction in goodwill.The fair value of the pre-existing contract between the Group and Pinnacle was assessed as required by IFRS 3. Thisassessment concluded that the contractual terms reflected market prices and therefore no adjustment to the purchaseconsideration or goodwill was required. Given the illiquid nature of the bioenergy pellet market, with very few spot markettransactions and contracts being negotiated bilaterally with no quoted market price, the approach to assessing the marketprice requires judgement. The market price for the purpose of this exercise was assessed based on the existing portfolioof Drax and Pinnacle contracts.Acquisition date fair values quoted in these accounts are provisional. In accordance with the measurement periodrequirements of IFRS 3, the Group has 12 months from the acquisition date to finalise these values. Whilst materialchanges are not expected, if further information about the fair value of the acquired assets and liabilities at the acquisitiondate becomes available, this may result in subsequent revisions to the acquisition date fair values recognised and acorresponding increase or decrease in goodwill. Based on the provisional fair values recognised, goodwill recognised inthese Condensed Consolidated Interim Financial Statements in respect of the Pinnacle acquisition is C$281.3 million. Comparative informationThe Group provides comparative financial information in these Condensed Consolidated Interim Financial Statements forboth the six months ended 30 June 2020 and the year ended 31 December 2020. Where included within text, incomestatement comparatives refer to the six months ended 30 June 2020 and balance sheet comparatives are as at 31December 2020, unless otherwise stated. The 30 June 2020 comparatives have been re-presented for the impact ofdiscontinued operations accounting in relation to the sale of the CCGT portfolio. See note 10 for more information ondiscontinued operations.
Alternative Performance Measures (APMs)Alternative Performance Measures are not defined in IFRS but provide additional information that is used by the Board toevaluate the Group's financial position and performance. These measures have been defined internally and may thereforenot be comparable to similar APMs presented by other companies. The APMs presented in these Condensed ConsolidatedInterim Financial Statements have been updated for the impact of the acquisition of Pinnacle.
APM definitions have been updated to exclude any amounts attributable to non-controlling interests, following the applicationof the equity method accounting requirements of IAS 28 and the accounting for non-controlling interests under IFRS 10,both of which have been applied for the first time in the six months ended 30 June 2021 as a result of the acquisition ofPinnacle. This change has no impact on amounts disclosed in respect of APMs for previous periods. Reflecting the shortperiod between the acquisition date and the balance sheet date, amounts attributable to non-controlling interests in the sixmonths ended 30 June 2021 are immaterial.
Presentation of the income statementThe Group's financial performance for the period, measured in accordance with IFRS, is shown in the Total Results columnon the face of the Condensed consolidated income statement. Exceptional items and certain remeasurements, including thetax thereon, are deducted from the Total Results in arriving at the Adjusted Results for the period. The Group's AdjustedResults are consistent with the way executive management and the Board assess the performance of the Group. AdjustedResults are intended to reflect the underlying trading performance of the Group's businesses and are presented to assistusers of the financial statements in evaluating the Group's trading performance and performance against strategicobjectives.
Exceptional items are those transactions that, by their nature, do not reflect the trading performance of the Group in theperiod. For a transaction to be considered exceptional, management considers the nature of the transaction, the frequencyof similar events, any related precedent and the commercial context. Presentation of a transaction as exceptional isapproved by the Audit Committee in accordance with an agreed policy. During the six months ended 30 June 2021, thepolicy has been reviewed and amended guidance on the application of the policy has been approved by the AuditCommittee. The revised guidance has been updated for the definition of materiality and clarification that all matters shouldbe assessed on a case-by-case basis in line with the principles set out in the exceptional items policy. This updatedapplication guidance would not have changed exceptional items recognised in either of the comparative periods presentedin these Condensed Consolidated Interim Financial Statements.
None of the financial impacts of Covid-19 on the Group's financial performance in the six months ended 30 June 2021 oreither of the comparative periods presented have been treated as exceptional items and they are included in AdjustedResults in full.
Certain remeasurements comprise fair value gains and losses on derivative contracts to the extent those contracts do notqualify for hedge accounting, or hedge accounting is not effective, which under IFRS are recorded in revenue, cost of salesor foreign exchange gains/(losses). The Group regards all of its forward contracting activity to represent an economic hedge.The impact of excluding these fair value remeasurements is to reflect commodity sales and purchases at contracted prices(the price paid or received in respect of delivery of the commodity in question), taking into account the impact of financialtrading (such as forward foreign currency purchases), in the Adjusted Results. The result of this adjustment shows theimpact in revenue, cost of sales and foreign exchange gains/(losses) at the time the transaction takes place.
Further information on exceptional items and certain remeasurements in the current and previous period is included in note6 to the Condensed Consolidated Interim Financial Statements.
In note 6, the Group presents a reconciliation of Adjusted EBITDA. Adjusted EBITDA is earnings before interest, tax,depreciation and amortisation, excluding the impact of exceptional items and certain remeasurements. Adjusted EBITDAonly includes the proportion of the results of non-wholly owned subsidiaries that is attributable to the shareholders of theGroup and it excludes the results of any associates.
Adjusted EBITDA is the primary measure used by executive management and the Board to assess the financialperformance of the Group as it provides a more comparable assessment of the Group's year on year trading performance.
Net debt
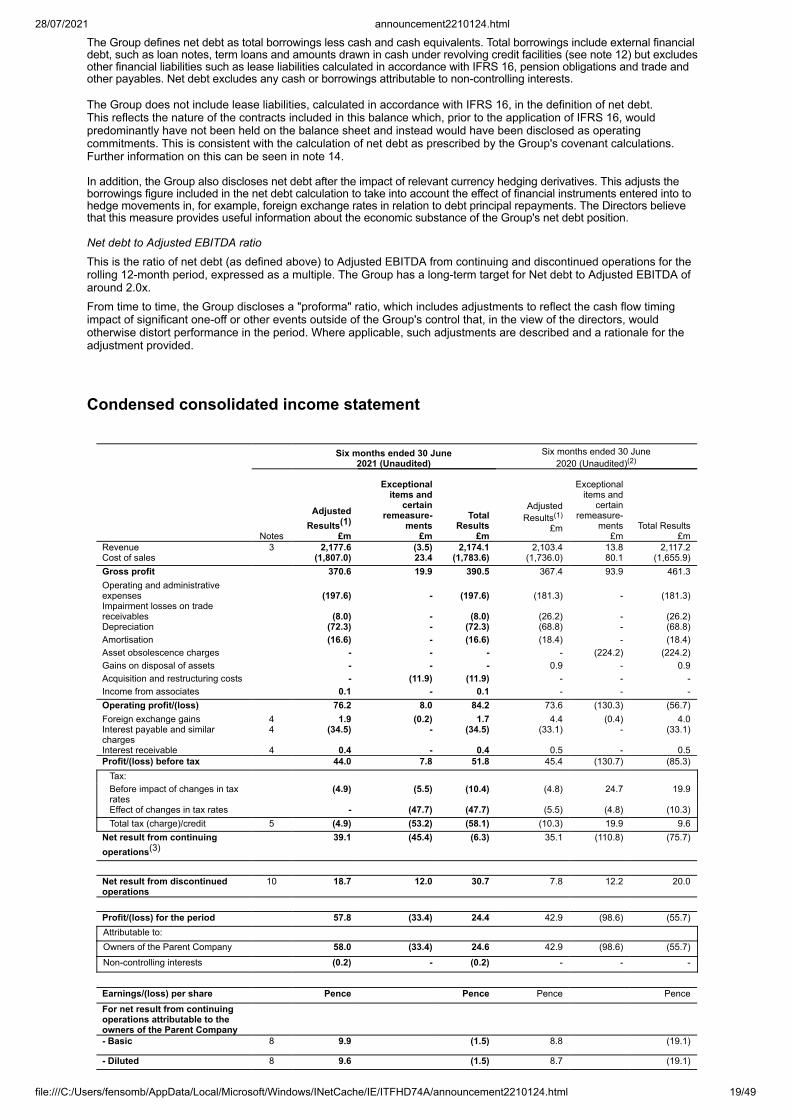
28/07/2021 announcement2210124.html
file:///C:/Users/fensomb/AppData/Local/Microsoft/Windows/INetCache/IE/ITFHD74A/announcement2210124.html 19/49
The Group defines net debt as total borrowings less cash and cash equivalents. Total borrowings include external financialdebt, such as loan notes, term loans and amounts drawn in cash under revolving credit facilities (see note 12) but excludesother financial liabilities such as lease liabilities calculated in accordance with IFRS 16, pension obligations and trade andother payables. Net debt excludes any cash or borrowings attributable to non-controlling interests.
The Group does not include lease liabilities, calculated in accordance with IFRS 16, in the definition of net debt.This reflects the nature of the contracts included in this balance which, prior to the application of IFRS 16, wouldpredominantly have not been held on the balance sheet and instead would have been disclosed as operatingcommitments. This is consistent with the calculation of net debt as prescribed by the Group's covenant calculations.Further information on this can be seen in note 14. In addition, the Group also discloses net debt after the impact of relevant currency hedging derivatives. This adjusts theborrowings figure included in the net debt calculation to take into account the effect of financial instruments entered into tohedge movements in, for example, foreign exchange rates in relation to debt principal repayments. The Directors believethat this measure provides useful information about the economic substance of the Group's net debt position.
Net debt to Adjusted EBITDA ratioThis is the ratio of net debt (as defined above) to Adjusted EBITDA from continuing and discontinued operations for therolling 12-month period, expressed as a multiple. The Group has a long-term target for Net debt to Adjusted EBITDA ofaround 2.0x.From time to time, the Group discloses a "proforma" ratio, which includes adjustments to reflect the cash flow timingimpact of significant one-off or other events outside of the Group's control that, in the view of the directors, wouldotherwise distort performance in the period. Where applicable, such adjustments are described and a rationale for theadjustment provided.
Condensed consolidated income statement
Six months ended 30 June
2021 (Unaudited)Six months ended 30 June
2020 (Unaudited)(2)
Notes
AdjustedResults(1)
£m
Exceptionalitems and
certainremeasure-
ments £m
TotalResults
£m
AdjustedResults(1)
£m
Exceptionalitems and
certainremeasure-
ments £m
Total Results £m
Revenue 3 2,177.6 (3.5) 2,174.1 2,103.4 13.8 2,117.2Cost of sales (1,807.0) 23.4 (1,783.6) (1,736.0) 80.1 (1,655.9)Gross profit 370.6 19.9 390.5 367.4 93.9 461.3Operating and administrativeexpenses
(197.6) - (197.6) (181.3) - (181.3)
Impairment losses on tradereceivables
(8.0) - (8.0) (26.2) - (26.2)
Depreciation (72.3) - (72.3) (68.8) - (68.8)Amortisation (16.6) - (16.6) (18.4) - (18.4)Asset obsolescence charges - - - - (224.2) (224.2)Gains on disposal of assets - - - 0.9 - 0.9Acquisition and restructuring costs - (11.9) (11.9) - - -Income from associates 0.1 - 0.1 - - -Operating profit/(loss) 76.2 8.0 84.2 73.6 (130.3) (56.7)Foreign exchange gains 4 1.9 (0.2) 1.7 4.4 (0.4) 4.0Interest payable and similarcharges
4 (34.5) - (34.5) (33.1) - (33.1)
Interest receivable 4 0.4 - 0.4 0.5 - 0.5Profit/(loss) before tax 44.0 7.8 51.8 45.4 (130.7) (85.3)
Tax: Before impact of changes in taxrates
(4.9) (5.5) (10.4) (4.8) 24.7 19.9
Effect of changes in tax rates - (47.7) (47.7) (5.5) (4.8) (10.3)Total tax (charge)/credit 5 (4.9) (53.2) (58.1) (10.3) 19.9 9.6
Net result from continuingoperations(3)
39.1 (45.4) (6.3) 35.1 (110.8) (75.7)
Net result from discontinuedoperations
10 18.7 12.0 30.7 7.8 12.2 20.0
Profit/(loss) for the period 57.8 (33.4) 24.4 42.9 (98.6) (55.7)Attributable to: Owners of the Parent Company 58.0 (33.4) 24.6 42.9 (98.6) (55.7)Non-controlling interests (0.2) - (0.2) - - -
Earnings/(loss) per share Pence Pence Pence PenceFor net result from continuingoperations attributable to theowners of the Parent Company
- Basic 8 9.9 (1.5) 8.8 (19.1)
- Diluted 8 9.6 (1.5) 8.7 (19.1)
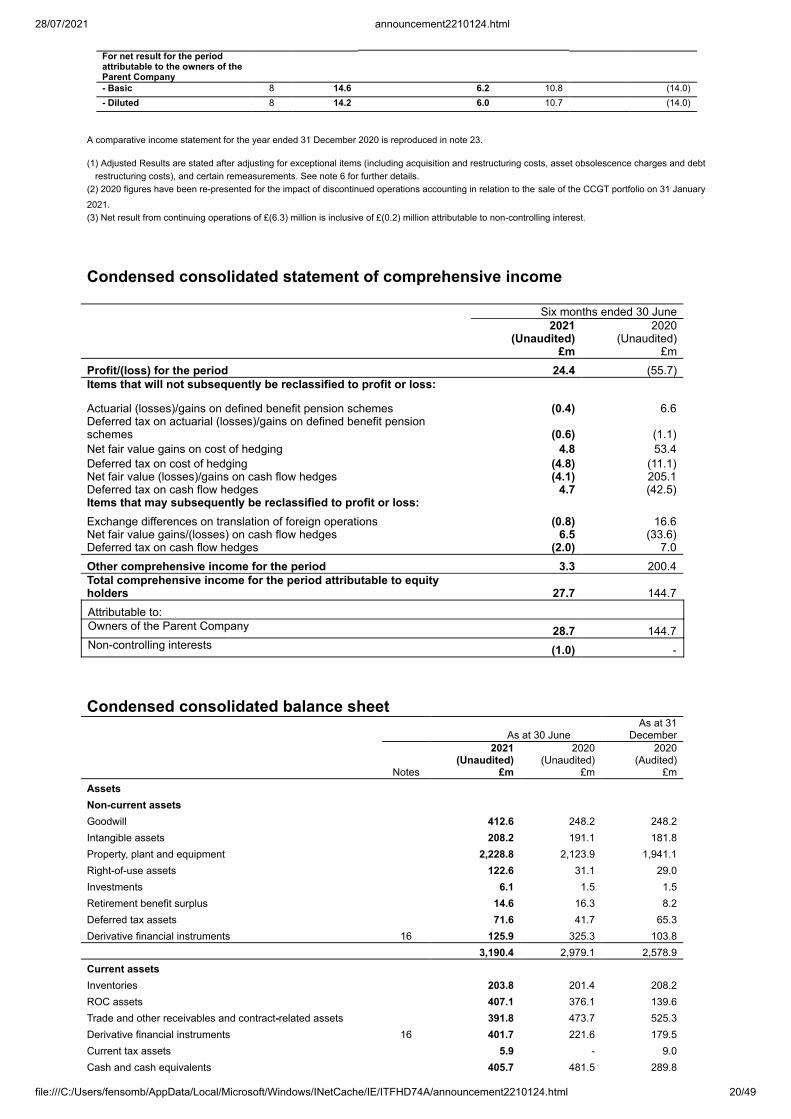
28/07/2021 announcement2210124.html
file:///C:/Users/fensomb/AppData/Local/Microsoft/Windows/INetCache/IE/ITFHD74A/announcement2210124.html 20/49
For net result for the periodattributable to the owners of theParent Company
- Basic 8 14.6 6.2 10.8 (14.0)- Diluted 8 14.2 6.0 10.7 (14.0)
A comparative income statement for the year ended 31 December 2020 is reproduced in note 23. (1) Adjusted Results are stated after adjusting for exceptional items (including acquisition and restructuring costs, asset obsolescence charges and debt
restructuring costs), and certain remeasurements. See note 6 for further details.(2) 2020 figures have been re-presented for the impact of discontinued operations accounting in relation to the sale of the CCGT portfolio on 31 January2021.(3) Net result from continuing operations of £(6.3) million is inclusive of £(0.2) million attributable to non-controlling interest.
Condensed consolidated statement of comprehensive income
Six months ended 30 June
2021 (Unaudited)
£m
2020 (Unaudited)
£mProfit/(loss) for the period 24.4 (55.7)Items that will not subsequently be reclassified to profit or loss:
Actuarial (losses)/gains on defined benefit pension schemes (0.4) 6.6Deferred tax on actuarial (losses)/gains on defined benefit pensionschemes (0.6) (1.1)Net fair value gains on cost of hedging 4.8 53.4Deferred tax on cost of hedging (4.8) (11.1)Net fair value (losses)/gains on cash flow hedges (4.1) 205.1Deferred tax on cash flow hedges 4.7 (42.5)Items that may subsequently be reclassified to profit or loss: Exchange differences on translation of foreign operations (0.8) 16.6Net fair value gains/(losses) on cash flow hedges 6.5 (33.6)Deferred tax on cash flow hedges (2.0) 7.0Other comprehensive income for the period 3.3 200.4Total comprehensive income for the period attributable to equityholders 27.7 144.7Attributable to: Owners of the Parent Company 28.7 144.7Non-controlling interests (1.0) -
Condensed consolidated balance sheet As at 30 June
As at 31December
Notes
2021 (Unaudited)
£m
2020(Unaudited)
£m
2020(Audited)
£mAssets Non-current assets Goodwill 412.6 248.2 248.2Intangible assets 208.2 191.1 181.8Property, plant and equipment 2,228.8 2,123.9 1,941.1Right-of-use assets 122.6 31.1 29.0Investments 6.1 1.5 1.5Retirement benefit surplus 14.6 16.3 8.2Deferred tax assets 71.6 41.7 65.3Derivative financial instruments 16 125.9 325.3 103.8 3,190.4 2,979.1 2,578.9Current assets Inventories 203.8 201.4 208.2ROC assets 407.1 376.1 139.6Trade and other receivables and contract-related assets 391.8 473.7 525.3Derivative financial instruments 16 401.7 221.6 179.5Current tax assets 5.9 - 9.0Cash and cash equivalents 405.7 481.5 289.8

28/07/2021 announcement2210124.html
file:///C:/Users/fensomb/AppData/Local/Microsoft/Windows/INetCache/IE/ITFHD74A/announcement2210124.html 21/49
Assets held for sale - - 261.3 1,816.0 1,754.3 1,612.7Liabilities Current liabilities Trade and other payables and contract-related liabilities (1,027.8) (1,067.1) (907.0)Lease liabilities (11.9) (7.1) (7.0)Current tax liabilities - (15.3) -Borrowings 12 (31.9) - -Derivative financial instruments 16 (491.7) (134.7) (311.5)Liabilities directly associated with assets held for sale - - (82.5) (1,563.3) (1,224.2) (1,308.0)Net current assets 252.7 530.1 304.7Non-current liabilities Borrowings 12 (1,401.9) (1,273.9) (1,065.7)Lease liabilities (111.9) (25.5) (23.2)Derivative financial instruments 16 (168.1) (67.9) (142.1)Provisions (84.5) (59.7) (91.2)Deferred tax liabilities (303.5) (289.4) (222.0) (2,069.9) (1,716.4) (1,544.2)Net assets 1,373.2 1,792.8 1,339.4Shareholders' equity Issued equity 47.5 47.4 47.5Share premium 431.3 429.6 430.0Hedge reserve 18 (65.1) 223.6 (76.0)Cost of hedging reserve 81.6 84.1 87.2Other reserves 19 697.3 723.2 697.3Retained profits 138.1 284.9 153.4Total equity attributable to owners of the Parent Company 1,330.7 1,792.8 1,339.4Non-controlling interest 42.5 - -Total shareholders' equity 1,373.2 1,792.8 1,339.4 Condensed consolidated statement of changes in equity
Issuedequity
£m
Sharepremium
£m
Hedgereserve
£m
Cost ofhedgingreserve
£m
Otherreserves
£m
Retainedprofits
£m
Non-controlling
interests£m
Total£m
At 1 January 2020 47.4 429.6 121.5 40.8 706.6 369.7 - 1,715.6Loss for the year - - - - - (157.9) - (157.9)Other comprehensive(expense)/income - - (89.7) 41.6 (9.3) 1.1 - (56.3)Total comprehensive(expense)/incomefor the year - - (89.7) 41.6 (9.3) (156.8) - (214.2)
Equity dividends paid - - - - - (64.7) - (64.7)
Issue of share capital 0.1 0.4 - - - - - 0.5Total transactions withowners 0.1 0.4 - - - (64.7) - (64.2)Movements on cash flowhedges released directlyfrom equity - - (133.1) - - - - (133.1)Deferred tax on cash flowhedges released directlyfrom equity - - 25.3 - - - - 25.3Movement on cost ofhedging released directlyfrom equity - - - 5.2 - - - 5.2Deferred tax on cost ofhedging released directlyfrom equity - - - (0.4) - - - (0.4)Movement in equityassociated with share-based payments - - - - - 5.2 - 5.2
At 31 December 2020 47.5 430.0 (76.0) 87.2 697.3 153.4 - 1,339.4At 1 January 2020 47.4 429.6 121.5 40.8 706.6 369.7 - 1,715.6Loss for the period - - - - - (55.7) - (55.7)
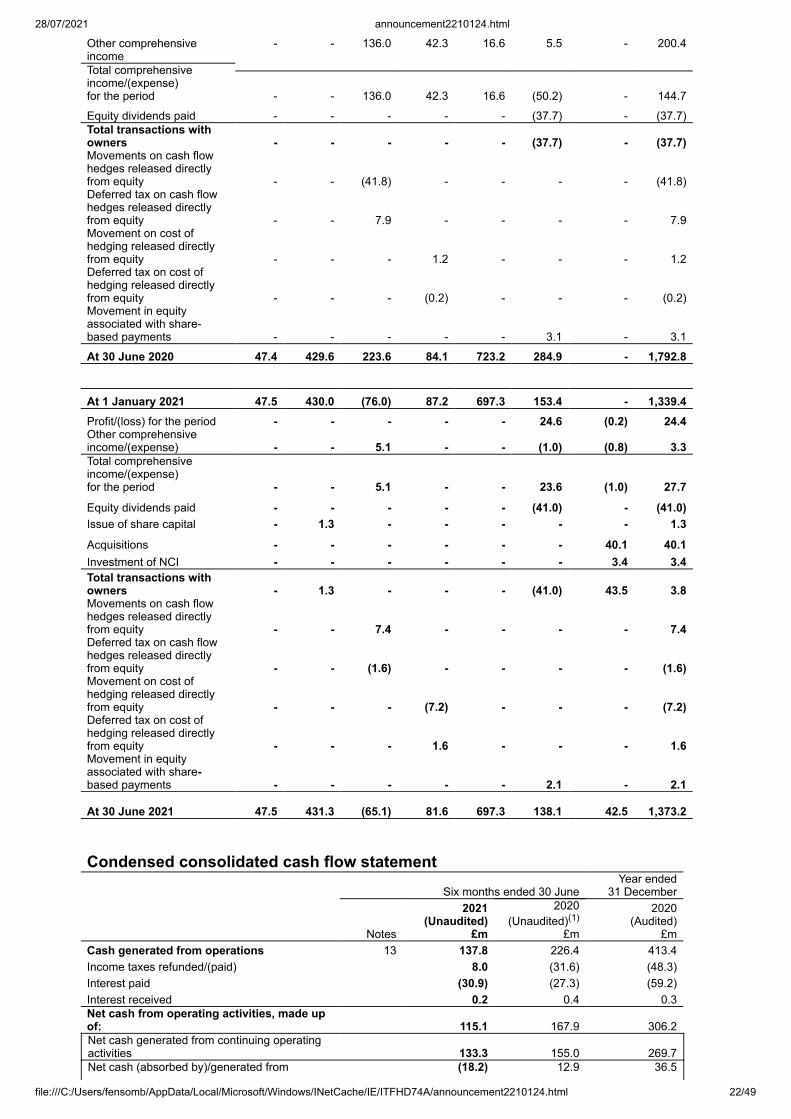
28/07/2021 announcement2210124.html
file:///C:/Users/fensomb/AppData/Local/Microsoft/Windows/INetCache/IE/ITFHD74A/announcement2210124.html 22/49
Other comprehensiveincome
- - 136.0 42.3 16.6 5.5 - 200.4
Total comprehensiveincome/(expense)for the period - - 136.0 42.3 16.6 (50.2) - 144.7
Equity dividends paid - - - - - (37.7) - (37.7)Total transactions withowners - - - - - (37.7) - (37.7)Movements on cash flowhedges released directlyfrom equity - - (41.8) - - - - (41.8)Deferred tax on cash flowhedges released directlyfrom equity - - 7.9 - - - - 7.9Movement on cost ofhedging released directlyfrom equity - - - 1.2 - - - 1.2Deferred tax on cost ofhedging released directlyfrom equity - - - (0.2) - - - (0.2)Movement in equityassociated with share-based payments - - - - - 3.1 - 3.1
At 30 June 2020 47.4 429.6 223.6 84.1 723.2 284.9 - 1,792.8
At 1 January 2021 47.5 430.0 (76.0) 87.2 697.3 153.4 - 1,339.4Profit/(loss) for the period - - - - - 24.6 (0.2) 24.4Other comprehensiveincome/(expense) - - 5.1 - - (1.0) (0.8) 3.3Total comprehensiveincome/(expense)for the period - - 5.1 - - 23.6
(1.0) 27.7
Equity dividends paid - - - - - (41.0) - (41.0)Issue of share capital - 1.3 - - - - - 1.3
Acquisitions - - - - - - 40.1 40.1Investment of NCI - - - - - - 3.4 3.4Total transactions withowners - 1.3 - - - (41.0)
43.5 3.8
Movements on cash flowhedges released directlyfrom equity - - 7.4 - - - - 7.4Deferred tax on cash flowhedges released directlyfrom equity - - (1.6) - - - - (1.6)Movement on cost ofhedging released directlyfrom equity - - - (7.2) - -
- (7.2)
Deferred tax on cost ofhedging released directlyfrom equity - - - 1.6 - -
- 1.6
Movement in equityassociated with share-based payments - - - - - 2.1
- 2.1
At 30 June 2021 47.5 431.3 (65.1) 81.6 697.3 138.1
42.5 1,373.2
Condensed consolidated cash flow statement Six months ended 30 June
Year ended 31 December
Notes
2021 (Unaudited)
£m
2020(Unaudited)(1)
£m
2020 (Audited) £m
Cash generated from operations 13 137.8 226.4 413.4Income taxes refunded/(paid) 8.0 (31.6) (48.3)Interest paid (30.9) (27.3) (59.2)Interest received 0.2 0.4 0.3Net cash from operating activities, made upof: 115.1 167.9 306.2Net cash generated from continuing operatingactivities 133.3 155.0 269.7Net cash (absorbed by)/generated from (18.2) 12.9 36.5
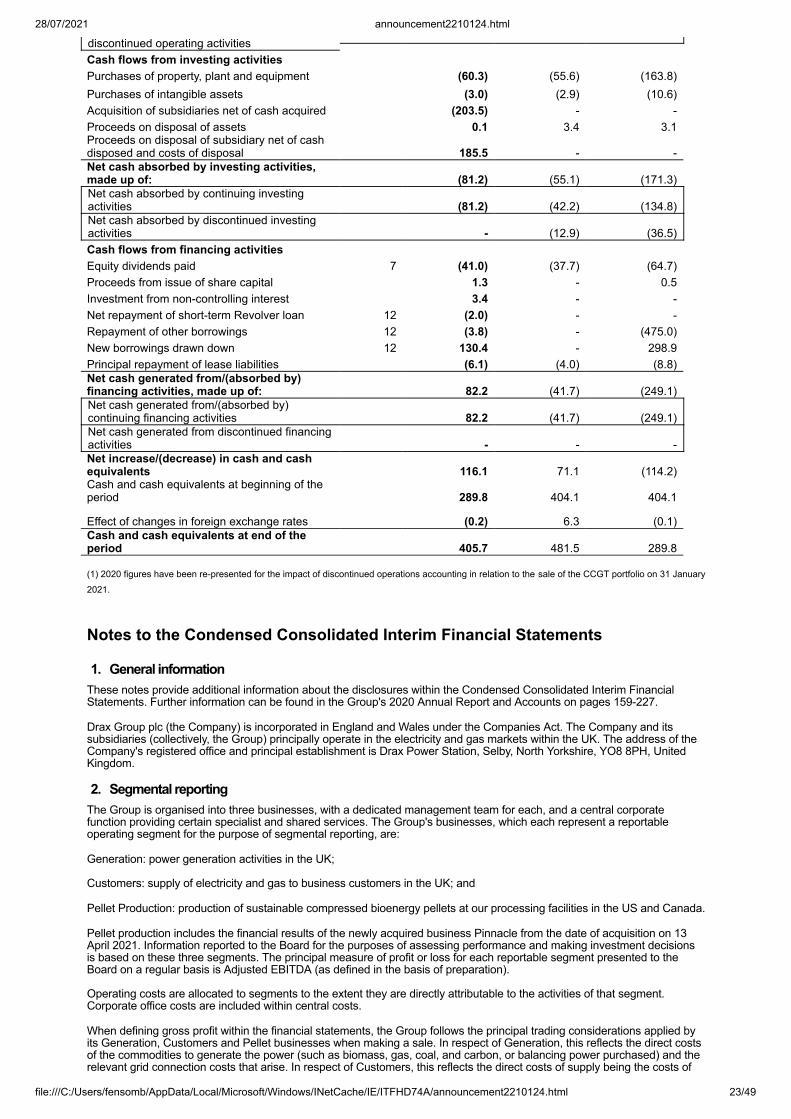
28/07/2021 announcement2210124.html
file:///C:/Users/fensomb/AppData/Local/Microsoft/Windows/INetCache/IE/ITFHD74A/announcement2210124.html 23/49
discontinued operating activitiesCash flows from investing activities Purchases of property, plant and equipment (60.3) (55.6) (163.8)Purchases of intangible assets (3.0) (2.9) (10.6)Acquisition of subsidiaries net of cash acquired (203.5) - -Proceeds on disposal of assets 0.1 3.4 3.1Proceeds on disposal of subsidiary net of cashdisposed and costs of disposal 185.5 - -Net cash absorbed by investing activities,made up of: (81.2) (55.1) (171.3)Net cash absorbed by continuing investingactivities (81.2) (42.2) (134.8)Net cash absorbed by discontinued investingactivities - (12.9) (36.5)Cash flows from financing activities Equity dividends paid 7 (41.0) (37.7) (64.7)Proceeds from issue of share capital 1.3 - 0.5Investment from non-controlling interest 3.4 - -Net repayment of short-term Revolver loan 12 (2.0) - -Repayment of other borrowings 12 (3.8) - (475.0)New borrowings drawn down 12 130.4 - 298.9Principal repayment of lease liabilities (6.1) (4.0) (8.8)Net cash generated from/(absorbed by)financing activities, made up of: 82.2 (41.7) (249.1)Net cash generated from/(absorbed by)continuing financing activities 82.2 (41.7) (249.1)Net cash generated from discontinued financingactivities - - -Net increase/(decrease) in cash and cashequivalents 116.1 71.1 (114.2)Cash and cash equivalents at beginning of theperiod 289.8 404.1 404.1
Effect of changes in foreign exchange rates (0.2) 6.3 (0.1)Cash and cash equivalents at end of theperiod 405.7 481.5 289.8 (1) 2020 figures have been re-presented for the impact of discontinued operations accounting in relation to the sale of the CCGT portfolio on 31 January2021. Notes to the Condensed Consolidated Interim Financial Statements
1. General informationThese notes provide additional information about the disclosures within the Condensed Consolidated Interim FinancialStatements. Further information can be found in the Group's 2020 Annual Report and Accounts on pages 159-227.
Drax Group plc (the Company) is incorporated in England and Wales under the Companies Act. The Company and itssubsidiaries (collectively, the Group) principally operate in the electricity and gas markets within the UK. The address of theCompany's registered office and principal establishment is Drax Power Station, Selby, North Yorkshire, YO8 8PH, UnitedKingdom.
2. Segmental reportingThe Group is organised into three businesses, with a dedicated management team for each, and a central corporatefunction providing certain specialist and shared services. The Group's businesses, which each represent a reportableoperating segment for the purpose of segmental reporting, are:
Generation: power generation activities in the UK;
Customers: supply of electricity and gas to business customers in the UK; and
Pellet Production: production of sustainable compressed bioenergy pellets at our processing facilities in the US and Canada.
Pellet production includes the financial results of the newly acquired business Pinnacle from the date of acquisition on 13April 2021. Information reported to the Board for the purposes of assessing performance and making investment decisionsis based on these three segments. The principal measure of profit or loss for each reportable segment presented to theBoard on a regular basis is Adjusted EBITDA (as defined in the basis of preparation).
Operating costs are allocated to segments to the extent they are directly attributable to the activities of that segment.Corporate office costs are included within central costs.
When defining gross profit within the financial statements, the Group follows the principal trading considerations applied byits Generation, Customers and Pellet businesses when making a sale. In respect of Generation, this reflects the direct costsof the commodities to generate the power (such as biomass, gas, coal, and carbon, or balancing power purchased) and therelevant grid connection costs that arise. In respect of Customers, this reflects the direct costs of supply being the costs of
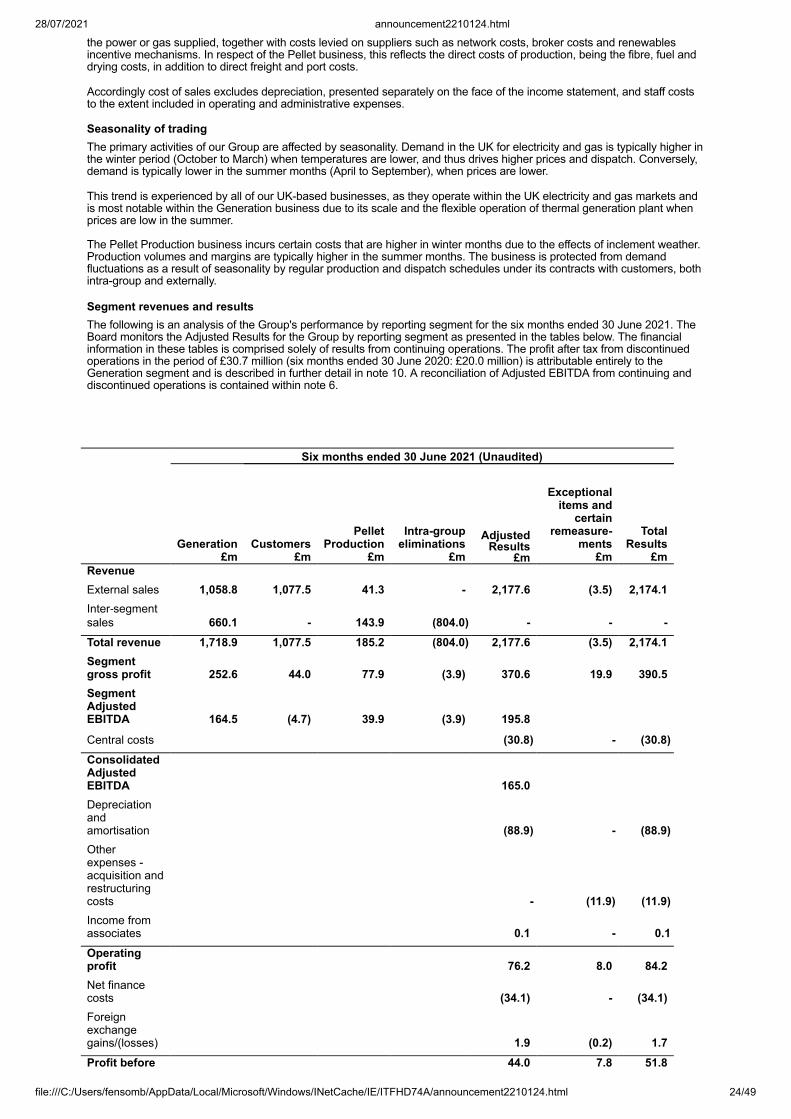
28/07/2021 announcement2210124.html
file:///C:/Users/fensomb/AppData/Local/Microsoft/Windows/INetCache/IE/ITFHD74A/announcement2210124.html 24/49
the power or gas supplied, together with costs levied on suppliers such as network costs, broker costs and renewablesincentive mechanisms. In respect of the Pellet business, this reflects the direct costs of production, being the fibre, fuel anddrying costs, in addition to direct freight and port costs.
Accordingly cost of sales excludes depreciation, presented separately on the face of the income statement, and staff coststo the extent included in operating and administrative expenses.
Seasonality of tradingThe primary activities of our Group are affected by seasonality. Demand in the UK for electricity and gas is typically higher inthe winter period (October to March) when temperatures are lower, and thus drives higher prices and dispatch. Conversely,demand is typically lower in the summer months (April to September), when prices are lower.
This trend is experienced by all of our UK-based businesses, as they operate within the UK electricity and gas markets andis most notable within the Generation business due to its scale and the flexible operation of thermal generation plant whenprices are low in the summer.
The Pellet Production business incurs certain costs that are higher in winter months due to the effects of inclement weather.Production volumes and margins are typically higher in the summer months. The business is protected from demandfluctuations as a result of seasonality by regular production and dispatch schedules under its contracts with customers, bothintra-group and externally.
Segment revenues and resultsThe following is an analysis of the Group's performance by reporting segment for the six months ended 30 June 2021. TheBoard monitors the Adjusted Results for the Group by reporting segment as presented in the tables below. The financialinformation in these tables is comprised solely of results from continuing operations. The profit after tax from discontinuedoperations in the period of £30.7 million (six months ended 30 June 2020: £20.0 million) is attributable entirely to theGeneration segment and is described in further detail in note 10. A reconciliation of Adjusted EBITDA from continuing anddiscontinued operations is contained within note 6.
Six months ended 30 June 2021 (Unaudited)
Generation £m
Customers £m
PelletProduction
£m
Intra-groupeliminations
£m
AdjustedResults
£m
Exceptionalitems and
certainremeasure-
ments £m
TotalResults
£mRevenue External sales 1,058.8 1,077.5 41.3 - 2,177.6 (3.5) 2,174.1Inter-segmentsales 660.1 - 143.9 (804.0) - - -Total revenue 1,718.9 1,077.5 185.2 (804.0) 2,177.6 (3.5) 2,174.1Segmentgross profit 252.6 44.0 77.9 (3.9) 370.6 19.9 390.5SegmentAdjustedEBITDA 164.5 (4.7) 39.9 (3.9) 195.8
Central costs (30.8) - (30.8)ConsolidatedAdjustedEBITDA 165.0 Depreciationandamortisation (88.9) - (88.9)Otherexpenses -acquisition andrestructuringcosts - (11.9) (11.9)Income fromassociates 0.1 - 0.1Operatingprofit 76.2 8.0 84.2Net financecosts (34.1) - (34.1)Foreignexchangegains/(losses) 1.9 (0.2) 1.7Profit before 44.0 7.8 51.8
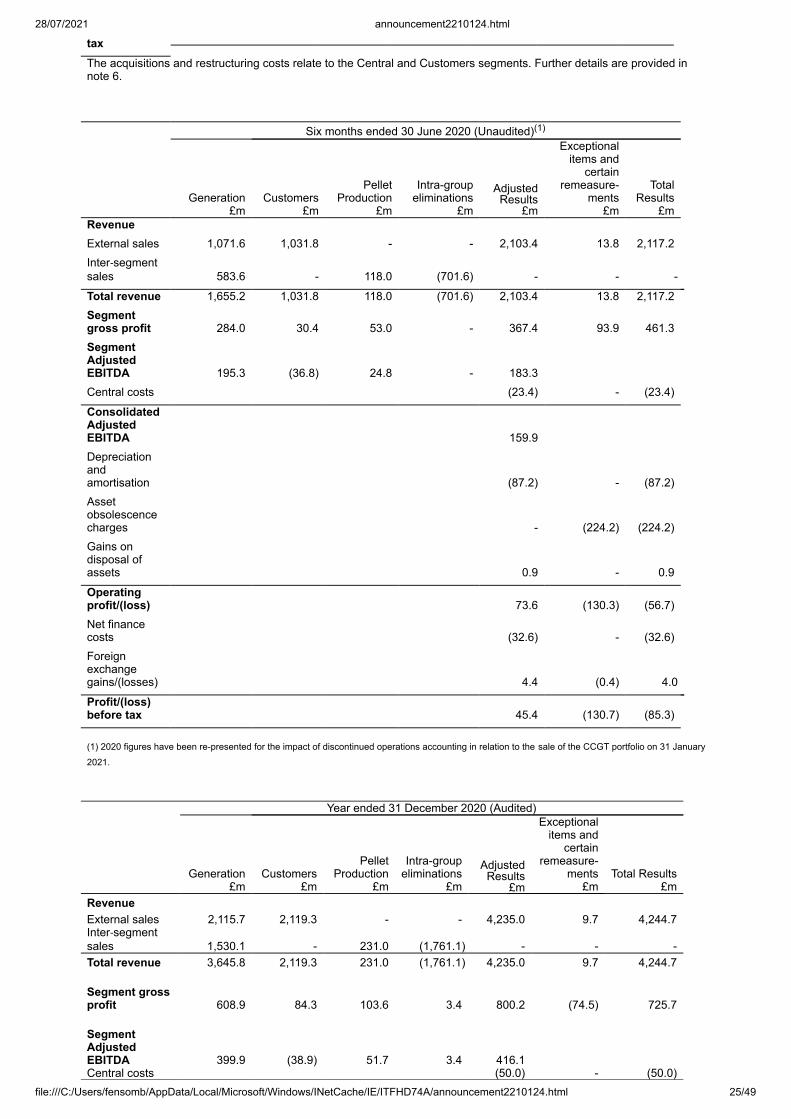
28/07/2021 announcement2210124.html
file:///C:/Users/fensomb/AppData/Local/Microsoft/Windows/INetCache/IE/ITFHD74A/announcement2210124.html 25/49
taxThe acquisitions and restructuring costs relate to the Central and Customers segments. Further details are provided innote 6.
Six months ended 30 June 2020 (Unaudited)(1)
Generation
£mCustomers
£m
PelletProduction
£m
Intra-groupeliminations
£m
AdjustedResults
£m
Exceptionalitems and
certainremeasure-
ments £m
TotalResults
£m
Revenue
External sales 1,071.6 1,031.8 - - 2,103.4 13.8 2,117.2 Inter-segmentsales 583.6 - 118.0 (701.6) - - -
Total revenue 1,655.2 1,031.8 118.0 (701.6) 2,103.4 13.8 2,117.2 Segmentgross profit 284.0 30.4 53.0 - 367.4 93.9 461.3
SegmentAdjustedEBITDA 195.3 (36.8) 24.8 - 183.3
Central costs (23.4) - (23.4)
ConsolidatedAdjustedEBITDA 159.9
Depreciationandamortisation (87.2) - (87.2)
Assetobsolescencecharges - (224.2) (224.2)
Gains ondisposal ofassets 0.9 - 0.9
Operatingprofit/(loss) 73.6 (130.3) (56.7)
Net financecosts (32.6) - (32.6)
Foreignexchangegains/(losses) 4.4 (0.4) 4.0
Profit/(loss)before tax 45.4 (130.7) (85.3)
(1) 2020 figures have been re-presented for the impact of discontinued operations accounting in relation to the sale of the CCGT portfolio on 31 January2021. Year ended 31 December 2020 (Audited)
Generation
£mCustomers
£m
PelletProduction
£m
Intra-groupeliminations
£m
AdjustedResults
£m
Exceptionalitems and
certainremeasure-
ments £m
Total Results £m
Revenue External sales 2,115.7 2,119.3 - - 4,235.0 9.7 4,244.7Inter-segmentsales 1,530.1 - 231.0 (1,761.1) - - -Total revenue 3,645.8 2,119.3 231.0 (1,761.1) 4,235.0 9.7 4,244.7 Segment grossprofit 608.9 84.3 103.6 3.4 800.2 (74.5) 725.7 SegmentAdjustedEBITDA 399.9 (38.9) 51.7 3.4 416.1 Central costs (50.0) - (50.0)
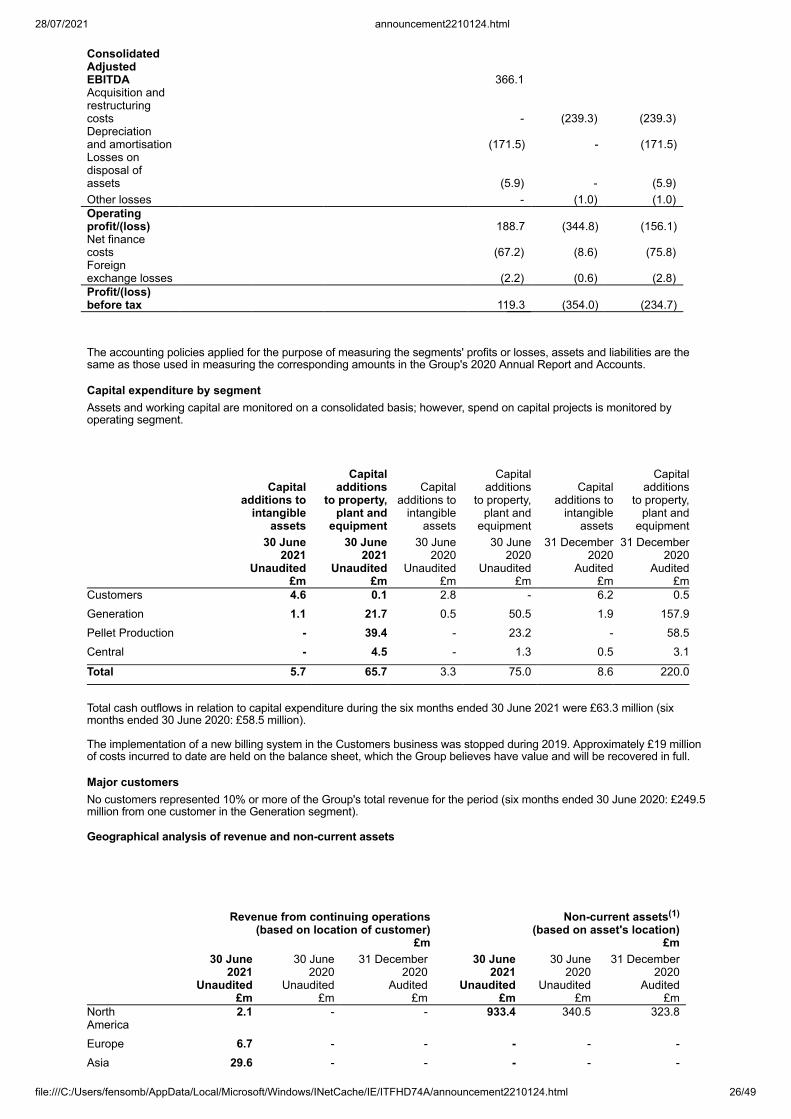
28/07/2021 announcement2210124.html
file:///C:/Users/fensomb/AppData/Local/Microsoft/Windows/INetCache/IE/ITFHD74A/announcement2210124.html 26/49
ConsolidatedAdjustedEBITDA 366.1 Acquisition andrestructuringcosts - (239.3) (239.3)Depreciationand amortisation (171.5) - (171.5)Losses ondisposal ofassets (5.9) - (5.9)Other losses - (1.0) (1.0)Operatingprofit/(loss) 188.7 (344.8) (156.1)Net financecosts (67.2) (8.6) (75.8)Foreignexchange losses (2.2) (0.6) (2.8)Profit/(loss)before tax 119.3 (354.0) (234.7)
The accounting policies applied for the purpose of measuring the segments' profits or losses, assets and liabilities are thesame as those used in measuring the corresponding amounts in the Group's 2020 Annual Report and Accounts.
Capital expenditure by segmentAssets and working capital are monitored on a consolidated basis; however, spend on capital projects is monitored byoperating segment.
Capitaladditions to
intangibleassets
Capitaladditions
to property,plant and
equipment
Capitaladditions to
intangibleassets
Capitaladditions
to property,plant and
equipment
Capitaladditions to
intangibleassets
Capitaladditions
to property,plant and
equipment 30 June 30 June 30 June 30 June 31 December 31 December 2021
Unaudited2021
Unaudited2020
Unaudited2020
Unaudited2020
Audited2020
Audited £m £m £m £m £m £mCustomers 4.6 0.1 2.8 - 6.2 0.5Generation 1.1 21.7 0.5 50.5 1.9 157.9Pellet Production - 39.4 - 23.2 - 58.5Central - 4.5 - 1.3 0.5 3.1
Total 5.7 65.7 3.3 75.0 8.6 220.0 Total cash outflows in relation to capital expenditure during the six months ended 30 June 2021 were £63.3 million (sixmonths ended 30 June 2020: £58.5 million).
The implementation of a new billing system in the Customers business was stopped during 2019. Approximately £19 millionof costs incurred to date are held on the balance sheet, which the Group believes have value and will be recovered in full.
Major customersNo customers represented 10% or more of the Group's total revenue for the period (six months ended 30 June 2020: £249.5million from one customer in the Generation segment).
Geographical analysis of revenue and non-current assets
Revenue from continuing operations(based on location of customer)
£m
Non-current assets(1)
(based on asset's location)£m
30 June 30 June 31 December 30 June 30 June 31 December 2021
Unaudited2020
Unaudited2020
Audited2021
Unaudited2020
Unaudited2020
Audited £m £m £m £m £m £mNorthAmerica
2.1 - - 933.4 340.5 323.8
Europe 6.7 - - - - -Asia 29.6 - - - - -
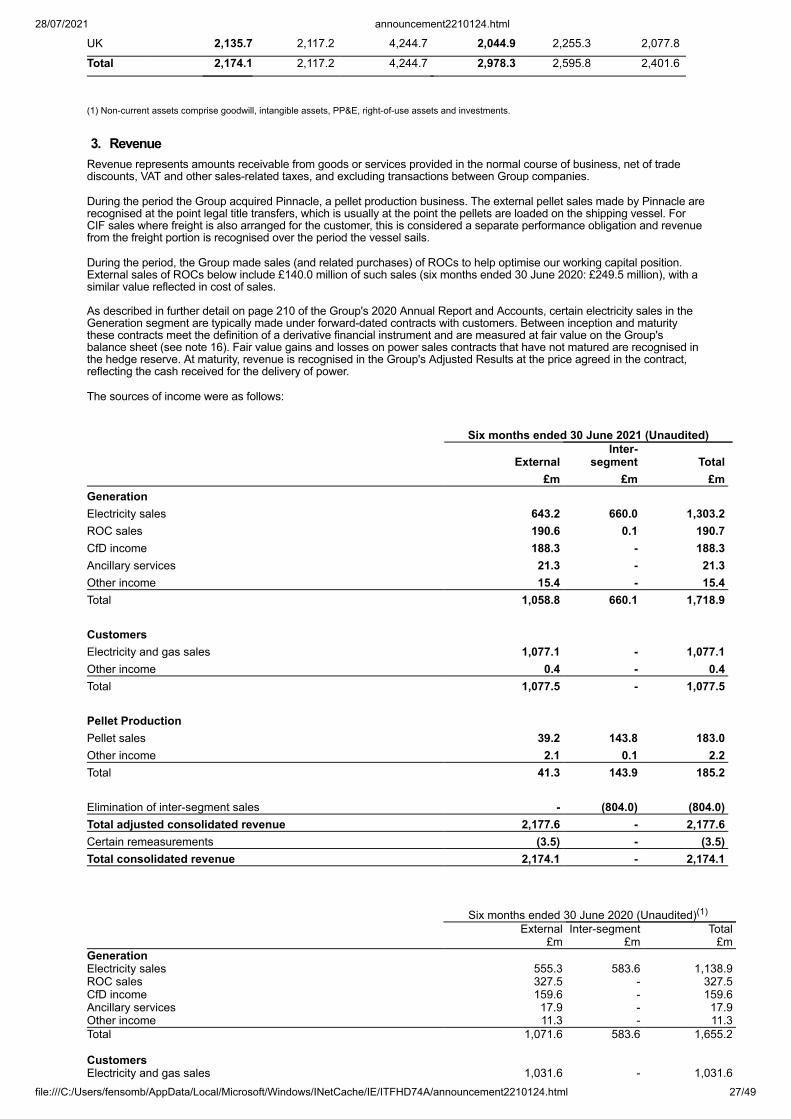
28/07/2021 announcement2210124.html
file:///C:/Users/fensomb/AppData/Local/Microsoft/Windows/INetCache/IE/ITFHD74A/announcement2210124.html 27/49
UK 2,135.7 2,117.2 4,244.7 2,044.9 2,255.3 2,077.8
Total 2,174.1 2,117.2 4,244.7 2,978.3 2,595.8 2,401.6
(1) Non-current assets comprise goodwill, intangible assets, PP&E, right-of-use assets and investments.
3. RevenueRevenue represents amounts receivable from goods or services provided in the normal course of business, net of tradediscounts, VAT and other sales-related taxes, and excluding transactions between Group companies.
During the period the Group acquired Pinnacle, a pellet production business. The external pellet sales made by Pinnacle arerecognised at the point legal title transfers, which is usually at the point the pellets are loaded on the shipping vessel. ForCIF sales where freight is also arranged for the customer, this is considered a separate performance obligation and revenuefrom the freight portion is recognised over the period the vessel sails.
During the period, the Group made sales (and related purchases) of ROCs to help optimise our working capital position.External sales of ROCs below include £140.0 million of such sales (six months ended 30 June 2020: £249.5 million), with asimilar value reflected in cost of sales.
As described in further detail on page 210 of the Group's 2020 Annual Report and Accounts, certain electricity sales in theGeneration segment are typically made under forward-dated contracts with customers. Between inception and maturitythese contracts meet the definition of a derivative financial instrument and are measured at fair value on the Group'sbalance sheet (see note 16). Fair value gains and losses on power sales contracts that have not matured are recognised inthe hedge reserve. At maturity, revenue is recognised in the Group's Adjusted Results at the price agreed in the contract,reflecting the cash received for the delivery of power.
The sources of income were as follows:
Six months ended 30 June 2021 (Unaudited)
ExternalInter-
segment Total
£m £m £m
Generation
Electricity sales 643.2 660.0 1,303.2
ROC sales 190.6 0.1 190.7
CfD income 188.3 - 188.3
Ancillary services 21.3 - 21.3
Other income 15.4 - 15.4
Total 1,058.8 660.1 1,718.9
Customers
Electricity and gas sales 1,077.1 - 1,077.1
Other income 0.4 - 0.4
Total 1,077.5 - 1,077.5
Pellet Production
Pellet sales 39.2 143.8 183.0
Other income 2.1 0.1 2.2
Total 41.3 143.9 185.2
Elimination of inter-segment sales - (804.0) (804.0)
Total adjusted consolidated revenue 2,177.6 - 2,177.6
Certain remeasurements (3.5) - (3.5)
Total consolidated revenue 2,174.1 - 2,174.1
Six months ended 30 June 2020 (Unaudited)(1)
External Inter-segment Total £m £m £mGeneration Electricity sales 555.3 583.6 1,138.9ROC sales 327.5 - 327.5CfD income 159.6 - 159.6Ancillary services 17.9 - 17.9Other income 11.3 - 11.3Total 1,071.6 583.6 1,655.2 Customers Electricity and gas sales 1,031.6 - 1,031.6
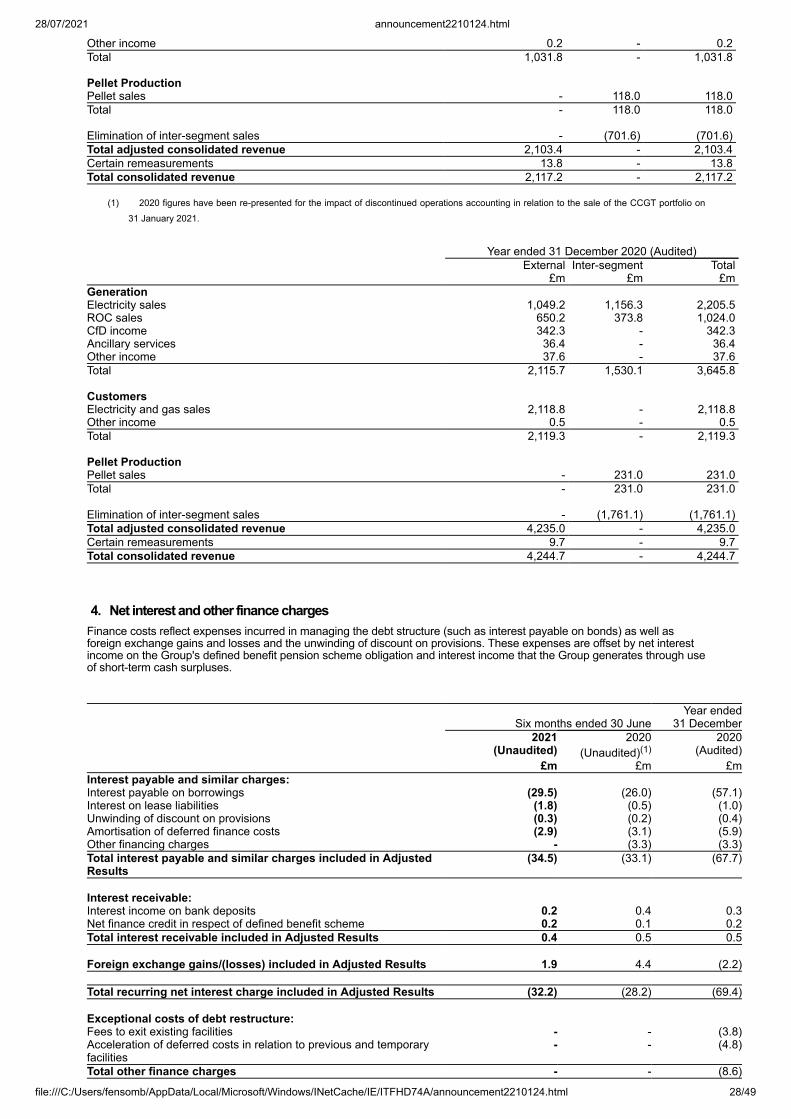
28/07/2021 announcement2210124.html
file:///C:/Users/fensomb/AppData/Local/Microsoft/Windows/INetCache/IE/ITFHD74A/announcement2210124.html 28/49
Other income 0.2 - 0.2Total 1,031.8 - 1,031.8 Pellet Production Pellet sales - 118.0 118.0Total - 118.0 118.0 Elimination of inter-segment sales - (701.6) (701.6)Total adjusted consolidated revenue 2,103.4 - 2,103.4Certain remeasurements 13.8 - 13.8Total consolidated revenue 2,117.2 - 2,117.2
(1) 2020 figures have been re-presented for the impact of discontinued operations accounting in relation to the sale of the CCGT portfolio on31 January 2021.
Year ended 31 December 2020 (Audited) External Inter-segment Total £m £m £mGeneration Electricity sales 1,049.2 1,156.3 2,205.5ROC sales 650.2 373.8 1,024.0CfD income 342.3 - 342.3Ancillary services 36.4 - 36.4Other income 37.6 - 37.6Total 2,115.7 1,530.1 3,645.8 Customers Electricity and gas sales 2,118.8 - 2,118.8Other income 0.5 - 0.5Total 2,119.3 - 2,119.3 Pellet Production Pellet sales - 231.0 231.0Total - 231.0 231.0 Elimination of inter-segment sales - (1,761.1) (1,761.1)Total adjusted consolidated revenue 4,235.0 - 4,235.0Certain remeasurements 9.7 - 9.7Total consolidated revenue 4,244.7 - 4,244.7
4. Net interest and other finance chargesFinance costs reflect expenses incurred in managing the debt structure (such as interest payable on bonds) as well asforeign exchange gains and losses and the unwinding of discount on provisions. These expenses are offset by net interestincome on the Group's defined benefit pension scheme obligation and interest income that the Group generates through useof short-term cash surpluses.
Six months ended 30 JuneYear ended
31 December 2021 2020 2020 (Unaudited) (Unaudited)(1) (Audited) £m £m £mInterest payable and similar charges: Interest payable on borrowings (29.5) (26.0) (57.1)Interest on lease liabilities (1.8) (0.5) (1.0)Unwinding of discount on provisions (0.3) (0.2) (0.4)Amortisation of deferred finance costs (2.9) (3.1) (5.9)Other financing charges - (3.3) (3.3)Total interest payable and similar charges included in AdjustedResults
(34.5) (33.1) (67.7)
Interest receivable: Interest income on bank deposits 0.2 0.4 0.3Net finance credit in respect of defined benefit scheme 0.2 0.1 0.2Total interest receivable included in Adjusted Results 0.4 0.5 0.5 Foreign exchange gains/(losses) included in Adjusted Results 1.9 4.4 (2.2) Total recurring net interest charge included in Adjusted Results (32.2) (28.2) (69.4) Exceptional costs of debt restructure: Fees to exit existing facilities - - (3.8)Acceleration of deferred costs in relation to previous and temporaryfacilities
- - (4.8)
Total other finance charges - - (8.6)
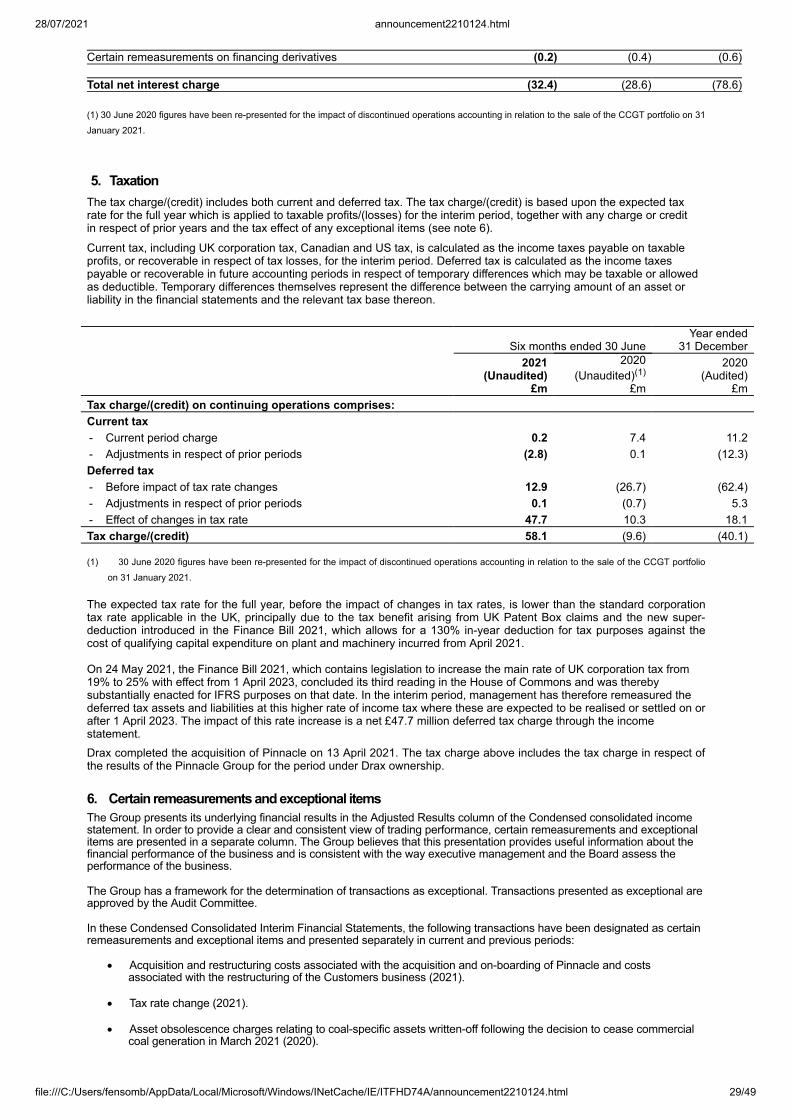
28/07/2021 announcement2210124.html
file:///C:/Users/fensomb/AppData/Local/Microsoft/Windows/INetCache/IE/ITFHD74A/announcement2210124.html 29/49
Certain remeasurements on financing derivatives (0.2) (0.4) (0.6) Total net interest charge (32.4) (28.6) (78.6) (1) 30 June 2020 figures have been re-presented for the impact of discontinued operations accounting in relation to the sale of the CCGT portfolio on 31January 2021.
5. TaxationThe tax charge/(credit) includes both current and deferred tax. The tax charge/(credit) is based upon the expected taxrate for the full year which is applied to taxable profits/(losses) for the interim period, together with any charge or creditin respect of prior years and the tax effect of any exceptional items (see note 6).
Current tax, including UK corporation tax, Canadian and US tax, is calculated as the income taxes payable on taxableprofits, or recoverable in respect of tax losses, for the interim period. Deferred tax is calculated as the income taxespayable or recoverable in future accounting periods in respect of temporary differences which may be taxable or allowedas deductible. Temporary differences themselves represent the difference between the carrying amount of an asset orliability in the financial statements and the relevant tax base thereon.
Six months ended 30 JuneYear ended
31 December
2021 (Unaudited)
£m
2020(Unaudited)(1)
£m
2020(Audited)
£mTax charge/(credit) on continuing operations comprises: Current tax - Current period charge 0.2 7.4 11.2- Adjustments in respect of prior periods (2.8) 0.1 (12.3)Deferred tax - Before impact of tax rate changes 12.9 (26.7) (62.4)- Adjustments in respect of prior periods 0.1 (0.7) 5.3- Effect of changes in tax rate 47.7 10.3 18.1Tax charge/(credit) 58.1 (9.6) (40.1) (1) 30 June 2020 figures have been re-presented for the impact of discontinued operations accounting in relation to the sale of the CCGT portfolio
on 31 January 2021. The expected tax rate for the full year, before the impact of changes in tax rates, is lower than the standard corporationtax rate applicable in the UK, principally due to the tax benefit arising from UK Patent Box claims and the new super-deduction introduced in the Finance Bill 2021, which allows for a 130% in-year deduction for tax purposes against thecost of qualifying capital expenditure on plant and machinery incurred from April 2021. On 24 May 2021, the Finance Bill 2021, which contains legislation to increase the main rate of UK corporation tax from19% to 25% with effect from 1 April 2023, concluded its third reading in the House of Commons and was therebysubstantially enacted for IFRS purposes on that date. In the interim period, management has therefore remeasured thedeferred tax assets and liabilities at this higher rate of income tax where these are expected to be realised or settled on orafter 1 April 2023. The impact of this rate increase is a net £47.7 million deferred tax charge through the incomestatement.Drax completed the acquisition of Pinnacle on 13 April 2021. The tax charge above includes the tax charge in respect ofthe results of the Pinnacle Group for the period under Drax ownership.
6. Certain remeasurements and exceptional itemsThe Group presents its underlying financial results in the Adjusted Results column of the Condensed consolidated incomestatement. In order to provide a clear and consistent view of trading performance, certain remeasurements and exceptionalitems are presented in a separate column. The Group believes that this presentation provides useful information about thefinancial performance of the business and is consistent with the way executive management and the Board assess theperformance of the business.
The Group has a framework for the determination of transactions as exceptional. Transactions presented as exceptional areapproved by the Audit Committee.
In these Condensed Consolidated Interim Financial Statements, the following transactions have been designated as certainremeasurements and exceptional items and presented separately in current and previous periods:
· Acquisition and restructuring costs associated with the acquisition and on-boarding of Pinnacle and costsassociated with the restructuring of the Customers business (2021).
· Tax rate change (2021).
· Asset obsolescence charges relating to coal-specific assets written-off following the decision to cease commercialcoal generation in March 2021 (2020).
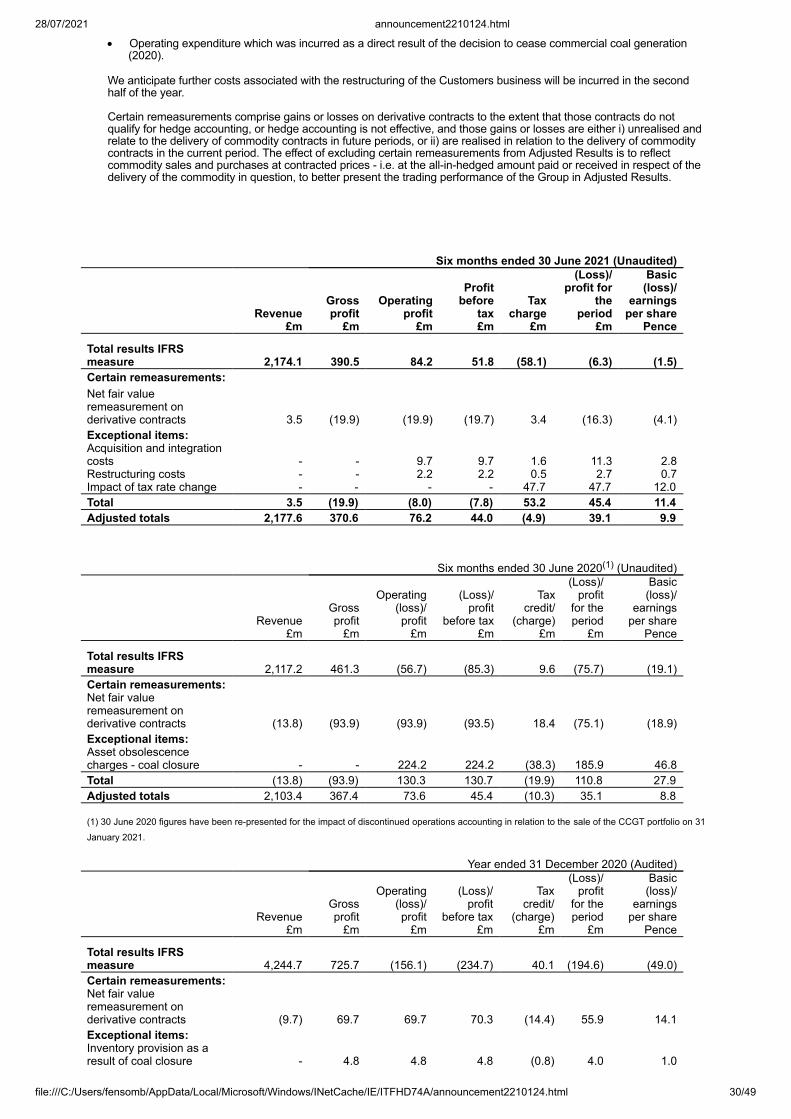
28/07/2021 announcement2210124.html
file:///C:/Users/fensomb/AppData/Local/Microsoft/Windows/INetCache/IE/ITFHD74A/announcement2210124.html 30/49
· Operating expenditure which was incurred as a direct result of the decision to cease commercial coal generation(2020).
We anticipate further costs associated with the restructuring of the Customers business will be incurred in the secondhalf of the year.
Certain remeasurements comprise gains or losses on derivative contracts to the extent that those contracts do notqualify for hedge accounting, or hedge accounting is not effective, and those gains or losses are either i) unrealised andrelate to the delivery of commodity contracts in future periods, or ii) are realised in relation to the delivery of commoditycontracts in the current period. The effect of excluding certain remeasurements from Adjusted Results is to reflectcommodity sales and purchases at contracted prices - i.e. at the all-in-hedged amount paid or received in respect of thedelivery of the commodity in question, to better present the trading performance of the Group in Adjusted Results.
Six months ended 30 June 2021 (Unaudited)
Revenue
£m
Grossprofit
£m
Operating
profit£m
Profitbefore
tax£m
Taxcharge
£m
(Loss)/profit for
theperiod
£m
Basic(loss)/
earningsper share
Pence
Total results IFRSmeasure 2,174.1 390.5 84.2 51.8 (58.1) (6.3) (1.5)Certain remeasurements: Net fair valueremeasurement onderivative contracts 3.5
(19.9)
(19.9) (19.7) 3.4 (16.3) (4.1)
Exceptional items: Acquisition and integrationcosts -
- 9.7 9.7 1.6 11.3 2.8
Restructuring costs - - 2.2 2.2 0.5 2.7 0.7Impact of tax rate change - - - - 47.7 47.7 12.0Total 3.5 (19.9) (8.0) (7.8) 53.2 45.4 11.4Adjusted totals 2,177.6 370.6 76.2 44.0 (4.9) 39.1 9.9
Six months ended 30 June 2020(1) (Unaudited)
Revenue
£m
Grossprofit
£m
Operating
(loss)/profit
£m
(Loss)/profit
before tax£m
Taxcredit/
(charge)£m
(Loss)/profit
for theperiod
£m
Basic(loss)/
earningsper share
Pence
Total results IFRSmeasure 2,117.2 461.3 (56.7) (85.3) 9.6 (75.7) (19.1)Certain remeasurements: Net fair valueremeasurement onderivative contracts (13.8)
(93.9) (93.9) (93.5)
18.4 (75.1) (18.9)
Exceptional items: Asset obsolescencecharges - coal closure - - 224.2 224.2 (38.3) 185.9 46.8Total (13.8) (93.9) 130.3 130.7 (19.9) 110.8 27.9Adjusted totals 2,103.4 367.4 73.6 45.4 (10.3) 35.1 8.8 (1) 30 June 2020 figures have been re-presented for the impact of discontinued operations accounting in relation to the sale of the CCGT portfolio on 31January 2021. Year ended 31 December 2020 (Audited)
Revenue
£m
Grossprofit
£m
Operating(loss)/profit
£m
(Loss)/profit
before tax£m
Taxcredit/
(charge)£m
(Loss)/profit
for theperiod
£m
Basic(loss)/
earningsper share
Pence
Total results IFRSmeasure 4,244.7 725.7 (156.1) (234.7) 40.1 (194.6) (49.0)Certain remeasurements: Net fair valueremeasurement onderivative contracts (9.7) 69.7 69.7 70.3 (14.4) 55.9 14.1Exceptional items: Inventory provision as aresult of coal closure - 4.8 4.8 4.8 (0.8) 4.0 1.0
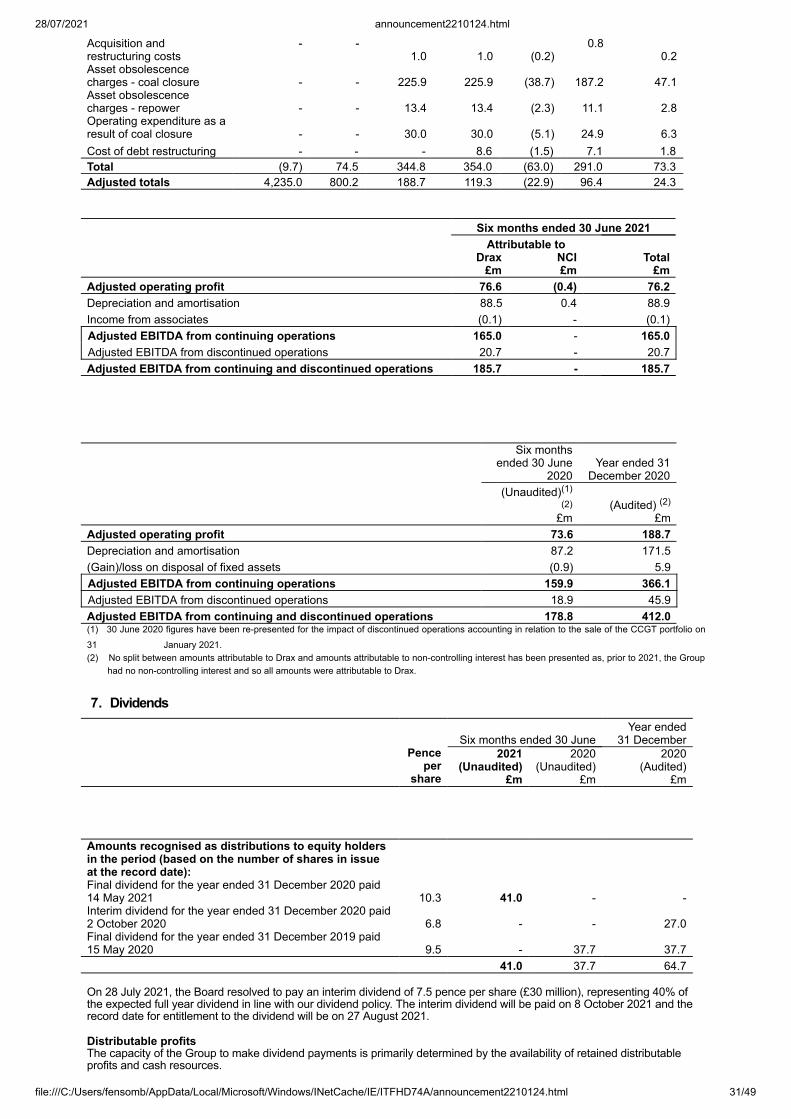
28/07/2021 announcement2210124.html
file:///C:/Users/fensomb/AppData/Local/Microsoft/Windows/INetCache/IE/ITFHD74A/announcement2210124.html 31/49
Acquisition andrestructuring costs
- - 1.0
1.0
(0.2)
0.8 0.2
Asset obsolescencecharges - coal closure - - 225.9 225.9 (38.7) 187.2 47.1Asset obsolescencecharges - repower - -
13.4
13.4
(2.3) 11.1
2.8
Operating expenditure as aresult of coal closure - -
30.0
30.0
(5.1) 24.9
6.3
Cost of debt restructuring - - - 8.6 (1.5) 7.1 1.8Total (9.7) 74.5 344.8 354.0 (63.0) 291.0 73.3Adjusted totals 4,235.0 800.2 188.7 119.3 (22.9) 96.4 24.3
Six months ended 30 June 2021 Attributable to
Drax
£mNCI
£mTotal
£mAdjusted operating profit 76.6 (0.4) 76.2Depreciation and amortisation 88.5 0.4 88.9Income from associates (0.1) - (0.1)Adjusted EBITDA from continuing operations 165.0 - 165.0Adjusted EBITDA from discontinued operations 20.7 - 20.7Adjusted EBITDA from continuing and discontinued operations 185.7 - 185.7
Six monthsended 30 June
2020Year ended 31
December 2020
(Unaudited)(1)(2)
£m
(Audited) (2)
£mAdjusted operating profit 73.6 188.7Depreciation and amortisation 87.2 171.5(Gain)/loss on disposal of fixed assets (0.9) 5.9Adjusted EBITDA from continuing operations 159.9 366.1Adjusted EBITDA from discontinued operations 18.9 45.9Adjusted EBITDA from continuing and discontinued operations 178.8 412.0(1) 30 June 2020 figures have been re-presented for the impact of discontinued operations accounting in relation to the sale of the CCGT portfolio on31 January 2021.(2) No split between amounts attributable to Drax and amounts attributable to non-controlling interest has been presented as, prior to 2021, the Group
had no non-controlling interest and so all amounts were attributable to Drax.
7. Dividends
Six months ended 30 JuneYear ended
31 December
Penceper
share
2021 (Unaudited) £m
2020 (Unaudited) £m
2020 (Audited) £m
Amounts recognised as distributions to equity holdersin the period (based on the number of shares in issueat the record date):
Final dividend for the year ended 31 December 2020 paid14 May 2021 10.3 41.0 - -Interim dividend for the year ended 31 December 2020 paid2 October 2020 6.8 - - 27.0Final dividend for the year ended 31 December 2019 paid15 May 2020 9.5 - 37.7 37.7 41.0 37.7 64.7 On 28 July 2021, the Board resolved to pay an interim dividend of 7.5 pence per share (£30 million), representing 40% ofthe expected full year dividend in line with our dividend policy. The interim dividend will be paid on 8 October 2021 and therecord date for entitlement to the dividend will be on 27 August 2021.
Distributable profitsThe capacity of the Group to make dividend payments is primarily determined by the availability of retained distributableprofits and cash resources.
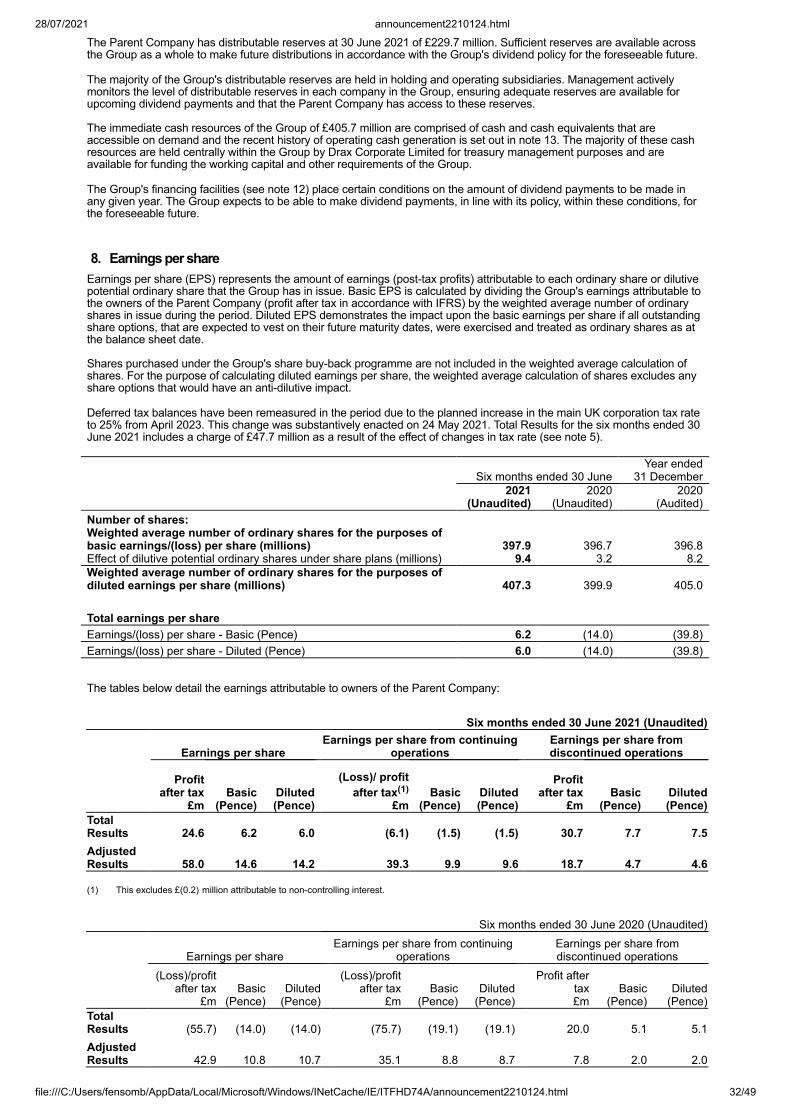
28/07/2021 announcement2210124.html
file:///C:/Users/fensomb/AppData/Local/Microsoft/Windows/INetCache/IE/ITFHD74A/announcement2210124.html 32/49
The Parent Company has distributable reserves at 30 June 2021 of £229.7 million. Sufficient reserves are available acrossthe Group as a whole to make future distributions in accordance with the Group's dividend policy for the foreseeable future.
The majority of the Group's distributable reserves are held in holding and operating subsidiaries. Management activelymonitors the level of distributable reserves in each company in the Group, ensuring adequate reserves are available forupcoming dividend payments and that the Parent Company has access to these reserves.
The immediate cash resources of the Group of £405.7 million are comprised of cash and cash equivalents that areaccessible on demand and the recent history of operating cash generation is set out in note 13. The majority of these cashresources are held centrally within the Group by Drax Corporate Limited for treasury management purposes and areavailable for funding the working capital and other requirements of the Group.
The Group's financing facilities (see note 12) place certain conditions on the amount of dividend payments to be made inany given year. The Group expects to be able to make dividend payments, in line with its policy, within these conditions, forthe foreseeable future.
8. Earnings per shareEarnings per share (EPS) represents the amount of earnings (post-tax profits) attributable to each ordinary share or dilutivepotential ordinary share that the Group has in issue. Basic EPS is calculated by dividing the Group's earnings attributable tothe owners of the Parent Company (profit after tax in accordance with IFRS) by the weighted average number of ordinaryshares in issue during the period. Diluted EPS demonstrates the impact upon the basic earnings per share if all outstandingshare options, that are expected to vest on their future maturity dates, were exercised and treated as ordinary shares as atthe balance sheet date.
Shares purchased under the Group's share buy-back programme are not included in the weighted average calculation ofshares. For the purpose of calculating diluted earnings per share, the weighted average calculation of shares excludes anyshare options that would have an anti-dilutive impact.
Deferred tax balances have been remeasured in the period due to the planned increase in the main UK corporation tax rateto 25% from April 2023. This change was substantively enacted on 24 May 2021. Total Results for the six months ended 30June 2021 includes a charge of £47.7 million as a result of the effect of changes in tax rate (see note 5).
Six months ended 30 JuneYear ended
31 December
2021
(Unaudited)2020
(Unaudited)2020
(Audited)Number of shares: Weighted average number of ordinary shares for the purposes ofbasic earnings/(loss) per share (millions) 397.9 396.7
396.8
Effect of dilutive potential ordinary shares under share plans (millions) 9.4 3.2 8.2Weighted average number of ordinary shares for the purposes ofdiluted earnings per share (millions) 407.3 399.9
405.0
Total earnings per share Earnings/(loss) per share - Basic (Pence) 6.2 (14.0) (39.8)Earnings/(loss) per share - Diluted (Pence) 6.0 (14.0) (39.8)
The tables below detail the earnings attributable to owners of the Parent Company:
Six months ended 30 June 2021 (Unaudited)
Earnings per share Earnings per share from continuing
operations Earnings per share fromdiscontinued operations
Profitafter tax
£mBasic
(Pence)Diluted(Pence)
(Loss)/ profitafter tax(1)
£mBasic
(Pence)Diluted(Pence)
Profitafter tax
£mBasic
(Pence)Diluted(Pence)
TotalResults 24.6 6.2 6.0 (6.1) (1.5) (1.5) 30.7 7.7 7.5AdjustedResults 58.0 14.6 14.2 39.3 9.9 9.6 18.7 4.7 4.6 (1) This excludes £(0.2) million attributable to non-controlling interest.
Six months ended 30 June 2020 (Unaudited)
Earnings per share Earnings per share from continuing
operations Earnings per share fromdiscontinued operations
(Loss)/profitafter tax
£mBasic
(Pence)Diluted
(Pence)
(Loss)/profitafter tax
£mBasic
(Pence)Diluted
(Pence)
Profit aftertax£m
Basic(Pence)
Diluted(Pence)
TotalResults (55.7) (14.0) (14.0) (75.7) (19.1) (19.1) 20.0 5.1 5.1AdjustedResults 42.9 10.8 10.7 35.1 8.8 8.7 7.8 2.0 2.0
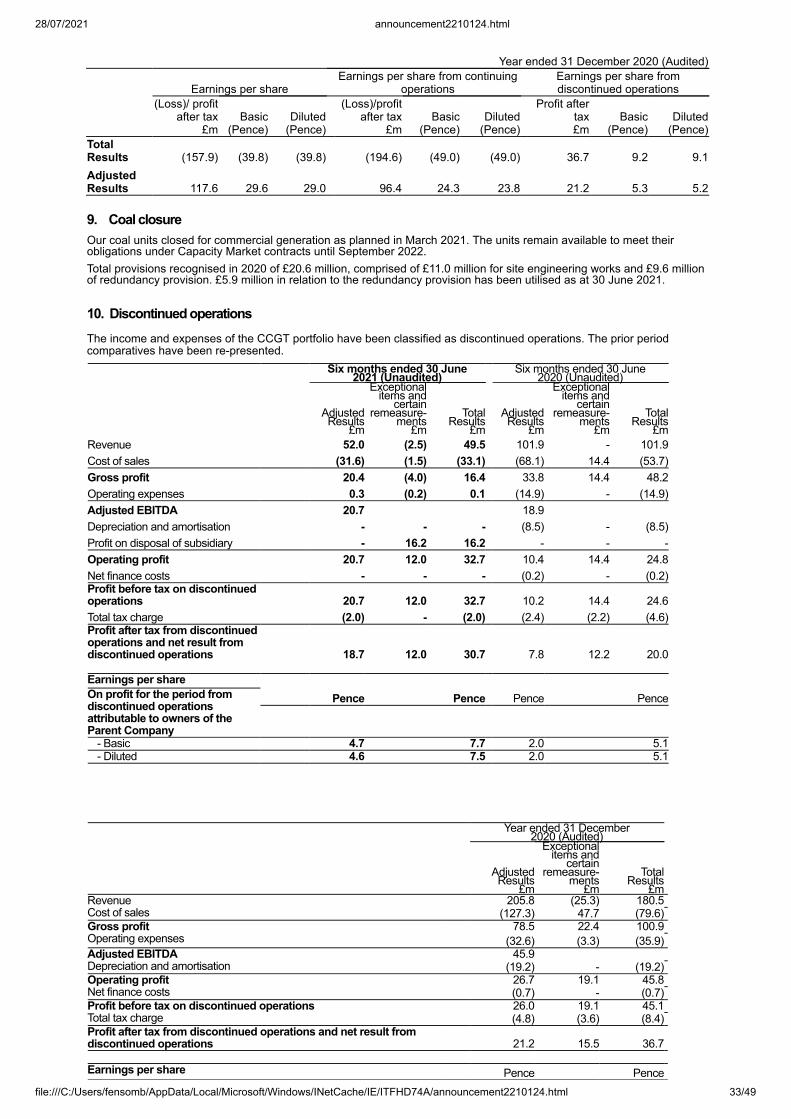
28/07/2021 announcement2210124.html
file:///C:/Users/fensomb/AppData/Local/Microsoft/Windows/INetCache/IE/ITFHD74A/announcement2210124.html 33/49
Year ended 31 December 2020 (Audited)
Earnings per share Earnings per share from continuing
operations Earnings per share fromdiscontinued operations
(Loss)/ profitafter tax
£mBasic
(Pence)Diluted
(Pence)
(Loss)/profitafter tax
£mBasic
(Pence)Diluted
(Pence)
Profit aftertax£m
Basic(Pence)
Diluted(Pence)
TotalResults (157.9) (39.8) (39.8) (194.6) (49.0) (49.0) 36.7 9.2 9.1AdjustedResults 117.6 29.6 29.0 96.4 24.3 23.8 21.2 5.3 5.2 9. Coal closureOur coal units closed for commercial generation as planned in March 2021. The units remain available to meet theirobligations under Capacity Market contracts until September 2022.Total provisions recognised in 2020 of £20.6 million, comprised of £11.0 million for site engineering works and £9.6 millionof redundancy provision. £5.9 million in relation to the redundancy provision has been utilised as at 30 June 2021. 10. Discontinued operationsThe income and expenses of the CCGT portfolio have been classified as discontinued operations. The prior periodcomparatives have been re-presented.
Six months ended 30 June
2021 (Unaudited) Six months ended 30 June
2020 (Unaudited)
AdjustedResults
£m
Exceptionalitems and
certainremeasure-
ments£m
TotalResults
£m AdjustedResults
£m
Exceptionalitems and
certainremeasure-
ments£m
TotalResults
£mRevenue 52.0 (2.5) 49.5 101.9 - 101.9Cost of sales (31.6) (1.5) (33.1) (68.1) 14.4 (53.7)Gross profit 20.4 (4.0) 16.4 33.8 14.4 48.2Operating expenses 0.3 (0.2) 0.1 (14.9) - (14.9)Adjusted EBITDA 20.7 18.9 Depreciation and amortisation - - - (8.5) - (8.5)Profit on disposal of subsidiary - 16.2 16.2 - - -Operating profit 20.7 12.0 32.7 10.4 14.4 24.8Net finance costs - - - (0.2) - (0.2)Profit before tax on discontinuedoperations 20.7 12.0 32.7 10.2 14.4 24.6Total tax charge (2.0) - (2.0) (2.4) (2.2) (4.6)Profit after tax from discontinuedoperations and net result fromdiscontinued operations 18.7 12.0 30.7 7.8 12.2 20.0
Earnings per shareOn profit for the period fromdiscontinued operationsattributable to owners of theParent Company
Pence Pence Pence Pence
- Basic 4.7 7.7 2.0 5.1- Diluted 4.6 7.5 2.0 5.1
Year ended 31 December
2020 (Audited)
AdjustedResults
£m
Exceptionalitems and
certainremeasure-
ments£m
TotalResults
£m Revenue 205.8 (25.3) 180.5 Cost of sales (127.3) 47.7 (79.6) Gross profit 78.5 22.4 100.9 Operating expenses (32.6) (3.3) (35.9) Adjusted EBITDA 45.9 Depreciation and amortisation (19.2) - (19.2) Operating profit 26.7 19.1 45.8 Net finance costs (0.7) - (0.7) Profit before tax on discontinued operations 26.0 19.1 45.1 Total tax charge (4.8) (3.6) (8.4) Profit after tax from discontinued operations and net result fromdiscontinued operations 21.2 15.5 36.7 Earnings per share Pence Pence
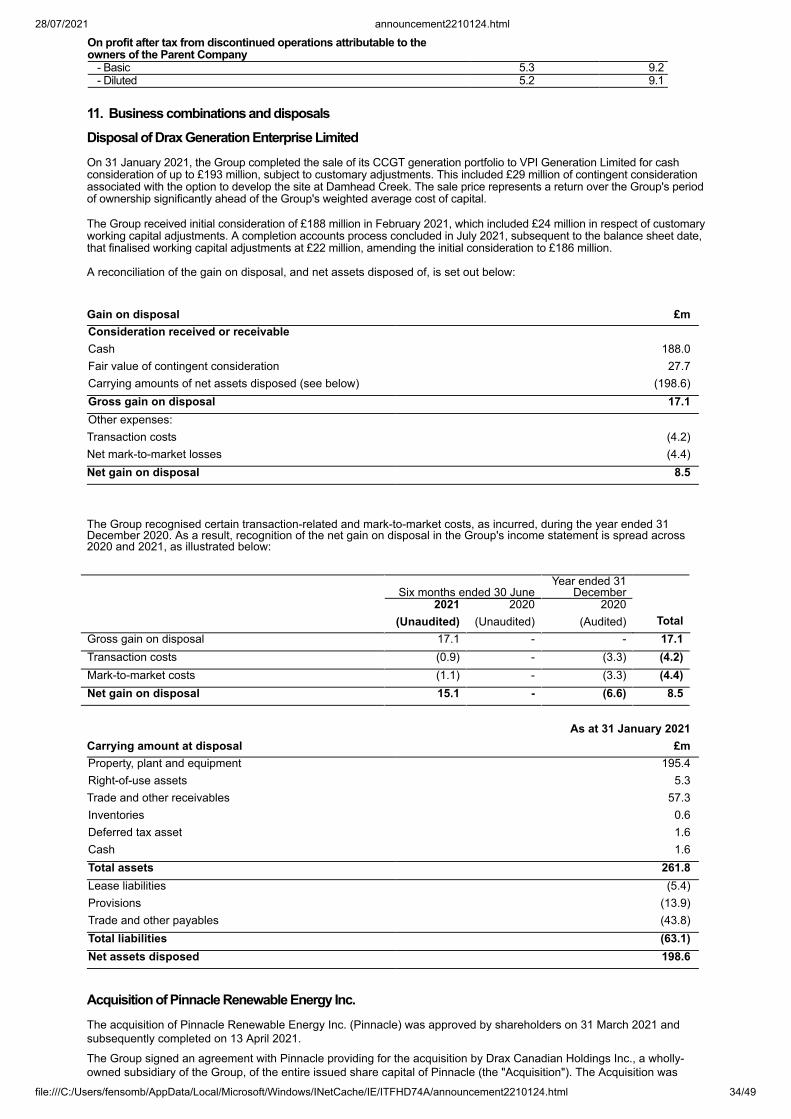
28/07/2021 announcement2210124.html
file:///C:/Users/fensomb/AppData/Local/Microsoft/Windows/INetCache/IE/ITFHD74A/announcement2210124.html 34/49
On profit after tax from discontinued operations attributable to theowners of the Parent Company
- Basic 5.3 9.2 - Diluted 5.2 9.1
11. Business combinations and disposalsDisposal of Drax Generation Enterprise LimitedOn 31 January 2021, the Group completed the sale of its CCGT generation portfolio to VPI Generation Limited for cashconsideration of up to £193 million, subject to customary adjustments. This included £29 million of contingent considerationassociated with the option to develop the site at Damhead Creek. The sale price represents a return over the Group's periodof ownership significantly ahead of the Group's weighted average cost of capital.
The Group received initial consideration of £188 million in February 2021, which included £24 million in respect of customaryworking capital adjustments. A completion accounts process concluded in July 2021, subsequent to the balance sheet date,that finalised working capital adjustments at £22 million, amending the initial consideration to £186 million.
A reconciliation of the gain on disposal, and net assets disposed of, is set out below:
Gain on disposal
£m
Consideration received or receivable Cash 188.0Fair value of contingent consideration 27.7Carrying amounts of net assets disposed (see below) (198.6)Gross gain on disposal 17.1Other expenses: Transaction costs (4.2)Net mark-to-market losses (4.4)Net gain on disposal 8.5 The Group recognised certain transaction-related and mark-to-market costs, as incurred, during the year ended 31December 2020. As a result, recognition of the net gain on disposal in the Group's income statement is spread across2020 and 2021, as illustrated below:
Six months ended 30 JuneYear ended 31
December
2021(Unaudited)
2020(Unaudited)
2020(Audited)
Total
Gross gain on disposal 17.1 - - 17.1Transaction costs (0.9) - (3.3) (4.2)Mark-to-market costs (1.1) - (3.3) (4.4)Net gain on disposal 15.1 - (6.6) 8.5 Carrying amount at disposal
As at 31 January 2021£m
Property, plant and equipment 195.4Right-of-use assets 5.3Trade and other receivables 57.3Inventories 0.6Deferred tax asset 1.6Cash 1.6Total assets 261.8Lease liabilities (5.4)Provisions (13.9)Trade and other payables (43.8)Total liabilities (63.1)Net assets disposed 198.6
Acquisition of Pinnacle Renewable Energy Inc.The acquisition of Pinnacle Renewable Energy Inc. (Pinnacle) was approved by shareholders on 31 March 2021 andsubsequently completed on 13 April 2021.
The Group signed an agreement with Pinnacle providing for the acquisition by Drax Canadian Holdings Inc., a wholly-owned subsidiary of the Group, of the entire issued share capital of Pinnacle (the "Acquisition"). The Acquisition was
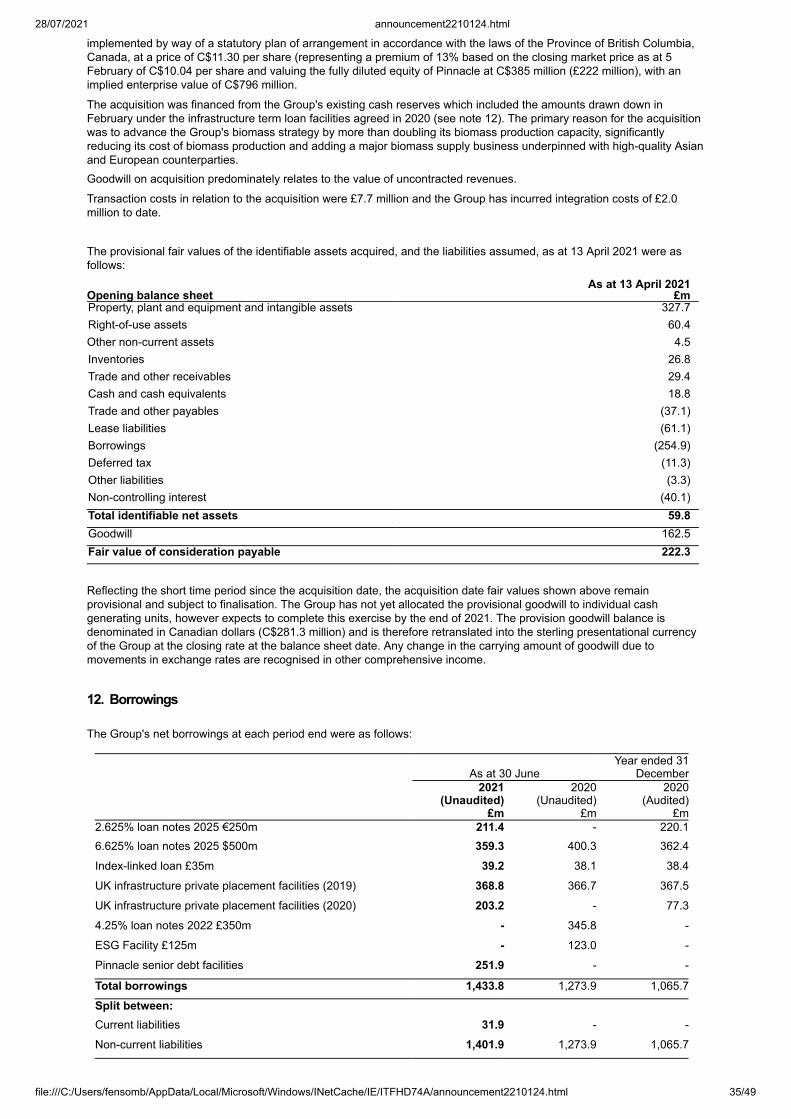
28/07/2021 announcement2210124.html
file:///C:/Users/fensomb/AppData/Local/Microsoft/Windows/INetCache/IE/ITFHD74A/announcement2210124.html 35/49
implemented by way of a statutory plan of arrangement in accordance with the laws of the Province of British Columbia,Canada, at a price of C$11.30 per share (representing a premium of 13% based on the closing market price as at 5February of C$10.04 per share and valuing the fully diluted equity of Pinnacle at C$385 million (£222 million), with animplied enterprise value of C$796 million.
The acquisition was financed from the Group's existing cash reserves which included the amounts drawn down inFebruary under the infrastructure term loan facilities agreed in 2020 (see note 12). The primary reason for the acquisitionwas to advance the Group's biomass strategy by more than doubling its biomass production capacity, significantlyreducing its cost of biomass production and adding a major biomass supply business underpinned with high-quality Asianand European counterparties.Goodwill on acquisition predominately relates to the value of uncontracted revenues.
Transaction costs in relation to the acquisition were £7.7 million and the Group has incurred integration costs of £2.0million to date.
The provisional fair values of the identifiable assets acquired, and the liabilities assumed, as at 13 April 2021 were asfollows: Opening balance sheet
As at 13 April 2021£m
Property, plant and equipment and intangible assets 327.7Right-of-use assets 60.4Other non-current assets 4.5Inventories 26.8Trade and other receivables 29.4Cash and cash equivalents 18.8Trade and other payables (37.1)Lease liabilities (61.1)Borrowings (254.9)Deferred tax (11.3)Other liabilities (3.3)Non-controlling interest (40.1)Total identifiable net assets 59.8Goodwill 162.5Fair value of consideration payable 222.3
Reflecting the short time period since the acquisition date, the acquisition date fair values shown above remainprovisional and subject to finalisation. The Group has not yet allocated the provisional goodwill to individual cashgenerating units, however expects to complete this exercise by the end of 2021. The provision goodwill balance isdenominated in Canadian dollars (C$281.3 million) and is therefore retranslated into the sterling presentational currencyof the Group at the closing rate at the balance sheet date. Any change in the carrying amount of goodwill due tomovements in exchange rates are recognised in other comprehensive income.
12. Borrowings The Group's net borrowings at each period end were as follows:
As at 30 June
Year ended 31December
2021 (Unaudited)
£m
2020(Unaudited)
£m
2020(Audited)
£m2.625% loan notes 2025 €250m 211.4 - 220.16.625% loan notes 2025 $500m 359.3 400.3 362.4
Index-linked loan £35m 39.2 38.1 38.4
UK infrastructure private placement facilities (2019) 368.8 366.7 367.5
UK infrastructure private placement facilities (2020) 203.2 - 77.3
4.25% loan notes 2022 £350m - 345.8 -
ESG Facility £125m - 123.0 -
Pinnacle senior debt facilities 251.9 - -
Total borrowings 1,433.8 1,273.9 1,065.7
Split between: Current liabilities 31.9 - -
Non-current liabilities 1,401.9 1,273.9 1,065.7
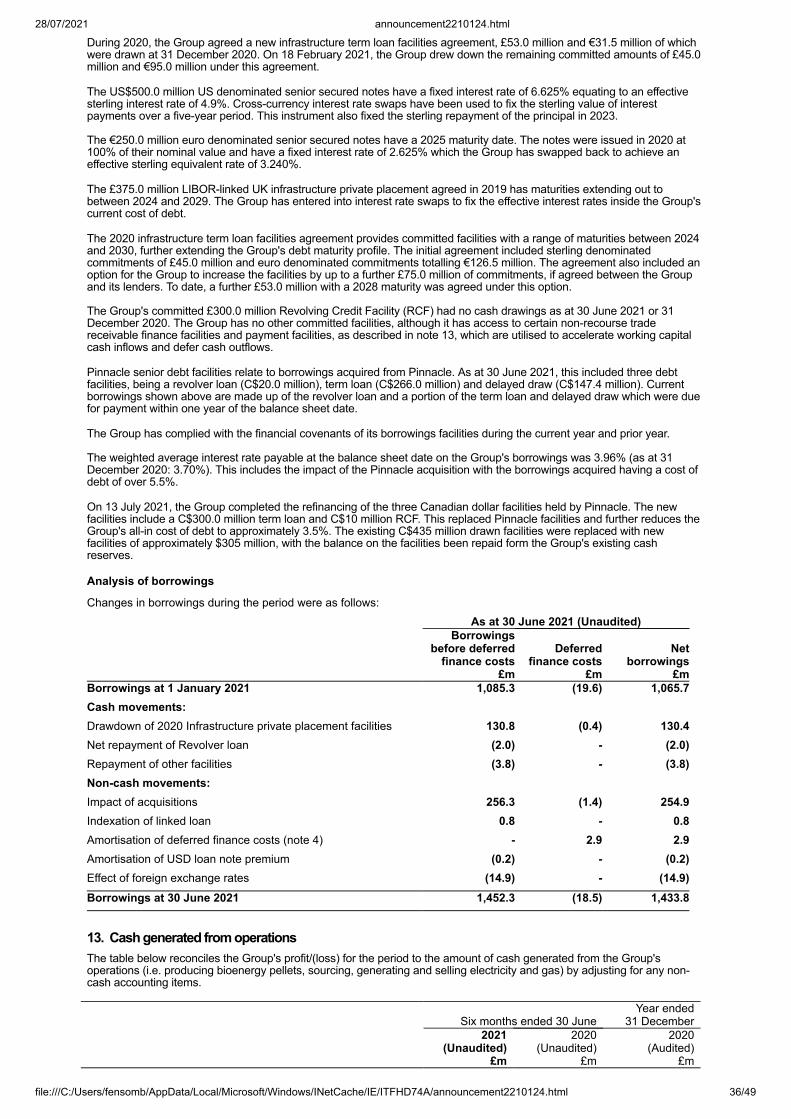
28/07/2021 announcement2210124.html
file:///C:/Users/fensomb/AppData/Local/Microsoft/Windows/INetCache/IE/ITFHD74A/announcement2210124.html 36/49
During 2020, the Group agreed a new infrastructure term loan facilities agreement, £53.0 million and €31.5 million of whichwere drawn at 31 December 2020. On 18 February 2021, the Group drew down the remaining committed amounts of £45.0million and €95.0 million under this agreement.
The US$500.0 million US denominated senior secured notes have a fixed interest rate of 6.625% equating to an effectivesterling interest rate of 4.9%. Cross-currency interest rate swaps have been used to fix the sterling value of interestpayments over a five-year period. This instrument also fixed the sterling repayment of the principal in 2023.
The €250.0 million euro denominated senior secured notes have a 2025 maturity date. The notes were issued in 2020 at100% of their nominal value and have a fixed interest rate of 2.625% which the Group has swapped back to achieve aneffective sterling equivalent rate of 3.240%.
The £375.0 million LIBOR-linked UK infrastructure private placement agreed in 2019 has maturities extending out tobetween 2024 and 2029. The Group has entered into interest rate swaps to fix the effective interest rates inside the Group'scurrent cost of debt.
The 2020 infrastructure term loan facilities agreement provides committed facilities with a range of maturities between 2024and 2030, further extending the Group's debt maturity profile. The initial agreement included sterling denominatedcommitments of £45.0 million and euro denominated commitments totalling €126.5 million. The agreement also included anoption for the Group to increase the facilities by up to a further £75.0 million of commitments, if agreed between the Groupand its lenders. To date, a further £53.0 million with a 2028 maturity was agreed under this option.
The Group's committed £300.0 million Revolving Credit Facility (RCF) had no cash drawings as at 30 June 2021 or 31December 2020. The Group has no other committed facilities, although it has access to certain non-recourse tradereceivable finance facilities and payment facilities, as described in note 13, which are utilised to accelerate working capitalcash inflows and defer cash outflows.
Pinnacle senior debt facilities relate to borrowings acquired from Pinnacle. As at 30 June 2021, this included three debtfacilities, being a revolver loan (C$20.0 million), term loan (C$266.0 million) and delayed draw (C$147.4 million). Currentborrowings shown above are made up of the revolver loan and a portion of the term loan and delayed draw which were duefor payment within one year of the balance sheet date.
The Group has complied with the financial covenants of its borrowings facilities during the current year and prior year.
The weighted average interest rate payable at the balance sheet date on the Group's borrowings was 3.96% (as at 31December 2020: 3.70%). This includes the impact of the Pinnacle acquisition with the borrowings acquired having a cost ofdebt of over 5.5%.
On 13 July 2021, the Group completed the refinancing of the three Canadian dollar facilities held by Pinnacle. The newfacilities include a C$300.0 million term loan and C$10 million RCF. This replaced Pinnacle facilities and further reduces theGroup's all-in cost of debt to approximately 3.5%. The existing C$435 million drawn facilities were replaced with newfacilities of approximately $305 million, with the balance on the facilities been repaid form the Group's existing cashreserves.
Analysis of borrowings
Changes in borrowings during the period were as follows: As at 30 June 2021 (Unaudited) Borrowings
before deferredfinance costs
Deferredfinance costs
Netborrowings
£m £m £mBorrowings at 1 January 2021 1,085.3 (19.6) 1,065.7Cash movements: Drawdown of 2020 Infrastructure private placement facilities 130.8 (0.4) 130.4Net repayment of Revolver loan (2.0) - (2.0)Repayment of other facilities (3.8) - (3.8)Non-cash movements: Impact of acquisitions 256.3 (1.4) 254.9Indexation of linked loan 0.8 - 0.8Amortisation of deferred finance costs (note 4) - 2.9 2.9Amortisation of USD loan note premium (0.2) - (0.2)Effect of foreign exchange rates (14.9) - (14.9)Borrowings at 30 June 2021 1,452.3 (18.5) 1,433.8
13. Cash generated from operationsThe table below reconciles the Group's profit/(loss) for the period to the amount of cash generated from the Group'soperations (i.e. producing bioenergy pellets, sourcing, generating and selling electricity and gas) by adjusting for any non-cash accounting items.
Six months ended 30 JuneYear ended
31 December
2021(Unaudited)
£m
2020(Unaudited)
£m
2020(Audited)
£m
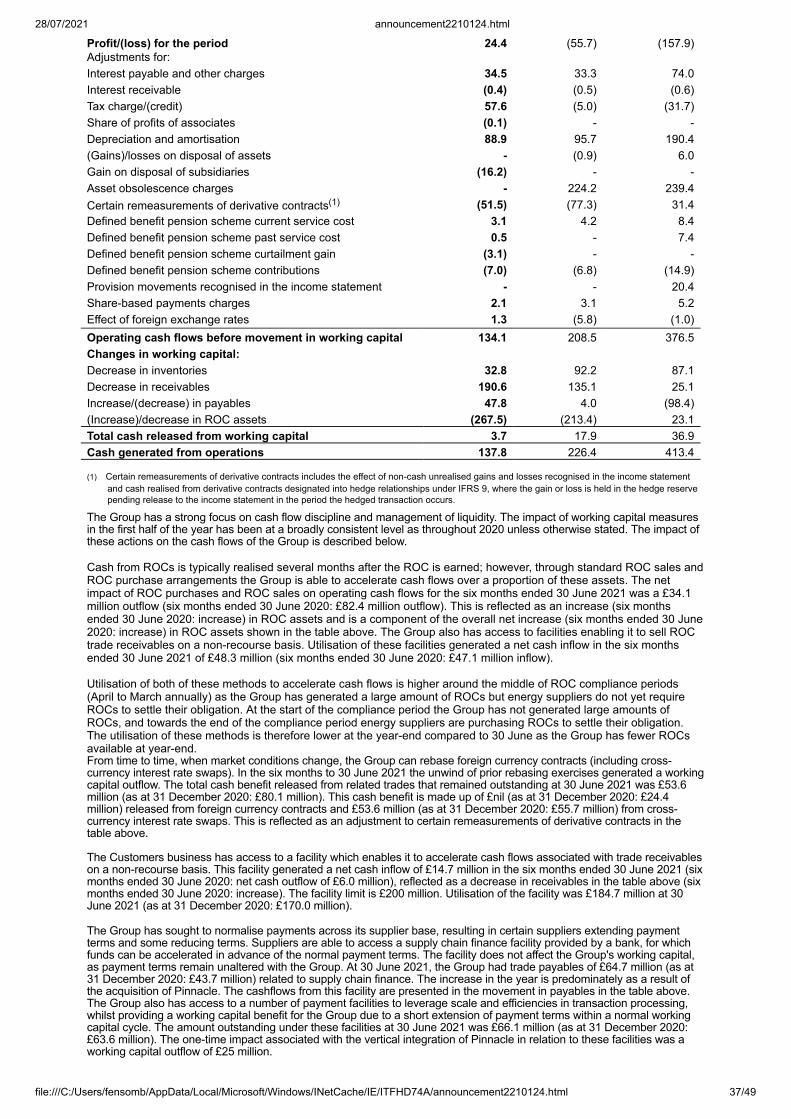
28/07/2021 announcement2210124.html
file:///C:/Users/fensomb/AppData/Local/Microsoft/Windows/INetCache/IE/ITFHD74A/announcement2210124.html 37/49
Profit/(loss) for the period 24.4 (55.7) (157.9)Adjustments for: Interest payable and other charges 34.5 33.3 74.0Interest receivable (0.4) (0.5) (0.6)Tax charge/(credit) 57.6 (5.0) (31.7)Share of profits of associates (0.1) - -Depreciation and amortisation 88.9 95.7 190.4(Gains)/losses on disposal of assets - (0.9) 6.0Gain on disposal of subsidiaries (16.2) - -Asset obsolescence charges - 224.2 239.4Certain remeasurements of derivative contracts(1) (51.5) (77.3) 31.4Defined benefit pension scheme current service cost 3.1 4.2 8.4Defined benefit pension scheme past service cost 0.5 - 7.4Defined benefit pension scheme curtailment gain (3.1) - -Defined benefit pension scheme contributions (7.0) (6.8) (14.9)Provision movements recognised in the income statement - - 20.4Share-based payments charges 2.1 3.1 5.2Effect of foreign exchange rates 1.3 (5.8) (1.0)Operating cash flows before movement in working capital 134.1 208.5 376.5Changes in working capital: Decrease in inventories 32.8 92.2 87.1Decrease in receivables 190.6 135.1 25.1Increase/(decrease) in payables 47.8 4.0 (98.4)(Increase)/decrease in ROC assets (267.5) (213.4) 23.1Total cash released from working capital 3.7 17.9 36.9Cash generated from operations 137.8 226.4 413.4
(1) Certain remeasurements of derivative contracts includes the effect of non-cash unrealised gains and losses recognised in the income statement
and cash realised from derivative contracts designated into hedge relationships under IFRS 9, where the gain or loss is held in the hedge reservepending release to the income statement in the period the hedged transaction occurs.
The Group has a strong focus on cash flow discipline and management of liquidity. The impact of working capital measuresin the first half of the year has been at a broadly consistent level as throughout 2020 unless otherwise stated. The impact ofthese actions on the cash flows of the Group is described below.
Cash from ROCs is typically realised several months after the ROC is earned; however, through standard ROC sales andROC purchase arrangements the Group is able to accelerate cash flows over a proportion of these assets. The netimpact of ROC purchases and ROC sales on operating cash flows for the six months ended 30 June 2021 was a £34.1million outflow (six months ended 30 June 2020: £82.4 million outflow). This is reflected as an increase (six monthsended 30 June 2020: increase) in ROC assets and is a component of the overall net increase (six months ended 30 June2020: increase) in ROC assets shown in the table above. The Group also has access to facilities enabling it to sell ROCtrade receivables on a non-recourse basis. Utilisation of these facilities generated a net cash inflow in the six monthsended 30 June 2021 of £48.3 million (six months ended 30 June 2020: £47.1 million inflow). Utilisation of both of these methods to accelerate cash flows is higher around the middle of ROC compliance periods(April to March annually) as the Group has generated a large amount of ROCs but energy suppliers do not yet requireROCs to settle their obligation. At the start of the compliance period the Group has not generated large amounts ofROCs, and towards the end of the compliance period energy suppliers are purchasing ROCs to settle their obligation.The utilisation of these methods is therefore lower at the year-end compared to 30 June as the Group has fewer ROCsavailable at year-end.From time to time, when market conditions change, the Group can rebase foreign currency contracts (including cross-currency interest rate swaps). In the six months to 30 June 2021 the unwind of prior rebasing exercises generated a workingcapital outflow. The total cash benefit released from related trades that remained outstanding at 30 June 2021 was £53.6million (as at 31 December 2020: £80.1 million). This cash benefit is made up of £nil (as at 31 December 2020: £24.4million) released from foreign currency contracts and £53.6 million (as at 31 December 2020: £55.7 million) from cross-currency interest rate swaps. This is reflected as an adjustment to certain remeasurements of derivative contracts in thetable above.
The Customers business has access to a facility which enables it to accelerate cash flows associated with trade receivableson a non-recourse basis. This facility generated a net cash inflow of £14.7 million in the six months ended 30 June 2021 (sixmonths ended 30 June 2020: net cash outflow of £6.0 million), reflected as a decrease in receivables in the table above (sixmonths ended 30 June 2020: increase). The facility limit is £200 million. Utilisation of the facility was £184.7 million at 30June 2021 (as at 31 December 2020: £170.0 million).
The Group has sought to normalise payments across its supplier base, resulting in certain suppliers extending paymentterms and some reducing terms. Suppliers are able to access a supply chain finance facility provided by a bank, for whichfunds can be accelerated in advance of the normal payment terms. The facility does not affect the Group's working capital,as payment terms remain unaltered with the Group. At 30 June 2021, the Group had trade payables of £64.7 million (as at31 December 2020: £43.7 million) related to supply chain finance. The increase in the year is predominately as a result ofthe acquisition of Pinnacle. The cashflows from this facility are presented in the movement in payables in the table above.The Group also has access to a number of payment facilities to leverage scale and efficiencies in transaction processing,whilst providing a working capital benefit for the Group due to a short extension of payment terms within a normal workingcapital cycle. The amount outstanding under these facilities at 30 June 2021 was £66.1 million (as at 31 December 2020:£63.6 million). The one-time impact associated with the vertical integration of Pinnacle in relation to these facilities was aworking capital outflow of £25 million.
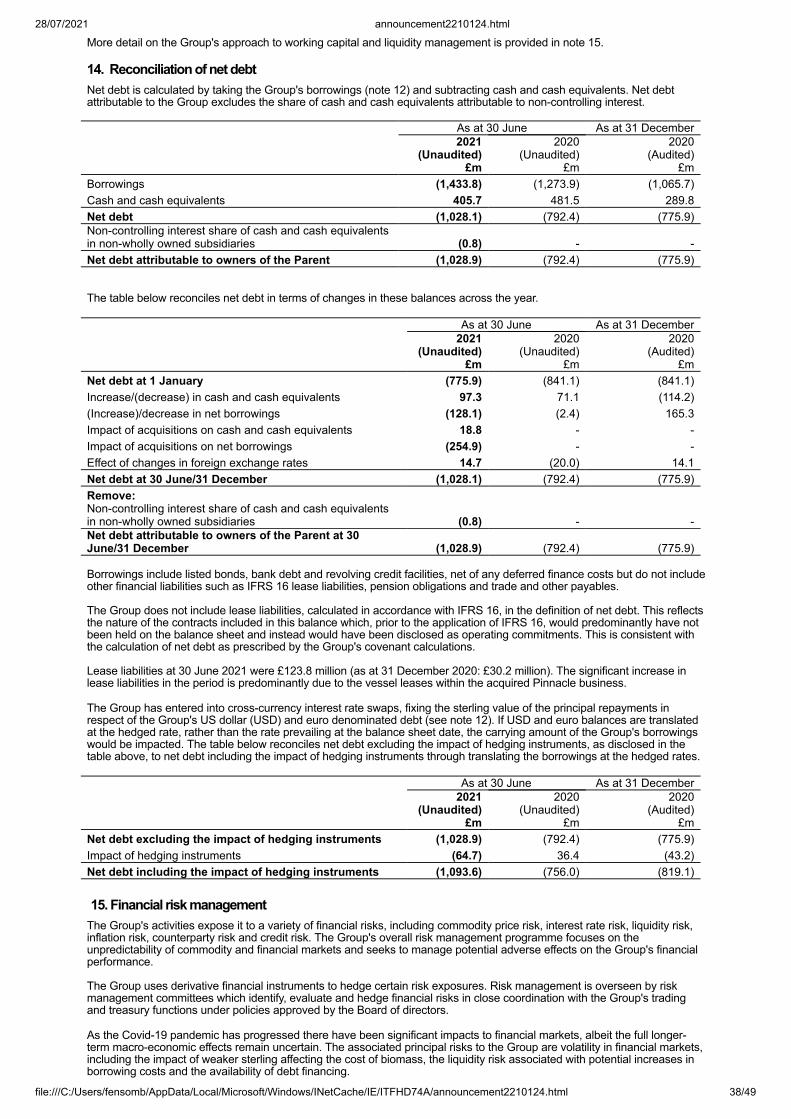
28/07/2021 announcement2210124.html
file:///C:/Users/fensomb/AppData/Local/Microsoft/Windows/INetCache/IE/ITFHD74A/announcement2210124.html 38/49
More detail on the Group's approach to working capital and liquidity management is provided in note 15.
14. Reconciliation of net debtNet debt is calculated by taking the Group's borrowings (note 12) and subtracting cash and cash equivalents. Net debtattributable to the Group excludes the share of cash and cash equivalents attributable to non-controlling interest.
As at 30 June As at 31 December
2021(Unaudited)
£m
2020(Unaudited)
£m
2020 (Audited) £m
Borrowings (1,433.8) (1,273.9) (1,065.7)Cash and cash equivalents 405.7 481.5 289.8Net debt (1,028.1) (792.4) (775.9)Non-controlling interest share of cash and cash equivalentsin non-wholly owned subsidiaries (0.8) - -Net debt attributable to owners of the Parent (1,028.9) (792.4) (775.9)
The table below reconciles net debt in terms of changes in these balances across the year.
As at 30 June As at 31 December
2021(Unaudited)
£m
2020(Unaudited)
£m
2020 (Audited) £m
Net debt at 1 January (775.9) (841.1) (841.1)Increase/(decrease) in cash and cash equivalents 97.3 71.1 (114.2)(Increase)/decrease in net borrowings (128.1) (2.4) 165.3Impact of acquisitions on cash and cash equivalents 18.8 - -Impact of acquisitions on net borrowings (254.9) - -Effect of changes in foreign exchange rates 14.7 (20.0) 14.1Net debt at 30 June/31 December (1,028.1) (792.4) (775.9)Remove: Non-controlling interest share of cash and cash equivalentsin non-wholly owned subsidiaries (0.8) - -Net debt attributable to owners of the Parent at 30June/31 December (1,028.9) (792.4) (775.9) Borrowings include listed bonds, bank debt and revolving credit facilities, net of any deferred finance costs but do not includeother financial liabilities such as IFRS 16 lease liabilities, pension obligations and trade and other payables.
The Group does not include lease liabilities, calculated in accordance with IFRS 16, in the definition of net debt. This reflectsthe nature of the contracts included in this balance which, prior to the application of IFRS 16, would predominantly have notbeen held on the balance sheet and instead would have been disclosed as operating commitments. This is consistent withthe calculation of net debt as prescribed by the Group's covenant calculations.
Lease liabilities at 30 June 2021 were £123.8 million (as at 31 December 2020: £30.2 million). The significant increase inlease liabilities in the period is predominantly due to the vessel leases within the acquired Pinnacle business.
The Group has entered into cross-currency interest rate swaps, fixing the sterling value of the principal repayments inrespect of the Group's US dollar (USD) and euro denominated debt (see note 12). If USD and euro balances are translatedat the hedged rate, rather than the rate prevailing at the balance sheet date, the carrying amount of the Group's borrowingswould be impacted. The table below reconciles net debt excluding the impact of hedging instruments, as disclosed in thetable above, to net debt including the impact of hedging instruments through translating the borrowings at the hedged rates.
As at 30 June As at 31 December
2021(Unaudited)
£m
2020(Unaudited)
£m
2020 (Audited) £m
Net debt excluding the impact of hedging instruments (1,028.9) (792.4) (775.9)Impact of hedging instruments (64.7) 36.4 (43.2)Net debt including the impact of hedging instruments (1,093.6) (756.0) (819.1)
15. Financial risk managementThe Group's activities expose it to a variety of financial risks, including commodity price risk, interest rate risk, liquidity risk,inflation risk, counterparty risk and credit risk. The Group's overall risk management programme focuses on theunpredictability of commodity and financial markets and seeks to manage potential adverse effects on the Group's financialperformance.
The Group uses derivative financial instruments to hedge certain risk exposures. Risk management is overseen by riskmanagement committees which identify, evaluate and hedge financial risks in close coordination with the Group's tradingand treasury functions under policies approved by the Board of directors.
As the Covid-19 pandemic has progressed there have been significant impacts to financial markets, albeit the full longer-term macro-economic effects remain uncertain. The associated principal risks to the Group are volatility in financial markets,including the impact of weaker sterling affecting the cost of biomass, the liquidity risk associated with potential increases inborrowing costs and the availability of debt financing.
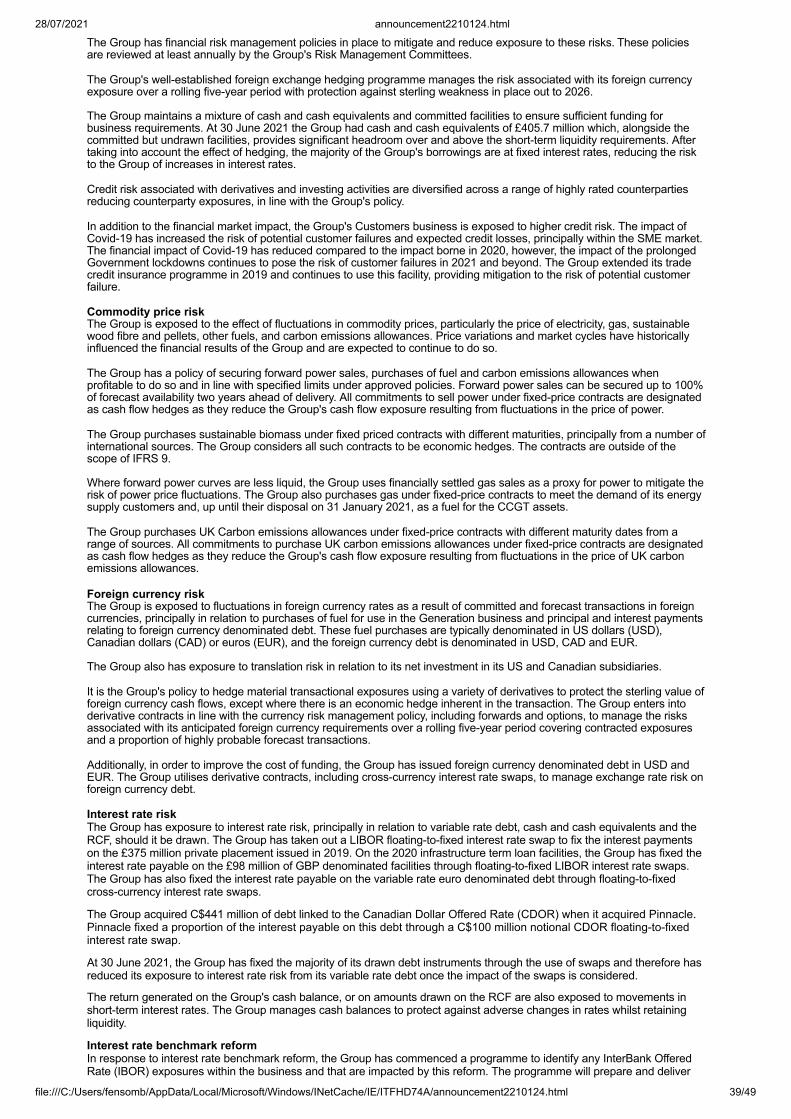
28/07/2021 announcement2210124.html
file:///C:/Users/fensomb/AppData/Local/Microsoft/Windows/INetCache/IE/ITFHD74A/announcement2210124.html 39/49
The Group has financial risk management policies in place to mitigate and reduce exposure to these risks. These policiesare reviewed at least annually by the Group's Risk Management Committees.
The Group's well-established foreign exchange hedging programme manages the risk associated with its foreign currencyexposure over a rolling five-year period with protection against sterling weakness in place out to 2026.
The Group maintains a mixture of cash and cash equivalents and committed facilities to ensure sufficient funding forbusiness requirements. At 30 June 2021 the Group had cash and cash equivalents of £405.7 million which, alongside thecommitted but undrawn facilities, provides significant headroom over and above the short-term liquidity requirements. Aftertaking into account the effect of hedging, the majority of the Group's borrowings are at fixed interest rates, reducing the riskto the Group of increases in interest rates.
Credit risk associated with derivatives and investing activities are diversified across a range of highly rated counterpartiesreducing counterparty exposures, in line with the Group's policy.
In addition to the financial market impact, the Group's Customers business is exposed to higher credit risk. The impact ofCovid-19 has increased the risk of potential customer failures and expected credit losses, principally within the SME market.The financial impact of Covid-19 has reduced compared to the impact borne in 2020, however, the impact of the prolongedGovernment lockdowns continues to pose the risk of customer failures in 2021 and beyond. The Group extended its tradecredit insurance programme in 2019 and continues to use this facility, providing mitigation to the risk of potential customerfailure.
Commodity price riskThe Group is exposed to the effect of fluctuations in commodity prices, particularly the price of electricity, gas, sustainablewood fibre and pellets, other fuels, and carbon emissions allowances. Price variations and market cycles have historicallyinfluenced the financial results of the Group and are expected to continue to do so.
The Group has a policy of securing forward power sales, purchases of fuel and carbon emissions allowances whenprofitable to do so and in line with specified limits under approved policies. Forward power sales can be secured up to 100%of forecast availability two years ahead of delivery. All commitments to sell power under fixed-price contracts are designatedas cash flow hedges as they reduce the Group's cash flow exposure resulting from fluctuations in the price of power.
The Group purchases sustainable biomass under fixed priced contracts with different maturities, principally from a number ofinternational sources. The Group considers all such contracts to be economic hedges. The contracts are outside of thescope of IFRS 9.
Where forward power curves are less liquid, the Group uses financially settled gas sales as a proxy for power to mitigate therisk of power price fluctuations. The Group also purchases gas under fixed-price contracts to meet the demand of its energysupply customers and, up until their disposal on 31 January 2021, as a fuel for the CCGT assets.
The Group purchases UK Carbon emissions allowances under fixed-price contracts with different maturity dates from arange of sources. All commitments to purchase UK carbon emissions allowances under fixed-price contracts are designatedas cash flow hedges as they reduce the Group's cash flow exposure resulting from fluctuations in the price of UK carbonemissions allowances.
Foreign currency riskThe Group is exposed to fluctuations in foreign currency rates as a result of committed and forecast transactions in foreigncurrencies, principally in relation to purchases of fuel for use in the Generation business and principal and interest paymentsrelating to foreign currency denominated debt. These fuel purchases are typically denominated in US dollars (USD),Canadian dollars (CAD) or euros (EUR), and the foreign currency debt is denominated in USD, CAD and EUR.
The Group also has exposure to translation risk in relation to its net investment in its US and Canadian subsidiaries.
It is the Group's policy to hedge material transactional exposures using a variety of derivatives to protect the sterling value offoreign currency cash flows, except where there is an economic hedge inherent in the transaction. The Group enters intoderivative contracts in line with the currency risk management policy, including forwards and options, to manage the risksassociated with its anticipated foreign currency requirements over a rolling five-year period covering contracted exposuresand a proportion of highly probable forecast transactions.
Additionally, in order to improve the cost of funding, the Group has issued foreign currency denominated debt in USD andEUR. The Group utilises derivative contracts, including cross-currency interest rate swaps, to manage exchange rate risk onforeign currency debt.
Interest rate riskThe Group has exposure to interest rate risk, principally in relation to variable rate debt, cash and cash equivalents and theRCF, should it be drawn. The Group has taken out a LIBOR floating-to-fixed interest rate swap to fix the interest paymentson the £375 million private placement issued in 2019. On the 2020 infrastructure term loan facilities, the Group has fixed theinterest rate payable on the £98 million of GBP denominated facilities through floating-to-fixed LIBOR interest rate swaps.The Group has also fixed the interest rate payable on the variable rate euro denominated debt through floating-to-fixedcross-currency interest rate swaps.
The Group acquired C$441 million of debt linked to the Canadian Dollar Offered Rate (CDOR) when it acquired Pinnacle.Pinnacle fixed a proportion of the interest payable on this debt through a C$100 million notional CDOR floating-to-fixedinterest rate swap.
At 30 June 2021, the Group has fixed the majority of its drawn debt instruments through the use of swaps and therefore hasreduced its exposure to interest rate risk from its variable rate debt once the impact of the swaps is considered.
The return generated on the Group's cash balance, or on amounts drawn on the RCF are also exposed to movements inshort-term interest rates. The Group manages cash balances to protect against adverse changes in rates whilst retainingliquidity.
Interest rate benchmark reformIn response to interest rate benchmark reform, the Group has commenced a programme to identify any InterBank OfferedRate (IBOR) exposures within the business and that are impacted by this reform. The programme will prepare and deliver
28/07/2021 announcement2210124.html
file:///C:/Users/fensomb/AppData/Local/Microsoft/Windows/INetCache/IE/ITFHD74A/announcement2210124.html 40/49
on an action plan to enable a smooth transition to alternative benchmark rates. This will involve considering appropriatealternative benchmark rates in line with those proposed by different working groups in the industry and engaging withcounterparties to implement appropriate wording in relevant contracts. This programme is expected to conclude in thesecond half of 2021.
The only interest rate benchmarks that the Group is exposed to within its hedge accounting relationships and which aresubject to interest rate benchmark reform are LIBOR and EURIBOR. The LIBOR exposures in hedge accountingrelationships are the hedge of the £375 million private placement (2019), and £98 million of the 2020 infrastructure term loanfacilities that are hedged using a floating-to-fixed LIBOR swap. The EURIBOR exposures in hedge accounting relationshipsare the hedge of the €95 million of the new infrastructure term loan facilities that are hedged using floating-to-fixedEURIBOR cross-currency interest rate swaps.
The Group is closely monitoring the market and the output from the various industry working groups managing the transitionto new benchmark interest rates. This includes announcements made by LIBOR regulators (including the Financial ConductAuthority (FCA)) regarding the transition away from LIBOR to Sterling Overnight Index Average Rate (SONIA). The FCA hasmade clear that, at the end of 2021, it will no longer seek to persuade, or compel, banks to submit to LIBOR.
Liquidity riskThe treasury function is responsible for liquidity, funding and settlement management under policies approved by the Board.Liquidity needs are monitored using regular forecasting of operational cash flows and financing commitments. The Groupmaintains a mixture of cash and cash equivalents and committed and uncommitted facilities in order to ensure sufficientfunding for business requirements.
In managing liquidity risk, the Group has the ability to accelerate the cash flows associated with certain working capitalitems, principally those related to ROC sales and Customers' energy supply sales. In each case, this is undertaken on anon-recourse basis and accordingly, the ROCs and other items are derecognised from the balance sheet at the point ofsale. The Group also utilises standard purchasing facilities to extend the working capital cycle, whilst still paying suppliers ontime.
Counterparty riskAs the Group relies on third-party suppliers and counterparties for the delivery of currency, sustainable biomass and othergoods and services, it is exposed to the risk of non-performance by these third-party suppliers. If a large supplier were to fallinto financial difficulty and/or fail to deliver against its contract with the Group, there would be additional costs associatedwith securing the lost goods or services from other suppliers.
The Group enters into contracts for the sale of electricity to a number of counterparties. The failure of one or more of thesecounterparties to perform their contractual obligations may cause the Group financial distress or increase the risk profile ofthe Group.
Credit riskThe Group's exposure to credit risk is predominantly limited to the carrying amount of financial assets recognised at thebalance sheet date.
The Group's three operating segments are all exposed to different levels and concentrations of credit risk, largely reflectingthe number, size and nature of their respective customers. Up to 30 June 2021, the majority of Pellet Production segmentsales were intra-group. The proportion of external sales will increase in future periods due to the acquisition of Pinnacle. Ofthese external sales, a significant majority are contracted to large utility customers where the concentration of credit risk islow.
The highest risk is in the Customers segment, with a high number of customers of varying sizes operating in a variety ofmarkets. In particular, its SME customers carry lower concentrations but higher levels of credit risk, owing to a customerbase comprised largely of smaller retail and commercial entities.
In the Customers segment, credit risk is managed by checking a company's creditworthiness and financial strength bothbefore commencing trade and during the business relationship. Credit risk is monitored and managed by business sector.
For the Generation segment, the risk arises from treasury, trading and energy procurement activities, as well as the sale ofby-products from generation activities. Wholesale counterparty credit exposures are monitored by individual counterpartyand by category of credit rating. Counterparty credit exposures are subject to approved limits. The Group uses masternetting agreements to reduce credit risk and net settles payments with counterparties where net settlement provisions exist.In addition, the Group employs a variety of other methods to mitigate credit risk: margining, various forms of parent companyguarantee, deed of charge, cash collateral, letters of credit and surety bonds. The majority of the Generation business'scredit risk is with counterparties in related energy industries or with financial institutions. In addition, where deemedappropriate, the Group has historically purchased credit default swaps.
For the Pellet Production segment, credit risk predominantly relates to the fact sales tend to be under large, long-termcontracts in an illiquid market. The Group manages this risk through detailed assessment of credit risk prior to entering newcontracts and subsequent monitoring of credit risk throughout the term of the contracts.
The investment of surplus cash is undertaken with the objective of ensuring that there is sufficient liquidity at all times, sothat funds are available to meet liabilities as they fall due, whilst securing a return from invested funds and preserving thecapital value of those funds within Board-approved policies. These policies manage credit risk exposure by setting outminimum rating requirements, maximum investment with any one counterparty based on their rating, and the maturityprofile.
Inflation riskThe Group is exposed to inflation risk on elements of its revenues and cost base. The Group's ROC revenues are linked toUK RPI and its Contract for Difference revenue (CfD) is linked to UK CPI. In addition, a proportion of the Group's fuel costsare linked to US/Canadian CPI. The Group uses financial derivative contracts including swaps and swaptions to hedge thefuture cashflows relating to a proportion of its exposure. The Group has fixed the cashflows on a proportion of these swaps.The Group also benefits from a natural hedge arising from its inflation-linked borrowings (see note 12).
Capital managementThe Group manages its capital to ensure it is able to continue as a going concern; maintain a strong credit ratingunderpinned by robust financial metrics; invest in its core business and pay a sustainable and growing dividend while
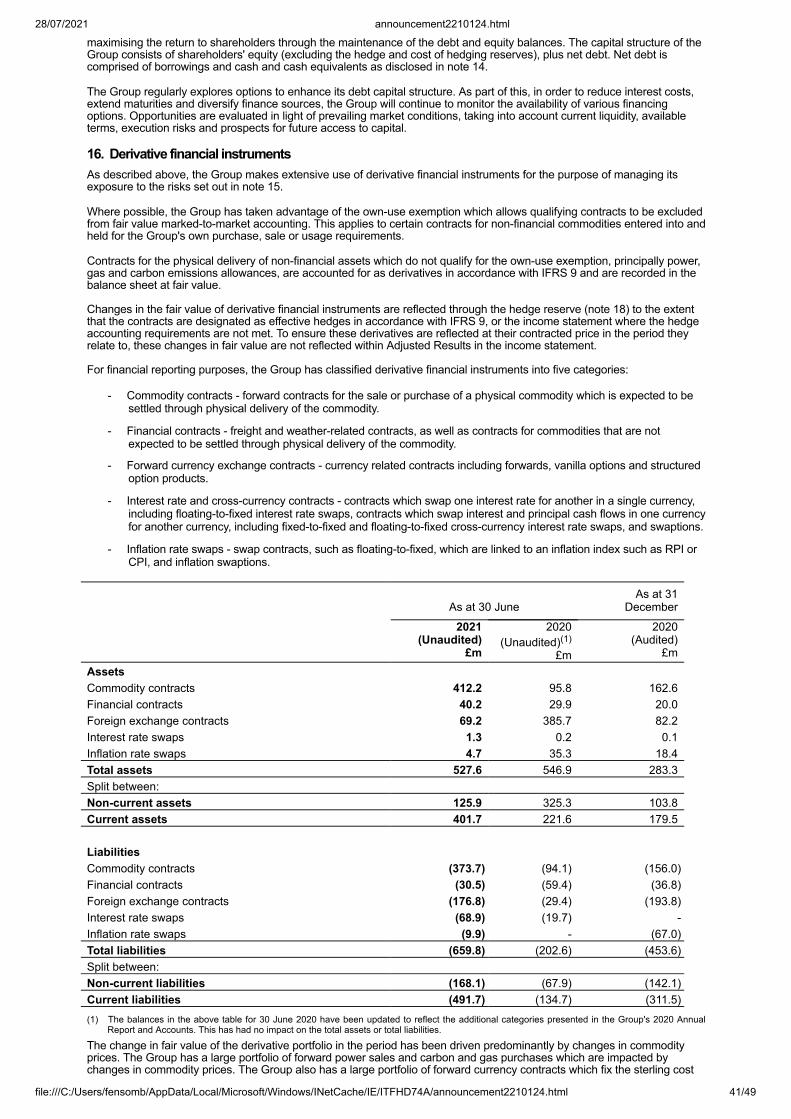
28/07/2021 announcement2210124.html
file:///C:/Users/fensomb/AppData/Local/Microsoft/Windows/INetCache/IE/ITFHD74A/announcement2210124.html 41/49
maximising the return to shareholders through the maintenance of the debt and equity balances. The capital structure of theGroup consists of shareholders' equity (excluding the hedge and cost of hedging reserves), plus net debt. Net debt iscomprised of borrowings and cash and cash equivalents as disclosed in note 14.
The Group regularly explores options to enhance its debt capital structure. As part of this, in order to reduce interest costs,extend maturities and diversify finance sources, the Group will continue to monitor the availability of various financingoptions. Opportunities are evaluated in light of prevailing market conditions, taking into account current liquidity, availableterms, execution risks and prospects for future access to capital.
16. Derivative financial instrumentsAs described above, the Group makes extensive use of derivative financial instruments for the purpose of managing itsexposure to the risks set out in note 15.
Where possible, the Group has taken advantage of the own-use exemption which allows qualifying contracts to be excludedfrom fair value marked-to-market accounting. This applies to certain contracts for non-financial commodities entered into andheld for the Group's own purchase, sale or usage requirements.
Contracts for the physical delivery of non-financial assets which do not qualify for the own-use exemption, principally power,gas and carbon emissions allowances, are accounted for as derivatives in accordance with IFRS 9 and are recorded in thebalance sheet at fair value.
Changes in the fair value of derivative financial instruments are reflected through the hedge reserve (note 18) to the extentthat the contracts are designated as effective hedges in accordance with IFRS 9, or the income statement where the hedgeaccounting requirements are not met. To ensure these derivatives are reflected at their contracted price in the period theyrelate to, these changes in fair value are not reflected within Adjusted Results in the income statement.
For financial reporting purposes, the Group has classified derivative financial instruments into five categories:
- Commodity contracts - forward contracts for the sale or purchase of a physical commodity which is expected to besettled through physical delivery of the commodity.
- Financial contracts - freight and weather-related contracts, as well as contracts for commodities that are notexpected to be settled through physical delivery of the commodity.
- Forward currency exchange contracts - currency related contracts including forwards, vanilla options and structuredoption products.
- Interest rate and cross-currency contracts - contracts which swap one interest rate for another in a single currency,including floating-to-fixed interest rate swaps, contracts which swap interest and principal cash flows in one currencyfor another currency, including fixed-to-fixed and floating-to-fixed cross-currency interest rate swaps, and swaptions.
- Inflation rate swaps - swap contracts, such as floating-to-fixed, which are linked to an inflation index such as RPI orCPI, and inflation swaptions.
As at 30 JuneAs at 31
December 2021
(Unaudited)£m
2020(Unaudited)(1)
£m
2020(Audited)
£mAssets Commodity contracts 412.2 95.8 162.6Financial contracts 40.2 29.9 20.0Foreign exchange contracts 69.2 385.7 82.2Interest rate swaps 1.3 0.2 0.1Inflation rate swaps 4.7 35.3 18.4Total assets 527.6 546.9 283.3Split between: Non-current assets 125.9 325.3 103.8Current assets 401.7 221.6 179.5 Liabilities Commodity contracts (373.7) (94.1) (156.0)Financial contracts (30.5) (59.4) (36.8)Foreign exchange contracts (176.8) (29.4) (193.8)Interest rate swaps (68.9) (19.7) -Inflation rate swaps (9.9) - (67.0)Total liabilities (659.8) (202.6) (453.6)Split between: Non-current liabilities (168.1) (67.9) (142.1)Current liabilities (491.7) (134.7) (311.5)(1) The balances in the above table for 30 June 2020 have been updated to reflect the additional categories presented in the Group's 2020 Annual
Report and Accounts. This has had no impact on the total assets or total liabilities.
The change in fair value of the derivative portfolio in the period has been driven predominantly by changes in commodityprices. The Group has a large portfolio of forward power sales and carbon and gas purchases which are impacted bychanges in commodity prices. The Group also has a large portfolio of forward currency contracts which fix the sterling cost
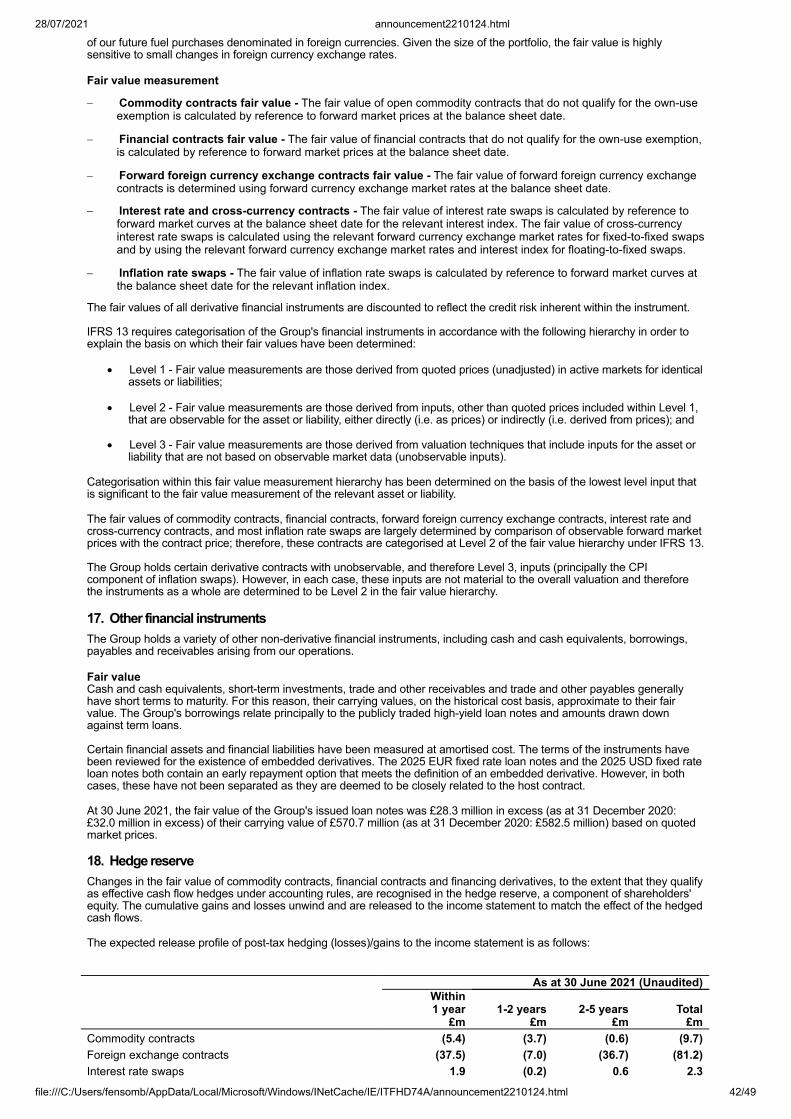
28/07/2021 announcement2210124.html
file:///C:/Users/fensomb/AppData/Local/Microsoft/Windows/INetCache/IE/ITFHD74A/announcement2210124.html 42/49
of our future fuel purchases denominated in foreign currencies. Given the size of the portfolio, the fair value is highlysensitive to small changes in foreign currency exchange rates.
Fair value measurement
- Commodity contracts fair value - The fair value of open commodity contracts that do not qualify for the own-useexemption is calculated by reference to forward market prices at the balance sheet date.
- Financial contracts fair value - The fair value of financial contracts that do not qualify for the own-use exemption,is calculated by reference to forward market prices at the balance sheet date.
- Forward foreign currency exchange contracts fair value - The fair value of forward foreign currency exchangecontracts is determined using forward currency exchange market rates at the balance sheet date.
- Interest rate and cross-currency contracts - The fair value of interest rate swaps is calculated by reference toforward market curves at the balance sheet date for the relevant interest index. The fair value of cross-currencyinterest rate swaps is calculated using the relevant forward currency exchange market rates for fixed-to-fixed swapsand by using the relevant forward currency exchange market rates and interest index for floating-to-fixed swaps.
- Inflation rate swaps - The fair value of inflation rate swaps is calculated by reference to forward market curves atthe balance sheet date for the relevant inflation index.
The fair values of all derivative financial instruments are discounted to reflect the credit risk inherent within the instrument.
IFRS 13 requires categorisation of the Group's financial instruments in accordance with the following hierarchy in order toexplain the basis on which their fair values have been determined:
· Level 1 - Fair value measurements are those derived from quoted prices (unadjusted) in active markets for identicalassets or liabilities;
· Level 2 - Fair value measurements are those derived from inputs, other than quoted prices included within Level 1,that are observable for the asset or liability, either directly (i.e. as prices) or indirectly (i.e. derived from prices); and
· Level 3 - Fair value measurements are those derived from valuation techniques that include inputs for the asset orliability that are not based on observable market data (unobservable inputs).
Categorisation within this fair value measurement hierarchy has been determined on the basis of the lowest level input thatis significant to the fair value measurement of the relevant asset or liability.
The fair values of commodity contracts, financial contracts, forward foreign currency exchange contracts, interest rate andcross-currency contracts, and most inflation rate swaps are largely determined by comparison of observable forward marketprices with the contract price; therefore, these contracts are categorised at Level 2 of the fair value hierarchy under IFRS 13.
The Group holds certain derivative contracts with unobservable, and therefore Level 3, inputs (principally the CPIcomponent of inflation swaps). However, in each case, these inputs are not material to the overall valuation and thereforethe instruments as a whole are determined to be Level 2 in the fair value hierarchy.
17. Other financial instrumentsThe Group holds a variety of other non-derivative financial instruments, including cash and cash equivalents, borrowings,payables and receivables arising from our operations.
Fair valueCash and cash equivalents, short-term investments, trade and other receivables and trade and other payables generallyhave short terms to maturity. For this reason, their carrying values, on the historical cost basis, approximate to their fairvalue. The Group's borrowings relate principally to the publicly traded high-yield loan notes and amounts drawn downagainst term loans.
Certain financial assets and financial liabilities have been measured at amortised cost. The terms of the instruments havebeen reviewed for the existence of embedded derivatives. The 2025 EUR fixed rate loan notes and the 2025 USD fixed rateloan notes both contain an early repayment option that meets the definition of an embedded derivative. However, in bothcases, these have not been separated as they are deemed to be closely related to the host contract.
At 30 June 2021, the fair value of the Group's issued loan notes was £28.3 million in excess (as at 31 December 2020:£32.0 million in excess) of their carrying value of £570.7 million (as at 31 December 2020: £582.5 million) based on quotedmarket prices.
18. Hedge reserveChanges in the fair value of commodity contracts, financial contracts and financing derivatives, to the extent that they qualifyas effective cash flow hedges under accounting rules, are recognised in the hedge reserve, a component of shareholders'equity. The cumulative gains and losses unwind and are released to the income statement to match the effect of the hedgedcash flows.
The expected release profile of post-tax hedging (losses)/gains to the income statement is as follows:
As at 30 June 2021 (Unaudited)
Within 1 year £m
1-2 years£m
2-5 years£m
Total £m
Commodity contracts (5.4) (3.7) (0.6) (9.7)Foreign exchange contracts (37.5) (7.0) (36.7) (81.2)Interest rate swaps 1.9 (0.2) 0.6 2.3
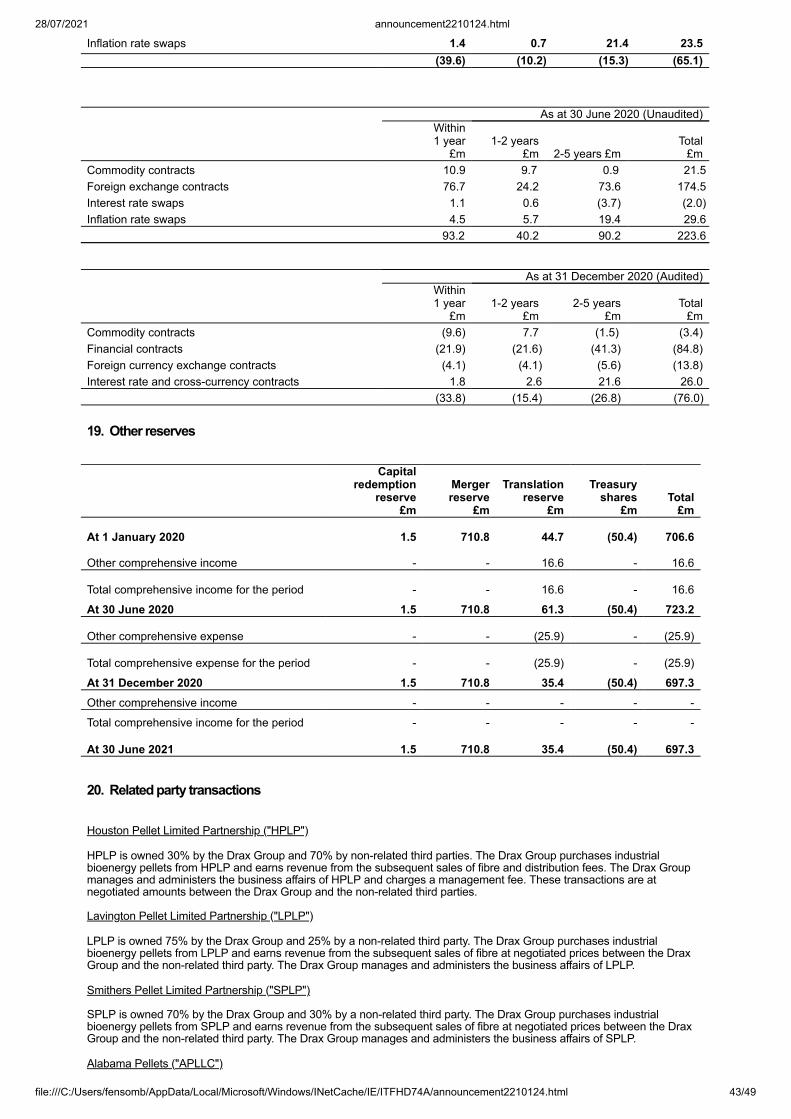
28/07/2021 announcement2210124.html
file:///C:/Users/fensomb/AppData/Local/Microsoft/Windows/INetCache/IE/ITFHD74A/announcement2210124.html 43/49
Inflation rate swaps 1.4 0.7 21.4 23.5 (39.6) (10.2) (15.3) (65.1) As at 30 June 2020 (Unaudited)
Within 1 year £m
1-2 years£m 2-5 years £m
Total £m
Commodity contracts 10.9 9.7 0.9 21.5Foreign exchange contracts 76.7 24.2 73.6 174.5Interest rate swaps 1.1 0.6 (3.7) (2.0)Inflation rate swaps 4.5 5.7 19.4 29.6 93.2 40.2 90.2 223.6
As at 31 December 2020 (Audited)
Within 1 year £m
1-2 years £m
2-5 years£m
Total £m
Commodity contracts (9.6) 7.7 (1.5) (3.4)Financial contracts (21.9) (21.6) (41.3) (84.8)Foreign currency exchange contracts (4.1) (4.1) (5.6) (13.8)Interest rate and cross-currency contracts 1.8 2.6 21.6 26.0 (33.8) (15.4) (26.8) (76.0)
19. Other reserves
Capitalredemption
reserve £m
Mergerreserve
£m
Translationreserve
£m
Treasury
shares £m
Total£m
At 1 January 2020 1.5 710.8 44.7
(50.4)
706.6
Other comprehensive income - - 16.6 - 16.6
Total comprehensive income for the period - - 16.6 -
16.6
At 30 June 2020 1.5 710.8 61.3 (50.4) 723.2
Other comprehensive expense - - (25.9) - (25.9)
Total comprehensive expense for the period - - (25.9) - (25.9)
At 31 December 2020 1.5 710.8 35.4 (50.4) 697.3Other comprehensive income - - - - -
Total comprehensive income for the period - - - - -
At 30 June 2021 1.5 710.8 35.4 (50.4) 697.3 20. Related party transactions Houston Pellet Limited Partnership ("HPLP")
HPLP is owned 30% by the Drax Group and 70% by non-related third parties. The Drax Group purchases industrialbioenergy pellets from HPLP and earns revenue from the subsequent sales of fibre and distribution fees. The Drax Groupmanages and administers the business affairs of HPLP and charges a management fee. These transactions are atnegotiated amounts between the Drax Group and the non-related third parties.
Lavington Pellet Limited Partnership ("LPLP")
LPLP is owned 75% by the Drax Group and 25% by a non-related third party. The Drax Group purchases industrialbioenergy pellets from LPLP and earns revenue from the subsequent sales of fibre at negotiated prices between the DraxGroup and the non-related third party. The Drax Group manages and administers the business affairs of LPLP.
Smithers Pellet Limited Partnership ("SPLP")
SPLP is owned 70% by the Drax Group and 30% by a non-related third party. The Drax Group purchases industrialbioenergy pellets from SPLP and earns revenue from the subsequent sales of fibre at negotiated prices between the DraxGroup and the non-related third party. The Drax Group manages and administers the business affairs of SPLP.
Alabama Pellets ("APLLC")
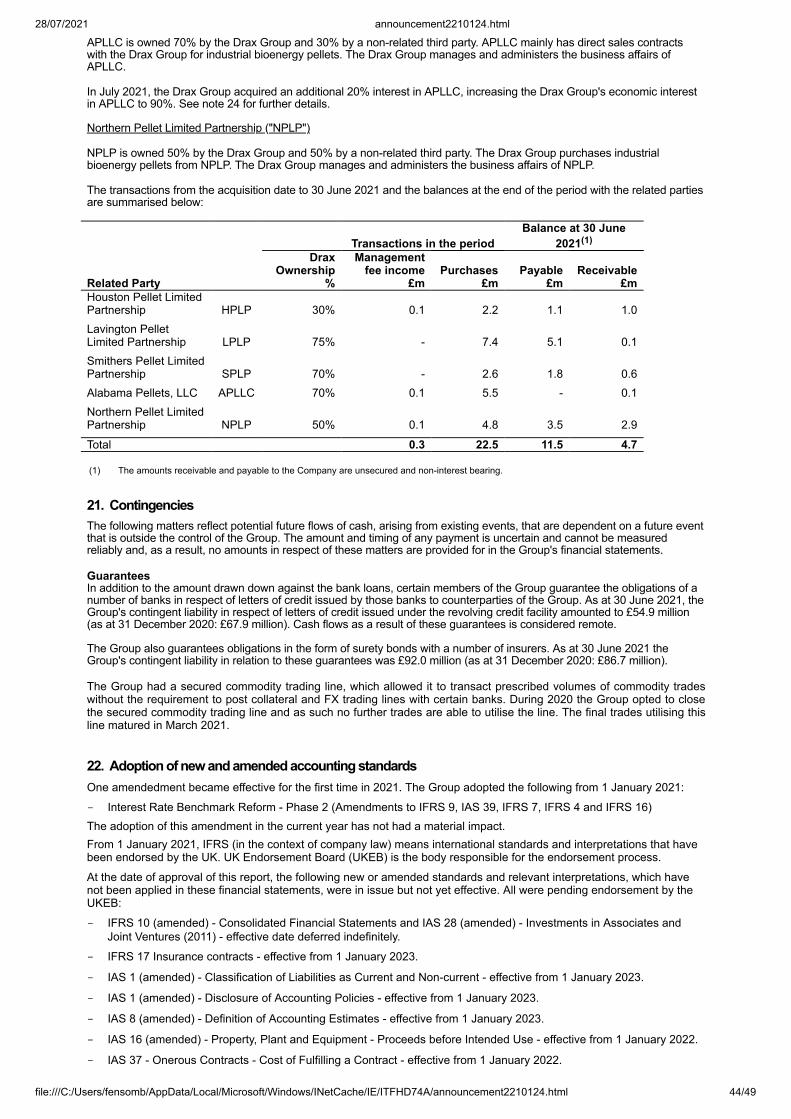
28/07/2021 announcement2210124.html
file:///C:/Users/fensomb/AppData/Local/Microsoft/Windows/INetCache/IE/ITFHD74A/announcement2210124.html 44/49
APLLC is owned 70% by the Drax Group and 30% by a non-related third party. APLLC mainly has direct sales contractswith the Drax Group for industrial bioenergy pellets. The Drax Group manages and administers the business affairs ofAPLLC.
In July 2021, the Drax Group acquired an additional 20% interest in APLLC, increasing the Drax Group's economic interestin APLLC to 90%. See note 24 for further details.
Northern Pellet Limited Partnership ("NPLP")
NPLP is owned 50% by the Drax Group and 50% by a non-related third party. The Drax Group purchases industrialbioenergy pellets from NPLP. The Drax Group manages and administers the business affairs of NPLP.
The transactions from the acquisition date to 30 June 2021 and the balances at the end of the period with the related partiesare summarised below:
Transactions in the periodBalance at 30 June
2021(1)
Related Party
DraxOwnership
%
Managementfee income
£mPurchases
£mPayable
£mReceivable
£mHouston Pellet LimitedPartnership HPLP 30% 0.1 2.2 1.1 1.0Lavington PelletLimited Partnership LPLP 75% - 7.4 5.1 0.1Smithers Pellet LimitedPartnership SPLP 70% - 2.6 1.8 0.6Alabama Pellets, LLC APLLC 70% 0.1 5.5 - 0.1Northern Pellet LimitedPartnership NPLP 50% 0.1 4.8 3.5 2.9
Total 0.3 22.5 11.5 4.7
(1) The amounts receivable and payable to the Company are unsecured and non-interest bearing.
21. ContingenciesThe following matters reflect potential future flows of cash, arising from existing events, that are dependent on a future eventthat is outside the control of the Group. The amount and timing of any payment is uncertain and cannot be measuredreliably and, as a result, no amounts in respect of these matters are provided for in the Group's financial statements.
GuaranteesIn addition to the amount drawn down against the bank loans, certain members of the Group guarantee the obligations of anumber of banks in respect of letters of credit issued by those banks to counterparties of the Group. As at 30 June 2021, theGroup's contingent liability in respect of letters of credit issued under the revolving credit facility amounted to £54.9 million(as at 31 December 2020: £67.9 million). Cash flows as a result of these guarantees is considered remote.
The Group also guarantees obligations in the form of surety bonds with a number of insurers. As at 30 June 2021 theGroup's contingent liability in relation to these guarantees was £92.0 million (as at 31 December 2020: £86.7 million).
The Group had a secured commodity trading line, which allowed it to transact prescribed volumes of commodity tradeswithout the requirement to post collateral and FX trading lines with certain banks. During 2020 the Group opted to closethe secured commodity trading line and as such no further trades are able to utilise the line. The final trades utilising thisline matured in March 2021.
22. Adoption of new and amended accounting standardsOne amendedment became effective for the first time in 2021. The Group adopted the following from 1 January 2021:
- Interest Rate Benchmark Reform - Phase 2 (Amendments to IFRS 9, IAS 39, IFRS 7, IFRS 4 and IFRS 16)The adoption of this amendment in the current year has not had a material impact.From 1 January 2021, IFRS (in the context of company law) means international standards and interpretations that havebeen endorsed by the UK. UK Endorsement Board (UKEB) is the body responsible for the endorsement process.
At the date of approval of this report, the following new or amended standards and relevant interpretations, which havenot been applied in these financial statements, were in issue but not yet effective. All were pending endorsement by theUKEB:
- IFRS 10 (amended) - Consolidated Financial Statements and IAS 28 (amended) - Investments in Associates andJoint Ventures (2011) - effective date deferred indefinitely.
- IFRS 17 Insurance contracts - effective from 1 January 2023.
- IAS 1 (amended) - Classification of Liabilities as Current and Non-current - effective from 1 January 2023.
- IAS 1 (amended) - Disclosure of Accounting Policies - effective from 1 January 2023.
- IAS 8 (amended) - Definition of Accounting Estimates - effective from 1 January 2023.
- IAS 16 (amended) - Property, Plant and Equipment - Proceeds before Intended Use - effective from 1 January 2022.
- IAS 37 - Onerous Contracts - Cost of Fulfilling a Contract - effective from 1 January 2022.
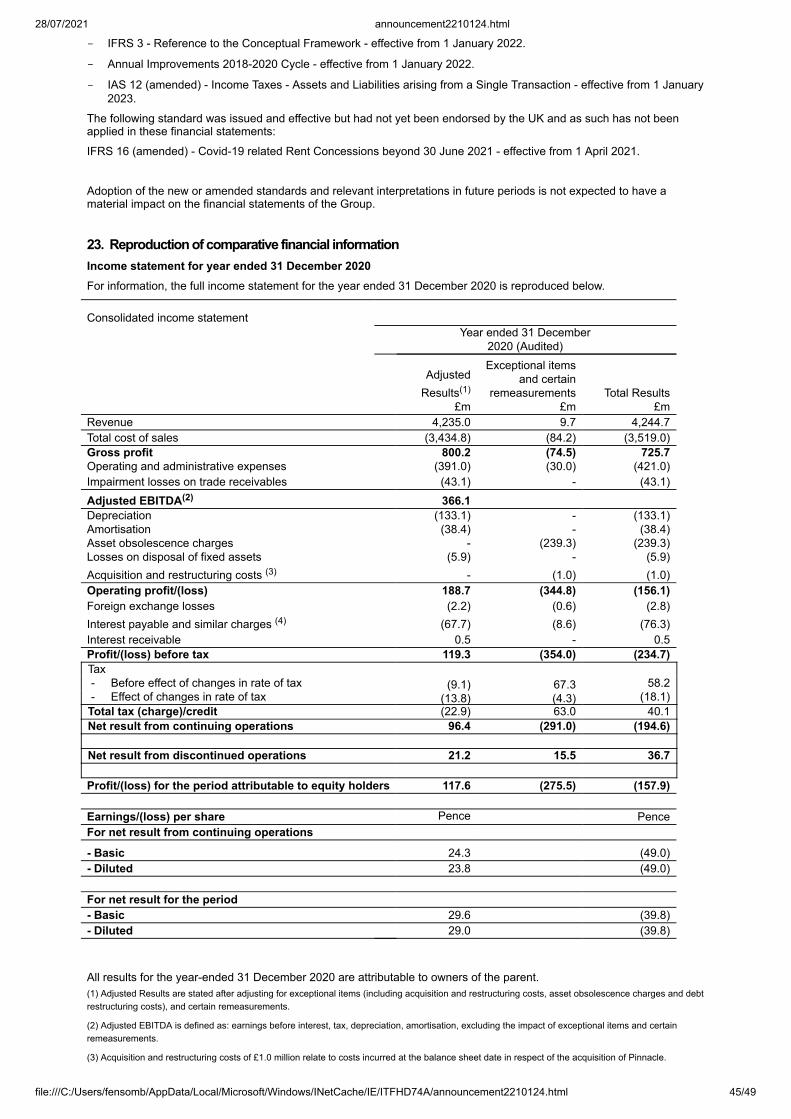
28/07/2021 announcement2210124.html
file:///C:/Users/fensomb/AppData/Local/Microsoft/Windows/INetCache/IE/ITFHD74A/announcement2210124.html 45/49
- IFRS 3 - Reference to the Conceptual Framework - effective from 1 January 2022.
- Annual Improvements 2018-2020 Cycle - effective from 1 January 2022.
- IAS 12 (amended) - Income Taxes - Assets and Liabilities arising from a Single Transaction - effective from 1 January2023.
The following standard was issued and effective but had not yet been endorsed by the UK and as such has not beenapplied in these financial statements:
IFRS 16 (amended) - Covid-19 related Rent Concessions beyond 30 June 2021 - effective from 1 April 2021.
Adoption of the new or amended standards and relevant interpretations in future periods is not expected to have amaterial impact on the financial statements of the Group.
23. Reproduction of comparative financial informationIncome statement for year ended 31 December 2020For information, the full income statement for the year ended 31 December 2020 is reproduced below.
Consolidated income statement
Year ended 31 December
2020 (Audited)
Adjusted
Results(1)
£m
Exceptional itemsand certain
remeasurements£m
Total Results£m
Revenue 4,235.0 9.7 4,244.7Total cost of sales (3,434.8) (84.2) (3,519.0)Gross profit 800.2 (74.5) 725.7Operating and administrative expenses (391.0) (30.0) (421.0)Impairment losses on trade receivables (43.1) - (43.1)Adjusted EBITDA(2) 366.1 Depreciation (133.1) - (133.1)Amortisation (38.4) - (38.4)Asset obsolescence charges - (239.3) (239.3)Losses on disposal of fixed assets (5.9) - (5.9)Acquisition and restructuring costs (3) - (1.0) (1.0)Operating profit/(loss) 188.7 (344.8) (156.1)Foreign exchange losses (2.2) (0.6) (2.8)Interest payable and similar charges (4) (67.7) (8.6) (76.3)Interest receivable 0.5 - 0.5Profit/(loss) before tax 119.3 (354.0) (234.7)Tax - Before effect of changes in rate of tax (9.1) 67.3 58.2- Effect of changes in rate of tax (13.8) (4.3) (18.1)
Total tax (charge)/credit (22.9) 63.0 40.1Net result from continuing operations 96.4 (291.0) (194.6) Net result from discontinued operations 21.2 15.5 36.7 Profit/(loss) for the period attributable to equity holders 117.6 (275.5) (157.9) Earnings/(loss) per share Pence PenceFor net result from continuing operations
- Basic 24.3 (49.0)- Diluted 23.8 (49.0) For net result for the period - Basic 29.6 (39.8)- Diluted 29.0 (39.8)
All results for the year-ended 31 December 2020 are attributable to owners of the parent.(1) Adjusted Results are stated after adjusting for exceptional items (including acquisition and restructuring costs, asset obsolescence charges and debtrestructuring costs), and certain remeasurements.
(2) Adjusted EBITDA is defined as: earnings before interest, tax, depreciation, amortisation, excluding the impact of exceptional items and certainremeasurements.
(3) Acquisition and restructuring costs of £1.0 million relate to costs incurred at the balance sheet date in respect of the acquisition of Pinnacle.
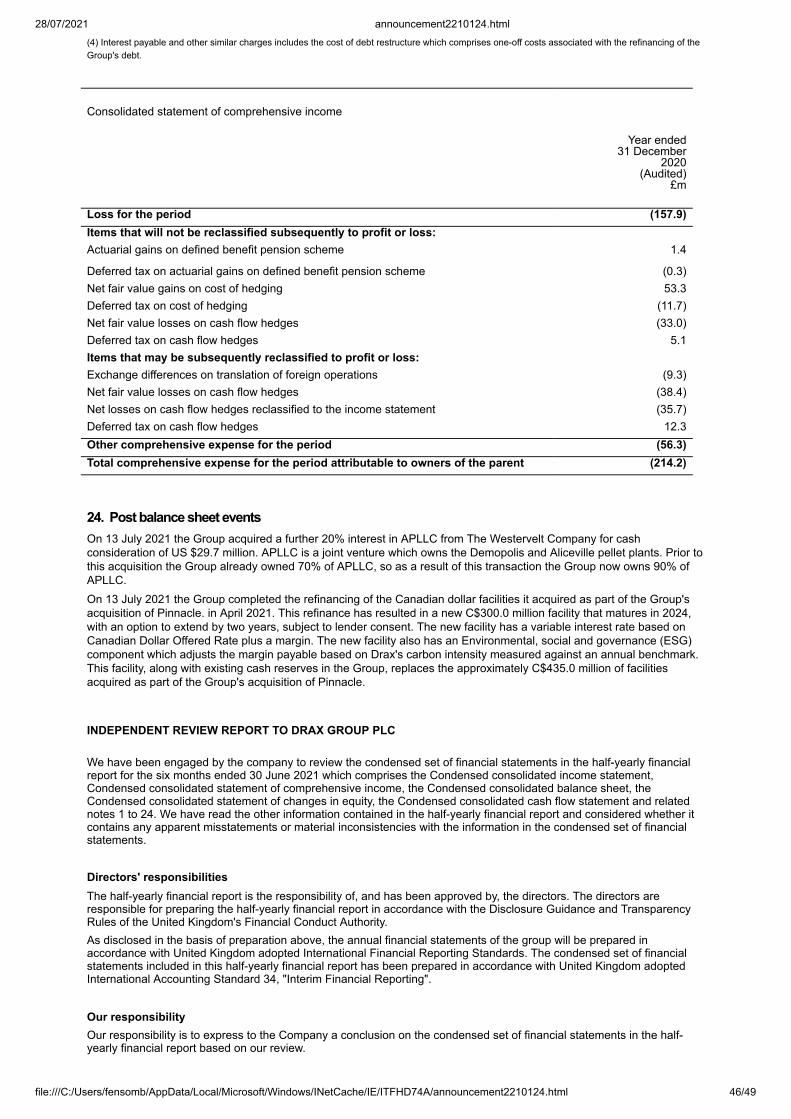
28/07/2021 announcement2210124.html
file:///C:/Users/fensomb/AppData/Local/Microsoft/Windows/INetCache/IE/ITFHD74A/announcement2210124.html 46/49
(4) Interest payable and other similar charges includes the cost of debt restructure which comprises one-off costs associated with the refinancing of theGroup's debt.
Consolidated statement of comprehensive income
Year ended
31 December2020
(Audited) £m
Loss for the period (157.9)Items that will not be reclassified subsequently to profit or loss: Actuarial gains on defined benefit pension scheme 1.4
Deferred tax on actuarial gains on defined benefit pension scheme (0.3)Net fair value gains on cost of hedging 53.3Deferred tax on cost of hedging (11.7)Net fair value losses on cash flow hedges (33.0)Deferred tax on cash flow hedges 5.1Items that may be subsequently reclassified to profit or loss: Exchange differences on translation of foreign operations (9.3)Net fair value losses on cash flow hedges (38.4)Net losses on cash flow hedges reclassified to the income statement (35.7)Deferred tax on cash flow hedges 12.3Other comprehensive expense for the period (56.3)Total comprehensive expense for the period attributable to owners of the parent (214.2)
24. Post balance sheet eventsOn 13 July 2021 the Group acquired a further 20% interest in APLLC from The Westervelt Company for cashconsideration of US $29.7 million. APLLC is a joint venture which owns the Demopolis and Aliceville pellet plants. Prior tothis acquisition the Group already owned 70% of APLLC, so as a result of this transaction the Group now owns 90% ofAPLLC.On 13 July 2021 the Group completed the refinancing of the Canadian dollar facilities it acquired as part of the Group'sacquisition of Pinnacle. in April 2021. This refinance has resulted in a new C$300.0 million facility that matures in 2024,with an option to extend by two years, subject to lender consent. The new facility has a variable interest rate based onCanadian Dollar Offered Rate plus a margin. The new facility also has an Environmental, social and governance (ESG)component which adjusts the margin payable based on Drax's carbon intensity measured against an annual benchmark.This facility, along with existing cash reserves in the Group, replaces the approximately C$435.0 million of facilitiesacquired as part of the Group's acquisition of Pinnacle.
INDEPENDENT REVIEW REPORT TO DRAX GROUP PLC We have been engaged by the company to review the condensed set of financial statements in the half-yearly financialreport for the six months ended 30 June 2021 which comprises the Condensed consolidated income statement,Condensed consolidated statement of comprehensive income, the Condensed consolidated balance sheet, theCondensed consolidated statement of changes in equity, the Condensed consolidated cash flow statement and relatednotes 1 to 24. We have read the other information contained in the half-yearly financial report and considered whether itcontains any apparent misstatements or material inconsistencies with the information in the condensed set of financialstatements. Directors' responsibilitiesThe half-yearly financial report is the responsibility of, and has been approved by, the directors. The directors areresponsible for preparing the half-yearly financial report in accordance with the Disclosure Guidance and TransparencyRules of the United Kingdom's Financial Conduct Authority.As disclosed in the basis of preparation above, the annual financial statements of the group will be prepared inaccordance with United Kingdom adopted International Financial Reporting Standards. The condensed set of financialstatements included in this half-yearly financial report has been prepared in accordance with United Kingdom adoptedInternational Accounting Standard 34, "Interim Financial Reporting". Our responsibilityOur responsibility is to express to the Company a conclusion on the condensed set of financial statements in the half-yearly financial report based on our review.
28/07/2021 announcement2210124.html
file:///C:/Users/fensomb/AppData/Local/Microsoft/Windows/INetCache/IE/ITFHD74A/announcement2210124.html 47/49
Scope of reviewWe conducted our review in accordance with International Standard on Review Engagements (UK and Ireland) 2410"Review of Interim Financial Information Performed by the Independent Auditor of the Entity" issued by the FinancialReporting Council for use in the United Kingdom. A review of interim financial information consists of making inquiries,primarily of persons responsible for financial and accounting matters, and applying analytical and other reviewprocedures. A review is substantially less in scope than an audit conducted in accordance with International Standards onAuditing (UK) and consequently does not enable us to obtain assurance that we would become aware of all significantmatters that might be identified in an audit. Accordingly, we do not express an audit opinion. ConclusionBased on our review, nothing has come to our attention that causes us to believe that the condensed set of financialstatements in the half-yearly financial report for the six months ended 30 June 2021 is not prepared, in all materialrespects, in accordance with United Kingdom adopted International Accounting Standard 34 and the Disclosure Guidanceand Transparency Rules of the United Kingdom's Financial Conduct Authority. Use of our reportThis report is made solely to the company in accordance with International Standard on Review Engagements (UK andIreland) 2410 "Review of Interim Financial Information Performed by the Independent Auditor of the Entity" issued by theFinancial Reporting Council. Our work has been undertaken so that we might state to the company those matters we arerequired to state to it in an independent review report and for no other purpose. To the fullest extent permitted by law, wedo not accept or assume responsibility to anyone other than the company, for our review work, for this report, or for theconclusions we have formed. Deloitte LLPStatutory AuditorLondon, United Kingdom28 July 2021
Glossary
Adjusted EBITDAEarnings before interest, tax, depreciation, amortisation excluding the impact of exceptional items and certainremeasurements. Adjusted EBITDA is typically stated as the combined value from both continuing and discontinuedoperations. Adjusted EBITDA only includes the proportion of the results of non-wholly owned subsidiaries that isattributable to Drax. Adjusted EBITDA excludes the results of any associates.Adjusted ResultsFinancial performance measures prefixed with "Adjusted" are stated after adjusting for material, one-off exceptional items(such as asset obsolescence charges, acquisition and restructuring costs or debt restructuring costs), and certainremeasurements on derivative contracts.
Ancillary servicesServices provided to National Grid used for balancing supply and demand or maintaining secure electricity supplies withinacceptable limits, for example Black Start contracts. They are described in Connection Condition 8 of the Grid Code.AvailabilityAverage percentage of time the units were available for generation.BECCSBioenergy with carbon capture and storage, with carbon resulting from power generation captured and stored.BEISThe Government Department for Business, Energy and Industrial Strategy, bringing together the responsibilities forbusiness, industrial strategy, science, innovation, energy and climate change (formerly DECC).BiomassOrganic material of non-fossil origin, including organic waste, that can be converted into bioenergy through combustion.Drax uses woody biomass from low grade wood, sawmill residues and forest residues, in the form of compressed woodpellets, to generate electricity at Drax Power Station.Black startProcedure used to restore power in the event of a total or partial shutdown of the national electricity transmission system.C$Canadian dollarCADCanadian dollarCapacity marketPart of the Government's Electricity Market Reform, the Capacity Market is intended to ensure security of electricitysupply by providing a payment for reliable sources of capacity.Carbon price supportA tax upon fossil fuel (including coal) used to generate electricity. It is charged as a levy on coal delivered to the powerstation.
28/07/2021 announcement2210124.html
file:///C:/Users/fensomb/AppData/Local/Microsoft/Windows/INetCache/IE/ITFHD74A/announcement2210124.html 48/49
CCCThe UK's Climate Change Committee.Combined Cycle Gas Turbines (CCGT)A form of highly efficient energy generation technology that combines a gas-fired turbine with a steam turbine.Contracts for difference (CfD)A mechanism to support investment in low-carbon electricity generation. The CfD works by stabilising revenues forgenerators at a fixed price level known as the 'strike price'. Generators will receive revenue from selling their electricityinto the market as usual. However, when the market reference price is below the strike price, they will also receive a top-up payment from suppliers for the additional amount. Conversely, if the reference price is above the strike price, thegenerator must pay back the difference.Enterprise valueEnterprise value is a measure of a company's total value. It is calculated by summing the market capitalisation of thecompany, equal to the current stock price multiplied by the number of outstanding stock shares, plus total debt, both shortterm and long term. Any cash and cash equivalents is then deducted from this to give the final enterprise value.ESGEnvironmental, social and governance.EU ETSThe EU Emissions Trading System is a mechanism introduced across the EU to reduce emissions of CO2; the scheme iscapable of being extended to cover all greenhouse gas emissions.EUREuroForced outageAny reduction in plant availability, excluding planned outages.Frequency responseThe automatic change in generation output, or in demand, to maintain a system frequency of 50Hz.Grid chargesIncludes transmission network use of system charges (TNUoS), balancing services use of system charges (BSUoS) anddistribution use of system charges (DUoS).Headroom and footroomPositive 'reserve' (see below) may be termed headroom and negative reserve as footroom.IFRSsInternational Financial Reporting Standards.InertiaThe stored energy in the large rotating mass of a generator, which assists in maintaining system stability. Wind and solarpower sources have no inertia.
Lost time incident rate (LTIR)The frequency rate is calculated on the following basis: (fatalities and lost time injuries)/hours worked × 100,000. Losttime injuries are defined as occurrences where the injured party is absent from work for more than 24 hours.Net debtComprises cash and cash equivalents, short-term investments less overdrafts and borrowings net of deferred financecosts.Net debt to Adjusted EBITDA ratioThe value of Net debt divided by Adjusted EBITDA (both as defined above), expressed as the number of times the valueof Net debt exceeds the value of Adjusted EBITDA. The Group has a long-term target of 2.0x Net debt to AdjustedEBITDA.NGONon-governmental organisationOpen Cycle Gas Turbine (OCGT)A free-standing gas turbine, using compressed air, to generate electricity.
Planned outageA period during which scheduled maintenance is executed according to the plan set at the outset of the year.ReserveGeneration or demand available to be dispatched by the System Operator to correct a generation/demand imbalance,normally at two or more minutes' notice.ResponseAutomatic change in generator output aimed at maintaining a system frequency of 50Hz. Frequency response is requiredin every second of the day.RIDDORSReporting of Injuries, Diseases and Dangerous Occurrences Regulations.ROCsA Renewable Obligation Certificate ("ROC") is a certificate issued to an accredited generator for electricity generatedfrom eligible renewable sources. The Renewable Obligation (RO) is currently the main support scheme for renewableelectricity projects in the UK.
SummerThe calendar months April to September.System operatorNational Grid Electricity Transmission. Responsible for the coordination of electricity flows onto and over the transmissionsystem, balancing generation supply and user demand.
28/07/2021 announcement2210124.html
file:///C:/Users/fensomb/AppData/Local/Microsoft/Windows/INetCache/IE/ITFHD74A/announcement2210124.html 49/49
Total recordable incident rate (TRIR)The frequency rate is calculated on the following basis: (fatalities, lost time injuries + worse than first aid injuries)/hoursworked × 100,000.Total ResultsFinancial performance measures prefixed with 'Total' are calculated in accordance with IFRS.US$US dollarUSDUS dollarValue from FlexibilityA measure of the value from flexible power generation, support services provided to the power network and attractivelypriced coal fuels.Voltage control/reactive powerMaintenance of voltage within specified limits in order to 'push' power around the system to maintain safety and stability.
WinterThe calendar months October to March. Drax Group plc
Drax Power Station Selby
North Yorkshire YO8 8PHTelephone: +44 (0)1757 618381
Fax: +44 (0)1757 612192www.drax.com
[1] Sterling exchange rate based on rates prevailing at the date of the acquisition.This information is provided by RNS, the news service of the London Stock Exchange. RNS is approved by the Financial ConductAuthority to act as a Primary Information Provider in the United Kingdom. Terms and conditions relating to the use and distribution of thisinformation may apply. For further information, please contact [email protected] or visit www.rns.com.
RNS may use your IP address to confirm compliance with the terms and conditions, to analyse how you engage with the informationcontained in this communication, and to share such analysis on an anonymised basis with others as part of our commercial services. Forfurther information about how RNS and the London Stock Exchange use the personal data you provide us, please see our Privacy Policy. END