risks of complications by attending physicians after performing nighttime procedures
TRANSCRIPT

Evidence Based Reviews in Surgery a joint program of
Canadian Association of General Surgeons L’Association Canadienne des Chirurgiens Généraux
& American College of Surgeons
Package #4
Articles for Review: 1. Rothschild JM, Keohane CA, Rogers S, et al. Risks of complications by attending physicians
after performing nighttime procedures. JAMA 2009;302(14):1565-72 2. Rochon PA, Gurwitz JH, Sykora K et al. Reader’s guide to critical appraisal of cohort
studies: 1. Role and design. BMJ 2005;330:895-897 3. Mamdani M, Sykora K, Li P et al. Reader’s guide to critical appraisal of cohort studies: 2.
Assessing potential for confounding. BMJ 2005;330:960-2 4. Normand SLT, Sykora K, Li P, et al. Reader’s guide to critical appraisal of cohort studies: 3.
Analytical strategies to reduce confounding. BMJ 2005;330:1021-3
Please read the above articles and be prepared to discuss the following: 1. What is the clinical question being addressed? 2. What is the study design? 3. What is the source of data? 4. Are the data accurate and valid? 5. Are the 2 cohorts adequately matched? 6. What outcomes were assessed and are they clinically relevant and sensitive? 7. What are the potential biases? 8. How precise is the estimate of risk? 9. What are the results? 10. Should the results of this study be used to implement etc. or are further studies required? 11. State the conclusion. Have the authors addressed the clinical question posed? 12. Does the evidence support the conclusion?
Evidence Based Reviews in Surgery is supported by an educational grant from:
Division of Education

ORIGINAL CONTRIBUTION
Risks of Complications by Attending PhysiciansAfter Performing Nighttime ProceduresJeffrey M. Rothschild, MD, MPHCarol A. Keohane, BSN, RNSelwyn Rogers, MD, MPHRoxane Gardner, MD, MPHStuart R. Lipsitz, ScDClaudia A. Salzberg, MSTony Yu, MD, MPHCatherine S. Yoon, MSDeborah H. Williams, MHAMatt F. Wien, BSCharles A. Czeisler, PhD, MDDavid W. Bates, MD, MScChristopher P. Landrigan, MD, MPH
INCREASING PUBLIC ATTENTION HAS
been focused on the role of residentphysicians’ fatigue in the occur-rence of medical errors, including
percutaneous needlestick and lacera-tion injuries and postcall motor vehiclecrashes.1-3 Less isknownabout theeffectsof extended-duration work shifts on theperformance of attending physicians.Attendingphysicianswhoperformemer-gency operations or perform deliveriesduring the night often schedule electiveprocedures or deliveries the followingday. It ispossible thatexperiencedattend-ing physicians may be better able to copewith the effects of sleep deprivation thanresidents.Furthermore, thesurgicalenvi-ronment differs sufficiently from othermedical environments so findings frommedical settings may not be directlyapplicable.4 To date, little research eithersupports or refutes these hypotheses.5
In2003, theAccreditationCouncil forGraduate Medical Education imple-mented resident physicians work hourlimits of 30 consecutive work hours and80 weekly hours.6 Unlike residents, theworkhoursofattendingphysiciansintheUnited States are not restricted. Little isknownaboutthefrequencyofelectivesur-
gicalandobstetrical/gynecologic(ob-gyn)proceduresbyattendingphysicianswhoparticipate inemergencyprocedures thenightbefore.Evenlessisknownabouttherisksofcomplicationsduring thesepost-nighttimeprocedures.Wethereforecon-ducted a study to address these gaps inknowledge.
METHODSThestudyhospitalwasa745-bedurban,tertiarycareacademic traumacenterandreferralcenterforhigh-riskobstetricalpro-cedures.Proceduresconducted ineithertheoperating roomor laboranddeliverysuite(L/D)betweenJanuary2000andDe-cember 2007 were eligible for matching
Author Affiliations: Division of General Medicine andPrimary Care and Departments of Medicine (Drs Roth-schild, Lipsitz, Yu, and Bates; Mss Keohane, Salzberg,Yoon, and Williams; and Mr Wien), Surgery (Dr Rog-ers), Obstetrics and Gynecology (Dr Gardner), Divisionof Sleep Medicine, Department of Medicine (Drs Czeislerand Landrigan), Brigham and Women’s Hospital; Har-vard Medical School (Drs Rothschild, Rogers, Gardner,
Czeisler, Bates, and Landrigan); Harvard School of Pub-lic Health (Dr Lipsitz); Division of General Pediatrics, De-partment of Medicine, Children’s Hospital Boston (DrLandrigan), Boston, Massachusetts.Corresponding Author: Jeffrey M. Rothschild, MD,MPH, Division of General Medicine, Brigham andWomen’s Hospital,1620 Tremont St, Boston, MA02120-1613 ([email protected]).
Context Few data exist on the relationships between experienced physicians’ workhours and sleep, and patient safety.
Objective To determine if sleep opportunities for attending surgeons and obstetricians/gynecologists are associated with the risk of complications.
Design, Setting, and Patients Matched retrospective cohort study of proceduresperformed from January 1999 through June 2008 by attending physicians (86 surgeonsand 134 obstetricians/gynecologists) who had been in the hospital performing anotherprocedure involving adult patients for at least part of the preceding night(12 AM-6 AM, postnighttime procedures). Sleep opportunity was calculated as the timebetween end of the overnight procedure and start of the first procedure the followingday. Matched control procedures included as many as 5 procedures of the same typeperformed by the same physician on days without preceding overnight procedures. Com-plications were identified and classified by a blinded 3-step process that included admin-istrative screening, medical record reviews, and clinician ratings.
Main Outcome Measures Rates of complications in postnighttime procedures ascompared with controls; rates of complications in postnighttime procedures amongphysicians with more than 6-hour sleep opportunities vs those with sleep opportuni-ties of 6 hours or less.
Results Atotal of919surgical and957obstetrical postnighttimeprocedureswerematchedwith 3552 and 3945 control procedures, respectively. Complications occurred in 101 post-nighttime procedures (5.4%) and 365 control procedures (4.9%) (odds ratio, 1.09; 95%confidence interval [CI], 0.84-1.41). Complications occurred in 82 of 1317 postnight-time procedures with sleep opportunities of 6 hours or less (6.2%) vs 19 of 559 post-nighttime procedures with sleep opportunities of more than 6 hours (3.4%) (odds ratio,1.72; 95% CI, 1.02-2.89). Postnighttime procedures completed after working more thanthan 12 hours (n=958) compared with 12 hours or less (n=918) had nonsignificantlyhigher complication rates (6.5% vs 4.3%; odds ratio, 1.47; 95% CI, 0.96-2.27).
Conclusion Overall, procedures performed the day after attending physicians workedovernight were not associated with significantly increased complication rates, al-though there was an increased rate of complications among postnighttime surgicalprocedures performed by physicians with sleep opportunities of less than 6 hours.JAMA. 2009;302(14):1565-1572 www.jama.com
©2009 American Medical Association. All rights reserved. (Reprinted) JAMA, October 14, 2009—Vol 302, No. 14 1565
at University of Calgary on 2 January 2011jama.ama-assn.orgDownloaded from
withcontrolproceduresof thesametypethat were completed between January1999 and June 2008. Most surgical pro-cedures includeda residentphysicianorotherassistant.Thehumanresearchcom-mittee approved the study.
Overall Study Design
We conducted a matched retrospectivecohort study in which we identified allattending surgeons and obstetricians/gynecologists who were involved in over-night and early morning emergency op-
erating room and L/D procedures priorto a daytime procedure. We matchedthese daytime procedures (postnight-time procedures) that followed over-night emergency procedures performedby the same attending physician at somepoint between midnight and 6 AM (over-night index procedures) with daytimeprocedures (control procedures) that didnot follow overnight procedures. Eachpostnighttimeprocedurewasmatchedbyphysician with as many as 5 of his or hermost contemporaneous control proce-
dures of the same or similar type. Post-nighttime procedures without at least 1matched control were excluded fromanalysis. Because of the lower compli-cation rate in spontaneous vaginal de-liveries,7 we enriched the daytime casesampling with cesarean deliveries.
Outcomes and Predictors of Interest
The primary outcomes were the pres-ence of surgical and ob-gyn proceduralcomplications, defined as adverse eventsoccurring as a result of care during anoperation or delivery and likely attrib-utable to the performance of the attend-ing surgeon or obstetrician/gynecolo-gist. Preventable complications werecomplications judged to have likely beendue to a surgical error. We excluded thefollowing: adverse outcomes likely dueto the patient’s condition (eg, septicshock during repair of infarcted bowel);adverse events judged unlikely to be as-sociated with the attending surgeon orobstetrician/gynecologist (eg, anesthetic-induced hypotension); and adverseevents of unclear relationship to intra-operative care (eg, pulmonary embolus).
Surgical complications included in-fection, massive hemorrhage, organ in-jury, wound failure, and other compli-cations such as failed procedures.Additional obstetrical/peripartum com-plications includedgreater than1000-mLblood loss, stillbirth, umbilical cord pro-lapse, shoulder dystocia, birth trauma,and fourth-degree perineal tear.8,9
Start and end times (procedure dura-tion) were the time of initial skin inci-sion to surgery end, and for vaginal de-liveries were the beginning of the secondstage of labor to the end of the third stage.Procedure duration did not include es-timatesof timespentwith thepatientpre-operatively and postoperatively.
We assessed 2 additional predictorsof fatigue in postnighttime proce-dures.10 Sleep opportunity was de-fined as the time period between the endof the last overnight index procedureand the beginning of the first daytimepostnighttime procedure. For analy-sis, we dichotomized sleep opportu-nity to 0 to 6 hours vs greater than 6hours. The work duration for each post-
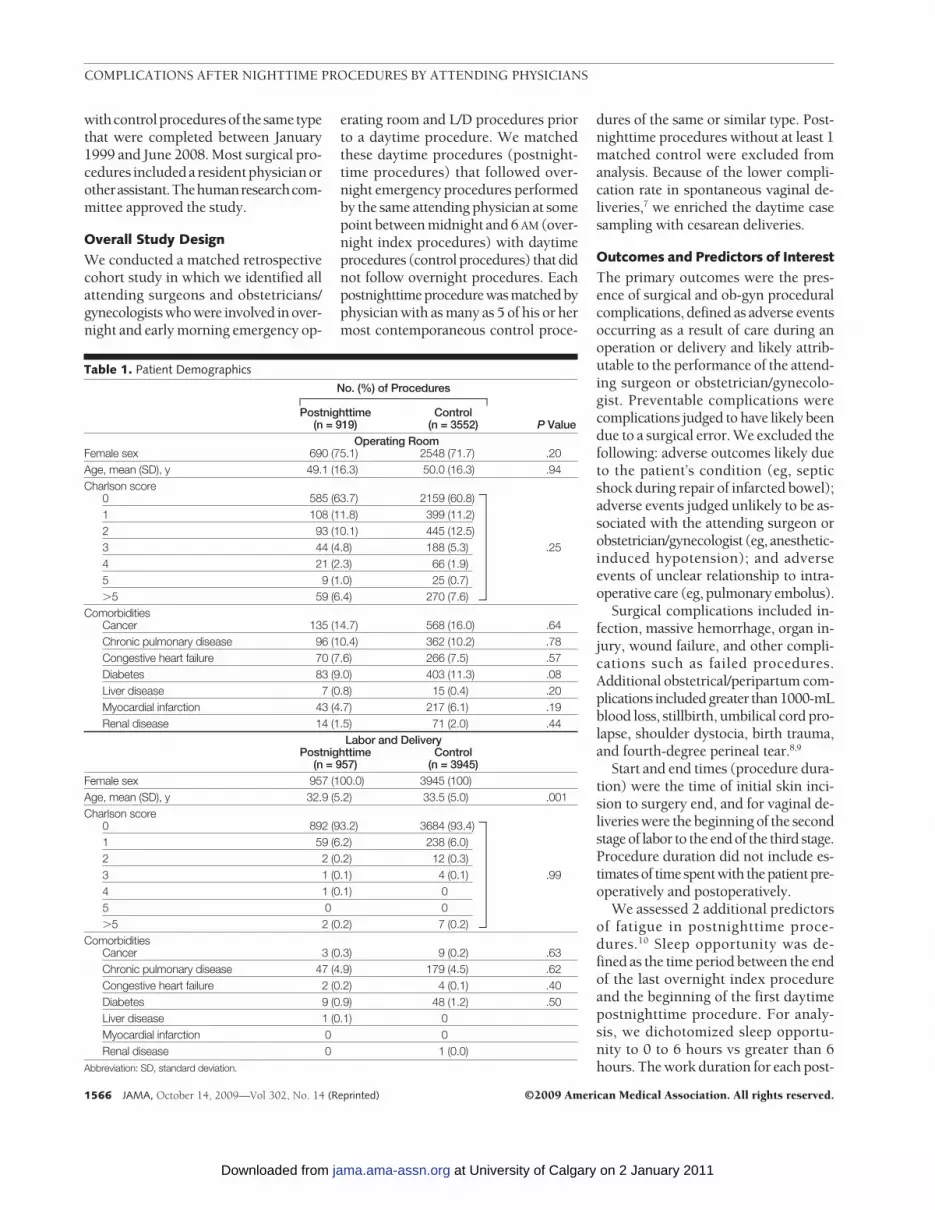
Table 1. Patient Demographics
No. (%) of Procedures
P ValuePostnighttime
(n = 919)Control
(n = 3552)Operating Room
Female sex 690 (75.1) 2548 (71.7) .20Age, mean (SD), y 49.1 (16.3) 50.0 (16.3) .94Charlson score
0 585 (63.7) 2159 (60.8)1 108 (11.8) 399 (11.2)2 93 (10.1) 445 (12.5)3 44 (4.8) 188 (5.3) .254 21 (2.3) 66 (1.9)5 9 (1.0) 25 (0.7)�5 59 (6.4) 270 (7.6)
ComorbiditiesCancer 135 (14.7) 568 (16.0) .64Chronic pulmonary disease 96 (10.4) 362 (10.2) .78Congestive heart failure 70 (7.6) 266 (7.5) .57Diabetes 83 (9.0) 403 (11.3) .08Liver disease 7 (0.8) 15 (0.4) .20Myocardial infarction 43 (4.7) 217 (6.1) .19Renal disease 14 (1.5) 71 (2.0) .44
Labor and DeliveryPostnighttime
(n = 957)Control
(n = 3945)Female sex 957 (100.0) 3945 (100)Age, mean (SD), y 32.9 (5.2) 33.5 (5.0) .001Charlson score
0 892 (93.2) 3684 (93.4)1 59 (6.2) 238 (6.0)2 2 (0.2) 12 (0.3)3 1 (0.1) 4 (0.1) .994 1 (0.1) 05 0 0�5 2 (0.2) 7 (0.2)
ComorbiditiesCancer 3 (0.3) 9 (0.2) .63Chronic pulmonary disease 47 (4.9) 179 (4.5) .62Congestive heart failure 2 (0.2) 4 (0.1) .40Diabetes 9 (0.9) 48 (1.2) .50Liver disease 1 (0.1) 0Myocardial infarction 0 0Renal disease 0 1 (0.0)
Abbreviation: SD, standard deviation.
COMPLICATIONS AFTER NIGHTTIME PROCEDURES BY ATTENDING PHYSICIANS
1566 JAMA, October 14, 2009—Vol 302, No. 14 (Reprinted) ©2009 American Medical Association. All rights reserved.
at University of Calgary on 2 January 2011jama.ama-assn.orgDownloaded from
nighttime procedure was the time fromthe start of the first overnight index pro-cedure to the end of each postnight-time procedure. Consecutive postnight-time procedures accrued unique andincreasingly longer work durations. Foranalysis, work duration was dichoto-mized into a 0- to 12-hour category vsa greater than 12-hour one.
Physician age, experience as mea-sured by postgraduate years, sex, andspecialty were collected, as were pa-tient age, sex, primary diagnosis, comor-bidities, Charlson score, and dischargedisposition.Proceduredata includedout-patient or inpatient status, location ofprocedure in the operating room or L/D,number of procedures performed by theattending physician, and type of proce-dure by organ system.
Procedure Matching
We matched postnighttime procedureswithsameorsimilarcontrolsbythesameattendingphysicianwithin12monthsforsurgicalproceduresandwithin6monthsfor ob-gyn procedures. We matched asmanyas5controlsforeachpostnighttimeprocedure preferentially using the sameInternational Classification of Diseases,Ninth Revision (ICD-9) procedure code,and if necessary, allowed matches of 1higher coding level (ie, of slightly lesserspecificity).Potentialcontrolprocedureswereexcluded frommatching if theyoc-curredonthesamedayor1dayafter anypostnighttime case. Control cases couldbe used only once for matching.
ComplicationScreeningandEvaluation
We electronically screened for compli-cations using ICD-9-Clinical Modifica-tion (CM) periprocedural surgical andob-gyn complications codes in theAgency for Healthcare Research andQuality Guide to Patient Safety Indica-tors11 and the Complications ScreeningProgram.12 We also used a previouslyvalidated set of administrative adverseevent screens including 30-day readmis-sions.13 We created data warehousequeries using the Obstetrics AdverseOutcome Index14 to capture additionalobstetrical complications including trans-fusion during delivery.
Following administrative screening,we used a 2-tiered approach for identi-fyingproceduralcomplications.15 Admin-istrative screen-positive proceduresunderwent medical record review by 2trained data abstractors. Interrater reli-ability testingwasconductedprior todatacollection. Abstracted cases with sus-pected complications were indepen-dently evaluated by clinician pairs withexperience inratingcomplications.Com-plications were judged on the likeli-hood of preventability and severity ofinjury using a previously developed rat-ing system.16 Disagreements wereresolved by consensus. Chart abstrac-torsandclinicianreviewerswereblindedto whether incidents occurred duringpostnighttime or matched control pro-cedures, overnight sleep opportunities,and shift durations.
Statistical Analysis
In analyses relating procedure type(postnighttime or control) with othervariables, generalized linear mixedmodels were used to account for the
clustering of patients within attend-ing physicians and within matchedsets.17,18 We reported means and pro-portions of the baseline characteris-tics and used generalized linear mixedmodels and Wald P values for differ-ences between postnighttime and con-trol procedures. We initially com-pared differences in outcomes usinggeneralized linear mixed models oddsratios (ORs), P values, and 95% confi-dence intervals (CIs) without adjust-ing for any confounders (but account-ing for clustering), and then usedgeneralized linear mixed models tocompute multivariable-adjusted ORsbetween outcomes and procedure typeand 95% CIs. We also conducted analy-ses comparing complication rates ofpostnighttime procedures in which at-tending physicians had 0 to 6 hours ofsleep vs greater than 6-hour sleep op-portunities and work duration was 0 to12 hours vs greater than 12 hours.
A priori confounders included age, co-morbidities, and sex for operating roomprocedures. Clustering is incorporated
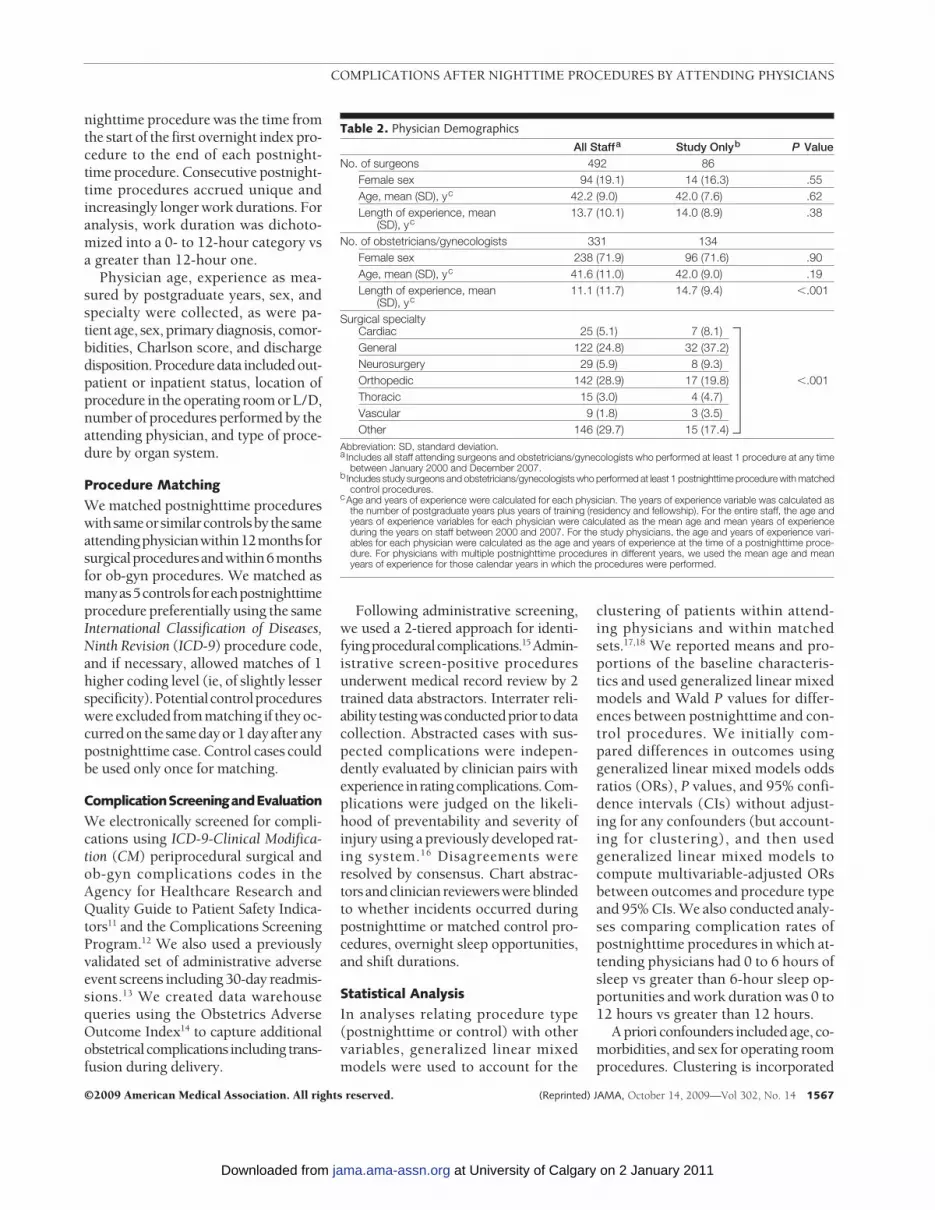
Table 2. Physician Demographics
All Staffa Study Onlyb P ValueNo. of surgeons 492 86
Female sex 94 (19.1) 14 (16.3) .55Age, mean (SD), yc 42.2 (9.0) 42.0 (7.6) .62Length of experience, mean
(SD), yc13.7 (10.1) 14.0 (8.9) .38
No. of obstetricians/gynecologists 331 134Female sex 238 (71.9) 96 (71.6) .90Age, mean (SD), yc 41.6 (11.0) 42.0 (9.0) .19Length of experience, mean
(SD), yc11.1 (11.7) 14.7 (9.4) �.001
Surgical specialtyCardiac 25 (5.1) 7 (8.1)General 122 (24.8) 32 (37.2)Neurosurgery 29 (5.9) 8 (9.3)Orthopedic 142 (28.9) 17 (19.8) �.001Thoracic 15 (3.0) 4 (4.7)Vascular 9 (1.8) 3 (3.5)Other 146 (29.7) 15 (17.4)
Abbreviation: SD, standard deviation.a Includes all staff attending surgeons and obstetricians/gynecologists who performed at least 1 procedure at any time
between January 2000 and December 2007.bIncludes study surgeons and obstetricians/gynecologists who performed at least 1 postnighttime procedure with matched
control procedures.cAge and years of experience were calculated for each physician. The years of experience variable was calculated as
the number of postgraduate years plus years of training (residency and fellowship). For the entire staff, the age andyears of experience variables for each physician were calculated as the mean age and mean years of experienceduring the years on staff between 2000 and 2007. For the study physicians, the age and years of experience vari-ables for each physician were calculated as the age and years of experience at the time of a postnighttime proce-dure. For physicians with multiple postnighttime procedures in different years, we used the mean age and meanyears of experience for those calendar years in which the procedures were performed.
COMPLICATIONS AFTER NIGHTTIME PROCEDURES BY ATTENDING PHYSICIANS
©2009 American Medical Association. All rights reserved. (Reprinted) JAMA, October 14, 2009—Vol 302, No. 14 1567
at University of Calgary on 2 January 2011jama.ama-assn.orgDownloaded from

in generalized linear mixed models suchthat we did not need to adjust for match-ing factors. Any covariate was kept in amultivariable model if it led to a 10%change in the OR estimate between out-come and procedure type.
For complication ratings among re-viewers, the k coefficient was used to as-sess interrater reliability. All analyseswere conducted using Proc Glimmix orProc Freq in SAS version 9.2, (SAS In-stitute Inc, Cary, North Carolina). All
tests were 2-tailed, and a P value of lessthen .05was considered significant. Sincetesting for the association of complica-tions with procedure type, sleep oppor-tunity, and work duration were planneda priori, we have not adjusted the type1 error to account for multiple compari-sons; thus, the P values should be inter-preted cautiously.
This studyhad80%power(�=5%)todetectadecrease inthecomplicationratefrom 4% in postnighttime procedures to
2.65% in control procedures using thegeneralizedlinearmixedmodelsWaldtest.With the observed complication rate of5.4%inpostnighttimeprocedures,wehad80% power to detect a decrease to 3.8%.
RESULTSProcedure and PhysicianCharacteristics
A total of 217 953 operating room and69 509 L/D procedures were performedduring the study period. We identified4059 operating room index procedures(1.9%) and 17 886 L/D ones (25.7%) thatended or started between 12 AM and6 AM (eFigure, available at http://www.jama.com). There were 1135 operat-ing room and 2945 L/D procedures per-formed by the same physician on thesame day as the index procedure. Wewere able to match 919 postnighttimeoperating room procedures (81%) and957 postnighttime L/D procedures(32.5%) to at least 1 control. We matchedan average of 3.9 operating room con-trol procedures with each postnight-time one (n=3552) and 4.1 L/D controlprocedures with each postnighttime one(n=3945). There were no differences be-tween patients who underwent controland postnighttime procedures exceptthat control ob-gyn patients were slightlyolder than postnighttime ones (TABLE 1).
Physiciancharacteristicsareprovidedin TABLE 2 for the 86 surgeons (17.5%)and 134 obstetricians/gynecologists(40.5%) who performed postnighttimeand matched control procedures. Themean and median number of postnight-time and control procedures per physi-cian are provided in TABLE 3. The mostcommonoperatingroomproceduresweregynecologic,digestive, andcardiovascu-lar cases.
Procedural Complications inPostnighttimeandControlProcedures
Results of the electronic administrativescreens and medical record reviews areprovided in theeFigure (availableathttp://www.jama.com). Clinician reviews de-termined that there were complicationsin 68 postnighttime operating room pro-cedures (7.4%) and 253 operating roomcontrol procedures (7.1%) (OR of a post-
Table 3. Procedure Types and Frequency per Physician and by Specialty
No. (%) of Procedures
Postnighttime Control
Labor and delivery procedure (n = 957) (n = 3945)
Cesarean delivery 880 (92.0) 3867 (98.0)Repair of obstetric laceration 53 (5.5) 52 (1.3)Spontaneous vaginal delivery 20 (2.1) 21 (0.5)Vacuum or forceps-assisted delivery 4 (0.4) 5 (0.1)
Operating room procedure by schedule (n = 919) (n = 3552)
Elective, previously scheduled 678 (73.8) 2830 (79.7)Outpatient 426 (46.4) 1567 (44.1)Emergency 138 (15) 392 (11)Elective, add-on same day 103 (11.2) 330 (9.3)
Operating room procedure by typeFemale genital organs 419 (45.6) 1443 (43.0)
Other incision/excision of uterus 211 (23.0) 812 (24.2)Other uterus and supporting structures 72 (7.8) 226 (6.7)Ovary 47 (5.1) 136 (4.1)Fallopian tubes 39 (4.2) 112 (3.3)Cervix 32 (3.5) 112 (3.3)Other genital organ 18 (2.0) 45 (1.3)
Digestive system 205 (22.3) 832 (24.8)Stomach 20 (2.2) 87 (2.6)Intestine incision/excision and anastomosis 29 (3.2) 124 (3.7)Gallbladder and biliary tree 46 (5.0) 211 (6.3)Hernia repair 30 (3.3) 139 (4.1)Other 80 (8.7) 271 (8.1)
Cardiovascular system 93 (10.1) 424 (12.7)Valve 24 (2.6) 119 (3.6)Coronary artery 39 (4.2) 180 (5.4)Other 30 (3.3) 125 (3.8)
Musculoskeletal system 53 (5.8) 208 (6.2)Skin/subcutaneous (includes implantable vascular access) 52 (5.7) 241 (7.2)Central nervous system 28 (3.0) 116 (3.5)Respiratory system 26 (2.8) 104 (3.1)Other 20 (2.2) 72 (2.1)Urinary system 14 (1.5) 67 (2.0)Breast 9 (1.0) 45 (1.3)
Procedures per physician by specialtySurgeons (n = 86)
Mean (median) [range] 6.1 (4) [1-39] 25.9 (15) [1-181]Obstetricians/gynecologists (n = 134)
Mean (median) [range] 10.1 (4) [1-104] 39.3 (15) [1-415]Abbreviation: SD, standard deviation.
COMPLICATIONS AFTER NIGHTTIME PROCEDURES BY ATTENDING PHYSICIANS
1568 JAMA, October 14, 2009—Vol 302, No. 14 (Reprinted) ©2009 American Medical Association. All rights reserved.
at University of Calgary on 2 January 2011jama.ama-assn.orgDownloaded from
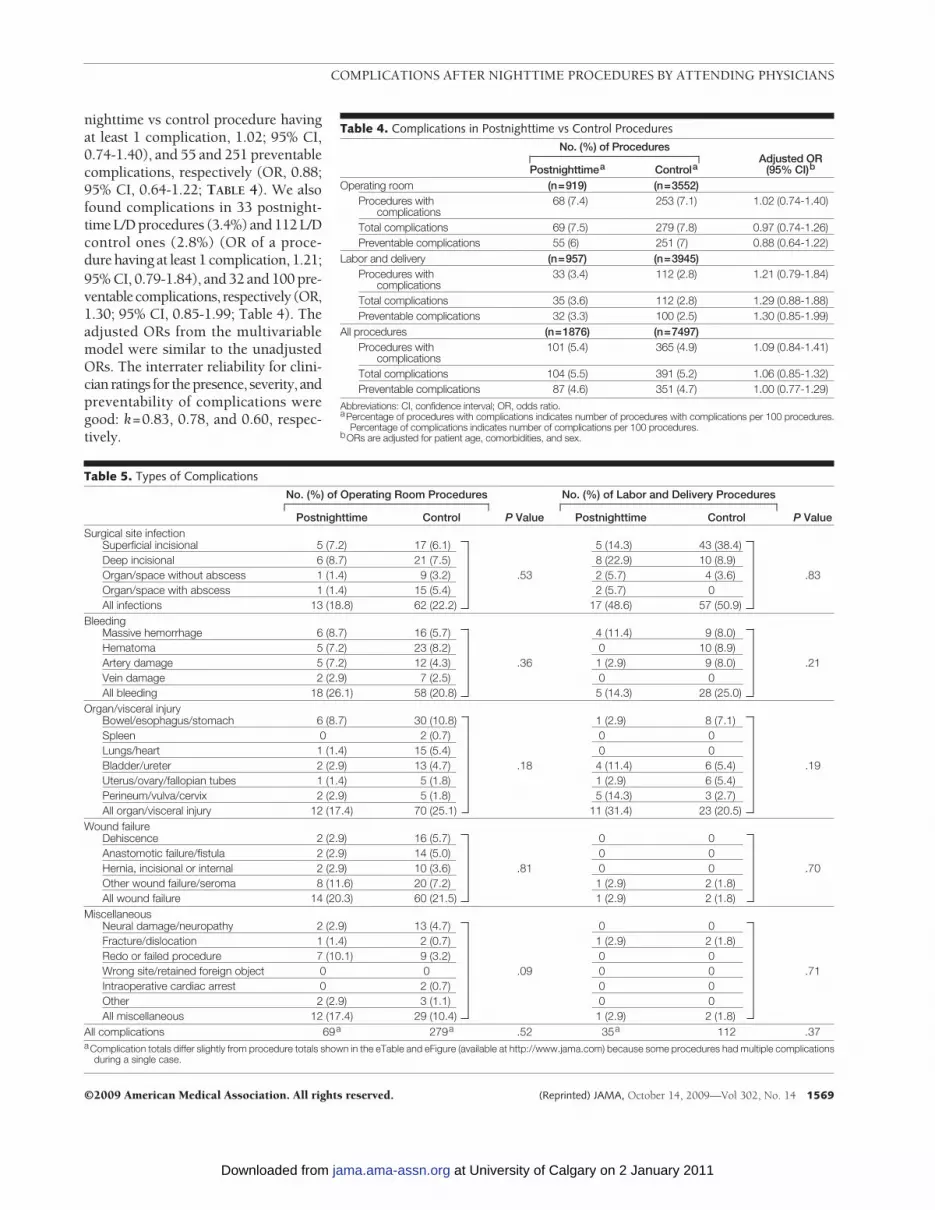
nighttime vs control procedure havingat least 1 complication, 1.02; 95% CI,0.74-1.40), and 55 and 251 preventablecomplications, respectively (OR, 0.88;95% CI, 0.64-1.22; TABLE 4). We alsofound complications in 33 postnight-time L/D procedures (3.4%) and 112 L/Dcontrol ones (2.8%) (OR of a proce-dure having at least 1 complication, 1.21;95% CI, 0.79-1.84), and 32 and 100 pre-ventablecomplications, respectively (OR,1.30; 95% CI, 0.85-1.99; Table 4). Theadjusted ORs from the multivariablemodel were similar to the unadjustedORs. The interrater reliability for clini-cian ratings for thepresence, severity, andpreventability of complications weregood: k=0.83, 0.78, and 0.60, respec-tively.
Table 4. Complications in Postnighttime vs Control ProceduresNo. (%) of Procedures
Adjusted OR(95% CI)bPostnighttimea Controla
Operating room (n=919) (n=3552)Procedures with
complications68 (7.4) 253 (7.1) 1.02 (0.74-1.40)
Total complications 69 (7.5) 279 (7.8) 0.97 (0.74-1.26)Preventable complications 55 (6) 251 (7) 0.88 (0.64-1.22)
Labor and delivery (n=957) (n=3945)Procedures with
complications33 (3.4) 112 (2.8) 1.21 (0.79-1.84)
Total complications 35 (3.6) 112 (2.8) 1.29 (0.88-1.88)Preventable complications 32 (3.3) 100 (2.5) 1.30 (0.85-1.99)
All procedures (n=1876) (n=7497)Procedures with
complications101 (5.4) 365 (4.9) 1.09 (0.84-1.41)
Total complications 104 (5.5) 391 (5.2) 1.06 (0.85-1.32)Preventable complications 87 (4.6) 351 (4.7) 1.00 (0.77-1.29)
Abbreviations: CI, confidence interval; OR, odds ratio.aPercentage of procedures with complications indicates number of procedures with complications per 100 procedures.
Percentage of complications indicates number of complications per 100 procedures.bORs are adjusted for patient age, comorbidities, and sex.
Table 5. Types of ComplicationsNo. (%) of Operating Room Procedures
P Value
No. (%) of Labor and Delivery Procedures
P ValuePostnighttime Control Postnighttime ControlSurgical site infection
Superficial incisional 5 (7.2) 17 (6.1) 5 (14.3) 43 (38.4)Deep incisional 6 (8.7) 21 (7.5) 8 (22.9) 10 (8.9)Organ/space without abscess 1 (1.4) 9 (3.2) .53 2 (5.7) 4 (3.6) .83Organ/space with abscess 1 (1.4) 15 (5.4) 2 (5.7) 0All infections 13 (18.8) 62 (22.2) 17 (48.6) 57 (50.9)
BleedingMassive hemorrhage 6 (8.7) 16 (5.7) 4 (11.4) 9 (8.0)Hematoma 5 (7.2) 23 (8.2) 0 10 (8.9)Artery damage 5 (7.2) 12 (4.3) .36 1 (2.9) 9 (8.0) .21Vein damage 2 (2.9) 7 (2.5) 0 0All bleeding 18 (26.1) 58 (20.8) 5 (14.3) 28 (25.0)
Organ/visceral injuryBowel/esophagus/stomach 6 (8.7) 30 (10.8) 1 (2.9) 8 (7.1)Spleen 0 2 (0.7) 0 0Lungs/heart 1 (1.4) 15 (5.4) 0 0Bladder/ureter 2 (2.9) 13 (4.7) .18 4 (11.4) 6 (5.4) .19Uterus/ovary/fallopian tubes 1 (1.4) 5 (1.8) 1 (2.9) 6 (5.4)Perineum/vulva/cervix 2 (2.9) 5 (1.8) 5 (14.3) 3 (2.7)All organ/visceral injury 12 (17.4) 70 (25.1) 11 (31.4) 23 (20.5)
Wound failureDehiscence 2 (2.9) 16 (5.7) 0 0Anastomotic failure/fistula 2 (2.9) 14 (5.0) 0 0Hernia, incisional or internal 2 (2.9) 10 (3.6) .81 0 0 .70Other wound failure/seroma 8 (11.6) 20 (7.2) 1 (2.9) 2 (1.8)All wound failure 14 (20.3) 60 (21.5) 1 (2.9) 2 (1.8)
MiscellaneousNeural damage/neuropathy 2 (2.9) 13 (4.7) 0 0Fracture/dislocation 1 (1.4) 2 (0.7) 1 (2.9) 2 (1.8)Redo or failed procedure 7 (10.1) 9 (3.2) 0 0Wrong site/retained foreign object 0 0 .09 0 0 .71Intraoperative cardiac arrest 0 2 (0.7) 0 0Other 2 (2.9) 3 (1.1) 0 0All miscellaneous 12 (17.4) 29 (10.4) 1 (2.9) 2 (1.8)
All complications 69a 279a .52 35a 112 .37aComplication totals differ slightly from procedure totals shown in the eTable and eFigure (available at http://www.jama.com) because some procedures had multiple complications
during a single case.
COMPLICATIONS AFTER NIGHTTIME PROCEDURES BY ATTENDING PHYSICIANS
©2009 American Medical Association. All rights reserved. (Reprinted) JAMA, October 14, 2009—Vol 302, No. 14 1569
at University of Calgary on 2 January 2011jama.ama-assn.orgDownloaded from
The severity of complications asso-ciated with the postnighttime and con-trol operating room procedures wasjudged as follows: unable to deter-mine or insignificant, 0 and 3 (1.1%);significant, 25 (36.2%) and 112(40.2%); serious, 42 (60.9%) and 144(51.7%); life-threatening, 2 (2.9%) and13 (4.7%); and fatal, 0 and 7 (2.5%),respectively (P=.84).
The severity of complications asso-ciated with the postnighttime and con-trol L/D procedures was judged asfollows: unable to determine or insig-nificant, 1 (2.9%) and 2 (1.8%); sig-nificant, 25 (71.4%) and 74 (66.1%);serious, 9 (25.7%) and 32 (28.6%); andlife-threatening, 0 and 4 (3.6%), re-spectively (P=.98).
The most common surgical compli-cations were organ injuries and bleed-ing; surgical site infections and organinjury were the most common obstet-rical complications. We did not detecta difference in types of complicationsbetween postnighttime and control pro-cedures (TABLE 5). Complicated post-nighttime and control operating roomprocedures (135 and 129 minutes, re-spectively) were longer than uncom-plicated procedures (64.5 and 66.2 min-utes; eTable, available at http://www.jama.com). Similarly complicated
postnighttime and control L/D proce-dures (71.5 and 60.4 minutes, respec-tively) were longer than uncompli-cated procedures (46.5 and 44.8minutes). The overall duration of post-nighttime L/D procedures (47.2 min-utes) was longer than for control pro-cedures (45.2 minutes; P=.002).
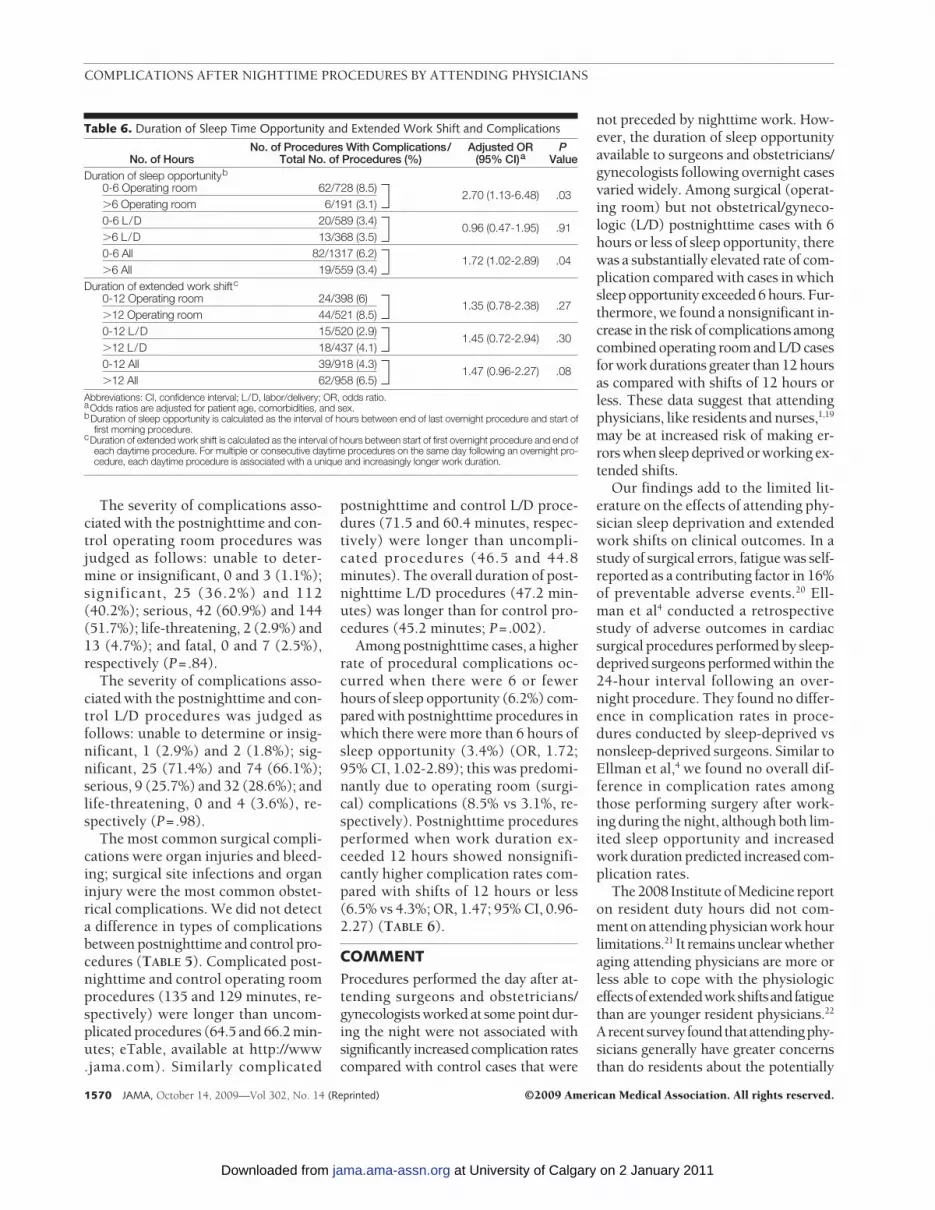
Among postnighttime cases, a higherrate of procedural complications oc-curred when there were 6 or fewerhours of sleep opportunity (6.2%) com-pared with postnighttime procedures inwhich there were more than 6 hours ofsleep opportunity (3.4%) (OR, 1.72;95% CI, 1.02-2.89); this was predomi-nantly due to operating room (surgi-cal) complications (8.5% vs 3.1%, re-spectively). Postnighttime proceduresperformed when work duration ex-ceeded 12 hours showed nonsignifi-cantly higher complication rates com-pared with shifts of 12 hours or less(6.5% vs 4.3%; OR, 1.47; 95% CI, 0.96-2.27) (TABLE 6).
COMMENTProcedures performed the day after at-tending surgeons and obstetricians/gynecologists worked at some point dur-ing the night were not associated withsignificantly increased complication ratescompared with control cases that were
not preceded by nighttime work. How-ever, the duration of sleep opportunityavailable to surgeons and obstetricians/gynecologists following overnight casesvaried widely. Among surgical (operat-ing room) but not obstetrical/gyneco-logic (L/D) postnighttime cases with 6hours or less of sleep opportunity, therewas a substantially elevated rate of com-plication compared with cases in whichsleep opportunity exceeded 6 hours. Fur-thermore, we found a nonsignificant in-crease in the risk of complications amongcombined operating room and L/D casesfor work durations greater than 12 hoursas compared with shifts of 12 hours orless. These data suggest that attendingphysicians, like residents and nurses,1,19
may be at increased risk of making er-rors when sleep deprived or working ex-tended shifts.
Our findings add to the limited lit-erature on the effects of attending phy-sician sleep deprivation and extendedwork shifts on clinical outcomes. In astudy of surgical errors, fatigue was self-reported as a contributing factor in 16%of preventable adverse events.20 Ell-man et al4 conducted a retrospectivestudy of adverse outcomes in cardiacsurgical procedures performed by sleep-deprived surgeons performed within the24-hour interval following an over-night procedure. They found no differ-ence in complication rates in proce-dures conducted by sleep-deprived vsnonsleep-deprived surgeons. Similar toEllman et al,4 we found no overall dif-ference in complication rates amongthose performing surgery after work-ing during the night, although both lim-ited sleep opportunity and increasedwork duration predicted increased com-plication rates.
The 2008 Institute of Medicine reporton resident duty hours did not com-ment on attending physician work hourlimitations.21 It remains unclear whetheraging attending physicians are more orless able to cope with the physiologiceffectsofextendedworkshiftsandfatiguethan are younger resident physicians.22
Arecentsurveyfoundthatattendingphy-sicians generally have greater concernsthan do residents about the potentially
Table 6. Duration of Sleep Time Opportunity and Extended Work Shift and Complications
No. of HoursNo. of Procedures With Complications/
Total No. of Procedures (%)Adjusted OR
(95% CI)aP
ValueDuration of sleep opportunityb
0-6 Operating room 62/728 (8.5)2.70 (1.13-6.48) .03
�6 Operating room 6/191 (3.1)0-6 L/D 20/589 (3.4)
0.96 (0.47-1.95) .91�6 L/D 13/368 (3.5)0-6 All 82/1317 (6.2)
1.72 (1.02-2.89) .04�6 All 19/559 (3.4)
Duration of extended work shiftc
0-12 Operating room 24/398 (6)1.35 (0.78-2.38) .27
�12 Operating room 44/521 (8.5)0-12 L/D 15/520 (2.9)
1.45 (0.72-2.94) .30�12 L/D 18/437 (4.1)0-12 All 39/918 (4.3)
1.47 (0.96-2.27) .08�12 All 62/958 (6.5)
Abbreviations: CI, confidence interval; L/D, labor/delivery; OR, odds ratio.aOdds ratios are adjusted for patient age, comorbidities, and sex.bDuration of sleep opportunity is calculated as the interval of hours between end of last overnight procedure and start of
first morning procedure.cDuration of extended work shift is calculated as the interval of hours between start of first overnight procedure and end of
each daytime procedure. For multiple or consecutive daytime procedures on the same day following an overnight pro-cedure, each daytime procedure is associated with a unique and increasingly longer work duration.
COMPLICATIONS AFTER NIGHTTIME PROCEDURES BY ATTENDING PHYSICIANS
1570 JAMA, October 14, 2009—Vol 302, No. 14 (Reprinted) ©2009 American Medical Association. All rights reserved.
at University of Calgary on 2 January 2011jama.ama-assn.orgDownloaded from
harmful effects of work hour restric-tions for trainees on their professionaldevelopment.23 Attendingphysiciansmaybe less likely to acknowledge the poten-tially harmful effects of extended workshifts than trainees. Someattendingphy-siciansmayalsobe less inclinedthanresi-dents to postpone electively scheduledsurgical procedures even when they areawareof thepossibilityofdecreasedalert-ness from insufficient overnight sleep.
Measures to reduce attending phy-sician extended-duration work shiftshave the potential to influence patientcare. Although our results suggest thatimproving sleep opportunities may im-prove care, work hour restrictions couldalso lead to disruptions in care conti-nuity or delays.24 Continuity of care isnot a major issue, however, when con-sidering appropriate rest periods be-tween the performances of proce-dures on different patients.
There have been no US legislative orprofessional initiatives concerning sleepdeprivation or work hours for attend-ing physicians.25 While noncompli-ance with the Accreditation Council forGraduate Medical Education residentwork hour standards has been prob-lematic,26 attending physician workschedule restrictions would likely beeven more challenging to monitor, en-force, and achieve. European restric-tions on attending and resident physi-cian work schedules have beencomplicated by increased surgical staffrequirements and staff shortages.27
Our data suggest that the business asusual of a “limitless work week” for at-tending physicians is not optimal for pa-tient care.25 Several initiatives couldmitigate the risks of unsafe levels of fa-tigue during procedures. Large physi-cian groups can avoid scheduling elec-tive procedures following overnighton-call responsibilities or use hospital-based clinicians, such as obstetrical “la-borists” and surgical hospitalists, tocover nighttime emergencies.28,29 A cul-ture of teamwork,30 along with criticalredesign of schedules, can mitigate thechance of unduly fatigued attendingphysicians performing procedures.10,31
When possible, adequate backup per-
sonnel should be available to relievephysicians who detect impaired per-formance due to severe fatigue in them-selves and others.32 Better sleep hy-giene or the appropriate use of caffeineas a stimulant should be considered.10
Individuals should be educated aboutthe effects of sleep deprivation on per-formance and how to recognize its ef-fects. While cancellations followingsleep-deprived nights are uncommonand may cause emotional and logisti-cal challenges for patients and staff,33
attending physicians should considercanceling or postponing elective pro-cedures if they are not alert enough tosafely operate. While technologies ex-ist for monitoring alertness during cer-tain tasks such as driving, they have notbeen tested for use as a “fitness for dutytest” in health care or other settings.
Our study has several limitations in-cluding possible unidentified confound-ers or biases not accounted for in a ret-rospective cohort study. Our resultsmight not be generalizable, especially tononteaching hospitals; the presence ofresident physicians may either have com-pensated for the effects of attending phy-sician fatigue or have added to it if theresidents themselves were sleep de-prived. While most of the physicians inour study primarily operated at the studyhospital, we were unable to determineif the rested attending physicians con-ducted overnight emergency proce-dures elsewhere. We were unable to de-termine if additional surgeons andobstetricians/gynecologists were re-quested to assist postnighttime proce-dures. We were also unable to identifyif the physicians who performed con-trolprocedureswereactuallyawakeover-night. Judging the preventability of com-plications may have been affected byreviewers’ hindsight bias.
CONCLUSIONSWe found that the rate of complica-tions for surgeons and obstetricians/gynecologists who performed proce-dures the preceding night in our studyhospital was not higher overall than forthose who did not. Surgeons who hadlimited opportunity for sleep had sig-
nificantly higher rates of complica-tions than those who had a longer sleepopportunity. We did not observe an in-creased rate of complication among ob-stetricians/gynecologists who had lim-ited opportunity for sleep; but given thelower rate of complications in labor anddelivery as compared with surgery,larger studies with increased statisti-cal power will be needed to further ex-plore the effects of sleep deprivation inthis setting.
Prospective studies are needed tomore definitively quantify the effects ofsleep deprivation on attending physi-cians across specialties, and to deter-mine the safety of performing surgeryafter working at night in nonteachingsettings. For situations in which it isnecessary for attending physicians toconduct life-saving procedures follow-ing overnight work, effective strate-gies to minimize the effects of fatigueshould be adopted into practice.Author Contributions: Dr Rothschild had full accessto all of the data in the study and takes responsibilityfor the integrity of the data and the accuracy of thedata analysis.Study concept and design: Rothschild, Keohane, Lipsitz,Czeisler, Bates, Landrigan.Acquisition of data: Rothschild, Keohane, Yoon,Williams, Wien.Analysis and interpretation of data: Rothschild,Keohane, Rogers, Gardner, Lipsitz, Salzberg, Yu, Yoon,Wien, Landrigan.Drafting of the manuscript: Rothschild, Keohane, Wien,Landrigan.Critical revision of the manuscript for important in-tellectual content: Rothschild, Keohane, Rogers,Gardner, Lipsitz, Salzberg, Yu, Yoon, Williams, Czeisler,Bates, Landrigan.Statistical analysis: Rothschild, Lipsitz, Yoon, Wien,Landrigan.Obtained funding: Rothschild.Administrative, technical, or material support:Rothschild, Keohane, Gardner, Salzberg, Yu, Williams,Bates, Landrigan.Study supervision: Rothschild, Keohane, Rogers,Landrigan.Financial Disclosures: Dr Landrigan reports serving asa paid consultant to the District Health Boards of NewZealand, providing recommendation on how to im-prove the scheduling and working conditions for jun-ior doctors in New Zealand; Vital Issues in Medicine,developing an educational course for physicians on ShiftWork Disorder (supported by an unrestricted educa-tional grant from Cephalon Inc to Vital Issues in Medi-cine); and AXDev, to assist in the development of astudy of Shift Work Disorder (supported by an unre-stricted research grant from Cephalon Inc to AXDev).In addition, Dr Landrigan reports receiving monetaryawards, honoraria, and travel reimbursement from mul-tiple academic and professional organizations for de-livering lectures on sleep deprivation and safety. DrCzeisler reports receiving consulting fees from or serv-ing as a paid member of scientific advisory boards forActelion Ltd, Avera Pharmaceuticals Inc, BombardierInc, Cephalon Inc, Delta Airlines, Eli Lilly and Co, Fedex
COMPLICATIONS AFTER NIGHTTIME PROCEDURES BY ATTENDING PHYSICIANS
©2009 American Medical Association. All rights reserved. (Reprinted) JAMA, October 14, 2009—Vol 302, No. 14 1571
at University of Calgary on 2 January 2011jama.ama-assn.orgDownloaded from

Kinko’s, Federal Motor Carrier Safety Administration(FMCSA), US Department of Transportation, FusionMedical Education LLC, Garda Sıoch a na Inspec-torate (Dublin, Ireland), Hypnion Inc, Global GroundSupport, Johnson & Johnson, Koninklijke Philips Elec-tronics NV, Morgan Stanley, Sanofi-Aventis Group,Portland Trail Blazers, Respironics Inc, Sepracor Inc,Sleep Multimedia Inc, Sleep Research Society (for whichDr Czeisler served as president), Somnus Therapeu-tics Inc, Takeda Pharmaceuticals, Vanda Pharmaceu-ticals Inc, Vital Issues in Medicine, Warburg-Pincus,and Zeo Inc. Dr Czeisler reports owning an equity in-terest in Lifetrac Inc, Somnus Therapeutics Inc, VandaPharmaceuticals Inc, and Zeo Inc; and receiving roy-alties from McGraw Hill, the New York Times, and Pen-guin Press. Dr Czeisler reports receiving lecture feesfrom the Accreditation Council of Graduate MedicalEducation, Alfresa, American Physiological Society, As-sociation of University Anesthesiologists, Baylor Col-lege of Medicine, Beth-Israel Deaconess Medical Cen-ter, Brown Medical School/Rhode Island Hospital,Cephalon Inc, Clinical Excellence Commission (Aus-tralia), Dalhousie University, Duke University Medi-cal Center, Harvard University, Institute of Sleep HealthPromotion, London Deanery, Morehouse School ofMedicine, Mount Sinai School of Medicine, NationalEmergency Training Center, National Institutes ofHealth, North East Sleep Society, Osaka UniversitySchool of Medicine, Partners HealthCare Inc, Sanofi-Aventis Inc, St Luke’s Roosevelt Hospital, Takeda, Tan-abe Seiyaku Co Ltd, Tokyo Electric Power Company,University of Michigan, University of Pennsylvania, Uni-versity of Pittsburgh, University of Tsukuba, Univer-sity of Virginia Medical School, University of Wash-ington Medical Center, University of Wisconsin MedicalSchool, World Federation of Sleep Research and SleepMedicine Societies, and the American Academy of Al-lergy, Asthma and Immunology Program Directors. DrCzeisler reports receiving research prizes with mon-etary awards from the American Academy of SleepMedicine, American Clinical and Climatological As-sociation, Association for Patient-Oriented Research,National Institute for Occupational Safety and Health,National Sleep Foundation, and Sleep Research Soci-ety; receiving clinical trial research contracts fromCephalon Inc, Merck & Co Inc, and Pfizer Inc; receiv-ing an investigator-initiated research grant from Cepha-lon Inc. Dr Czeisler reports that his research labora-tory at the Brigham and Women’s Hospital has receivedunrestricted research and education funds and/or sup-port for research expenses from Cephalon Inc, Ko-ninklijke Philips Electronics NV, ResMed, and theBrigham and Women’s Hospital. The Harvard Medi-cal School Division of Sleep Medicine, which Dr Czeislerdirects, has received unrestricted research and edu-cational gifts and endowment funds from Boe-hringer Ingelheim Pharmaceuticals Inc, Cephalon Inc,George H. Kidder, Gerald McGinnis, GlaxoSmithKline,Herbert Lee, Hypnion, Jazz Pharmaceuticals, Jor-dan’s Furniture, Merck & Co Inc, Peter C. Farrell, Pfizer,ResMed, Respironics Inc, Sanofi-Aventis Inc, Sealy Inc,Sepracor Inc, Simmons, Sleep Health Centers LLC,Spring Aire, Takeda Pharmaceuticals, and Tempur-Pedic. The Harvard Medical School/Division of SleepMedicine has received gifts from many outside orga-nizations and individuals including Aetna US Health-care, Alertness Solutions Inc, American Academy ofSleep Medicine, Axon Sleep Research Laboratories Inc,Boehringer Ingelheim Pharmaceuticals Inc, Brigham &Women’s Hospital Department of Medicine, Bristol-Myers Squibb, Catalyst Group, Cephalon Inc, ClarusVentures, Comfortaire Corporation, Committee for In-terns and Residents, Eli Lilly and Co, Farrell Family Foun-dation, Fisher & Paykel Healthcare Corporation, GeorgeH. Kidder, GlaxoSmithKline, Gosule, Butkus & JessonLLP, Hypnion Inc, Innovative Brands Group (Na-ture’s Rest), Jordan’s Furniture, King Koil Sleep Prod-ucts, Land and Sky, Merck Research Laboratories, MPM
Capital, Neurocrine Biosciences Inc, Orphan Medical/Jazz Pharmaceuticals, Park Place Corporation, PfizerGlobal Pharmaceuticals, Pfizer Healthcare Division,Pfizer Inc, Purdue Pharma LP, PR21, ResMed Inc, Res-pironics Inc, Sanofi-Aventis Inc, Sanofi-Synthelabo,Sealy Mattress Company, Sealy Inc, Select ComfortCorporation, Sepracor Inc, Simmons Co, Sleep Ave LLC,SleepCare LLC, Sleep Health Centers LLC, Spring AirMattress Co, Takeda Pharmaceuticals, Tempur-Pedic Medical Division, Total Sleep Holdings, VandaPharmaceuticals Inc, and the Zeno Group. The Har-vard Medical School/Division of Sleep Medicine Sleepand Health Education Program has received educa-tional grant funding from Cephalon Inc, Takeda Phar-maceuticals, Sanofi-Aventis Inc, and Sepracor Inc. DrCzeisler reports being the incumbent of an endowedprofessorship provided to Harvard University by Cepha-lon Inc and holds a number of process patents in thefield of sleep/circadian rhythms (eg, photic resettingof the human circadian pacemaker). Since 1985, DrCzeisler has also served as an expert witness on vari-ous legal cases related to sleep and/or circadianrhythms.Funding/Support: This study was supported by a grantfrom the Rx Foundation, Cambridge, Massachusetts.Role of the Sponsor: The Rx Foundation had no rolein the design and conduct of the study; the collec-tion, preparation, or interpretation of the data; or thepreparation or approval of the manuscript.Additional Information: eTable and eFigure are avail-able at http://www.jama.com.Additional Contributions: We thank Cathy Foskett,RN for her contributions in chart abstractions and datacollection. She received salary support from the grant.
REFERENCES
1. Landrigan CP, Rothschild JM, Cronin JW, et al. Effectof reducing interns’ work hours on serious medical er-rors in intensive care units. N Engl J Med. 2004;351:1838-1848.2. Ayas NT, Barger LK, Cade BE, et al. Extended workduration and the risk of self-reported percutaneousinjuries in interns. JAMA. 2006;296(9):1055-1062.3. Barger LK, Cade BE, Ayas NT, et al; Harvard WorkHours, Health, and Safety Group. Extended work shiftsand the risk of motor vehicle crashes among interns.N Engl J Med. 2005;352(2):125-134.4. Ellman PI, Law MG, Tache-Leon C, et al. Sleep dep-rivation does not affect operative results in cardiacsurgery. Ann Thorac Surg. 2004;78(3):906-911.5. Sachs BP. A 38-year-old woman with fetal loss andhysterectomy. JAMA. 2005;294(7):833-840.6. Fletcher KE, Davis SQ, Underwood W, MangrulkarRS, McMahon LF Jr, Saint S. Systematic review: ef-fects of resident work hours on patient safety. AnnIntern Med. 2004;141(11):851-857.7. Lydon-Rochelle M, Holt VL, Martin DP, EasterlingTR. Association between method of delivery and ma-ternal rehospitalization. JAMA. 2000;283(18):2411-2416.8. Romano PS, Yasmeen S, Schembri ME, Keyzer JM,Gilbert WM. Coding of perineal lacerations and othercomplications of obstetric care in hospital dischargedata. Obstet Gynecol. 2005;106(4):717-725.9. Forster AJ, Fung I, Caughey S, et al. Adverse eventsdetected by clinical surveillance on an obstetric service.Obstet Gynecol. 2006;108(5):1073-1083.10. Landrigan CP, Czeisler CA, Barger LK, Ayas NT,Rothschild JM, Lockley SW; Harvard Work Hours,Health and Safety Group. Effective implementationof work-hour limits and systemic improvements.Jt Comm J Qual Patient Saf. 2007;33(11)(suppl):19-29.11. Agency for Healthcare Research and Quality.AHRQ Quality Indicators-Guide to Patient Safety In-dicators: 03-R203. Rockville, MD: Agency for Health-care Research & Quality; 2003.
12. Iezzoni LI, Daley J, Heeren T, et al. Identifying com-plications of care using administrative data. Med Care.1994;32(7):700-715.13. Karson AS, Bates DW. Screening for adverseevents. J Eval Clin Pract. 1999;5(1):23-32.14. Mann S, Pratt S, Gluck P, et al. Assessing qualityin obstetrical care. Jt Comm J Qual Patient Saf. 2006;32(9):497-505.15. Weissman JS, Rothschild JM, Bendavid E, et al.Hospital workload and adverse events. Med Care.2007;45(5):448-455.16. Bates DW, Cullen DJ, Laird N, et al. Incidence ofadverse drug events and potential adverse drug events.JAMA. 1995;274(1):29-34.17. Breslow NE, Clayton DG. Approximate infer-ence in generalized linear models. J Am Stat Assoc.1993;88(421):9-25 doi:10.2307/2290687.18. Woflinger R, O’Connell M. Generalized linearmixed models. J Statist Comput Simulation. 1993;48(3-4):233-243 doi:10.1080/00949659308811554.19. Rogers AE, Hwang W-T, Aiken LH, Dinges DF.The working hours of hospital staff nurses and pa-tient safety. Health Aff (Millwood). 2004;23(4):202-212.20. Gawande AA, Zinner MJ, Studdert DM, BrennanTA. Analysis of errors reported by surgeons at threeteaching hospitals. Surgery. 2003;133(6):614-621.21. Institute of Medicine; Committee on OptimizingGraduate Medical Trainee (Resident) Hours and WorkSchedules to Improve Patient Safety; National Re-search Council. Resident Duty Hours: Enhancing Sleep,Supervision, and Safety. Ulmer C, Wolman DM, JohnsMME, eds. Washington, DC: The National Acad-emies Press; 2008.22. Dijk DJ, Duffy JF, Czeisler CA. Contribution of cir-cadian physiology and sleep homeostasis to age-related changes in human sleep. Chronobiol Int. 2000;17(3):285-311.23. Hutter MM, Kellogg KC, Ferguson CM, AbbottWM, Warshaw AL. The impact of the 80-hour resi-dent workweek on surgical residents and attendingsurgeons. Ann Surg. 2006;243(6):864-871, discus-sion 871-875.24. Pape HC, Pfeifer R. Restricted duty hours for sur-geons and impact on residents quality of life, educa-tion, and patient care. Patient Saf Surg. 2009;3(1):3.25. Hyman NH. Attending work hour restrictions: isit time? Arch Surg. 2009;144(1):7-8.26. Landrigan CP, Barger LK, Cade BE, Ayas NT,Czeisler CA. Interns’ compliance with accreditationcouncil for graduate medical education work-hourlimits. JAMA. 2006;296(9):1063-1070.27. Büchler P, Kraus TW, Friess H, Buchler MW. La-bor legislation in the European Union has impact onworkforce management in surgical centers. Surgery.2003;134(1):3-11.28. Weinstein L. The laborist: a new focus of prac-tice for the obstetrician. Am J Obstet Gynecol. 2003;188(2):310-312.29. Maa J, Carter JT, Gosnell JE, Wachter R, HarrisHW. The surgical hospitalist: a new model for emer-gency surgical care. J Am Coll Surg. 2007;205(5):704-711.30. Makary MA, Sexton JB, Freischlag JA, et al. Pa-tient safety in surgery. Ann Surg. 2006;243(5):628.31. Vincent C, Moorthy K, Sarker SK, Chang A, DarziAW. Systems approaches to surgical quality and safety.Ann Surg. 2004;239(4):475-482.32. American College of Obstetr ic ians andGynecologists. ACOG Committee Opinion #328: pa-tient safety in the surgical environment. ObstetGynecol. 2006;107(2 pt 1):429-433.33. Gaba DM, Howard SK. Patient safety: fatigueamong clinicians and the safety of patients. N Engl JMed. 2002;347(16):1249-1255.
COMPLICATIONS AFTER NIGHTTIME PROCEDURES BY ATTENDING PHYSICIANS
1572 JAMA, October 14, 2009—Vol 302, No. 14 (Reprinted) ©2009 American Medical Association. All rights reserved.
at University of Calgary on 2 January 2011jama.ama-assn.orgDownloaded from

Education and debate
Reader’s guide to critical appraisal of cohort studies: 1.Role and designPaula A Rochon, Jerry H Gurwitz, Kathy Sykora, Muhammad Mamdani, David L Streiner,Susan Garfinkel, Sharon-Lise T Normand, Geoffrey M Anderson
Cohort studies can provide valuable information unavailable from randomised trials, but readersneed to be alert to possible flaws
Valid evidence on the benefits and risks of healthcareinterventions is essential to rational decision making.Randomised controlled trials are considered the bestmethod for providing evidence on efficacy. However,they face important ethical and logistical constraintsand have been criticised for focusing on highly selectedpopulations and outcomes.1 2 Some of these problemscan be overcome by cohort studies. Cohort studies canbe thought of as natural experiments in whichoutcomes are measured in real world rather thanexperimental settings. They can evaluate large groupsof diverse individuals, follow them for long periods,and provide information on a range of outcomes,including rare adverse events. However, the promise ofcohort studies as a useful source of evidence needs tobe balanced against concerns about the validity of thatevidence.3 4
In this three paper series we will provide anapproach to the critical appraisal of cohort studies.This article describes the role and design of cohortstudies and explains how selection bias can confoundthe relation between the intervention and the outcome.The second article will outline strategies for identifica-tion and assessment of the potential for confounding,and the third article describes statistical techniques thatcan be used to deal with confounding. Each paperdefines a set of questions that, taken together, can pro-vide readers with a systematic approach to criticallyassessing evidence from cohort studies.
Randomised trial or cohort study?Cohort studies are similar to randomised controlledtrials in that they compare outcomes in groups that didand did not receive an intervention. The maindifference is that allocation of individuals is not bychance. Table 1 gives some important similarities anddifferences between the two types of study. Becausethey are expensive and recruiting patients can be diffi-cult, randomised controlled trials are generally shortterm and used to determine efficacy in selected popu-lations under strict conditions. Cohort studies can beused to determine if the efficacy observed inrandomised trials translates into effectiveness in
broader populations and more realistic settings and toprovide information on adverse events and risks.5
Selection bias as a threat to validityThe internal validity of a study is defined as the extentto which the observed difference in outcomes betweenthe two comparison groups can be attributed to theintervention rather than other factors. The biggestadvantage of randomised controlled trials comparedwith cohort studies is that the random allocation pro-cess enhances the internal validity of a study byminimising selection bias and confounding.6 Thispaper relies on the definitions provided by CONSORT(box 1).7
Allocation by chance in a randomised controlledtrial should mean that the groups being compared aresimilar in terms of both measured and unmeasuredbaseline factors.8 This is not so in cohort studies, andtherefore cohort studies are vulnerable to selectionbias. In cohort studies, factors that determined whethera person received the intervention could result in thegroups differing in factors related to the outcome,either because people were preferentially selected toreceive one treatment or because of choices that theymade. These baseline differences in prognosis couldconfound the assessment of the effect of the interven-tion.
In cohort studies care must be taken to minimise,assess, and deal with selection bias. A comprehensive
Cohort studies can use diverse populations
PH
OT
OA
LTO
/PH
OT
ON
ICA
This is the firstof three articleson appraisingcohort studies
Kunin-LunenfeldApplied ResearchUnit, BaycrestCentre for GeriatricCare, Toronto, ON,CanadaPaula A Rochonsenior scientist
Meyers PrimaryCare Institute,Worcester, MA01605, USAJerry H Gurwitzexecutive director
Institute for ClinicalEvaluative Sciences,Toronto, ON,CanadaKathy Sykorasenior biostatisticianMuhammadMamdanisenior scientistSusan Garfinkelresearch coordinator
Department ofPsychiatry,University ofToronto, Toronto,ON, CanadaDavid L Streinerprofessor
Department ofHealth Care Policy,Harvard MedicalSchool, Boston,USASharon-Lise TNormandprofessor of healthcare policy(biostatistics)
continued over
BMJ 2005;330:895–7
895BMJ VOLUME 330 16 APRIL 2005 bmj.com
approach is needed that includes the selection ofappropriate comparison groups, the identification andassessment of the comparability of potential confound-ers between those comparison groups, and the use ofsophisticated statistical techniques in the analysis.
Comparison groups in cohort studiesThe essence of any cohort study is the comparison ofoutcomes between people who received the interven-tion and those who did not. For example, to answer thequestion, “Do patients who receive an atypical antipsy-chotic drug have an increased risk of hip fracture?” acohort study must ask: “What would have happened tothese patients if they had not received the atypicalantipsychotic drug?”
Ideally, the comparison group in the cohort studyshould be identical to the intervention group, apartfrom the fact that they did not receive the intervention.This ideal comparison group is described bymethodologists as providing the “counterfactual” or“potential outcome.”9 In reality, this ideal comparisongroup does not exist. Part of the art of designing acohort study is choosing comparison groups thatapproach this ideal in order to minimise selection biaswhile maintaining clinically relevance.
The analysis of the association between antipsy-chotic drugs and hip fracture can be used to define thetypes of comparisons that could be found in cohortstudies. For any specific intervention (such as exposureto atypical antipsychotics) two factors—the exposureexperience of the comparison group and thepopulation from which the intervention and compari-son groups are selected—define the types of compari-sons that are possible (box 2). People taking atypicalantipsychotics can be compared with either peopletaking an alternative antipsychotic or with thoseprescribed no antipsychotic drugs. These comparisonscould be made in a general population (all elderlypeople) or in a restricted population (elderly peoplewith dementia).
Questions to ask when assessing acohort study designWhat comparison is being made?Published studies may include more than one type ofcomparison, but the focus of any appraisal of a cohortstudy is on an individual comparison between an inter-vention group and a comparison group in a definedpopulation. A well written study should contain a cleardefinition of why the two groups were selected andhow they were defined. This information is essentialfor assessment of clinical relevance and potential forselection bias.
Does the comparison make clinical sense?The clinical relevance of comparisons needs to beassessed for each case. In the analysis of antipsychoticuse and hip fracture, for instance, all four types of com-parison might be relevant. However, this might not betrue in other analyses. For example, although it wouldbe possible for a cohort study to compare HIV positivepatients receiving antiretroviral therapy with thosereceiving no intervention,10 this comparison would beirrelevant to many clinicians. A more relevant cohortstudy would compare patients receiving one antiretro-viral therapy with patients receiving another interven-tion.11 In contrast, a clinically relevant study of theadverse effects of a commonly used treatment such asa non-steroidal anti-inflammatory drug might includea comparison with a no intervention population sinceno drug treatment could be a realistic option for somepeople.12
Cohort studies should not only describe the popu-lations being compared but also include a discussion ofthe clinical context for that comparison and provide ajustification for the comparison. Readers of thesestudies should determine if the study makes acomparison that is realistic and relevant to theirdecision needs.
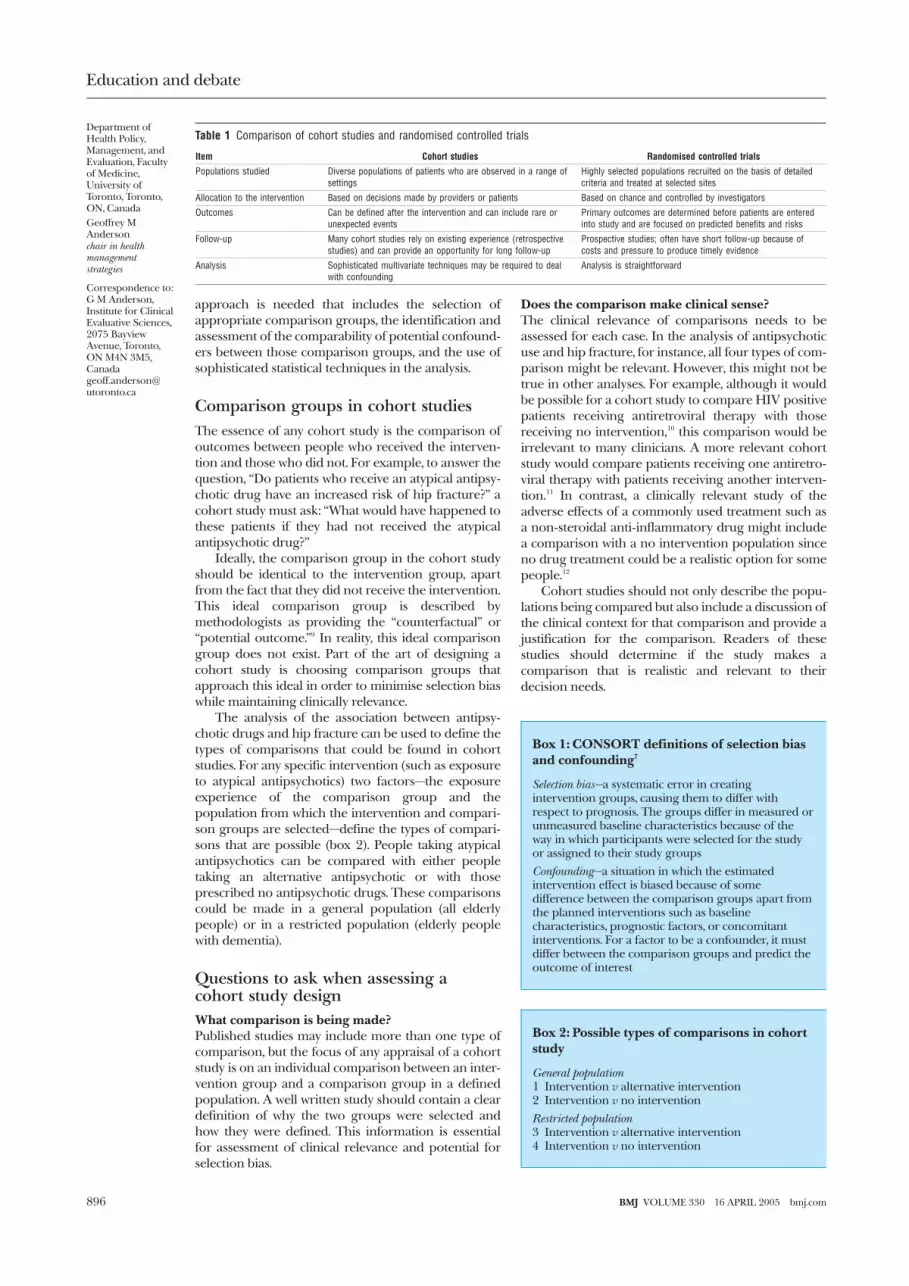
Table 1 Comparison of cohort studies and randomised controlled trials
Item Cohort studies Randomised controlled trials
Populations studied Diverse populations of patients who are observed in a range ofsettings
Highly selected populations recruited on the basis of detailedcriteria and treated at selected sites
Allocation to the intervention Based on decisions made by providers or patients Based on chance and controlled by investigators
Outcomes Can be defined after the intervention and can include rare orunexpected events
Primary outcomes are determined before patients are enteredinto study and are focused on predicted benefits and risks
Follow-up Many cohort studies rely on existing experience (retrospectivestudies) and can provide an opportunity for long follow-up
Prospective studies; often have short follow-up because ofcosts and pressure to produce timely evidence
Analysis Sophisticated multivariate techniques may be required to dealwith confounding
Analysis is straightforward
Box 1: CONSORT definitions of selection biasand confounding7
Selection bias—a systematic error in creatingintervention groups, causing them to differ withrespect to prognosis. The groups differ in measured orunmeasured baseline characteristics because of theway in which participants were selected for the studyor assigned to their study groups
Confounding—a situation in which the estimatedintervention effect is biased because of somedifference between the comparison groups apart fromthe planned interventions such as baselinecharacteristics, prognostic factors, or concomitantinterventions. For a factor to be a confounder, it mustdiffer between the comparison groups and predict theoutcome of interest
Box 2: Possible types of comparisons in cohortstudy
General population1 Intervention v alternative intervention2 Intervention v no intervention
Restricted population3 Intervention v alternative intervention4 Intervention v no intervention
Education and debate
Department ofHealth Policy,Management, andEvaluation, Facultyof Medicine,University ofToronto, Toronto,ON, CanadaGeoffrey MAndersonchair in healthmanagementstrategies
Correspondence to:G M Anderson,Institute for ClinicalEvaluative Sciences,2075 BayviewAvenue, Toronto,ON M4N 3M5,[email protected]
896 BMJ VOLUME 330 16 APRIL 2005 bmj.com
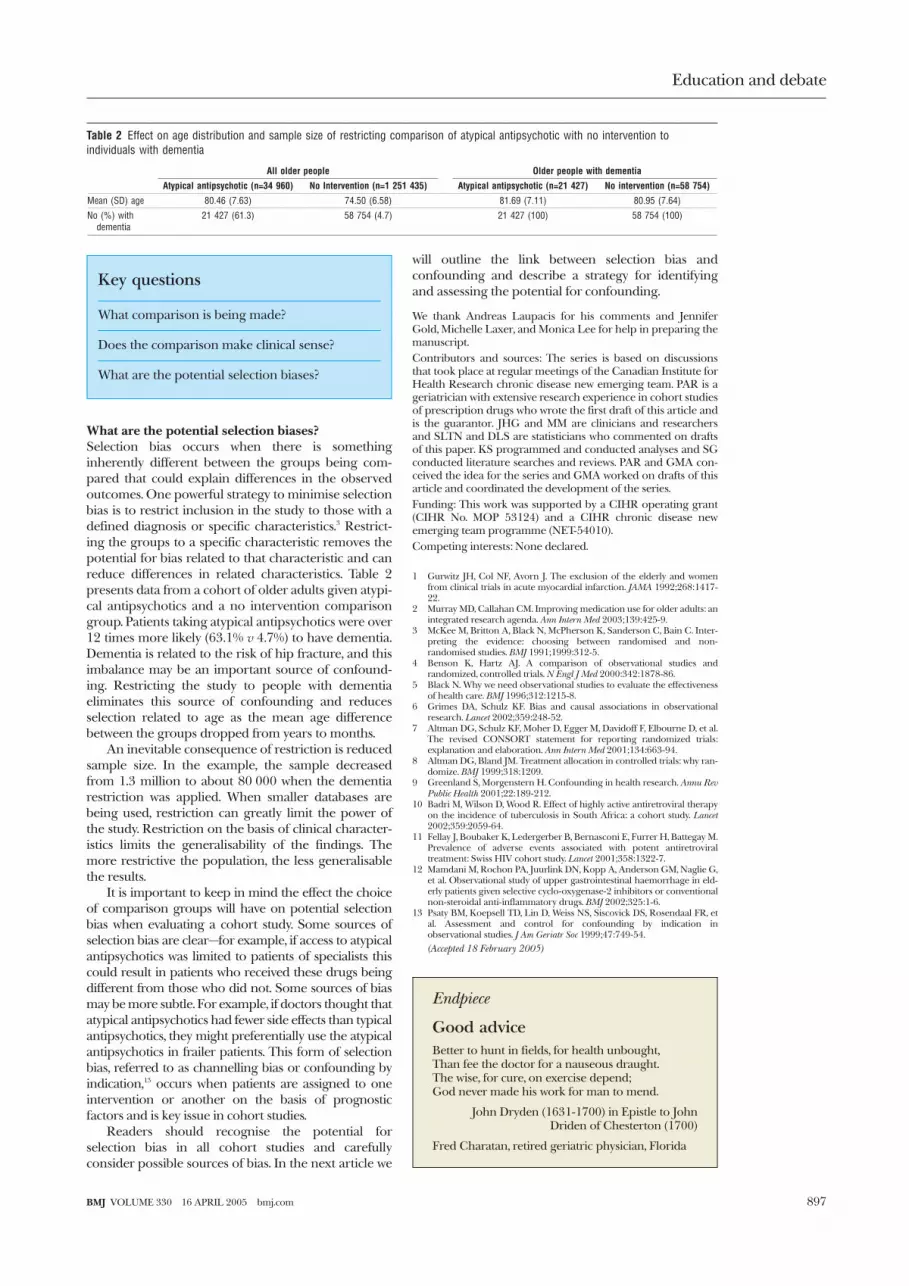
What are the potential selection biases?Selection bias occurs when there is somethinginherently different between the groups being com-pared that could explain differences in the observedoutcomes. One powerful strategy to minimise selectionbias is to restrict inclusion in the study to those with adefined diagnosis or specific characteristics.3 Restrict-ing the groups to a specific characteristic removes thepotential for bias related to that characteristic and canreduce differences in related characteristics. Table 2presents data from a cohort of older adults given atypi-cal antipsychotics and a no intervention comparisongroup. Patients taking atypical antipsychotics were over12 times more likely (63.1% v 4.7%) to have dementia.Dementia is related to the risk of hip fracture, and thisimbalance may be an important source of confound-ing. Restricting the study to people with dementiaeliminates this source of confounding and reducesselection related to age as the mean age differencebetween the groups dropped from years to months.
An inevitable consequence of restriction is reducedsample size. In the example, the sample decreasedfrom 1.3 million to about 80 000 when the dementiarestriction was applied. When smaller databases arebeing used, restriction can greatly limit the power ofthe study. Restriction on the basis of clinical character-istics limits the generalisability of the findings. Themore restrictive the population, the less generalisablethe results.
It is important to keep in mind the effect the choiceof comparison groups will have on potential selectionbias when evaluating a cohort study. Some sources ofselection bias are clear—for example, if access to atypicalantipsychotics was limited to patients of specialists thiscould result in patients who received these drugs beingdifferent from those who did not. Some sources of biasmay be more subtle. For example, if doctors thought thatatypical antipsychotics had fewer side effects than typicalantipsychotics, they might preferentially use the atypicalantipsychotics in frailer patients. This form of selectionbias, referred to as channelling bias or confounding byindication,13 occurs when patients are assigned to oneintervention or another on the basis of prognosticfactors and is key issue in cohort studies.
Readers should recognise the potential forselection bias in all cohort studies and carefullyconsider possible sources of bias. In the next article we
will outline the link between selection bias andconfounding and describe a strategy for identifyingand assessing the potential for confounding.
We thank Andreas Laupacis for his comments and JenniferGold, Michelle Laxer, and Monica Lee for help in preparing themanuscript.Contributors and sources: The series is based on discussionsthat took place at regular meetings of the Canadian Institute forHealth Research chronic disease new emerging team. PAR is ageriatrician with extensive research experience in cohort studiesof prescription drugs who wrote the first draft of this article andis the guarantor. JHG and MM are clinicians and researchersand SLTN and DLS are statisticians who commented on draftsof this paper. KS programmed and conducted analyses and SGconducted literature searches and reviews. PAR and GMA con-ceived the idea for the series and GMA worked on drafts of thisarticle and coordinated the development of the series.Funding: This work was supported by a CIHR operating grant(CIHR No. MOP 53124) and a CIHR chronic disease newemerging team programme (NET-54010).Competing interests: None declared.
1 Gurwitz JH, Col NF, Avorn J. The exclusion of the elderly and womenfrom clinical trials in acute myocardial infarction. JAMA 1992;268:1417-22.
2 Murray MD, Callahan CM. Improving medication use for older adults: anintegrated research agenda. Ann Intern Med 2003;139:425-9.
3 McKee M, Britton A, Black N, McPherson K, Sanderson C, Bain C. Inter-preting the evidence: choosing between randomised and non-randomised studies. BMJ 1991;1999:312-5.
4 Benson K, Hartz AJ. A comparison of observational studies andrandomized, controlled trials. N Engl J Med 2000:342:1878-86.
5 Black N. Why we need observational studies to evaluate the effectivenessof health care. BMJ 1996;312:1215-8.
6 Grimes DA, Schulz KF. Bias and causal associations in observationalresearch. Lancet 2002;359:248-52.
7 Altman DG, Schulz KF, Moher D, Egger M, Davidoff F, Elbourne D, et al.The revised CONSORT statement for reporting randomized trials:explanation and elaboration. Ann Intern Med 2001;134:663-94.
8 Altman DG, Bland JM. Treatment allocation in controlled trials: why ran-domize. BMJ 1999;318:1209.
9 Greenland S, Morgenstern H. Confounding in health research. Annu RevPublic Health 2001;22:189-212.
10 Badri M, Wilson D, Wood R. Effect of highly active antiretroviral therapyon the incidence of tuberculosis in South Africa: a cohort study. Lancet2002;359:2059-64.
11 Fellay J, Boubaker K, Ledergerber B, Bernasconi E, Furrer H, Battegay M.Prevalence of adverse events associated with potent antiretroviraltreatment: Swiss HIV cohort study. Lancet 2001;358:1322-7.
12 Mamdani M, Rochon PA, Juurlink DN, Kopp A, Anderson GM, Naglie G,et al. Observational study of upper gastrointestinal haemorrhage in eld-erly patients given selective cyclo-oxygenase-2 inhibitors or conventionalnon-steroidal anti-inflammatory drugs. BMJ 2002;325:1-6.
13 Psaty BM, Koepsell TD, Lin D, Weiss NS, Siscovick DS, Rosendaal FR, etal. Assessment and control for confounding by indication inobservational studies. J Am Geriatr Soc 1999;47:749-54.
(Accepted 18 February 2005)
Table 2 Effect on age distribution and sample size of restricting comparison of atypical antipsychotic with no intervention toindividuals with dementia
All older people Older people with dementia
Atypical antipsychotic (n=34 960) No Intervention (n=1 251 435) Atypical antipsychotic (n=21 427) No intervention (n=58 754)
Mean (SD) age 80.46 (7.63) 74.50 (6.58) 81.69 (7.11) 80.95 (7.64)
No (%) withdementia
21 427 (61.3) 58 754 (4.7) 21 427 (100) 58 754 (100)
Key questions
What comparison is being made?
Does the comparison make clinical sense?
What are the potential selection biases?
Endpiece
Good adviceBetter to hunt in fields, for health unbought,Than fee the doctor for a nauseous draught.The wise, for cure, on exercise depend;God never made his work for man to mend.
John Dryden (1631-1700) in Epistle to JohnDriden of Chesterton (1700)
Fred Charatan, retired geriatric physician, Florida
Education and debate
897BMJ VOLUME 330 16 APRIL 2005 bmj.com
Reader’s guide to critical appraisal of cohort studies:2. Assessing potential for confoundingMuhammad Mamdani, Kathy Sykora, Ping Li, Sharon-Lise T Normand, David L Streiner,Peter C Austin, Paula A Rochon, Geoffrey M Anderson
Although confounding is an important problem of cohort studies, its effects can be minimised toenable valid comparison
In cohort studies, who does or does not receive anintervention is determined by practice patterns,personal choice, or policy decisions. This raises thepossibility that the intervention and comparisongroups may differ in characteristics that affect the studyoutcome, a problem called selection bias. If these char-acteristics have independent effects on the observedoutcome in each group, they will create differences inoutcomes between the groups apart from those relatedto the interventions being assessed. This effect isknown as confounding.1 In the first paper in the serieswe dealt with the design and use of cohort studies andhow to identify selection bias.2 This paper focuses onthe definition and assessment of confounders.
What is a confounder?For a characteristic to be a confounder in a particularstudy, it must meet two criteria.1 The first is that it mustbe related to the outcome in terms of prognosis or sus-ceptibility. For example, in the study of the associationbetween antipsychotic use and hip fracture that weconsidered in the first paper,2 age is known to berelated to risk of hip fracture and therefore has thepotential to be a confounder.
The second criterion that defines a confounder isthat the distribution of the characteristic is different inthe groups being compared. It can differ in terms ofeither the mean or the degree of variation or variabilityin that characteristic. For example, for age to be a con-founder in a cohort study, either the average age or thevariation in the age in the groups being comparedwould have to be different. Assessing variation as wellas average values is important because groups can havethe same average value but very different variation. Forexample, one group with an average age of 70 couldinclude only people aged 70 and another with thesame average age could consist of equal proportions ofindividuals aged 50 and 90. Nevertheless, even a char-acteristic that is a strong predictor of outcome will notbe a confounder if its distribution is balanced betweenthe comparison groups.
In assessing cohort studies, it is important to iden-tify potential confounders and to examine their distri-bution in the intervention and comparison groups.Below we describe the three questions that need to beanswered.
Has there been a systematic effort toidentify and measure potentialconfounders?Although currently available evidence helps identifypotential confounders, the imperfect state of knowl-
edge means that some characteristics related to theoutcome may not have been discovered (unknownconfounders). Even if a confounder is known, theremay be insufficient data to evaluate it.
In randomised controlled trials, all potentialconfounders (known or unknown) are expected to beevenly distributed between the groups being com-pared.3 Cohort studies, however, have no similarprotection against confounding and are especially vul-nerable to unknown confounders. This does not meanthat all cohort studies are inherently invalid. Theunknown potential confounders may not have a largeindependent effect on the outcome of interest and,therefore, even if unevenly distributed, might not resultin much bias. Unknown potential confounders mayalso be evenly distributed between the groups.Nevertheless, all cohort studies should recognise thatunknown confounders could affect the results and, asoutlined in the next article in this series,4 investigatorsshould make an effort to determine how sensitive theresults are to unknown confounders.
Although unknown confounders are difficult todeal with in cohort studies, a systematic approach canbe used to identify known confounders. This shouldstart with a well designed search of comprehensivedatabases such as Medline. In the context of the studyof the relation between antipsychotic use and the out-come of a hip fracture, a review of the literaturesuggests that risk factors for hip fracture can be brokendown into four categories5–10:x Features of medical history—for example, stroke,osteoporosisx Exposure to drugs—for example, benzodiazepines,oestrogensx Demographics—for example, age and sexx Social and behavioural factors—for example, exer-cise and diet.
Once the potential confounders have beenidentified, the next step is to develop ways to measurethese in the groups being studied. In many cases, espe-cially when using administrative databases, it may notbe possible to measure all known confounders. Even ifthey are measured, the reliability and validity of themeasurement technique may be unclear. In the hipfracture and atypical antipsychotic example (seebmj.com for details of how the cohort was created) weused administrative databases to measure knownconfounders. These databases are poor sources ofinformation on behavioural and social factors. Thefailure to include measures of these factors has beenidentified as a key issue in cohort studies of hip
Further details on the study cohort and propensity scores areon bmj.com
Education and debate
This is thesecond of threearticles onappraisingcohort studies
Institute for ClinicalEvaluative Sciences,Toronto, ONCanadaMuhammadMamdanisenior scientistKathy Sykorasenior biostatisticianPing LianalystPeter C Austinsenior scientist
Department ofHealth Care Policy,Harvard MedicalSchool, Boston,USASharon-Lise TNormandprofessor of healthcare policy(biostatistics)
Department ofPsychiatry,University ofToronto, ON,CanadaDavid L Streinerprofessor
Kunin-LunenfeldApplied ResearchUnit, BaycrestCentre for GeriatricCare, Toronto, ON,CanadaPaula A Rochonsenior scientist
Department ofHealth Policy,Management andEvaluation, Facultyof Medicine,University ofToronto, Toronto,ON CanadaGeoffrey MAndersonchair in healthmanagementstrategies
Correspondence to:G M Anderson,Institute for ClinicalEvaluative Sciences,2075 BayviewAvenue, Toronto,ON M4N 3M5,[email protected]
BMJ 2005;330:960–2
960 BMJ VOLUME 330 23 APRIL 2005 bmj.com
fracture,11 and lack of control for lifestyle factors hasbeen suggested to have a key role in the differences inrisk of cardiovascular disease seen in cohort andrandomised controlled studies of hormone replace-ment therapy.12 Although the administrative databasescan provide some information on patient history suchas previous falls, they may underestimate their trueprevalence. It is important to know which confoundershave been measured in the study and how well theyhave been measured.
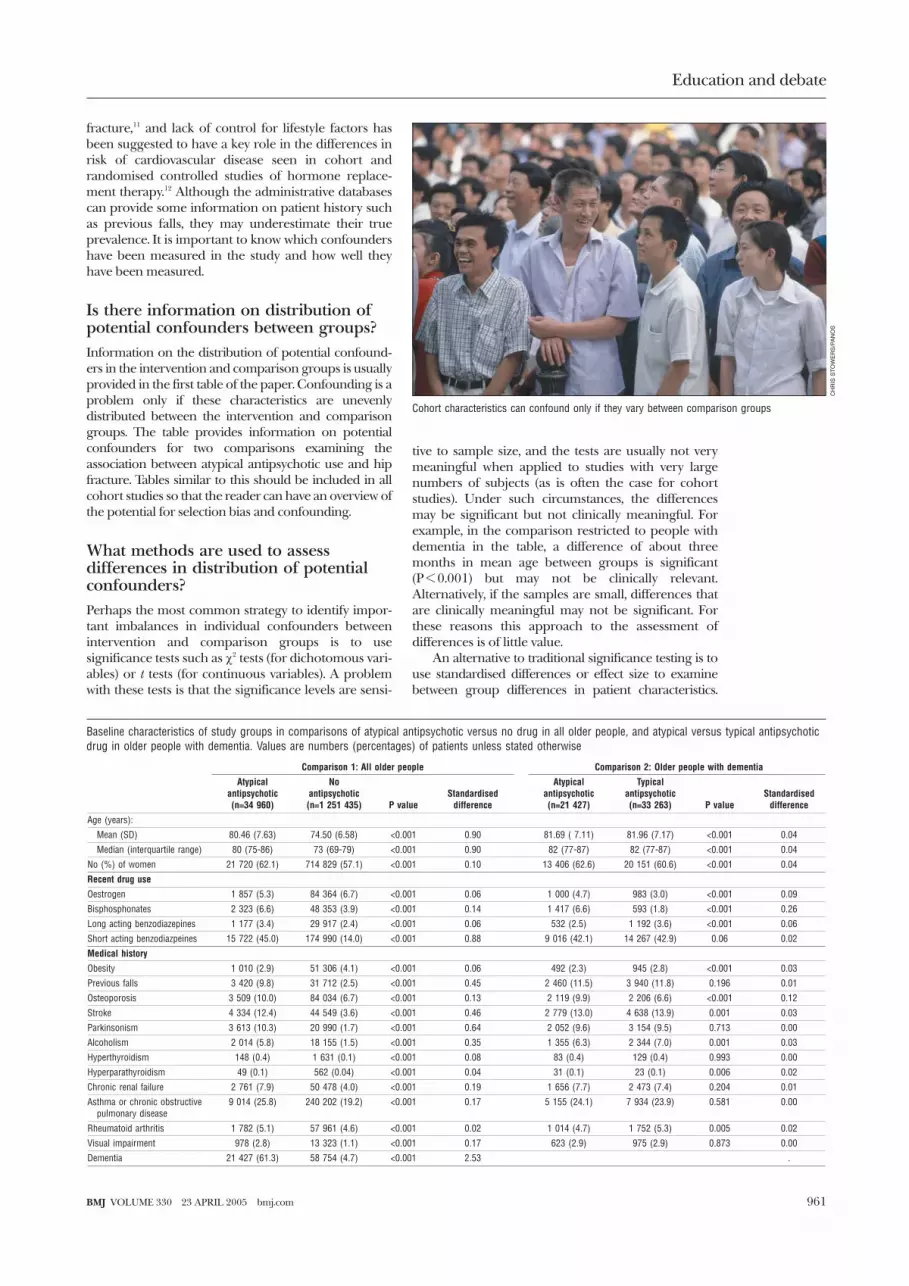
Is there information on distribution ofpotential confounders between groups?Information on the distribution of potential confound-ers in the intervention and comparison groups is usuallyprovided in the first table of the paper. Confounding is aproblem only if these characteristics are unevenlydistributed between the intervention and comparisongroups. The table provides information on potentialconfounders for two comparisons examining theassociation between atypical antipsychotic use and hipfracture. Tables similar to this should be included in allcohort studies so that the reader can have an overview ofthe potential for selection bias and confounding.
What methods are used to assessdifferences in distribution of potentialconfounders?Perhaps the most common strategy to identify impor-tant imbalances in individual confounders betweenintervention and comparison groups is to usesignificance tests such as �2 tests (for dichotomous vari-ables) or t tests (for continuous variables). A problemwith these tests is that the significance levels are sensi-
tive to sample size, and the tests are usually not verymeaningful when applied to studies with very largenumbers of subjects (as is often the case for cohortstudies). Under such circumstances, the differencesmay be significant but not clinically meaningful. Forexample, in the comparison restricted to people withdementia in the table, a difference of about threemonths in mean age between groups is significant(P < 0.001) but may not be clinically relevant.Alternatively, if the samples are small, differences thatare clinically meaningful may not be significant. Forthese reasons this approach to the assessment ofdifferences is of little value.
An alternative to traditional significance testing is touse standardised differences or effect size to examinebetween group differences in patient characteristics.
Baseline characteristics of study groups in comparisons of atypical antipsychotic versus no drug in all older people, and atypical versus typical antipsychoticdrug in older people with dementia. Values are numbers (percentages) of patients unless stated otherwise
Comparison 1: All older people Comparison 2: Older people with dementia
Atypicalantipsychotic(n=34 960)
Noantipsychotic(n=1 251 435) P value
Standardiseddifference
Atypicalantipsychotic(n=21 427)
Typicalantipsychotic(n=33 263) P value
Standardiseddifference
Age (years):
Mean (SD) 80.46 (7.63) 74.50 (6.58) <0.001 0.90 81.69 ( 7.11) 81.96 (7.17) <0.001 0.04
Median (interquartile range) 80 (75-86) 73 (69-79) <0.001 0.90 82 (77-87) 82 (77-87) <0.001 0.04
No (%) of women 21 720 (62.1) 714 829 (57.1) <0.001 0.10 13 406 (62.6) 20 151 (60.6) <0.001 0.04
Recent drug use
Oestrogen 1 857 (5.3) 84 364 (6.7) <0.001 0.06 1 000 (4.7) 983 (3.0) <0.001 0.09
Bisphosphonates 2 323 (6.6) 48 353 (3.9) <0.001 0.14 1 417 (6.6) 593 (1.8) <0.001 0.26
Long acting benzodiazepines 1 177 (3.4) 29 917 (2.4) <0.001 0.06 532 (2.5) 1 192 (3.6) <0.001 0.06
Short acting benzodiazpeines 15 722 (45.0) 174 990 (14.0) <0.001 0.88 9 016 (42.1) 14 267 (42.9) 0.06 0.02
Medical history
Obesity 1 010 (2.9) 51 306 (4.1) <0.001 0.06 492 (2.3) 945 (2.8) <0.001 0.03
Previous falls 3 420 (9.8) 31 712 (2.5) <0.001 0.45 2 460 (11.5) 3 940 (11.8) 0.196 0.01
Osteoporosis 3 509 (10.0) 84 034 (6.7) <0.001 0.13 2 119 (9.9) 2 206 (6.6) <0.001 0.12
Stroke 4 334 (12.4) 44 549 (3.6) <0.001 0.46 2 779 (13.0) 4 638 (13.9) 0.001 0.03
Parkinsonism 3 613 (10.3) 20 990 (1.7) <0.001 0.64 2 052 (9.6) 3 154 (9.5) 0.713 0.00
Alcoholism 2 014 (5.8) 18 155 (1.5) <0.001 0.35 1 355 (6.3) 2 344 (7.0) 0.001 0.03
Hyperthyroidism 148 (0.4) 1 631 (0.1) <0.001 0.08 83 (0.4) 129 (0.4) 0.993 0.00
Hyperparathyroidism 49 (0.1) 562 (0.04) <0.001 0.04 31 (0.1) 23 (0.1) 0.006 0.02
Chronic renal failure 2 761 (7.9) 50 478 (4.0) <0.001 0.19 1 656 (7.7) 2 473 (7.4) 0.204 0.01
Asthma or chronic obstructivepulmonary disease
9 014 (25.8) 240 202 (19.2) <0.001 0.17 5 155 (24.1) 7 934 (23.9) 0.581 0.00
Rheumatoid arthritis 1 782 (5.1) 57 961 (4.6) <0.001 0.02 1 014 (4.7) 1 752 (5.3) 0.005 0.02
Visual impairment 978 (2.8) 13 323 (1.1) <0.001 0.17 623 (2.9) 975 (2.9) 0.873 0.00
Dementia 21 427 (61.3) 58 754 (4.7) <0.001 2.53 .
Cohort characteristics can confound only if they vary between comparison groups
CH
RIS
ST
OW
ER
S/P
AN
OS
Education and debate
961BMJ VOLUME 330 23 APRIL 2005 bmj.com

Standardised differences reflect the mean difference as apercentage of the standard deviation. To estimate these,differences between groups are divided by the pooledstandard deviation of the two groups. This measure ofthe distribution is not as sensitive to sample size as tradi-tional tests and provides a sense of the relativemagnitude of differences. Standardised differences ofgreater than 0.1 are typically felt to be meaningful.13
In the table, traditional significance testing foundthat all 19 potential confounders were significantly dif-ferent (P < 0.001) in comparison 1, and that 13 of the19 characteristics had standardised differences greaterthan 0.1. Of particular note is the large standardiseddifference for history of dementia. Restriction of thestudy to people with dementia eliminates the possibil-ity of confounding from this characteristic. Forcomparison 2, traditional significance tests showed that8 of the 18 potential confounders were significantlydifferent (P < 0.001) but only two had a standardiseddifference greater than 0.1. The use of the standardiseddifferences technique shows that comparison 1 hassubstantial selection bias, particularly for dementia,whereas comparison 2 has much less potential for bias.
Both traditional significance testing and standard-ised differences focus on one potential confounder at atime and do not provide an overall perspective on howthe comparison groups differ. For example, two groupscould have the same mean age and proportion ofwomen, but one could contain old men and youngwomen and the other old women and young men. Anincreasingly common approach to the analysis ofcohort studies of health care interventions is to usepropensity score methods14 15—a technique thatinvolves multivariate assessment of confounders (seebmj.com for a brief discussion and an example).
Selection bias in cohort studies can result inconfounding. Here we have defined questions that canhelp identify potential confounders. In the next articlewe will examine statistical methods that can be used toreduce the effect of confounding and strategies thatcan be used to determine if the results of a study areplausible.
We thank Jennifer Gold and Monica Lee for help in preparingthe manuscript.Contributors and sources: The series is based on discussionsthat took place at regular meetings of the Canadian Institute forHealth Research chronic disease new emerging team. MM is aclinician with extensive research experience in cohort studies ofprescription drugs who wrote the first draft of this article and isthe guarantor. SLTN, DLS, and PCA are statisticians who com-
mented on drafts of this paper. KS and PL programmed andconducted analyses. PAR and GMA conceived the idea for theseries and GMA worked on drafts of this article and coordinatedthe development of the series.Funding: This work was supported by a CIHR operating grant(CIHR No MOP 53124) and a CIHR chronic disease newemerging team programme (NET-54010).Competing interests: None declared.
1 Altman D, Schulz KF, Moher D, Egger M, Davidoff F, Elbourne D, et al.The revised CONSORT statement for reporting randomized trials:explanation and elaboration. Ann Intern Med 2001;134:663-94.
2 Gurwitz JH, Sykora K, Mamdani M, Streiner DL, Garfinkel S, et al. Read-er’s guide to critical appraisal of cohort studies: 1. Role and design. BMJ2005;330:895-7.
3 Altman D, Bland MJ. Treatment allocation in controlled trials: whyrandomise? BMJ 1999;318:1209.
4 Normand SLT, Sykora K, Li P, Mamdani M, Rochon PA, Anderson GM.Reader’s guide to critical appraisal of cohort studies: 3. Analytical strate-gies to reduce confounding. BMJ (in press).
5 Lawlor DA, Patel R, Ebrahim S. Association between falls in elderlywomen and chronic diseases and drug use: cross sectional study. BMJ2003;327:1-6.
6 Feskanich D, Willett W, Colditz G. Walking and leisure-time activity andrisk of hip fracture in postmenopausal women. JAMA 2002;288:2300-6.
7 Haentjens P, Autier PH, Boonen S. Clinical risk factors for hip fracture inelderly women: a case-control study. J Orthop Trauma 2002;16:379-85.
8 Cummings SR, Nevitt MC, Browner WS, Stone K, Fox KM, Ensrud KE, etal. Risk factors for hip fracture in white women. N Engl J Med1995;332:767-73.
9 Masud T, Morris RO. Epidemiology of falls. Age Ageing 2001;30(suppl4):3-7.
10 Ensrud KE, Blackwell T, Mangione CM, Bowman PJ, Bauer DC, SchwartzA, et al. Central nervous system active medications and risk for fracturesin older women. Arch Intern Med 2003;163:949-57.
11 Schneeweiss S, Wang PS. Association between SSRI use and hip fracturesand the effect of residual confounding bias in claims database studies. JClin Psychopharmacol 2004;24:632-8.
12 Humphrey LL, Chan BK, Sox HC. Postmenopausal hormonereplacement therapy and primary prevention of cardiovascular disease,Ann Intern Med 2002;137:273-84.
13 Cohen J. Statistical power analysis for the behavioural sciences. Hillsdale, NJ:Academic Press, 1988.
14 Rubin DB, Estimating causal effects from large data sets using propensityscores. Ann Intern Med 1997;127:757-63.
15 Joffe MM, Rosenbaum PR. Propensity scores. Am J Epidemiol1999;150:327-33.
(Accepted 18 February 2005)
Key questions
Has there been a systematic effort to identify andmeasure potential confounders?
Is there information on how the potentialconfounders are distributed between thecomparison groups?
What methods are used to assess differences inthe distribution of potential confounders?
Submitting articles to the BMJ
We are now inviting all authors who want to submit a paper tothe BMJ to do so via the web (http://submit.bmj.com).
Benchpress is a website where authors deposit theirmanuscripts and editors go to read them and record theirdecisions. Reviewers’ details are also held on the system, andwhen asked to review a paper reviewers will be invited to accessthe site to see the relevant paper. The system is secure, protectedby passwords, so that authors see only their own papers andreviewers see only those they are meant to.
Anyone with an internet connection and a web browser can usethe system.
The system provides all our guidance and forms and allowsauthors to suggest reviewers for their paper. Authors get animmediate acknowledgment that their submission has beenreceived, and they can watch the progress of their manuscript.The record of their submission, including editors’ and reviewers’reports, remains on the system for future reference.
The system itself offers extensive help, and the BMJ OnlineSubmission Team will help authors and reviewers if they getstuck.
Benchpress is accessed via http://submit.bmj.com or via a linkfrom bmj.com
Education and debate
962 BMJ VOLUME 330 23 APRIL 2005 bmj.com

13 Department of Health. Tackling health inequalities: a programme foraction. London: DoH, 2003. (www.dh.gov.uk/assetRoot/04/01/93/62/04019362.pdf)
14 Exworthy M, Stuart M, Blane D, Marmot M. Tackling health inequalitiessince the Acheson inquiry. Bristol: Policy Press, 2003.
15 Department of Health. Health inequalities—national targets on infantmortality and life expectancy—technical briefing (revised 2002)www.dh.gov.uk/assetRoot/04/07/78/96/04077896.pdf (accessed 11Apr 2005).
16 Social Exclusion Unit. Bringing Britain together: a national strategy forneighbourhood renewal. London: Stationery Office, 1998. (Cm 4045.)
17 Office for National Statistics. Life expectancy at birth by health and localauthorities in the United Kingdom 1991-1993 to 2001-2003, includingrevised results for England and Wales 1991-1993 to 2000-2002, 2004.www.statistics.gov.uk/statbase/Product.asp?vlnk = 8841 (accessed 11 Apr2005).
18 Office for National Statistics. Population estimates for England andWales. www.statistics.gov.uk/statbase/Product.asp?vlnk = 601&More = N(accessed 11 Apr 2005). (Includes link to data for Scotland and NorthernIreland.)
19 Bajekal, M. Healthy life expectancy by area deprivation: magnitude andtrends in England, 1994–1999. Health Stat Q 2005;25:18-27.
20 Low A, Low A. Measuring the gap: quantifying and comparing localhealth inequalities, J Public Health 2004;26:388-95.
21 Gordon D. Census based deprivation indices: their weighting and valida-tion. J Epidemiol Community Health 1995;49(suppl 2):S39-44.
22 Dorling D, Thomas B. Appendix. In: People and places: a 2001 census atlasof the UK. Bristol: Policy Press, 2004.
23 Dorling D, Mitchell R, Shaw M, Orford S, Davey Smith G. The Ghost ofChristmas Past: the health effects of poverty in London in 1896 and1991. BMJ 2000;321:1547-51.
24 Wagstaff A, Paci P, van Doorslaer E. On the measurement of inequalitiesin health, Soc Sci Med 1991;33:545-57.
25 Dorling D. Death in Britain: how local mortality rates have changed:1950s-1990s. York: Joseph Rowntree Foundation, 1997.
26 Szreter S, Mooney G. Urbanization, mortality, and the standard of livingdebate: new estimates of the expectation of life at birth in nineteenthcentury British cities. Economic History Review 1998;51:84-112.
27 Goodman A, Shephard A. Inequality and living standards in Great Britain:some facts. London: Institute for Fiscal Studies, 2002.
28 Cabinet Office. Strategic audit: progress and challenges for the UK. London:Prime Minister’s Strategy Unit, 2005.
29 Dorling D, Thomas B. Know your place: housing wealth and inequality inGreat Britain 1980-2003 and beyond. The Shelter policy library, 26November 2004. http://england.shelter.org.uk/files/docs/7970/Knowyourplace.pdf (accessed 11 Apr 2005).
30 Hills J. Policy challenges and dilemmas for the next 20 years. In: Glenner-ster H, Hills J, Piachaud D, Webb J, eds. One hundred years of poverty andpolicy. York: Joseph Rowntree Foundation, 2004.
31 Morris J, Donkin A, Wonderling D, Wilkinson P, Dowler E. A minimumincome for healthy living. J Epidemiol Community Health 2000;54:885-9.
32 Morris J, Deeming C. Minimum incomes for health living (MIHL): nextthrust in UK social policy? Policy Politics 2004;32:441-54.
33 Bromley C. Has Britain become immune to inequality? In: Park A,Curtice J, Thomson K, Jarvis L, Bromley C, eds. British social attitudes: con-tinuity and change over two decades. London: Sage, 2003.(Accepted 6 April 2005)
Readers guide to critical appraisal of cohort studies: 3.Analytical strategies to reduce confoundingSharon-Lise T Normand, Kathy Sykora, Ping Li, Muhammad Mamdani, Paula A Rochon,Geoffrey M Anderson
Analytical strategies can help deal with potential confounding but readers need to know whichstrategy is appropriate
The previous articles in this series1 2 argued that cohortstudies are exposed to selection bias and confounding,and that critical appraisal requires a careful assessmentof the study design and the identification of potentialconfounders. This article describes two analyticalstrategies—regression and stratification—that can beused to assess and reduce confounding. Some cohortstudies match individual participants in the interventionand comparison groups on the basis of confounders, butbecause matching may be viewed as a special case ofstratification we have not discussed it specifically anddetails are available elsewhere.3 4 Neither of thesetechniques can eliminate bias related to unmeasured orunknown confounders. Furthermore, both have theirown assumptions, advantages, and limitations.
RegressionRegression uses the data to estimate how confoundersare related to the outcome and produces an adjustedestimate of the intervention effect. It is the mostcommonly used method for reducing confounding incohort studies. The outcome of interest is the depend-ent variable, and the measures of baseline characteris-tics (such as age and sex) and the intervention areindependent variables. The choice of method ofregression analysis (linear, logistic, proportionalhazards, etc) is dictated by the type of dependent vari-able. For example, if the outcome is binary (such asoccurrence of hip fracture), a logistic regression modelwould be appropriate; in contrast, if the outcome is
time to an event (such as time to hip fracture) aproportional hazards model is appropriate.
Regression analyses estimate the association of eachindependent variable with the dependent variable afteradjusting for the effects of all the other variables.Because the estimated association between the interven-tion and outcome variables adjusts for the effects of allthe measured baseline characteristics, the resultingestimate is called the adjusted effect. For example,regression could be used to control for differences inage and sex between two groups and to estimate theintervention effect adjusted for age and sex differences.
Stratification of the cohort helps minimise bias
SA
MB
AP
HO
TO
/PH
OT
ON
ICA
Results of propensity score analysis are on bmj.com
Education and debate
This is the lastof three articleson appraisingcohort studies
Department ofHealth Care Policy,Harvard MedicalSchool, Boston, MA,USASharon-Lise TNormandprofessor of healthcare policy(biostatistics)
Institute for ClinicalEvaluative Sciences,Toronto, ON,CanadaKathy Sykorasenior biostatisticianPing LianalystMuhammadMamdanisenior scientist
continued over
BMJ 2005;330:1021–3
1021BMJ VOLUME 330 30 APRIL 2005 bmj.com
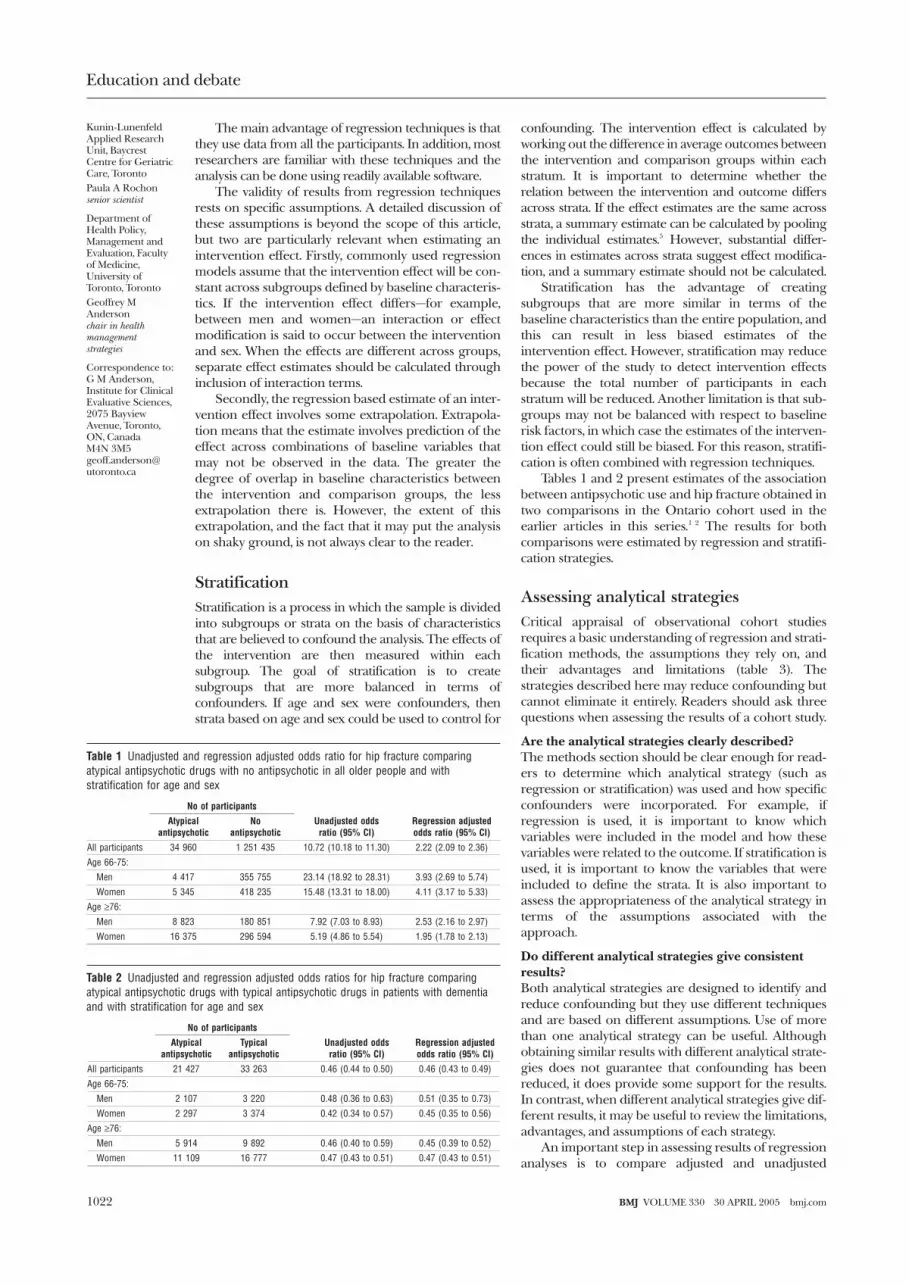
The main advantage of regression techniques is thatthey use data from all the participants. In addition, mostresearchers are familiar with these techniques and theanalysis can be done using readily available software.
The validity of results from regression techniquesrests on specific assumptions. A detailed discussion ofthese assumptions is beyond the scope of this article,but two are particularly relevant when estimating anintervention effect. Firstly, commonly used regressionmodels assume that the intervention effect will be con-stant across subgroups defined by baseline characteris-tics. If the intervention effect differs—for example,between men and women—an interaction or effectmodification is said to occur between the interventionand sex. When the effects are different across groups,separate effect estimates should be calculated throughinclusion of interaction terms.
Secondly, the regression based estimate of an inter-vention effect involves some extrapolation. Extrapola-tion means that the estimate involves prediction of theeffect across combinations of baseline variables thatmay not be observed in the data. The greater thedegree of overlap in baseline characteristics betweenthe intervention and comparison groups, the lessextrapolation there is. However, the extent of thisextrapolation, and the fact that it may put the analysison shaky ground, is not always clear to the reader.
StratificationStratification is a process in which the sample is dividedinto subgroups or strata on the basis of characteristicsthat are believed to confound the analysis. The effects ofthe intervention are then measured within eachsubgroup. The goal of stratification is to createsubgroups that are more balanced in terms ofconfounders. If age and sex were confounders, thenstrata based on age and sex could be used to control for
confounding. The intervention effect is calculated byworking out the difference in average outcomes betweenthe intervention and comparison groups within eachstratum. It is important to determine whether therelation between the intervention and outcome differsacross strata. If the effect estimates are the same acrossstrata, a summary estimate can be calculated by poolingthe individual estimates.5 However, substantial differ-ences in estimates across strata suggest effect modifica-tion, and a summary estimate should not be calculated.
Stratification has the advantage of creatingsubgroups that are more similar in terms of thebaseline characteristics than the entire population, andthis can result in less biased estimates of theintervention effect. However, stratification may reducethe power of the study to detect intervention effectsbecause the total number of participants in eachstratum will be reduced. Another limitation is that sub-groups may not be balanced with respect to baselinerisk factors, in which case the estimates of the interven-tion effect could still be biased. For this reason, stratifi-cation is often combined with regression techniques.
Tables 1 and 2 present estimates of the associationbetween antipsychotic use and hip fracture obtained intwo comparisons in the Ontario cohort used in theearlier articles in this series.1 2 The results for bothcomparisons were estimated by regression and stratifi-cation strategies.
Assessing analytical strategiesCritical appraisal of observational cohort studiesrequires a basic understanding of regression and strati-fication methods, the assumptions they rely on, andtheir advantages and limitations (table 3). Thestrategies described here may reduce confounding butcannot eliminate it entirely. Readers should ask threequestions when assessing the results of a cohort study.
Are the analytical strategies clearly described?The methods section should be clear enough for read-ers to determine which analytical strategy (such asregression or stratification) was used and how specificconfounders were incorporated. For example, ifregression is used, it is important to know whichvariables were included in the model and how thesevariables were related to the outcome. If stratification isused, it is important to know the variables that wereincluded to define the strata. It is also important toassess the appropriateness of the analytical strategy interms of the assumptions associated with theapproach.
Do different analytical strategies give consistentresults?Both analytical strategies are designed to identify andreduce confounding but they use different techniquesand are based on different assumptions. Use of morethan one analytical strategy can be useful. Althoughobtaining similar results with different analytical strate-gies does not guarantee that confounding has beenreduced, it does provide some support for the results.In contrast, when different analytical strategies give dif-ferent results, it may be useful to review the limitations,advantages, and assumptions of each strategy.
An important step in assessing results of regressionanalyses is to compare adjusted and unadjusted
Table 1 Unadjusted and regression adjusted odds ratio for hip fracture comparingatypical antipsychotic drugs with no antipsychotic in all older people and withstratification for age and sex
No of participants
Unadjusted oddsratio (95% CI)
Regression adjustedodds ratio (95% CI)
Atypicalantipsychotic
Noantipsychotic
All participants 34 960 1 251 435 10.72 (10.18 to 11.30) 2.22 (2.09 to 2.36)
Age 66-75:
Men 4 417 355 755 23.14 (18.92 to 28.31) 3.93 (2.69 to 5.74)
Women 5 345 418 235 15.48 (13.31 to 18.00) 4.11 (3.17 to 5.33)
Age ≥76:
Men 8 823 180 851 7.92 (7.03 to 8.93) 2.53 (2.16 to 2.97)
Women 16 375 296 594 5.19 (4.86 to 5.54) 1.95 (1.78 to 2.13)
Table 2 Unadjusted and regression adjusted odds ratios for hip fracture comparingatypical antipsychotic drugs with typical antipsychotic drugs in patients with dementiaand with stratification for age and sex
No of participants
Unadjusted oddsratio (95% CI)
Regression adjustedodds ratio (95% CI)
Atypicalantipsychotic
Typicalantipsychotic
All participants 21 427 33 263 0.46 (0.44 to 0.50) 0.46 (0.43 to 0.49)
Age 66-75:
Men 2 107 3 220 0.48 (0.36 to 0.63) 0.51 (0.35 to 0.73)
Women 2 297 3 374 0.42 (0.34 to 0.57) 0.45 (0.35 to 0.56)
Age ≥76:
Men 5 914 9 892 0.46 (0.40 to 0.59) 0.45 (0.39 to 0.52)
Women 11 109 16 777 0.47 (0.43 to 0.51) 0.47 (0.43 to 0.51)
Education and debate
Kunin-LunenfeldApplied ResearchUnit, BaycrestCentre for GeriatricCare, TorontoPaula A Rochonsenior scientist
Department ofHealth Policy,Management andEvaluation, Facultyof Medicine,University ofToronto, TorontoGeoffrey MAndersonchair in healthmanagementstrategies
Correspondence to:G M Anderson,Institute for ClinicalEvaluative Sciences,2075 BayviewAvenue, Toronto,ON, CanadaM4N [email protected]
1022 BMJ VOLUME 330 30 APRIL 2005 bmj.com

estimates of the effect. If the adjusted and unadjustedintervention estimates differ greatly, it implies that dif-ferences in baseline characteristics have had a substan-tial effect on the outcome. Table 1 shows a largedifference between the unadjusted and adjusted oddsratio estimates for hip fracture in the total population(10.7 v 2.2). This suggests that the large differences inthe distribution of baseline characteristics were asource of confounding. In contrast, the comparisonrestricted to patients with dementia in table 2 producessimilar unadjusted and adjusted odds ratio estimates.
Most regression models assume a constant relationbetween the outcome and intervention across all base-line characteristics, and stratification provides atechnique for examining this assumption. In table 1,the odds ratios for hip fracture differ greatly across thefour age-sex strata (unadjusted odds ratio from 23.14to 5.19 and adjusted odds ratio from 1.95 to 4.11).These differences suggest an effect modificationbetween use of atypical antipsychotics and age and sex.Stratified analyses using propensity score methodsshow similar results (see bmj.com).
Are the results plausible?Because cohort studies are subject to confoundingfrom unmeasured or unknown confounders, it isalways unclear whether efforts to control confoundingthrough design (such as a randomised controlleddesign) or through more complete or accuratemeasurement and adjustment of confounders wouldgive a different result. One approach to answering thisquestion is to determine the sensitivity of the results tounmeasured confounders. This type of sensitivityanalysis is informed by a review of the literature todetermine the size of the effects of known potentialconfounders, the size of the effects measured in thestudy, and the prevalence of potential confounders.The sensitivity analysis uses simulations that providedirect estimates of the size and degree of imbalance ofthe “unmeasured” confounder needed to negate theresults of the study.6 7 If the study results are sensitive toa small amount of bias, it is important to consider theextent to which confounders were taken into accountin the analysis at the design or analysis stage.
The biological plausibility of the results is also animportant consideration. This is a complex question,
and the issues will vary from study to study. In the studyof the relation between antipsychotic use and hip frac-ture, the drugs could alter the risk of falls (andtherefore the risk of hip fracture) through severalmechanisms. These include sedation, changes inmuscle rigidity, changes in balance, and cardiac effectssuch as hypotension and arrhythmia.
The results of any study should also be placed inthe context of other similar studies including previousobservational studies or randomised controlled trial. Inthe example study, previous studies of psychoactivedrugs and hip fracture have shown similar sizedeffects.8
Concluding remarksRandomised controlled trials and cohort studies areboth subject to problems related to the consistent defi-nition of interventions and outcomes. However, onlycohort studies are subject to selection bias andconfounding due to differences in baseline characteris-tics between the intervention and comparison groups.The questions defined in this series provide asystematic approach that a reader can use to criticallyappraise the design, content, and analysis of a cohortstudy.
We thank Jennifer Gold, Monica Lee, and Michelle Laxer forhelp in preparing this manuscript.Contributors and sources: The series is based on discussionsthat took place at regular meetings of the Canadian Institutesfor Health Research chronic disease new emerging team. SLTNis a senior biostatistician with extensive experience in theoreticaland practical issues related to the design, analysis, and interpre-tation of cohort studies who wrote the first draft of this paperand is the guarantor. PAR and MM commented on drafts of thispaper. KS and PL programmed and conducted analyses. PARand GMA conceived of the idea for the series, worked on draftsof this paper, and coordinated the development of the series.Funding: This work was supported by a Canadian Institutes forHealth Research (CIHR) operating grant (CIHR No. MOP53124) and a CIHR chronic disease new emerging teamprogramme (NET-54010).Competing interests: None declared.
1 Rochon PA, Gurwitz JH, Sykora K, Mamdani M, Streiner DL, Garfinkel S,et al. Readers guide to the critical appraisal of cohort studies: 1. Role anddesign. BMJ 2005;330:895-7.
2 Mamdani, M, Sykora K, Li P, Normand SLT, Streiner DL, Austin PC, et al.Reader’s guide to the critical appraisal of cohort studies: 2. Assessingpotential for confounding. BMJ 2005;330:960-2.
3 Evans S. Matched cohorts can be useful [commentary to Helms M et al.Short and long term mortality associated with foodborne bacterialgastrointestinal infections: registry based study]. BMJ 2003;326:360.
4 Greenlander S, Morgenstern H. Matching and efficiency in cohort stud-ies. Am J Epidemiol 1990;131:151-9.
5 Rosner B. Fundamentals of biostatistics. 5th ed. Pacific Grove, CA: DuxburyPress, 2000.
6 Rosenbaum PR. Sensitivity analyses for certain permutation inferences inmatched observational studies. Biometrika 1987;74:13-26.
7 Schneeweiss S, Wang PS. Association between SSRI use and hip fracturesand the effect of residual confounding bias in claims database studies. JClin Psychopharmacol 2004;24:632-8.
8 Ensrud KE, Blackwell T, Mangione CM, Bowman PJ, Bauer DC, SchwartzA, et al. Central nervous system active medications and risk for fracturesin older women. Arch Intern Med 2003;163:949-57.
(Accepted 18 February 2005)
Table 3 Advantages and disadvantages of analytical strategies
Regression Stratification
Advantages Familiar to researchers Can focus on key confounders
Uses all the data Can be easily used to assess presence of effect modification
Standard software available Standard software available
Disadvantages Comparability of treatment groups difficult to assess Imbalance may still be present within strata
Involves extrapolation Can reduce power
Key questions
Are the analytical strategies clearly described?
Do different analytical strategies used yieldconsistent results?
Are the results plausible?
Education and debate
1023BMJ VOLUME 330 30 APRIL 2005 bmj.com

Evidence Based Reviews in Surgery a joint program of
Canadian Association of General Surgeons L’Association Canadienne des Chirurgiens Généraux
& American College of Surgeons
Methodological Review Package #4
1. What is the clinical question being addressed? To determine if sleep opportunities for attending surgeons and obstetricians/gynecologists are associated with the risk of complications.
2. What is the study design?
This is a matched retrospective cohort study. A cohort study is undertaken to establish a causal association. In the case of a Retrospective Cohort Study, the investigator collects data from past records and does not follow patients up as is the case with a prospective study. However, the starting point of this study is the same as for all Cohort studies. The first objective is still to establish two groups - Exposed versus Nonexposed, in this case patients undergoing postnighttime surgery versus controls. In addition, an effort was made to “match” cases and controls.
3. What is the source of data?
Data sources include hospital charts and discharge summaries. It is not explicitly stated but likely data were retrieved from various administrative data sources from Brigham and Women’s Hospital. As stated, this is a large, tertiary care, urban hospital.
4. Are the data accurate and valid?
Don’t know. The data appear accurate and valid but are hampered by their retrospective nature. In fact, the authors do not specify the actual data sources (ie chart review, discharge summaries, etc). In addition, data abstraction and assessment of complications relies both on chart review and administrative data sets. Both of these methods have inherent weaknesses. In the former, data are interpreted by the data abstractor and are therefore subject to being misinterpreted. In the latter, the data are only as accurate as when they were initially entered and coded in the patients’ charts or administrative database. Studies comparing NSQIP assessment of complications and the assessment obtained from hospital or regional administrative databases show that administrative databases grossly underestimate the nature and severity of complications.
Division of Education

Steinberg SM, Popa MR, Michalek JA, et al. Comparison of risk adjustment methodologies in surgical quality improvement. Surgery 2008;144(4):662-7; discussion 662-7.
5. Are the 2 cohorts adequately matched?
The two cohorts are well matched, apart from a minor (6 month) difference in age in the labor/delivery (L/D) group. Every postnighttime case was matched to several contemporaneous control cases performed by the same physician. Matching relied on administrative data and ICD-9 coding of cases, and is therefore subject to the same limitations of data quality. We are given relatively limited information about the two groups of patients (control cases and postnighttime procedures). It is therefore possible that the two groups are inherently different with respect to a confounding factor, and that this may have an impact on the conclusions. This is one of the limitations of using administrative data: important clinical data which impact on outcome are often not collected and available.
A confounder is a characteristic that is related to the outcome in terms of susceptibility or prognosis, and is unevenly distributed between the groups being compared. In assessing cohort studies, it is important to identify potential confounders and examine their distribution between the groups being compared. In this study, cases and controls were matched primarily based on ICD 9 procedure codes. Major comorbidities were compared between groups and using the Charlson score, however other potential confounders such as re-operative surgery were not specifically addressed.
6. What outcomes were assessed and are they clinically relevant and sensitive?
The primary outcome was the rate of complications in postnighttime procedures compared to controls. In addition, rates of complications were compared between surgeons who had sleep opportunities greater or less than 6 hours prior to the postnighttime procedure. These outcomes are in general clinically relevant, but due to the retrospective/chart review nature of the study are entirely dependent on the correct and detailed documentation having been recorded at the time of the patients’ admission. This decreases the sensitivity of the outcome measures.
7. What are the potential biases? As is the nature of cohort studies, multiple biases are possible. Selection bias is defined as a systematic error in creating the intervention groups causing them to differ with respect to prognosis. The resulting groups differ in measured or unmeasured baseline characteristics because of the way in which participants, in this case patients undergoing surgery, were selected for the study or assigned to their study groups. For instance, it is possible, or perhaps even likely that a surgeon would schedule elective cases that he or she feels are in some way “easier” or more straightforward for the days after a nighttime duty and avoid scheduling cases that are subjectively more difficult. This sort of bias may be extremely difficult to control for, as it may not be objectively quantifiable, but more of a surgical gestalt. In this case several potential confounding variables are not characterized. These include the presence or absence of residents and their state of rest. In addition, it is impossible to determine if the physicians when performing regularly scheduled elective surgery had decreased sleep opportunity (i.e. operating at another institution, up with a sick child, etc). The judging of the preventability of complications may have been subject to reviewers’ hindsight bias.
8. How precise is the estimate of risk? If we refer to the results in table 4, we are given the percentage of complications. We are also given the odds ratio and 95% confidence intervals around these odds ratios. An odds ratio is the ratio of the odds of an event (in this case, complications) in the exposed group to the odds of the same event in a group that is not exposed. The confidence interval is the range of values within which it is probable that the true value of a parameter lies. Thus, the narrower the confidence interval, the more precise the estimate. In this case for the primary study outcome, complications occurred in 101 post- nighttime procedures (5.4%) and 365 control procedures (4.9%) (odds ratio, 1.09; 95% confidence interval [CI], 0.84-1.41). The confidence interval is reasonably narrow, but includes an odds ratio of 1 (same odds in both groups), and so is non-significant. Complications occurred in 82 of 1317 post nighttime procedures with sleep opportunities of 6 hours or less (6.2%) vs 19 of 559 post- nighttime procedures with sleep opportunities of more than 6 hours (3.4%) (odds ratio, 1.72; 95% CI, 1.02-2.89). In this case, the confidence interval is much wider, and narrowly avoids including an odds ratio of 1.
9. What are the results? A total of 919 surgical and 957 obstetrical post nighttime procedures were matched with 3552 and 3945 control procedures, respectively. Complications occurred in 101 post- nighttime procedures (5.4%) and 365 control procedures (4.9%) (odds ratio, 1.09; 95% confidence interval

[CI], 0.84-1.41). Complications occurred in 82 of 1317 post nightime procedures with sleep opportunities of 6 hours or less (6.2%) vs 19 of 559 post- nighttime procedures with sleep opportunities of more than 6 hours (3.4%) (odds ratio, 1.72; 95% CI, 1.02-2.89). Postnighttime procedures completed after working more than than 12 hours (n = 958) compared with 12 hours or less (n = 918) had nonsignificantly higher complication rates (6.5% vs 4.3%; odds ratio, 1.47; 95% CI, 0.96-2.27). Refer to Table 4 in the paper.
10. Should the results of this study be used to implement changes or are further studies required?
The evidence from this cohort study should be used to help establish prospective trials in this area. This cohort study is not sufficient to change practice or establish causality.
11. State the conclusion. Have the authors addressed the question posed? Yes. The rate of complications for surgeons and obstetricians/gynecologists who performed procedures the preceding night was not higher overall than for those who did not. Surgeons who had limited opportunity for sleep did have a higher rate of complication than those who had ample opportunity for sleep.
12. Does the evidence support the conclusion? The evidence from this study underscores the difficulties of clearly establishing a causal relationship between exposure and outcome. Overall the conclusion is supported by the evidence, although the sub group analysis should be interpreted with caution. Prosanto Chaudhury and Members of the Evidence Based Reviews in Surgery Committee

Evidence Based Reviews in Surgery a joint program of
Canadian Association of General Surgeons L’Association Canadienne des Chirurgiens Généraux
& American College of Surgeons
Clinical Review Package #4
Rothschild JM, Keohane CA, Rogers S, et al. Risks of complications by attending physicians after performing nighttime procedures. JAMA 2009;302(14):1565-72 This study expands our knowledge about the role of surgeons’ fatigue in the occurrence of medical errors1. The investigation informs this issue since it examines risks for experienced surgeons (rather than surgical trainees) to commit complications after periods of sleep deprivation. The authors found that surgeons who participated in emergency procedures the night before scheduled surgery, did not have an overall increase in the number of complications in scheduled procedures the next day, but an increased rate of complications was observed among surgeons who had less than six hours of opportunity to sleep between completion of their last night procedure and their first one the next day. The findings of this study are highly relevant to surgeons whose schedules might not allow optimal rest when conducting complex procedures after they have been operating the night before. The data are also relevant to the current teaching environment where, frequently, a large number of trainees must be supervised directly, and with high quality in the operating room, despite fatigue and sleep deprivation in their attending supervising faculty. The data have implications for surgical specialties where sub-specialization has resulted in surgeons participating in multiple and competing call schedules, for example, those of acute surgery, trauma, oncology, transplantation, critical care medicine and hepatobiliary procedures. As acknowledged by the authors, the study outcomes may not be generalizable to all environments since the investigation was completed in an urban, tertiary, sub-specialty referral care centre where resident trainees may have added to or lessened effects of sleep deprivation amongst the attending surgeons who participated. The authors also acknowledge that they could not exclude that surgeons who performed control daytime procedures may also have been awake the night before and experienced consequences of missed sleep opportunity due to work in other capacities. Furthermore, there is clearly a difference between specialties as evidenced by the absence of a significantly increased complication rate in the OBGYN sub-specialty compared with other sub-specialties. Thus, differences related to structures and processes of care in specialties may alter susceptibilities to the effects of rest deprivation, a topic which is currently under investigation to explain variations in complications and mortalities in hospital patients2. The current investigation complements other literature which focuses upon physicians-in-training who have been assigned declining work hours in both the United States and Europe to improve patient safety and doctors’ working conditions3,4. While these legislated reductions to work hours to the 80-hour work week in the United States and to less than 52 hours in European Union countries (going to 48 hours in 2012) may relate to trainees, the relevance to experienced surgeons is less clear. A more recent article has probed the question of whether reduction of
Division of Education
trainees’ work hours has resulted in improved outcomes for patients5: a total of 34 published articles from the past decade were reviewed but there was no clear indication of whether patients were harmed or their outcomes improved as a result of restricted work hours. As acknowledged in that investigation, limitations of the literature were based upon studies of poor quality with retrospective analyses. Only one randomized controlled trial was identified, a problem acknowledged as relating to the inability to have doctors enter a control group where they are subjected to long work shift durations and sleep deprivation. The study by Rothschild et al has likely had limited impact on the practice of many surgeons. Yet the observation that sleep deprivation affects experienced surgeons in some specialties prompts the admonition that practice should change to decrease unsafe levels of fatigue. This is commensurate with patient safety initiatives that herald novel commitments and accreditation standards to reduce adverse outcomes in patient care. Improvements in practice should be achievable through the use of better scheduling to avoid elective procedures after overnight call, enhanced support from hospital-based clinicians (such as physician extenders and advanced nurse practitioners), teamwork to provide backup coverage and education of surgeons about ways to improve sleep hygiene. Further research is warranted. The effects of unsafe levels of fatigue need to be better characterized in experienced surgeons, particularly across different specialties. New studies should examine complications after post night-time procedures in private care settings. It is important that future research should also include a focus on the implications of reducing work hours for surgeons. For example, frequent shift changes, reduced shift lengths and patient hand-offs of care mandated by work hour restriction may yield unacceptable discontinuity of patient care, shortages of surgeon workforce and delays to reach the operating room6. In conclusion, this investigation by Rothschild et al adds rigor to our understanding of the effects of unsafe levels of fatigue in some experienced surgeons. While it is logical to conclude that actions should be taken to restrict surgeons’ work hours, the absence of clear data on the benefit of restricted work hours on outcomes of patient care remains a problem. While further research is conducted to clarify the effects of workplace fatigue on complications, surgeons should adopt a note of caution when performing scheduled procedures after nights on call by improving their scheduling, teamwork, reliance on other health professionals and improving sleep hygiene. Garth Warnock MD University of British Columbia References: 1. Rothschild JM, Keohane CA, Rogers S, et al. Risks of Complications by Attending
Physicians After Performing Nighttime Procedures. Journal of the American Medical Association. 2009;302:1565-1572.
2. Ghaferi AA, Birkmeyer JD, Dimick JB. Variation in hospital mortality associated with in-patient surgery. New England Journal of Medicine 2009; 361:1360-75.
3. Accreditation Council for Graduate Medical Education. Report of the ACGME workgroup on resident duty hours. Chicago, 2002.
4. Department of Health. European Working Time Directive. 2010.

5. Moonesinghe SR, Lowery J, Shahi N, Millen A, Beard JD. Impact of reduction in working hours for doctors in training on postgraduate medical education and patients’ outcomes: systematic review. British Medical Journal. 2011;342:1-13.
6. Buchler P, Kraus TW, Freiss H, Buchler MW. Labor legislation in the European Union has impact on workforce management in surgical centers. Surgery. 2003;134:3-11.

Evidence Based Reviews in Surgery a joint program of
Canadian Association of General Surgeons L’Association Canadienne des Chirurgiens Généraux
& American College of Surgeons
Clinical Review Package #4
Rothschild JM, Keohane CA, Rogers S, et al. Risks of complications by attending physicians after performing nighttime procedures. JAMA 2009;302(14):1565-72 The essence of professionalism lies in placing the interests of one's patient before that of self. In light of that attribute, one can easily see the paradox. If the surgeon is up over the night performing emergency procedures, and a patient has been prepared for the operation the following day, is extraordinarily anxious about it, and has had relatives take off work in order to see it happen, what does the surgeon do if he or she feels fatigued? On the one hand, the interests of the patient to be operated upon might dictate rescheduling the procedure or never having scheduled it in the first place, but this assumes that the professional being entirely intellectually honest has come to the conclusion that the degree of fatigue will impair performance. Libby Zion died on March 5, 1984. Hers is probably one of the most discussed hospitalizations and deaths in all of contemporary medicine. As is well known, her passing led to significant public discussion and eventual legislation in New York State and those laws are usually referred to as the 405 Regulations. While some minor and relatively subjectively phrased regulations were brought to bear upon surgery residencies throughout the 1990s, it was not until the general requirements of the ACGME took effect in 2003 that significant control was brought upon the amount of time that a resident could work. Generally this is of course referred to as the "80 hour workweek." We are now in the newest phase of the ACGME regulations that are taking effect this academic year. There is still no significant movement to control the work hours of the attending physician. The study by Rothschild and colleagues seeks to explore whether physicians who have been on call and have been awake performing procedures for substantial portions of the night have an increased risk of complications in procedures performed the day following that on call period. In the introduction to the article the authors state that little is known about the effects of extended work shifts on the performance of the attending physicians as contrasted with resident physicians. They also admit that "it is possible that experienced attending physicians may be better able to cope with the effects of sleep deprivation than residents." In the overall experience at the institution they found that there were not significantly increased complication rates in such procedures. They do however have some questions in sub segmenting the sleep opportunity of such physicians as to whether or not there might be elevated rates of complications in physicians who perform surgery after an extended duty period or after less than 6 hours of sleep opportunity and conclude that their data suggest that there may be an increased risk of making errors when such physicians are sleep deprived.
Division of Education
While many attending physicians and more than a few residents may recoil at the thought of regulation of sleep hours for all physicians, clearly we must admit that the question should be asked. However, we, the profession should and must ask and scientifically answer the question. It is again intrinsic to the meaning of being a profession that we control our practice and behavior for the maximum good of those we are privileged to serve. In the literature that is extant, the most rigor has been seen from the sleep scientists who advocate for far greater restrictions that are presently in use. While flaws can and have been demonstrated in their studies, it remains for those in the profession who believe that current surgeon sleep habits do not place patients at risk to prove that with the same scientific rigor. If we believe in patient safety as the foremost guide for what we do, then nothing less will suffice. However, if we for the sake of discussion speculate that there should be regulation or at least guidelines, how shall we effectively care for our communities? The Health Policy Research Institute of the American College of Surgeons has determined that there should be 7.53 general surgeons for each 100,000 in the population. Many communities fall far short of that ratio. What further access problems will be engendered by such potential regulations? Alternatively phrased, is it better that there always be a general surgeon available who may on occasion be tired or that there be a well rested surgeon available part of the time? Thomas V Whalen, MD, MMM Chief Medical Officer Lehigh Valley Health Network