perceptual evaluation of colorized nighttime imagery
TRANSCRIPT

Perceptual evaluation of colorized nighttime imagery
Alexander Toeta,b, Michael J. de Jonga,b, Maarten A. Hogervorsta, Ignace T.C. Hoogeb
a TNO, Kampweg 5, 3769DE Soesterberg, The Netherlands b Experimental Psychology, Helmholtz Institute, Utrecht University, Utrecht, The Netherlands
ABSTRACT
We recently presented a color transform that produces fused nighttime imagery with a realistic color appearance (Hogervorst & Toet, 2010, Information Fusion, 11-2, 69-77). To assess the practical value of this transform we performed two experiments in which we compared human scene recognition for monochrome intensified (II) and longwave infrared (IR) imagery, and color daylight (REF) and fused multispectral (CF) imagery. First we investigated the amount of detail observers can perceive in a short time span (the gist of the scene). Participants watched brief image presentations and provided a full report of what they had seen. Our results show that REF and CF imagery yielded the highest precision and recall measures, while both II and IR imagery yielded significantly lower values. This suggests that observers have more difficulty extracting information from monochrome than from color imagery. Next, we measured eye fixations of participants who freely explored the images. Although the overall fixation behavior was similar across image modalities, the order in which certain details were fixated varied. Persons and vehicles were typically fixated first in REF, CF and IR imagery, while they were fixated later in II imagery. In some cases, color remapping II imagery and fusion with IR imagery restored the fixation order of these image details. We conclude that color remapping can yield enhanced scene perception compared to conventional monochrome nighttime imagery, and may be deployed to tune multispectral image representation such that the resulting fixation behavior resembles the fixation behavior for daylight color imagery.
Keywords: image fusion, color transform, color night vision, evaluation, scene gist, eye movements.
1 INTRODUCTION We recently introduced a real-time color transform that enables full color rendering of multispectral nighttime images, giving them a realistic and stable color appearance1. Although the resulting images have the intuitive appearance of daylight images, it has not yet been established whether human visual perception actually benefits from this color transform. The current study was performed to assess whether this new color transform can indeed enhance human visual scene recognition and understanding.
Night vision cameras are a vital source of information for a wide-range of critical military and law enforcement applications such as surveillance, reconnaissance, intelligence gathering, and security2. Common night-time imaging systems cameras are low-light-level cameras, which amplify reflected visible to near infrared (NIR) light, and thermal or long-wave infrared (LWIR) cameras, which convert thermal energy into a visible image. Currently, monochrome display of nightvision imagery is still the standard. However, monochrome nightvision imagery often does not look natural, provides lower feature contrast, and tends to induce visual illusions and fatigue3,4. Moreover, the absence of color severely impairs scene recognition5. Intuitive color representations of nightvision imagery may alleviate these problems6.
Scene understanding and recognition, reaction time, and object identification are faster and more accurate with realistic and diagnostically (and also – though to a lesser extent – non-diagnostically 7) colored imagery than with monochrome imagery8-12. Color also contributes to ultra-rapid scene categorization or gist perception13-16 and drives overt visual attention17. Therefore, appropriately designed false color rendering of nighttime multispectral imagery may improve observer performance and reaction times in tasks that involve scene segmentation and classification18-23.
In this study we performed two observer experiments to investigate whether human visual scene perception indeed benefits from a realistic color representation of multispectral nighttime imagery. In the first experiment observers were asked to give a detailed description of briefly presented night vision images in a free-recall paradigm. The night vision modalities tested were intensified visual (II), longwave infrared (IR), color fused multispectral (CF; produced with our new color mapping algorithm1), and digital daytime color photographs (REF). As stated before, we hypothesized that
Human Vision and Electronic Imaging XIX, edited by Bernice E. Rogowitz, Thrasyvoulos N. Pappas, Huib de Ridder, Proc. of SPIE-IS&T Electronic Imaging, Proc. of SPIE Vol. 9014, 901412
© 2014 SPIE-IS&T · CCC code: 0277-786X/14/$18 · doi: 10.1117/12.2042409
SPIE-IS&T/Vol. 9014 901412-1
Downloaded From: http://proceedings.spiedigitallibrary.org/ on 03/04/2014 Terms of Use: http://spiedl.org/terms

observers would be able to extract information from imagery in the REF and CF categories more accurately and with less effort than from imagery in the II or IR categories. We expected (H1) that imagery in the REF category would yield the most complete and most accurate image descriptions, followed by imagery in the CF, II and IR categories (in that order). In the second experiment we registered the fixation behavior of observers who freely explored imagery from each of the four categories investigated. Our second hypothesis was (H2) that fixation behavior for REF and CF imagery would be similar, since realistically colored multispectral nighttime imagery (CF) should be equally informative (and therefore drive fixation behavior in a similar way) as daytime color imagery (REF). Our third hypothesis was (H3) that fixation behavior for both REF and CF imagery would be different from fixation behavior for II and IR imagery, since observers probably have more difficulty extracting information from grayscale nighttime imagery than from either colorized multispectral imagery or daytime photographs.
The rest of this paper is as follows. First (for the sake of completeness) we briefly present the color fusion algorithm. Then we will present the method, results and discussion of respectively a scene gist experiment and an eye movement study. Finally we will present our conclusions.
2 COLOR REMAPPING Our color remapping technique is based on the assumption that there is a fixed relation between false color tuples and natural color triplets for bands near the visual spectrum 1. This allows its implementation as a simple color table swapping operation. For bands that are not correlated with the visual spectrum (e.g., LWIR) this assumption evidently does not apply. In that case, the color remapping can for instance be deployed to enhance the detectability of targets through contrast enhancement and color highlighting24. Color remapping is achieved by mapping the multi-band sensor signal to an indexed false color image and swapping its color table with that of a regular daylight color image of a similar scene. Different (e.g., urban, rural, maritime, or desert) environments may require specific color tables. However, in practice an entire environment is well represented by a single color table, as long as the environmental characteristics don’t change too drastically25. Thus, only a limited number of color tables is required in practice. These tables need to be constructed only once, before the system is deployed.
When both a multispectral and a daylight color image are available of the same scene a realistic color mapping can be obtained by establishing a direct relation between the values of corresponding pixels in both images 1. When there is only an indexed daylight color image available representing an environment similar to the one in which the multispectral sensor suite will be deployed, a mapping can still be established by transferring the color statistics of the daylight image to the multispectral image26. Although the first approach yields more specific colors, both approaches produce intuitively correct and stable color representations.
For the sake of completeness we will briefly describe our color transformation here, using the example shown in Figure 1 (an extensive description is presented elsewhere1). Figure 1a depicts the full color daytime reference image, which is in this case a color photograph taken with a standard digital camera. Figure 1b and c respectively show a visible and near-infrared image of the same scene. Figure 1f shows the result of applying daytime colors to the two-band night-time sensor image using our new color mapping technique. The color transfer method works as follows. First, the multi-band sensor image is transformed to a false-color image by taking the individual visual and NIR bands (Figures 1b and 1c respectively) as input to the R and G channels, referred to as the RGB-image (Figure 1d). In practice any other combination of two channels can also be used (one could just as well use the combinations R & B or B & R). Mapping the two bands to a false color RGB-image allows us to use standard image conversion techniques, such as indexing27. In the next step the resulting false color (RGB-image) Figure 1d is converted to an indexed image. Each pixel in such an image contains a single index. The index refers to an RGB-value in a color look-up table (the number of entries can be chosen by the user). In the present example of a sensor image consisting of two bands (R and G; Figure 1d) the color look-up table contains various combinations of R and G values (the B-values are set to zero when the sensor or sensor pair provides only two bands). For each index representing a given R,G combination (a given false color) the corresponding realistic color equivalent is obtained by locating the pixels in the target image with this particular index and finding the corresponding pixels in the (realistic color) reference image (Figure 1a). First, the RGB-values are converted to perceptually de-correlated lαβ values28. Next, the average lαβ-vector is calculated over this ensemble of pixels. This assures that the computed average color reflects the perceptual average color. Averaging automatically takes the distribution of the pixels into account: colors that appear more frequently are attributed a greater weight. For instance, let us assume that we would like to derive the realistic color associated with color index i. In that case we locate
SPIE-IS&T/Vol. 9014 901412-2
Downloaded From: http://proceedings.spiedigitallibrary.org/ on 03/04/2014 Terms of Use: http://spiedl.org/terms

(e) (f)
all pixels in the (indexed) false color multi-band target image with color index i. We then collect all corresponding pixels (i.e., pixels with the same image coordinates) in the reference daytime color image, convert these to lαβ, and calculate the average lαβ-value of this set. Next, we transform the resulting average lαβ-value back to RGB. Finally, we assign this RGB-value to index i of the new color look-up table. These steps are successively carried out for all color indices. This process yields a new color look-up table containing the realistic colors associated with the various multi-band combinations in the false color (RGB) color look-up table. Replacing the RGB-color look-up table (left side of Figure 1e) by the realistic color look-up table (right side of Figure 1e) yields an image with a realistic color appearance, in which the colors are optimized for this particular sample set (Figure 1f).
Figure 1. Example of color remapping Gecko (dual band visual + near infrared) imagery. (a) Daylight color reference image. Visible (b) and near-infrared (c) nighttime images of the same scene provided by the Gecko system. (d) Intermediate RG false color representation of (b) and (c), obtained by assigning (b) to the green and (c) to the red channel of an RGB color image (the blue channel is set to zero). (e) Color mapping derived from corresponding pixel pairs in (a) and (d). (f) Output of the Gecko system, obtained by applying the mapping scheme in (d) to the intermediate two band false color image in (e). The list of key elements that served as ground truth for this particular scene consisted of the following four elements: {shrubs, trees, building, grass}.
SPIE-IS&T/Vol. 9014 901412-3
Downloaded From: http://proceedings.spiedigitallibrary.org/ on 03/04/2014 Terms of Use: http://spiedl.org/terms
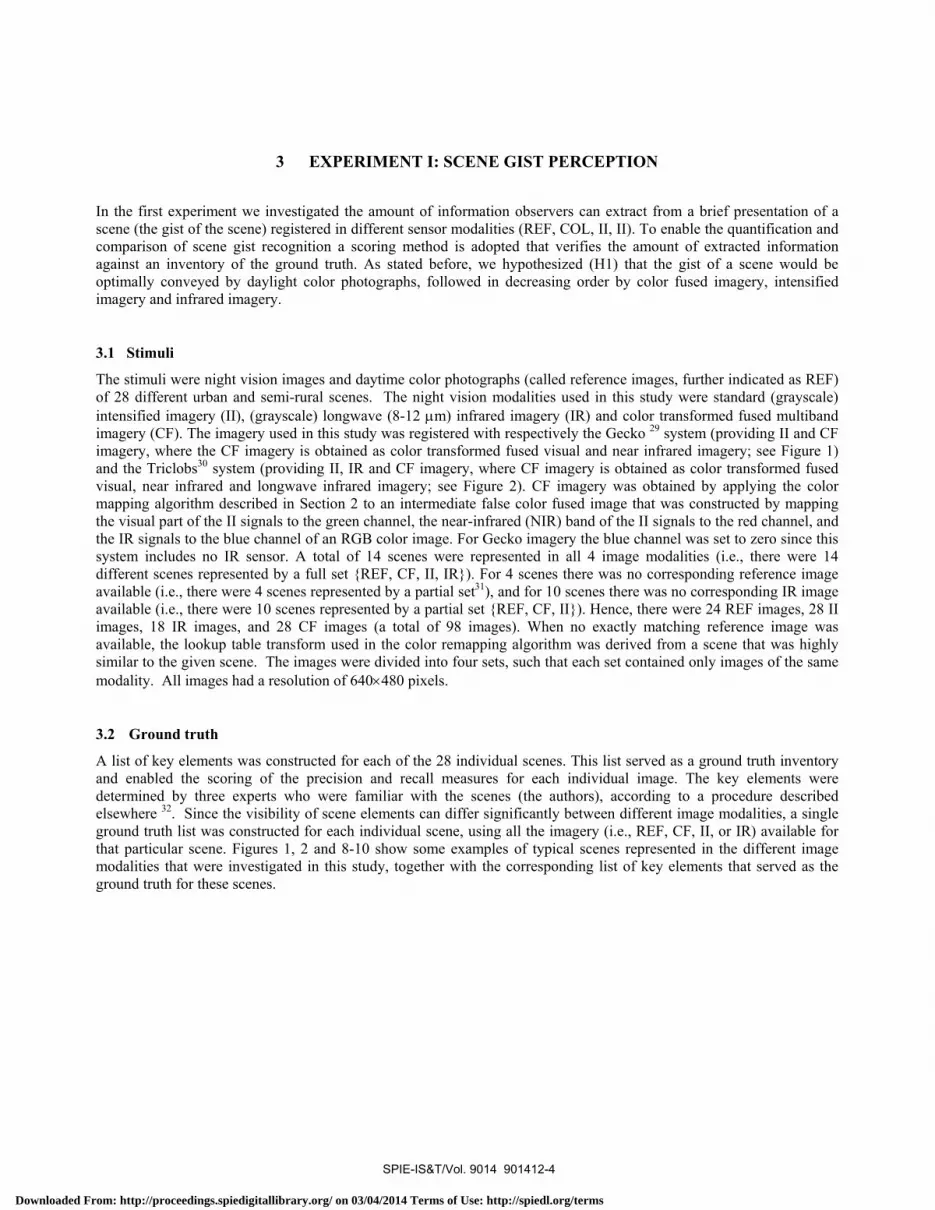
3 EXPERIMENT I: SCENE GIST PERCEPTION
In the first experiment we investigated the amount of information observers can extract from a brief presentation of a scene (the gist of the scene) registered in different sensor modalities (REF, COL, II, II). To enable the quantification and comparison of scene gist recognition a scoring method is adopted that verifies the amount of extracted information against an inventory of the ground truth. As stated before, we hypothesized (H1) that the gist of a scene would be optimally conveyed by daylight color photographs, followed in decreasing order by color fused imagery, intensified imagery and infrared imagery.
3.1 Stimuli
The stimuli were night vision images and daytime color photographs (called reference images, further indicated as REF) of 28 different urban and semi-rural scenes. The night vision modalities used in this study were standard (grayscale) intensified imagery (II), (grayscale) longwave (8-12 μm) infrared imagery (IR) and color transformed fused multiband imagery (CF). The imagery used in this study was registered with respectively the Gecko 29 system (providing II and CF imagery, where the CF imagery is obtained as color transformed fused visual and near infrared imagery; see Figure 1) and the Triclobs30 system (providing II, IR and CF imagery, where CF imagery is obtained as color transformed fused visual, near infrared and longwave infrared imagery; see Figure 2). CF imagery was obtained by applying the color mapping algorithm described in Section 2 to an intermediate false color fused image that was constructed by mapping the visual part of the II signals to the green channel, the near-infrared (NIR) band of the II signals to the red channel, and the IR signals to the blue channel of an RGB color image. For Gecko imagery the blue channel was set to zero since this system includes no IR sensor. A total of 14 scenes were represented in all 4 image modalities (i.e., there were 14 different scenes represented by a full set {REF, CF, II, IR}). For 4 scenes there was no corresponding reference image available (i.e., there were 4 scenes represented by a partial set31), and for 10 scenes there was no corresponding IR image available (i.e., there were 10 scenes represented by a partial set {REF, CF, II}). Hence, there were 24 REF images, 28 II images, 18 IR images, and 28 CF images (a total of 98 images). When no exactly matching reference image was available, the lookup table transform used in the color remapping algorithm was derived from a scene that was highly similar to the given scene. The images were divided into four sets, such that each set contained only images of the same modality. All images had a resolution of 640×480 pixels.
3.2 Ground truth
A list of key elements was constructed for each of the 28 individual scenes. This list served as a ground truth inventory and enabled the scoring of the precision and recall measures for each individual image. The key elements were determined by three experts who were familiar with the scenes (the authors), according to a procedure described elsewhere 32. Since the visibility of scene elements can differ significantly between different image modalities, a single ground truth list was constructed for each individual scene, using all the imagery (i.e., REF, CF, II, or IR) available for that particular scene. Figures 1, 2 and 8-10 show some examples of typical scenes represented in the different image modalities that were investigated in this study, together with the corresponding list of key elements that served as the ground truth for these scenes.
SPIE-IS&T/Vol. 9014 901412-4
Downloaded From: http://proceedings.spiedigitallibrary.org/ on 03/04/2014 Terms of Use: http://spiedl.org/terms
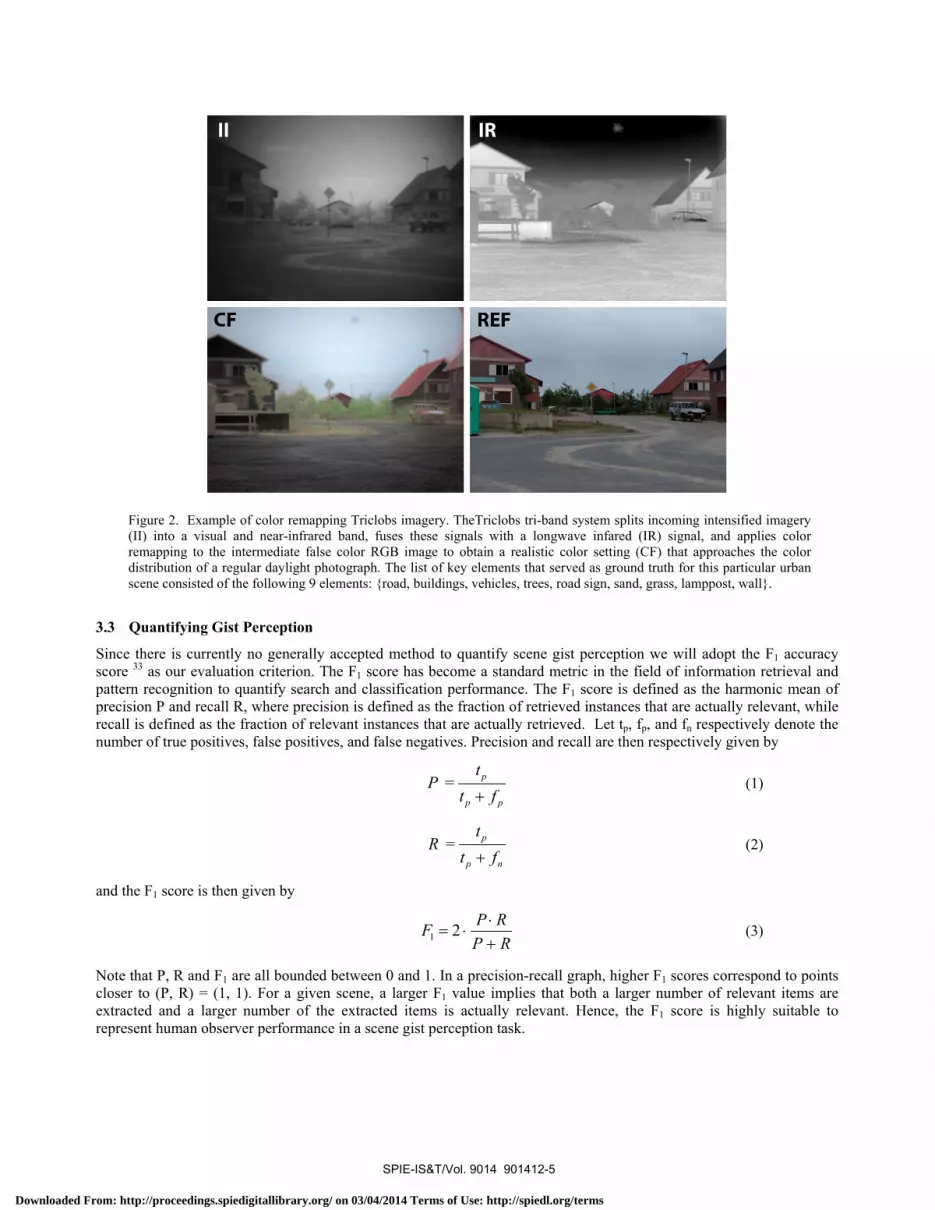
Figure 2. Example of color remapping Triclobs imagery. TheTriclobs tri-band system splits incoming intensified imagery (II) into a visual and near-infrared band, fuses these signals with a longwave infared (IR) signal, and applies color remapping to the intermediate false color RGB image to obtain a realistic color setting (CF) that approaches the color distribution of a regular daylight photograph. The list of key elements that served as ground truth for this particular urban scene consisted of the following 9 elements: {road, buildings, vehicles, trees, road sign, sand, grass, lamppost, wall}.
3.3 Quantifying Gist Perception
Since there is currently no generally accepted method to quantify scene gist perception we will adopt the F1 accuracy score 33 as our evaluation criterion. The F1 score has become a standard metric in the field of information retrieval and pattern recognition to quantify search and classification performance. The F1 score is defined as the harmonic mean of precision P and recall R, where precision is defined as the fraction of retrieved instances that are actually relevant, while recall is defined as the fraction of relevant instances that are actually retrieved. Let tp, fp, and fn respectively denote the number of true positives, false positives, and false negatives. Precision and recall are then respectively given by
= p
p p
tP
t f+ (1)
= p
p n
tR
t f+ (2)
and the F1 score is then given by
1 2 P RFP R⋅
= ⋅+
(3)
Note that P, R and F1 are all bounded between 0 and 1. In a precision-recall graph, higher F1 scores correspond to points closer to (P, R) = (1, 1). For a given scene, a larger F1 value implies that both a larger number of relevant items are extracted and a larger number of the extracted items is actually relevant. Hence, the F1 score is highly suitable to represent human observer performance in a scene gist perception task.
SPIE-IS&T/Vol. 9014 901412-5
Downloaded From: http://proceedings.spiedigitallibrary.org/ on 03/04/2014 Terms of Use: http://spiedl.org/terms
3.4 Participants
A total of 81 participants (40 males and 41 females, mean age= 31.2, SD=12.3) performed the experiment. The participants were randomly assigned to one of four groups, based on stimulus type. As a result 20 participants viewed 24 REF images, 20 participants viewed 28 CF images, 19 participants viewed 28 II images, and 22 participants viewed 18 IR images. All participants had self-reported normal or corrected to normal vision and no color deficiencies.
3.5 Procedure and Task
The test application started by presenting written information about the experimental procedure and the user instructions. The information stated that a number of test images would be presented in the course of the experiment, and the observer was asked to provide an accurate and detailed description of the content of each test image immediately following its presentation. To illustrate the purpose of the experiment and to familiarize the participants with the type of images that would be presented, two example images (of the same modality but not part of the test set) were first shown, together with a written description of their content. To encourage the participants to provide a detailed account of their percept the written descriptions accompanying the example images were quite extensive. The participants were further informed that each stimulus presentation interval would consist of a brief (500 ms) presentation of a test image preceded for 2 s by a black fixation cross in the middle of a white screen, and followed by a briefly (500 ms) presented random noise image. They were instructed to fixate the cross for 2 s until the test image appeared, and to type in a free-format accurate and detailed description of the test image in a text box that would appear immediately following the noise image. After reading the introduction, the participants could start the actual experiment by pointing and clicking on a button on the screen labeled “Next”. The test images were shown on a white background. The observers were given unlimited time to enter their description of the test image in the text box. After typing in their stimulus description they could start the presentation of the next stimulus by pointing and clicking on a button on the screen labeled “Next”. Note that a presentation time of 500 ms is commonly accepted as sufficient for perceiving a natural scene and most of its contents 32,34-36.
3.6 Results
Each image description provided by the participants was evaluated by computing a precision and recall value. This was done by scoring the elements mentioned in the description returned by the participants against the corresponding ground truth inventory (the list of key elements) for the corresponding scene 32.
A between factors ANOVA revealed a significant difference between the F1 scores for the different types of imagery tested (F (3, 77) = 34.03, p < 0.001, ηp
2 = 0.57). Bonferroni post-hoc tests revealed that participants in the color fused (CF) image condition had a significantly higher F1 values then participants in the intensified image (II) and infrared image (IR) conditions (both p values < 0.001). Participants in the daylight color image (REF) condition did not differ significantly on the F1 value from participants in the CF image condition (p = 0.629). Figure 3 shows the mean (over all observers and all scenes) F1 scores for each of the 4 images modalities tested. The higher F1 score in the CF condition means that participants were able to correctly identify more objects and had better scene recognition, suggesting that the gist of the scene was conveyed better by CF than by either II or IR imagery. The individual precision and recall measures can further clarify this result (Figure 4). Participants in the CF condition scored significantly higher on both precision and recall than participants in the II and IR condition. Note that participants in the CF condition yielded similar precision but higher recall scores as participants in the REF condition. This implies that CF imagery (1) clearly conveys the identity of relevant scene elements (leading to a similar precision for CF as for REF), while (2) CF imagery clearly represents a larger amount of relevant scene elements. This is most likely a direct result of the increased informativeness of the CF imagers due to the fusion of multiple spectral bands. Participants in the intensified image and infrared condition on the other hand were less precise and made more mistakes in what they thought they perceived, resulting in a higher false positive rate. Persons and terrain features are almost always correctly recalled in both REF and CF imagery, while participants in the II condition often failed to detect persons.
3.7 Discussion
The present results confirm our hypothesis H1 that the gist of a scene is conveyed better (i.e., to a larger extent and more accurately) with color fused and daylight color images then with infrared and intensified image images. Participants in the CF and REF condition recalled more details and were more precise than participants in the IR and II conditions. The fact there is no significant difference between gist perception with CF and REF images suggests that our multispectral color rendering conveys the gist of the scenes used in this study just as well as regular daylight color photographs.
SPIE-IS&T/Vol. 9014 901412-6
Downloaded From: http://proceedings.spiedigitallibrary.org/ on 03/04/2014 Terms of Use: http://spiedl.org/terms

0.7
0.6 -4
a0.5-#
##
v .L
0.1
0.0REF CF II IR
1.0
0.9 -
0.8 -
0.7 -
o
A
o
o REF
CF
0.2 0.3 0.4
Mean Recall
n II
OIR
0.5 0.6
Figure 3. Mean (over all observers and all scenes) F1 scores for the four images modalities (CF, REF, II and IR) investigated in this study. The error bars represent the standard error of the mean.
Figure 4. Mean (over all observers and all scenes) precision and recall scores for the four images modalities (CF, REF, II and IR) investigated in this study.
SPIE-IS&T/Vol. 9014 901412-7
Downloaded From: http://proceedings.spiedigitallibrary.org/ on 03/04/2014 Terms of Use: http://spiedl.org/terms

4 EXPERIMENT II: GAZE BEHAVIOR 4.1 Stimuli
The stimuli used in this experiment were the same four sets of respectively REF, CF, II and IR images that were also used in Experiment I. To enhance the resolution of the eye tracking data the size of the original images (640×480 pixels) was enlarged with a factor 2 for display using bicubic interpolation and subsampling.
4.2 Apparatus and Set-up
Matlab (www.mathworks.com) with the Psychophysics Toolbox 3 (psychtoolbox.org) was used to display the images on a monitor (refresh rate: 60 Hz) and to record eye movement data. During the experiment the participants were comfortably seated in front of the monitor. A chinrest was used to prevent head movement and to ensure that the participants remained at a fixed viewing distance of 56 cm from the monitor. An easyGaze eye tracker (designinteractive.net) was used to register eye fixations with a sampling frequency of 52 Hz. The declared system accuracy by the manufacturer is 0.5 deg, which, at a viewing distance of 56 cm, is equivalent to about 18 pixels. QuickGLANCE 6.5.0.3 software (www.eyetechaac.com) was used to calibrate and measure eye movements.
4.3 Participants
A total of 100 participants (39 males and 61 females, mean age= 21.4, SD=2.5) performed the experiment. All participants had self-reported normal or corrected to normal vision and no color deficiencies. The participants were randomly divided into four groups of 25 persons each. Each group viewed all images from only one of the four image modalities (i.e., either REF, CF, II or IR).
4.4 Procedure and Task
The experiment started with a nine-point calibration procedure to calibrate the eye tracker for each individual participant. Participants were then instructed (i) to fixate a cross that appeared in the center of the screen prior to each stimulus presentation, (ii) to start the next stimulus presentation by pressing the spacebar button on the computer keyboard, and (iii) to freely inspect the image that was presented between 0.5 - 1 seconds after pressing the spacebar and for at most five seconds (maximal presentation duration). To speed up the experiment participants were able to continue to the next image (by pressing the spacebar again) when they had completely inspected the image. This procedure was repeated until the participant had inspected all images from a given set.
4.5 Results
Fixation duration, number of fixations and number of fixations per second were analyzed for all scenes and image modalities using R software (www.r-project.org). There was no significant difference between the image modalities for the mean fixation duration (F(3, 96) = .520, p = .669; see Figure 5), the mean number of fixations ( F(3, 96) = .150, p = .930; see Figure 6), or the mean number of fixations per second (F(3, 96) = 1,427, p = .240; Figure 7). Hence, these data provide no support for both our hypotheses H2 (similar fixation behavior for REF and CF imagery) and H3 (fixation behavior for both REF and CF imagery would be different from fixation behavior for II and IR imagery). These results indicate that participants looked at the same number of elements for the same amount of time at roughly the same speed in all image modalities. This does, however, not mean that participants also looked at the same type of elements.
To investigate the type of details that were actually inspected by the observers the fixation distributions (computed from the data of all observers) were visualized as heat maps and superimposed on the corresponding images using Matlab (e.g., Figure 8). On first sight these heatmaps appear quite similar for the different image modalities. On closer inspection, it appears that color remapping in some cases increases the similarity of human fixation behavior to that on REF imagery. For instance, Figure 9 and Figure 10 show that after color remapping of (the visual and NIR bands of) the II signal the heat maps of the REF images appear more similar to the heat maps of the CF images than to the heat maps of the II images.
It is difficult to accurately establish where the participants fixated due to the limited resolution of the fixation registration device and the inherent behavioral variation between observers. A solution for this problem is to define extended regions-of-interest (ROIs) and to compare viewing behavior for the same ROIs across different image modalities37. For each scene we therefore defined several (between 1 and 6, median number of 4) ROIs, based on the heat maps and the list of key elements resulting from the gist experiment. These ROIs represented the scene elements that were both (1) fixated by most observers in this experiment and (2) that were also named most frequently by participants in Experiment
SPIE-IS&T/Vol. 9014 901412-8
Downloaded From: http://proceedings.spiedigitallibrary.org/ on 03/04/2014 Terms of Use: http://spiedl.org/terms

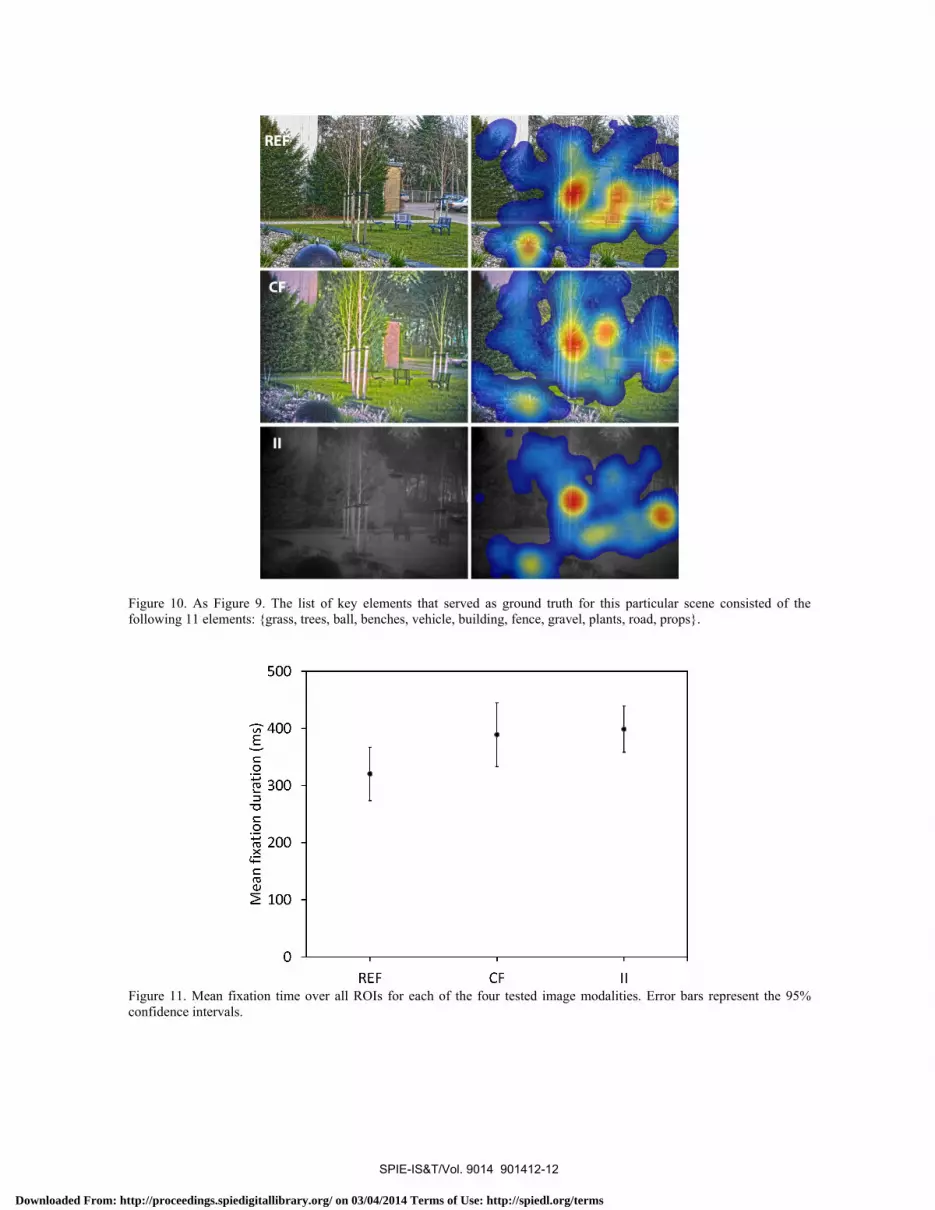
I. In addition, we also included ROIs representing scene areas that yielded notable differences in heat maps (based on visual inspection) across image modalities. The mean overall gaze duration was calculated for each ROI and analyzed using a between factors ANOVA. Since our main interest is whether the addition of color to multispectral imagery can enhance scene processing up to the level of regular daylight color imagery, we only analyzed fixations in the ROIs for the REF, CF, and II image modalities. The IR modality was not considered here since its representation of many of the scene elements is often quite distinct from the other three image modalities. Mean overall gaze duration was not significantly different between the ROIs in the REF, CF and II image modalities (F(2, 72) = 3.02 , p= .055; see Figure 11). Since our procedure to define the ROIs may have been biased we repeated our analysis for arbitrary ROIs defined as the cells of a regular rectangular image grid, for grid sizes of respectively 4×4, 6×6 and 8×8 pixels. Again we found no significant difference between the mean overall gaze duration across the different image modalities.
To get a better notion of where - and in what order - participants fixated the scenes we also compared individual scan paths between image modalities. It appears that the initial fixations in the REF, CF and IR conditions are typically towards persons and vehicles (when present in the scene), whereas these details are typically inspected at a much later stage in the scan process in the II condition. This suggests that persons and vehicles were more salient in the REF, CF and IR conditions then in the II condition.
4.6 Discussion
The results of Experiment II indicate that participants looked at approximately the same number of elements for about the same amount of time at roughly the same speed in all image modalities tested in this study. Although the overall fixation behavior was similar across image modalities, the fixation order showed some variations. In some cases, persons and vehicles were fixated first in REF, CF and IR imagery, while these items were fixated at a later stage in the scanning of II imagery, indicating that persons and vehicles were less salient in II imagery. It appears that color remapping an II signal and fusion with an IR band may both serve to restore the fixation order of image details by boosting their saliency levels in the resulting CF image to the levels in the REF image.
5 CONCLUSIONS From Experiment I we found no significant difference between the perception of scene gist with CF and REF images. This suggests that our multispectral color rendering conveys the gist of the scenes used in this study just as well as regular daylight color photographs. Also, participants in the IR and II conditions recalled significantly less details and were less precise than participants in the CF and REF condition.
Experiment II showed that participants looked at the same amount of elements for the same amount of time at roughly the same speed in all image modalities tested in this study. For most scenes, human fixation behavior did not differ between image modalities. In natural viewing conditions eye movements are guided both (1) by the low-level stimulus features (e.g., a scene’s luminance, color, edge distribution38-40) and (2) by subjectively or semantically informative regions (e.g., the viewer’s task and goals and scene familiarity38,41). However, it has been found that even in neutral viewing tasks (watching images with neutral content in the absence of a particular task) cognitive factors override the low-level factors in fixation selection: regions with high semantic importance attract fixations regardless of their saliency42. As a result fixation selection is robust for low level image manipulations such as contrast modulation and color to grayscale conversion43. This may explain our current finding that fixation behavior is highly similar across different image modalities.
Although the overall fixation behavior was similar across image modalities, the order of the fixated elements differed between image modalities for some scenes. For instance, persons and vehicles were sometimes fixated earlier in REF, CF and IR imagery than in II imagery. This is probably because these elements are often represented at low contrast in II imagery, while they are easily visible in REF and CF imagery and depicted at high contrast in IR imagery. We found that color remapping an II signal and fusion with an IR band may both serve to restore the fixation order of image details by boosting their saliency levels in the resulting CF image to the levels in the REF image. This finding can be used (1) to tune multispectral color fusion such that the resulting fixation behavior resembles the fixation behavior corresponding to daylight color imagery, or (2) to enhance the detectability and recognition of features of interest (e.g., camouflage breaking).
SPIE-IS&T/Vol. 9014 901412-9
Downloaded From: http://proceedings.spiedigitallibrary.org/ on 03/04/2014 Terms of Use: http://spiedl.org/terms

500
400 -E
T
IT
Q1
E 300 -+7,
coc;} 200 -cCOCD
1
100
o
REF CF II IR
15
i
I`,L) 1fl _
0
REF CF II IR
4
T
1
- 1 -
0
REF CF II IR
Figure 5. Mean fixation time for each of the four tested image modalities. Error bars represent the 95% confidence intervals.
Figure 6. Mean number of fixations for each of the four tested image modalities. Error bars represent the 95% confidence intervals.
Figure 7. Mean number of fixations per second or each of the four tested image modalities. Error bars represent the 95% confidence intervals
SPIE-IS&T/Vol. 9014 901412-10
Downloaded From: http://proceedings.spiedigitallibrary.org/ on 03/04/2014 Terms of Use: http://spiedl.org/terms

Figure 8. Fixation distribution (for all observers) plotted as heat maps and superimposed on the corresponding scene. The list of key elements that served as ground truth for this particular scene consisted of the following 9 elements: {houses, garage, chair, person, tree, fence, shrubs, grass, road}.
Figure 9. After color remapping (the visual and NIR bands of) the II signal the corresponding heat map becomes more similar to the heat map of the REF image. The list of key elements that served as ground truth for this particular scene consisted of the following 8 elements: {grass, trees, street bench, road sign, buildings, vehicles, bicycle path, lamppost}.
SPIE-IS&T/Vol. 9014 901412-11
Downloaded From: http://proceedings.spiedigitallibrary.org/ on 03/04/2014 Terms of Use: http://spiedl.org/terms
500
-, 400 -E
F, i
i
cßa100 -
0
REF CF II
Figure 10. As Figure 9. The list of key elements that served as ground truth for this particular scene consisted of the following 11 elements: {grass, trees, ball, benches, vehicle, building, fence, gravel, plants, road, props}.
Figure 11. Mean fixation time over all ROIs for each of the four tested image modalities. Error bars represent the 95% confidence intervals.
SPIE-IS&T/Vol. 9014 901412-12
Downloaded From: http://proceedings.spiedigitallibrary.org/ on 03/04/2014 Terms of Use: http://spiedl.org/terms

REFERENCES
[1] Hogervorst, M.A. and Toet, A., "Fast natural color mapping for night-time imagery," Information Fusion, 11(2) ,pp. 69-77, 2010.
[2] Blum, R.S. and Liu, Z., "Multi-sensor image fusion and its applications", CRC Press, Taylor & Francis Group, Boca Raton, Florida, USA, 2006.
[3] Kooi, F.L. and Toet, A., "What's crucial in night vision goggle simulation ?," In: J.G. Verly (Ed.), Enhanced and Synthetic Vision 2005,SPIE-5802, pp. 37-46, The International Society for Optical Engineering, Bellingham, WA., USA, 2005.
[4] Berkley, W.E., "Night vision goggle illusions and visual training," In: Visual problems in night operations,AGARD-LS-187, pp. 9-1-9-6, North Atlantic Treaty Organization, Neuilly-sur-Seine Cedex, France, 1992.
[5] Stuart, G.W. and Hughes, P.K., "Towards an understanding of the effect of night vision display imagery on scene recognition," Ergonomics Open Journal, 2 ,pp. 150-158, 2009.
[6] Toet, A. and Hogervorst, M.A., "Progress in color night vision," Optical Engineering, 51(1) ,pp. 010901-1-19, 2012. [7] Bramão, I., Reis, A., Petersson, K.M. and Faísca, L., "The role of color information on object recognition: A review
and meta-analysis," Acta Psychologica, 138(1) ,pp. 244-253, 2011. [8] Sampson, M.T. "An assessment of the impact of fused monochrome and fused color night vision displays on
reaction time and accuracy in target detection", AD-A321226, Naval Postgraduate School, Monterey, CA, 1996. [9] Spence, I., Wong, P., Rusan, M. and Rastegar, N., "How color enhances visual memory for natural scenes,"
Psychological Science, 17(1) ,pp. 1-6, 2006. [10] Gegenfurtner, K.R. and Rieger, J., "Sensory and cognitive contributions of color to the recognition of natural
scenes," Current Biology, 10(13) ,pp. 805-808, 2000. [11] Wichmann, F.A., Sharpe, L.T. and Gegenfurtner, K.R., "The contributions of color to recognition memory for
natural scenes," Journal of Experimental Psychology: Learning, Memory, and Cognition, 28(3) ,pp. 509-520, 2002.
[12] Tanaka, J.W. and Presnell, L.M., "Color diagnosticity in object recognition," Perception & Psychophysics, 61(6) ,pp. 1140-1153, 1999.
[13] Castelhano, M.S. and Henderson, J.M., "The influence of color on the perception of scene gist," Journal of Experimental Psychology: Human Perception and Performance, 34(3) ,pp. 660-675, 2008.
[14] Rousselet, G.A., Joubert, O.R. and Fabre-Thorpe, M., "How long to get the "gist" of real-world natural scenes?," Visual Cognition, 12(6) ,pp. 852-877, 2005.
[15] Goffaux, V., Jacques, C., Mouraux, A., Oliva, A., Schyns, P. and Rossion, B., "Diagnostic colours contribute to the early stages of scene categorization: Behavioural and neurophysiological evidence," Visual Cognition, 12(6) ,pp. 878-892, 2005.
[16] Oliva, A. and Schyns, P.G., "Diagnostic colors mediate scene recognition," Cognitive Psychology, 41 ,pp. 176-210, 2000.
[17] Frey, H.-P., Honey, C. and König, P., "What's color got to do with it? The influence of color on visual attention in different categories," Journal of Vision, 8(14) ,pp. 6-1-6-17, 2008.
[18] Essock, E.A., Sinai, M.J., McCarley, J.S., Krebs, W.K. and DeFord, J.K., "Perceptual ability with real-world nighttime scenes: image-intensified, infrared, and fused-color imagery," Human Factors, 41(3) ,pp. 438-452, 1999.
[19] Sinai, M.J., McCarley, J.S., Krebs, W.K. and Essock, E.A., "Psychophysical comparisons of single- and dual-band fused imagery," In: J.G. Verly (Ed.), Enhanced and Synthetic Vision 1999,SPIE-3691, pp. 176-183, The International Society for Optical Engineering, Bellingham, WA, 1999.
[20] Toet, A., IJspeert, J.K., Waxman, A.M. and Aguilar, M., "Fusion of visible and thermal imagery improves situational awareness," In: J.G. Verly (Ed.), Enhanced and Synthetic Vision 1997,SPIE-3088, pp. 177-188, International Society for Optical Engineering, Bellingham, WA, USA, 1997.
[21] Toet, A. and IJspeert, J.K., "Perceptual evaluation of different image fusion schemes," In: I. Kadar (Ed.), Signal Processing, Sensor Fusion, and Target Recognition X,SPIE-4380, pp. 436-441, The International Society for Optical Engineering, Bellingham, WA, 2001.
[22] Varga, J.T. "Evaluation of operator performance using true color and artificial color in natural scene perception", AD-A363036, Naval Postgraduate School, Monterey, CA, 1999.
[23] White, B.L. (1998). Evaluation of the impact of multispectral image fusion on human performance in global scene processing. Monterey, CA: Naval Postgraduate School.
SPIE-IS&T/Vol. 9014 901412-13
Downloaded From: http://proceedings.spiedigitallibrary.org/ on 03/04/2014 Terms of Use: http://spiedl.org/terms

[24] Hogervorst, M.A. and Toet, A., "Evaluation of a color fused dual-band NVG," In: B.V. Dasarathy (Ed.), Multisensor, Multisource Information Fusion: Architectures, Algorithms, and Applications 2009,SPIE-7345, pp. 734502-1-734502-7, SPIE - The International Society for Optical Engineering, Bellingham, WA, 2009.
[25] Hogervorst, M.A. and Toet, A., "Presenting nighttime imagery in daytime colours," In: Proceedings of the 11th International Conference on Information Fusion, pp. 706-713, International Society of Information Fusion, Cologne, Germany, 2008.
[26] Toet, A., "Natural colour mapping for multiband nightvision imagery," Information Fusion, 4(3) ,pp. 155-166, 2003.
[27] Heckbert, P., "Color image quantization for frame buffer display," Computer Graphics, 19(3) ,pp. 297-307, 1982. [28] Ruderman, D.L., Cronin, T.W. and Chiao, C.-C., "Statistics of cone responses to natural images: implications for
visual coding," Journal of the Optical Society of America A, 15(8) ,pp. 2036-2045, 1998. [29] Toet, A. and Hogervorst, M.A., "Portable real-time color night vision," In: B.V. Dasarathy (Ed.), Multisensor,
Multisource Information Fusion: Architectures, Algorithms, and Applications 2008,SPIE-6974, pp. 697402-1-697402-12, The International Society for Optical Engineering, Bellingham, WA, USA, 2008.
[30] Toet, A. and Hogervorst, M.A., "TRICLOBS portable triband lowlight color observation system," In: B.V. Dasarathy (Ed.), Multisensor, Multisource Information Fusion: Architectures, Algorithms, and Applications 2009,SPIE-7345, pp. 734503-1-734503-11, SPIE - The International Society for Optical Engineering, Bellingham, WA, 2009.
[31] Ackenhusen, J.G., "Infrared/hyperspectral methods (paper II)," In: J. MacDonald et al. (Ed.), Alternatives for Landmine Detection, pp. 111-125, Rand Corporation, Santa Monica, CA, 2003.
[32] Fei-Fei, L., Iyer, A., Koch, C. and Perona, P., "What do we perceive in a glance of a real-world scene?," Journal of Vision, 7(1-10) ,pp. 1-29, 2007.
[33] van Rijsbergen, C.J., "Information retrieval. 2nd Edition.", Butterworth-Heinemann, Newton, MA, USA, 1979. [34] Biederman, I., Teitelbaum, R.C. and Mezzanotte, R.J., "Scene perception: a failure to find a benefit from prior
expectancy or familiarity," Journal of Experimental Psychology: Learning, Memory, and Cognition, 9(3) ,pp. 411-429, 1983.
[35] Potter, M.C., "Short-term conceptual memory for pictures," Journal of Experimental Psychology: Human Learning and Memory, 2(5) ,pp. 509-522, 1976.
[36] Thorpe, S., Fize, D. and Marlot, C., "Speed of processing in the human visual system," Nature, 381(6582) ,pp. 520-522, 1996.
[37] Lanir, J., Maltz, M. and Rotman, S.R., "Comparing multispectral image fusion methods for a target detection task," Optical Engineering, 46(6-066402) ,pp. 1-8, 2007.
[38] Henderson, J.M., Brockmole, J.R., Castelhano, M.S. and Mack, M., "Visual saliency does not account for eye movements during visual search in real-world scenes," In: R.P.G. van Gompel, M.H. Fischer, W.S. Murray & R.L. Hill (Ed.), Eye movements: A window on the mind and brain, pp. 537-562, Elsevier, Amsterdam, The Netherlands, 2007.
[39] Parkhurst, D., Law, K. and Niebur, E., "Modeling the role of salience in the allocation of overt visual attention," Vision Research, 42(1) ,pp. 107-123, 2002.
[40] Tatler, B.W., Baddeley, R.J. and Gilchrist, I.D., "Visual correlates of fixation selection: effects of scale and time," Vision Research, 45(5) ,pp. 643-659, 2005.
[41] Castelhano, M.S., Mack, M.L. and Henderson, J.M., "Viewing task influences eye movement control during active scene perception," Journal of Vision, 9(3, article 6) ,pp. 1-15, 2009.
[42] Nyström, M. and Holmquist, K., "Semantic override of low-level features in image viewing - both initially and overall," Journal of Eye Movement Research, 2(2) ,pp. paper #2,1-11, 2008.
[43] Harding, G. and Bloj, M., "Real and predicted influence of image manipulations on eye movements during scene recognition," Journal of Vision, 10(2, paper no. 8) ,pp. 1-17, 2010.
SPIE-IS&T/Vol. 9014 901412-14
Downloaded From: http://proceedings.spiedigitallibrary.org/ on 03/04/2014 Terms of Use: http://spiedl.org/terms