perceptual representation of visible surfaces
TRANSCRIPT
Perception amp Psychophysics2003 65 (5) 747-762
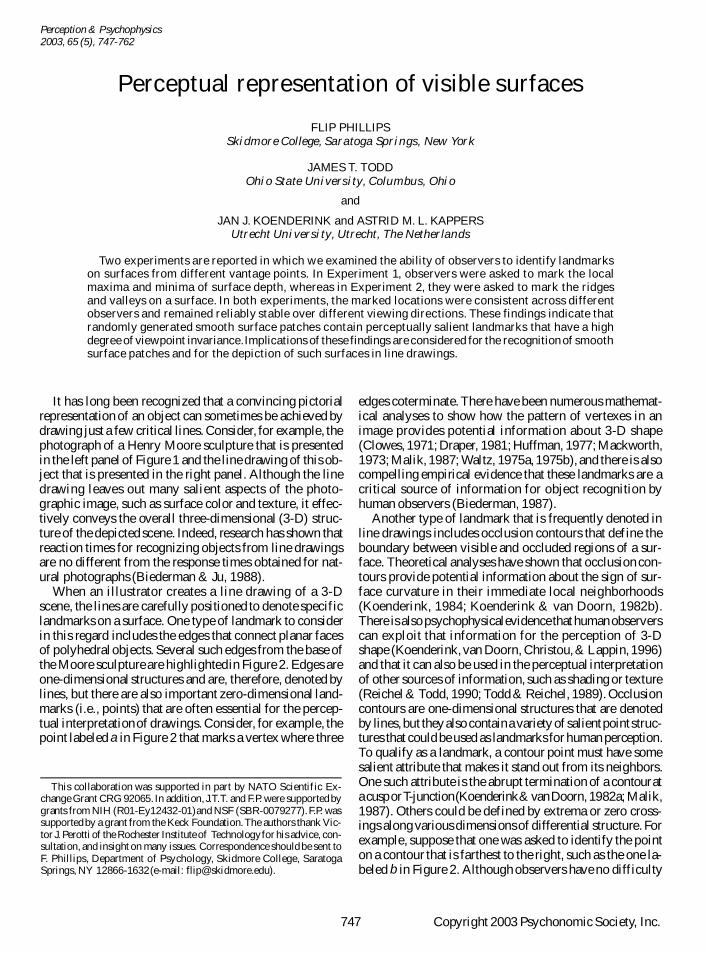
It has long been recognized that a convincing pictorialrepresentation of an object can sometimes be achieved bydrawing just a few critical lines Consider for example thephotograph of a Henry Moore sculpture that is presentedin the left panel of Figure 1 and the line drawing of this ob-ject that is presented in the right panel Although the linedrawing leaves out many salient aspects of the photo-graphic image such as surface color and texture it effec-tively conveys the overall three-dimensional (3-D) struc-ture of the depicted scene Indeed research has shown thatreaction times for recognizing objects from line drawingsare no different from the response times obtained for nat-ural photographs (Biederman amp Ju 1988)
When an illustrator creates a line drawing of a 3-Dscene the lines are carefully positioned to denote specificlandmarks on a surface One type of landmark to considerin this regard includes the edges that connect planar facesof polyhedral objects Several such edges from the base ofthe Moore sculpture are highlighted in Figure 2 Edges areone-dimensional structures and are therefore denoted bylines but there are also important zero-dimensional land-marks (ie points) that are often essential for the percep-tual interpretation of drawings Consider for example thepoint labeled a in Figure 2 that marks a vertex where three
edges coterminate There have been numerous mathemat-ical analyses to show how the pattern of vertexes in animage provides potential information about 3-D shape(Clowes 1971 Draper 1981 Huffman 1977 Mackworth1973 Malik 1987 Waltz 1975a 1975b) and there is alsocompelling empirical evidence that these landmarks are acritical source of information for object recognition byhuman observers (Biederman 1987)
Another type of landmark that is frequently denoted inline drawings includes occlusion contours that define theboundary between visible and occluded regions of a sur-face Theoretical analyses have shown that occlusion con-tours provide potential information about the sign of sur-face curvature in their immediate local neighborhoods(Koenderink 1984 Koenderink amp van Doorn 1982b)There is also psychophysical evidence that human observerscan exploit that information for the perception of 3-Dshape (Koenderink van Doorn Christou amp Lappin 1996)and that it can also be used in the perceptual interpretationof other sources of information such as shading or texture(Reichel amp Todd 1990 Todd amp Reichel 1989) Occlusioncontours are one-dimensional structures that are denotedby lines but they also contain a variety of salient point struc-tures that could be used as landmarks for human perceptionTo qualify as a landmark a contour point must have somesalient attribute that makes it stand out from its neighborsOne such attribute is the abrupt termination of a contour ata cusp or T-junction (Koenderink amp van Doorn 1982a Malik1987) Others could be defined by extrema or zero cross-ings along various dimensions of differential structure Forexample suppose that one was asked to identify the pointon a contour that is farthest to the right such as the one la-beled b in Figure 2 Although observers have no difficulty
747 Copyright 2003 Psychonomic Society Inc
This collaboration was supported in part by NATO Scientific Ex-change Grant CRG 92065 In addition JTT and FP were supported bygrants from NIH (R01-Ey12432-01) and NSF (SBR-0079277) FP wassupported by a grant from the Keck Foundation The authors thank Vic-tor J Perotti of the Rochester Institute of Technology for his advice con-sultation and insight on many issues Correspondence should be sent toF Phillips Department of Psychology Skidmore College SaratogaSprings NY 12866-1632 (e-mail flipskidmoreedu)
Perceptual representation of visible surfaces
FLIP PHILLIPSSkidmore College Saratoga Springs New York
JAMES T TODDOhio State University Columbus Ohio
and
JAN J KOENDERINK and ASTRID M L KAPPERSUtrecht University Utrecht The Netherlands
Two experiments are reported in which we examined the ability of observers to identify landmarkson surfaces from different vantage points In Experiment 1 observers were asked to mark the localmaxima and minima of surface depth whereas in Experiment 2 they were asked to mark the ridgesand valleys on a surface In both experiments the marked locations were consistent across differentobservers and remained reliably stable over different viewing directions These findings indicate thatrandomly generated smooth surface patches contain perceptually salient landmarks that have a highdegree of viewpoint invariance Implications of these findings are considered for the recognition of smoothsurface patches and for the depiction of such surfaces in line drawings
748 PHILLIPS TODD KOENDERINK AND KAPPERS
in making such judgments the location of the resultinglandmark would be highly unstable because it would varywith object orientation An alternative approach that over-comes this difficulty is to define landmarks by extrema ofcurvature such as those labeled c and d in Figure 2 (Rich-ards Koenderink amp Hoffman 1987)
There have been several experiments reported in the lit-erature in which the perception of surface landmarks onobject silhouettes has been examined (Hoffman amp Singh1997 Norman Phillips amp Ross 2001 Siddiqi Tresnessamp Kimia 1996 Singh Seyranian amp Hoffman 1999) Thisresearch has been focused primarily on the ability of ob-servers to segment objects into perceptually distinct partsIn a typical experiment observers are presented with asmoothly curved silhouette and they are asked to identifythe perceived part boundaries by marking points along itscontour For most of the objects that have been studiedthus far observers are able to perform this task with a highdegree of both intrasubject and intersubject reliabilityMoreover as was originally hypothesized by Hoffman andRichards (1984) the perceived part boundaries tend to belocated at extrema of negative curvature
Unfortunately there has been almost no research on theperception of landmarks in interior regions of smoothlycurved surfaces Although Hoffman and his colleagues haveargued that negative curvature extrema should define partboundaries on surfaces as well as on silhouettes the evi-dence to support this claim has been primarily anecdotal(see eg Hoffman amp Richards 1984 Hoffman amp Singh1997) Some indirect evidence for the existence of land-marks on smooth surfaces comes from recent experimentson the perceived correspondence relations between dif-ferent views of the same object (Koenderink KappersPollick amp Kawato 1997 Koenderink van Doorn Kappers ampTodd 1997 Phillips Todd Koenderink amp Kappers1997) Suppose for example that an observer is presentedwith pairs of objects that are structurally identical exceptthat they have different random textures and are posi-tioned at different orientations in depth A single point onone of the objects is highlighted with a small colored dotand the observer is required to identify the correspondingpoint at a different orientation on the second object Theability of observers to identify the point-to-point corre-spondences over different orientations is surprisingly ac-
curate For orientation differences up to 30ordm the averageerrors within the objectrsquos projected image can be as smallas just a few minutes of arc (Phillips et al 1997) Whenasked to reveal their subjective impressions of this task al-most all observers describe a similar strategy The targetpoints are localized by identifying their positions relativeto other salient landmarks such as the ldquotop of a bumprdquo orthe ldquoedge of a cliffrdquo These are then used to triangulate thesame positions when viewed from a different orientation
Given the consistency of observersrsquo subjective impres-sions we were curious to discover the specific attributesof surface structure by which these landmarks are percep-tually defined and the present series of experiments weredesigned to address this issue Our working hypothesis aswe began these experiments was that the perceived land-marks on a surface would be located at local extrema (iemaxima or minima) of some underlying geometric prop-erty of the surface structure (eg depth slant curvednessetc) These could include point singularities such as thepeaks of mountains where the underlying dimension is ata maximum (or minimum) in all directions or line singu-larities such as ridges or valleys where the dimension isat a maximum (or minimum) in all directions except oneIt is important to recognize that local extrema can havevarying degrees of stability across different levels of dif-
Figure 1 Henry Moorersquos Three Piece Reclining Figure Draped 1975
Figure 2 Some potential landmark points on Moorersquos sculpture a is a cotermination of three edges b is the point far-thest to the right on the occlusion boundary c and d representcurvature extrema
a
b
c
d
PERCEPTUAL REPRESENTATION OF VISIBLE SURFACES 749
ferential structure Unlike extrema of depth or slant thelocations of curvature singularities do not change as afunction of surface orientation Thus they could be espe-cially useful for defining landmarks that are viewpoint in-variant (see also Hoffman amp Richards 1984 Richardset al 1987 Siddiqi et al 1996)
EXPERIMENT 1
Our initial experiment was designed to provide an ideaof what class of surface measures might be used to repre-sent phenomenal feature locations on a 3-D surface
At the grossest level these geometric properties can bedivided into two basic groups those that depend on theposition of the viewer relative to the object and those thatare viewpoint invariant Measures of the first type willvary as a result of the projection R 3reg R 2 that occurs when3-D objects in the world are projected onto the retina Thatis they will vary with the direction from which the objectis viewed or the orientation of the object relative to the ob-server whereas the descriptions of the second type remainconstant over transformations of the viewer or the object
At a gross level of analysis there are characteristics thatmostly remain constant over viewpoint and object trans-formations such as the identity of the object its color ortexture the relative location of ldquopartsrdquo on rigid objectsand so on Similarly there are characteristics that will varywith viewpoint such as absolute and relative depth fromthe observer ordinal and metric position of individual lo-cations on the object and so on Any useful perceptual rep-resentation would most likely have to take both sorts intoconsideration due to ambiguities in the sort of informationprovided For example in a representation of the Mooresculpture shown in Figure 2 we could use a viewpoint-dependent feature such as b or viewpoint-independentfeatures such as a c and d
In this experiment the nature of these landmark loca-tions was examined When we identify locations on objectsdo we tend to do this in a viewer-centered or a viewpoint-independent way More specifically do viewer-centered
or viewpoint-independent measures best describe our per-ceptual representations of these locations
Method In this experiment observers used a simple marking paradigm to
indicate the local surface depth maxima and minima regions for anontrivial 3-D object from a viewer-centered frame of reference Bypresenting the object in various orientations relative to the observerwe can then compare the marked extrema with the actual minimaand maxima in the various orientations as a measure of their accu-racy
Observers The observers consisted of 4 adults the authors and1 additional laboratory member All were aware of the purpose of theexperiment and had normal or corrected-to-normal vision All theobservers had extensive experience with the concepts under investi-gation (viewer-centered depth and curvature extrema) and had servedas observers in numerous other experiments dealing with these sameconcepts
Stimuli The experimental probe surface stimuli were similar tothe turbulent surface patches used in our past research (Phillips ampTodd 1996 Phillips et al 1997) Simply put these surfaces aresmoothly varying self-similar ldquobumpyrdquo surfaces A grid of bumpsare created at some given spatial frequency and additional grids aresuperimposed at various scales to yield the self-similarity The nom-inal height of a given bump is determined by a random function andeach bump is smoothly interpolated with its neighboring bumpsThe superposition of bumps of various (typically harmonic) scalesyield our final stimuli
More specifically these surfaces are of the variety z 5 f (xy) aheight function over the (xy) planemdashso called Monge surfaces Forthese experiments f (xy) is a two-dimensional smoothly varyingrandom wave function By summing n octaves of this function weend up with a class of self-similar surfaces often used to simulatenatural phenomena such as mountains marble fire and clouds inphoto-realistic computer graphics images (see Peachey 1985 andPerlin 1985 for further details) Indeed there is significant evidencethat many natural objects possess this type of self-similarity (Man-delbrot 1983 Thompson 1992)
Equation 1 shows the specific function used in these experimentswhere n is the number of octaves and f the frequency of the randomwave function
(1)
The noise function is defined as follows First a two-dimensionaldiscrete lattice of uniformly distributed random numbers is defined
f x yx y
f n
n
( ) =( )
aringnoise
Figure 3 A depth map and surface plot of the first of two turbulent probe surfaces used in these experiments
750 PHILLIPS TODD KOENDERINK AND KAPPERS
The distance from point to point in this lattice forms the underlyingsize of the lowest frequency component of the resulting surface (iethe carrier frequency for the rest of the noise) In order to obtain avalue at a given real-valued (xy) location a bicubic interpolation isperformed between the neighboring lattice points This yields asmooth differentiable function that is then summed over n octavesaccording to Equation 1 to create the probe surfaces for the stimuli
The base wavelength of the noise function was chosen so that theresulting probe surface had features (bumps and dimples) whosesize subtended roughly 2ordm of visual angle when viewed frontoparal-lel Two octaves were added contributing 1ordm and 05ordm features respec-tively The resulting summation yielded a bumpy surface somewhatreminiscent of a mountainous landscape An example of the stimuliused can be seen in Figures 3 and 4 This surface was mathemati-cally infinite in extent in both x and y and an arbitrary (xy) positionon the surface was chosen as the center of the test region used in thisand subsequent experiments For those interested in further detailsa rigorous explanation of the generation and analysis of these stim-uli is available in Phillips (in press)
Finally the probe surface was smooth shaded and textured usinga uniform random checkerboard pattern of gray levels The texturewas applied so that equal areas on the surface had approximately equalareas of texture map associated with them On each presentation thetexture was randomly displaced in (xy) so that the texture as a wholecould be used as a cue but no specific location on the texture couldbe used as a visual anchor point
Procedure Before the start of the experiment all the observersdiscussed and agreed on the phenomenal geometric definition ofviewer-centered depth minima and maxima as well as confirmingtheir presence in a set of test images All agreed that the extrema werepoint singularities that existed relative to the observersrsquo line of sight
Each observer was presented with one of the two probe surfacestimuli in one of three possible orientations frontoparallel (the 0 con-dition) slanted backward away from the observer 20ordm (the 2 condi-tion) or slanted forward toward the observer 20ordm (the 1 condition)The observer then used the mouse to manipulate a monocularly pre-sented cursor to locate all of the local depth minima and maximapresent on the probe surface The cursor was unconstrained andtherefore free to move to any location on the probe surface Whenthe observer located a feature point at a desired location a key on thekeyboard was pressed to indicate the type of point located under thecursor Each location selected by the observer was then markedusing a small dot in order to eliminate the chance that a locationwould be classified more than once
All the observers marked locations on both shapes at all three ori-entations twice per condition resulting in a 2 3 3 design Each ses-sion consisted of one of the six possible conditions in which the ob-
server marked as many or as few features as they interpreted as beingpresent No time limit was placed on the session and no specific or-dering of marking (maxima before minima topmost before bottom-most etc) was imposed The probe surfaces and orientations wererandomized across trials and across observers in order to reduce biasthat might arise as a result of learning any one of the surfaces in aparticular orientation
Apparatus All the stimuli utilized in this experiment were cre-ated and presented using QuickDraw 3D v 151 and Sprockets v 10on an Apple Power Macintosh 9600200 workstation which was ex-panded to utilize a second monitor for stereo presentation A stereo-scope was constructed using off-the-shelf optical components Fourfirst-surface mirrors were mounted on individual adjustable stagesto allow for the adjustment of each individualrsquos interpupillary dis-tance The entire mirror assembly was mounted to an optical benchstrip that was in turn mounted to the table holding the monitorsEach monitor was a 15-in Sony Trinitron color matched using a Light-source ColorTron 32-band spectrophotometer All the images weredisplayed at 1024 3 768 resolution at 75 Hz in 32-bit color depth
A chinrest mounted on a separate table to avoid and isolate un-wanted vibration was utilized to steady the observerrsquos head and main-tain a constant viewing distance The stimuli were approximately165 cm in size viewed at an effective distance of 86 cm which re-sulted in stimuli that subtended roughly 114ordm of visual angle (1ordm lt15 cm) All the trials took place with dim room lighting
Prior to each session a Nonius image was displayed with Verniermarkings on the monitors for the two eyes These marks werebrought into alignment by the observer via adjustment of the moni-torsrsquo geometry and the stereoscopersquos mirrors resulting in an accu-rate limited distortion stereographic image Finally the observersrsquoresponse was obtained using a standard keyboard and mouse lo-cated on a third table to avoid unwanted vibrations to the optical as-sembly or chinrest
Results and Discussion Because the observers were instructed to indicate all of
the minima and maxima using a viewer-centered frame ofreference we would expect there to be systematic variationsin the observersrsquo marking for each presentation conditionsince the extrema changed relative to the viewer for eachpresentation condition Figure 5 illustrates the viewer-centered depth maps for the frontoparallel and 120ordm slantedconditions
We designed a local extrema finder using Mathematica(Wolfram 1991) that systematically located all of the local
Figure 4 A depth map and surface plot for the second probe surface stimulus used in these ex-periments
PERCEPTUAL REPRESENTATION OF VISIBLE SURFACES 751
depth minima and maxima on the probe surface for eachof the orientations relative to the viewer The results of thissearch are shown in Figure 6
The observers were free to mark any number of loca-tions as extrema and this presented a minor challenge inanalysis If there were direct one-to-one relationships be-tween the marked and the actual extrema it would be asimple matter to compute the euclidean distance offset asa measure of accuracy To analyze performance in this ex-periment a correlation technique was devised to measurea goodness of fit between the observed and the actual ex-trema In our analysis two surfaces were constructed thefirst being the ground truth (actual extrema of the probesurface hereafter the measure surface) and the second de-
rived from the extrema indicated by the observers (hereafterthe response surface) The resulting surfaces were corre-lated yielding a measure of goodness of fit between themThis solved the correspondence problem presented above
The construction of the measure and response surfaceswas done as follows Initially each surface was a plane thesize of the probe area of the probe surface On each sur-face a unit-height Gaussian ldquobumprdquo was added at the lo-cation of an actual or a judged extrema respectively Thediameter of this bump was based on our previous research(Phillips amp Todd 1996) which investigated the percep-tual salience of classes of geometric structuresmdashmost no-tably bumps and dimples on which the local extrema sitin these experiments In those experiments we found that
MaximaMinima
Forward (+) Fronto (0) Back (ndash)
9
0
ndash9
9
0
ndash9
9
0
ndash9ndash9 0 9 ndash9 0 9 ndash9 0 9
Figure 5 Viewer-centered depth maps for Surface 1 (see Figure 3) from two view-ing conditions on the left the frontoparallel viewing condition on the right the 1 20ordmslanted condition White areas in the contour plot are closer to the observer In the sur-face plot the line of sight is along the z (vertical) axis Note how many minima andmaxima move or disappear entirely when the probe surface is tilted away from fron-toparallel
Figure 6 Locations of actual depth extrema on the probe surface for each viewing condition Light squares rep-resent maxima (peaks) whereas dark squares represent minima (dips) on the probe surface relative to the ob-server Note that several extrema move appear or disappear as the orientation of the probe surface changesUnits are in centimeters
752 PHILLIPS TODD KOENDERINK AND KAPPERS
bumps and dimples that subtended approximately 2ordm of vi-sual angle were optimally perceived when embedded inthe same family of probe surfaces as those used here Tocreate the final maps negative bumps (ie ldquodimplesrdquo) wereadded to the surface at the location of each minima and pos-itive bumps were added at the location of each maxima
This process was executed separately for the actual andthe observer-indicated extrema resulting in two maps Onedesirable side effect of this method of creating the mapswas that the local height of the resulting map was scaledon the basis of the surrounding terrain This resulted in adiffusion of the surface in areas that had small gradientsof orientation (ie flat areas) and a sharpening of the sur-face in regions with high gradients (ie sharp peaks) Theresulting measure surface construction for one of ourstimuli is shown in Figure 7 and a construction of 1 ob-serverrsquos response surfaces is shown in Figure 8 This tech-nique for constructing implicit surfaces is similar in spiritto the techniques used by Blinn (1982) and expanded byothers in the field of computer graphics
In Figure 9 we show the observersrsquo responses at each ori-entation of the probe surface relative to the observer alongwith the actual extrema Critically unlike the actual ex-
trema the observersrsquo markings were very similar across ori-entations Since we know that the actual extrema changedlocation or existence at each orientation this suggests thatthe observers were not performing the task as specifiedThus the observersrsquo markings seemed to be consistent withthe extrema in the frontoparallel presentation conditionfurther suggesting a viewer-independent representationthat utilized a fiducial frame of reference consistent withthe probe surfacersquos height-field This finding is consistentwith our previous results (Phillips et al 1997) whereinthe observers appeared to be marking locations on a refer-ence surface consistent with a particular privileged repre-sentation of the surface In this experiment as well as in ourprevious one there was evidence that this frame of referencewas the global ground plane of this terrain-like surface
The R2 between the response and the measure surfaceswere as follows forward slant (1) R2 5 46 frontoparal-lel (0) R2 5 58 backward slant (2) R2 5 35 These re-sults support the notion that the observers were not per-forming the task as requestedmdashthat is they were apparentlynot using a viewer-centric frame of reference The fron-toparallel condition demonstrated acceptable performancebut the slanted presentations and adjustments were not as
9
0
ndash9
9
0
ndash9
9
0
ndash9ndash9 0 9 ndash9 0 9 ndash9 0 9
10
0
ndash10
10
0
ndash10
10
0
ndash105
0
ndash5
5
0
ndash5
5
0
ndash5ndash5
05
ndash50
5
ndash50
5
Forward (+) Fronto (0) Back (ndash)
Figure 7 A measure surface generated from the actual probe surface extrema at each viewing condition White areas repre-sent peaks whereas dark areas represent troughs Areas of concentrated shading represent more steep peaks or troughs whereasbroader areas represent flatter regions Units are in centimeters
PERCEPTUAL REPRESENTATION OF VISIBLE SURFACES 753
strong A visual examination of the results show that theobservers seemed to be marking the same locations re-gardless of the orientation of the probe surface Table 1shows that there was a high correlation between the judgedextrema across the orientation conditions The correlationsbetween the actual extrema across the conditions were farweaker For example in Table 1 there is a very low associ-ation (R2 lt 17) between the actual extrema in the forward-slant (1) condition and the backward-slant (2) conditionHowever there is a relatively good amount of agreementin the judged data with an R2 lt 59 This relatively strongagreement carries across the orientation conditions con-sistently whereas the actual agreement varies significantlySince the observers appear to have been judging the sameextrema regardless of orientation condition this leads usto wonder which extrema or even what characteristic ofthe probe surface was actually being marked Their judg-ments were far more consistent between conditions thanwould be suggested by the actual extrema Whatever wasbeing marked was apparently viewpoint independent forthese surfaces
These results suggest that at least for the orientationsutilized in this experiment the observers appear to havebeen performing the identification task on the probe sur-face itself rather than in the imagemdashthat is using aviewer-independent rather than a viewer-centered frame
of reference The observers were instructed to utilize aviewer-centered frame of reference to mark the extremaon our surfaces and therefore we would have expected thatthere would have been some systematic variation in thedepth markings for the different orientation conditionshowever no such variation appeared Similar results wereobtained in a previous set of experiments (Phillips et al1997) that required identifying arbitrarily presented loca-tions on a surface that was randomly reoriented relative to
Figure 8 Response surface generated from an observerrsquos markings for the location of local minima and maxima in eachobservation condition Light areas represent marked maxima whereas dark areas represent troughs Areas of concen-trated shading represent tighter clustering in responses whereas more diffuse regions represent more variable responsesClustered responses result in a steeper narrower bump or dip whereas diffuse responses result in a lower more diffusebump or dip Units are in centimeters
Table 1R2 Between All Pairs of Orientations
for Actual and Judged Extrema
R2
Slant Conditions Judged Extrema Actual Extrema
(10) 6561 5929(12) 5625 1681(02) 7056 2601
NotemdashThe similar relationships between the observersrsquo settings and thelarge differences between the actual extrema belie the suggestion that theobservers are indicating something other than the actual viewpoint-dependent extrema Whatever they are marking is similar regardless oforientation of the probe surface relative to the observer In the forwardversus frontoparallel (1 0) condition there is a reasonably high R2 be-tween the locations of the extrema but in the other conditions [(1 2)and (0 2)] this is not the case The correspondence of the judged ex-trema is consistently high across all conditions
754 PHILLIPS TODD KOENDERINK AND KAPPERS
the observer The observers in that experiment did not ex-hibit any systematic bias as a function of the orientation ofthe surface which agrees largely with the results of thepresent experiment
Our main goal in this experiment was to determinewhether observers would be able to make use of the struc-tural information available to make extrema judgmentsfrom a specific frame of reference If our representation ofsurface structure in this case were mainly viewer centeredwe would expect variation in responses across the pre-sented orientations The results of the present experimentsuggest a representation consistent with landmarks de-fined by viewer-independent features Since these resultssuggest the possibility of a privileged frame of referencewhen locations on an object are identified we should nowconsider what underlying geometric properties might giverise to the information used to frame this coordinate system
EXPERIMENT 2
In Experiment 1 the observers were asked to identifylocal point singularities in surface structure such as thepeaks of mountains where viewer-centered depth is at amaximum (or minimum) in all directions Experiment 2in contrast was designed to investigate the perceptions ofline singularities such as ridges or valleys where an under-
lying dimension of surface structure is at a maximum (orminimum) in all directions except one One way of thinkingabout these two types of surface landmarks is that the pointsingularities are nodes on a graph and the line singularitiesare the edges that connect them For example in creatinga city map it is common to represent streets as lines (iethe edges of a graph) and individual buildings or intersec-tions as points (ie nodes) A similar representation is alsopossible for smoothly curved surfaces in which the peaks ofmountains are represented as nodes and the ridge lines thatconnect them as edges There is significant empirical evi-dence in the area of environmental psychology that humansrepresent their physical environment in a manner that is sim-ilar to a graph structure (cf Lynch 1960 Nasar 1998)
Because the results of Experiment 1 had shown that ob-servers could not successfully adopt a viewer-centered
Figure 9 Actual extrema (top) and a composite of all the observersrsquo markings (bottom) of the locations of local min-ima and maxima in each observation condition Light squares represent marked maxima (peaks) whereas dark areasrepresent minima (pits) Note that unlike the actual extrema the observersrsquo responses were very similar across viewingconditions therefore the observers were not performing the task as instructed Thus the observersrsquo markings seemedto be consistent with the extrema in the frontoparallel presentation condition further suggesting a privileged viewer-independent representation of the surface
Table 2Results From the Constrained Judgment Taskto Test the Reliability of Observersrsquo Markings
Observer xs ss
AK 0190 0100JK 0163 0100FP 0215 0142
NotemdashUnits are in centimeters All 3 observersrsquo responses were tightlyclustered within lt02 cm (013ordm visual angle)
PERCEPTUAL REPRESENTATION OF VISIBLE SURFACES 755
frame of reference in making judgments about local depthextrema we chose in the present study to let them decidewhat constituted a ridge or a valley without providing ex-plicit instructions about how those concepts should beperceptually defined In an effort to determine whetherobservers could perform reliably with such vague instruc-tions a pilot experiment was conducted in which ob-servers viewed a stereogram of a smoothly curved surfaceand were asked to draw the pattern of ridges and valleysonto a sheet of graph paper A visual analysis of thesedrawings revealed a high level of agreement across dif-ferent observers thus suggesting that instructing them tomark ridges and valleys is a perceptually meaningful task
Experiment 2 had three specific goals First we wantedto measure the precision with which observers can iden-tify the locations of ridges and valleys on a smoothlycurved surface at different orientations in depth Second
we wanted to assess the consistency of these judgmentsacross different observers Finally we also wanted to de-termine the underlying dimensions of differential struc-ture (eg depth orientation or curvature) by which theselandmarks are perceptually defined
Method Procedure The same surfaces and presentation conditions as
those in Experiment 1 were used in this experimentmdashtwo differentsurfaces presented with their orientation frontoparallel and 620ordmrelative to the viewer The observers were instructed to mark the phe-nomenal ridge lines and valleys of the surfaces As with the first ex-periment the stimuli were presented stereoscopically with textureand shading A monocular cursor was manipulated with the mousewhich the observers used to mark as many points on the ridge and val-ley structures as they felt necessary to define the extent and shape ofthe structure There was no constraint on the position of the cursorand the ridges and valleys could be marked in any order The stimuliapparatus and observers were the same as those in Experiment 1
In order to obtain a more fine-grained measure of the precision ofthese judgments 3 of the observers (AK JK and FP) also per-formed a more constrained version of the same task in which thecursor could be moved only vertically along a single scan line Tenscan lines were presented for each surface at each of the three pos-sible orientations in depth and each scan line was repeated on threeseparate trials The observers were instructed to mark all the pointsat which the scan line crossed a ridge or a valley
Results and Discussion Constrained judgments Let us first consider the re-
sults obtained on the constrained judgment task in orderto evaluate the overall reliability and precision of the per-ceived locations of ridges and valleys It is important tokeep in mind that for a given surface the locus of surfacepoints along a vertical scan line was the same for all threepossible orientations in depth This made it possible tomeasure any subtle changes in the apparent locations ofridge lines that may have occurred as a function of chang-ing viewing direction As is consistent with the findingsfrom Experiment 1 however the observersrsquo judgments re-
Figure 10 An example of the probe surface used in Experi-ment 2 and the marking of linear structures by Observer FP Inthis task the observer was instructed to mark the phenomenalridge lines and valleys of the surface using as many locations asnecessary to fully describe the structures including their end-points
Marked Region Summary Response Surface
ndash9
ndash99
9
0
0ndash75
Figure 11 Construction of the response surface Shown on the left is the composite marking data for all the observers AGaussian bump is moved across each separate cubic-interpolated path and these bumps are summed to create the surface seenon the right Both the contour plot and the surface plot show broader and shallower areas where there is less concentration inthe observersrsquo markings and higher sharper areas where there is a large amount of consistency and thus overlap
756 PHILLIPS TODD KOENDERINK AND KAPPERS
mained remarkably stable over the different surface ori-entations which spanned a 40ordm range
In order to measure the spread of these judgments aclustering analysis was performed to isolate individualridge points and to measure the variance in the vertical po-sitions of the observersrsquo markings for each one The re-sults of this analysis are shown in Table 2 which showsthe average variance for individual ridge points collapsedover orientations and the variations in variance amongdifferent ridge points These results show that the ob-servers were able to mark the positions of ridges and val-leys within lt02 cm (013ordm of visual angle) This is a re-markably high degree of reliability for localizing thesestructures given that they were not explicitly defined bythe instructions and that the surfaces were presented overa large range of possible orientations
Unconstrained judgments For the second part ofExperiment 2 the observersrsquo markings were not con-strained An example consisting of a surface and themarked structures of one session of Observer FP areshown in Figure 10 A similar analysis was used as in Ex-periment 1 based on the correlation between a referencesurface and a judged surface
The response surfaces were constructed as follows Fora given set of ridge or valley markings by a given observera smooth cubic interpolating spline (agrave la Bezier) was fitthrough all the marked points A linear Gaussian bump ordip was then added to the surface along this fitted curvedepending on the type of structure marked resulting in a3-D linear structure on the surface The bumprsquos width andheight were selected in the same way as in Experiment 1a choice further reinforced by the results of the pilot ex-periment above Multiple markings in the same area rein-forced and thus heightened the bumps whereas straymarks or marks made a few number of times resulted inlower structures Similarly the clustering of the markscontrolled the width of the structure Tightly clusteredmarks resulted in a narrow and taller bump or dip whereasmore dispersed markings indicative of less agreement onthe position of the feature in question resulted in a lowerand more dispersed bump or dip on the constructed surfaceRepeating this for each observerrsquos markings resulted in aresponse surface consisting of all of the locations markedas ridges or valleys As in Experiment 1 this technique is
similar to that of Blinn (1982) and others for creating im-plicit surfaces
Response surfaces were constructed for each observerin each of the presentation conditions (1 0 or 2 as inExperiment 1) Figure 11 illustrates the construction of asurface using the responses for all the observers
Interobserver consistency In our pilot experimentoutlined above we determined the reliability within agiven observer and found it to be high We compared theresults across observers as well giving a measure of reli-ability between observers as well To obtain this measure-ment the response surfaces for each observer were corre-lated with those for all the other observers and the summarysurface for all the observers Table 3 shows the results ofthis analysis
The correlations show a reasonably strong agreement be-tween the observersrsquo markings The remaining variabilityis most likely due to the constraints of the interobserver re-liability and the difference in criterion for the endpoints ofthe linear structures For example a piece of paper with astrong crease at one end that lessens over the length of thepaper (see Figure 12) will create a gradually vanishingridge structure whose presence or absence is subject tosome threshold-like psychophysical function
Underlying geometry For this experiment the taskdid not explicitly specify which geometric structures wereto be marked As a result there is no ldquoground-truthrdquo tocompare the observations against Instead we need to com-pare them with various geometric surface properties in anattempt to discover which underlying structures might beproviding the phenomenal information that leads to themarkings Responses based on viewer-centered featureswould therefore correlate with viewer-centered measuressuch as depth Viewer-independent responses would cor-respond to features that do not change with viewpointsuch as the gradient or curvatures of the surface
At any location P on a surface an infinite number ofplane curves exist containing the normal vector NP there(so-called normal curves) Each of these curves can be as-signed a measure of curvature k at P Two of these ks areof primary interest the minimum and maximum curva-tures commonly known as the principalcurvatures Thesecurvatures denoted k1 and k2 (sometimes kmin and kmax )have the additional characteristic that the curves that con-tain them are always orthogonal The tangents of thesecurves which define the tangent plane at P along with
Table 3 R2 Between Individual Observersrsquo Response Surfaces
Observer
AK FP JK VP
FP 664JK 765 706VP 635 781 691All 856 894 910 870
NotemdashThe last row contains correlations of each observer with themean responses of all observers There is reasonably strong agreementbetween observers with variance likely being due to the constraints ofinterobserver reliability and differences in criterion for the endpoints ofthe linear structures
Figure 12 An example of the criterion problem in determiningthe beginning and ending of the linear structures In this exam-ple a surface strongly creased at one end and flat on the othercreates a ridge that gradually fades away Exactly where it disap-pears is variable on the basis of the observerrsquos criterion
PERCEPTUAL REPRESENTATION OF VISIBLE SURFACES 757
the normal define a local orthogonal frame For our pur-poses it is important to note that these curvatures are in-trinsic to the surface and are unchanged by viewpoint
Traditionally the two curvatures are combined intoother measures that are useful for diagnosing the nature ofthe surface at a given location Two of the most commonare the Gaussian curvature
K 5 k1k2 (2)
and the mean curvature
(3)
A more formal description of curvature and the parame-terizations of them can be found in the Appendix
For the analysis of the observersrsquo response data a set ofmeasure surfaces were constructed from the depth gradi-ent and curvature information of the probe surfacesThese surfaces were then compared with the observersrsquoresponse surfaces to find a best-fitting match For eachmeasure the reference surface was constructed where zrepresented the magnitude of the measure at the location(xy) of the probe surface For example for Gaussian cur-vature the resulting measure surface was of the form z 5Kx y where K is measured at (xy) on the probe surface Adepth-map measure surface relative to the viewer can beconstructed as z 5 Trans[ f (xy)] where Trans representsthe viewpoint transformation of the surface location thesurface defined by f (xy) Figure 13 shows maps for someof the curvature-based viewer-independent measures
H =+k k1 2
2
75
5
25
0
ndash25
ndash5
ndash75
75
5
25
0
ndash25
ndash5
ndash75
75
5
25
0
ndash25
ndash5
ndash75
75
5
25
0
ndash25
ndash5
ndash75
75
5
25
0
ndash25
ndash5
ndash75
75
5
25
0
ndash25
ndash5
ndash75
ndash75 ndash5 ndash25 0 25 5 75 ndash75 ndash5 ndash25 0 25 5 75 ndash75 ndash5 ndash25 0 25 5 75
ndash75 ndash5 ndash25 0 25 5 75 ndash75 ndash5 ndash25 0 25 5 75 ndash75 ndash5 ndash25 0 25 5 75
75
5
25
0
ndash25
ndash5
ndash75
ndash75 ndash5 ndash25 0 25 5 75
Mean Curvature Shape Index
Gaussian Curvature Curvedness
Curvature Contrast
Figure 13 Curvatures and several example reparameterizations On the left are the two separatecurvature values for Surface 1 used in our experiments These curvatures k 1 and k 2 can be com-bined into other measures that reflect some curvature-based aspect of the surface geometry as out-lined above For example shape index and curvedness (S and C ) represent scale-independent andscale-dependent aspects of the underlying shape respectively Mean and Gaussian curvature (Hand K ) show the average curvature and the product of the curvatures at a given point the sign beinga useful indicator of the class (but not the direction) of curvature in the latter case Finally the cur-vature contrast (D | k |) shows a slight modification of mean and Gaussian curvature that captures theabsolute local difference in curvature at a given surface location
758 PHILLIPS TODD KOENDERINK AND KAPPERS
The results from Experiment 1 suggest that the point-features were identified in a viewpoint-independent man-ner therefore we chose to correlate the observersrsquo mark-ings with several of the curvature reparameterizationsmentioned above since these parameterizations are intrin-sic to the surfacemdashthat is they do not change with view-point Specifically we utilized the Gaussian and mean cur-vatures (K and H ) shape index and curvedness (S and C )gradient magnitude ( |=|) total curvature magnitude (S|k|)curvature contrast (D |k|) and signed curvature difference(Dk) In addition we looked at the signed maximum and theunsigned maximum of the two principal curvatures k |max ||k|max (see the Appendix for details on these measures)For completeness we also correlated the resulting mark-ings with the viewpoint-dependent depth map
In Table 4 and Table 5 the results are shown for each ob-server partitioned into two sets by the strength of correla-tion Within each measure all the subjects were in generalagreement as were the measures between subjects Acrossall observers and measures in the best-fitting cases R2 lt4 whereas with the poorly fitting measures the R2 re-mains close to 0 in all cases The depth map shows littlecorrelation as well Even when assuming a frontoparalleldepth map across all viewing conditions these correla-tions are quite small with R2 well below 05 in all cases(see the first column of Table 5 for details)
Since the observersrsquo results were highly consistent wealso performed the correlations by orientation collapsedacross observers As would be expected the results for theviewpoint-independent measures were consistent with theper-observer findings with mean curvature (H ) shape index
(S ) curvature contrast (D|k |) and signed maximum cur-vature magnitude (k|max|) showing the most variance ac-counted for in Table 6 As with Experiment 1 there was lit-tle difference between orientations although the backward-slanting condition showed less strength than the othersWe suspect this may be explained by a slight criterion shiftby all the observers due to the small change in the totalamount of self-occlusions in this case (although we chosethe range of orientations specifically to avoid wholesaleself-occlusion of depth extrema)
The results from Experiment 2 generalize the findingsof Experiment 1 from point structures to linear structuresThe observers marked regions of the geometry wherethere were extremal values of intrinsic and thereforeviewpoint-independent curvature and curvature-relatedmeasures When representations that would support thissort of invariance are considered the previously describedgraph structures can accommodate these findings nicelyIt does however remain to be seen what the best consti-tution of this structure should be It is reasonable to con-sider the ldquobumprdquo and ldquodiprdquo structures from Experiment 1as nodes of such a structure but the extended structures ofExperiment 2 are more ambiguous Does a ridge serve aconnecting purpose perhaps of two other geometric nodallocations or does the ridge itself constitute a node
GENERAL DISCUSSION
The research described in the present article was designedto investigate the perception of landmarks on smoothlycurved surfaces and to determine the relative stability ofthese landmarks over different viewing directions This re-search was motivated in part by an earlier experiment(Phillips et al 1997) in which observers reported thatsurface landmarks such as hills valleys and ridges wereused to determine the point-to-point correspondence rela-tions across multiple vantage points Our working hy-pothesis as we began these experiments was that the per-ceived landmarks on a surface would be located at localextrema (ie maxima or minima) of some underlyinggeometric property of the surface shape (eg depth slantcurvedness etc) Our initial experimental strategy there-fore was to measure the precision with which observerscould identify local extrema at varying levels of differen-tial structure
Table 4Results of Experiment 2 by Observer R2 of the Best-Performing
Measures Averaged Across All Presentation Orientations
Measure
Observer H S D|k| k|max |
AK 405 354 397 387FP 399 347 431 412JK 472 447 479 480VP 394 337 403 390
NotemdashThe measures show a strong consistency across observers High-est R2s occur with mean curvature (H ) shape index (S ) curvature con-trast (D|k|) and the signed maximum magnitude of the principal curva-tures (k|max|)
Table 5Results of Experiment 2 by Observer R2 of the Best-Performing Measures
Averaged Across All Presentation Orientations
Measure
Observer Depth K C |=| S|k| Dk k|max|
AK 048 011 000 018 000 003 000FP 025 007 000 000 000 002 000JK 0477 009 000 007 000 004 000VP 0552 017 002 004 004 002 001
NotemdashThe measures show a strong consistency across observers Absolute depthGaussian curvature (K ) curvedness (C ) gradient magnitude (|=|) total curvature mag-nitude (S|k|) signed curvature difference (Dk) and the unsigned principal curvaturemaximum (k|max|) show little or no agreement with the observersrsquo markings
PERCEPTUAL REPRESENTATION OF VISIBLE SURFACES 759
In Experiment 1 the observers were instructed to iden-tify the local depth maxima and minima on a stereoscop-ically presented surface in different orientations Becausedepth extrema vary as a function of viewing direction theaccurate performance of this task would produce signifi-cant differences between the marked locations in the dif-ferent orientation conditions That is not what occurredhowever When we examined the distributions of observersrsquoresponses the perceived surface extrema in the differentorientations were all highly correlated with one anotherThat is to say the selected landmarks were all viewpointinvariant Apparently the observers were unable to adopta viewpoint-dependent frame of reference to identify localextrema even though they were specifically instructed todo so Whereas Experiment 1 was concerned with the zero-dimensional landmark points on visible surfaces Experi-ment 2 was designed to investigate the higher order one-dimensional structures that are commonly referred to asridges and valleys Given the results from Experiment 1we decided not to provide the observers with explicit in-structions about how these structures are geometricallydefined All they were told was to mark the tops of theridges and the bottoms of the valleys and the precise de-finitions of these terms were left to their own intuitions
Despite the vagueness of these instructions the observerswere able to perform these tasks with a high degree ofconfidence and the overall pattern of their responses wasremarkably consistent As in Experiment 1 the landmarksthey selected were minimally affected by changes in sur-face orientation thus indicating that their judgments werebased on some property of the surface that was viewpointinvariant In an effort to reveal the specific attribute of sur-face structure we correlated their pattern of responseswith a wide variety of geometric measures at varying lev-els of differential structure
There have been a number of previous suggestions inthe literature that perceptually salient landmarks on a sur-face are likely to be located at curvature extrema This hy-pothesis was first proposed by Hoffman and Richards(1984) for the perception of surface part boundariesmdashbased on a mathematical constraint that when two arbi-trary shapes are made to interpenetrate one another theymust always meet at a discontinuity of negative curvature(see also Hoffman amp Singh 1997 Richards et al 1987)A similar idea was later proposed by Phillips et al (1997)in order to account for the ability of observers to make point-
to-point correspondence judgments over multiple vantagepoints The results of the present experiments are in manyways supportive of these hypotheses The judged land-marks showed a high degree of viewpoint invariance theywere poorly correlated with the patterns of extrema indepth or orientation and they were highly correlated withthe patterns of extrema for several measures of surfacecurvature
There is however some remaining uncertainty in thesedata about how curvature is perceptually parameterizedNote in Tables 4 and 5 that some measures of curvaturecorrelate quite highly with the observersrsquo judgmentswhereas others do not Our initial intuition for this taskwas that perceived landmarks would most likely be lo-cated at extrema of curvedness but the data did not sup-port that prediction Indeed the correlations of curved-ness with the observersrsquo judgments were lower than thosefor any other measure of curvature we investigated Be-cause many of these measures are correlated with one an-other it is difficult from the present data to draw anystrong conclusions about what specific aspects of curva-ture are most salient for human perception Of the mea-sures we examined mean curvature curvature contrastshape index and signed maximum curvature magnitudewere the best predictors of the observersrsquo judgments butadditional research is obviously needed before any strongconclusions are drawn about the status of those measuresas perceptual primitives
The results of the present experiments indicate that ran-domly generated smoothly curved surfaces contain per-ceptually salient landmarks that have a high degree ofviewpoint invariance (see also Phillips et al 1997) Theselandmarks include point singularities such as the apex ofa mountain or the nadir of a crater but they also includeextended line structures such as ridges and valleys It isespecially interesting that these landmarks exhibit a highdegree of stability over changing viewing directionswhereas judgments of more generic local surface proper-ties typically do not (eg Norman Todd Perotti amp Tittle
Table 6R2 for Each of the Best-Performing Measures
Collapsed Across Observers for Each Orientation
Measures
Orientation H S D|k| k|max|Frontoparallel (0) 607 570 613 603Forward (1) 612 579 603 603Backward (2) 546 514 568 558
NotemdashIn all cases R2 is highest in the frontoparallel case indicatingthat the observers were performing the task without regard for the globalorientation of the surface
Figure 14 An artistrsquos depiction of one of the surfaces used in ourexperiments using only line elements (ie no shading) The upperpanels show the lines apparently used to denote occlusion andboundary contours respectively The lower panel is the originaldrawing The individual contour drawings do not result in a satis-fying three-dimensional percept both sets of contours are required
760 PHILLIPS TODD KOENDERINK AND KAPPERS
1996) This suggests that the topological arrangement ofsurface landmarks could be a representational anchor thatunderlies our phenomenal experience of shape constancyIn a formal sense these topological relations are most eas-ily characterized as graph structures which are closely re-lated to those that have been studied in other perceptualcontexts such as the patterns of edges and vertexes onpolyhedral objects (Clowes 1971 Draper 1981 Huffman1977 Mackworth 1973 Malik 1987 Waltz 1975a 1975b)or the patterns of occlusion contours on smooth surfaces(Hoffman amp Richards 1984 Richards et al 1987)
An interesting issue for future research is to examinethe importance of curvature ridge lines for the pictorialrepresentation of smoothly curved surfaces It is impor-tant to keep in mind that in mechanical drawings of poly-hedral objects the lines are typically drawn to denote thelocationrsquos occlusion contours or the edges that connectplanar facetsmdashwhich are extreme examples of curvatureridges Could a similar denotation scheme be effective forthe pictorial depiction of more smoothly curved surfacesIn an effort to address this question we asked an artist todraw a depiction of one of our experimental surfaces with-out using any shading The results of her efforts are shownin the bottom panel of Figure 14 Note that it includes anoutline of the perimeter of the surface patch and also someinternal lines to depict the ridges and valleys These twotypes of line structures are shown separately in the top pan-els to demonstrate how both are needed for a perceptuallyconvincing depiction
Another more formal example of this same phenome-non is shown in Figure 15 The lower right panel of thisfigure shows a radial cosine surface that is depicted withshading The occlusion contours for this surface are pre-sented in the upper left panel and its curvature ridge linesare presented in the upper right panel Note that neither of
these patterns presented in isolation provides a perceptu-ally convincing pictorial representation of the 3-D surfacestructure However when both types of contours are com-bined in the lower left panel they provide sufficient in-formation to specify the surface shape Although we haveobserved similar effects for other types of surfaces used inour investigations we have not attempted to systemati-cally compare the perceptual effectiveness of curvatureridge lines with that of other types of surface structuressuch as depth or orientation ridges This could perhaps bea useful strategy for identifying the specific attributes oflocal surface (or image) structure by which surface land-marks are perceptually defined
REFERENCES
Biederman I (1987) Recognition-by-components A theory of humanimage understanding Psychological Review 94 115-117
Biederman I amp Ju G (1988) Surface versus edge-base determinantsof visual recognition Cognitive Psychology 20 38-64
Blinn J (1982) A generalization of algebraic surface drawing ACMTransactions on Graphics 1 235-256
Clowes M B (1971) On seeing things Artificial Intelligence 2 79-116 Draper S W (1981) The use of gradient and dual space in line draw-
ing interpretation Artificial Intelligence 17 461-508 Hoffman D D amp Richards W A (1984) Parts of recognition Cog-
nition 18 65-96 Hoffman D D amp Singh M (1997) Salience of visual parts Cogni-
tion 63 29-78 Huffman D A (1977) Realizable configurations of lines in pictures
of polyhedra Machine Intelligence 8 493-509Koenderink J J (1984) What does the occluding contour tell us about
solid shape Perception 13 321-330 Koenderink J J (1990) Solid shape Cambridge MA MIT Press Koenderink J J Kappers A M L Pollick F E amp Kawato M
(1997) Correspondence in pictorial space Perception amp Psychophysics59 813-827
Koenderink J J amp van Doorn A J (1982a) Perception of solidshape and spatial lay-out through photometric invariants In R Trappl(Ed) Cybernetics and systems research (pp 943-948) AmsterdamNorth-Holland
Koenderink J J amp van Doorn A J (1982b) The shape of smoothobjects and the way contours end Perception 11 129-137
Koenderink J J van Doorn A J Christou C amp Lappin J S(1996) Shape constancy in pictorial relief Perception 25 155-164
Koenderink J J van Doorn A J Kappers A M L amp Todd J T(1997) The visual contour in depth Perception amp Psychophysics 59828-838
Lynch K (1960) The image of the city Cambridge MA MIT Press Mackworth A K (1973) Interpreting pictures of polyhedral scenes
Artificial Intelligence 4 121-137 Malik J (1987) Interpreting line drawings of curved objects Interna-
tional Journal of Computer Vision 1 73-103 Mandelbrot B B (1983) The fractal geometry of nature (2nd ed)
New York Freeman Nasar J L (1998) The evaluative image of the city Newbury Park
CA Sage Norman J F Phillips F amp Ross H E (2001) Information concen-
tration along the boundary contours of naturally shaped solid objectsPerception 30 1285-1294
Norman J F Todd J T Perotti V J amp Tittle J M (1996) Vi-sual perception of three-dimensional length Journal of ExperimentalPsychology Human Perception amp Performance 22 173-186
Peachey D R (1985) Solid texturing of complex surfaces ComputerGraphics 19 279-286
Perlin K (1985) An image synthesizer Computer Graphics 19 287-296
Figure 15 A formal example of the type of illustration shownin Figure 14 using a radial cosine surface The top panels showthe occlusion and boundary contours separately The bottom leftshows them integrated and the bottom right shows the surface asrepresented using a contour texture As with the artist-producedexample the collections of individual occlusion or boundary con-tours do not result in a compelling three-dimensional object buttheir conjunction does
PERCEPTUAL REPRESENTATION OF VISIBLE SURFACES 761
Phillips F (in press) Creating noisy objects Perception Phillips F amp Todd J T (1996) Perception of local three-dimensional
shape Journal of Experimental Psychology Human Perception ampPerformance 22 930-944
Phillips F Todd J T Koenderink J J amp Kappers A M L (1997)Perceptual localization of surface position Journal of ExperimentalPsychology Human Perception amp Performance 23 1481-1492
Reichel F D amp Todd J T (1990) Perceived depth inversion ofsmoothly curved surfaces due to image orientation Journal of Exper-imental Psychology Human Perception amp Performance 16 653-664
Richards W A Koenderink J J amp Hoffman D D (1987) Infer-ring three-dimensional shapes from two-dimensional silhouettesJournal of the Optical Society of America A 4 1168-1175
Siddiqi K Tresness K J amp Kimia B B (1996) Parts of visual formPsychological aspects Perception 25 399-424
Singh M Seyranian G D amp Hoffman D D (1999) Parsing sil-houettes The short-cut rule Perception amp Psychophysics 61 636-660
Thompson D W (1992) On growth and form The complete revisededition New York Dover
Todd J T amp Reichel F D (1989) Ordinal structure in the visual per-ception and cognition of smoothly curved surfaces Psychological Re-view 96 643-657
Waltz D (1975a) Generating semantic descriptions from drawings ofscenes with shadows In P Winston (Ed) The psychology of computervision (pp 19-91) New York McGraw-Hill
Waltz D (1975b) Understanding line drawings of scenes with shad-ows In P H Winston (Ed) The psychology of computer vision(pp 19-91) New York McGraw-Hill
Wolfram S (1991) Mathematica A system for doing mathematics bycomputer (2nd ed) Redwood City CA Addison-Wesley
APPENDIXDifferential Geometry of Surfaces
Given a regular surface M [ R 3 consider the set of all planes containing a given point P andits normal vector NP Each plane will intersect M in a curve whose local curvature k at P is de-fined by
(4)
where r denotes the radius of the osculating circle at P At the limits a k 5 0 on a curve repre-sents a ldquoflatrdquo region (its osculating circle has an infinite radius) and as k approaches infinity thecurve develops a ldquokinkrdquo or discontinuity (see Figure A1) The sign of the curvature defines its rel-ative concavity or convexity
On a given M at all P there are a pair of orthogonal curves whose ks are at a minimum and max-imum relative to all others These are the principal curvatures denoted k1 and k2 (sometimes de-noted kmin and kmax respectively) By examining the relationship between them we can defineseveral classes of special locations on a surface
Intuitively a location with no curvature in either direction
k1k2 5 0 (5)
is defined as planar point A location with curvature in only one direction
k1 5 0 or k2 5 0 (6)
is a parabolic point And a location with equal nonzero curvatures
k1 5 k2 THORN 0 (7)
is an umbilic point The mean curvature H is defined as
(8)
Points where H 5 0 are minimal points Minimal surfaces are surfaces where H 5 0 everywhereThe Gaussian curvature K is defined as
K 5 k1k2 (9)
Points where K 0 are hyperbolic points whereas points with K 0 are elliptic points Together H and K define the differential nature of a surface at a given location Koenderink
(1990) has suggested a reparameterization of the principal curvatures that offer the further bene-fits of scale-dependent and scale-independent measures
The shape index S is the scale-independent measure defined as
(10)
When S 5 605 the location is a cylindric (or monoclastic) ldquotroughrdquo or ldquoridgerdquo At S 5 610 thelocation is an elliptical (or synclastic) ldquodimplerdquo or ldquobumprdquo And when S 5 0 the location is a hy-perbolic (or anticlastic) ldquosaddlerdquo The sign specifies the orientation of the curvatures relative to
S = -+-
2 1 2
1 21 2p
arctan k k
k kk k
H =+k k1 2
2
k = 1r
762 PHILLIPS TODD KOENDERINK AND KAPPERS
the normal defined at that point The scale-dependent complement to shape index is curvednessC defined as
(11)
Curvedness is a single-valued analogue of curvature when C 5 0 the location is a planar pointand as C approaches infinity the location is a crease or point (depending on S) Unlike the rawcurvature it is always positive the direction of curvature is encoded in the shape index
For the present set of experiments we defined additional reparameterizations of the ks to bet-ter understand the nature of the observersrsquo responses Curvature difference Dk is the signed dif-ference of curvatures defined as
Dk 5 k1 2 k2 (12)
Curvature contrast D|k| is the difference of curvature magnitudes defined as
D|k| 5 |k2| 2 |k1| (13)
This measure is concerned only with the magnitude of the difference and not with the sign (andwill always be positive since k2 $ k1) Total curvature magnitude S|k| is the complement to cur-vature contrast defined as
S|k| 5 |k1| 1 |k2| (14)
As with curvature contrast this measure uses the magnitudes and is always positive It representsthe total amount of curvature at a given location similar to CA1
Finally we defined two measures in the spirit of the minima rule of Hoffman and Richards(1984) The first is the signed maximum magnitude k| max | defined as
(15)
The second is the maximum magnitude |k|max defined by
|k|max 5 max (|k1||k2|) (16)
NOTE
A1 The signed analogue to total curvature magnitude is equivalent to the mean curvature measurementand therefore is not included
(Manuscript received March 4 2002 revision accepted for publication January 28 2003)
kk k k
kmax
=
gtigraveiacuteicirc
1 1 2
2
if
otherwise
C =+k k1
222
2
APPENDIX (Continued)
Figure A1 The upper left figure shows two points P1 and P2with curvature k 5 0 at P1 and k 0 at P2 The right-hand P fig-ure illustrates the osculating circle at P whose radius r deter-mines the curvature P on curve C The osculating circle is definedas the circle that is described by P1 P P2 as P1 and P2 approachP on C at the limit
P1
P2
P
P1
P2
C
r