perceptual assignment of opacity to translucent surfaces: the role of image blur
TRANSCRIPT
1 IntroductionIn constructing the percept of transparencyöseeing an object or surface through apartially transmissive surfaceöthe visual system must decompose or scission (Koffka1935) the light intensity at each retinal location, and assign the separate componentsto distinct surfaces in depth. The contributions of the underlying surface and the trans-parent surface are collapsed onto a single intensity value at each point in the image,and these contributions must be separated if the two surfaces are to be extracted. Inthis regard, the problem of perceptual transparency is similar to other visual problemsin that multiple contributions (eg surface reflectance, illumination, surface orientation)must be inferred from a single pattern of light intensities. What makes perceptualtransparency unique, however, is that the image decomposition involves the visualconstruction of two distinct surfaces (or material layers) along each line of sight.
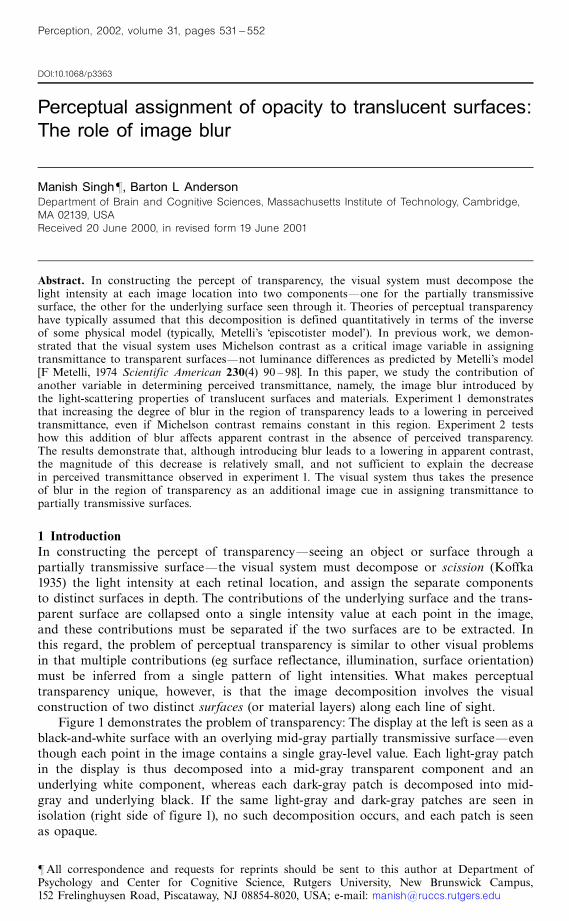
Figure 1 demonstrates the problem of transparency: The display at the left is seen as ablack-and-white surface with an overlying mid-gray partially transmissive surfaceöeventhough each point in the image contains a single gray-level value. Each light-gray patchin the display is thus decomposed into a mid-gray transparent component and anunderlying white component, whereas each dark-gray patch is decomposed into mid-gray and underlying black. If the same light-gray and dark-gray patches are seen inisolation (right side of figure 1), no such decomposition occurs, and each patch is seenas opaque.
Perceptual assignment of opacity to translucent surfaces:The role of image blur
Perception, 2002, volume 31, pages 531 ^ 552
Manish Singhô, Barton L AndersonDepartment of Brain and Cognitive Sciences, Massachusetts Institute of Technology, Cambridge,MA 02139, USAReceived 20 June 2000, in revised form 19 June 2001
Abstract. In constructing the percept of transparency, the visual system must decompose thelight intensity at each image location into two componentsöone for the partially transmissivesurface, the other for the underlying surface seen through it. Theories of perceptual transparencyhave typically assumed that this decomposition is defined quantitatively in terms of the inverseof some physical model (typically, Metelli's `episcotister model'). In previous work, we demon-strated that the visual system uses Michelson contrast as a critical image variable in assigningtransmittance to transparent surfacesönot luminance differences as predicted by Metelli's model[F Metelli, 1974 Scientific American 230(4) 90 ^ 98]. In this paper, we study the contribution ofanother variable in determining perceived transmittance, namely, the image blur introduced bythe light-scattering properties of translucent surfaces and materials. Experiment 1 demonstratesthat increasing the degree of blur in the region of transparency leads to a lowering in perceivedtransmittance, even if Michelson contrast remains constant in this region. Experiment 2 testshow this addition of blur affects apparent contrast in the absence of perceived transparency.The results demonstrate that, although introducing blur leads to a lowering in apparent contrast,the magnitude of this decrease is relatively small, and not sufficient to explain the decreasein perceived transmittance observed in experiment 1. The visual system thus takes the presenceof blur in the region of transparency as an additional image cue in assigning transmittance topartially transmissive surfaces.
DOI:10.1068/p3363
ôAll correspondence and requests for reprints should be sent to this author at Department ofPsychology and Center for Cognitive Science, Rutgers University, New Brunswick Campus,152 Frelinghuysen Road, Piscataway, NJ 08854-8020, USA; e-mail: [email protected]
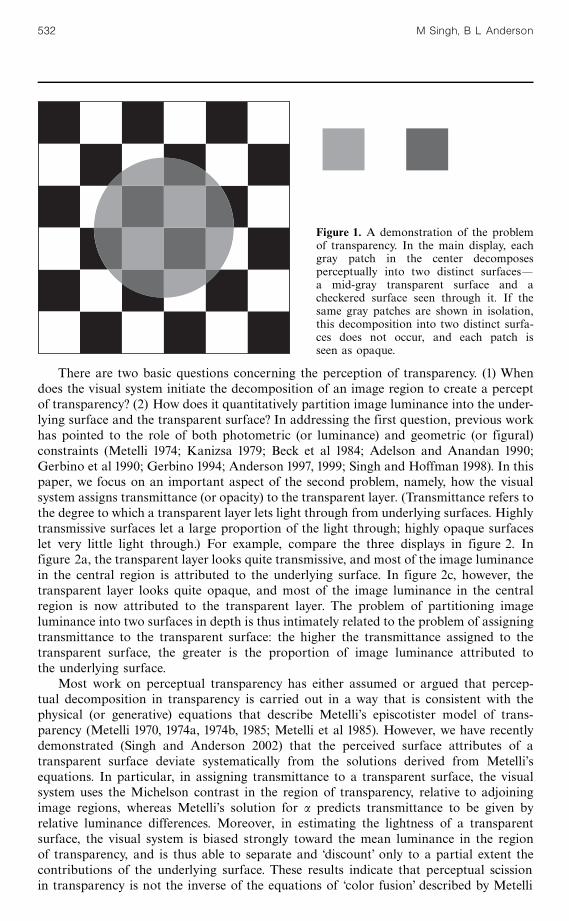
There are two basic questions concerning the perception of transparency. (1) Whendoes the visual system initiate the decomposition of an image region to create a perceptof transparency? (2) How does it quantitatively partition image luminance into the under-lying surface and the transparent surface? In addressing the first question, previous workhas pointed to the role of both photometric (or luminance) and geometric (or figural)constraints (Metelli 1974; Kanizsa 1979; Beck et al 1984; Adelson and Anandan 1990;Gerbino et al 1990; Gerbino 1994; Anderson 1997, 1999; Singh and Hoffman 1998). In thispaper, we focus on an important aspect of the second problem, namely, how the visualsystem assigns transmittance (or opacity) to the transparent layer. (Transmittance refers tothe degree to which a transparent layer lets light through from underlying surfaces. Highlytransmissive surfaces let a large proportion of the light through; highly opaque surfaceslet very little light through.) For example, compare the three displays in figure 2. Infigure 2a, the transparent layer looks quite transmissive, and most of the image luminancein the central region is attributed to the underlying surface. In figure 2c, however, thetransparent layer looks quite opaque, and most of the image luminance in the centralregion is now attributed to the transparent layer. The problem of partitioning imageluminance into two surfaces in depth is thus intimately related to the problem of assigningtransmittance to the transparent surface: the higher the transmittance assigned to thetransparent surface, the greater is the proportion of image luminance attributed tothe underlying surface.
Most work on perceptual transparency has either assumed or argued that percep-tual decomposition in transparency is carried out in a way that is consistent with thephysical (or generative) equations that describe Metelli's episcotister model of trans-parency (Metelli 1970, 1974a, 1974b, 1985; Metelli et al 1985). However, we have recentlydemonstrated (Singh and Anderson 2002) that the perceived surface attributes of atransparent surface deviate systematically from the solutions derived from Metelli'sequations. In particular, in assigning transmittance to a transparent surface, the visualsystem uses the Michelson contrast in the region of transparency, relative to adjoiningimage regions, whereas Metelli's solution for a predicts transmittance to be given byrelative luminance differences. Moreover, in estimating the lightness of a transparentsurface, the visual system is biased strongly toward the mean luminance in the regionof transparency, and is thus able to separate and `discount' only to a partial extent thecontributions of the underlying surface. These results indicate that perceptual scissionin transparency is not the inverse of the equations of color fusion' described by Metelli
Figure 1. A demonstration of the problemof transparency. In the main display, eachgray patch in the center decomposesperceptually into two distinct surfacesöa mid-gray transparent surface and acheckered surface seen through it. If thesame gray patches are shown in isolation,this decomposition into two distinct surfa-ces does not occur, and each patch isseen as opaque.
532 M Singh, B L Anderson
(see section 2). Rather, the visual system appears to track certain simple, but critical,image variables in order to assign surface attributes to transparent layers. This suggeststhat the study of perceptual transparency must be aimed at identifying such imagevariables and their perceptual contributions, rather than simply equating perceptualtheory with the inverse of specific generative models.
In this paper, we demonstrate that image blur is an additional variable that thevisual system uses to assign transmittance to partially transmissive layers. Previouswork on perceptual transparency (including our own) has typically studied contexts inwhich the partially transmissive layer transmits some of the incident light, and reflectssome of it. Many partially transmissive materials, however, also exhibit the propertyof translucency, which leads to a blurring of contours seen through the translucentmaterial. Here, we study the perceptual consequences of such blurring. Our resultsshow that the visual system takes the presence of blur in the region of transparency(relative to adjoining regions) as evidence for a decrease in the transmittance of atransparent layer, even if the Michelson contrast remains unchanged in this region.Moreover, this decrease in perceived transmittance is not accounted for by the rela-tively small decrease in apparent contrast that results from such blurring. Hence,the visual system takes the presence of blur as a further image cueöin addition tocontrast reductionöin assigning transmittance to partially transmissive surfaces.
We begin with a short exposition of Metelli's episcotister model, and the predictionsit makes regarding perceived surface attributes. We briefly review empirical workaimed at testing the predictions of Metelli's model, including our own previous resultsthat demonstrate the critical role of Michelson contrast in assigning perceived trans-mittance. We then turn to the perceptual contributions of image blur in determiningperceived transmittance.
(a) (b)
(c)
Figure 2. The precise way in which image luminance isdecomposed into the transparent surface and the under-lying surface depends on the transmittance assigned tothe transparent layer. The higher the perceived trans-mittance, the greater the proportion of image luminanceattributed to the underlying surface.
Image blur and translucent surfaces 533
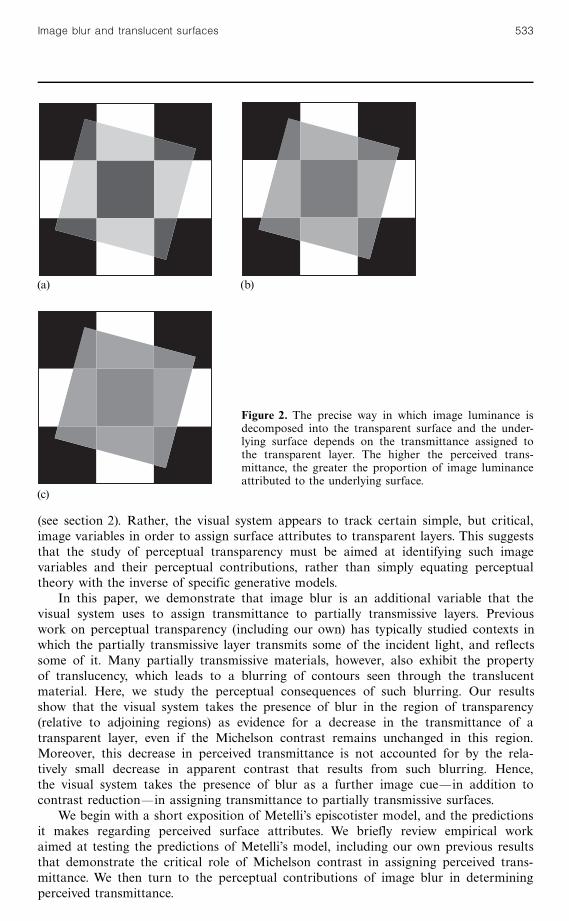
2 Metelli's equations and their extensionsMetelli (1970, 1974a, 1974b, 1985; Metelli et al 1985) proposed a model of transparencybased on the physical setup of an episcotister. A flat fan blade with reflectance t and anopen sector of relative area a is rotated in front of a bipartite background (figure 3a).When this rotation is faster than fusion speed, it leads to the percept of a homoge-neous transparent layer overlying the bipartite background (figure 3b). The term a thencaptures the transmittance of the episcotister, namely, the proportion of light that itlets through. Large values of a (ie values close to 1) correspond to highly transmissiveepiscotisters, whereas small values of a (ie close to 0) correspond to episcotisters thatare almost fully opaque.
The resulting color mixing' (Metelli 1974a) in the episcotister model is describedby Talbot's law:
p � aa� �1ÿ a�t , (1)
q � ab� �1ÿ a�t . (2)
In other words, reflectances a and t are mixed in ratios a and 1ÿ a respectively,resulting in reflectance p; and b and t are mixed in ratios a and 1ÿ a resulting in q.Since the terms a and t are identical in (1) and (2), these equations can be solved toyield the following solutions:
a � pÿ q
aÿ b, (3)
t � aqÿ bp
a� qÿ bÿ p. (4)
Metelli argued that perceptual scission in transparency is given by the inverse of colorfusion', and that the perceived transmittance and reflectance of the transparent layerare thus given by the solutions to equations (3) and (4). In particular, solution (3)predicts that perceived transmittance is determined by the reflectance difference in theregion of transparency, relative to that in the surrounding region (see figure 3b).
Although Metelli's equations are written in terms of reflectance values, Gerbinoet al (1990) have shown that the same equations are obtained when luminance issubstituted for reflectance. The luminance formulation of Metelli's equations is moreappropriate from the point of view of perceptual theory since the visual system isnot `given' reflectance values, but luminance values. Formally identical equations also
(a) (b)
a ab b
t p q
a
Figure 3. Metelli's episcotister model of transparency. A circular disk with an open sector isrotated rapidly in front of a bipartite background (a), hence creating a percept of transparency (b).This leads to a quantitative model of color fusion in transparency. Perceptual scission is thendefined by inverting the equations of color fusion.
534 M Singh, B L Anderson
follow in the context of a mesh (or screen) placed in front of a bipartite background,rather than a rotating episcotister. In this case, a refers to the areal density of the holesin the mesh, and t refers to the reflectance of the material portion of the mesh.
More recently, we (Singh and Anderson 2002) have extended the luminance versionof Metelli's equations to textured displays that contain a continuous range of lumi-nance values, rather than four distinct values (a, b, p, q ). The local solutions for a andt in this case are given by:
a � Lmax ÿ Lmin
Amax ÿ Amin
� Lrange
Arange, (5)
t � ArangeLmean ÿ AmeanLrange
Arange ÿ Lrange, (6)
where L refers to luminance values in the image region containing transparency, andA refers to luminance values in image regions where the underlying surface is seen inplain view. These solutions are simple extensions of the luminance versions of solutions(3) and (4). In particular, solution (5) predicts that perceived transmittance is given bythe luminance range within the region of transparency, relative to adjoining regions.
3 Perceptual validity of Metelli's modelTo what extent do Metelli's equations provide an account of how the human visualsystem assigns surface attributes to transparent layers? Most studies of perceptualtransparency have argued for the validity of Metelli's model. Ironically, however,Metelli himself made an observation that undermined the perceptual validity of hismodel. Citing an observation by Tudor-Hart (1928), Metelli (1974b) noted that a blackepiscotister looks more transmissive than a white episcotister of the same physicaltransmittance a (ie with the same sized open sector). However, Metelli never reconciledthis observation with his formal model. In this section, we briefly review some of theempirical studies that have tested Metelli's model. We argue that the reason thesestudies have not found the failures in Metelli's model is because they have typically notmeasured separately how the visual system assigns a and t.
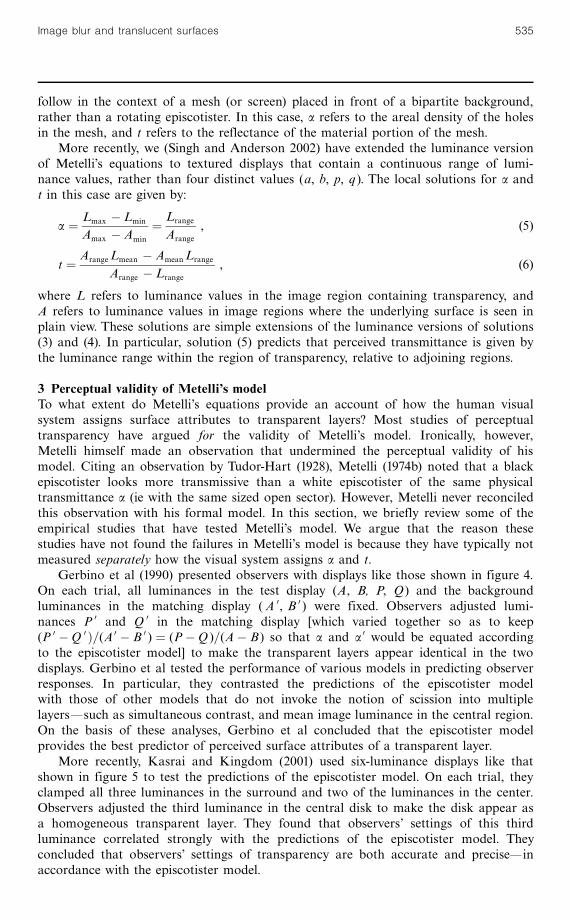
Gerbino et al (1990) presented observers with displays like those shown in figure 4.On each trial, all luminances in the test display (A, B, P, Q) and the backgroundluminances in the matching display (A 0, B 0 ) were fixed. Observers adjusted lumi-nances P 0 and Q 0 in the matching display [which varied together so as to keep(P 0 ÿQ 0 �=(A 0 ÿ B 0 ) � (PÿQ)=(Aÿ B) so that a and a 0 would be equated accordingto the episcotister model] to make the transparent layers appear identical in the twodisplays. Gerbino et al tested the performance of various models in predicting observerresponses. In particular, they contrasted the predictions of the episcotister modelwith those of other models that do not invoke the notion of scission into multiplelayersösuch as simultaneous contrast, and mean image luminance in the central region.On the basis of these analyses, Gerbino et al concluded that the episcotister modelprovides the best predictor of perceived surface attributes of a transparent layer.
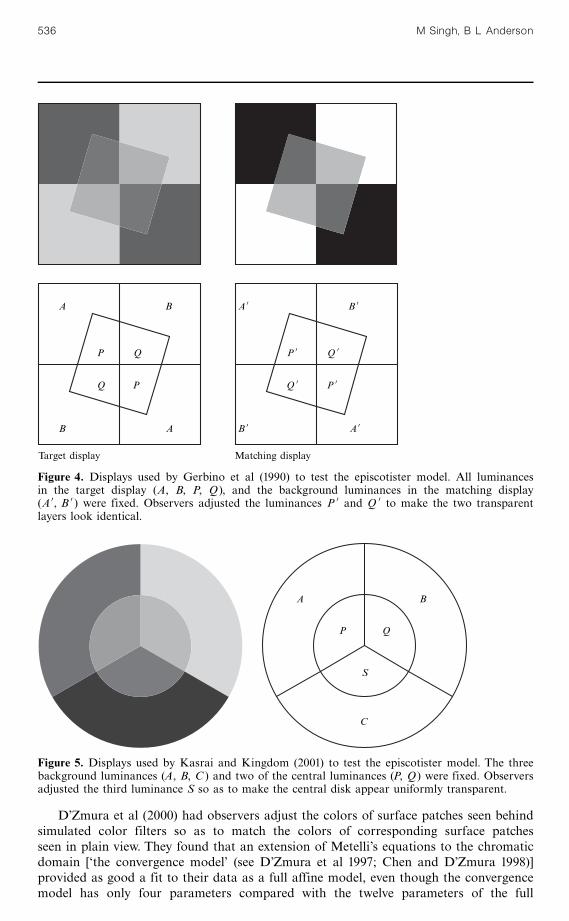
More recently, Kasrai and Kingdom (2001) used six-luminance displays like thatshown in figure 5 to test the predictions of the episcotister model. On each trial, theyclamped all three luminances in the surround and two of the luminances in the center.Observers adjusted the third luminance in the central disk to make the disk appear asa homogeneous transparent layer. They found that observers' settings of this thirdluminance correlated strongly with the predictions of the episcotister model. Theyconcluded that observers' settings of transparency are both accurate and preciseöinaccordance with the episcotister model.
Image blur and translucent surfaces 535
D'Zmura et al (2000) had observers adjust the colors of surface patches seen behindsimulated color filters so as to match the colors of corresponding surface patchesseen in plain view. They found that an extension of Metelli's equations to the chromaticdomain [`the convergence model' (see D'Zmura et al 1997; Chen and D'Zmura 1998)]provided as good a fit to their data as a full affine model, even though the convergencemodel has only four parameters compared with the twelve parameters of the full
Target display Matching display
A B A 0 B 0
B A B 0 A 0
P Q P 0 Q 0
Q P Q 0 P 0
Figure 4. Displays used by Gerbino et al (1990) to test the episcotister model. All luminancesin the target display (A, B, P, Q ), and the background luminances in the matching display(A 0, B 0 ) were fixed. Observers adjusted the luminances P 0 and Q 0 to make the two transparentlayers look identical.
A B
P Q
S
C
Figure 5. Displays used by Kasrai and Kingdom (2001) to test the episcotister model. The threebackground luminances (A, B, C ) and two of the central luminances (P, Q ) were fixed. Observersadjusted the third luminance S so as to make the central disk appear uniformly transparent.
536 M Singh, B L Anderson
affine model. Moreover, on the basis of the fits to the convergence model, they inferredthat human observers underestimate the transmittance of a transparent filter by afactor of almost two (see also Hagedorn and D'Zmura 2000).
Although the above three studies employed very different experimental techniques,they share the characteristic that they did not give observers the opportunity to makeseparate matches of the transmittance and lightness of a transparent layer. Observers'matches were based either on the overall appearance of the transparent layer, or onthe appearance of underlying surfaces. As a result, these studies did not allow for adirect test of the perceptual validity of the Metelli's solutions for surface transmittance(a) and lightness (t).
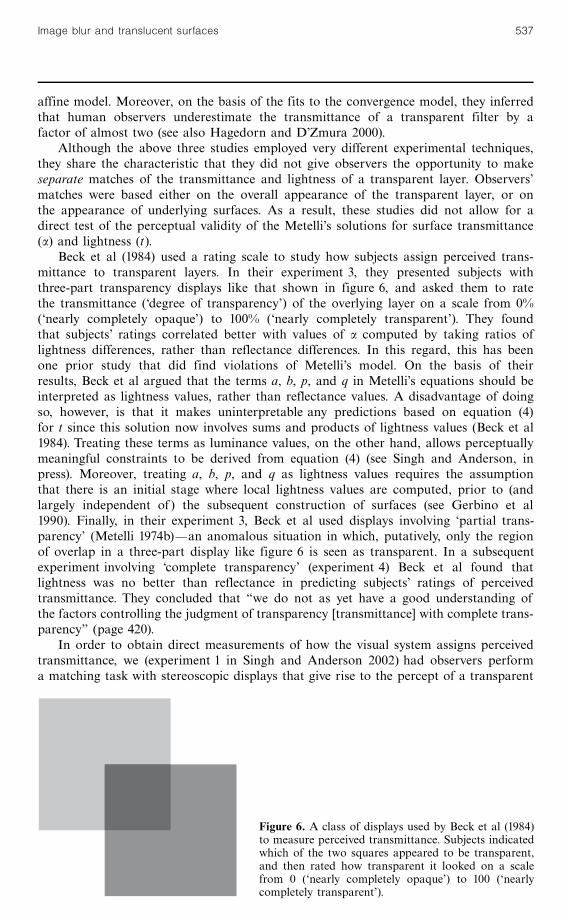
Beck et al (1984) used a rating scale to study how subjects assign perceived trans-mittance to transparent layers. In their experiment 3, they presented subjects withthree-part transparency displays like that shown in figure 6, and asked them to ratethe transmittance (`degree of transparency') of the overlying layer on a scale from 0%(`nearly completely opaque') to 100% (`nearly completely transparent'). They foundthat subjects' ratings correlated better with values of a computed by taking ratios oflightness differences, rather than reflectance differences. In this regard, this has beenone prior study that did find violations of Metelli's model. On the basis of theirresults, Beck et al argued that the terms a, b, p, and q in Metelli's equations should beinterpreted as lightness values, rather than reflectance values. A disadvantage of doingso, however, is that it makes uninterpretable any predictions based on equation (4)for t since this solution now involves sums and products of lightness values (Beck et al1984). Treating these terms as luminance values, on the other hand, allows perceptuallymeaningful constraints to be derived from equation (4) (see Singh and Anderson, inpress). Moreover, treating a, b, p, and q as lightness values requires the assumptionthat there is an initial stage where local lightness values are computed, prior to (andlargely independent of ) the subsequent construction of surfaces (see Gerbino et al1990). Finally, in their experiment 3, Beck et al used displays involving `partial trans-parency' (Metelli 1974b)öan anomalous situation in which, putatively, only the regionof overlap in a three-part display like figure 6 is seen as transparent. In a subsequentexperiment involving complete transparency' (experiment 4) Beck et al found thatlightness was no better than reflectance in predicting subjects' ratings of perceivedtransmittance. They concluded that ` we do not as yet have a good understanding ofthe factors controlling the judgment of transparency [transmittance] with complete trans-parency'' (page 420).
In order to obtain direct measurements of how the visual system assigns perceivedtransmittance, we (experiment 1 in Singh and Anderson 2002) had observers performa matching task with stereoscopic displays that give rise to the percept of a transparent
Figure 6. A class of displays used by Beck et al (1984)to measure perceived transmittance. Subjects indicatedwhich of the two squares appeared to be transparent,and then rated how transparent it looked on a scalefrom 0 (`nearly completely opaque') to 100 (`nearlycompletely transparent').
Image blur and translucent surfaces 537
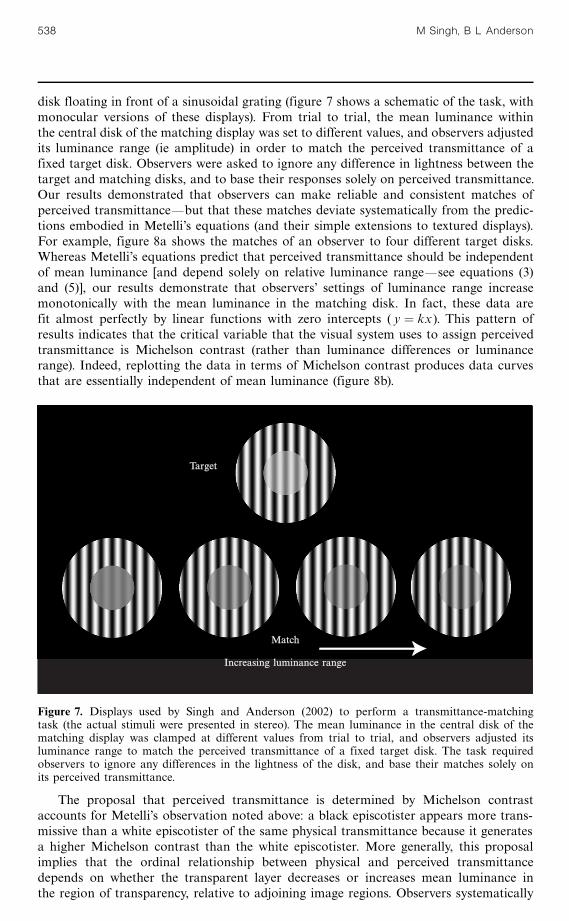
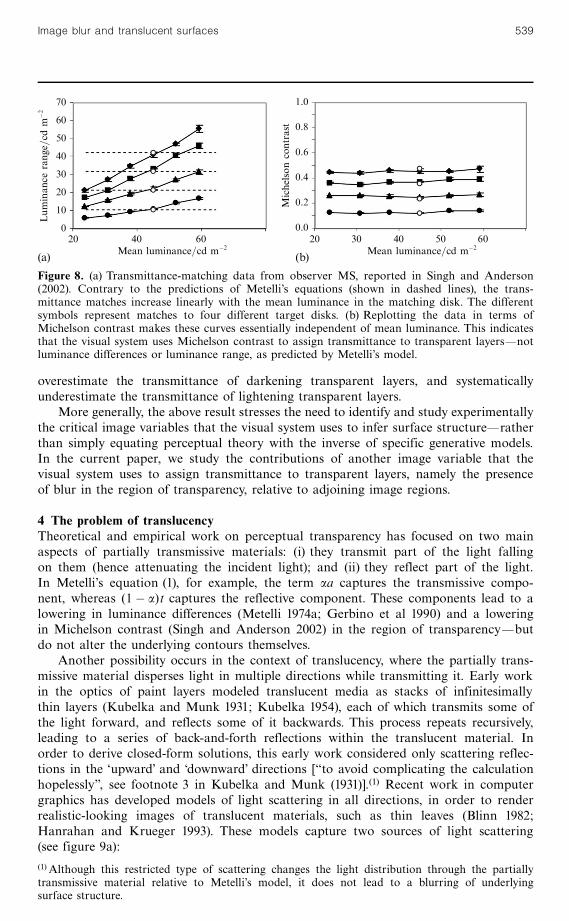
disk floating in front of a sinusoidal grating (figure 7 shows a schematic of the task, withmonocular versions of these displays). From trial to trial, the mean luminance withinthe central disk of the matching display was set to different values, and observers adjustedits luminance range (ie amplitude) in order to match the perceived transmittance of afixed target disk. Observers were asked to ignore any difference in lightness between thetarget and matching disks, and to base their responses solely on perceived transmittance.Our results demonstrated that observers can make reliable and consistent matches ofperceived transmittanceöbut that these matches deviate systematically from the predic-tions embodied in Metelli's equations (and their simple extensions to textured displays).For example, figure 8a shows the matches of an observer to four different target disks.Whereas Metelli's equations predict that perceived transmittance should be independentof mean luminance [and depend solely on relative luminance rangeösee equations (3)and (5)], our results demonstrate that observers' settings of luminance range increasemonotonically with the mean luminance in the matching disk. In fact, these data arefit almost perfectly by linear functions with zero intercepts ( y � kx). This pattern ofresults indicates that the critical variable that the visual system uses to assign perceivedtransmittance is Michelson contrast (rather than luminance differences or luminancerange). Indeed, replotting the data in terms of Michelson contrast produces data curvesthat are essentially independent of mean luminance (figure 8b).
The proposal that perceived transmittance is determined by Michelson contrastaccounts for Metelli's observation noted above: a black episcotister appears more trans-missive than a white episcotister of the same physical transmittance because it generatesa higher Michelson contrast than the white episcotister. More generally, this proposalimplies that the ordinal relationship between physical and perceived transmittancedepends on whether the transparent layer decreases or increases mean luminance inthe region of transparency, relative to adjoining image regions. Observers systematically
Target
Match
Increasing luminance range
Figure 7. Displays used by Singh and Anderson (2002) to perform a transmittance-matchingtask (the actual stimuli were presented in stereo). The mean luminance in the central disk of thematching display was clamped at different values from trial to trial, and observers adjusted itsluminance range to match the perceived transmittance of a fixed target disk. The task requiredobservers to ignore any differences in the lightness of the disk, and base their matches solely onits perceived transmittance.
538 M Singh, B L Anderson
overestimate the transmittance of darkening transparent layers, and systematicallyunderestimate the transmittance of lightening transparent layers.
More generally, the above result stresses the need to identify and study experimentallythe critical image variables that the visual system uses to infer surface structureöratherthan simply equating perceptual theory with the inverse of specific generative models.In the current paper, we study the contributions of another image variable that thevisual system uses to assign transmittance to transparent layers, namely the presenceof blur in the region of transparency, relative to adjoining image regions.
4 The problem of translucencyTheoretical and empirical work on perceptual transparency has focused on two mainaspects of partially transmissive materials: (i) they transmit part of the light fallingon them (hence attenuating the incident light); and (ii) they reflect part of the light.In Metelli's equation (1), for example, the term aa captures the transmissive compo-nent, whereas (1ÿ a)t captures the reflective component. These components lead to alowering in luminance differences (Metelli 1974a; Gerbino et al 1990) and a loweringin Michelson contrast (Singh and Anderson 2002) in the region of transparencyöbutdo not alter the underlying contours themselves.
Another possibility occurs in the context of translucency, where the partially trans-missive material disperses light in multiple directions while transmitting it. Early workin the optics of paint layers modeled translucent media as stacks of infinitesimallythin layers (Kubelka and Munk 1931; Kubelka 1954), each of which transmits some ofthe light forward, and reflects some of it backwards. This process repeats recursively,leading to a series of back-and-forth reflections within the translucent material. Inorder to derive closed-form solutions, this early work considered only scattering reflec-tions in the `upward' and `downward' directions [` to avoid complicating the calculationhopelessly'', see footnote 3 in Kubelka and Munk (1931)].(1) Recent work in computergraphics has developed models of light scattering in all directions, in order to renderrealistic-looking images of translucent materials, such as thin leaves (Blinn 1982;Hanrahan and Krueger 1993). These models capture two sources of light scattering(see figure 9a):
70
60
50
40
30
20
10
0
1.0
0.8
0.6
0.4
0.2
0.0
Lum
inan
cerang
e=cd
mÿ2
Michelson
contrast
20 40 60 20 30 40 50 60Mean luminance=cd mÿ2 Mean luminance=cd mÿ2(a) (b)
Figure 8. (a) Transmittance-matching data from observer MS, reported in Singh and Anderson(2002). Contrary to the predictions of Metelli's equations (shown in dashed lines), the trans-mittance matches increase linearly with the mean luminance in the matching disk. The differentsymbols represent matches to four different target disks. (b) Replotting the data in terms ofMichelson contrast makes these curves essentially independent of mean luminance. This indicatesthat the visual system uses Michelson contrast to assign transmittance to transparent layersönotluminance differences or luminance range, as predicted by Metelli's model.
(1) Although this restricted type of scattering changes the light distribution through the partiallytransmissive material relative to Metelli's model, it does not lead to a blurring of underlyingsurface structure.
Image blur and translucent surfaces 539
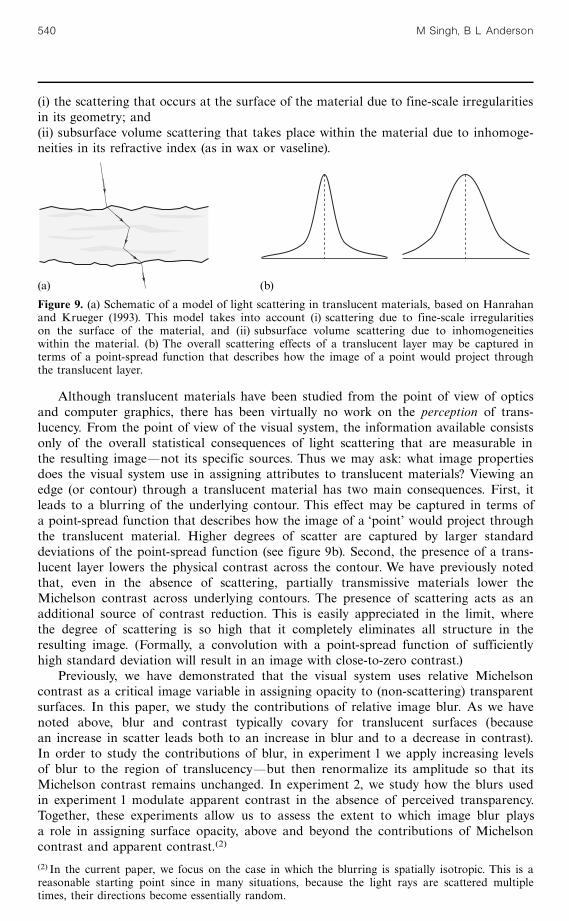
(i) the scattering that occurs at the surface of the material due to fine-scale irregularitiesin its geometry; and(ii) subsurface volume scattering that takes place within the material due to inhomoge-neities in its refractive index (as in wax or vaseline).
Although translucent materials have been studied from the point of view of opticsand computer graphics, there has been virtually no work on the perception of trans-lucency. From the point of view of the visual system, the information available consistsonly of the overall statistical consequences of light scattering that are measurable inthe resulting imageönot its specific sources. Thus we may ask: what image propertiesdoes the visual system use in assigning attributes to translucent materials? Viewing anedge (or contour) through a translucent material has two main consequences. First, itleads to a blurring of the underlying contour. This effect may be captured in terms ofa point-spread function that describes how the image of a `point' would project throughthe translucent material. Higher degrees of scatter are captured by larger standarddeviations of the point-spread function (see figure 9b). Second, the presence of a trans-lucent layer lowers the physical contrast across the contour. We have previously notedthat, even in the absence of scattering, partially transmissive materials lower theMichelson contrast across underlying contours. The presence of scattering acts as anadditional source of contrast reduction. This is easily appreciated in the limit, wherethe degree of scattering is so high that it completely eliminates all structure in theresulting image. (Formally, a convolution with a point-spread function of sufficientlyhigh standard deviation will result in an image with close-to-zero contrast.)
Previously, we have demonstrated that the visual system uses relative Michelsoncontrast as a critical image variable in assigning opacity to (non-scattering) transparentsurfaces. In this paper, we study the contributions of relative image blur. As we havenoted above, blur and contrast typically covary for translucent surfaces (becausean increase in scatter leads both to an increase in blur and to a decrease in contrast).In order to study the contributions of blur, in experiment 1 we apply increasing levelsof blur to the region of translucencyöbut then renormalize its amplitude so that itsMichelson contrast remains unchanged. In experiment 2, we study how the blurs usedin experiment 1 modulate apparent contrast in the absence of perceived transparency.Together, these experiments allow us to assess the extent to which image blur playsa role in assigning surface opacity, above and beyond the contributions of Michelsoncontrast and apparent contrast.(2)
(a) (b)
Figure 9. (a) Schematic of a model of light scattering in translucent materials, based on Hanrahanand Krueger (1993). This model takes into account (i) scattering due to fine-scale irregularitieson the surface of the material, and (ii) subsurface volume scattering due to inhomogeneitieswithin the material. (b) The overall scattering effects of a translucent layer may be captured interms of a point-spread function that describes how the image of a point would project throughthe translucent layer.
(2) In the current paper, we focus on the case in which the blurring is spatially isotropic. This is areasonable starting point since in many situations, because the light rays are scattered multipletimes, their directions become essentially random.
540 M Singh, B L Anderson
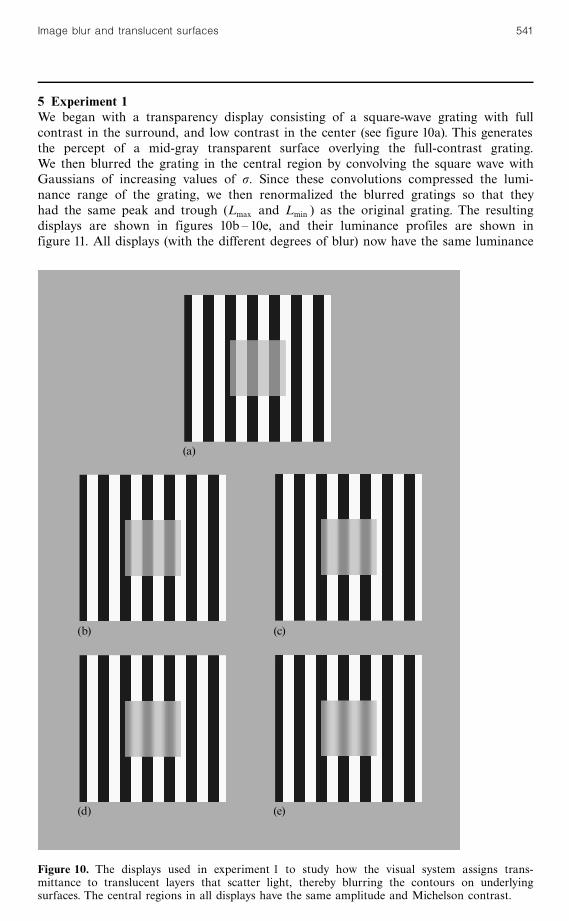
5 Experiment 1We began with a transparency display consisting of a square-wave grating with fullcontrast in the surround, and low contrast in the center (see figure 10a). This generatesthe percept of a mid-gray transparent surface overlying the full-contrast grating.We then blurred the grating in the central region by convolving the square wave withGaussians of increasing values of s. Since these convolutions compressed the lumi-nance range of the grating, we then renormalized the blurred gratings so that theyhad the same peak and trough (Lmax and Lmin ) as the original grating. The resultingdisplays are shown in figures 10b ^ 10e, and their luminance profiles are shown infigure 11. All displays (with the different degrees of blur) now have the same luminance
(a)
(b) (c)
(d) (e)
Figure 10. The displays used in experiment 1 to study how the visual system assigns trans-mittance to translucent layers that scatter light, thereby blurring the contours on underlyingsurfaces. The central regions in all displays have the same amplitude and Michelson contrast.
Image blur and translucent surfaces 541
range, and the same Michelson contrast, within the central region. These displays thusallow us to study the effects of blur on the perceived opacity of a translucent layer.
5.1 Methods5.1.1 Observers. Three observers with normal or corrected-to-normal vision participatedin the experiment. One observer was na|« ve to the purposes of the experiment (RF),and the other two were authors (MS and BA).
5.1.2 Stimuli and apparatus. Each test display consisted of a large square regioncontaining a vertically oriented square-wave grating (see figure 12). The side of thelarge square subtended 4.4 deg and it was placed on a mid-gray background (lumi-nance � 44.91 cd mÿ2). The spatial frequency of the square-wave grating was 1.51cycles degÿ1 (period � 0.662 deg), its mean luminance was 44.91 cd mÿ2, and its lumi-nance range was 84.84 cd mÿ2 (Michelson contrast � 0.945). A smaller square wasplaced inside the large one (the `target square'). Its side subtended 1.68 deg. Thissmaller square had the same mean luminance (44.91 cd mÿ2) as the surround, but alower contrast. Three different values of Michelson contrast in the smaller square weretested: 0.236, 0.354, and 0.472. These corresponded to luminance ranges of 21.23, 31.83,and 42.44 cd mÿ2, respectively. (The blurring procedure was thus applied to threedisplays with different contrast values in the target square.)
A
ÿA
A
ÿA
A
ÿA
A
ÿA
A
ÿA
Ã~ÄP P
Ã~ÄP P Ã~ÄP P
Ã~ÄP P Ã~ÄP P
(a)
(b) (c)
(d) (e)
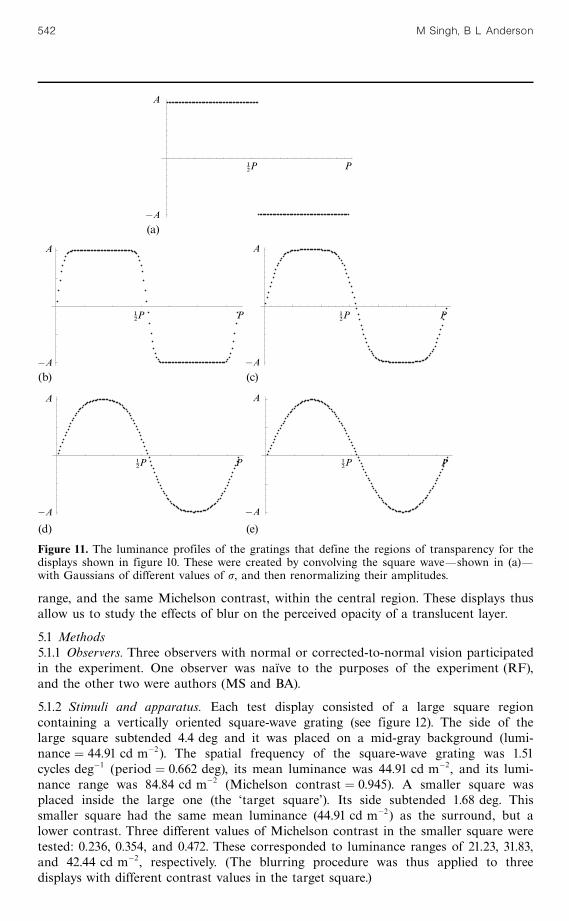
Figure 11. The luminance profiles of the gratings that define the regions of transparency for thedisplays shown in figure 10. These were created by convolving the square waveöshown in (a)öwith Gaussians of different values of s, and then renormalizing their amplitudes.
542 M Singh, B L Anderson
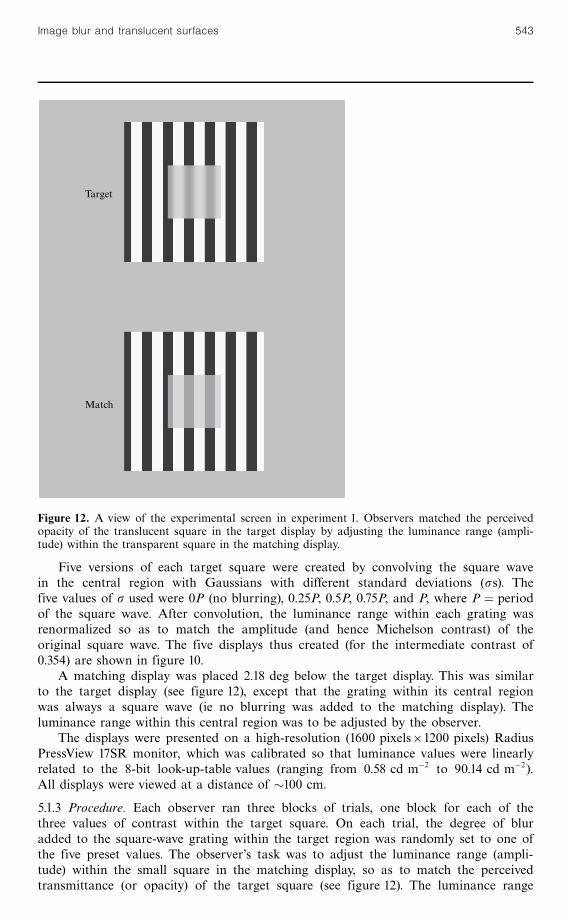
Five versions of each target square were created by convolving the square wavein the central region with Gaussians with different standard deviations (ss). Thefive values of s used were 0P (no blurring), 0.25P, 0.5P, 0.75P, and P, where P � periodof the square wave. After convolution, the luminance range within each grating wasrenormalized so as to match the amplitude (and hence Michelson contrast) of theoriginal square wave. The five displays thus created (for the intermediate contrast of0.354) are shown in figure 10.
A matching display was placed 2.18 deg below the target display. This was similarto the target display (see figure 12), except that the grating within its central regionwas always a square wave (ie no blurring was added to the matching display). Theluminance range within this central region was to be adjusted by the observer.
The displays were presented on a high-resolution (1600 pixels61200 pixels) RadiusPressView 17SR monitor, which was calibrated so that luminance values were linearlyrelated to the 8-bit look-up-table values (ranging from 0.58 cd mÿ2 to 90.14 cd mÿ2).All displays were viewed at a distance of �100 cm.
5.1.3 Procedure. Each observer ran three blocks of trials, one block for each of thethree values of contrast within the target square. On each trial, the degree of bluradded to the square-wave grating within the target region was randomly set to one ofthe five preset values. The observer's task was to adjust the luminance range (ampli-tude) within the small square in the matching display, so as to match the perceivedtransmittance (or opacity) of the target square (see figure 12). The luminance range
Target
Match
Figure 12. A view of the experimental screen in experiment 1. Observers matched the perceivedopacity of the translucent square in the target display by adjusting the luminance range (ampli-tude) within the transparent square in the matching display.
Image blur and translucent surfaces 543
increased and decreased symmetrically about the preset value of mean luminance.In each block, observers performed six adjustments for each of the five levels of blur.The first adjustment for each level of blur was taken as practice, resulting in fiveexperimental adjustments for each level of blur.
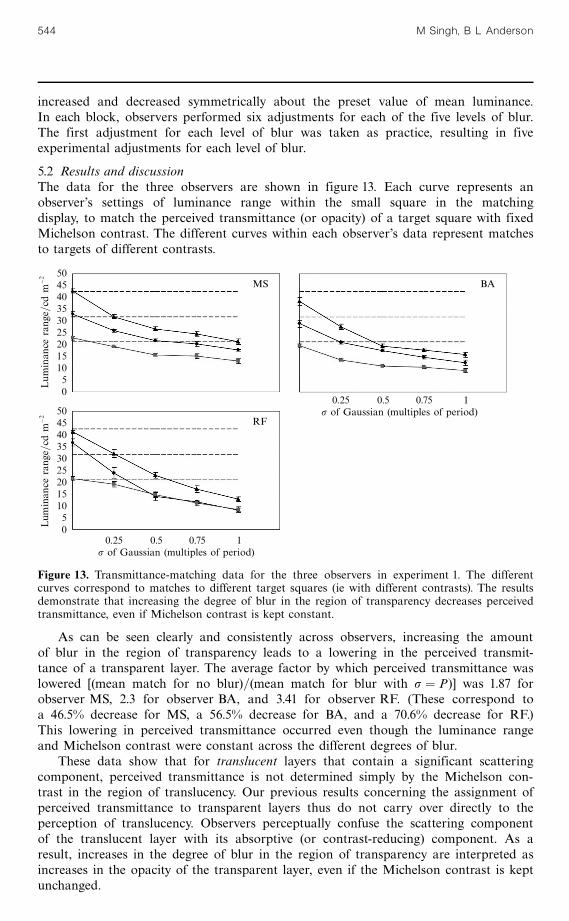
5.2 Results and discussionThe data for the three observers are shown in figure 13. Each curve represents anobserver's settings of luminance range within the small square in the matchingdisplay, to match the perceived transmittance (or opacity) of a target square with fixedMichelson contrast. The different curves within each observer's data represent matchesto targets of different contrasts.
As can be seen clearly and consistently across observers, increasing the amountof blur in the region of transparency leads to a lowering in the perceived transmit-tance of a transparent layer. The average factor by which perceived transmittance waslowered [(mean match for no blur)=(mean match for blur with s � P)] was 1.87 forobserver MS, 2.3 for observer BA, and 3.41 for observer RF. (These correspond toa 46.5% decrease for MS, a 56.5% decrease for BA, and a 70.6% decrease for RF.)This lowering in perceived transmittance occurred even though the luminance rangeand Michelson contrast were constant across the different degrees of blur.
These data show that for translucent layers that contain a significant scatteringcomponent, perceived transmittance is not determined simply by the Michelson con-trast in the region of translucency. Our previous results concerning the assignment ofperceived transmittance to transparent layers thus do not carry over directly to theperception of translucency. Observers perceptually confuse the scattering componentof the translucent layer with its absorptive (or contrast-reducing) component. As aresult, increases in the degree of blur in the region of transparency are interpreted asincreases in the opacity of the transparent layer, even if the Michelson contrast is keptunchanged.
50454035302520151050
50454035302520151050
Lum
inan
cerang
e=cd
mÿ2
Lum
inan
cerang
e=cd
mÿ2
0.25 0.5 0.75 1s of Gaussian (multiples of period)
0.25 0.5 0.75 1s of Gaussian (multiples of period)
MS BA
RF
Figure 13. Transmittance-matching data for the three observers in experiment 1. The differentcurves correspond to matches to different target squares (ie with different contrasts). The resultsdemonstrate that increasing the degree of blur in the region of transparency decreases perceivedtransmittance, even if Michelson contrast is kept constant.
544 M Singh, B L Anderson
A natural question is whether this result has to do with translucency per se, orwhether it is simply a contrast effect. In other words, does the decrease in perceivedtransmittance follow simply from a concomitant decrease in apparent contrast? Forexample, a sine wave appears to have somewhat lower contrast than a correspondingsquare wave with the same peak and trough (eg Ginsburg et al 1980; Georgeson 1991;Georgeson and Shackleton 1994). This is consistent with evidence both from contrast-threshold experiments (Campbell and Robson 1968) and from contrast-matchingexperiments (Ginsburg et al 1980), and indicates that the apparent contrast of agrating is biased toward its fundamental amplitude (ie the amplitude of its fundamentalfrequency). Since the blurred versions of the square wave in figures 10b ^ 10e all havelower fundamental amplitudes than the corresponding square wave in figure 10a, theywould indeed be perceived as having lower contrast. Thus the possibility remains thatperceived relative contrast consistently determines perceived opacity irrespective ofwhether or not blur is present, and the results of experiment 1 simply reflect theinadequacy of Michelson contrast in capturing apparent contrast in these displays.
Note, however, that since the fundamental amplitude of a square wave is 4=p timesthat of a corresponding sine wave, a contrast measure based on fundamental amplitudewould predict an effect no larger than 4=p, or �1:27; in our displays (ie a decreasein perceived transmittance of no more than 21%). The mean magnitude of the effectobtained in experiment 1, however, was 2.53öor a 60.5% overall decrease in perceivedtransmittance. Thus, these results cannot be attributed simply to the lowering in thefundamental amplitude of the square-wave grating that results from blurring. Similarly,the results cannot be attributed to a decrease in root-mean-square (RMS) contrast(Moulden et al 1990) since the standard deviation of luminance values in a sine-wavegrating is only 29.2% lower than that of a square wave.
To study directly the extent to which the results of experiment 1 might be explainedby a lowering in apparent contrast, we conducted a control experiment in which observ-ers matched the apparent contrast of the target regions used in experiment 1öexceptthat these were now placed in contexts that did not generate percepts of transparency.
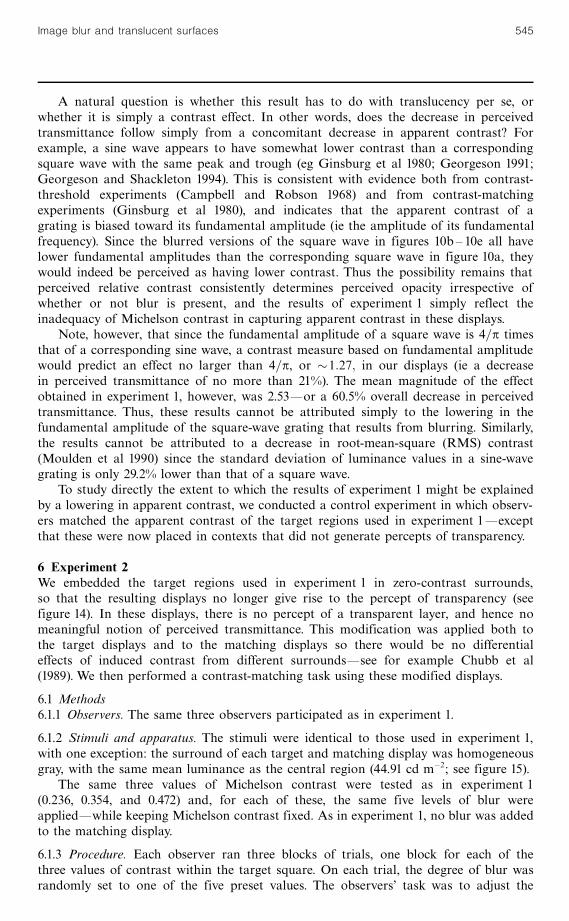
6 Experiment 2We embedded the target regions used in experiment 1 in zero-contrast surrounds,so that the resulting displays no longer give rise to the percept of transparency (seefigure 14). In these displays, there is no percept of a transparent layer, and hence nomeaningful notion of perceived transmittance. This modification was applied both tothe target displays and to the matching displays so there would be no differentialeffects of induced contrast from different surroundsösee for example Chubb et al(1989). We then performed a contrast-matching task using these modified displays.
6.1 Methods6.1.1 Observers. The same three observers participated as in experiment 1.
6.1.2 Stimuli and apparatus. The stimuli were identical to those used in experiment 1,with one exception: the surround of each target and matching display was homogeneousgray, with the same mean luminance as the central region (44.91 cd mÿ2; see figure 15).
The same three values of Michelson contrast were tested as in experiment 1(0.236, 0.354, and 0.472) and, for each of these, the same five levels of blur wereappliedöwhile keeping Michelson contrast fixed. As in experiment 1, no blur was addedto the matching display.
6.1.3 Procedure. Each observer ran three blocks of trials, one block for each of thethree values of contrast within the target square. On each trial, the degree of blur wasrandomly set to one of the five preset values. The observers' task was to adjust the
Image blur and translucent surfaces 545
luminance range (amplitude) within the matching display, so as to match the apparentcontrast of the target (see figure 15).
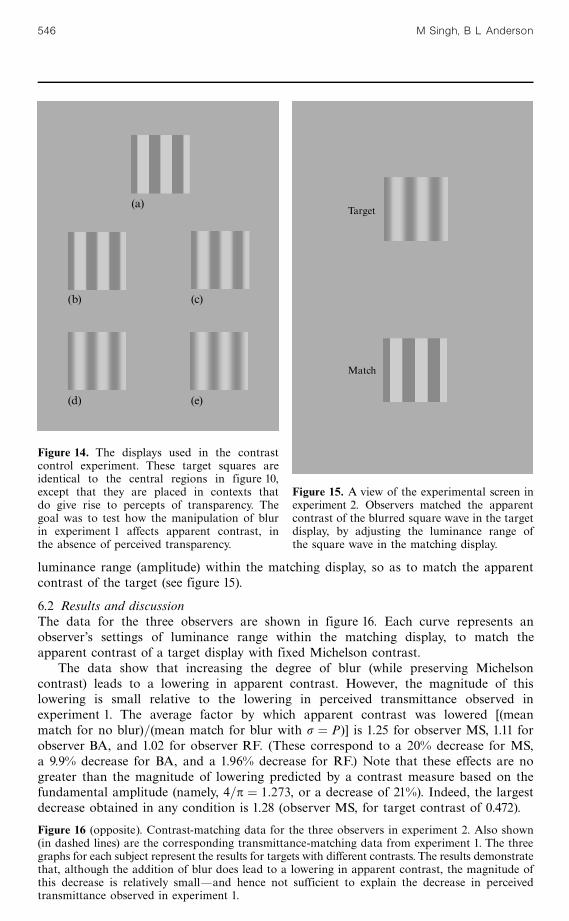
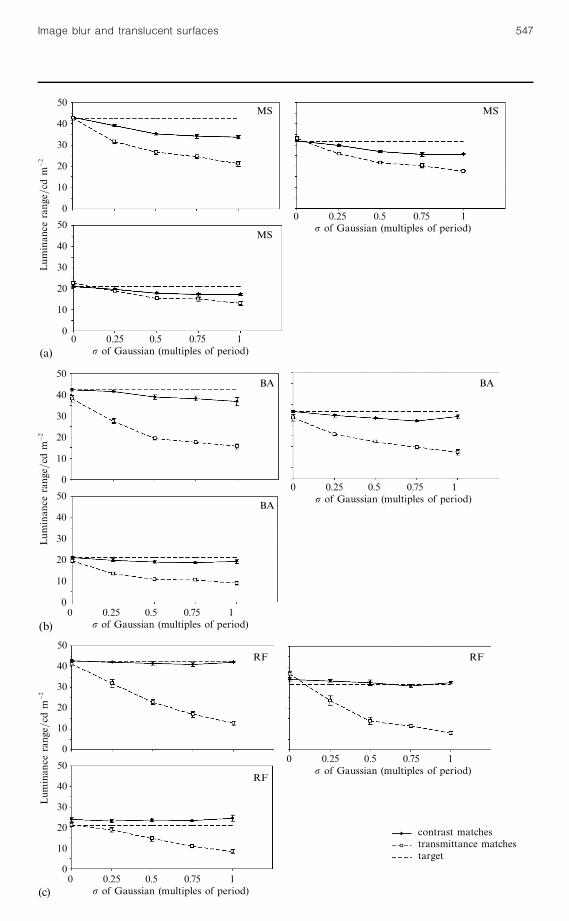
6.2 Results and discussionThe data for the three observers are shown in figure 16. Each curve represents anobserver's settings of luminance range within the matching display, to match theapparent contrast of a target display with fixed Michelson contrast.
The data show that increasing the degree of blur (while preserving Michelsoncontrast) leads to a lowering in apparent contrast. However, the magnitude of thislowering is small relative to the lowering in perceived transmittance observed inexperiment 1. The average factor by which apparent contrast was lowered [(meanmatch for no blur)=(mean match for blur with s � P)] is 1.25 for observer MS, 1.11 forobserver BA, and 1.02 for observer RF. (These correspond to a 20% decrease for MS,a 9.9% decrease for BA, and a 1.96% decrease for RF.) Note that these effects are nogreater than the magnitude of lowering predicted by a contrast measure based on thefundamental amplitude (namely, 4=p � 1:273, or a decrease of 21%). Indeed, the largestdecrease obtained in any condition is 1.28 (observer MS, for target contrast of 0.472).
Figure 14. The displays used in the contrastcontrol experiment. These target squares areidentical to the central regions in figure 10,except that they are placed in contexts thatdo give rise to percepts of transparency. Thegoal was to test how the manipulation of blurin experiment 1 affects apparent contrast, inthe absence of perceived transparency.
(a)
(b) (c)
(d) (e)
Target
Match
Figure 15. A view of the experimental screen inexperiment 2. Observers matched the apparentcontrast of the blurred square wave in the targetdisplay, by adjusting the luminance range ofthe square wave in the matching display.
Figure 16 (opposite). Contrast-matching data for the three observers in experiment 2. Also shown(in dashed lines) are the corresponding transmittance-matching data from experiment 1. The threegraphs for each subject represent the results for targets with different contrasts. The results demonstratethat, although the addition of blur does lead to a lowering in apparent contrast, the magnitude ofthis decrease is relatively smallöand hence not sufficient to explain the decrease in perceivedtransmittance observed in experiment 1.
546 M Singh, B L Anderson
50
40
30
20
10
0
50
40
30
20
10
0
Lum
inan
cerang
e=cd
mÿ2
(a)
MS MS
MS
0 0.25 0.5 0.75 1s of Gaussian (multiples of period)
0 0.25 0.5 0.75 1s of Gaussian (multiples of period)
50
40
30
20
10
0
50
40
30
20
10
0
(b)
Lum
inan
cerang
e=cd
mÿ2
BA BA
BA
0 0.25 0.5 0.75 1s of Gaussian (multiples of period)
0 0.25 0.5 0.75 1s of Gaussian (multiples of period)
50
40
30
20
10
0
50
40
30
20
10
0
Lum
inan
cerang
e=cd
mÿ2
0 0.25 0.5 0.75 1s of Gaussian (multiples of period)
RF RF
RF
contrast matchestransmittance matchestarget
(c)
0 0.25 0.5 0.75 1s of Gaussian (multiples of period)
Image blur and translucent surfaces 547
Therefore, although our manipulation of blur does lead to a lowering in apparentcontrast, the magnitude of this decrease is not sufficient to explain the decrease inperceived transmittance observed in experiment 1. (Recall that the mean effect sizesin experiment 1 were 1.87, 2.3, and 3.41, for observers MS, BA, and RF, respectively.)Indeed, the proportion of decrease in perceived transmittance attributable to a low-ering in apparent contrast is 0.668 for observer MS, 0.482 for observer BA, and 0.298for observer RF. In matching perceived opacity, observers thus genuinely confuse thescattering component of a translucent surface with its absorptive (or contrast-reducing)component. This indicates that the visual system takes the presence of blur as an addi-tional cue (ie in addition to contrast reduction) when assigning opacity to translucentsurfacesöthe higher the blur, the lower is the perceived transmittance.
7 ConclusionsPerceptual transparency is a unique visual problem that requires the construction oftwo distinct surfaces (or material layers) along the same line of sightöan underlyingopaque surface, and a partially transmissive surface through which the opaque surfaceis seen. One aspect of the problem of transparency is studying how the visual system`discounts' the contributions of interposed partially transmissive surfaces or media, sothat the intrinsic properties of underlying surfaces may be recovered. According tothis approach, the problem of transparency is another instance of the more generalproblem of lightness constancy (Adelson 2000) or color constancy (D'Zmura et al2000). However, another equally important aspect of perceptual transparency is assign-ing surface properties to the transparent layer itself. When we encounter transparencyin the world, we are aware not only of the surface properties of underlying surfaces,but also of those of the interposed transparent layeröin particular, its transmittanceand its lightness. Furthermore, as the transparent layer becomes less transmissive, weare aware more of the transparent layer, rather than the underlying layer (comparethe display in figure 2c with that in figure 2a).
Most work on perceptual transparencyöincluding very recent work (see section 3)öhas supported the view that perceptual transparency is consistent with Metelli'sepiscotister model (but see Beck et al 1984). However, we have recently shown thatthe perception of surface transmittance and lightness deviates systematically from thepredictions of Metelli's equations. In particular, whereas Metelli's solution for a predictsthat perceived transmittance should be given by relative luminance differences inthe region of transparency, we demonstrated that it is determined instead by relativeMichelson contrast (Singh and Anderson 2002). The use of Michelson contrast leadsobservers to systematically overestimate the transmittance of darkening transparentlayers (that decrease the mean luminance in the image region containing transparency,relative to adjoining regions), and to systematically underestimate the transmittanceof lightening transparent layers (that increase mean luminance in the region of trans-parency).
In the current paper, we studied the contributions of another critical image variablein determining perceived opacity, namely the image blur that results from the light-scattering properties of translucent layers. Our results showed that Michelson contrast,by itself, is not sufficient to predict perceived transmittance for translucent layers:adding blur to the region of transparency (relative to adjoining regions) decreasesperceived transmittance, even if Michelson contrast is preserved (experiment 1). More-over, this result is not accounted for by the small decrease in apparent contrast thatresults from such blurring (experiment 2), nor by the decrease in the fundamentalamplitude or RMS contrast of the blurred square wave. Thus, the visual system treatsthe presence of blur as an additional image cue when assigning transmittance (ie inaddition to contrast reduction). In experiment 1, a Gaussian blur with s equal to the
548 M Singh, B L Anderson
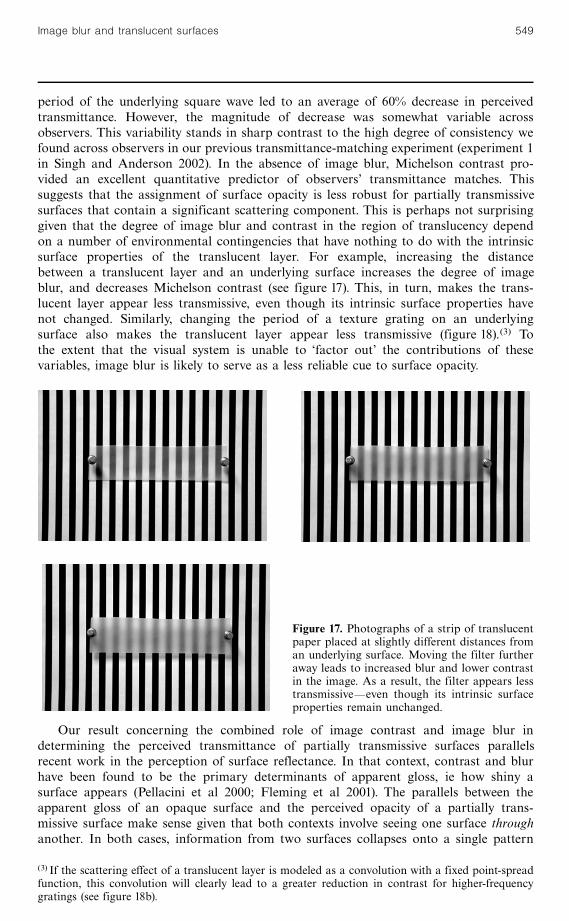
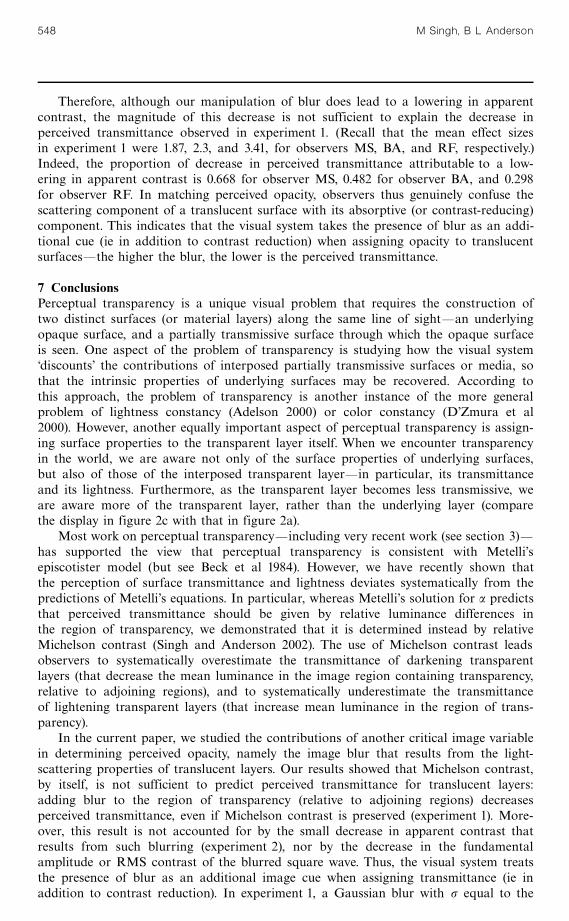
period of the underlying square wave led to an average of 60% decrease in perceivedtransmittance. However, the magnitude of decrease was somewhat variable acrossobservers. This variability stands in sharp contrast to the high degree of consistency wefound across observers in our previous transmittance-matching experiment (experiment 1in Singh and Anderson 2002). In the absence of image blur, Michelson contrast pro-vided an excellent quantitative predictor of observers' transmittance matches. Thissuggests that the assignment of surface opacity is less robust for partially transmissivesurfaces that contain a significant scattering component. This is perhaps not surprisinggiven that the degree of image blur and contrast in the region of translucency dependon a number of environmental contingencies that have nothing to do with the intrinsicsurface properties of the translucent layer. For example, increasing the distancebetween a translucent layer and an underlying surface increases the degree of imageblur, and decreases Michelson contrast (see figure 17). This, in turn, makes the trans-lucent layer appear less transmissive, even though its intrinsic surface properties havenot changed. Similarly, changing the period of a texture grating on an underlyingsurface also makes the translucent layer appear less transmissive (figure 18).(3) Tothe extent that the visual system is unable to `factor out' the contributions of thesevariables, image blur is likely to serve as a less reliable cue to surface opacity.
Our result concerning the combined role of image contrast and image blur indetermining the perceived transmittance of partially transmissive surfaces parallelsrecent work in the perception of surface reflectance. In that context, contrast and blurhave been found to be the primary determinants of apparent gloss, ie how shiny asurface appears (Pellacini et al 2000; Fleming et al 2001). The parallels between theapparent gloss of an opaque surface and the perceived opacity of a partially trans-missive surface make sense given that both contexts involve seeing one surface throughanother. In both cases, information from two surfaces collapses onto a single pattern
(3) If the scattering effect of a translucent layer is modeled as a convolution with a fixed point-spreadfunction, this convolution will clearly lead to a greater reduction in contrast for higher-frequencygratings (see figure 18b).
Figure 17. Photographs of a strip of translucentpaper placed at slightly different distances froman underlying surface. Moving the filter furtheraway leads to increased blur and lower contrastin the image. As a result, the filter appears lesstransmissiveöeven though its intrinsic surfaceproperties remain unchanged.
Image blur and translucent surfaces 549
of light intensities and, in both cases, the visual system must decompose this pattern ofintensities to extract two surfaces along each line of sight. (To further appreciate thisanalogy, note that seeing an object reflected in a perfectly glossy surfaceöeg a polishedmirroröis optically identical to seeing it through a perfectly transmissive surfaceöeg aclear glass pane.)
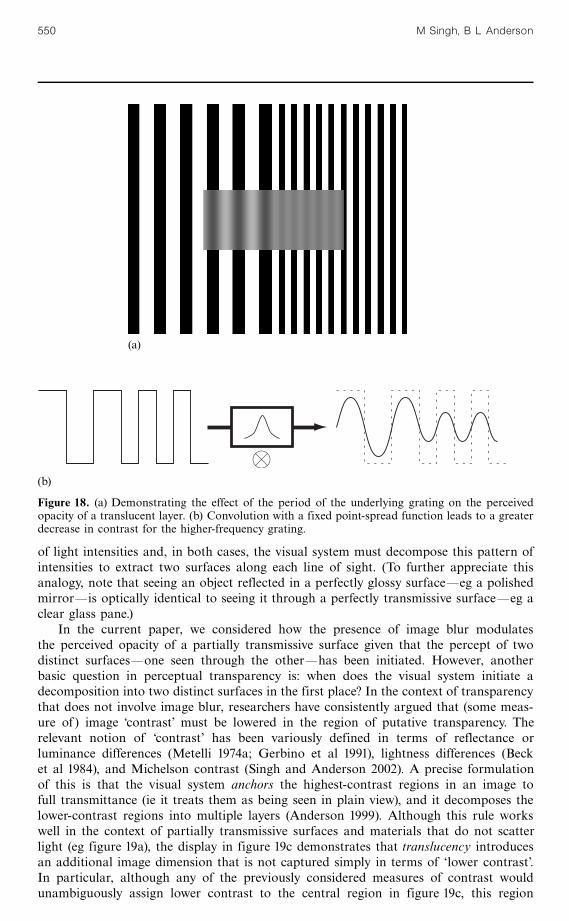
In the current paper, we considered how the presence of image blur modulatesthe perceived opacity of a partially transmissive surface given that the percept of twodistinct surfacesöone seen through the otheröhas been initiated. However, anotherbasic question in perceptual transparency is: when does the visual system initiate adecomposition into two distinct surfaces in the first place? In the context of transparencythat does not involve image blur, researchers have consistently argued that (some meas-ure of) image contrast' must be lowered in the region of putative transparency. Therelevant notion of contrast' has been variously defined in terms of reflectance orluminance differences (Metelli 1974a; Gerbino et al 1991), lightness differences (Becket al 1984), and Michelson contrast (Singh and Anderson 2002). A precise formulationof this is that the visual system anchors the highest-contrast regions in an image tofull transmittance (ie it treats them as being seen in plain view), and it decomposes thelower-contrast regions into multiple layers (Anderson 1999). Although this rule workswell in the context of partially transmissive surfaces and materials that do not scatterlight (eg figure 19a), the display in figure 19c demonstrates that translucency introducesan additional image dimension that is not captured simply in terms of `lower contrast'.In particular, although any of the previously considered measures of contrast wouldunambiguously assign lower contrast to the central region in figure 19c, this region
(a)
(b)
Figure 18. (a) Demonstrating the effect of the period of the underlying grating on the perceivedopacity of a translucent layer. (b) Convolution with a fixed point-spread function leads to a greaterdecrease in contrast for the higher-frequency grating.
550 M Singh, B L Anderson
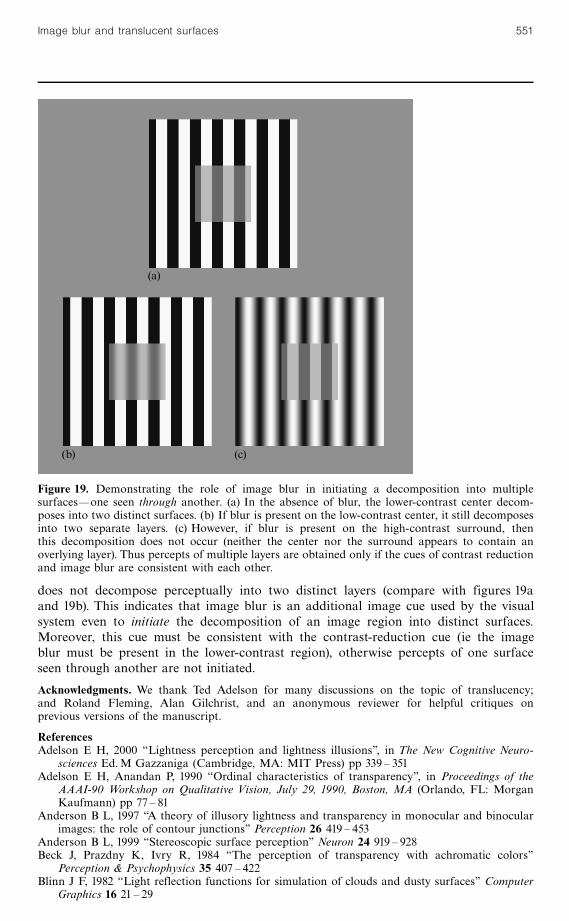
does not decompose perceptually into two distinct layers (compare with figures 19aand 19b). This indicates that image blur is an additional image cue used by the visualsystem even to initiate the decomposition of an image region into distinct surfaces.Moreover, this cue must be consistent with the contrast-reduction cue (ie the imageblur must be present in the lower-contrast region), otherwise percepts of one surfaceseen through another are not initiated.
Acknowledgments. We thank Ted Adelson for many discussions on the topic of translucency;and Roland Fleming, Alan Gilchrist, and an anonymous reviewer for helpful critiques onprevious versions of the manuscript.
ReferencesAdelson E H, 2000 ` Lightness perception and lightness illusions'', in The New Cognitive Neuro-
sciences Ed.M Gazzaniga (Cambridge, MA: MIT Press) pp 339 ^ 351Adelson E H, Anandan P, 1990 ``Ordinal characteristics of transparency'', in Proceedings of the
AAAI-90 Workshop on Qualitative Vision, July 29, 1990, Boston, MA (Orlando, FL: MorganKaufmann) pp 77 ^ 81
Anderson B L, 1997 `A theory of illusory lightness and transparency in monocular and binocularimages: the role of contour junctions'' Perception 26 419 ^ 453
Anderson B L, 1999 ` Stereoscopic surface perception'' Neuron 24 919 ^ 928Beck J, Prazdny K, Ivry R, 1984 ` The perception of transparency with achromatic colors''
Perception & Psychophysics 35 407 ^ 422Blinn J F, 1982 ` Light reflection functions for simulation of clouds and dusty surfaces'' Computer
Graphics 16 21 ^ 29
(a)
(b) (c)
Figure 19. Demonstrating the role of image blur in initiating a decomposition into multiplesurfacesöone seen through another. (a) In the absence of blur, the lower-contrast center decom-poses into two distinct surfaces. (b) If blur is present on the low-contrast center, it still decomposesinto two separate layers. (c) However, if blur is present on the high-contrast surround, thenthis decomposition does not occur (neither the center nor the surround appears to contain anoverlying layer). Thus percepts of multiple layers are obtained only if the cues of contrast reductionand image blur are consistent with each other.
Image blur and translucent surfaces 551
Campbell F W, Robson J G, 1968 `Application of Fourier analysis to the visibility of gratings''Journal of Physiology (London) 197 551 ^ 566
Chen V, D'Zmura M, 1998 ` Test of a convergence model for color transparency perception''Perception 27 595 ^ 608
Chubb C, Sperling G, Solomon J, 1989 ` Texture interactions determine perceived contrast''Proceedings of the National Academy of Sciences of the USA 86 9631 ^ 9635
D'Zmura M, Colantoni P, Knoblauch K, Laget B, 1997 ` Color transparency'' Perception 26471 ^ 492
D'Zmura M, Rinner O, Gegenfurtner K R, 2000 ` The colors seen behind transparent filters''Perception 29 911 ^ 926
Fleming R W, Dror R O, Adelson E H, 2001 ` Surface reflectance estimation under unknownnatural illumination'' Journal of Vision 1(3) 43a (abstract); http://journalofvision.org/1/3/43DOI 10.1167/1.3.43
Georgeson M A, 1991 ` Over the limit: Encoding contrast above threshold in human vision'',in Limits of Vision Eds J J Kulikowski, V Walsh, I J Murray, volume 5 in Vision and VisualDysfunction Ed. J Cronly-Dillon (London: Macmillan) pp 106 ^ 119
Georgeson M A, Shackleton T M, 1994 ``Perceived contrast of gratings and plaids: Non-linearsummation across oriented filters'' Vision Research 34 1061 ^ 1075
Gerbino W, 1994 `Achromatic transparency'', in Lightness, Brightness, and TransparencyEd. A L Gilchrist (Hove, Sussex: Lawrence Erlbaum Associates) pp 215 ^ 225
Gerbino W, Stultiens C, Troost J, de Weert C, 1990 ` Transparent layer constancy'' Journal ofExperimental Psychology: Human Perception and Performance 16 3 ^ 20
Ginsburg A P, Cannon M W, Nelson M A, 1980 ` Suprathreshold processing of complex visualstimuli: evidence for linearity in contrast perception'' Science 208 618 ^ 621
Hagedorn J, D'Zmura M, 2000 ``Color appearances of surfaces viewed through fog'' Perception29 1169 ^ 1184
Hanrahan P, Krueger W, 1993 ` Reflection from layered surfaces due to subsurface scattering'',in Proceedings of SIGGRAPH 1993: Computer Graphics (New York: ACM SIGGRAPH)pp 165 ^ 174
Kanizsa G, 1979 Organization in Vision (New York: Praeger)Kasrai R, Kingdom F A, 2001 ` Precision, accuracy, and range of perceived achromatic trans-
parency'' Journal of the Optical Society of America A 18 1 ^ 11Koffka K, 1935 Principles of Gestalt Psychology (London: Harcourt, Brace, and World)Kubelka P, 1954 ` New contributions to the optics of intensely light-scattering materials. Part II:
Non-homogeneous layers'' Journal of the Optical Society of America 44 330 ^ 335Kubelka P, Munk F, 1931 ` Ein Beitrag zur Optik der Farbanstriche'' [An article on the optics of
paint layers] Zeitschrift fu« r Technische Physik 12(112) translated into English by S H Westin,available at www.graphics.cornell.edu/�westin/
Metelli F, 1970 `An algebraic development of the theory of perceptual transparency'' Ergonomics13 59 ^ 66
Metelli F, 1974a ``The perception of transparency'' Scientific American 230(4) 90 ^ 98Metelli F, 1974b `Achromatic color conditions in the perception of transparency'', in Perception:
Essays in Honor of J.J.Gibson Eds R B MacLeod, H L Pick (Ithaca, NY: Cornell UniversityPress) pp 95 ^ 116
Metelli F, 1985 ` Stimulation and perception of transparency'' Psychological Research 47 185 ^ 202Metelli F, Da Pos O, Cavedon A, 1985 ` Balanced and unbalanced, complete and partial trans-
parency'' Perception & Psychophysics 38 354 ^ 366Moulden B, Kingdom F, Gatley L, 1990 ` The standard deviation of luminance as a metric for
contrast in random-dot images'' Perception 19 79 ^ 101Pellacini F, Ferwerda J A, Greenberg D P, 2000 ` Toward a psychophysically-based light reflec-
tion model for image synthesis'', in Proceedings of SIGGRAPH 2000: Computer GraphicsEd. K Akeley (New York: ACM SIGGRAPH) pp 55 ^ 64
Singh M, Anderson B L, 2002 ` Toward a perceptual theory of transparency'' Psychological Review(in press)
Singh M, Hoffman D, 1998 ` Part boundaries alter the perception of transparency'' PsychologicalScience 9 370 ^ 378
Tudor-Hart B, 1928 ` Studies in transparency, form, and colour'' Psychologische Forschung 10255 ^ 298
ß 2002 a Pion publication printed in Great Britain
552 M Singh, B L Anderson