rheology and setting of high volume fly ash mixtures
TRANSCRIPT
1
Rheology and Setting of High Volume Fly Ash Mixtures
Dale P. Bentz and Chiara F. Ferraris Building and Fire Research Laboratory
National Institute of Standards and Technology 100 Bureau Drive, Stop 8615
Gaithersburg, MD 20899 USA Phone: (301)975-5865 FAX: (301)990-6891
E-mail: [email protected], [email protected]
Abstract
While high volume fly ash (HVFA) concretes can be designed and produced to meet 28-d strength requirements and often even exceed the durability performance of conventional concretes, a persistent problem is the potentially long delay in setting time that produces concurrently long delays in finishing the concrete in the field. Previous isothermal calorimetry studies on two different powder additions, namely calcium hydroxide and a rapid set cement, have shown that these powders can mitigate excessive retardation of the hydration reactions. In this paper, rheological measurements and conventional Vicat setting time studies are conducted to verify that these powder additions do indeed reduce setting times in paste systems based on both ASTM Class C and ASTM Class F fly ashes. The reductions depend on the class of fly ash and suggest that trial mixtures would be a necessity to apply these technologies to each specific fly ash/cement/admixture combination being employed in the field. Potentially, for such screening studies, the rheological measurement of yield stress may provide a faster indication of setting (and finishability) than conventional Vicat needle penetration measurements on pastes. Keywords: Building technology; high volume fly ash; hydration; rheology; set time; sustainability. Introduction As sustainability moves to the forefront of the concerns of the construction industry and society as a whole, greater emphasis is being placed on producing concrete mixtures with increased volume fractions of supplementary cementitious materials, including slag and fly ash [1]. High volume fly ash (HVFA) mixtures are attractive from a sustainability viewpoint [2], as they typically replace 50 % or more of the portland cement (and the CO2 emissions accompanying its production) with a material that might otherwise end up being landfilled. These mixtures are being used more and more in practice, but a common remark from contractors is that HVFA mixtures can be susceptible to long delays in finishing and sometimes lack necessary early age strength development. The complexity of the cement/fly ash/admixture interactions that contribute to excessive retardation is recognized by laboratory and field personnel, with these interactions being further dependent of environmental conditions and inherent material variability [3,4].
2
In an ongoing research project [5] at the National Institute of Standards and Technology (NIST), this excessive retardation has been experienced in HVFA paste and mortar mixtures based on both Class C and Class F fly ashes, as designated per ASTM C618 [6]. Previously, McCarthy and Dhir [7] have demonstrated that entirely replacing the portland cement by a rapid hardening cement or a low energy clinker can produce 45 % Class F fly ash concretes with acceptable early age strength performance. Additionally, screening studies [8], based on isothermal calorimetry, have identified two potential powder additions that mitigate retardation in hydration when employed at only a 5 % to 10 % level: calcium hydroxide and a rapid set cement (RSC). The objective of the present study is to examine the rheology and setting behavior of pastes prepared with these two additives, to verify that they indeed reduce the setting time of the mixtures without impairing initial workability, as quantified by measurement of yield stress development. Materials and Experimental Procedures An ASTM C150 Type II/V cement [9] was employed; its detailed chemical composition and a variety of early-age performance properties have been published recently [8,10]. The cement contains the maximum allowed tricalcium aluminate content of 5 % by mass for a C150 Type V classification (potential Bogue composition) and is also sold as a Type I/II cement by its manufacturer. The Blaine fineness of the Type II/V cement is 387 m2/kg, as supplied by the manufacturer, and its specific gravity is 3250 kg/m3. A supply of a Class C fly ash (specific gravity of 2690 kg/m3) was obtained from a concrete ready-mix producer and a Class F fly ash (specific gravity of 2100 kg/m3) from a local fly ash producer. Detailed oxide compositions for the two fly ashes, as determined at a private testing laboratory, are provided in Table 1. Measured particle size distributions for all of the powder materials employed in this study were reported previously [8]. The D50 (median) particle diameters of the Class C and Class F fly ashes were measured to be 10.3 µm and 25.3 µm, respectively. A rapid set cement (calcium sulfoaluminate, dicalcium silicate, and gypsum) with the oxide composition provided in Table 1 was obtained from a commercial supplier. Calcium hydroxide and calcium sulfate dihydrate (gypsum, 98 % purity) were purchased from an international chemical company. The high range water-reducing agent (HRWRA) was of the polycarboxylate type (43 % solids, specific gravity of 1.08) and was obtained directly from a chemical admixture supplier.
All cement pastes were prepared with a water-to-cementitious materials or water-to-binder ratio by mass (w/cm) of 0.30, in a high shear blender following the procedure developed by the Portland Cement Association [11] and described in detail in [12]. For a given mixture, all powder materials were pre-blended for 30 minutes in a sealed plastic jar on a Turbula1 blender. The HRWRA was pre-mixed with the mixing water. Immediately following mixing, small specimens were obtained for isothermal calorimetry [13] and rheology [12] measurements and/or standard setting time (truncated cone) specimens [14] were prepared.
1 Certain commercial products are identified in this paper to specify the materials used and procedures employed. In no case does such identification imply endorsement or recommendation by the National Institute of Standards and Technology, nor does it indicate that the products are necessarily the best available for the purpose.
3
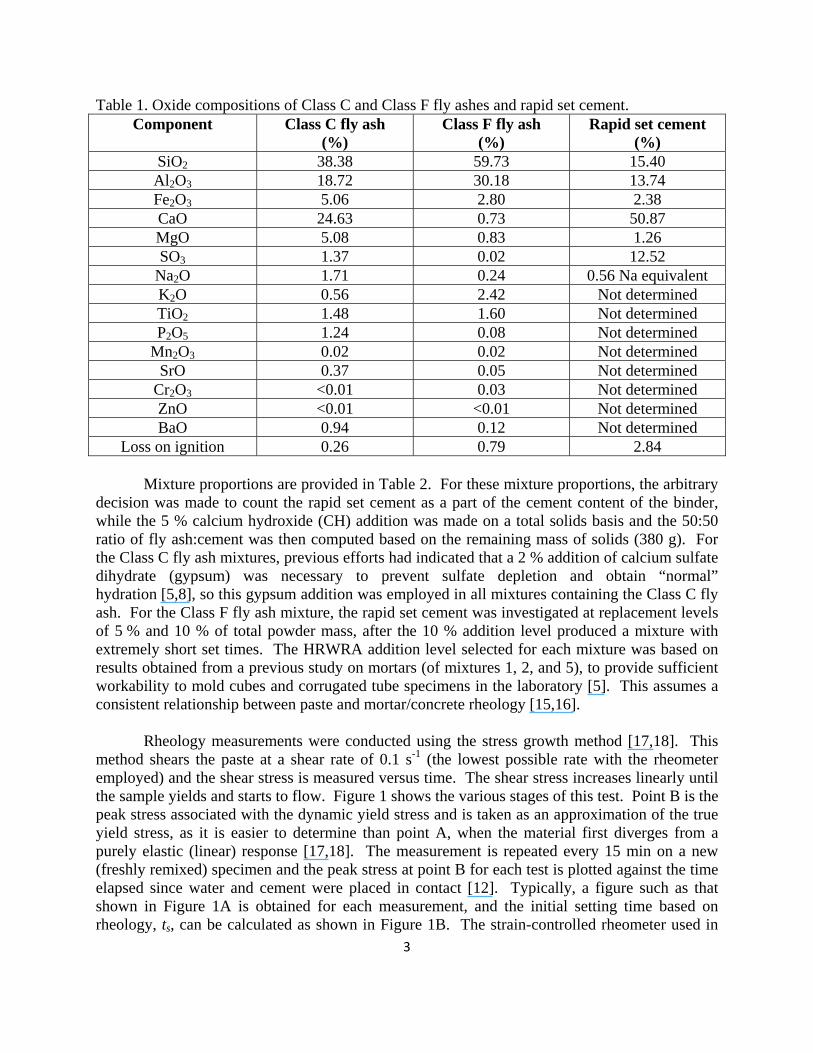
Table 1. Oxide compositions of Class C and Class F fly ashes and rapid set cement. Component Class C fly ash
(%) Class F fly ash
(%) Rapid set cement
(%) SiO2 38.38 59.73 15.40 Al2O3 18.72 30.18 13.74 Fe2O3 5.06 2.80 2.38 CaO 24.63 0.73 50.87 MgO 5.08 0.83 1.26 SO3 1.37 0.02 12.52
Na2O 1.71 0.24 0.56 Na equivalent K2O 0.56 2.42 Not determined TiO2 1.48 1.60 Not determined P2O5 1.24 0.08 Not determined
Mn2O3 0.02 0.02 Not determined SrO 0.37 0.05 Not determined
Cr2O3 <0.01 0.03 Not determined ZnO <0.01 <0.01 Not determined BaO 0.94 0.12 Not determined
Loss on ignition 0.26 0.79 2.84 Mixture proportions are provided in Table 2. For these mixture proportions, the arbitrary
decision was made to count the rapid set cement as a part of the cement content of the binder, while the 5 % calcium hydroxide (CH) addition was made on a total solids basis and the 50:50 ratio of fly ash:cement was then computed based on the remaining mass of solids (380 g). For the Class C fly ash mixtures, previous efforts had indicated that a 2 % addition of calcium sulfate dihydrate (gypsum) was necessary to prevent sulfate depletion and obtain “normal” hydration [5,8], so this gypsum addition was employed in all mixtures containing the Class C fly ash. For the Class F fly ash mixture, the rapid set cement was investigated at replacement levels of 5 % and 10 % of total powder mass, after the 10 % addition level produced a mixture with extremely short set times. The HRWRA addition level selected for each mixture was based on results obtained from a previous study on mortars (of mixtures 1, 2, and 5), to provide sufficient workability to mold cubes and corrugated tube specimens in the laboratory [5]. This assumes a consistent relationship between paste and mortar/concrete rheology [15,16].
Rheology measurements were conducted using the stress growth method [17,18]. This
method shears the paste at a shear rate of 0.1 s-1 (the lowest possible rate with the rheometer employed) and the shear stress is measured versus time. The shear stress increases linearly until the sample yields and starts to flow. Figure 1 shows the various stages of this test. Point B is the peak stress associated with the dynamic yield stress and is taken as an approximation of the true yield stress, as it is easier to determine than point A, when the material first diverges from a purely elastic (linear) response [17,18]. The measurement is repeated every 15 min on a new (freshly remixed) specimen and the peak stress at point B for each test is plotted against the time elapsed since water and cement were placed in contact [12]. Typically, a figure such as that shown in Figure 1A is obtained for each measurement, and the initial setting time based on rheology, ts, can be calculated as shown in Figure 1B. The strain-controlled rheometer used in
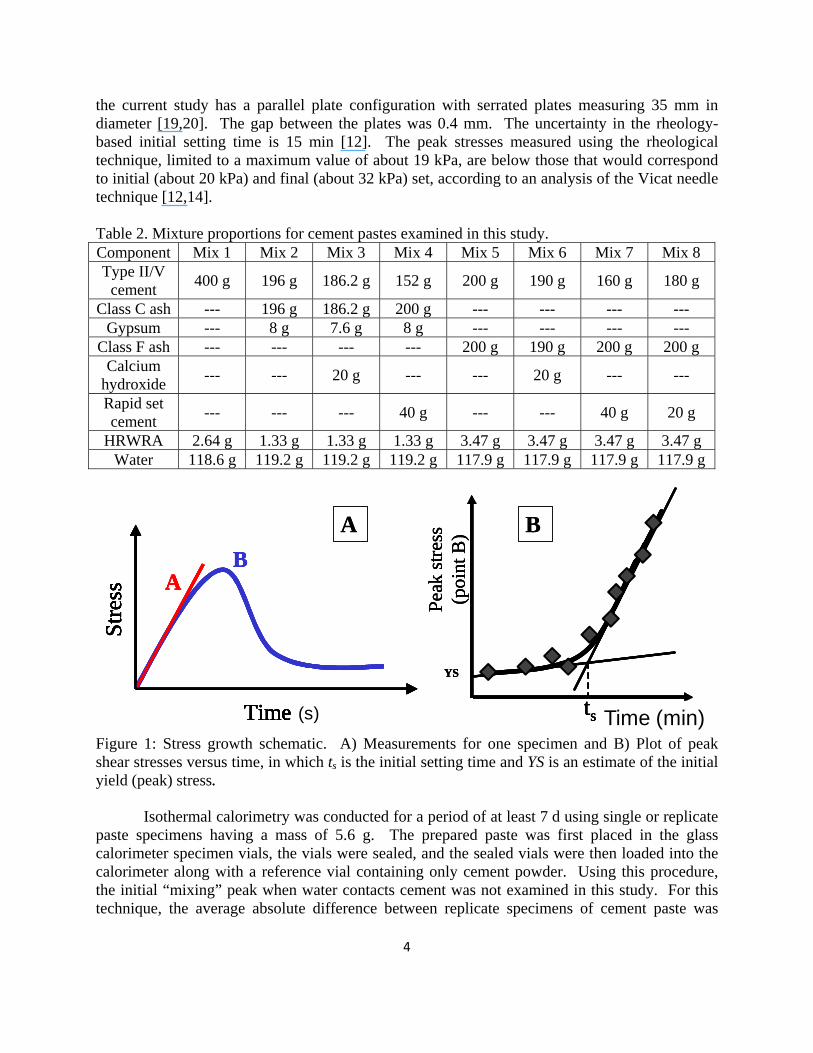
the current study has a parallel plate configuration with serrated plates measuring 35 mm in diameter [19,20]. The gap between the plates was 0.4 mm. The uncertainty in the rheology-based initial setting time is 15 min [12]. The peak stresses measured using the rheological technique, limited to a maximum value of about 19 kPa, are below those that would correspond to initial (about 20 kPa) and final (about 32 kPa) set, according to an analysis of the Vicat needle technique [12,14]. Table 2. Mixture proportions for cement pastes examined in this study. Component Mix 1 Mix 2 Mix 3 Mix 4 Mix 5 Mix 6 Mix 7 Mix 8 Type II/V
cement 400 g 196 g 186.2 g 152 g 200 g 190 g 160 g 180 g
Class C ash --- 196 g 186.2 g 200 g --- --- --- --- Gypsum --- 8 g 7.6 g 8 g --- --- --- ---
Class F ash --- --- --- --- 200 g 190 g 200 g 200 g Calcium
hydroxide --- --- 20 g --- --- 20 g --- ---
Rapid set cement --- --- --- 40 g --- --- 40 g 20 g
HRWRA 2.64 g 1.33 g 1.33 g 1.33 g 3.47 g 3.47 g 3.47 g 3.47 g Water 118.6 g 119.2 g 119.2 g 119.2 g 117.9 g 117.9 g 117.9 g 117.9 g
ts Time
Peak
stre
ss
(poi
nt B
)
YS
Time
Stre
ss
4
AB
Time
Stre
ss
Time
Stre
ss
BA
A B
ts Time
Peak
stre
ss
(poi
nt B
)
YS
ts Time ts Time
Peak
stre
ss
(poi
nt B
)
YS
Time
Stre
ss
BA
Time
Stre
ss
A B
(s)Time
Stre
ss
BA
Time (min) Figure 1: Stress growth schematic. A) Measurements for one specimen and B) Plot of peak shear stresses versus time, in which ts is the initial setting time and YS is an estimate of the initial yield (peak) stress. Isothermal calorimetry was conducted for a period of at least 7 d using single or replicate paste specimens having a mass of 5.6 g. The prepared paste was first placed in the glass calorimeter specimen vials, the vials were sealed, and the sealed vials were then loaded into the calorimeter along with a reference vial containing only cement powder. Using this procedure, the initial “mixing” peak when water contacts cement was not examined in this study. For this technique, the average absolute difference between replicate specimens of cement paste was
5
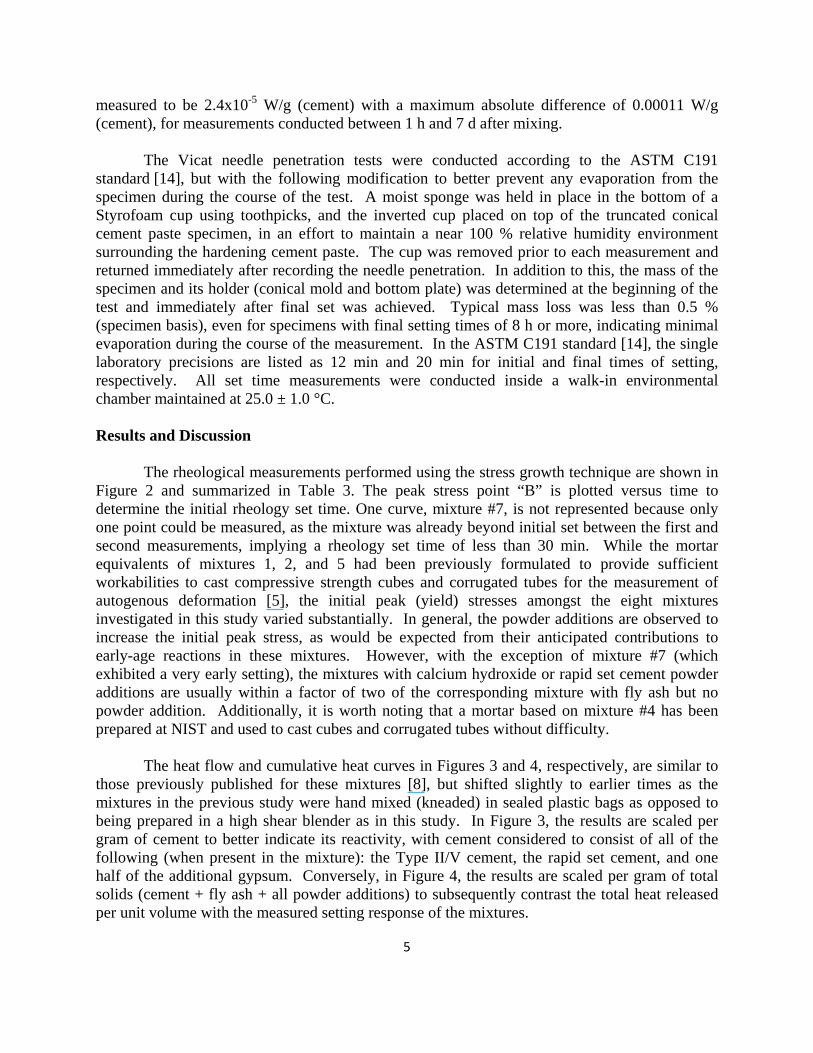
measured to be 2.4x10⁻⁵ W/g (cement) with a maximum absolute difference of 0.00011 W/g (cement), for measurements conducted between 1 h and 7 d after mixing. The Vicat needle penetration tests were conducted according to the ASTM C191 standard [14], but with the following modification to better prevent any evaporation from the specimen during the course of the test. A moist sponge was held in place in the bottom of a Styrofoam cup using toothpicks, and the inverted cup placed on top of the truncated conical cement paste specimen, in an effort to maintain a near 100 % relative humidity environment surrounding the hardening cement paste. The cup was removed prior to each measurement and returned immediately after recording the needle penetration. In addition to this, the mass of the specimen and its holder (conical mold and bottom plate) was determined at the beginning of the test and immediately after final set was achieved. Typical mass loss was less than 0.5 % (specimen basis), even for specimens with final setting times of 8 h or more, indicating minimal evaporation during the course of the measurement. In the ASTM C191 standard [14], the single laboratory precisions are listed as 12 min and 20 min for initial and final times of setting, respectively. All set time measurements were conducted inside a walk-in environmental chamber maintained at 25.0 ± 1.0 °C. Results and Discussion The rheological measurements performed using the stress growth technique are shown in Figure 2 and summarized in Table 3. The peak stress point “B” is plotted versus time to determine the initial rheology set time. One curve, mixture #7, is not represented because only one point could be measured, as the mixture was already beyond initial set between the first and second measurements, implying a rheology set time of less than 30 min. While the mortar equivalents of mixtures 1, 2, and 5 had been previously formulated to provide sufficient workabilities to cast compressive strength cubes and corrugated tubes for the measurement of autogenous deformation [5], the initial peak (yield) stresses amongst the eight mixtures investigated in this study varied substantially. In general, the powder additions are observed to increase the initial peak stress, as would be expected from their anticipated contributions to early-age reactions in these mixtures. However, with the exception of mixture #7 (which exhibited a very early setting), the mixtures with calcium hydroxide or rapid set cement powder additions are usually within a factor of two of the corresponding mixture with fly ash but no powder addition. Additionally, it is worth noting that a mortar based on mixture #4 has been prepared at NIST and used to cast cubes and corrugated tubes without difficulty.
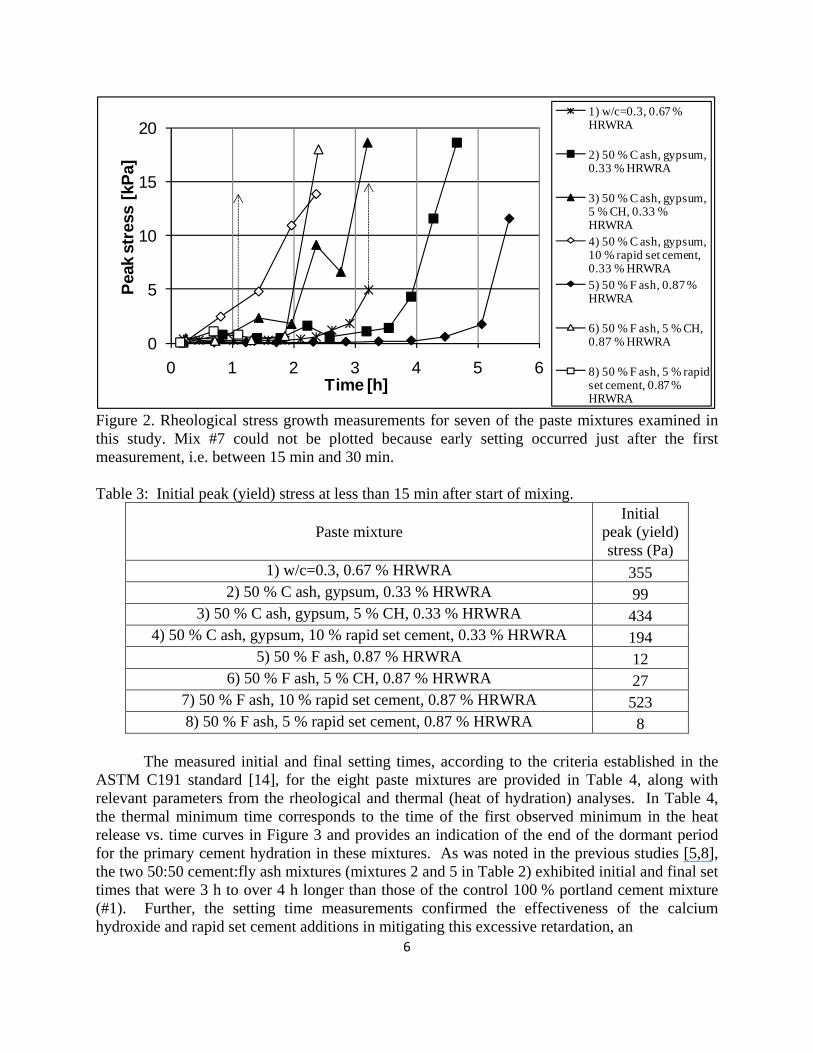
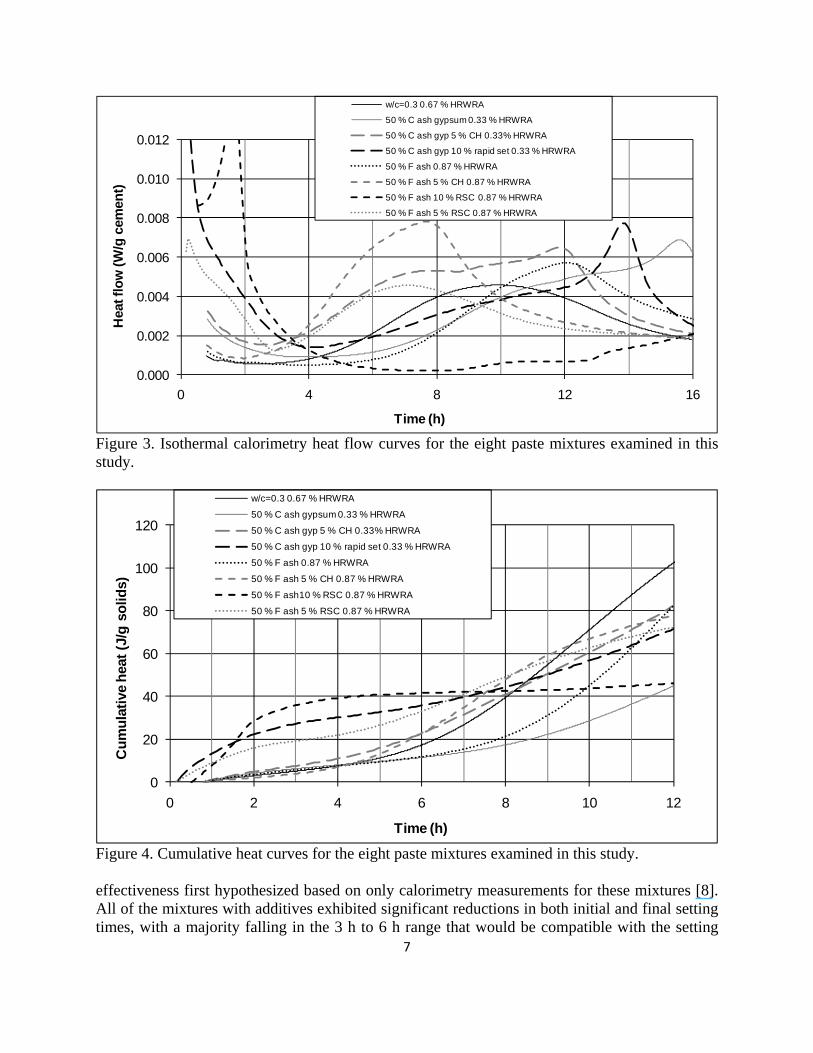
The heat flow and cumulative heat curves in Figures 3 and 4, respectively, are similar to those previously published for these mixtures [8], but shifted slightly to earlier times as the mixtures in the previous study were hand mixed (kneaded) in sealed plastic bags as opposed to being prepared in a high shear blender as in this study. In Figure 3, the results are scaled per gram of cement to better indicate its reactivity, with cement considered to consist of all of the following (when present in the mixture): the Type II/V cement, the rapid set cement, and one half of the additional gypsum. Conversely, in Figure 4, the results are scaled per gram of total solids (cement + fly ash + all powder additions) to subsequently contrast the total heat released per unit volume with the measured setting response of the mixtures.
0
5
10
15
20
0 1 2 3 4 5 6
Peak
str
ess
[kPa
]
Time [h]
1) w/c=0.3, 0.67 % HRWRA
2) 50 % C ash, gypsum, 0.33 % HRWRA
3) 50 % C ash, gypsum, 5 % CH, 0.33 % HRWRA4) 50 % C ash, gypsum, 10 % rapid set cement, 0.33 % HRWRA5) 50 % F ash, 0.87 % HRWRA
6) 50 % F ash, 5 % CH, 0.87 % HRWRA
8) 50 % F ash, 5 % rapid set cement, 0.87 % HRWRA
Figure 2. Rheological stress growth measurements for seven of the paste mixtures examined in this study. Mix #7 could not be plotted because early setting occurred just after the first measurement, i.e. between 15 min and 30 min. Table 3: Initial peak (yield) stress at less than 15 min after start of mixing.
Paste mixture Initial
peak (yield) stress (Pa)
1) w/c=0.3, 0.67 % HRWRA 355 2) 50 % C ash, gypsum, 0.33 % HRWRA 99
3) 50 % C ash, gypsum, 5 % CH, 0.33 % HRWRA 434 4) 50 % C ash, gypsum, 10 % rapid set cement, 0.33 % HRWRA 194
5) 50 % F ash, 0.87 % HRWRA 12 6) 50 % F ash, 5 % CH, 0.87 % HRWRA 27
7) 50 % F ash, 10 % rapid set cement, 0.87 % HRWRA 523 8) 50 % F ash, 5 % rapid set cement, 0.87 % HRWRA 8
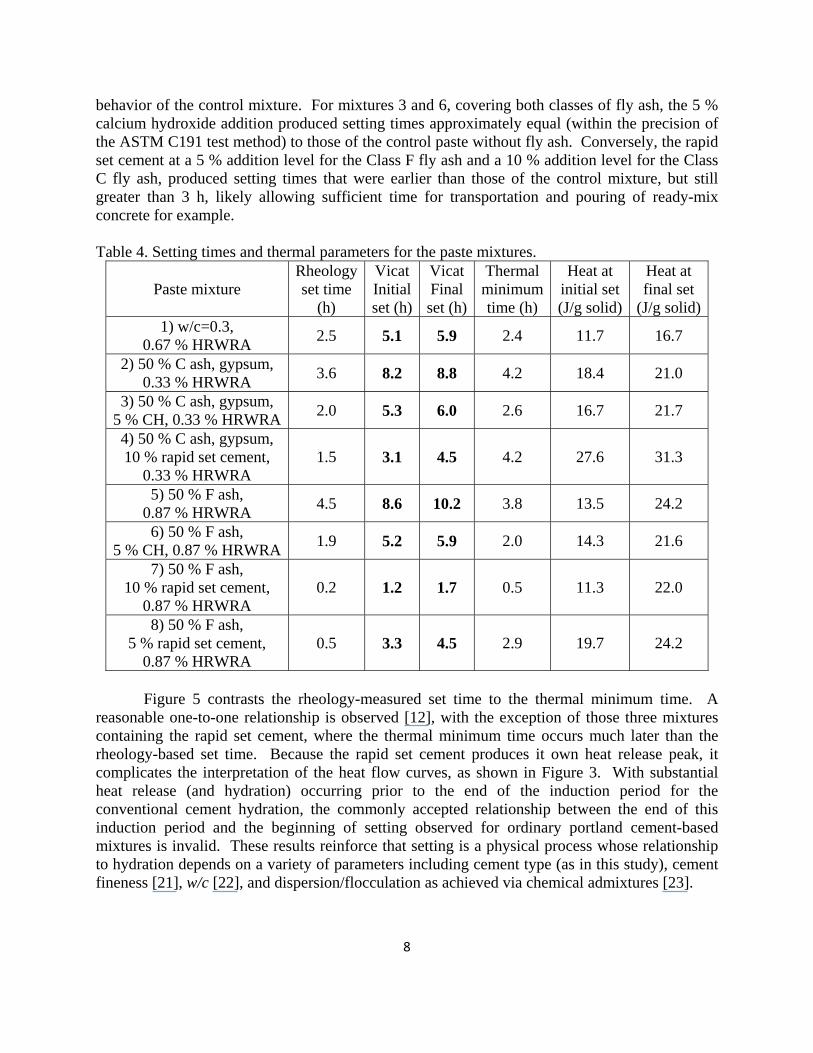
The measured initial and final setting times, according to the criteria established in the ASTM C191 standard [14], for the eight paste mixtures are provided in Table 4, along with relevant parameters from the rheological and thermal (heat of hydration) analyses. In Table 4, the thermal minimum time corresponds to the time of the first observed minimum in the heat release vs. time curves in Figure 3 and provides an indication of the end of the dormant period for the primary cement hydration in these mixtures. As was noted in the previous studies [5,8], the two 50:50 cement:fly ash mixtures (mixtures 2 and 5 in Table 2) exhibited initial and final set times that were 3 h to over 4 h longer than those of the control 100 % portland cement mixture (#1). Further, the setting time measurements confirmed the effectiveness of the calcium hydroxide and rapid set cement additions in mitigating this excessive retardation, an
6
0.000
0.002
0.004
0.006
0.008
0.010
0.012
0 4 8 12 16
Hea
t flo
w (W
/g c
emen
t)
Time (h)
w/c=0.3 0.67 % HRWRA
50 % C ash gypsum 0.33 % HRWRA
50 % C ash gyp 5 % CH 0.33% HRWRA
50 % C ash gyp 10 % rapid set 0.33 % HRWRA
50 % F ash 0.87 % HRWRA
50 % F ash 5 % CH 0.87 % HRWRA
50 % F ash 10 % RSC 0.87 % HRWRA
50 % F ash 5 % RSC 0.87 % HRWRA
Figure 3. Isothermal calorimetry heat flow curves for the eight paste mixtures examined in this study.
0
20
40
60
80
100
120
0 2 4 6 8 10 12
Cum
ulat
ive
heat
(J/g
sol
ids)
Time (h)
w/c=0.3 0.67 % HRWRA
50 % C ash gypsum 0.33 % HRWRA
50 % C ash gyp 5 % CH 0.33% HRWRA
50 % C ash gyp 10 % rapid set 0.33 % HRWRA
50 % F ash 0.87 % HRWRA
50 % F ash 5 % CH 0.87 % HRWRA
50 % F ash10 % RSC 0.87 % HRWRA
50 % F ash 5 % RSC 0.87 % HRWRA
Figure 4. Cumulative heat curves for the eight paste mixtures examined in this study. effectiveness first hypothesized based on only calorimetry measurements for these mixtures [8]. All of the mixtures with additives exhibited significant reductions in both initial and final setting times, with a majority falling in the 3 h to 6 h range that would be compatible with the setting
7
8
behavior of the control mixture. For mixtures 3 and 6, covering both classes of fly ash, the 5 % calcium hydroxide addition produced setting times approximately equal (within the precision of the ASTM C191 test method) to those of the control paste without fly ash. Conversely, the rapid set cement at a 5 % addition level for the Class F fly ash and a 10 % addition level for the Class C fly ash, produced setting times that were earlier than those of the control mixture, but still greater than 3 h, likely allowing sufficient time for transportation and pouring of ready-mix concrete for example. Table 4. Setting times and thermal parameters for the paste mixtures.
Paste mixture
Rheologyset time
(h)
Vicat Initial set (h)
Vicat Final set (h)
Thermal minimum time (h)
Heat at initial set (J/g solid)
Heat at final set
(J/g solid)1) w/c=0.3,
0.67 % HRWRA 2.5 5.1 5.9 2.4 11.7 16.7
2) 50 % C ash, gypsum, 0.33 % HRWRA 3.6 8.2 8.8 4.2 18.4 21.0
3) 50 % C ash, gypsum, 5 % CH, 0.33 % HRWRA 2.0 5.3 6.0 2.6 16.7 21.7
4) 50 % C ash, gypsum, 10 % rapid set cement,
0.33 % HRWRA 1.5 3.1 4.5 4.2 27.6 31.3
5) 50 % F ash, 0.87 % HRWRA 4.5 8.6 10.2 3.8 13.5 24.2
6) 50 % F ash, 5 % CH, 0.87 % HRWRA 1.9 5.2 5.9 2.0 14.3 21.6
7) 50 % F ash, 10 % rapid set cement,
0.87 % HRWRA 0.2 1.2 1.7 0.5 11.3 22.0
8) 50 % F ash, 5 % rapid set cement,
0.87 % HRWRA 0.5 3.3 4.5 2.9 19.7 24.2
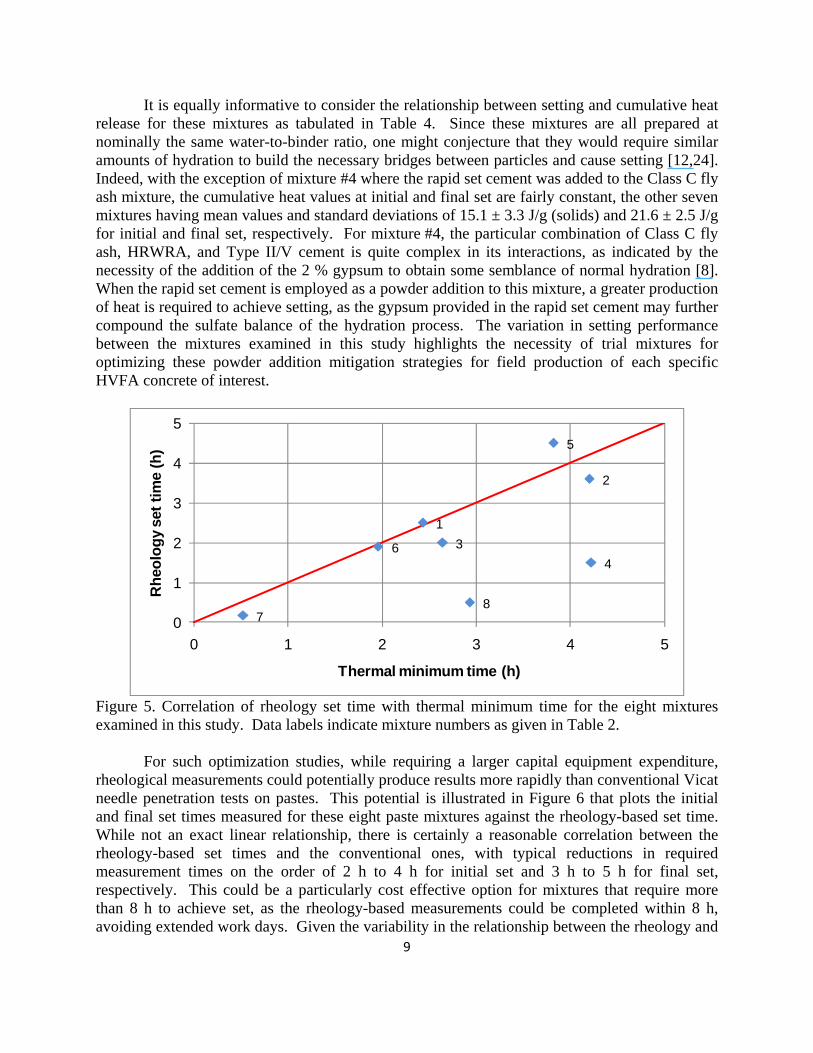
Figure 5 contrasts the rheology-measured set time to the thermal minimum time. A reasonable one-to-one relationship is observed [12], with the exception of those three mixtures containing the rapid set cement, where the thermal minimum time occurs much later than the rheology-based set time. Because the rapid set cement produces it own heat release peak, it complicates the interpretation of the heat flow curves, as shown in Figure 3. With substantial heat release (and hydration) occurring prior to the end of the induction period for the conventional cement hydration, the commonly accepted relationship between the end of this induction period and the beginning of setting observed for ordinary portland cement-based mixtures is invalid. These results reinforce that setting is a physical process whose relationship to hydration depends on a variety of parameters including cement type (as in this study), cement fineness [21], w/c [22], and dispersion/flocculation as achieved via chemical admixtures [23].
It is equally informative to consider the relationship between setting and cumulative heat release for these mixtures as tabulated in Table 4. Since these mixtures are all prepared at nominally the same water-to-binder ratio, one might conjecture that they would require similar amounts of hydration to build the necessary bridges between particles and cause setting [12,24]. Indeed, with the exception of mixture #4 where the rapid set cement was added to the Class C fly ash mixture, the cumulative heat values at initial and final set are fairly constant, the other seven mixtures having mean values and standard deviations of 15.1 ± 3.3 J/g (solids) and 21.6 ± 2.5 J/g for initial and final set, respectively. For mixture #4, the particular combination of Class C fly ash, HRWRA, and Type II/V cement is quite complex in its interactions, as indicated by the necessity of the addition of the 2 % gypsum to obtain some semblance of normal hydration [8]. When the rapid set cement is employed as a powder addition to this mixture, a greater production of heat is required to achieve setting, as the gypsum provided in the rapid set cement may further compound the sulfate balance of the hydration process. The variation in setting performance between the mixtures examined in this study highlights the necessity of trial mixtures for optimizing these powder addition mitigation strategies for field production of each specific HVFA concrete of interest.
1
2
34
5
6
78
0
1
2
3
4
5
0 1 2 3 4 5
Rhe
olog
y se
t tim
e (h
)
Thermal minimum time (h)
Figure 5. Correlation of rheology set time with thermal minimum time for the eight mixtures examined in this study. Data labels indicate mixture numbers as given in Table 2. For such optimization studies, while requiring a larger capital equipment expenditure, rheological measurements could potentially produce results more rapidly than conventional Vicat needle penetration tests on pastes. This potential is illustrated in Figure 6 that plots the initial and final set times measured for these eight paste mixtures against the rheology-based set time. While not an exact linear relationship, there is certainly a reasonable correlation between the rheology-based set times and the conventional ones, with typical reductions in required measurement times on the order of 2 h to 4 h for initial set and 3 h to 5 h for final set, respectively. This could be a particularly cost effective option for mixtures that require more than 8 h to achieve set, as the rheology-based measurements could be completed within 8 h, avoiding extended work days. Given the variability in the relationship between the rheology and
9
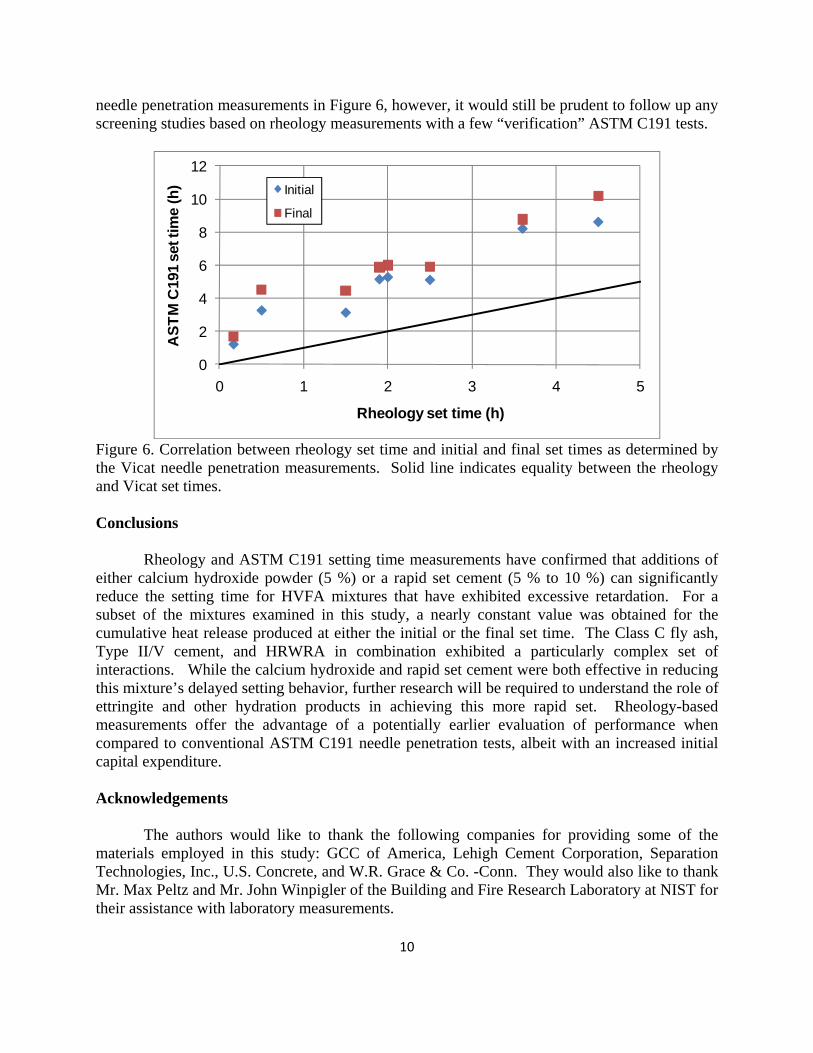
needle penetration measurements in Figure 6, however, it would still be prudent to follow up any screening studies based on rheology measurements with a few “verification” ASTM C191 tests.
0
2
4
6
8
10
12
0 1 2 3 4 5
AST
M C
191
set t
ime
(h)
Rheology set time (h)
Initial
Final
Figure 6. Correlation between rheology set time and initial and final set times as determined by the Vicat needle penetration measurements. Solid line indicates equality between the rheology and Vicat set times. Conclusions Rheology and ASTM C191 setting time measurements have confirmed that additions of either calcium hydroxide powder (5 %) or a rapid set cement (5 % to 10 %) can significantly reduce the setting time for HVFA mixtures that have exhibited excessive retardation. For a subset of the mixtures examined in this study, a nearly constant value was obtained for the cumulative heat release produced at either the initial or the final set time. The Class C fly ash, Type II/V cement, and HRWRA in combination exhibited a particularly complex set of interactions. While the calcium hydroxide and rapid set cement were both effective in reducing this mixture’s delayed setting behavior, further research will be required to understand the role of ettringite and other hydration products in achieving this more rapid set. Rheology-based measurements offer the advantage of a potentially earlier evaluation of performance when compared to conventional ASTM C191 needle penetration tests, albeit with an increased initial capital expenditure. Acknowledgements The authors would like to thank the following companies for providing some of the materials employed in this study: GCC of America, Lehigh Cement Corporation, Separation Technologies, Inc., U.S. Concrete, and W.R. Grace & Co. -Conn. They would also like to thank Mr. Max Peltz and Mr. John Winpigler of the Building and Fire Research Laboratory at NIST for their assistance with laboratory measurements.
10
11
References 1) Mehta PK. Global concrete industry sustainability. Concrete Int 2009;31(2):45-8. 2) Mehta PK. High-performance high-volume fly ash concrete for sustainable development. Proceedings of the International Workshop on Sustainable Development and Concrete Technology, Beijing, China: 2004. p. 3-14. 3) Wang H, Qi C, Farzam H, Turici J. Interaction of materials used in concrete. Concrete Int 2006;28(4):47-52. 4) Roberts LR, Taylor PC. Understanding cement-SCM-admixture interaction issues. Concrete Int 2007;29(1):33-41. 5) Bentz DP, Ferraris CF, Peltz MA, Winpigler J. Mixture Proportioning Options for Improving High Volume Fly Ash Concretes. Proceedings of the International Conference on Sustainable Concrete Pavements: Practices, Challenges, and Directions, Sacramento, CA. 2010. 6) ASTM C618-08a. Standard specification for coal fly ash and raw or calcined natural pozzolan for use in concrete: 2008. 7) McCarthy MJ, Dhir RK. Development of high volume fly ash cements for use in concrete construction. Fuel 2005;84:1423-32. 8) Bentz DP. Powder additions to mitigate retardation in high volume fly ash mixtures. ACI Mater J, (submitted) 2009. 9) ASTM C150-07. Standard specification for portland cement: 2007. 10) Bentz DP. Blending different fineness cements to engineer the properties of cement-based materials. accepted by Mag Concrete Res; 2010. 11) Helmuth RA, Hills LM, Whiting DA, Bhattacharja S. Abnormal concrete performance in the presence of admixtures. 1995 PCA serial # 2006. 12) Sant G, Ferraris CF, Weiss J. Rheological properties of cement pastes: A discussion of structure formation and mechanical property development. Cem Concrete Res 2008; 38(11):1286-96. 13) Bentz DP, Peltz MA. Reducing thermal and autogenous shrinkage contributions to early-age cracking. ACI Mater J 2008;105(4):414-20. 14) ASTM C191-08. Standard test methods for time of setting of hydraulic cement by Vicat needle: 2008. 15) Ferraris CF. Measurement of the rheological properties of cement paste: A new approach. Proceedings of the RILEM International Symposium on “The Role of Admixtures in High Performance Concrete,” edited by J.G. Cabrera and R. Rivera-Villarreal, RILEM, France, 2000. 16) Ferraris CF, Obla KH, Hill R. The influence of mineral admixtures on the rheology of cement paste and concrete. Cem Concrete Res 2001;31(2):245-55. 17) Nguyen QD, Boger DV. Measuring the flow properties of yield stress fluids. Ann Rev Fluid Mech 1992; 24:47-88. 18) Taylor PC, Johansen VC, Graf LA, Kozikowski RL, Zemajtis JZ, Ferraris CF. “Identifying Incompatible Combinations of Concrete Materials; Volume I & II,” FHWA report # FHWA-HRT-06-080, 2006 (http://www.fhwa.dot.gov/pavement/concrete/pubs/06079/ and http://www.fhwa.dot.gov/pavement/concrete/pubs/06080/index.cfm). 19) Amziane S, Ferraris CF. Cementitious paste setting using rheological and pressure measurements. ACI Mater J 2007;104(2):137-45.
12
20) Ferraris CF, Geiker M, Martys NS, Muzzatti N. Parallel-plate rheometer calibration using oil and lattice Boltzmann simulation. J. Adv Concrete Tech 2007;5(3);363-71. 21) Bentz DP, Sant G, Weiss WJ. Early-age properties of cement-based materials: I. Influence of cement fineness. ASCE J Mater Civ Eng 2008;20(7):502-8. 22) Bentz DP, Peltz MA, Winpigler J. Early-age properties of cement-based materials: II. Influence of water-to-cement ratio. ASCE J Mater Civ Eng 2009;21(9):512-7. 23) Sant G, Dehardai M, Bentz D, Lura P, Ferraris CF, Bullard JW, Weiss J. Detecting the fluid-to-solid transition in cement pastes: Comparing experimental and numerical techniques. Concrete Int 2009;31(6):53-58. 24) Bentz DP, Cement hydration: Building bridges and dams at the microstructural level. Mater Struct 2007;40(4):397-404.