geopolymer concrete from fly-ash with recycled aggregates
TRANSCRIPT
School of Engineering & Information Technology Environmental Engineering
Bachelor of Environmental Engineering (Honours)
Pioneering a New Approach to Sustainable Concrete in Western Australia:
Geopolymer Concrete from Fly-Ash with Recycled Aggregates
Hendrik Gildenhuys
6/12/2020
Project Supervisors:
Dr. Martin Anda
David Beyer
Francis Burke

1
Declaration I declare that this thesis has been composed solely by myself and that it has not been submitted for
any other previous application for a degree; except where stated otherwise by reference or
acknowledgement.
Hendrik Gildenhuys
5/12/2020

2
Acknowledgement I would like to thank Dr. Martin Anda for his continual guidance, support and contribution to this
project as my academic supervisor. The constant encouragement to reach outside of my comfort
zone has been really valuable in developing the tools required to becoming an engineer.
I would also like to thank both of my industry supervisors, David Beyer and Francis Burke for their
personal mentoring and contribution to this project. The knowledge and professional skills you have
shared with me is something I am very grateful for.
Lastly, thank you to members from industry that have been very welcoming and helpful by providing
valuable knowledge that has contributed to this project.
3
Abstract This study investigates the suitability of a closed-loop approach to the management of useful waste
derived materials such as recycled aggregates from construction waste and fly-ash to manufacture
recycled aggregate geopolymer concrete.
This investigation was carried out in two parts. Part 1 considered the particle size distribution, water
absorption and particle densities for both recycled coarse and fine aggregates. These materials were
used to create recycled aggregate concrete specimens used for part 2 – compressive strength and
slump test for both conventional Portland cement concrete and fly-ash based geopolymer concrete.
The results demonstrate that the higher water absorption values obtained for the recycled
aggregates can be attributed to the decreases in particle size fraction and particle density. Overall,
the use of recycled aggregates in geopolymer concrete had better workability than in conventional
concrete. The use of manufactured results in a very dry mix for both the conventional and
geopolymer concrete mixes. The use of recycled sand results in a mix that had better workability
than a mix with natural sand for types of concrete. The technical, sustainability and economic
implications of these findings are further discussed.
Overall, the manufacturing of recycled aggregate geopolymer concrete is a two-fold solution,
addressing both the problem of natural resource depletion and the large carbon footprint linked to
cement manufacturing. It was determined that integrating FGRAC into the Western Australian
concrete market requires specific focus on low value, fit-for-purpose pre-cast applications. For
higher value applications of concrete, pre-treatment of the source materials is suggested to improve
their attributes.
4
Table of Contents Declaration .............................................................................................................................................. 1
Acknowledgement .................................................................................................................................. 2
Abstract ................................................................................................................................................... 3
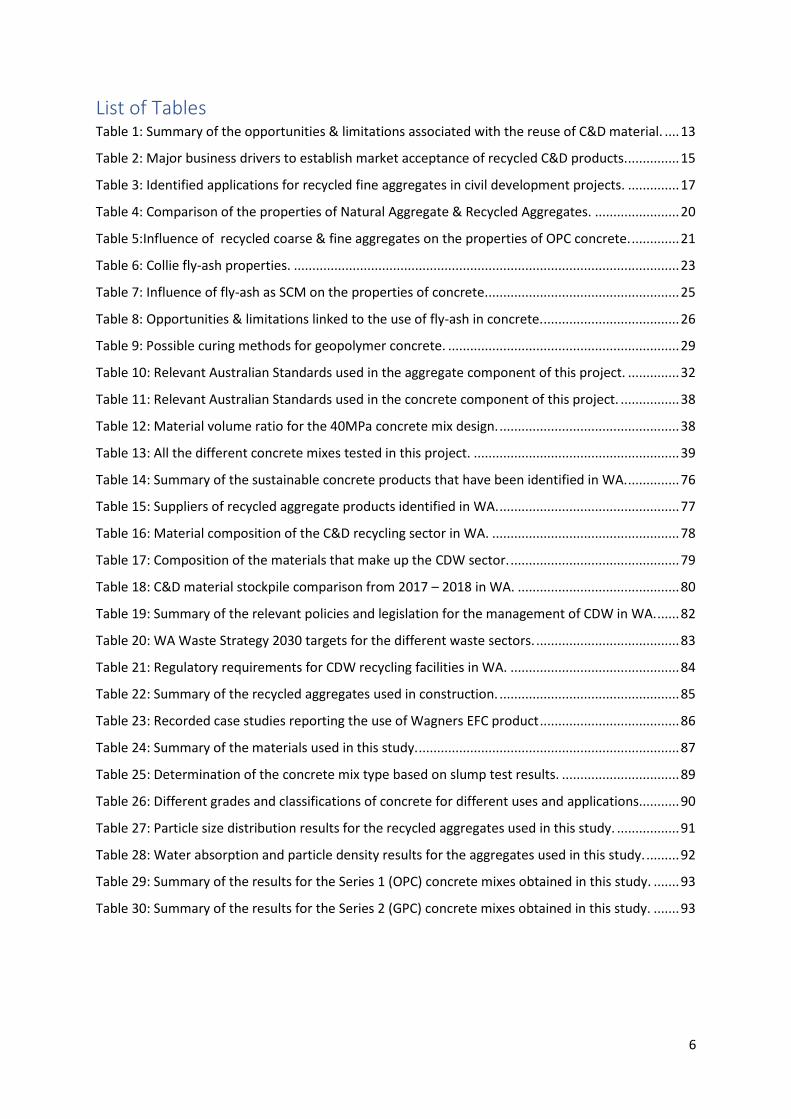
List of Tables ........................................................................................................................................... 6
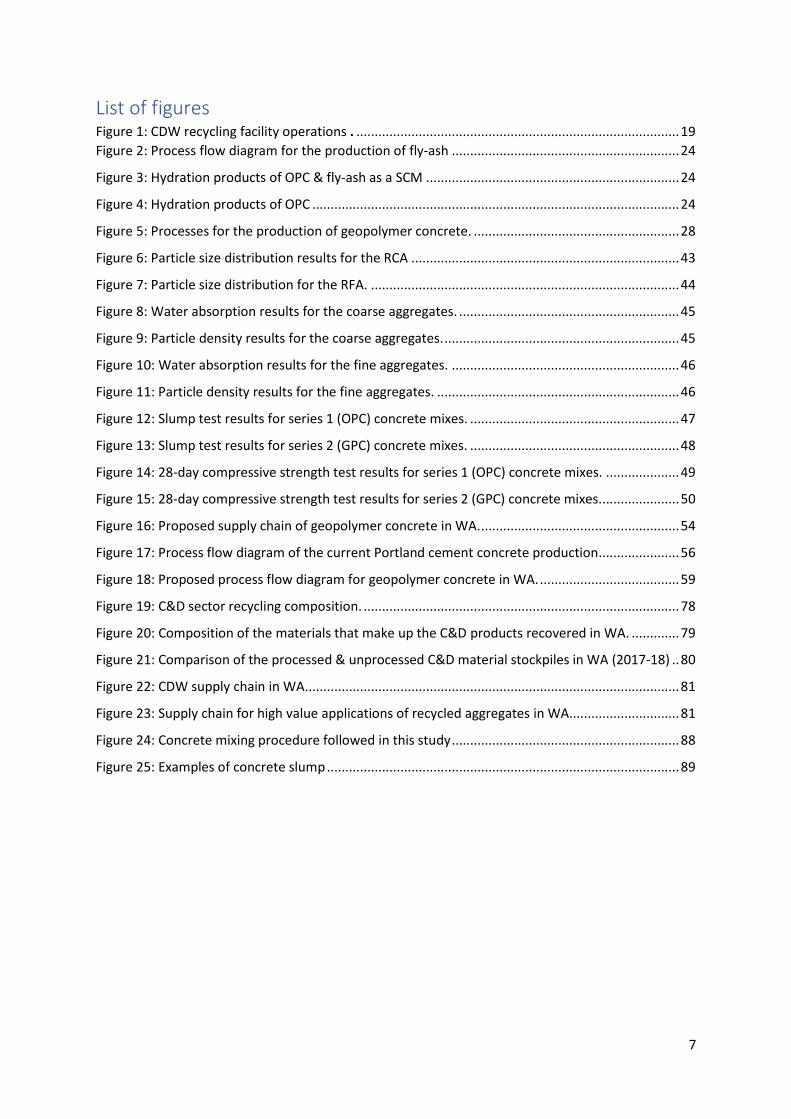
List of figures ........................................................................................................................................... 7
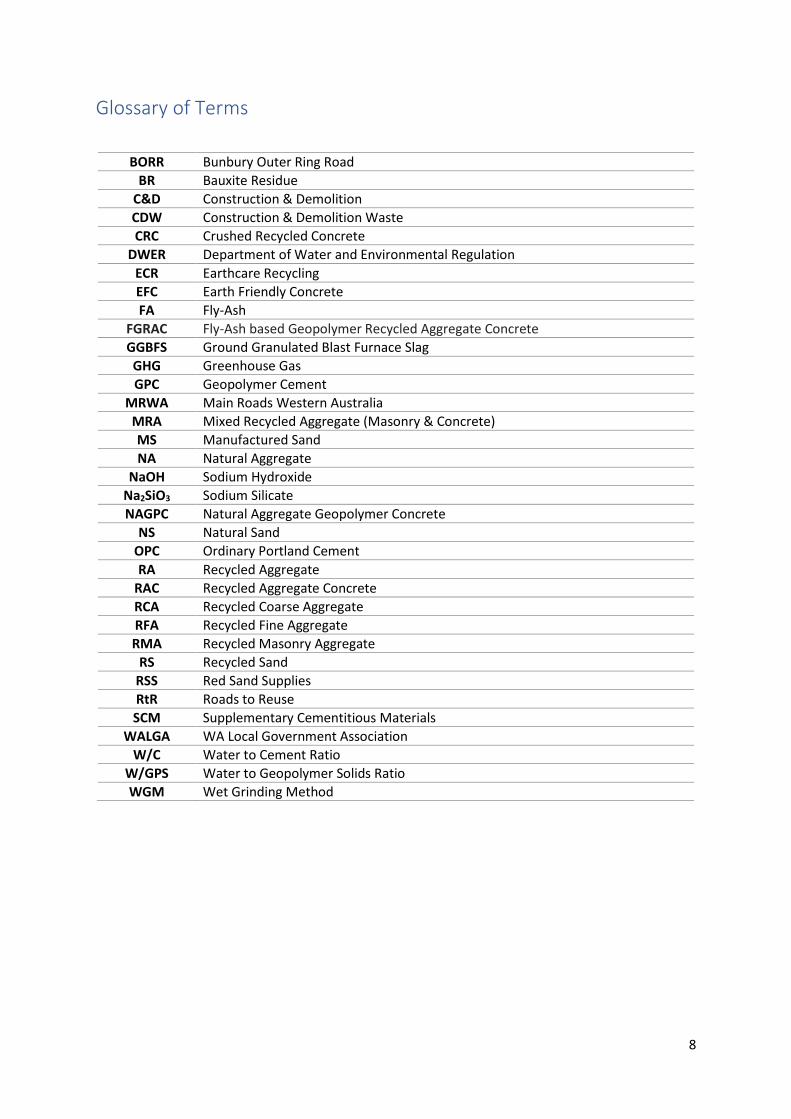
Glossary of Terms.................................................................................................................................... 8
1 Introduction .................................................................................................................................... 9
1.1 Background ............................................................................................................................. 9
1.2 Aims & Objectives ................................................................................................................. 10
1.3 Thesis Structure & Scope ...................................................................................................... 11
2 Literature Review .......................................................................................................................... 12
2.1 C&D Waste Management in Western Australia ................................................................... 12
2.1.1 Performance Data ......................................................................................................... 14
2.1.2 Supply Chain Analysis .................................................................................................... 15
2.1.3 Policy & Legislation ....................................................................................................... 16
2.2 Recycled Aggregates ............................................................................................................. 17
2.2.1 Recycled Fine Aggregates ............................................................................................. 17
2.2.2 Barriers & Opportunities for RA Reuse ......................................................................... 18
2.2.3 Production of RA ........................................................................................................... 19
2.2.4 Properties of RA ............................................................................................................ 20
2.2.5 Recycled Aggregate Concrete (RAC) ............................................................................. 21
2.3 Fly-Ash & Geopolymer Concrete........................................................................................... 22
2.3.1 Fly-Ash in WA ................................................................................................................ 22
2.3.2 Properties of FA ............................................................................................................ 23
2.3.3 Production of FA ........................................................................................................... 24
2.3.4 FA as SCM in Concrete .................................................................................................. 24
2.3.5 Geopolymer Concrete (GPC) ......................................................................................... 27
3 Methodology ................................................................................................................................. 31
3.1 Part 1 – Aggregates ............................................................................................................... 32
3.1.1 Assumptions & Considerations ..................................................................................... 32
3.1.2 Particle Size Distribution ............................................................................................... 33
3.1.3 Water Absorption & Particle Density ............................................................................ 34
3.2 Part 2 – Concrete .................................................................................................................. 38
3.2.1 Assumptions & Considerations ..................................................................................... 39
3.2.2 Preparation ................................................................................................................... 40
5
3.2.3 Mixing ............................................................................................................................ 40
3.2.4 Casting Concrete Specimens ......................................................................................... 41
3.2.5 Slump Test ..................................................................................................................... 42
4 Results & Analysis ......................................................................................................................... 43
4.1 Part 1 – Aggregates ............................................................................................................... 43
4.1.1 Particle Size Distribution ............................................................................................... 43
4.1.2 Water Absorption & Particle Density ............................................................................ 45
4.2 Part 2 – Concrete .................................................................................................................. 47
4.2.1 Slump Test ..................................................................................................................... 47
4.2.2 Compressive Strength ................................................................................................... 49
4.3 Summary of Findings ............................................................................................................. 51
5 Discussion ...................................................................................................................................... 52
5.1 Suitability of establishing a sustainable concrete industry in WA using RA and FA ............. 52
5.1.1 Technical Outcomes ...................................................................................................... 52
5.1.2 Sustainability Outcomes ............................................................................................... 52
5.1.3 Economic Outcomes ..................................................................................................... 53
5.2 Fly-Ash Geopolymer Recycled Aggregate Concrete (FGRAC) Products in WA ..................... 55
5.3 Limitations & Lessons Learnt ................................................................................................ 60
6 Conclusion & Recommendations .................................................................................................. 61
6.1 Project Aim & Objectives Addressed .................................................................................... 62
6.2 Recommendations & Future Work ....................................................................................... 64
6.2.1 Future Work .................................................................................................................. 64
6.3 Summary Statement ............................................................................................................. 64
References ............................................................................................................................................ 65
Appendices ............................................................................................................................................ 72
Appendix A – Literature Review........................................................................................................ 72
Appendix B – Methodology .............................................................................................................. 87
Appendix C – Results & Analysis ....................................................................................................... 91
6
List of Tables Table 1: Summary of the opportunities & limitations associated with the reuse of C&D material. .... 13
Table 2: Major business drivers to establish market acceptance of recycled C&D products. .............. 15
Table 3: Identified applications for recycled fine aggregates in civil development projects. .............. 17
Table 4: Comparison of the properties of Natural Aggregate & Recycled Aggregates. ....................... 20
Table 5:Influence of recycled coarse & fine aggregates on the properties of OPC concrete. ............. 21
Table 6: Collie fly-ash properties. ......................................................................................................... 23
Table 7: Influence of fly-ash as SCM on the properties of concrete. .................................................... 25
Table 8: Opportunities & limitations linked to the use of fly-ash in concrete. ..................................... 26
Table 9: Possible curing methods for geopolymer concrete. ............................................................... 29
Table 10: Relevant Australian Standards used in the aggregate component of this project. .............. 32
Table 11: Relevant Australian Standards used in the concrete component of this project. ................ 38
Table 12: Material volume ratio for the 40MPa concrete mix design. ................................................. 38
Table 13: All the different concrete mixes tested in this project. ........................................................ 39
Table 14: Summary of the sustainable concrete products that have been identified in WA. .............. 76
Table 15: Suppliers of recycled aggregate products identified in WA. ................................................. 77
Table 16: Material composition of the C&D recycling sector in WA. ................................................... 78
Table 17: Composition of the materials that make up the CDW sector. .............................................. 79
Table 18: C&D material stockpile comparison from 2017 – 2018 in WA. ............................................ 80
Table 19: Summary of the relevant policies and legislation for the management of CDW in WA. ...... 82
Table 20: WA Waste Strategy 2030 targets for the different waste sectors. ....................................... 83
Table 21: Regulatory requirements for CDW recycling facilities in WA. .............................................. 84
Table 22: Summary of the recycled aggregates used in construction. ................................................. 85
Table 23: Recorded case studies reporting the use of Wagners EFC product ...................................... 86
Table 24: Summary of the materials used in this study. ....................................................................... 87
Table 25: Determination of the concrete mix type based on slump test results. ................................ 89
Table 26: Different grades and classifications of concrete for different uses and applications. .......... 90
Table 27: Particle size distribution results for the recycled aggregates used in this study. ................. 91
Table 28: Water absorption and particle density results for the aggregates used in this study. ......... 92
Table 29: Summary of the results for the Series 1 (OPC) concrete mixes obtained in this study. ....... 93
Table 30: Summary of the results for the Series 2 (GPC) concrete mixes obtained in this study. ....... 93
7
List of figures Figure 1: CDW recycling facility operations . ........................................................................................ 19
Figure 2: Process flow diagram for the production of fly-ash .............................................................. 24
Figure 3: Hydration products of OPC & fly-ash as a SCM ..................................................................... 24
Figure 4: Hydration products of OPC .................................................................................................... 24
Figure 5: Processes for the production of geopolymer concrete. ........................................................ 28
Figure 6: Particle size distribution results for the RCA ......................................................................... 43
Figure 7: Particle size distribution for the RFA. .................................................................................... 44
Figure 8: Water absorption results for the coarse aggregates. ............................................................ 45
Figure 9: Particle density results for the coarse aggregates. ................................................................ 45
Figure 10: Water absorption results for the fine aggregates. .............................................................. 46
Figure 11: Particle density results for the fine aggregates. .................................................................. 46
Figure 12: Slump test results for series 1 (OPC) concrete mixes. ......................................................... 47
Figure 13: Slump test results for series 2 (GPC) concrete mixes. ......................................................... 48
Figure 14: 28-day compressive strength test results for series 1 (OPC) concrete mixes. .................... 49
Figure 15: 28-day compressive strength test results for series 2 (GPC) concrete mixes...................... 50
Figure 16: Proposed supply chain of geopolymer concrete in WA. ...................................................... 54
Figure 17: Process flow diagram of the current Portland cement concrete production ...................... 56
Figure 18: Proposed process flow diagram for geopolymer concrete in WA. ...................................... 59
Figure 19: C&D sector recycling composition. ...................................................................................... 78
Figure 20: Composition of the materials that make up the C&D products recovered in WA. ............. 79
Figure 21: Comparison of the processed & unprocessed C&D material stockpiles in WA (2017-18) .. 80
Figure 22: CDW supply chain in WA ...................................................................................................... 81
Figure 23: Supply chain for high value applications of recycled aggregates in WA .............................. 81
Figure 24: Concrete mixing procedure followed in this study .............................................................. 88
Figure 25: Examples of concrete slump ................................................................................................ 89
8
Glossary of Terms
BORR Bunbury Outer Ring Road
BR Bauxite Residue
C&D Construction & Demolition
CDW Construction & Demolition Waste
CRC Crushed Recycled Concrete
DWER Department of Water and Environmental Regulation
ECR Earthcare Recycling
EFC Earth Friendly Concrete
FA Fly-Ash
FGRAC Fly-Ash based Geopolymer Recycled Aggregate Concrete
GGBFS Ground Granulated Blast Furnace Slag
GHG Greenhouse Gas
GPC Geopolymer Cement
MRWA Main Roads Western Australia
MRA Mixed Recycled Aggregate (Masonry & Concrete)
MS Manufactured Sand
NA Natural Aggregate
NaOH Sodium Hydroxide
Na2SiO3 Sodium Silicate
NAGPC Natural Aggregate Geopolymer Concrete
NS Natural Sand
OPC Ordinary Portland Cement
RA Recycled Aggregate
RAC Recycled Aggregate Concrete
RCA Recycled Coarse Aggregate
RFA Recycled Fine Aggregate
RMA Recycled Masonry Aggregate
RS Recycled Sand
RSS Red Sand Supplies
RtR Roads to Reuse
SCM Supplementary Cementitious Materials
WALGA WA Local Government Association
W/C Water to Cement Ratio
W/GPS Water to Geopolymer Solids Ratio
WGM Wet Grinding Method

9
1 Introduction The purpose of this chapter is to introduce the construction and industrial waste products currently
underused in Western Australia and how there is a potential opportunity for their utilisation in the
manufacturing of sustainable concrete.
The significance of this project is that it looks into options to reduce the climate impact of concrete
production by incorporating a closed-loop approach to the management useful waste derived
materials such as recycled aggregates (RA) from construction and demolition waste (CDW) aswell as
fly-ash (FA) which is a by-product from the coal combustion process, which can be used to synthesis
geopolymer cement (GPC).
1.1 Background According to the latest national waste report, 1.5 million tonnes of construction and demolition
(C&D) waste is processed in WA each year, 88% of which is generated in the Perth metro area [1].
Most of this material is unable to find suitable end markets mainly due to perception issues of using
a ‘waste’ product. The WA Waste Strategy 2030 outlines a framework to guide WA’s transition to a
closed loop cycle and as a result strategy targets have been set which aim to encourage the
environmentally sensible behaviours of avoiding, reducing and recycling of waste. Currently WA has
a C&D recovery rate of 75% with the 2030 target being 80% [2].
Given that the annual concrete production in WA is around 6 million tonnes per year [3] and with
aggregates constituting up to 80% of a concrete mix by volume, there is a unique opportunity to add
value to this underutilised product which is currently being stockpiled – estimated to be around 1
million m3 in the Perth metro area [4].
A 2019 report by Beyond Zero Emissions which sought out to identify potential industries that can be
established in Collie to guide its transition from coal fired power stations to renewable energy
identified that a new concrete industry using the decade’s worth of existing FA deposits in addition
to the current production rate of 300,000 tonnes per year of FA [5], has the potential to generate
around 50 immediate new jobs [6].
It is estimated that the production of Portland cement contributes to around 1.35 billion tonnes (7%)
of the total annual global greenhouse gas (GHG) emissions [7]. It is also predicted that the annual
production of cement is increasing at a rate of 3% annually [8]. The high energy consumption linked
to the production of concrete can be greatly reduced by decreasing the amount of cement used.
One method of achieving this is through incorporating supplementary cementitious materials (SCM)
such as FA and other pozzolanic materials. Recent innovations in geopolymer technology have made
it possible to completely replace the cement component of a concrete mix and in turn reduce the
CO2 emissions by up-to 80% [9].
This circular economic approach has additional benefits such as reducing the waste sent to landfill,
reducing the stress on natural material assets and contributing to meeting the targets set in the
Waste Strategy 2030 [10].
10
1.2 Aims & Objectives The aim of this study is to add value to recycled construction material and industrial by-products
that currently have a poor established market in WA. This project seeks to determine the suitability
of manufacturing concrete with recycled aggregates and fly-ash as the source material. The research
will investigate how different recycled aggregate and sand influence the properties of conventional
concrete and fly-ash based geopolymer concrete.
The specific objectives for this project are:
1. Review the literature relating to the reuse of Recycled Aggregates (RA) and fly-ash (FA) in
concrete.
2. Investigate the current construction and demolition (C&D) waste (CDW) management practices
in WA.
3. Test the particle size distribution, water absorption and particle densities for the Recycled
Coarse Aggregates (RCA), Recycled Sand (RS) and Manufactured Sand (MS).
4. Develop Recycled Aggregate Concrete (RAC) specimens with a design compressive strength of
40MPa for both Ordinary Portland Cement (OPC) and Geopolymer Cement (GPC).
5. Collect and analyse the data on the workability and compressive strength of OPC and GPC RAC
specimens.
6. Evaluate the suitability of establishing a sustainable concrete industry in WA using RA and FA.
7. Make Recommendations for the optimisation and integration of a Fly-Ash based Geopolymer
Recycled Aggregate Concrete (FGRAC) product.
11
1.3 Thesis Structure & Scope Section 1 (Introduction) provides a general overview of the context and background of this study.
The aim of the project and the objectives required to satisfy this aim are also presented.
Section 2 (Literature Review) seeks to address objectives 1 and 2 of this study by demonstrating
knowledge on the following topics. Section 2.1 covers the CDW management practices in WA by
considering the most current performance data, the current market of C&D products and the policy
and legislation hindering and promoting market acceptance. Section 2.2 clearly differentiates
between the material that make up the broad range of recycled aggregates aswell as covering the
production processes, properties and how this influences the characteristics of concrete. Section 2.3
discusses the properties of collie fly-ash and methods for how integration as a source material for
the synthesis of geopolymer could be achieved. Geopolymer concrete properties and real work case
studies on its use is also explored.
Section 3 (Methodology) covers the methods used to achieve objectives 3, 4 and 5 by using the
procedure outlined in the relevant Australian Standards. Section 3.1 covers the particle size
distribution, water absorption and particle densities of the RA used. Section 3.2 covers the
compressive strength and slump test for OPC and GPC concretes with different arrangements of RA.
Section 4 (Results & Analysis) presents the results from each test for each material mentioned in
Section 3. Critical analysis on how and why these results were obtained is also presented.
Comparisons are drawn between the different arrangements of materials used in the different
mixes.
Section 5 (Discussion) sets out to address objectives 6 and 7 of this study. The suitability, integration
and optimisation of FGRAC and its source materials are critically discussed in detail. The limitations
and project summary are also discussed in Sections 5.3 and 5.4 respectively.
Section 6 (Conclusion & Recommendations) concludes this study by summarising how each of the
objectives to satisfy the aim of this project have been addressed in Section 6.1. Section 6.2 covers
the recommendations as a result of this study aswell as future work building on from what has been
achieved in this study, further providing data and case studies supporting the reuse of recycled
construction materials and industrial by-products in construction applications.
The Appendices include supporting material that is referred to throughout the different chapters of
this thesis.
12
2 Literature Review This literature review seeks to explore the suitability of RA in concrete production by providing
context for understanding the hurdles and opportunities to using recycled C&D material and FA in
the production of low-carbon concrete. The management of CDW in WA is examined in Section 2.1.
Followed by Section 2.2, which reviews the current uses and value of reusing RA & FA in concrete.
Section 2.3 explores the use of FA in concrete aswell as the geopolymerisation process and what
work has been done using FGRAC in Australia.
2.1 C&D Waste Management in Western Australia CDW refers to waste produced by demolition and building activities, including road and rail
construction and maintenance and excavation of land associated with construction activities [11].
The importance of CDW management lies in the need to minimise the amount of waste sent to
landfill, but to also mitigate against natural material resource depletion [12]. In addition to the
availability of nearby market outlets, there are also other local factors that have an influence on the
use of recycled C&D products. These include relative cost of landfill levy fees, cost of recycled
materials and the proximity of reprocessing facilities in comparison to natural material quarries [13].
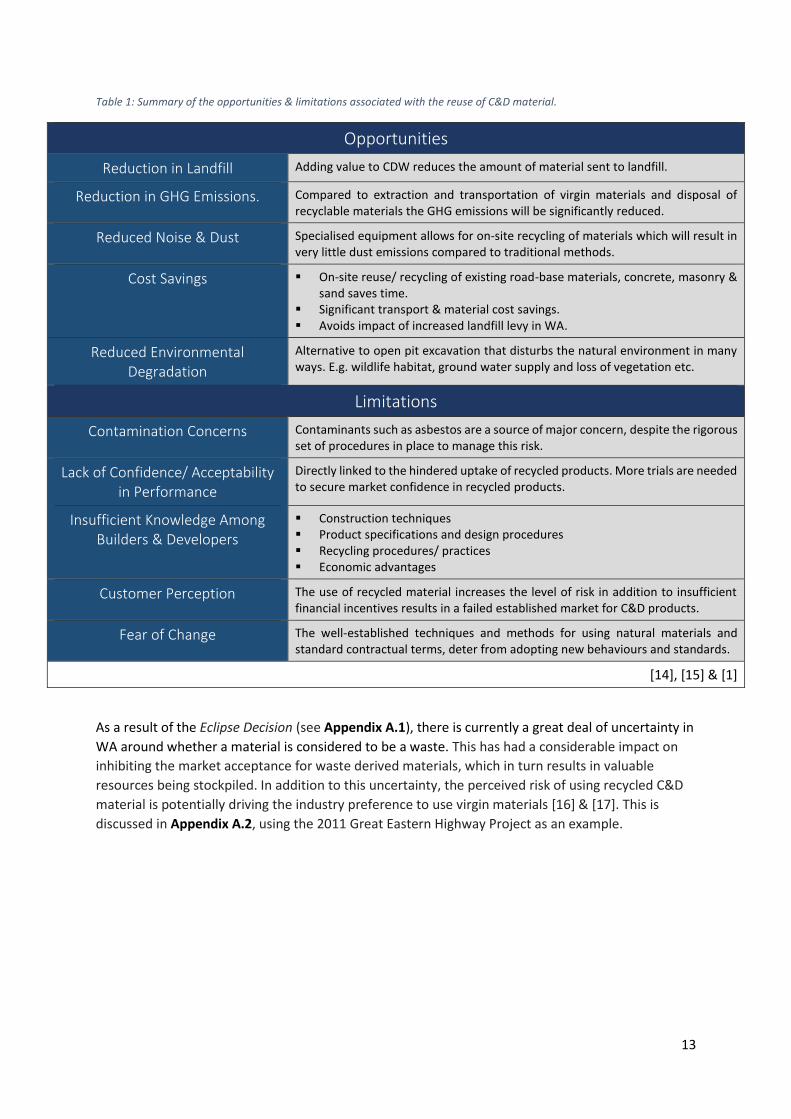
Table 1 summarises the benefits and limitations associated with the reuse of C&D material.
13
Table 1: Summary of the opportunities & limitations associated with the reuse of C&D material.
Opportunities
Reduction in Landfill Adding value to CDW reduces the amount of material sent to landfill.
Reduction in GHG Emissions. Compared to extraction and transportation of virgin materials and disposal of recyclable materials the GHG emissions will be significantly reduced.
Reduced Noise & Dust Specialised equipment allows for on-site recycling of materials which will result in very little dust emissions compared to traditional methods.
Cost Savings
▪ On-site reuse/ recycling of existing road-base materials, concrete, masonry & sand saves time.
▪ Significant transport & material cost savings. ▪ Avoids impact of increased landfill levy in WA.
Reduced Environmental Degradation
Alternative to open pit excavation that disturbs the natural environment in many ways. E.g. wildlife habitat, ground water supply and loss of vegetation etc.
Limitations
Contamination Concerns Contaminants such as asbestos are a source of major concern, despite the rigorous set of procedures in place to manage this risk.
Lack of Confidence/ Acceptability in Performance
Directly linked to the hindered uptake of recycled products. More trials are needed to secure market confidence in recycled products.
Insufficient Knowledge Among Builders & Developers
▪ Construction techniques ▪ Product specifications and design procedures ▪ Recycling procedures/ practices ▪ Economic advantages
Customer Perception The use of recycled material increases the level of risk in addition to insufficient financial incentives results in a failed established market for C&D products.
Fear of Change The well-established techniques and methods for using natural materials and standard contractual terms, deter from adopting new behaviours and standards.
[14], [15] & [1]
As a result of the Eclipse Decision (see Appendix A.1), there is currently a great deal of uncertainty in
WA around whether a material is considered to be a waste. This has had a considerable impact on
inhibiting the market acceptance for waste derived materials, which in turn results in valuable
resources being stockpiled. In addition to this uncertainty, the perceived risk of using recycled C&D
material is potentially driving the industry preference to use virgin materials [16] & [17]. This is
discussed in Appendix A.2, using the 2011 Great Eastern Highway Project as an example.
14
2.1.1 Performance Data There are some limitations to consider when referring to the WA CDW recovery and stockpiling data,
which has proven to be very problematic. Not only is the waste data expensive to collect, but also
the requirements, scope and mechanisms for collecting and reporting data on waste varies between
jurisdictions and industries [18]. The 2017-18 WA Waste Authority recycling activity report noted
that some of the reprocessors decided not to return the survey questionnaires due to its voluntary
nature. Therefore it is suggested that the actual recycling and stockpiling data is most likely to be
under reported. The survey also did not capture any reuse or waste avoidance initiatives used by the
organisations – it only includes data on the amount of material recycled or recovered [19].
Furthermore, it was outlined by the WA Local Government Association (WALGA) that different
sources are used for the collection of data on landfill, recovery, and recycling activity. These
different sources are often not in communication with each other, which further highlights the
degree of uncertainty associated with the actual recovery rates in WA [16].
2.1.1.1 Recycling Activity
According to the 2017-18 WA recycling activity report by the WA Waste Authority, the CDW stream
contributed to 1,136,000 tonnes (47%) of all the material processed in WA during this period [1].
The composition of the recovered waste material streams in the C&D sector for the 2017-18 period
are illustrated in Table 16 and Figure 19 in Appendix A.6. C&D materials refers to concrete (25%),
brick (3%), asphalt (2%), plasterboard (>1%), sand, clean fill & rubble (69%), which account for 85%
of the materials recycled [1]. The composition of each of these materials streams that were
recovered during the 2017 – 18 period are illustrated in Table 17 and Figure 20 in Appendix A.6.
88% of the total amount of CDW recycled in WA was sourced from the Perth metro region. The
remaining 12% was sourced from the rest of WA. It was also noted that all the material recycling was
undertaken in WA – No material was exported or processed in other states or territories [1].
2.1.1.2 Stockpiling Activity
In the same report by the WA Waste Authority, an increase of 16% in the total stockpiled C&D
material was recorded during the 2017-18 period. This increase translates to an addition of 72,800
tonnes of CDW to the existing 453,200 tonnes of CDW that was recorded at the start of the 2017
financial year [1]. The C&D material stockpiles for WA during the 2017-18 period is illustrated in
Table 18 and Figure 21 in Appendix A.6.
2.1.1.3 Landfill Activity
For the 2017-18 period, landfill activity for the Perth metro region was estimated using data
provided by Department of Water and Environmental Regulation (DWER), which was based on
aggregate waste levy data. The landfill activity for the rest of WA was estimated through
extrapolating the data collected from a voluntary survey using weighbridges [1]. According to the
2018 National Waste Report, the amount of CDW sent to landfill in the 2016-17 period in WA was
2,360,000 Tonnes. This represents a 40% decrease from the 2006-07 period, highlighting that more
waste is being recovered. This in turn adds value to these useful materials [20].
15
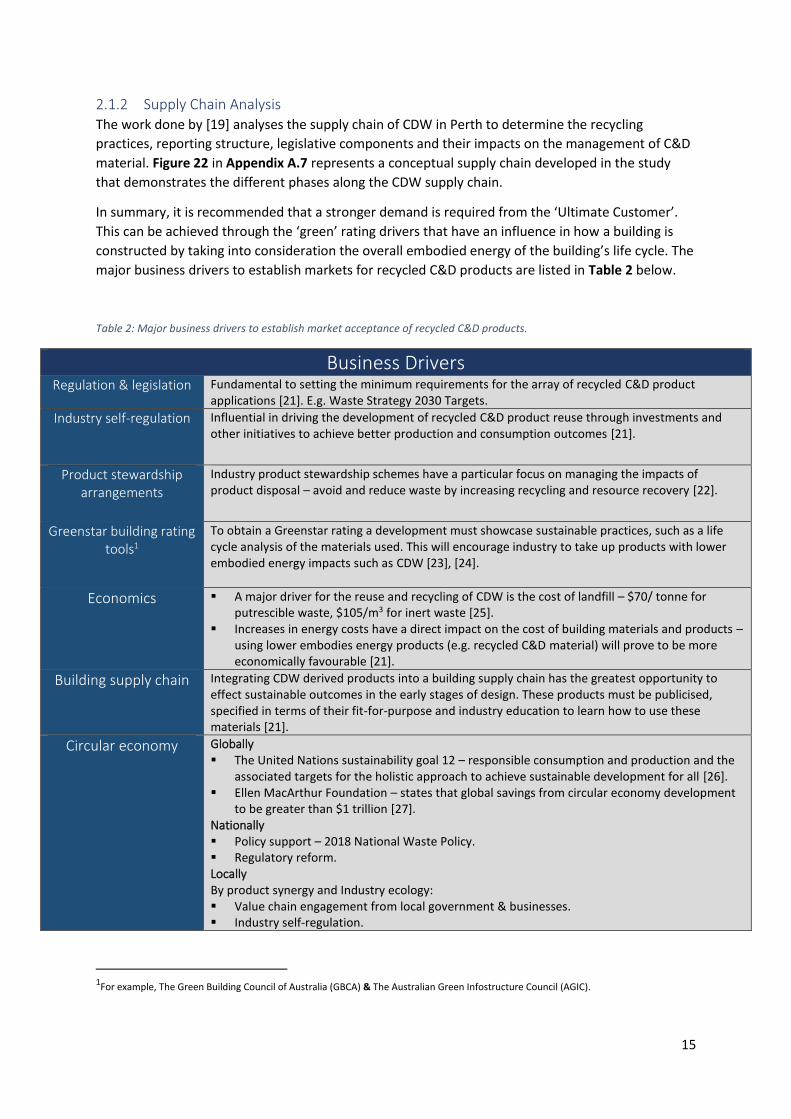
2.1.2 Supply Chain Analysis The work done by [19] analyses the supply chain of CDW in Perth to determine the recycling
practices, reporting structure, legislative components and their impacts on the management of C&D
material. Figure 22 in Appendix A.7 represents a conceptual supply chain developed in the study
that demonstrates the different phases along the CDW supply chain.
In summary, it is recommended that a stronger demand is required from the ‘Ultimate Customer’.
This can be achieved through the ‘green’ rating drivers that have an influence in how a building is
constructed by taking into consideration the overall embodied energy of the building’s life cycle. The
major business drivers to establish markets for recycled C&D products are listed in Table 2 below.
Table 2: Major business drivers to establish market acceptance of recycled C&D products.
Business Drivers
Regulation & legislation Fundamental to setting the minimum requirements for the array of recycled C&D product applications [21]. E.g. Waste Strategy 2030 Targets.
Industry self-regulation Influential in driving the development of recycled C&D product reuse through investments and other initiatives to achieve better production and consumption outcomes [21].
Product stewardship arrangements
Industry product stewardship schemes have a particular focus on managing the impacts of product disposal – avoid and reduce waste by increasing recycling and resource recovery [22].
Greenstar building rating tools1
To obtain a Greenstar rating a development must showcase sustainable practices, such as a life cycle analysis of the materials used. This will encourage industry to take up products with lower embodied energy impacts such as CDW [23], [24].
Economics ▪ A major driver for the reuse and recycling of CDW is the cost of landfill – $70/ tonne for putrescible waste, $105/m3 for inert waste [25].
▪ Increases in energy costs have a direct impact on the cost of building materials and products – using lower embodies energy products (e.g. recycled C&D material) will prove to be more economically favourable [21].
Building supply chain Integrating CDW derived products into a building supply chain has the greatest opportunity to effect sustainable outcomes in the early stages of design. These products must be publicised, specified in terms of their fit-for-purpose and industry education to learn how to use these materials [21].
Circular economy
Globally ▪ The United Nations sustainability goal 12 – responsible consumption and production and the
associated targets for the holistic approach to achieve sustainable development for all [26]. ▪ Ellen MacArthur Foundation – states that global savings from circular economy development
to be greater than $1 trillion [27]. Nationally ▪ Policy support – 2018 National Waste Policy. ▪ Regulatory reform. Locally By product synergy and Industry ecology: ▪ Value chain engagement from local government & businesses. ▪ Industry self-regulation.
1For example, The Green Building Council of Australia (GBCA) & The Australian Green Infostructure Council (AGIC).

16
2.1.3 Policy & Legislation The Waste Authority of WA and the WA Department of Water and Environment Regulation (DWER)
are the major governing bodies in WA that provide guidance, data, regulation and policy on the
reuse, recycling, and stockpiling of CDW [2]. Table 19 in Appendix A.8 summarises the various
policies and legislation relevant to the management of CDW. From the Waste Strategy 2030 targets
and recovery (landfill diversion) rates for each waste stream from 2015 – 2018 (Table 20 in
Appendix A.8) it is noted that the CDW diversion from landfill has increased significantly from the
2015-16 period and now is achieving the Waste Strategy 2030’s target of 75% by 2020 [1]. The
increased rate of C&D recycling reflects a reduction in reported waste disposal, rather than an
increase in the C&D sectors recycling activity. This is because the actual amount of waste recycled
from the C&D sector has decreased by 130,400 tonnes from the 2014-15 period, whereas the
amount of material sent to landfill has increased by 79% (372,300 tonnes) over the same period [1].

17
2.2 Recycled Aggregates Recycled Aggregates (RA) are the primary product produced from processing CDW, with a product
generation rate of 969,000 tonnes per year, accounting for around 85% of the CDW stream [1].
Overall a reduction in GHG emissions of up to 65% is possible due to the circular economic life cycle
that RA make use of across all its different applications. Furthermore, the use of RA reduces the
stress on natural material assets [28]. Table 22 in Appendix A.10 summarises the different types of
RCA used in construction in Australia. Work done by [4] has identified the available RA resources
that are available in WA. These include structural recycled sand suitable for clean fill and driveway
crossovers and different RA products. These include crushed recycled concrete (CRC), mixed recycled
aggregate (MRA) which is comprised of mixed masonry such as crushed bricks, pavers and tiles,
often used for roadbase. Also available is Recycled Masonry Aggregates (RMA) produced from
separated masonry products such as that sold by Red Sand Supplies (RSS). It is noted that the current
uses for this recovered C&D material is mostly limited to use in road construction, site works and
landscape applications [29].
2.2.1 Recycled Fine Aggregates Recycled Fine Aggregates (RFA) is one of the more complicated material streams in the CDW sector.
This is due to the confluence of two issues – the ambiguous nature of this material and its various
definitions aswell as the potential for significant contamination [30].
The RFA that will be used in the experimental section of this project falls into two categories.
▪ Recycled Sand refers to the natural material that is excavated from land development and
construction sites. This includes sand from excavated footings, soak wells as well as clean site
scrapes. This repurposed product is suitable for backfilling, siteworks, concrete slabs and for
back filling trenches [31].
▪ Manufactured Sand consists of purpose-made crushed fine aggregates, comprising of recycled
C&D material such as concrete, brick, limestone and general clean rubble [32].
Traditionally, RFA is used as fill material for a variety of building construction and civil development
projects. However, there is a huge market for its reuse in the following applications outlined in Table
3 below.
Table 3: Identified applications for recycled fine aggregates in civil development projects.
Recycled Fine Aggregate Reuse Applications
▪ Bedding & backfill o Pipe/ utility trenches o Retaining walls o Foundations o Embankments
▪ Landfill rejuvenation ▪ Drainage ▪ Paving ▪ Brick making ▪ Metal casting ▪ Landscaping ▪ Road construction
o Asphalt mixes o Road-base
[33] & [34].
18
RFA can serve as an economic and more sustainable alternative to Natural Sand (NS). However, the
key is to ensure the RFA is procured from a reliable source and that it has been adequately
processed and tested to meet the required quality specifications [35].
2.2.1.1 Optimising the Performance of RFA
An issue linked to RFA sourced from CDW is that quality varies based on source location [36], making
it difficult to produce a replicable and consistent product. The Wet Grinding Method (WGM)
explored in [19] can be used to improve the quality of RFA. The way the WGM works is that the RFA
are ground up by a rotor inside of a rotating vessel. The RFA are eventually ground up enough to
pass through a screen. From here the material moves to a high velocity centrifuge where impurities
such as mortar are removed aswell as reducing the angular shape of the particles. This secondary
treatment process allows for a RA product that would be suitable in high value market such as
concrete manufacturing. Figure 23 in Appendix A.7 illustrates the conceptual supply chain for
incorporating the WGM and how this can be incorporated to high value applications such as
concrete manufacturing.
2.2.2 Barriers & Opportunities for RA Reuse Current legislation and perceptions towards RA are not strong enough to support its widespread
market acceptance in the recycled product market. This is linked to its heterogenous nature which
sets a limit on its reproducibility. According to [37] & [36] the technical issues creating difficulty for
the reuse of RA in structural applications include:
▪ Cement remains
▪ Higher porosity
▪ Angular shape
▪ Variations in quality
▪ High levels of sulphate and chloride content
▪ Impurities
The major benefits to using RA in structural applications is costs and climate impact. Lower
transportation costs are often linked to RA since the recycling facilities are often located in urban
areas [38]. Considering that aggregates make up 65 – 80% of the total volume of a concrete mix,
GHG emissions can be reduced by up to 16 – 23% by replacing RA with NA [39]. The use of RA is a
two-fold solution as it offers a solution to reduce stress on natural material assets aswell as reduce
waste sent to landfill [40].
19
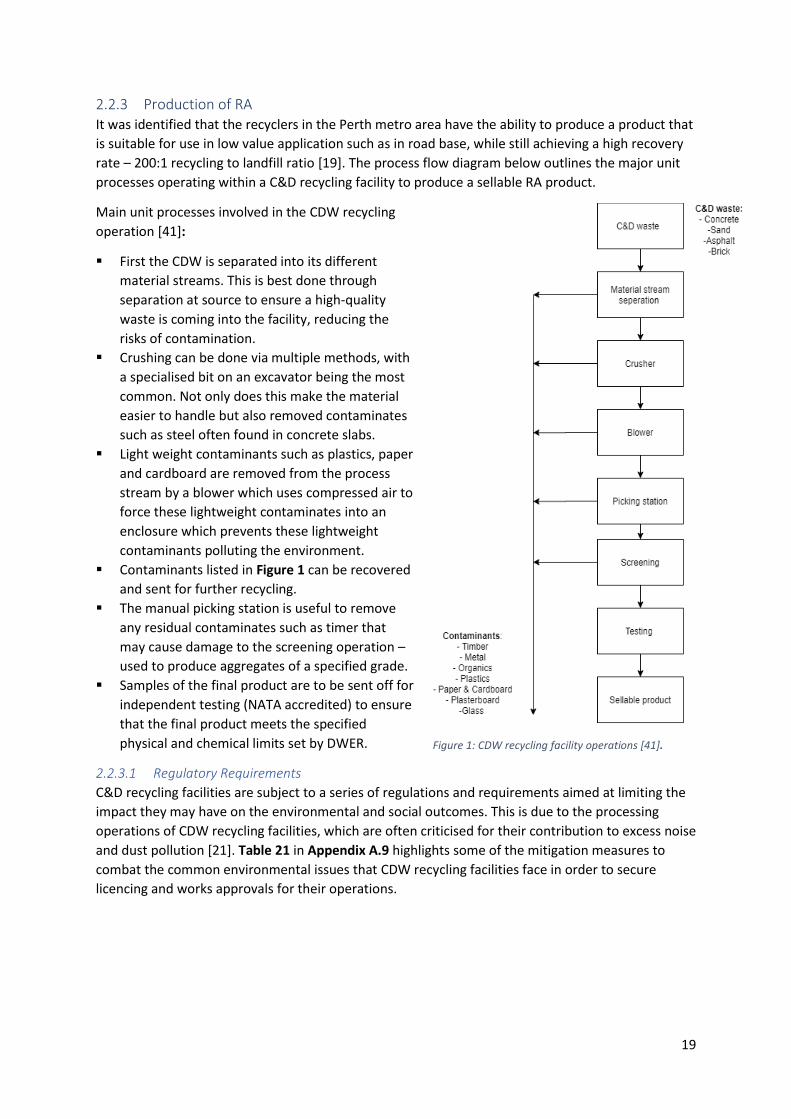
2.2.3 Production of RA It was identified that the recyclers in the Perth metro area have the ability to produce a product that
is suitable for use in low value application such as in road base, while still achieving a high recovery
rate – 200:1 recycling to landfill ratio [19]. The process flow diagram below outlines the major unit
processes operating within a C&D recycling facility to produce a sellable RA product.
Main unit processes involved in the CDW recycling
operation [41]:
▪ First the CDW is separated into its different
material streams. This is best done through
separation at source to ensure a high-quality
waste is coming into the facility, reducing the
risks of contamination.
▪ Crushing can be done via multiple methods, with
a specialised bit on an excavator being the most
common. Not only does this make the material
easier to handle but also removed contaminates
such as steel often found in concrete slabs.
▪ Light weight contaminants such as plastics, paper
and cardboard are removed from the process
stream by a blower which uses compressed air to
force these lightweight contaminates into an
enclosure which prevents these lightweight
contaminants polluting the environment.
▪ Contaminants listed in Figure 1 can be recovered
and sent for further recycling.
▪ The manual picking station is useful to remove
any residual contaminates such as timer that
may cause damage to the screening operation –
used to produce aggregates of a specified grade.
▪ Samples of the final product are to be sent off for
independent testing (NATA accredited) to ensure
that the final product meets the specified
physical and chemical limits set by DWER.
2.2.3.1 Regulatory Requirements
C&D recycling facilities are subject to a series of regulations and requirements aimed at limiting the
impact they may have on the environmental and social outcomes. This is due to the processing
operations of CDW recycling facilities, which are often criticised for their contribution to excess noise
and dust pollution [21]. Table 21 in Appendix A.9 highlights some of the mitigation measures to
combat the common environmental issues that CDW recycling facilities face in order to secure
licencing and works approvals for their operations.
Figure 1: CDW recycling facility operations [41].
20
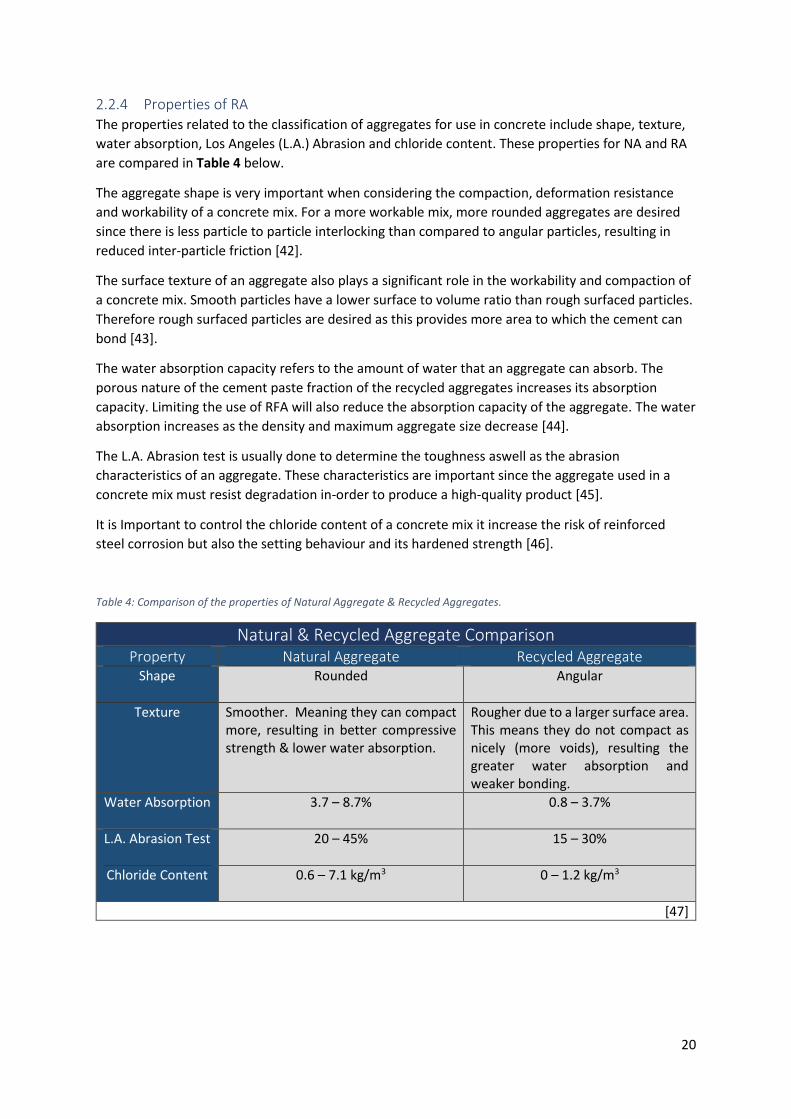
2.2.4 Properties of RA The properties related to the classification of aggregates for use in concrete include shape, texture,
water absorption, Los Angeles (L.A.) Abrasion and chloride content. These properties for NA and RA
are compared in Table 4 below.
The aggregate shape is very important when considering the compaction, deformation resistance
and workability of a concrete mix. For a more workable mix, more rounded aggregates are desired
since there is less particle to particle interlocking than compared to angular particles, resulting in
reduced inter-particle friction [42].
The surface texture of an aggregate also plays a significant role in the workability and compaction of
a concrete mix. Smooth particles have a lower surface to volume ratio than rough surfaced particles.
Therefore rough surfaced particles are desired as this provides more area to which the cement can
bond [43].
The water absorption capacity refers to the amount of water that an aggregate can absorb. The
porous nature of the cement paste fraction of the recycled aggregates increases its absorption
capacity. Limiting the use of RFA will also reduce the absorption capacity of the aggregate. The water
absorption increases as the density and maximum aggregate size decrease [44].
The L.A. Abrasion test is usually done to determine the toughness aswell as the abrasion
characteristics of an aggregate. These characteristics are important since the aggregate used in a
concrete mix must resist degradation in-order to produce a high-quality product [45].
It is Important to control the chloride content of a concrete mix it increase the risk of reinforced
steel corrosion but also the setting behaviour and its hardened strength [46].
Table 4: Comparison of the properties of Natural Aggregate & Recycled Aggregates.
Natural & Recycled Aggregate Comparison
Property Natural Aggregate Recycled Aggregate Shape
Rounded Angular
Texture Smoother. Meaning they can compact more, resulting in better compressive strength & lower water absorption.
Rougher due to a larger surface area. This means they do not compact as nicely (more voids), resulting the greater water absorption and weaker bonding.
Water Absorption
3.7 – 8.7% 0.8 – 3.7%
L.A. Abrasion Test
20 – 45% 15 – 30%
Chloride Content
0.6 – 7.1 kg/m3 0 – 1.2 kg/m3
[47]
21
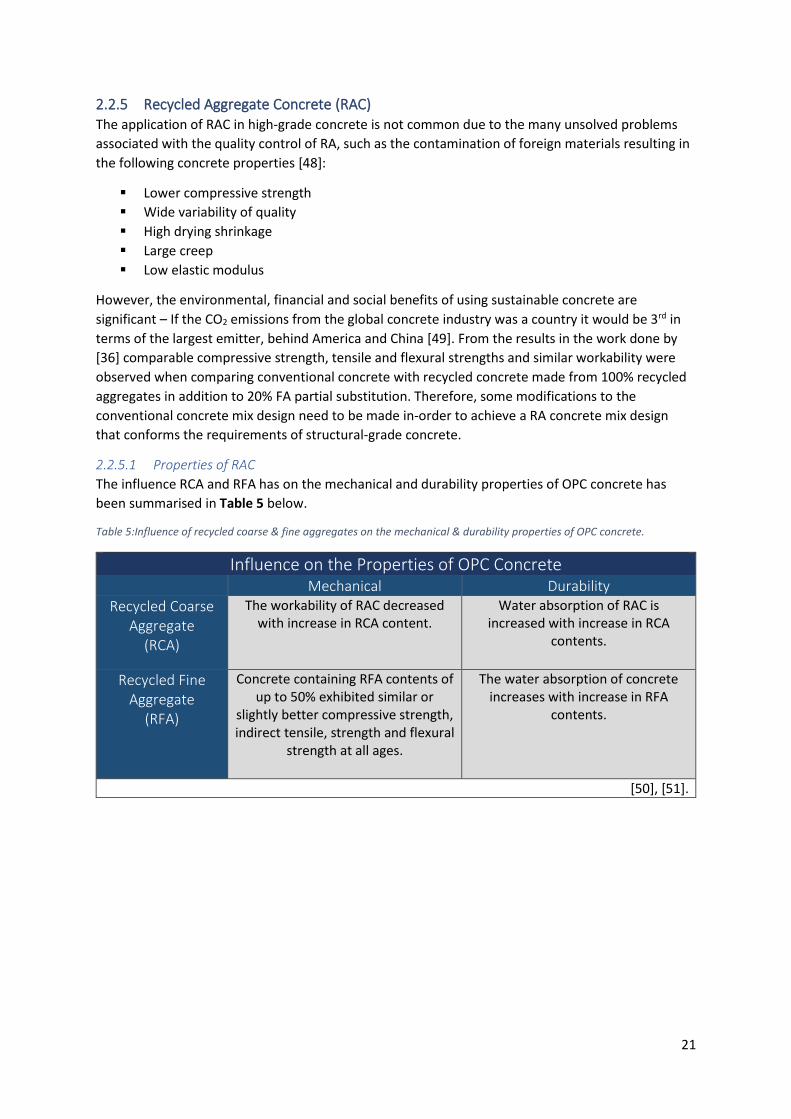
2.2.5 Recycled Aggregate Concrete (RAC) The application of RAC in high-grade concrete is not common due to the many unsolved problems
associated with the quality control of RA, such as the contamination of foreign materials resulting in
the following concrete properties [48]:
▪ Lower compressive strength
▪ Wide variability of quality
▪ High drying shrinkage
▪ Large creep
▪ Low elastic modulus
However, the environmental, financial and social benefits of using sustainable concrete are
significant – If the CO2 emissions from the global concrete industry was a country it would be 3rd in
terms of the largest emitter, behind America and China [49]. From the results in the work done by
[36] comparable compressive strength, tensile and flexural strengths and similar workability were
observed when comparing conventional concrete with recycled concrete made from 100% recycled
aggregates in addition to 20% FA partial substitution. Therefore, some modifications to the
conventional concrete mix design need to be made in-order to achieve a RA concrete mix design
that conforms the requirements of structural-grade concrete.
2.2.5.1 Properties of RAC
The influence RCA and RFA has on the mechanical and durability properties of OPC concrete has
been summarised in Table 5 below.
Table 5:Influence of recycled coarse & fine aggregates on the mechanical & durability properties of OPC concrete.
Influence on the Properties of OPC Concrete
Mechanical Durability
Recycled Coarse Aggregate
(RCA)
The workability of RAC decreased with increase in RCA content.
Water absorption of RAC is increased with increase in RCA
contents.
Recycled Fine Aggregate
(RFA)
Concrete containing RFA contents of up to 50% exhibited similar or
slightly better compressive strength, indirect tensile, strength and flexural
strength at all ages.
The water absorption of concrete increases with increase in RFA
contents.
[50], [51].
22
2.3 Fly-Ash & Geopolymer Concrete By incorporating a sequence of chemical and physical processes, FA can be refined into a
geopolymer material which has been previously used as an alternative to cementing material [52].
Geopolymers are a member of the silicon based inorganic polymer family. FA based geopolymer
material can be made by mixing the alumino-silicate feed (FA) with an alkaline solution [53].
Currently the surplus of FA in Collie is an untapped resource, with a maximum of only 30% being
repurposed for potential reuse [54]. Currently in Collie over 12 million tonnes of FA is in storage,
with plans to clear 4.42 ha to increase storage capacity in 2020 [55]. There is potential economic
gain due to the abundance of the resource and the removal of potentially toxic and unusable wastes,
in addition to industry and job creation for Collie [6].
2.3.1 Fly-Ash in WA FA is the waste product produced from the coal combustion process. Defined as the solid material
extracted from the flue gases of a boiler fired with pulverised coal, it accounts for 18% of the
national waste stream [56]. In WA around 300,000 tonnes per annum of FA is produced [5], most of
which comes from Collie – the heart of the South West Interconnected System (SWIS). The decade’s
worth of FA is currently stockpiled in storage dams which was observed at the Synergy Muja Power
Plant – covering an area of 42 ha and depth of 7m2 to accommodate for the annual production of
140 tonnes. It was observed that Bluewaters Power Station uses the FA as overburden. This is a very
expensive operations as around thirty trucks (capacity of around 10m3) are required to transport the
FA from the power station to the mine each day. Currently there is no legislation in place to
encourage the power companies operating in Collie to utilise their FA deposits in a sustainable
manner [6].
2 The dam walls are made from the bottom ash which has been shown to have excellent performance results in applications such as land rejuvenation and road base construction. However, lack of market acceptance for the FA restricts the bottom ash from being used for these valuable applications.
23
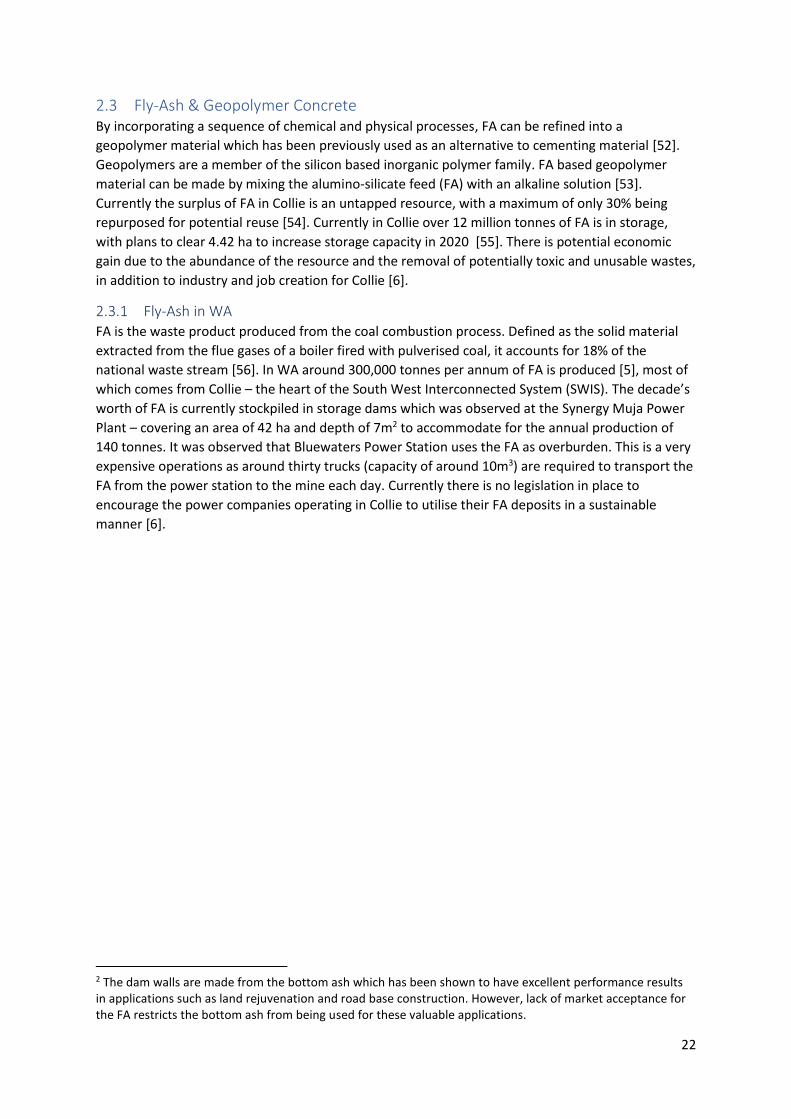
2.3.2 Properties of FA FA is a pozzolanic material – alumina-silicate based material which reacts with the calcium hydroxide
(CaOH) produced by the hydration of OPC to produce calcium-silicate hydrates and calcium-
aluminium hydrates. Other pozzolanic materials that are being used as partial replacement of
cement include blast furnace slag and silica fume [57]. The quality and composition of FA can differ
depending on the type and quality of coal combusted3. The high iron and low calcium content Class
F4 FA produced in Collie is derived from burning anthracite or bituminous coal. Work done by [58]
has determined the following properties of the FA produced in Collie (Table 6).
Table 6: Collie fly-ash properties.
Collie Fly-Ash Properties
Reactive Amorphous Content 54.58 wt. %
Carbon Content 2.06 wt.%.
Water Content 0.73 wt.%
Al2O3 23.59 wt.%
Fe2O3 15.33 wt.%
SiO2 51.46 wt.%
[58]
The particle size distribution of the Collie FA is finer (80% of particles < 35µm) than the FA found in
the Eastern states. This can be linked to the higher moisture content of the coal found in Collie [58].
It is noted in [59] that FA with a high carbon content will result in a reduced compressive strength.
This is due to the high tendency of the carbon to absorb water and other additives causing
disturbance to the required ratio for hydrothermal condensation to occur.
3 In the ASTM Standard Specification two classes of FA are identified:
▪ Class F – Created from the combustion of anthracite or bituminous coal and has a low calcium content.
▪ Class C – Created from the combustion of lignite or sub-bituminous coal and has a high calcium content.
4 The sum of Al2O3, Fe2O3 and SiO2 found in the Collie fly-ash is 90.4%, conforming to the lower limit 70% requirement for a Class F fly-ash [58].
24
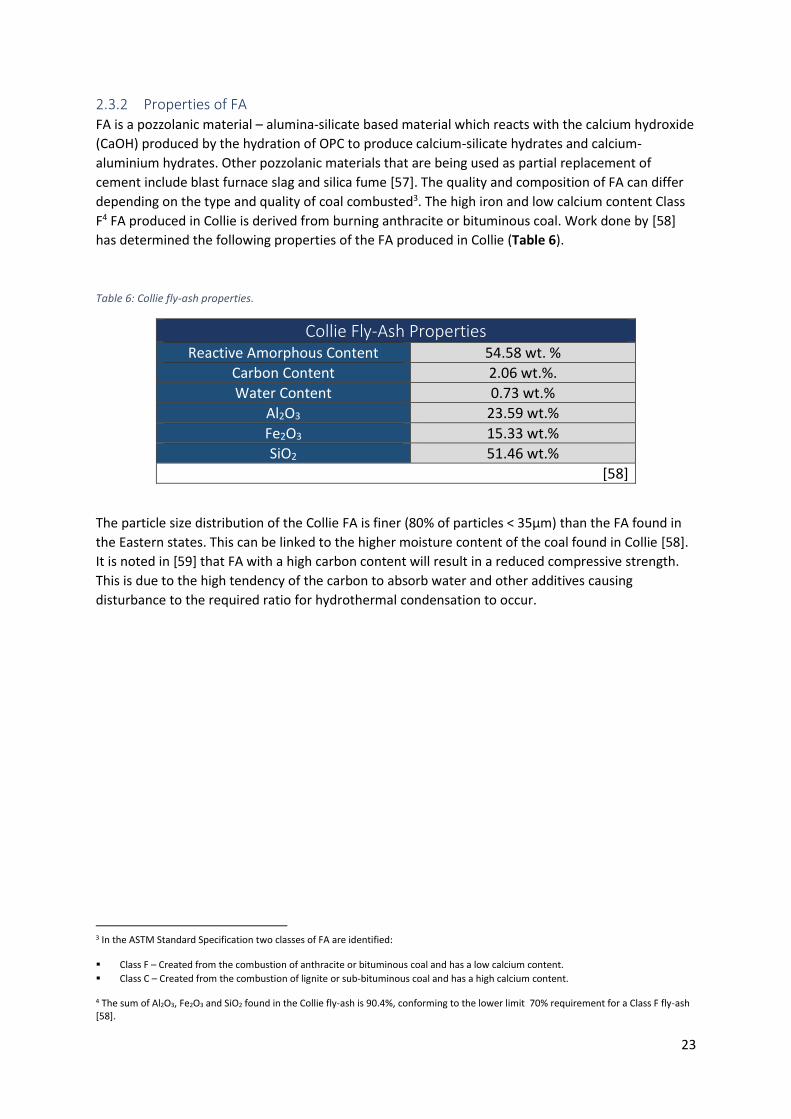
2.3.3 Production of FA When the coal enters the plant, it is first pulverised so it can be fed into the boiler where it combusts
at around 1,500⁰C. At this temperature, the inorganic materials such as calcite, gypsum, quarts,
pyrite and clay minerals melt and fuse together to form the glassy spherical FA particles which are
collected from the flue gases through mechanical and electrostatic precipitators. The bottom ash is
collected from the bottom of the boiler due to being a heavier particle and attributes to only 10% of
the ash produced – the remainder 90% is FA [57]. This process has been illustrated in figure 2 below.
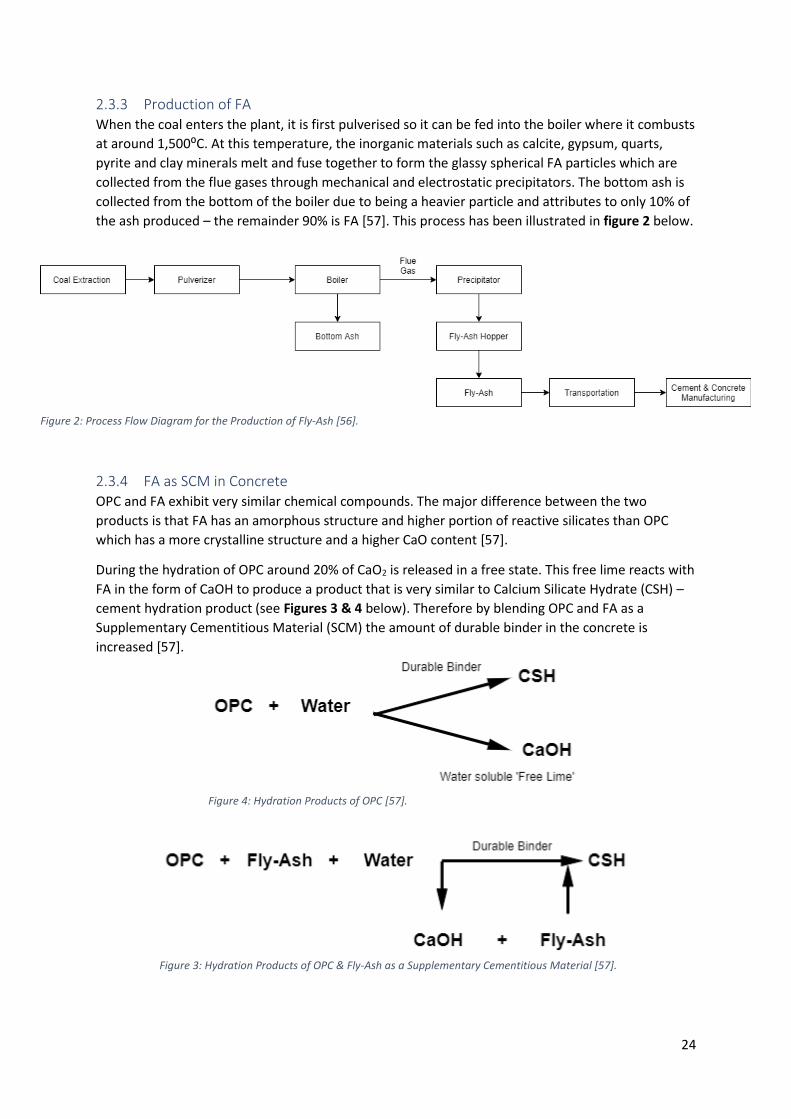
2.3.4 FA as SCM in Concrete OPC and FA exhibit very similar chemical compounds. The major difference between the two
products is that FA has an amorphous structure and higher portion of reactive silicates than OPC
which has a more crystalline structure and a higher CaO content [57].
During the hydration of OPC around 20% of CaO2 is released in a free state. This free lime reacts with
FA in the form of CaOH to produce a product that is very similar to Calcium Silicate Hydrate (CSH) –
cement hydration product (see Figures 3 & 4 below). Therefore by blending OPC and FA as a
Supplementary Cementitious Material (SCM) the amount of durable binder in the concrete is
increased [57].
Figure 2: Process Flow Diagram for the Production of Fly-Ash [56].
Figure 4: Hydration Products of OPC [57].
Figure 3: Hydration Products of OPC & Fly-Ash as a Supplementary Cementitious Material [57].

25
In the multiple pieces of work done by S.F.U Ahmed, the partial substitution of Collie FA in concrete
made from RA has been explored. The findings have been summarised below: [50] & [51]
▪ The inclusion of FA improves the workability of RAC’s.
▪ The addition of 40% FA significantly reduced the water absorption values of all RAC’s. The long-
term (56 & 91 days) compressive strengths of RAC’s were also improved.
▪ The partial replacement of cement with 30% & 40% FA in the RAC’s exhibited improvement in
compressive strength, flexural strength and water absorption at 56 days.
Other influences FA SCM substitution has on the durability properties of concrete are summarised in
Table 7 below.
Table 7: Influence of Fly-ash as Supplementary Cementitious Material on the Properties of Concrete.
Influence of Fly-Ash SCM on the Durability Properties of Concrete
Compressive Strength Long term strengths increased due to pozzolanic reactions at the later age.
Tensile Strength Function of compressive strength and not effected by fly-ash.
Flexural Strength
Hardened Density Improved workability results in higher densities in field concrete.
Drying Shrinkage Reduced shrinkage is due to lower water demand.
Elastic Modulus Limited influence on density and is related more to the compressive strength.
[56]
26
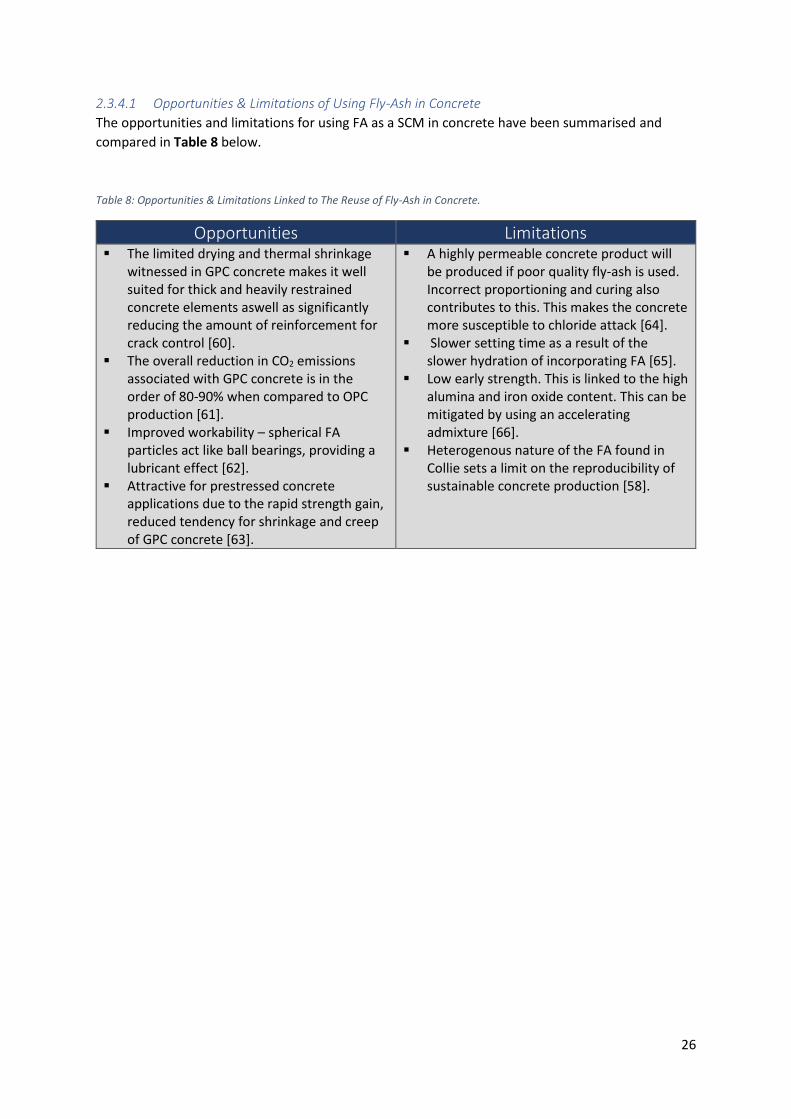
2.3.4.1 Opportunities & Limitations of Using Fly-Ash in Concrete
The opportunities and limitations for using FA as a SCM in concrete have been summarised and
compared in Table 8 below.
Table 8: Opportunities & Limitations Linked to The Reuse of Fly-Ash in Concrete.
Opportunities Limitations ▪ The limited drying and thermal shrinkage
witnessed in GPC concrete makes it well suited for thick and heavily restrained concrete elements aswell as significantly reducing the amount of reinforcement for crack control [60].
▪ The overall reduction in CO2 emissions associated with GPC concrete is in the order of 80-90% when compared to OPC production [61].
▪ Improved workability – spherical FA particles act like ball bearings, providing a lubricant effect [62].
▪ Attractive for prestressed concrete applications due to the rapid strength gain, reduced tendency for shrinkage and creep of GPC concrete [63].
▪ A highly permeable concrete product will be produced if poor quality fly-ash is used. Incorrect proportioning and curing also contributes to this. This makes the concrete more susceptible to chloride attack [64].
▪ Slower setting time as a result of the slower hydration of incorporating FA [65].
▪ Low early strength. This is linked to the high alumina and iron oxide content. This can be mitigated by using an accelerating admixture [66].
▪ Heterogenous nature of the FA found in Collie sets a limit on the reproducibility of sustainable concrete production [58].

27
2.3.5 Geopolymer Concrete (GPC) Geopolymers are inorganic three dimensional networks of alumino-silicate that can adopt a shape
readily at low temperatures [67]. The concept of geopolymer chemistry was first developed by
Joseph Davidovits in 1978 as part of his research to develop a ‘plastic’ material that is both heat
resistant and non-combustible for structural applications [68]. This innovative cementitious binder
serves as a sustainable alternative to the production of OPC which has a huge carbon footprint due
to the high temperatures required. The benefits of using GPC in sustainable construction has been
listed below [69]:
▪ Longer service life
▪ Low carbon emissions
▪ Life cycle cost savings
▪ Recycling of industrial waste
▪ Reduced stress on virgin material assets
▪ Reduced global warming potential.
2.3.5.1 Properties of GPC
The properties and durability of fresh and hardened GPC using Collie class F FA has been extensively
explored by various academics from Curtin University. Their findings are summarised below. It was
concluded that the performance of GPC is comparable to that of OPC.
Work done by [70] & [9] devised the Water-to-Geopolymer Solids Ratio (W/GPS) for Class F FA. It
was found that as this ratio increases, the workability of the mixture also increased as it contained
more water (results in a decrease in the compressive strength). Using the same previously
mentioned W/GPS ratio, [69] found that the slump value is dependent on the ratio of sodium silicate
(Na2SiO3) and sodium hydroxide (NaOH) aswell as the concentration of NaOH. Suitable workability
was achieved when the W/GPS ratio was more than 0.22 in addition to the usage of low water
absorption aggregates. The workability can also be increased by using a Naphthalene based super
plasticiser [70].
Work done by [71] found that the compressive strength of GPC concrete increases as the ratio of
Na2SiO3 / FA is increased and decreases as the binder/ sand ratio is more than 0.5. This study was
successful in creating GPC concrete which achieved a compressive strength of 100 MPa. It was also
found that a 20 – 30% increase in the compressive strength was achieved by first sieving the FA.
GPC concrete also has a much lower shrinkage and heat of hydration when compared to OPC.
Additionally It is expected that the chemistry of GPC concrete would provide a good resistance to
chloride attack [60].
28
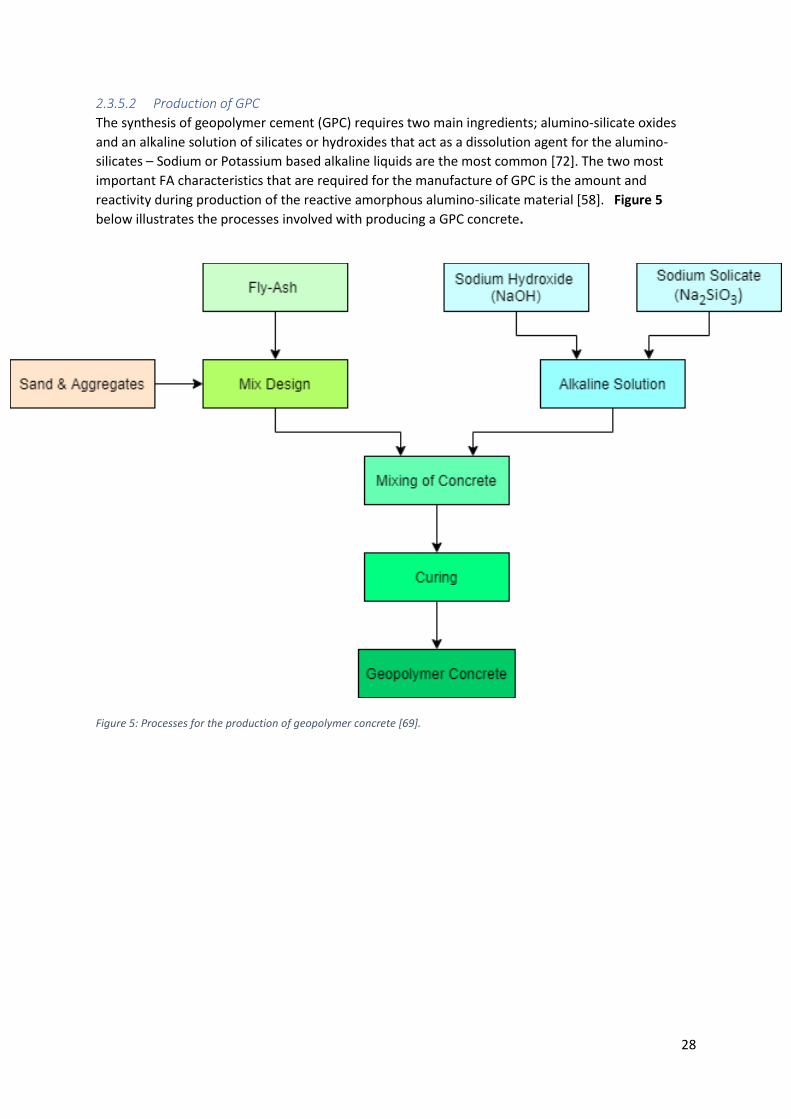
2.3.5.2 Production of GPC
The synthesis of geopolymer cement (GPC) requires two main ingredients; alumino-silicate oxides
and an alkaline solution of silicates or hydroxides that act as a dissolution agent for the alumino-
silicates – Sodium or Potassium based alkaline liquids are the most common [72]. The two most
important FA characteristics that are required for the manufacture of GPC is the amount and
reactivity during production of the reactive amorphous alumino-silicate material [58]. Figure 5
below illustrates the processes involved with producing a GPC concrete.
Figure 5: Processes for the production of geopolymer concrete [69].
29
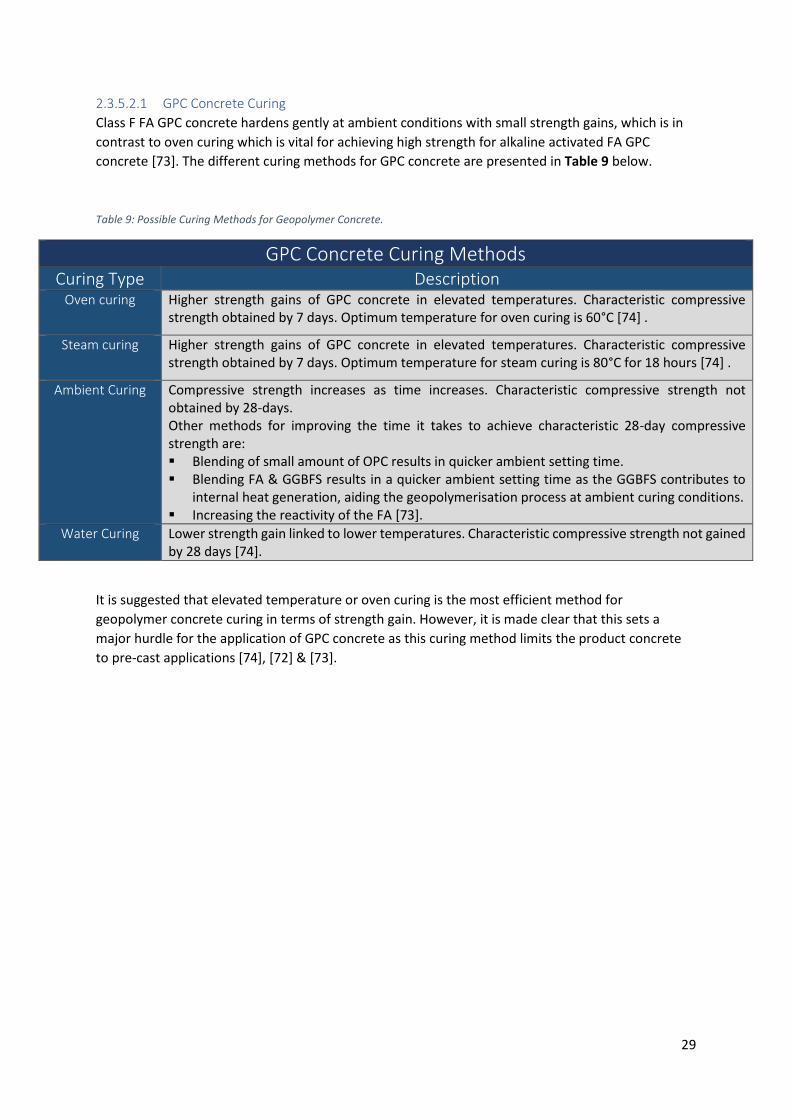
2.3.5.2.1 GPC Concrete Curing
Class F FA GPC concrete hardens gently at ambient conditions with small strength gains, which is in
contrast to oven curing which is vital for achieving high strength for alkaline activated FA GPC
concrete [73]. The different curing methods for GPC concrete are presented in Table 9 below.
Table 9: Possible Curing Methods for Geopolymer Concrete.
GPC Concrete Curing Methods
Curing Type Description Oven curing Higher strength gains of GPC concrete in elevated temperatures. Characteristic compressive
strength obtained by 7 days. Optimum temperature for oven curing is 60°C [74] .
Steam curing Higher strength gains of GPC concrete in elevated temperatures. Characteristic compressive strength obtained by 7 days. Optimum temperature for steam curing is 80°C for 18 hours [74] .
Ambient Curing Compressive strength increases as time increases. Characteristic compressive strength not obtained by 28-days. Other methods for improving the time it takes to achieve characteristic 28-day compressive strength are: ▪ Blending of small amount of OPC results in quicker ambient setting time. ▪ Blending FA & GGBFS results in a quicker ambient setting time as the GGBFS contributes to
internal heat generation, aiding the geopolymerisation process at ambient curing conditions. ▪ Increasing the reactivity of the FA [73].
Water Curing Lower strength gain linked to lower temperatures. Characteristic compressive strength not gained by 28 days [74].
It is suggested that elevated temperature or oven curing is the most efficient method for
geopolymer concrete curing in terms of strength gain. However, it is made clear that this sets a
major hurdle for the application of GPC concrete as this curing method limits the product concrete
to pre-cast applications [74], [72] & [73].
30
2.3.5.3 GPC Concrete Case Studies
The 2013 GPC Concrete House entry to the U.S Department of Energy Solar Decathlon was a
technical innovation due to its inclusion of an integrated thermal mass system – hydroponic tubes
circulating heated water were embedded within the pre-cast wall panels in addition to insulated
formwork to reach the desired curing temperature of 60°. Sensors where used measure the
temperature of the curing concrete and as a result will continue to function after curing and were
therefore incorporated into the buildings monitoring and control system [63].
Currently Wagners are one of the major producers and suppliers of a commercial GPC concrete
product in Australia. Based in Toowoomba, Queensland their product called Earth Friendly Concrete
(EFC) uses a geopolymer binder system made from the chemical activation of blast furnace slag and
FA. The numerous successful projects undertaken by Wagners using their environmentally
responsible product will hopefully lead the way in supporting the increased uptake of GPC concrete
[60] & [75]. The work by [60] discusses several site-case and pre-cast field applications of Wagners
GPC concrete and its suitability as an alternative to conventional concrete – see Table 23 in
Appendix A.11 for an overview for each of the several case studies. More recently, in November
2014 Wagners completed work on the Brisbane West Wellcamp Airport (BWWA) where 40,000m3 of
the EFC product was used to construct the turning node, apron and taxiway pavements – making it
the largest application of GPC concrete in the world at the time. The product was found to be well
suited for this application due to its high flexural tensile strength, low shrinkage and workability
characteristics. Another strong driver for the use of GPC concrete in this project is the environmental
benefits linked to using this sustainable product – The CO2 emissions saved in this project amount to
8,640 tonnes [75].
31
3 Methodology This section outlines the methods, importance, and desired outcomes for objectives 3, 4 and 5 of
this study. The collection of data was carried out in two parts. Part 1 includes the particle size
distribution and water absorption for both the coarse and fine aggregates. Part 2 includes the
compressive strength and slump test for both the OPC and GPC concrete mixes.
Objective 3 – Test the particle size distribution, water absorption and particle densities for the
Recycled Coarse Aggregates (RCA), Recycled Sand (RS) and Manufactured Sand (MS).
The methods for the particle size distribution of coarse and fine aggregates align with AS 1141.11.1 –
2009. For the water absorption the methods align with AS 1141.5 – 1996 for the fine aggregates and
AS 1141.6.1 – 2000 for the coarse aggregates. The RA have heterogenous grading and therefore
sieving is required to recover the desired portion – 7 & 14mm. The 20mm recycled road base must
be portioned into coarse (≥5mm) and fine (< 5mm) aggregates from which the RCA and MS
components of this project. The desired outcome from this method is to develop the desired
concrete mix design (Objective 4) by taking into consideration the shape, size and absorption of the
RCA, RS and MS.
Objective 4 – Develop Recycled Aggregate Concrete (RAC) specimens with a design compressive
strength of 40MPa for both Ordinary Portland Cement (OPC) and Geopolymer Cement (GPC).
The DOE British Method will be used to develop structural grade concrete mix designs for each of the
concrete mixes. A 40MPa concrete mix design requires the correct ratio of cement, sand, aggregate
and water while still being workable. The desired outcome from this is to develop a 40MPa
sustainable concrete using the RA and FA.
Objective 5 – Collect and analyse the data on the workability and compressive strength of OPC and
GPC RAC specimens.
In-order to accurately measure the compressive strength of a concrete mix the compressive strength
test requires sampling, curing and crushing of concrete samples requires a repeatable procedure so
that the results can be compared. Therefore the following Australian Standards were used:
▪ AS 1012.1 – 2014: Methods of sampling concrete.
▪ AS 1012.8.1 – 2014: Methods for making & curing concrete.
▪ AS 1012.9 – 2014: Methods for testing concrete specimens.
The compressive strength results will provide insight on the opportunities for how the type of
cement, coarse and fine aggregates can be optimised to create a concrete mix that meets a
minimum design strength of 40MPa.
For the slump test AS 1012.3.1 – 2014: Methods of testing concrete slump was followed. The
importance of this is that the slump value of a concrete mix allows for determination of the
workability and consistency of the concrete mix which is influenced from the concrete mix design.
The desired outcome from the slump test results for each of the different mixes is to reveal how the
size, type and water absorption of the coarse and fine aggregates impact the consistency,
flowability, compaction and harshness of the concrete mix.

32
3.1 Part 1 – Aggregates The aggregates component of this project seeks to conduct a particle size distribution of the 20mm
recycled road base material aswell as the Recycled Sand product obtained from Earthcare Recycling
(ECR). Table 24 in Appendix B.1. summarises all the materials used in this study. This data will be
used to compare the particle size distribution of the recycled materials against the limits set out in
the Australian Standards for aggregates in concrete (see Table 10 below). In addition to this, the
water absorption of the 7mm and 14mm RCA is also to be collected. This data will be used to
compare to natural material aswell as what impact this may have in the design of a concrete mix.
Table 10: Relevant Australian Standards used in the aggregate component of this project.
Australian Standards – Aggregates
AS 2758.1 – 2004 Aggregates for Rock & Engineering Purposes – Concrete Aggregates.
AS 1141.11.1 – 2009 Particle Size Distribution – Sieving Method.
AS 1141.6.1 – 2000 Methods for Sampling & Testing Aggregates. Method 6.1: Particle Density & Water Absorption of Coarse Aggregate – Weighing-In-Water Method.
AS 1141.5 – 2000 Methods for Sampling & Testing of Aggregates Particle Density & Water Absorption of Fine Aggregate
3.1.1 Assumptions & Considerations ▪ Although it can be assumed that the 20 mm recycled roadbase sample obtained from ECR is an
accurate representation of the stockpile it came from. However, this stockpile compared to
other stockpiles of 20mm recycled roadbase located at other C&D recycler yards in the Perth
metro region will differ in quality as the CDW is sourced from different location – variations in
material compositions and processing procedures.
▪ The sieve apertures that were obtained were different from those suggested in the Australian
Standards – 5mm sieve used instead 4.75mm to separate coarse and fine aggregates as this was
the equipment that was available.
▪ Water absorption for RFA done by independent testing facility as equipment for this test was not
available.
33
3.1.2 Particle Size Distribution This method sets out the procedure to determine the particle size distribution of coarse and fine
aggregates in accordance to AS 1141.11.1 – 2009 – Particle Size Distribution – Sieving Method.
3.1.2.1 Apparatus & Equipment
▪ Scoop
▪ Buckets
▪ Balances
▪ Drying oven
▪ 200mm diameter sieve – 0.075, 0.6, 1.18, 1.7, 2 & 4mm
▪ 450mm diameter sieve – 5, 8, 11.2, 16 & 22.4mm
▪ Brush
3.1.2.2 Preparation
The 20mm recycled road base sample was separated into 2 sizes using a 5mm sieve. The portions
obtained for the material recovered and material passing the sieve were tested separately.
3.1.2.3 Procedure
The procedure for both the coarse & fine aggregates was as followed:
1. Stack the sieves in order of decreasing size from top to bottom.
2. Place 3kg of RCA (150g for the RFA) in the top sieve and agitate by hand.
3. Determine the mass of each increment.
3.1.2.4 Calculations
The mass of material passing (%) each of the sieves were calculated based on the total mass of the
sample.
34
3.1.3 Water Absorption & Particle Density This method is used to calculate the SSD density and water absorption of the 7mm and 14mm RCA
to be used in the concrete samples. The procedure followed was in accordance to AS 1141.6.2 –
2000 – Methods for Sampling & Testing Aggregates. Method 6.1: Particle Density & Water
Absorption of Coarse Aggregate – Weighing-In-Water Method.
The water absorption and particle density of the RS and MS was obtained from the NATA accredited
testing facility5 as much of the equipment required was not available. The procedure followed was in
accordance to AS 1141.5 – 2000 – Methods for Sampling & Testing of Aggregates Particle Density &
Water Absorption of Fine Aggregate.
3.1.3.1 Recycled Coarse Aggregate
3.1.3.1.1 Apparatus & Equipment
▪ Wire basket
▪ Water bath
▪ Thermometer
▪ Balance
▪ Oven
▪ Container
▪ Towels & dry clothes
▪ Dishes
3.1.3.1.2 Preparation
1. Recover approximately 2kg of 7mm and 14mm (50/50 mix) aggregates retained on a 5mm
sieve.
a. If the material passing the 5mm sieve amounts to a less than 10% of the total. If it
amounts to more than 10% test it separately in accordance with AS 1141.5.
2. Wash to remove dust from the surface of the aggregates.
3.1.3.1.3 Procedure
1. Submerge the aggregate in water for 24hrs, ensuring at least 20mm of water is above the
material layer. Occasionally stirring the vessel to dislodge any air bubbles.
2. After the 24hr submersion period, transfer the aggregate into a basket (record the empty
mass of the basket as W2) immersed in water contained in a bath below the balance. Attach
the basket hanger to the balance and weigh the basket & material (W1).
3. Record the temperature of the water in the bath.
4. Remove the basket and material from the water bath and allow to drain and then transfer to
the dish.
5. Surface dry the aggregates until all visible films of water have been removed and the
aggregates appear damp. Record the SSD mass of the aggregates (m2).
6. Dry the material in an oven at 105°C – 110°C to constant mass and determine its mass (m1)
5 2kg samples of both recycled sand & manufactured sand were sent off for independent testing by Materials Consultants Pty. Ltd. Based in Perth (300 Collier Road, Bassendean WA 6054) Water absorption and particle density analysis in accordance with AS 1141.5 – 2000. The cost associated with this is $165 per sample.
35
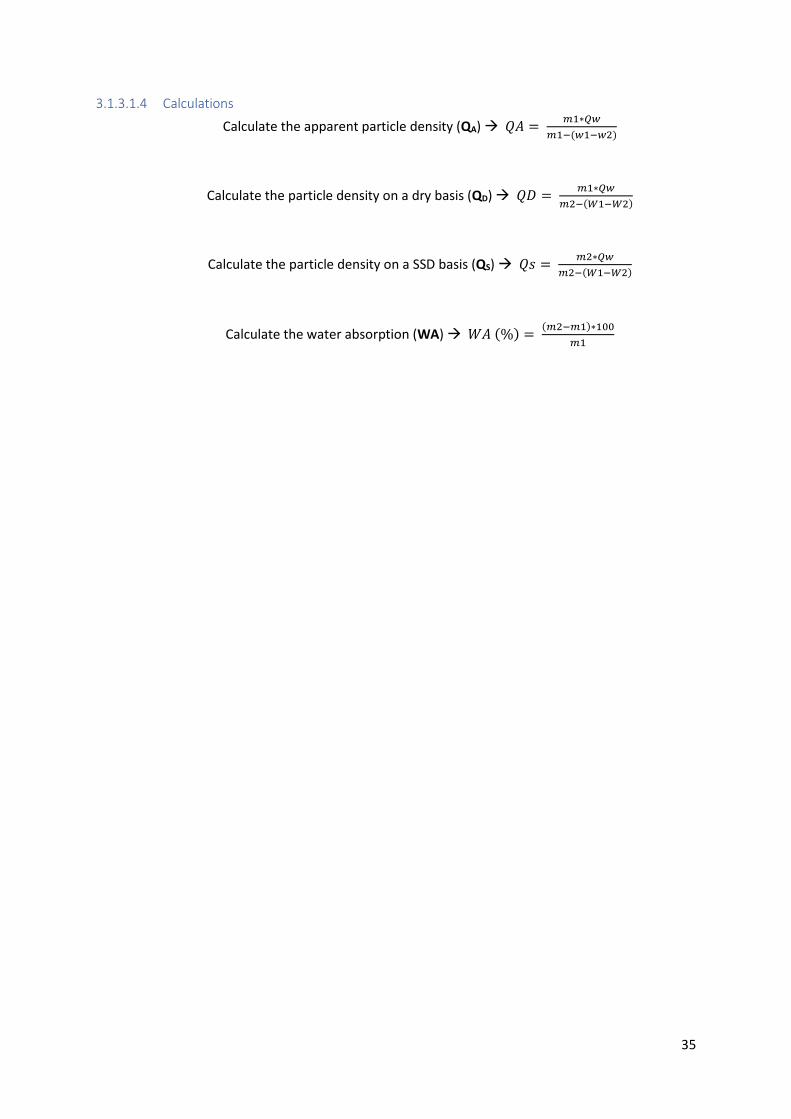
3.1.3.1.4 Calculations
Calculate the apparent particle density (QA) → 𝑄𝐴 = 𝑚1∗𝑄𝑤
𝑚1−(𝑤1−𝑤2)
Calculate the particle density on a dry basis (QD) → 𝑄𝐷 = 𝑚1∗𝑄𝑤
𝑚2−(𝑊1−𝑊2)
Calculate the particle density on a SSD basis (QS) → 𝑄𝑠 = 𝑚2∗𝑄𝑤
𝑚2−(𝑊1−𝑊2)
Calculate the water absorption (WA) → 𝑊𝐴 (%) = (𝑚2−𝑚1)∗100
𝑚1

36
3.1.3.2 Recycled Fine Aggregates
3.1.3.2.1 Apparatus & Equipment
▪ Balance
▪ 500mL Volumetric Flask
▪ Conical mould (73mm high, base diameter of 90mm & top diameter 38mm).
▪ Tampering rod
▪ Oven
▪ Dish
▪ 4.75mm sieve (only 5mm available)
▪ Thermometer
3.1.3.2.2 Preparation
Sieve the recycled sand and manufactured sand samples through a 5mm sieve to obtain a 500g
sample of each.
3.1.3.2.3 Procedure
1. Immerse the samples of fine aggregate in a water bath at room temperature for 24 hours.
Remove air bumbles by gently agitating the sample for each fine aggregate.
2. Drain the water of the test samples and spread out on a flat surface. Expose the fine
aggregate to a gently moving current of warm air and stir frequently to obtain a uniform
surface dried aggregate.
3. Fill the conical mould when the fine aggregate seems to be free flowing. Tamp the surface of
the aggregate with the tampering rod 25 times by letting it drop 10mm above the surface of
the test sample.
4. Lift the conical mould vertically. The sample will retain its shape if free moisture is present.
The sample will slump if it’s too dry. Add additional water and stand for 30 mins.
5. Continue the procedure in step (3.) and (4.) until the sample slumps on the removal of the
cone. This means that sample has reached its saturated surface dry (SSD) condition.
6. Determine the total test sample mass (m2) immediately after reaching SSD condition.
7. Place the test portion into the volumetric flask and fill to the 500mL mark. Record the mass
of the volumetric flask and its contents (m3).
8. Remove the fine aggregate from the volumetric flask and place it in the dish.
9. Place the sample in the drying oven at 105°C – 110°C until constant mass is reached. Record
the mass of the dry fine aggregate (m1).
10. Fill the volumetric flask with water to the 500mL mark and determine the mass of the filled
flask (m4).
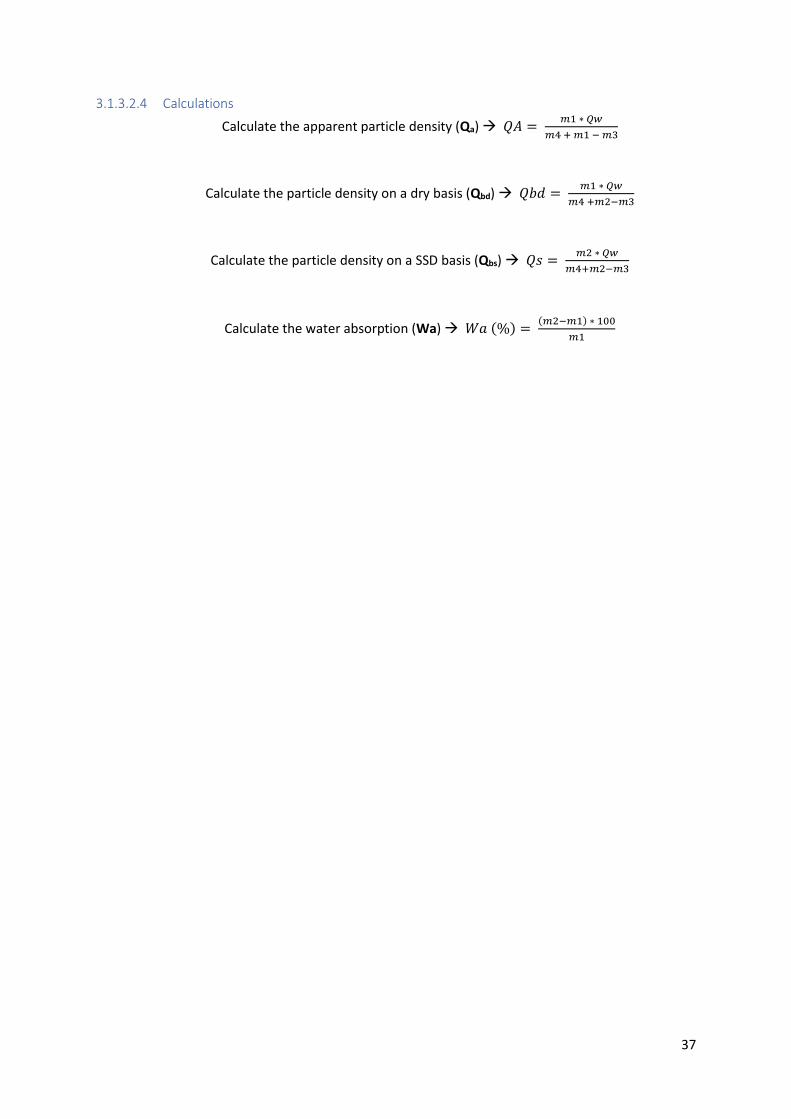
37
3.1.3.2.4 Calculations
Calculate the apparent particle density (Qa) → 𝑄𝐴 = 𝑚1 ∗ 𝑄𝑤
𝑚4 + 𝑚1 − 𝑚3
Calculate the particle density on a dry basis (Qbd) → 𝑄𝑏𝑑 = 𝑚1 ∗ 𝑄𝑤
𝑚4 +𝑚2−𝑚3
Calculate the particle density on a SSD basis (Qbs) → 𝑄𝑠 = 𝑚2 ∗ 𝑄𝑤
𝑚4+𝑚2−𝑚3
Calculate the water absorption (Wa) → 𝑊𝑎 (%) = (𝑚2−𝑚1) ∗ 100
𝑚1
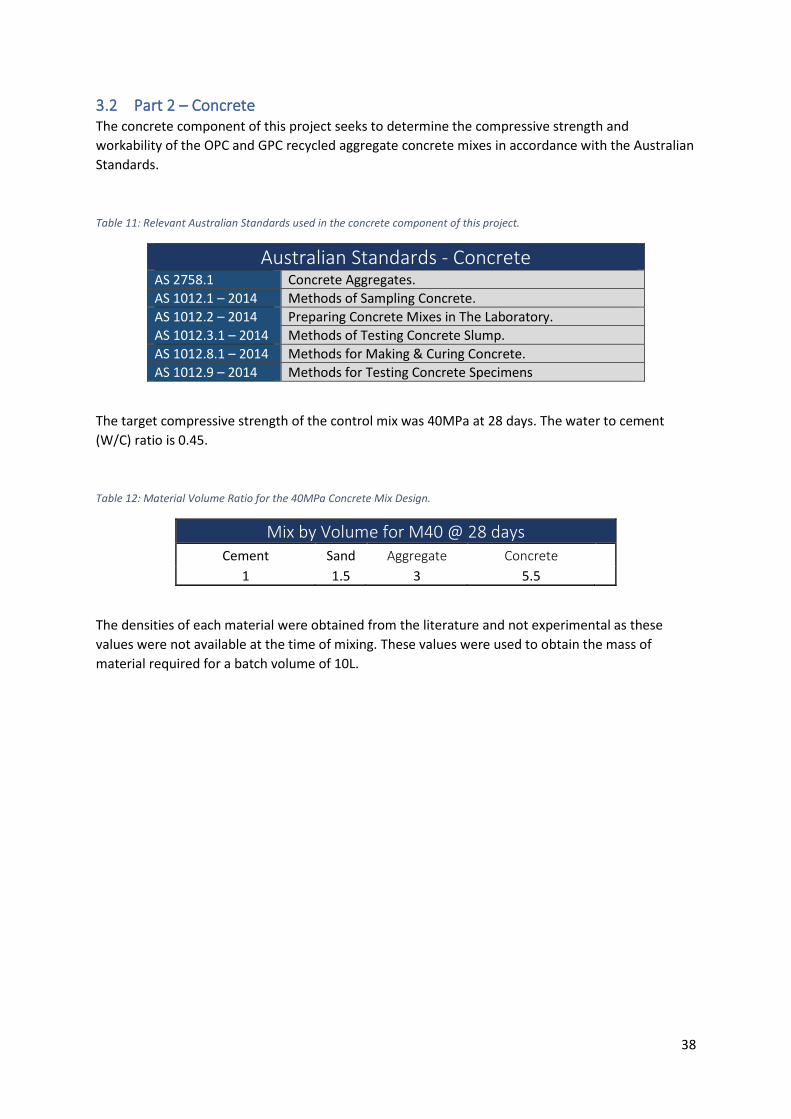
38
3.2 Part 2 – Concrete The concrete component of this project seeks to determine the compressive strength and
workability of the OPC and GPC recycled aggregate concrete mixes in accordance with the Australian
Standards.
Table 11: Relevant Australian Standards used in the concrete component of this project.
Australian Standards - Concrete
AS 2758.1 Concrete Aggregates.
AS 1012.1 – 2014 Methods of Sampling Concrete.
AS 1012.2 – 2014 Preparing Concrete Mixes in The Laboratory.
AS 1012.3.1 – 2014 Methods of Testing Concrete Slump.
AS 1012.8.1 – 2014 Methods for Making & Curing Concrete.
AS 1012.9 – 2014 Methods for Testing Concrete Specimens
The target compressive strength of the control mix was 40MPa at 28 days. The water to cement
(W/C) ratio is 0.45.
Table 12: Material Volume Ratio for the 40MPa Concrete Mix Design.
Mix by Volume for M40 @ 28 days Cement Sand Aggregate Concrete
1 1.5 3 5.5
The densities of each material were obtained from the literature and not experimental as these
values were not available at the time of mixing. These values were used to obtain the mass of
material required for a batch volume of 10L.
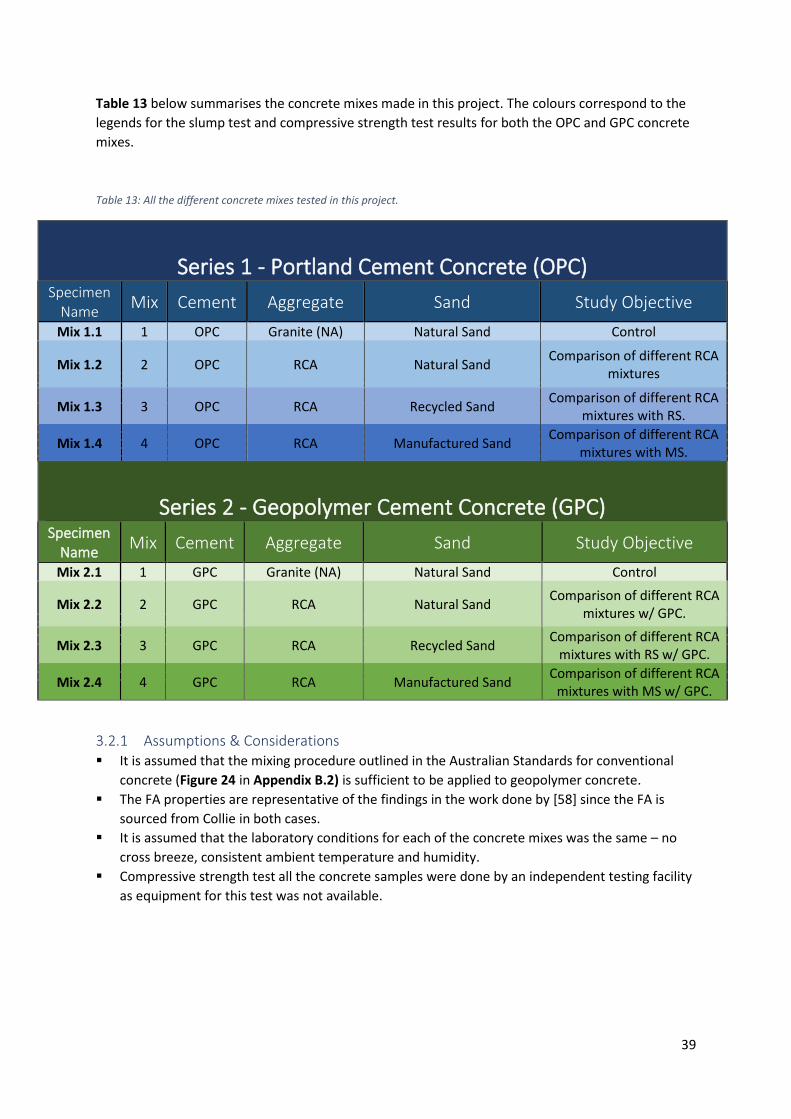
39
Table 13 below summarises the concrete mixes made in this project. The colours correspond to the
legends for the slump test and compressive strength test results for both the OPC and GPC concrete
mixes.
Table 13: All the different concrete mixes tested in this project.
Series 1 - Portland Cement Concrete (OPC)
Specimen Name
Mix Cement Aggregate Sand Study Objective
Mix 1.1 1 OPC Granite (NA) Natural Sand Control
Mix 1.2 2 OPC RCA Natural Sand Comparison of different RCA
mixtures
Mix 1.3 3 OPC RCA Recycled Sand Comparison of different RCA
mixtures with RS.
Mix 1.4 4 OPC RCA Manufactured Sand Comparison of different RCA
mixtures with MS.
Series 2 - Geopolymer Cement Concrete (GPC)
Specimen Name
Mix Cement Aggregate Sand Study Objective
Mix 2.1 1 GPC Granite (NA) Natural Sand Control
Mix 2.2 2 GPC RCA Natural Sand Comparison of different RCA
mixtures w/ GPC.
Mix 2.3 3 GPC RCA Recycled Sand Comparison of different RCA
mixtures with RS w/ GPC.
Mix 2.4 4 GPC RCA Manufactured Sand Comparison of different RCA
mixtures with MS w/ GPC.
3.2.1 Assumptions & Considerations ▪ It is assumed that the mixing procedure outlined in the Australian Standards for conventional
concrete (Figure 24 in Appendix B.2) is sufficient to be applied to geopolymer concrete.
▪ The FA properties are representative of the findings in the work done by [58] since the FA is
sourced from Collie in both cases.
▪ It is assumed that the laboratory conditions for each of the concrete mixes was the same – no
cross breeze, consistent ambient temperature and humidity.
▪ Compressive strength test all the concrete samples were done by an independent testing facility
as equipment for this test was not available.
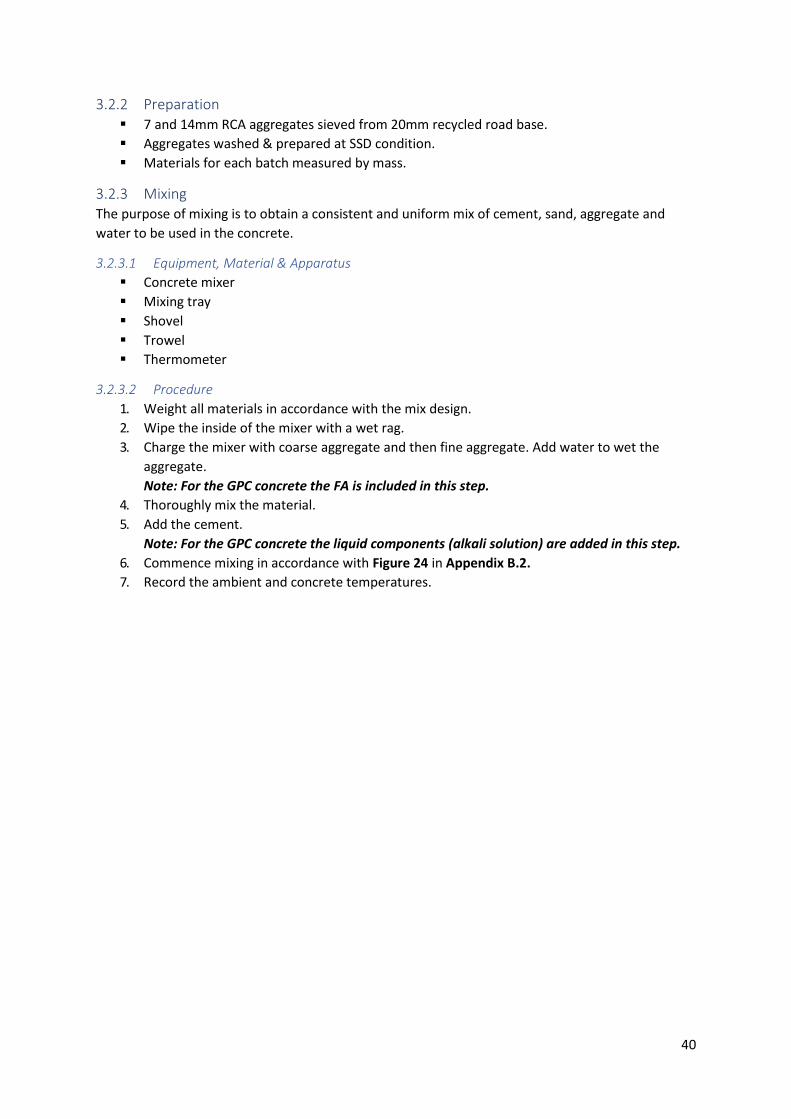
40
3.2.2 Preparation ▪ 7 and 14mm RCA aggregates sieved from 20mm recycled road base.
▪ Aggregates washed & prepared at SSD condition.
▪ Materials for each batch measured by mass.
3.2.3 Mixing The purpose of mixing is to obtain a consistent and uniform mix of cement, sand, aggregate and
water to be used in the concrete.
3.2.3.1 Equipment, Material & Apparatus
▪ Concrete mixer
▪ Mixing tray
▪ Shovel
▪ Trowel
▪ Thermometer
3.2.3.2 Procedure
1. Weight all materials in accordance with the mix design.
2. Wipe the inside of the mixer with a wet rag.
3. Charge the mixer with coarse aggregate and then fine aggregate. Add water to wet the
aggregate.
Note: For the GPC concrete the FA is included in this step.
4. Thoroughly mix the material.
5. Add the cement.
Note: For the GPC concrete the liquid components (alkali solution) are added in this step.
6. Commence mixing in accordance with Figure 24 in Appendix B.2.
7. Record the ambient and concrete temperatures.
41
3.2.4 Casting Concrete Specimens The concrete specimens were moulded in accordance to AS 1012.8.1:2014.
3.2.4.1 Equipment, Material & Apparatus
▪ Cylindrical moulds (2L)
▪ Mineral oil
▪ Rubber mallet
3.2.4.2 Procedure
1. Lightly oil the inside surfaces of the moulds.
2. The fresh concrete was poured into a cylindrical mould [100(D) x 200(H)] in approximately 2
equal layers.
3. Compact each layer by rodding (25 strokes per layer), the strokes being distributed uniformly
over the cross-section of the mould.
4. Do not contact the baseplate of the mould with the rod. For each layer just penetrate into the
underlying layer with at least the first 10 strokes.
5. Close any holes remaining in the surface of each layer by tapping the sides of the mould with a
rubber mallet.
6. Place sufficient concrete in the last layer to overfill the mould when compacted.
7. Strike off & smooth the surface of the concrete, avoiding a mirror finish.
8. Initial Curing – Specimens were stored in their moulds on a rigid horizontal surface for a period
of 18 – 36 hours. The air around the specimens was maintained at 27 ± 2 °C.
9. When the initial curing period has elapsed, the specimen were removed from the mould,
identified & promptly transported to the testing facility6 where they were placed under standard
moist curing conditions until the time of test (28 days).
Note: The GPC concrete specimens will be oven cured at 60 °C for 28 days.
Note: Demoulded specimens should be protected during transportation by means such as
wrapping in wet newspaper and packing within plastic bags.
6 Once set, the concrete cylinders are removed from the moulds and sent off for independent testing by Materials
Consultants Pty. Ltd. Based in Perth (300 Collier Road, Bassendean WA 6054) will do the compressive testing with
accordance with AS 1012.9. The cost associated with this is $30 per concrete cylinder.
42
3.2.5 Slump Test The slump test provides an indication of the consistency and workability of a concrete mix. The
slump test method is followed from section 6 in AS 1012.3.1:2014.
3.2.5.1 Equipment, Material & Apparatus
▪ Slump cone (6L)
▪ Base Plate
▪ Scoop (1L)
▪ Poking rod
▪ Ruler
3.2.5.2 Procedure
1. Moisten the internal surface of the mould and base plate by wiping with a damp cloth
immediately before commencing each test.
2. Place the mould on a carefully levelled base plate. Hold the mould firmly on the base plate and
ensure it remains in place during the rodding of the concrete.
3. Fill the mould in 3 layers each approximately 1/3rd of the height of the mould. As each scoopful
of concrete is being placed, move the scoop around the top edge of the mould as the concrete
slides from it. To ensure symmetrical distribution of the concrete within the mould. The addition
of the concrete for the top layer shall be carried out so as not to compact the concrete of the
top layer.
Note: A detachable collar is used to facilitate filling the mould.
4. Rod each layer with 25 strokes, distributed uniformly over the cross-section of the mould. Rod
the bottom layer throughout its depth and placing half the strokes near the perimeter. Rod the
2nd layer and the top layer throughout their depth, so that the strokes just penetrate into the
underlying layer.
Note: Avoid excessive contact with the base plate when rodding.
5. During the filling and rodding operation for the top layer, heap the concrete above the mould
before the rodding is started. If the rodding operation results in subsidence of the concrete
below the top edge of the mould, add more concrete to keep an excess of concrete above the
top of the mould.
6. After the top layer has been rodded, strike off the surface of the concrete by using a screeding
and rolling motion of the rod so that the mould is filled exactly. Quickly remove the excess
material from around the base of the mould, avoiding any movement or vibration of the mould.
Maintain a firm downward pressure at all times until the mould is removed. Immediately
remove the mould from the concrete by raising it slowly and carefully in a vertical direction,
allowing the concrete to subside. Complete the operation of raising the mould through its own
height in under 4 sec. without causing any lateral or torsional displacement of the concrete.
7. Immediately measure the slump by determining the difference between the height of the mould
(300mm) and the average hight of the top surface of the concrete and cross reference the shape
of the slump in accordance to Figure 25 in Appendix B.3.
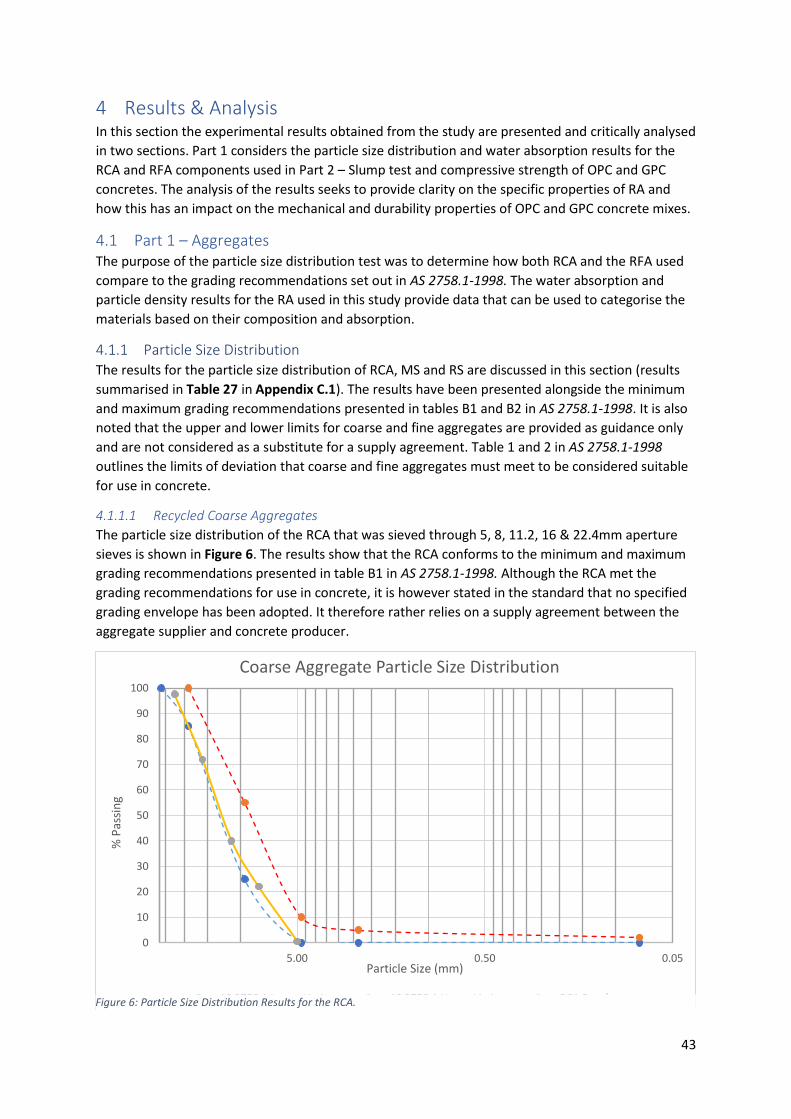
43
4 Results & Analysis In this section the experimental results obtained from the study are presented and critically analysed
in two sections. Part 1 considers the particle size distribution and water absorption results for the
RCA and RFA components used in Part 2 – Slump test and compressive strength of OPC and GPC
concretes. The analysis of the results seeks to provide clarity on the specific properties of RA and
how this has an impact on the mechanical and durability properties of OPC and GPC concrete mixes.
4.1 Part 1 – Aggregates The purpose of the particle size distribution test was to determine how both RCA and the RFA used
compare to the grading recommendations set out in AS 2758.1-1998. The water absorption and
particle density results for the RA used in this study provide data that can be used to categorise the
materials based on their composition and absorption.
4.1.1 Particle Size Distribution The results for the particle size distribution of RCA, MS and RS are discussed in this section (results
summarised in Table 27 in Appendix C.1). The results have been presented alongside the minimum
and maximum grading recommendations presented in tables B1 and B2 in AS 2758.1-1998. It is also
noted that the upper and lower limits for coarse and fine aggregates are provided as guidance only
and are not considered as a substitute for a supply agreement. Table 1 and 2 in AS 2758.1-1998
outlines the limits of deviation that coarse and fine aggregates must meet to be considered suitable
for use in concrete.
4.1.1.1 Recycled Coarse Aggregates
The particle size distribution of the RCA that was sieved through 5, 8, 11.2, 16 & 22.4mm aperture
sieves is shown in Figure 6. The results show that the RCA conforms to the minimum and maximum
grading recommendations presented in table B1 in AS 2758.1-1998. Although the RCA met the
grading recommendations for use in concrete, it is however stated in the standard that no specified
grading envelope has been adopted. It therefore rather relies on a supply agreement between the
aggregate supplier and concrete producer.
0
10
20
30
40
50
60
70
80
90
100
0.050.505.00
% P
assi
ng
Particle Size (mm)
Coarse Aggregate Particle Size Distribution
AS 2758.1 Lower Limit AS 2758.1 Upper Limit RCA ResultsFigure 6: Particle Size Distribution Results for the RCA.
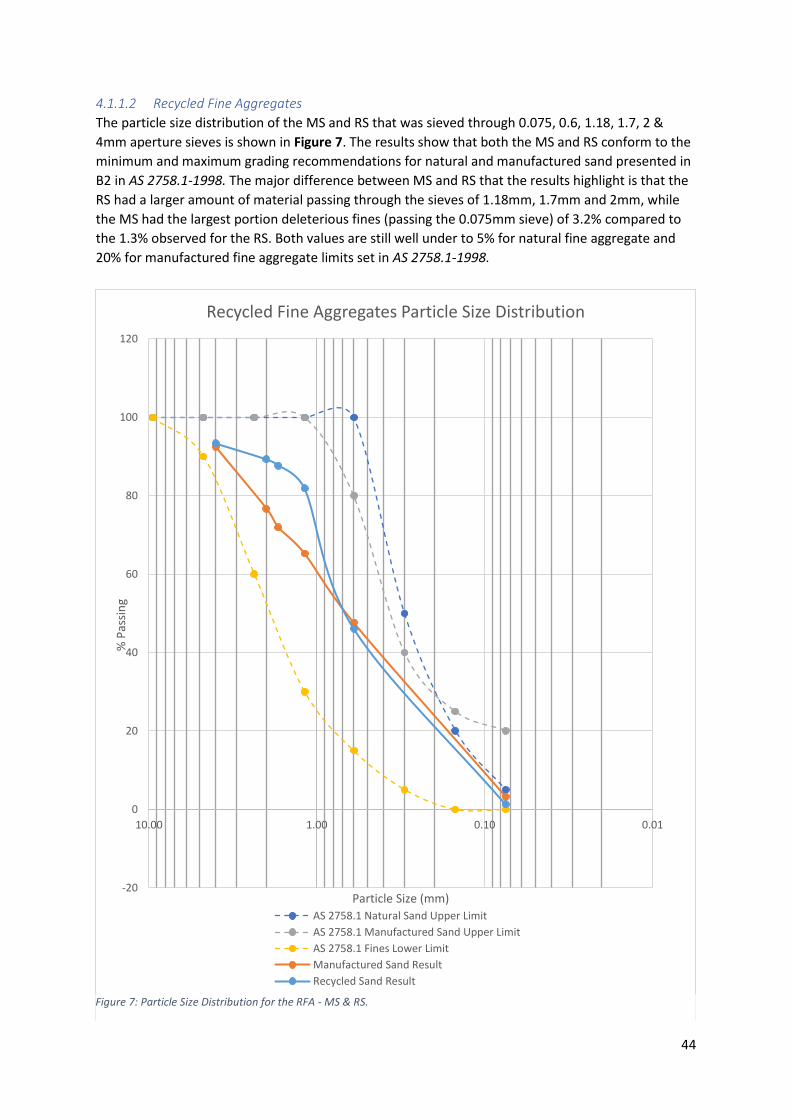
44
4.1.1.2 Recycled Fine Aggregates
The particle size distribution of the MS and RS that was sieved through 0.075, 0.6, 1.18, 1.7, 2 &
4mm aperture sieves is shown in Figure 7. The results show that both the MS and RS conform to the
minimum and maximum grading recommendations for natural and manufactured sand presented in
B2 in AS 2758.1-1998. The major difference between MS and RS that the results highlight is that the
RS had a larger amount of material passing through the sieves of 1.18mm, 1.7mm and 2mm, while
the MS had the largest portion deleterious fines (passing the 0.075mm sieve) of 3.2% compared to
the 1.3% observed for the RS. Both values are still well under to 5% for natural fine aggregate and
20% for manufactured fine aggregate limits set in AS 2758.1-1998.
-20
0
20
40
60
80
100
120
0.010.101.0010.00
% P
assi
ng
Particle Size (mm)
Recycled Fine Aggregates Particle Size Distribution
AS 2758.1 Natural Sand Upper Limit
AS 2758.1 Manufactured Sand Upper Limit
AS 2758.1 Fines Lower Limit
Manufactured Sand Result
Recycled Sand Result
Figure 7: Particle Size Distribution for the RFA - MS & RS.
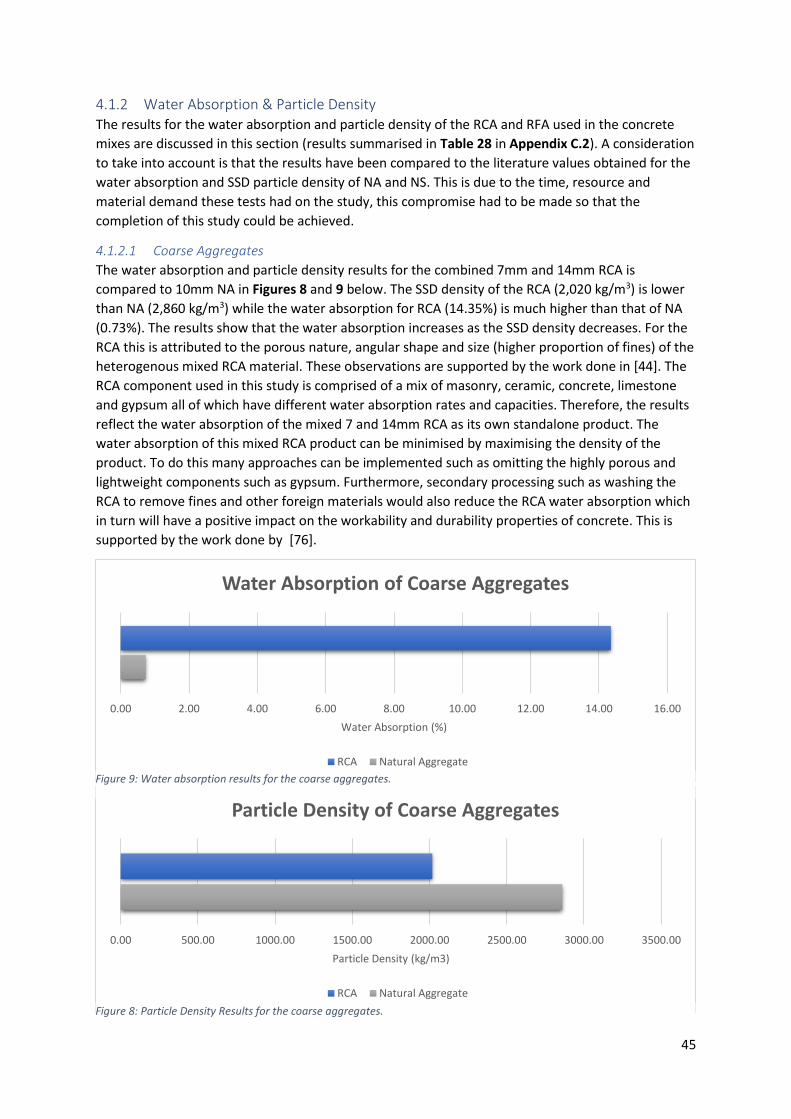
45
4.1.2 Water Absorption & Particle Density The results for the water absorption and particle density of the RCA and RFA used in the concrete
mixes are discussed in this section (results summarised in Table 28 in Appendix C.2). A consideration
to take into account is that the results have been compared to the literature values obtained for the
water absorption and SSD particle density of NA and NS. This is due to the time, resource and
material demand these tests had on the study, this compromise had to be made so that the
completion of this study could be achieved.
4.1.2.1 Coarse Aggregates
The water absorption and particle density results for the combined 7mm and 14mm RCA is
compared to 10mm NA in Figures 8 and 9 below. The SSD density of the RCA (2,020 kg/m3) is lower
than NA (2,860 kg/m3) while the water absorption for RCA (14.35%) is much higher than that of NA
(0.73%). The results show that the water absorption increases as the SSD density decreases. For the
RCA this is attributed to the porous nature, angular shape and size (higher proportion of fines) of the
heterogenous mixed RCA material. These observations are supported by the work done in [44]. The
RCA component used in this study is comprised of a mix of masonry, ceramic, concrete, limestone
and gypsum all of which have different water absorption rates and capacities. Therefore, the results
reflect the water absorption of the mixed 7 and 14mm RCA as its own standalone product. The
water absorption of this mixed RCA product can be minimised by maximising the density of the
product. To do this many approaches can be implemented such as omitting the highly porous and
lightweight components such as gypsum. Furthermore, secondary processing such as washing the
RCA to remove fines and other foreign materials would also reduce the RCA water absorption which
in turn will have a positive impact on the workability and durability properties of concrete. This is
supported by the work done by [76].
0.00 500.00 1000.00 1500.00 2000.00 2500.00 3000.00 3500.00
Particle Density (kg/m3)
Particle Density of Coarse Aggregates
RCA Natural Aggregate
0.00 2.00 4.00 6.00 8.00 10.00 12.00 14.00 16.00
Water Absorption (%)
Water Absorption of Coarse Aggregates
RCA Natural Aggregate
Figure 8: Particle Density Results for the coarse aggregates.
Figure 9: Water absorption results for the coarse aggregates.
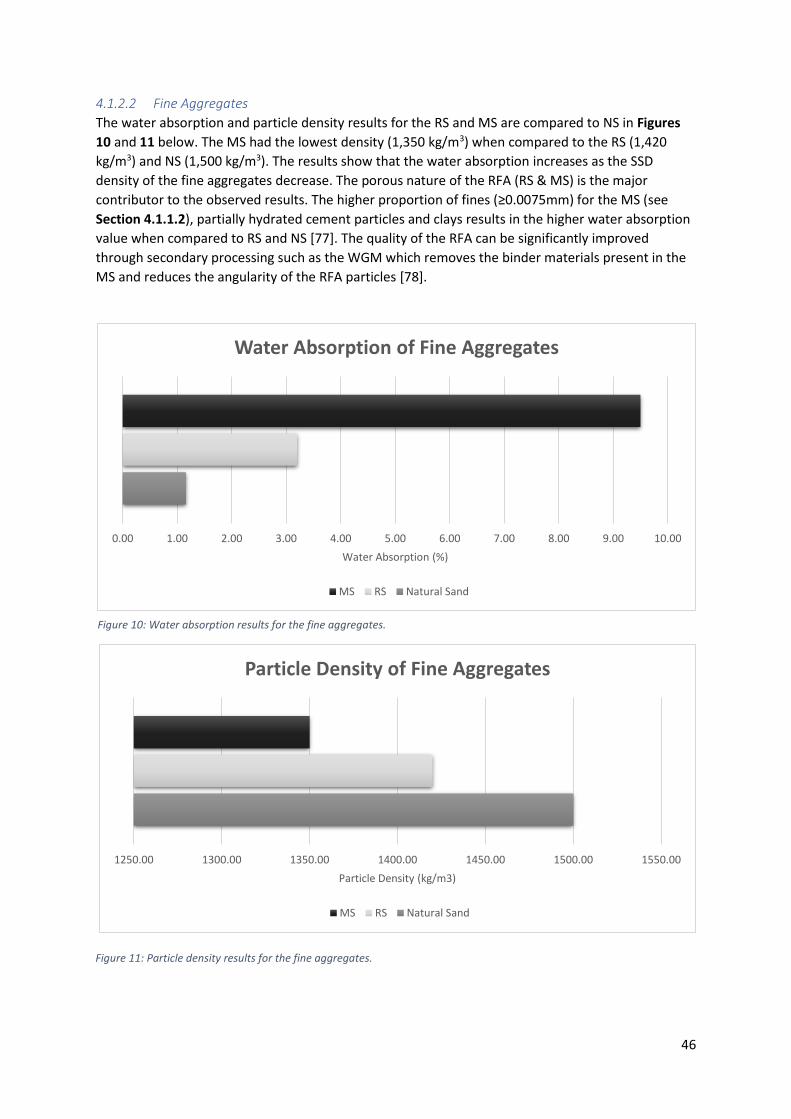
46
4.1.2.2 Fine Aggregates
The water absorption and particle density results for the RS and MS are compared to NS in Figures
10 and 11 below. The MS had the lowest density (1,350 kg/m3) when compared to the RS (1,420
kg/m3) and NS (1,500 kg/m3). The results show that the water absorption increases as the SSD
density of the fine aggregates decrease. The porous nature of the RFA (RS & MS) is the major
contributor to the observed results. The higher proportion of fines (≥0.0075mm) for the MS (see
Section 4.1.1.2), partially hydrated cement particles and clays results in the higher water absorption
value when compared to RS and NS [77]. The quality of the RFA can be significantly improved
through secondary processing such as the WGM which removes the binder materials present in the
MS and reduces the angularity of the RFA particles [78].
0.00 1.00 2.00 3.00 4.00 5.00 6.00 7.00 8.00 9.00 10.00
Water Absorption (%)
Water Absorption of Fine Aggregates
MS RS Natural Sand
Figure 10: Water absorption results for the fine aggregates.
Figure 11: Particle density results for the fine aggregates.
1250.00 1300.00 1350.00 1400.00 1450.00 1500.00 1550.00
Particle Density (kg/m3)
Particle Density of Fine Aggregates
MS RS Natural Sand
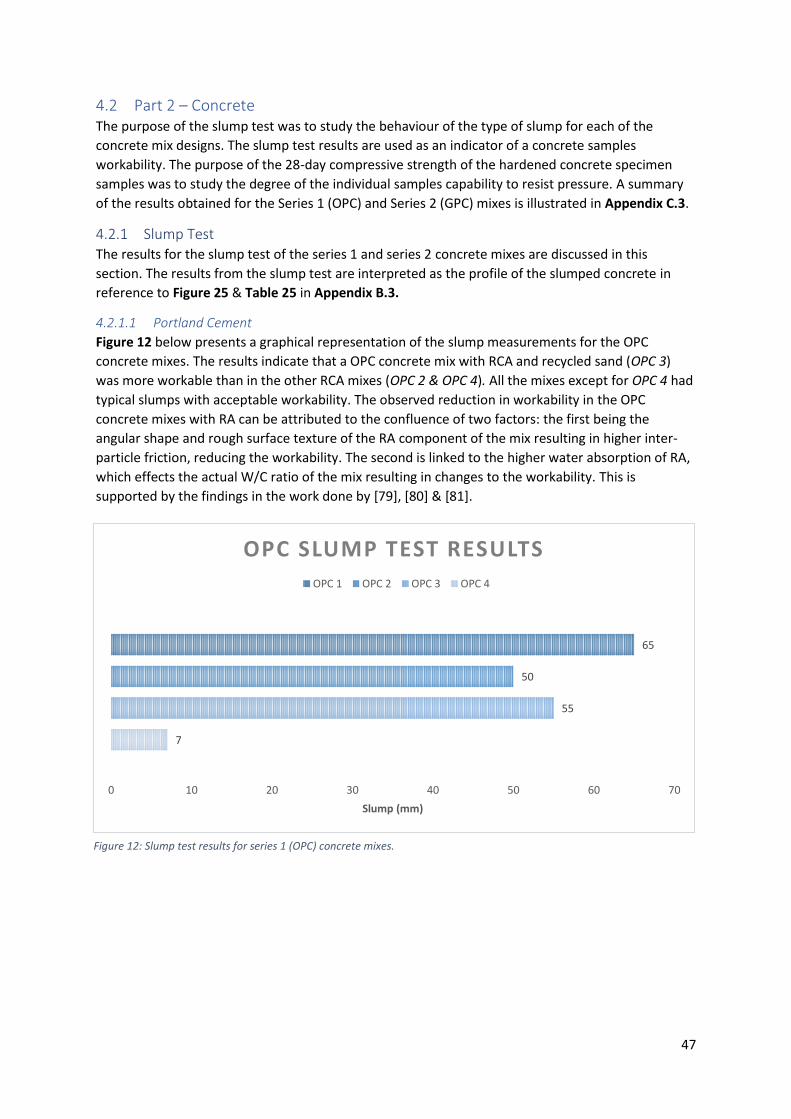
47
4.2 Part 2 – Concrete The purpose of the slump test was to study the behaviour of the type of slump for each of the
concrete mix designs. The slump test results are used as an indicator of a concrete samples
workability. The purpose of the 28-day compressive strength of the hardened concrete specimen
samples was to study the degree of the individual samples capability to resist pressure. A summary
of the results obtained for the Series 1 (OPC) and Series 2 (GPC) mixes is illustrated in Appendix C.3.
4.2.1 Slump Test The results for the slump test of the series 1 and series 2 concrete mixes are discussed in this
section. The results from the slump test are interpreted as the profile of the slumped concrete in
reference to Figure 25 & Table 25 in Appendix B.3.
4.2.1.1 Portland Cement
Figure 12 below presents a graphical representation of the slump measurements for the OPC
concrete mixes. The results indicate that a OPC concrete mix with RCA and recycled sand (OPC 3)
was more workable than in the other RCA mixes (OPC 2 & OPC 4). All the mixes except for OPC 4 had
typical slumps with acceptable workability. The observed reduction in workability in the OPC
concrete mixes with RA can be attributed to the confluence of two factors: the first being the
angular shape and rough surface texture of the RA component of the mix resulting in higher inter-
particle friction, reducing the workability. The second is linked to the higher water absorption of RA,
which effects the actual W/C ratio of the mix resulting in changes to the workability. This is
supported by the findings in the work done by [79], [80] & [81].
7
55
50
65
0 10 20 30 40 50 60 70
Slump (mm)
OPC SLUMP TEST RESULTS
OPC 1 OPC 2 OPC 3 OPC 4
Figure 12: Slump test results for series 1 (OPC) concrete mixes.
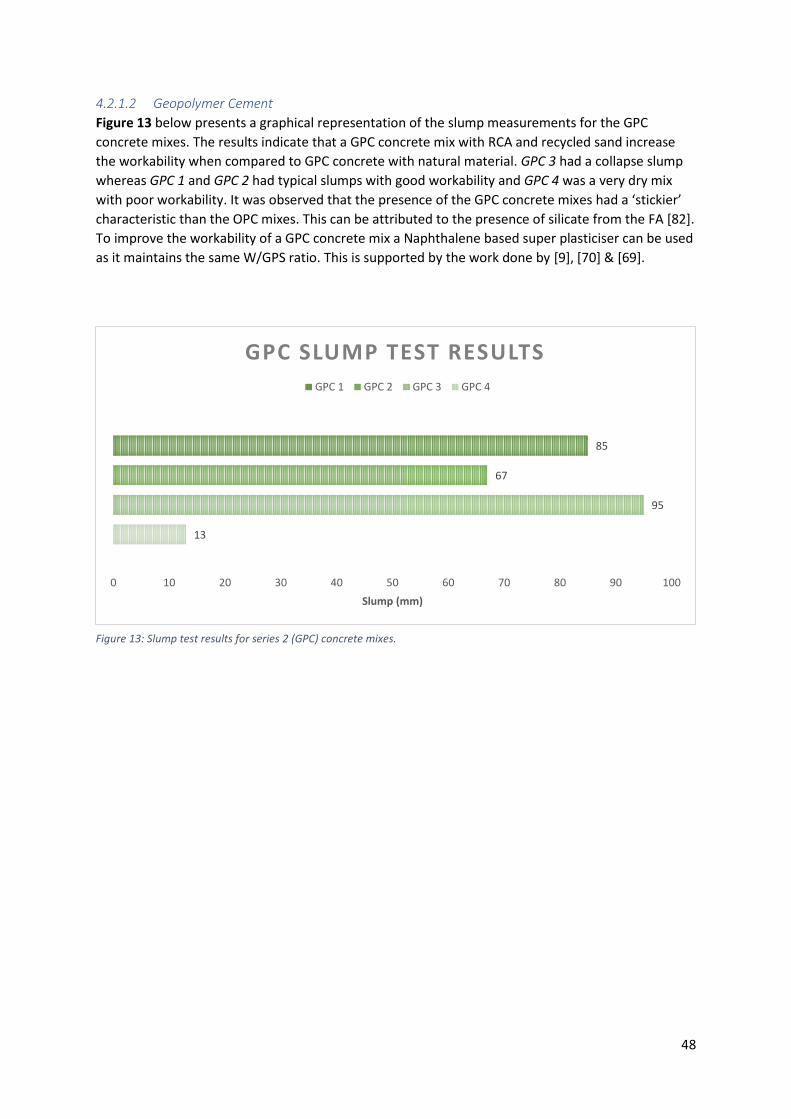
48
4.2.1.2 Geopolymer Cement
Figure 13 below presents a graphical representation of the slump measurements for the GPC
concrete mixes. The results indicate that a GPC concrete mix with RCA and recycled sand increase
the workability when compared to GPC concrete with natural material. GPC 3 had a collapse slump
whereas GPC 1 and GPC 2 had typical slumps with good workability and GPC 4 was a very dry mix
with poor workability. It was observed that the presence of the GPC concrete mixes had a ‘stickier’
characteristic than the OPC mixes. This can be attributed to the presence of silicate from the FA [82].
To improve the workability of a GPC concrete mix a Naphthalene based super plasticiser can be used
as it maintains the same W/GPS ratio. This is supported by the work done by [9], [70] & [69].
13
95
67
85
0 10 20 30 40 50 60 70 80 90 100
Slump (mm)
GPC SLUMP TEST RESULTS
GPC 1 GPC 2 GPC 3 GPC 4
Figure 13: Slump test results for series 2 (GPC) concrete mixes.
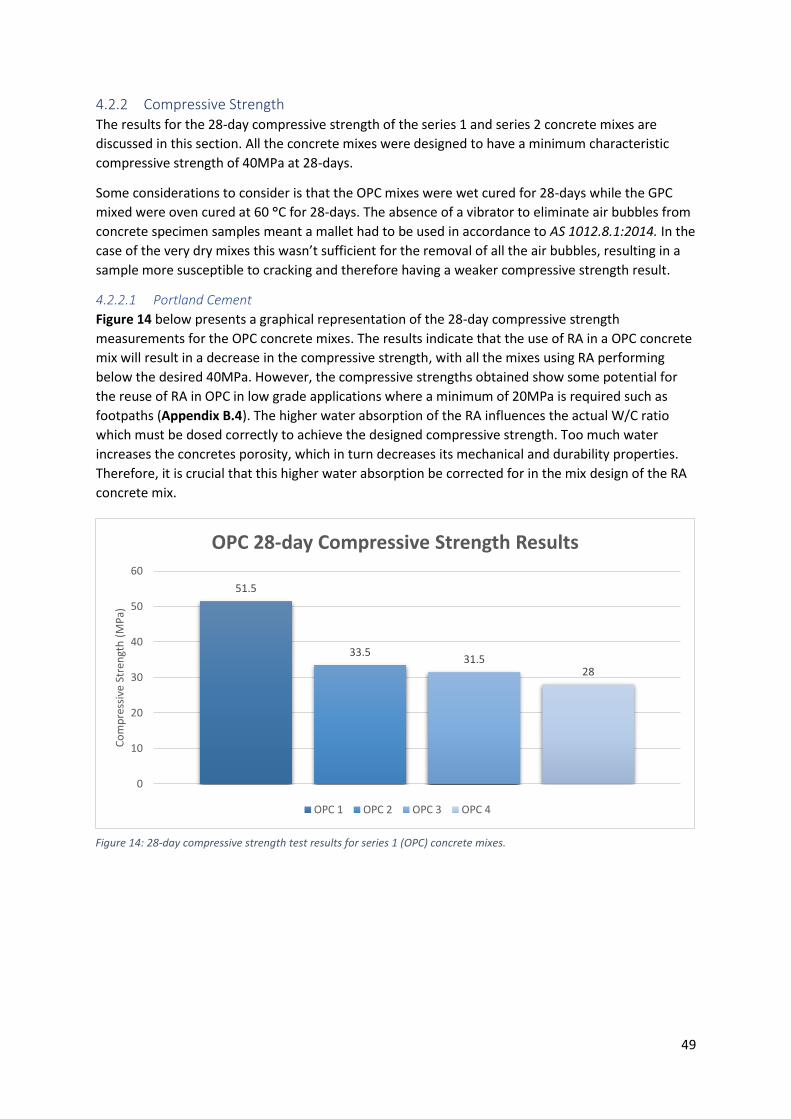
49
4.2.2 Compressive Strength The results for the 28-day compressive strength of the series 1 and series 2 concrete mixes are
discussed in this section. All the concrete mixes were designed to have a minimum characteristic
compressive strength of 40MPa at 28-days.
Some considerations to consider is that the OPC mixes were wet cured for 28-days while the GPC
mixed were oven cured at 60 °C for 28-days. The absence of a vibrator to eliminate air bubbles from
concrete specimen samples meant a mallet had to be used in accordance to AS 1012.8.1:2014. In the
case of the very dry mixes this wasn’t sufficient for the removal of all the air bubbles, resulting in a
sample more susceptible to cracking and therefore having a weaker compressive strength result.
4.2.2.1 Portland Cement
Figure 14 below presents a graphical representation of the 28-day compressive strength
measurements for the OPC concrete mixes. The results indicate that the use of RA in a OPC concrete
mix will result in a decrease in the compressive strength, with all the mixes using RA performing
below the desired 40MPa. However, the compressive strengths obtained show some potential for
the reuse of RA in OPC in low grade applications where a minimum of 20MPa is required such as
footpaths (Appendix B.4). The higher water absorption of the RA influences the actual W/C ratio
which must be dosed correctly to achieve the designed compressive strength. Too much water
increases the concretes porosity, which in turn decreases its mechanical and durability properties.
Therefore, it is crucial that this higher water absorption be corrected for in the mix design of the RA
concrete mix.
51.5
33.531.5
28
0
10
20
30
40
50
60
Co
mp
ress
ive
Stre
ngt
h (
MP
a)
OPC 28-day Compressive Strength Results
OPC 1 OPC 2 OPC 3 OPC 4
Figure 14: 28-day compressive strength test results for series 1 (OPC) concrete mixes.

50
4.2.2.2 Geopolymer Cement
Figure 15 below presents a graphical representation of the 28-day compressive strength
measurements for the GPC concrete mixes. The results indicate that the use of RCA in a GPC
concrete mix will results in a decrease in the compressive strength. The 28-day compressive strength
results obtained for the GPC mixes are linked to some experimental error. After sampling the GPC
specimens into the cylindrical moulds, they were placed in the oven for a minimum of 24 hours
before being demoulded, after which they will be returned to the oven for the remainder of the 28-
day curing period. This was done so that the GPC specimens do not stick to mould as in the case of
the initial trials which resulted in an extremely difficult demoulding procedure. It is possible that the
compressive strength result for all the series 2 mixes can be attributed to the demoulding process as
cracks were observed on the sample after demoulding. To amend these errors, work into ambient
curing should be explored to eliminate the issues linked to demoulding the oven cured specimens. It
is also suggested in the literature that the use of a Naphthalene based super plasticiser has positive
results for high early strength properties by lowering the W/GPS ratio. Furthermore, appropriate
mix design for both the chemical component and the solid material component of a GPC mix are
required by considering the water absorption and SSD density values obtained in Section 4.1.2 for
the aggregates and sand. Beneficiation of the FA has also been proven to produce a higher strength
GPC concrete since this increases the reactivity of the FA. Time and material limitations resulted in
the GPC mixes not being replicated.
11.9
3.5
0.9
6.3
0
2
4
6
8
10
12
14
Co
mp
ress
ive
Stre
ngt
h (
MP
a)
GPC 28-day Compressive Strength Results
GPC 1 GPC 2 GPC 3 GPC 4
Figure 15: 28-day compressive strength test results for series 2 (GPC) concrete mixes.
51
4.3 Summary of Findings The higher water absorption values obtained for RCA, MS and RS can be attributed to the decreases
in particle size fraction and SSD density. Few methods have been presented in the literature on how
to reduce the water absorption of RA which in turn will have an improved effect on the workability
and compressive strength of a concrete mix using RA. These include mix design compensation,
removal of fines and lightweight foreign material, reduced angularity of aggregate shape and
Improvements to the porosity of the RA.
Overall, the use of RA in GPC concrete mixes had better workability than in OPC concrete mixes. The
use of MS in the RAC results in a very dry mix for both OPC and GPC. The use of RS in RAC results in a
mix that had better workability than RAC with NS for both OPC and GPC.
The main findings from the compressive strength results are that RCA result in a decrease in the
compressive strength of OPC concrete due to the weaker bonds between the particles & cement
matrix – direct result of the altered W/C ratio. OPC concrete using RA met the compressive strength
requirements for ordinary concrete (25MPa) applications such as slabs, beams, columns & footings.
The GPC mix using MS had a better compressive strength than the GPC mix using NS & RCA –
highlighting the suitability of MS over natural sand in GPC concrete. Since the RCA and MS are both
produced from the same processed C&D product (20mm road-base) the only secondary processing
required to conform meet the Australian Standards for concrete aggregates is to sieve the material
through a 5mm sieve to separate the coarse and fine aggregate components.
52
5 Discussion This section seeks out to determine the suitability of using RA in geopolymer concrete by critically
analysing and evaluating the suitability of establishing a sustainable concrete industry in WA using
RA and FA aswell as to provide recommendations for the optimisation and integration of a FGRAC
product in WA.
5.1 Suitability of establishing a sustainable concrete industry in WA using RA and FA The suitability of establishing a sustainable concrete industry in WA has be determined based on the
technical implications, sustainability and economic outcomes of manufacturing geopolymer concrete
in WA.
5.1.1 Technical Outcomes Based on the compressive strength results from this study pertaining to the suitable applications of
RA and FA in concrete can be individually analysed for the different applications of RAC, GPC
concrete and the combination of the two – FGRAC. The compressive strength results for the RAC
specimens achieving values of up to 33MPa, meeting the criteria for Normal-Class concrete, with
defined 28-day strength grades of 20MPa, 25MPa & 32MPa (N20, N25 and N32 respectively). The
suitable applications of these products are in footpaths, patios, garden shed floors, roads, carparks
and driveways [83]. The results of this study suggest that GPC concrete can be used in ordinary
concrete N10 applications such as levelling of bedding for footings and concrete roads. This is
supported by the work done [84] which explores low specification geopolymer concrete products
such as pavers and retaining wall blocks. However it has been identified that much stronger
strengths can be obtained, with some samples of geopolymer concrete in the literature achieving
compressive strength of up to 100MPa [71], making it suitable for Special-Class concrete where high
strength and high performance concretes are required [83]. Additionally, findings from the literature
suggest that geopolymer concrete is especially more resistant to chloride ion penetration, making it
suitable for use in corrosive environments such as in coastal applications [60]. Artificial reef units are
a product that have been identified that can be potentially made from geopolymer concrete in WA.
Correspondence with a manufacturer of these structures uncovered that currently the geopolymer
material used in these artificial reef units used along the WA coastline are sourced from the
Netherlands, resulting in expensive shipping costs. Using the locally available materials to produce
these products will positively improve the carbon footprint of these aquatic structures. Furthermore,
many concrete structures start to deteriorate after 20 – 30 years despite being designed for a service
life of around 50 – 100 years. According to the literature this mostly occurs in corrosive
environments where chloride attack deteriorates the steel reinforcement within the concrete
structures [85]. Therefore by using geopolymer concrete, not only are the climate impacts greatly
reduced in terms of GHG emissions, but the product lifespan can also be increased.
5.1.2 Sustainability Outcomes Given WA’s annual concrete production rate of 6 million tonnes per year [3], the current generation
rates of 300,000 tonnes per year of FA [5] and 970,000 tonnes per year of RA [1] are sufficient to
secure a production rate of 540,000 tonnes per year of geopolymer concrete, in turn contributing to
the Waste Strategy 2030 recovery target of 80%. In addition to the estimated 12 million tonnes of FA
in storage dams [55], a sustained operation of 40 years can be potentially achieved using the same
production rate of geopolymer concrete – certifying confidence that this product can be produced
even after the coal fired power station units are shut down. It is expected that 30 workers will be
affected when Muja C unit 5 goes offline in late 2022 and a further 40-50 workers when Muja C unit
53
6 in late 2024 [86]. A new sustainable concrete industry in Collie can have a significant contribution
to a transition strategy for the transition to renewable energy by providing a unique new job
opportunity for many of these displaced workers. In addition to this, to guide Collie’s transition,
education programs can be set up at the local TAFE and high school to equip the younger community
with the skills required to work with geopolymer concrete. Once established, this skilled workforce
can lead the path for its use as more people become familiar with this new product in the
neighbouring regions such as Bunbury, Busselton and Perth.
5.1.3 Economic Outcomes To revive the post-pandemic economy of Australia, shovel-ready projects have been prioritised. One
such project is the $852 million Bunbury Outer Ring Road (BORR) project expected to commence in
2021 [87]. This presents an ideal opportunity to study how geopolymer concrete sound barriers and
retaining walls perform in application using the FA from Collie and RA from Peel Resources located in
Australind. Also located in Australind is MJB Industries who specialise in pre-cast concrete products
such as panels, retaining walls and road barriers7. Evidence based applications of geopolymer
concrete is the most powerful way of pioneering a path for securing confidence in developers and
builders. This approach is currently followed by Wagners and their EFC products, who are leading the
charge in the Eastern States of Australia and secured market confidence through external product
verification. The BORR project will be the biggest infrastructure project undertaken in the southwest
of WA. This 27 km, four-laned highway is one of the fast-tracked regional projects that boost the
economy by supporting local jobs immediately, with a major driver of this project being its potential
to kick start the economy recovery because of the COVID-19 pandemic. By integrating a sustainable
concrete industry to manufacture the high volume pre-cast components required, around 50
immediate new jobs will be unlocked in the Collie, Bunbury and Australind areas [6], in addition to
the thousands expected to be generated for the BORR project [87]. Not only are the benefits linked
to the generation of local jobs, but the environmental savings are significant in terms of landfill
avoidance, natural material assets and GHG emissions. It has been stated that around 18 Olympic
sized swimming pools of concrete are estimated to be required for the construction of the BORR
[88]. Based on the mix design used for the geopolymer concrete samples in this study over 10,000m3
of FA and 34,000m3 of RA can be utilised to create the cementless geopolymer concrete product that
that can have a potential GHG reduction of around 80% compared to conventional concrete [9].
Furthermore, it is estimated that around 6.5 times of the volume of Optus stadium of fill is required.
This amounts to 6 million m3 [88] which can make a significant contribution to reusing and adding
value to the stockpiles of processed C&D material currently available in WA – estimated to be
around 1 million m3 [4]. Lessons learnt from the 2019 Roads to Reuse (RtR) Pilot project facilitated by
MRWA and the WA Waste Authority can induce confidence also as the well documented progress
reporting and outcomes of this project highlight the key benefits of using recycled C&D material.
This can have a further positive impact on landfill avoidance and reduced stress on natural material
assets that are traditionally used in infrastructure projects.
The BORR project is just one hypothetical method for the reuse of RA and FA to make geopolymer
concrete in the South-West of WA. There are many other potential scenarios such as the artificial
reef product mentioned previously. Figure 16 below illustrates a Supply Chain Analysis (SCA) for the
integration of geopolymer concrete in WA which outlines the different options available based on
source material procurement, concrete batching facility, accessibility of pre-cast facility and
application of the final product. The major consideration that influences cost is the transportation
logistics as there are many options available whether it be by rail, truck or ship at many different
7 https://mjbindustries.com/

54
stages of manufacturing the geopolymer concrete product. In summary, two supply chains have
been identified for both the Perth metro region and the south-west of WA. Using the FA available in
Kwinana that is of the same quality as the FA sourced from Collie aswell as RA from one of the many
CDW recyclers a batching plant in Kwinana can produce the geopolymer concrete and send it to a
pre-cast facility to make the fit-for-purpose products for coastal or road infrastructure projects. The
other option is to establish a batching plant at either Shotts or Kemerton industrial parks depending
on factors such as FA transportation, RA availability and proximity to pre-cast facility, which again
can make the fit-for-purpose products for coastal or road infrastructure projects. The latter case
would support the use of geopolymer concrete products in the BORR project mentioned previously.
Figure 16: Proposed supply chain of geopolymer concrete in WA.
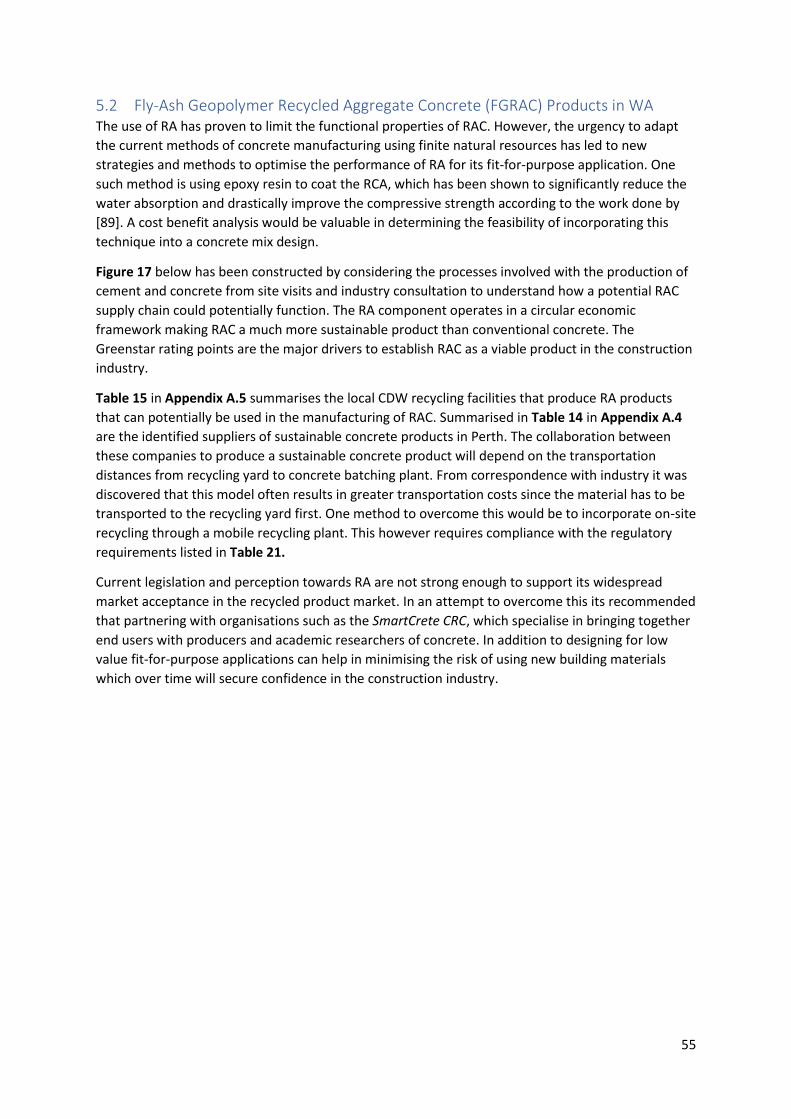
55
5.2 Fly-Ash Geopolymer Recycled Aggregate Concrete (FGRAC) Products in WA The use of RA has proven to limit the functional properties of RAC. However, the urgency to adapt
the current methods of concrete manufacturing using finite natural resources has led to new
strategies and methods to optimise the performance of RA for its fit-for-purpose application. One
such method is using epoxy resin to coat the RCA, which has been shown to significantly reduce the
water absorption and drastically improve the compressive strength according to the work done by
[89]. A cost benefit analysis would be valuable in determining the feasibility of incorporating this
technique into a concrete mix design.
Figure 17 below has been constructed by considering the processes involved with the production of
cement and concrete from site visits and industry consultation to understand how a potential RAC
supply chain could potentially function. The RA component operates in a circular economic
framework making RAC a much more sustainable product than conventional concrete. The
Greenstar rating points are the major drivers to establish RAC as a viable product in the construction
industry.
Table 15 in Appendix A.5 summarises the local CDW recycling facilities that produce RA products
that can potentially be used in the manufacturing of RAC. Summarised in Table 14 in Appendix A.4
are the identified suppliers of sustainable concrete products in Perth. The collaboration between
these companies to produce a sustainable concrete product will depend on the transportation
distances from recycling yard to concrete batching plant. From correspondence with industry it was
discovered that this model often results in greater transportation costs since the material has to be
transported to the recycling yard first. One method to overcome this would be to incorporate on-site
recycling through a mobile recycling plant. This however requires compliance with the regulatory
requirements listed in Table 21.
Current legislation and perception towards RA are not strong enough to support its widespread
market acceptance in the recycled product market. In an attempt to overcome this its recommended
that partnering with organisations such as the SmartCrete CRC, which specialise in bringing together
end users with producers and academic researchers of concrete. In addition to designing for low
value fit-for-purpose applications can help in minimising the risk of using new building materials
which over time will secure confidence in the construction industry.
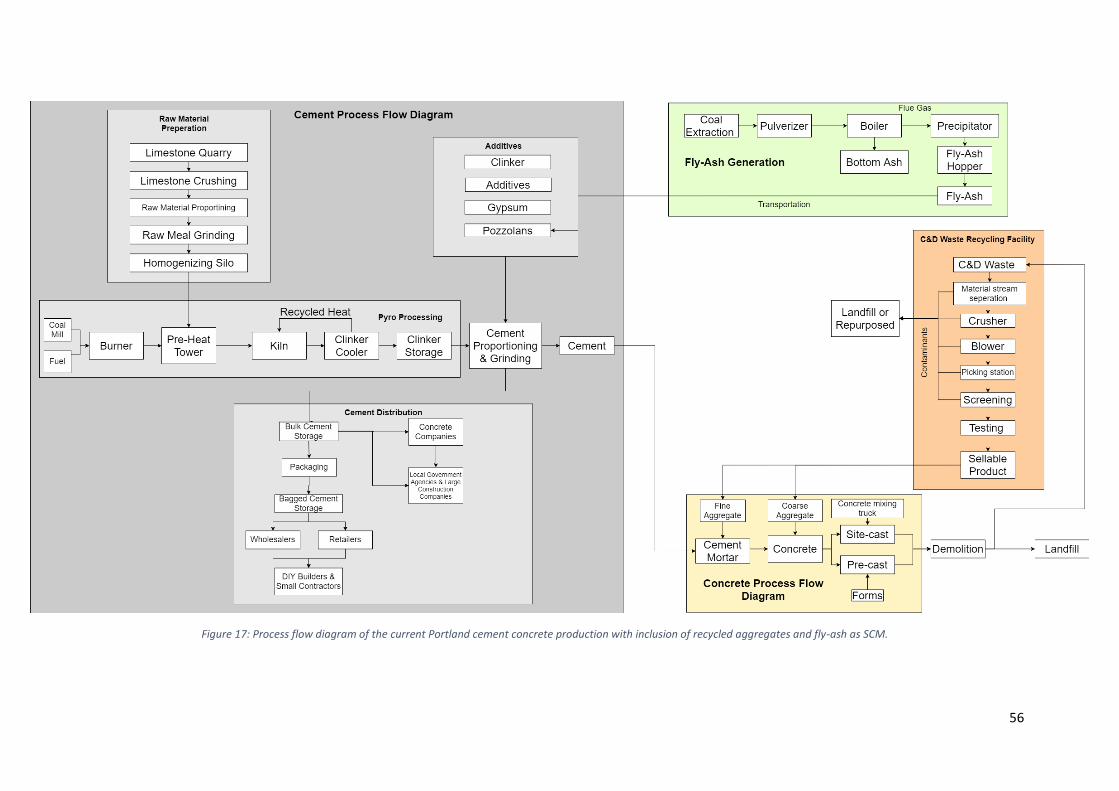
56
Figure 17: Process flow diagram of the current Portland cement concrete production with inclusion of recycled aggregates and fly-ash as SCM.
57
Figure 18 below illustrates the process flows of producing geopolymer concrete using the FA from
Collie and RA from CDW recyclers. Consistent and reliable supply for both the FA and RA can be
assured considering the large annual production rates and enormous stockpiles of each in WA. As for
the quality of both source materials, there is some with variability because of the heterogenous
nature of both materials. Two potential approaches to overcome this have been identified. The first
is to further process the materials such as sieving for the RA and pre-treatment of the FA to generate
a more consistent and higher quality product. The other is through a specification that lists the
material and uniformity requirements of the source materials for geopolymer based concrete on its
fit-for-purpose application. For example, given the higher compressive strength of NA over RA in
geopolymer concrete the specification might list that for an application where high strength is
required (80MPa) NA must be used with NS – this product may be called Natural Aggregate
Geopolymer Concrete (NAGPC). However, for low value pre-cast applications where 20MPa is
required (e.g. pavements) RA are promoted. This will require FGRAC having its own set of standards
and specifications aimed at the fit-for-purpose applications. From this, classifying the RA products
into categories such as CRC, MRA & RMA and RS & MS, where the definitions and quality parameters
are clearly specified, would provide confidence in the end users as this addresses the ambiguity and
uncertainty associated with RA.
In this study a 5mm sieve was used to recover the RCA and MS materials used in the mixes. Both
materials met the grading recommendations. Given both materials originate from the same stockpile
(20mm recycled roadbase) presents an opportunity where the recycled roadbase could potentially
be suitable for direct reuse in geopolymer concrete, making it a very attractive option based on the
economic and sustainability benefits.
Due to the sensitive chemistry of geopolymer concrete, the alkali chemical dosing and mix design are
required to be very precise which may present a challenge for workers that are used to the robust
nature of conventional concrete. Therefore, not only is it important to consider a skilled geopolymer
concrete workforce, but this offers a unique situation where the geopolymer concrete mix can
remain dormant up until the point the alkali activator is added – this can be of benefit if the
transportation distances are a major consideration since no chemical admixtures would be required
to prevent the concrete from setting.
The elevated temperatures required for curing of geopolymer concrete limits its application to pre-
cast products. A pre-cast curing method that would avoid the costs of high temperature curing
would be to use the excess heat from the heat exchangers from the Synergy or Bluewaters power
stations in Collie. Other curing methods have been explored in the literature (Table 9). The use of
GGBFS seems to be the most promising as this is the most researched and has been applied in
practice8. Greenstar Ratings taking into consideration the life cycle processes will be the major
drivers to establish a market for geopolymer concrete since the GHG emission reductions can be
quite significant when compared to the conventional methods for concrete production. The design
of Eco-houses using geopolymer concrete may present a unique opportunity. Recent innovative
work done in California where an integrated thermal mass system using hydroponic tubes circulating
heated water were embedded within the geopolymer pre-cast concrete wall panels. This allowed for
in-situ curing, with the additional benefit to the passive house design of the structure, by allowing
the geopolymer concrete features to perform like thermal batteries. This has potential in WA given
8 Wagners is able to cure their EFC product at ambient temperatures since they use the blending GGBFS with class F FA.

58
the Mediterranean climate in addition to the uptake of eco-houses, with entire suburbs dedicated to
such developments such as the White Gum Valley (WGV) estate.
There is also further potential to reduce the carbon footprint of geopolymer concrete through the
utilisation of another industrial waste-product – bauxite residue (BR). Recently it was uncovered that
this material can be potentially replaced for NaOH in GPC mix [90]. This will make the Na2SiO3 the
only non-waste material used in the production of geopolymer concrete. The resulting product will
be red in colour, which from a marketing perspective has some benefits for decorative concrete for
example. This required further investigation to fully understand the implications and opportunities
linked to the application of BR in geopolymer concrete.
59
Figure 18: Proposed process flow diagram for geopolymer concrete in WA.
60
5.3 Limitations & Lessons Learnt The limitations on the collection of data and resulting lessons learnt in this study include:
▪ Demoulding of the geopolymer concrete samples was extremely difficult since the specimens
were found to “stick” to the moulds. Care was taken to be as gentle as possible. This still
resulted in some specimens cracking, chipping, and fracturing creating an experimental
inconsistency. Ambient curing methods should be investigated and followed to prevent this.
▪ Access to the full gamut of aggregate and concrete testing equipment was limited, which in turn
had an impact on the quality of the concrete specimens produced. The use of mechanical
vibrators to agitate the concrete samples for example would have eliminated all the air bubbles
allowing for more consistency between the concrete samples.
▪ The high demand for the use of the aggregate sieves used to conduct the particle size
distribution curves in addition to the time demand these tests had, resulted in multiple stages of
the data collection phases of this study being delayed. It was important to sieve enough material
so that all the concrete samples could be made. Given the 12-hour window of which these sieves
were available for use created a logistical situation that was navigated through extensive pre-
planning and cooperation with lab technicians.
▪ The order in which this study was conducted was restricted by materials, resources and time
limitations which resulted in the concrete component being conducted before the water
absorption results for the coarse and fine aggregates were obtained. This therefore meant that
literature values had to be used for the RCA during the mix design phase. In future works the
water absorption and SSD density values should be incorporated into the mix design to
successfully achieve the characteristic design strength of the concrete mix.
▪ Structural grade (40MPa) geopolymer was not achieved in this study. This can be attributed to
mix design & the method of curing. Additionally, super plasticiser can be used as this is a
common method used to improve both the workability and compressive strength of concrete. It
does this by effecting the W/GPS ratio, resulting in a lower requirement of water to be used.
Therefore, it is stressed that the results obtained for geopolymer concrete in this study are not
an accurate representation of geopolymer concrete performance when compared to what has
been achieved and trailed in practice. More work is required to achieve structural grade FGRAC
samples. However, the findings suggest that MS would be more suitable in a FGRAC mix than NS.
61
6 Conclusion & Recommendations In this study the scope for the reuse of locally available RA and FA in both OPC and GPC concrete has
been determined. In addition to an extensive literature review, aggregate particle size distribution
and water absorption aswell as concrete slump and compressive strength testing was done.
The FGRAC results are linked to a degree of experimental error and are therefore not an accurate
representation of geopolymer concrete performance when compared to what has been done and
trailed in practice – this requires further investigation.
The results from this study demonstrate that the higher water absorption values obtained for RCA,
MS and RS can be attributed to the decreases in particle size fraction and SSD density. Overall, the
use of RA in GPC concrete mixes had better workability than in OPC concrete mixes. The use of MS in
the RAC results in a very dry mix for both OPC and GPC. The use of RS in RAC results in a mix that had
better workability than RAC with NS for both OPC and GPC. Finally, the GPC mix using MS had a
better compressive strength than the GPC mix using NS & RCA.
62
6.1 Project Aim & Objectives Addressed The specific objectives addressed in this study are:
Objective 1: Review the literature relating to the reuse of RA and FA in concrete. This was achieved
during the literature review stage of this study. To summarise the findings, it was found that both
materials have been well explored with case studies available to support confidence in the
application of these products in the manufacturing of low-carbon concrete. The benefits of reduced
waste sent to landfill, reduced stress on natural material assets and reduced carbon footprint of RA
in concrete are overshadowed by a decrease in the mechanical and durability properties of RAC.
With only around 20% of the FA in WA being repurposed for beneficial use, the growing stockpiles of
this untapped resource in Collie can be used to synthesise GPC which currently only commercialised
by one company in the Eastern states of Australia.
Objective 2: Investigate the current CDW management practices in WA. This was achieved during the literature review stage of this study. Due to a lack of market acceptance processed C&D material is currently stockpiled at numerous sites in the Perth metro region. This poor market acceptance can be largely attributed to the uncertainty revolving around whether a material is a waste or not as a result of the Eclipse decision. A fit-for-purpose legislative framework which aims to address this uncertainty is currently under amendment by DWER. From a market development perspective, it has been suggested that a higher demand is required from the ultimate customer. This is achievable through Greenstar rating drivers and mandating of recycled materials in construction and civil development projects.
Objective 3: Test the particle size distribution, water absorption and particle densities for the RCA, RS
and MS. This was successfully achieved during the data collection stage of this study. The findings
from particle size distribution tests were that the RCA, MS and RS met the grading recommendations
set out in the Australian Standards for concrete aggregates (AS 2758.1 – 2004). The water absorption
results for the RA were significantly higher than the natural material. This is attributed mostly to the
porous nature, presence of fines and binder materials. From the water absorption and particle
density results it was found that the water absorption of the RA can be minimised by maximing the
particle density which can be achieved by removing the gypsum found in the RCA for example.
Objective 4: Develop RAC specimens with a design compressive strength of 40MPa for both Ordinary
OPC and GPC concrete. This was developed during the methodology stage of the study. This
objective was however not fully met, with only 1 out of the 8 samples achieving the structural grade
(40MPa) compressive strength. This can be attributed to mix design (DOE British Method) incorrectly
accounting for the higher water absorption values of the RA used, which would have influenced the
W/C and W/GPS ratios for the OPC and GPC concrete mixes respectively.
Objective 5: Collect and analyse the data on the workability and compressive strength of OPC and
GPC RAC specimens. This was successfully achieved during the data collection stage of this study. The
headline findings from the slump test results was that the use of RA decreased the workability of a
concrete mix. The use of MS resulted in a concrete mix that was very dry and had poor workability
for both OPC and GPC concrete while the use of RS in RAC resulted in a mix that was more workable
than a mix using RCA and NS for both OPC and GPC concrete. From the compressive strength testing
results it was found that the use of RCA decreased the compressive strength of OPC concrete due to
the weaker bond between the particles and cement matrix. A GPC RAC mix using MS was also found
to have a better compressive strength than a GPC concrete mix with NS and RCA – highlighting the
suitability of MS in geopolymer concrete.
63
Objective 6: Evaluate the suitability of establishing a sustainable concrete industry in WA using RA
and FA. This was successfully achieved during the discussions chapter of this study by using the
findings from the literature review, informal consultation with industry and critical evaluation of the
results obtained. To summarise, the manufacturing of geopolymer concrete is a two-fold solution,
addressing both the problem of stockpiling and storing RA and FA but also has the potential to
drastically reduce the carbon footprint of a development or construction project. Furthermore, a
geopolymer concrete industry also serves as a great candidate to aid Collie’s transition to renewable
energy by generating 50 immediate new jobs softening the blow this will have on the coal fired
power station work force expected to be effected.
Objective 7: Recommend approaches for the optimisation and integration of a FGRAC product. This
was successfully achieved during the discussions chapter of this study by using the findings from the
literature review, informal consultation with industry and critical evaluation of the results obtained.
In summary FGRAC can be integrated into the current concrete market through specific focus on low
fit-for-purpose applications of geopolymer concrete, such as the low-value pre-cast structures such
as sound barriers and road retaining walls for the BORR project. The optimisation for a FGRAC
product will require the use of a super-plasticiser in the mix and should incorporate ambient curing
methods.
64
6.2 Recommendations & Future Work It its recommended that secondary treatment of RA be implemented to improve the performance of
RA. It is recommended that ambient curing methods, super plasticisers and FA pre-treatment be
considered for the development of a high quality geopolymer concrete product. It is also suggested
that the mix designs for different RA combinations in geopolymer concrete be developed based on
fit-for-purpose, low value applications such as pre-cast sound barriers and sound walls. Lastly, its
recommended that partnering with organisations such as the SmartCrete CRC can significantly assist
in guiding the geopolymer concrete transition from lab scale to industry scale.
6.2.1 Future Work Some future work that has been identified because of this study include:
▪ Hemp based geopolymers – The southwest has some manufactures of hemp products.
Combining the waste products from this industry and combining it with geopolymer technology,
new ‘hemp-crete’ products could be developed.
▪ Bauxite residue – The chemical composition of BR may be suitable to replace the NaOH
component in geopolymer concrete. With this being available in abundance in Collie (6 million
tonnes per year), further benefits to waste management can be achieved, while also producing a
unique product.
▪ Epoxy resin coated RCA in geopolymer concrete – although shown to significantly improve the
properties of concrete, a cost benefit analysis determining the feasibility of this technique in WA
is required.
6.3 Summary Statement Laboratory scale application of geopolymer concrete is an extensively researched topic. However,
there is an extreme lack of industrial scale geopolymer concrete projects around the world. It was
found to be surprising that a geopolymer concrete industry hasn’t already been established in WA
considering the high number of research papers produced from Curtin University on Collie fly-ash
geopolymer concrete – with results showing that geopolymer concrete is comparable, if not better
than conventional concrete. Disregarding private funding, the capital required to establish a
geopolymer concrete industry can be obtained from the readily available R&D funding and
government grants that support innovate low-carbon footprint products.
It is suggested that the concrete products be designed for a fit-for-purpose low value applications
such as sound barriers and concrete retaining walls. These pre-cast concrete structures are ideal for
geopolymer concrete since the curing methods are best suited for pre-cast applications due to the
elevated temperatures required. Furthermore, the proximity and frequent interaction with the
Bunbury port allows for the option of transporting geopolymer concrete internationally. The
reduced performance linked to the use of recycled materials in concrete can be overcome through
varies methods. The value of a Recycled Aggregate Geopolymer concrete industry in Collie comes
down to the resulting environmental, social and economic benefits such an industry can have on
supporting Collie’s transition from coal fired power stations to renewable energy, while making use
of the stockpiled recycled material which lead to costly and environmental issues if not used.
65
References
[1] Perryman, G. & Green, S., “Recycling Activity in Western Australia 2017 - 18,” Waste Authority,
Brunswick Heads NSW, 2019.
[2] “Waste Authority Annual Report,” Government of Western Australia , Joondalup , 2019.
[3] Ryan, P., “Review of the concrete market in the Western Australian and Northern Territory
Resources and Related Infrastructure Sectors,” Cement Concrete & Aggregate Australia, 2012.
[4] Beyer, D. & Cooper, G., “WA Construction Resources - Recovered Construction & Demolition
Materials Resource Guide,” Perth, 2020.
[5] Goodbourn, C, “Amendment Notice L6637/1995/15,” DWER, Perth, 2018.
[6] “Collie at the Crossroads,” Beyond Zero Emissions Inc. , Melbourne , 2019.
[7] Malhorta, V., “Sustainable Development & Concrete Technology,” ACI Concrete International,
pp. 7-22, 2002.
[8] McCaffrey, R., “Climate Change and the Cement Industry,” GCL Environmental Special Issue,
2002.
[9] Hardjito, D. & Rangan, B., “Development and Properties of Low-Calcium Fly Ash-Based
Geopolymer Concrete,” Curtin University of Technology, Perth, 2005.
[10
]
Waste Authority, “WARR Strategy 2030,” DWER, Perth, 2020.
[11
]
“National Waste Report,” Environmental Protection & Heritage Council , Adelaide , 2010.
[12
]
Knoeri, C., Binder, C. & Althaus, H., “Decisions on recycling: Construction stakeholders decisions
regarding recycled mineral construction materials,” Elsevier, 2011.
[13
]
A.-C. Broughton, “C&D Markets Buil Upon Base,” Recycling Today, 2001.
[14
]
Townsend, T., “Benefits of Construction & Demolition Debris Recycling in the United States.,”
Construction & Demolition Recycling Association, Florida, 2017.
[15
]
Tam, V. Soomro, M. & Evangelista, A., “A Review of Recycled Aggregate in Concrete
Applications (2000-2017),” Construction & Building Materials, pp. 272-292, 2018.
[16
]
Murray, R., “Construction and demolition waste in Western Australia: A case study on best
practice demolition,” Murdoch University, Perth, 2019.
[17
]
Rawnsley, C., “Issues paper: Waste not, want not: Valuing waste as a resource,” Department of
Water and Environmental Regulation, Perth, 2019.
66
[18
]
I. Tung, “Construction and demolition waste in Western Australia: Applications of existing
methods to measure demolition waste,” Murdoch University, Perth, 2020.
[19
]
C. Harris, “A supply chain analysis of construction and demolition waste streams in Perth,
Western Australia,” Murdoch University, Perth, 2017.
[20
]
J. R. P. T. J. &. B. G. Pickin, “National Waste Report,” Blue Environment, 2018.
[21
]
Edge Environment Pty Ltd, “Construction and Demolition Waste Guide - Recycling and Re-use
Across The Supply Chain,” Depertment of Sustainability, Environment, Water & Population ,
Canberra, 2012.
[22
]
“Voluntary Product Stewardship Arrangements,” 2011. [Online]. Available:
https://www.environment.gov.au/protection/waste-resource-recovery/product-
stewardship/voluntary-product-stewardship.
[23
]
“Green Building Council Australia,” 2020. [Online]. Available: https://new.gbca.org.au/.
[24
]
“AGIC,” 2009. [Online]. Available: http://www.agic.net.au/.
[25
]
DWER, “Media Statements,” 2020. [Online]. Available: https://www.der.wa.gov.au/about-
us/media-statements/112-landfill-levy-rates-to-rise-from-january-2015.
[26
]
United Nations, “Sustainable Development Goals,” 30 March 2020. [Online]. Available:
https://www.un.org/development/desa/disabilities/envision2030.html.
[27
]
A. Dilenno, “Key drivers and implications of circular economy inititives in global business,” 7
December 2016. [Online]. Available: https://www.recyclingtoday.com/article/key-drivers-and-
implications-of-circular-economy-initiatives-in-global-business/.
[28
]
M. P. C. L. I. &. C. J. Hossain, “Comparative Environmental Evaluation of Aggregate Production
from Recycled Waste Materials & Virgin Sources by LCA,” Resources, Conservation & Recycling,
pp. 67-77, 2016.
[29
]
R. N. J. &. D. R. Silva, “Use of Recycled Aggregates Arising from Construction and Demolition
Waste in New Construction Applications,” Journal of Cleaner Production , 2019.
[30
]
Hyder Consulting , “C&D waste status reprt: Management of C&D waste in Australia,”
Sustainable Resource Solutions, 2011.
[31
]
UNEP, “Sand & Sustainability: Finding new solutions for environmental governance of global
sand resources,” United Nations Environment Programme, Geneva, Switzerland , 2019.
[32
]
CCAA, “Use of recycled aggregates in construction,” 2008.
[33
]
C. &. S. E. Andela, “Handbook of Alternative Uses for Recycled Glass,” 2017.
67
[34
]
“Recycled Sand,” 2017. [Online]. Available: https://greenroads.com.au/recycled-sand/.
[35
]
R. B. J. &. D. R. Silva, “Availability and Processing of Recycled Aggregates Within the
Construction & Demolition Supply Chian: A Review,” Journal of Cleaner Production, 2016.
[36
]
K. Chiu, “The Use os Recycled Concrete Aggregate in Structural Concrete Around South East
Queensland,” University of Southern Queensland, 2006.
[37
]
T. &. W. Y. Vivian, “Optimization on Proportion for Recycled Aggregate in Concrete Using Two-
Stage Mixing Approach,” Construction & Building Materials, 2007.
[38
]
S. C. N. Nelson, “High-Strength Structural Concrete with Recycled Aggregates,” University of
Southern Queensland, 2004.
[39
]
L. D. J. &. V.-A. R. Jiménez, “Carbon Footprint of Recycled Aggregate Concrete,” Avdances in
Civil Engineering , 2018.
[40
]
P. Sharma, “An Introduction to Recycled Aggregate Concrete: Production & Applications,”
Amity University, Haryana, India, 2015.
[41
]
J. D. G. W. C. &. V. K. Brennan, “A closed-loop system of C&D waste recycling,” ISARC, Sydney,
2014.
[42
]
B. H. S. &. K. K. Aissoun, “Influence of Aggregate Characteristics on Workability of
Superworkable Concrete,” Materials & Structures , 2015.
[43
]
S. &. W. M. Kosmatka, “Design & Control of Concrete Mixtures,” Portland Cement Association ,
Skakie, Illinois, 2011.
[44
]
I. G.-F. B. M.-A. F. &. C.-L. D. González-Taboada, “Study of recycled concrete aggregate quality
and its relationship with recycled concrete compressive strength using database analysis,”
Materiales de Construcción, 2016.
[45
]
A. N. B. T. Y. &. C. K. Mohajerani, “A New Practicle Method for Determining the LA Abrasion
Value for Aggregates,” Soild & Foundations, pp. 840 - 848, 2017.
[46
]
CCAA, “Chloride Resistance of Concrete,” Cement Concrete & Aggregates Australia, 2009.
[47
]
A. A. M. K. V. B. K. K. F. &. D. A. Mohd, “Comparative Analysis of Concrete Using Recycled
Aggregate,” International Journal of Engineering Research & Management, pp. 2349-2058,
2018.
[48
]
Vivian, W. Tam, Y. Gao, X. & Tam, C, “Mictrostructural Analysis of Recycled Aggregate Concrete
Produced from Two-Stage Mixing Approach,” Cement & Concrete Research, 2005.
[49
]
J. J.-M. G. M. M. &. P. J. Olivier, “Trends in Global CO2 Emissions: Report,” PBL, Netherlands,
2016.

68
[50
]
S.F.U Ahmed , “Properties of concrete containing recycled fine aggregate & fly ash,” Journal of
solid waste technology b& management, 2014.
[51
]
S.F.U. Ahmed, “Properties of concrete containing construction & demilition wastes and fly ash,”
Journal of Civil Engineering , 2012.
[52
]
“Rethinking Cement,” Beyond Zero Emissions, Victoria, 2017.
[53
]
T. Gourley, “Geopolymers in Australia,” Australian Ceramic Society , pp. 102-110, 2014.
[54
]
C. Heidrich, “Ash Utilisation - an Australian Perspective,” Ash Development Association of
Australia , Wollongong, 2002.
[55
]
T. Amonini, “Synergy Applies to increase Fly Ash Dam,” 16 January 2020. [Online]. Available:
https://www.colliemail.com.au/story/6557222/fly-ash-dam-application-for-synergy/.
[56
]
ADAA, “Australian Experience with Fly-Ash in Concrete: Applications & Opportunities,” Ash
Development Association of Australia , Wollongong, 2009.
[57
]
P. Nath, “Durability of Concrete Using Fly Ash as a Partial Replacement of Cement,” Curtin
University , Perth, 2010.
[58
]
N. W. Chen-Tan, “Geopolymer from a Western Australian Fly Ash,” Curtin University , Perth,
2010.
[59
]
C. R. D. &. K. P. Shi, Alkali-Activated Cements & Concretes, London: Taylor & Francis, 2003.
[60
]
J. &. D. J. Aldred, “Is Geopolymer Concrete a Suitible Alternative to Traditional Concrete?,”
Toowoomba, 2012.
[61
]
[62
] S. Tyson, “Fly-Ash Facts for Highway Engineers,” American Coal Ash Association , Washington,
DC, 2003.
[63
]
B. S. C. G. T. T. M. &. I. K. Tempest, “Manufacture of Full Scale Geopolymer Cement Concrete
Components: A Case Study to highlight Opportunities & Challanges,” PCI Journal , 2015.
[64
]
A. &. M. V. Ramezanianpour, “Effect of curing on the compressive strength, resistance to
chloride-ion penetration and porosity of concretes incorporating slag, fly ash or silica fume,”
Cement & Concrete Composites, pp. 125 - 133, 1995.
[65
]
D. &. F. C. Bentz, “Rheology & Setting of High Volume Fly Ash Mixtures,” Cement & Concrete
Composites, pp. 265-270, 2010.
[66
]
P. Mehta, “Influence of Fly Ash Characteristics on the strength of Portland Fly Ash Mixtures,”
Cement & Concrete Research, pp. 669-674, 1985.

69
[67
]
A. S. D. J.-B. T. S. T. A. A. H. S. &. L. D. Mohajerani, “Recycling Waste Materials in Geopolymer
Concrete,” Clean Technologies & Environmental Policy , 2019.
[68
]
J. Davidovits, “Geopolymers: Inorganic Polymeric New Materials,” Thermal Analysis and
Calorimetry, pp. 1633-1656, 1991.
[69
]
A. A. M. &. S. M. Hassan, “Use of geopolymer concrete for cleaner and sustainable environment
- A review of mechanical properties and microstructure,” Journal of Cleaner Production, pp. 704
- 728, 2019.
[70
]
B. V. Rangan, “Studies on fly-ash based geopolymer concrete,” Sustainable Development
Solutions , 2008.
[71
]
A. &. C.-T. N. Riessen, “Benefication of Collie fly ash for synthesis of geopolymer. Part 2 -
Geopolymers.,” Fuel, pp. 829 - 835, 2013.
[72
]
N. &. R. B. Lloyd, “Geopolymer Concrete With Fly-Ash,” Curtin University of Technology , Perth,
2010.
[73
]
M. H. S. M. B. &. S. I. Nurruddin, “Methods of Curing Geopolymer Concrete: A Review,”
International Journal of Advanced & Applied Sciences, pp. 31- 36, 2017.
[74
]
V. S. M. &. H. S. Yewale, “Evaluation of Efficient Types of Curing for Geopolymer Concrete,”
International Journal of New Technologies in Science & Engineering , 2016.
[75
]
T. D. J. G. R. &. A. J. Glasby, EFC Geopolymer Concrete Aircraft Pavements at Brisbane West
Wellcamp Airport, Melbourne: Wagners, 2015.
[76
]
T. B. L. &. H. P. Pavlu, “Influence of Recycled Aggregate Quality on The Mechanical Properties of
Concrete,” Communications , Prague, Czech Republic. , 2014.
[77
]
F. E. L. &. B. J. Rodrigues, “A New Method to Determine the Density and Water Absorption of
Fine Recycled Aggregates,” Materials Research , Lisbon, Portugal , 2013.
[78
]
M. &. A. M. Solyman, “Classification of Recycled Sands and their Applications as Fine
Aggregates for Concrete & Bituminous Mixtures,” 2005.
[79
]
H. &. S. S. Sandeep, “The Inerface Behaviour of Recycled Concrete Aggregate: A
Micromechanical Grain-Scale Experimental Study,” Construction & Building Materials, pp. 627-
638, 2019.
[80
]
K. K. D. &. J. A. Mane, “Strength and Workability of Concrete with Manufactured Sand,”
International Research Publication House , Dharward, India, 2017.
[81
]
L. W. J. &. T. S. Butler, “Towards the Classification of Recycled Concrete Aggregates: INfluence
of Fundamental Aggregate Properties on Recycled Concrete Performance,” Journal of
Sustainable Cement Based Materials, pp. 140 - 163, 2014.
[82
]
G. H. W. T. W. &. Z. M. Fang, “Workability and Mechanical Properties of Alkali-Activated Fly-
Ash-Slag Concrete Cured at Ambient Temperature,” Construction & Building Materials, pp. 476
- 487, 2018.
70
[83
]
CCAA, “Guide to Concrete for Housing,” Cement Concrete & Aggregates Australia , 2007.
[84
]
M. Slabbert, “Utilising waste products from Kwinana Industries to Manufacture Low
Specification Geopolymer Concrete,” Curtin University , Perth, 2008.
[85
]
M. Alexander, “Service Life Design and Modelling of Concrete Structures - Background,
Development & Implementation,” Revista ALCONPAT, Cape Town, South Africa, 2018.
[86
]
WA Government, “Muja Power Station in Collie to be Scaled Back from 2022,” 5 August 2019.
[Online]. Available:
https://www.mediastatements.wa.gov.au/Pages/McGowan/2019/08/Muja-Power-Station-in-
Collie-to-be-scaled-back-from-2022.aspx.
[87
]
McGowan, M. & Saffioti, R., “Bunbury Outer Ring Road Constract to Creat Thousands of Local
Jobs,” 22 October 2020. [Online]. Available:
https://www.acciona.com.au/pressroom/news/2020/october/bunbury-outer-ring-road-
contract-to-create-thousands-of-local-jobs/.
[88
]
“Sustainability Outcomes from the Planning and Development of Bunbury Outer Ring Road,”
BORR Team, Perth, 2020.
[89
]
S. Adnan, “Study on Concrete Containing Recycled Aggregates Immersed in Epoxy Resin,”
NATEC, 2017.
[90
]
World Aluminium , “Maximising the use of Bauxite Residue in Cement,” International
Aluminium Institute, 2020.
[91
]
T. H. a. L. Barrett, “When is waste, waste?,” Murdoch University, perth, 2017.
[92
]
“CCF,” 3 June 2020. [Online]. Available: www.ccfwa.com.au/News-page/dwer-provides-clarity-
on-clean-fill-uncontaminated-fill/.
[93
]
C. Barton, “HWL EBSWORTH,” 9 May 2018. [Online]. Available:
https://hwlebsworth.com.au/use-of-clean-fill-on-development-sites-not-subject-to-
levy/#:~:text='Clean%20fill%20premises'%20is%20defined,'%20or%20'uncontaminated%20fill'..
[94
]
Rawnsley, C., “Factsheet: Amendments to the Environmental Protection Regulations 1987 -
clean fill and uncontaminated fill,” Department of Water and Environmental Regulation, Perth,
2018.
[95
]
ECR, “Earthcare Recycling (ECR) response to issues paper: Waste not, want not: valuing waste
as a resource,” DWER, Joondalup, 2019.
[96
]
“ABC News,” 25 May 2012. [Online]. Available: https://www.abc.net.au/news/2012-05-
25/asbestos-traces-in-roadworks/4032890.
[97
]
Waste Industries, “Guidelines for manageing asbestos at C&D waste recovery facilities,”
Department of Environment & Conservation , 2012.
71
[98
]
“Kwinana Freeway Northbound Widening,” MRWA, Perth, 2020.
[99
]
“Roads to Reuse Pilot Project Case Study,” 14 November 2019. [Online]. Available:
https://www.wasteauthority.wa.gov.au/publications/view/case-sudy/roads-to-reuse-pilot-
project-case-study.
[10
0]
“Roads to Reuse,” 27 March 2020. [Online]. Available:
https://www.wasteauthority.wa.gov.au/programs/view/roads-to-reuse.
[10
1]
“Envirocrete,” 9 November 2020. [Online]. Available:
https://www.boral.com.au/sites/default/files/media_library/documents/Envirocrete_brochure
.pdf.
[10
2]
BGC Concrete, “GreenStar Concrete,” 11 November 2020. [Online]. Available:
bgcconcrete.com.au/greenstarconcrete.
[10
3]
“Eco-Concrete,” 9 November 2020. [Online]. Available:
https://www.capitalconcretewa.com.au/products/ecoconcrete/.
[10
4]
“Concrete for Sustainable Development,” 9 November 2020. [Online]. Available:
https://www.holcim.com.au/products-and-services/concrete-readymix/high-
performance/concrete-for-sustainable-development.
[10
5]
“ViroDecs EPD,” 9 November 2020. [Online]. Available: https://epd-australasia.com/wp-
content/uploads/2019/07/Holcim-ViroDecs-EPD.pdf.
[10
6]
“National Waste Policy,” Australian Government , 2018.
[10
7]
“HIA,” 27 October 2019. [Online]. Available: https://hia.com.au/regional-news/wa/warr-
regulations-rn20 .
[10
8]
“Parliament of WA,” 21 December 2007 . [Online]. Available:
https://www.parliament.wa.gov.au/parliament/bills.nsf/BillProgressPopup?openForm&Parent
UNID=23802642F14FB737C8257377000E9D95.
[10
9]
DER, “Environmental Guidelines for C&D waste recycling facilities,” Department of
Environmental Regulation , Peth, 2009.
[11
0]
CCAA, “Briefing: Sustainable use of aggregates,” 2013.
[11
1]
K. Mudavath, “Different Grades of Concrete and Their Uses/ Applications,” 10 September 2018.
[Online]. Available: https://wecivilengineers.wordpress.com/2018/09/10/different-grades-of-
concrete-and-their-uses-applications/.
72
Appendices
Appendix A – Literature Review
A.1 – The Eclipse Decision On March 9, 2016, the WA Supreme Court found Eclipse Resources Pty Ltd (Eclipse) liable to pay
$21.5 million in overdue levies dating back to 2008 [91]. This resulted in unintended consequences
in relation to the use of clean fill on development sites – creating concerns that sand transferred
from one site to another for land development could attract the landfill levy [92], since the
acceptance of ≤ 500 tonnes per year of material could make payment of the landfill levy applicable
[93].
This stems from Eclipse’s resource recovery operations at three sites in the Perth metro region
where waste derived materials were used to backfill quarry voids [93]. These sites were licenced as
schedule 1 under the EP Regulations as category 63 class 1 inert landfill sites since each of these sites
received more than the regulatory threshold of 500 tonnes per year of material [91]. Eclipse argued
that the materials were being recycled and as a result were not waste for the purpose of the Levy
Regulations and therefore, they did not pay the landfill levy [93].
On the 12th of May 2017 the decision was upheld by the WA Court of Appeal on the basis that the
term ‘waste’ takes its ordinary definition – material that is unwanted by/ or excess to the needs of
the person who is the source of the material. This was followed by the High court refusing Eclipse’s
application for special leave to appeal on the 14th of September 2017 [93].
Following the outcome of the Eclipse decision in March of 2016, the planned review of DWER’s
material guidelines for clean fill and construction products was put on hold in order to consider the
implications of the Eclipse decision and as a result DWER released its industry consultation paper on
the 10th of November 2017, which aimed to address these unintended consequences [93].
DWER then published its consultation summary report on the 27th April 2018 and passed changes to
the Environmental Protection Regulations and Waste Definitions [93]. These changes meant that
clean fill may be used at development sites without the risk of attracting the landfill levy.
Furthermore, waste derived materials may be used as fill if it meets the threshold for
uncontaminated fill [94].
However, it was identified that there is a policy void – no legislative mechanism to encourage the
use of waste derived materials that do not satisfy the uncontaminated fill thresholds, but may be
suitable for fill depending on the nature of the receiving environment [93], [17].
In spite of these legislative reforms, there remains a need for the existing policy and regulatory
issues to be resolved as they are severely impending the growth for the application of waste derived
materials in the development sector [95].
73
A.2 – Asbestos & The Great Eastern highway Project In 2011, the use of recycled C&D material in road construction as part of a scheme to reduce the
amount of waste going to landfill was suspended due to concerns about traces of asbestos. At the
time, there was an absolute zero allowable limit for asbestos in WA civil projects. Due to improper
implementation of this scheme, some recycled product mixture from a stockpile was used before
testing was done. The testing showed that some traces of asbestos were in fact present in the
sample. As a result, a review had to be conducted to ensure that there were no health and safety
issues, which was both costly and time consuming [96].
This severely impacted the market for C&D products as the perceived risks were now viewed as
being ‘too high’ [96].
Following this incident, a great deal of reform and development was endured to minimise the
asbestos risk linked to the reuse of recycled C&D products.
In 2012 the guidelines for the management of asbestos at CDW recycling facilities was released by
DWER followed by a sampling and testing regime that recycling facilities have to comply with. In
addition, an independent auditing and reporting process was also incorporated to ensure that the
risk of asbestos contamination has been addressed by material suppliers [97].
Despite these reforms, there is still a lack of confidence in the market for the reuse of recycled C&D
products. This has created a negative perception that will require continued effort to be resolved –
though education, case studies and pilot projects, such as the Roads to Reuse program (See
Appendix A.3) [21].
74
A.3 – Roads to Reuse Case Study The Roads to Reuse (RtR) Pilot is a state government initiative that has been administrated by the
Waste Authority of WA. Initiated in early 2019, the pilot project committed to the reuse of 25,000
tonnes of recycled C&D material in MRWA projects, such as the widening of the Kwinana Freeway
and Murdoch Drive connection.
As of June 2020:
24,263 tonnes of Crushed Recycled Concrete and demolition waste was used as subbase under full depth asphalt [98].
> 5,000 tonnes of recycled C&D material used on the Murdoch Drive connection – exceeding
the initial commitment to use 4,000 tonnes [99].
Some of the requirements listed in the RtR specification are [100]:
150mm of crushed recycled concrete (CRC) used as road sub-base under full depth asphalt
(250mm).
CRC is a granular material mixture of fine grained and course soils and crushed aggregate up to
20mm in size
Products containing concrete with a pH > 9 should not be used within 100m of any wetland,
water course or on land subject to flooding.
Road base containing concrete with the same pH limit may only be used when sealed with
asphalt.
The use of recycled C&D material have proven to display the following benefits [99]:
Lower transportation costs and lower emissions from reduced transport → suppliers of recycled
product are located closer to construction sores compared to suppliers of virgin material.
Recycled C&D material strength → Used as a sub-base, it provides a stiff underlying layer that
will help extend the life of various road pavements.
Additional cost reductions over time → Basecoarse under local roads presents initial costs
which are offset by the longer life of recycled materials.
Time and labour savings → Less mixing required since the material is more consistent than
traditional limestone.
Water savings → Recycled material used less compaction moisture than virgin material.
Durability → Can withstand moderate construction vehicle traffic without further material
breakdown, whereas conventional materials are more likely to breakdown under the same
traffic conditions.
Some other outcomes observed so far outlined in [99] are as followed:
CRC considered to be a high strength and durable material by MRWA.
The scheme is working so well that more product is being used than originally committed to.
The auditing processes is working, ensuring a quality product is being supplied, showing that
recyclers are doing the right thing, as well as providing MRWA confidence in the process.

75
Recycled material is good to work with. Some of the benefits include:
▪ Reduced risk of delamination
▪ Uses less compaction moisture
▪ Appears to retain moisture
▪ 6-13% less water required in construction process.
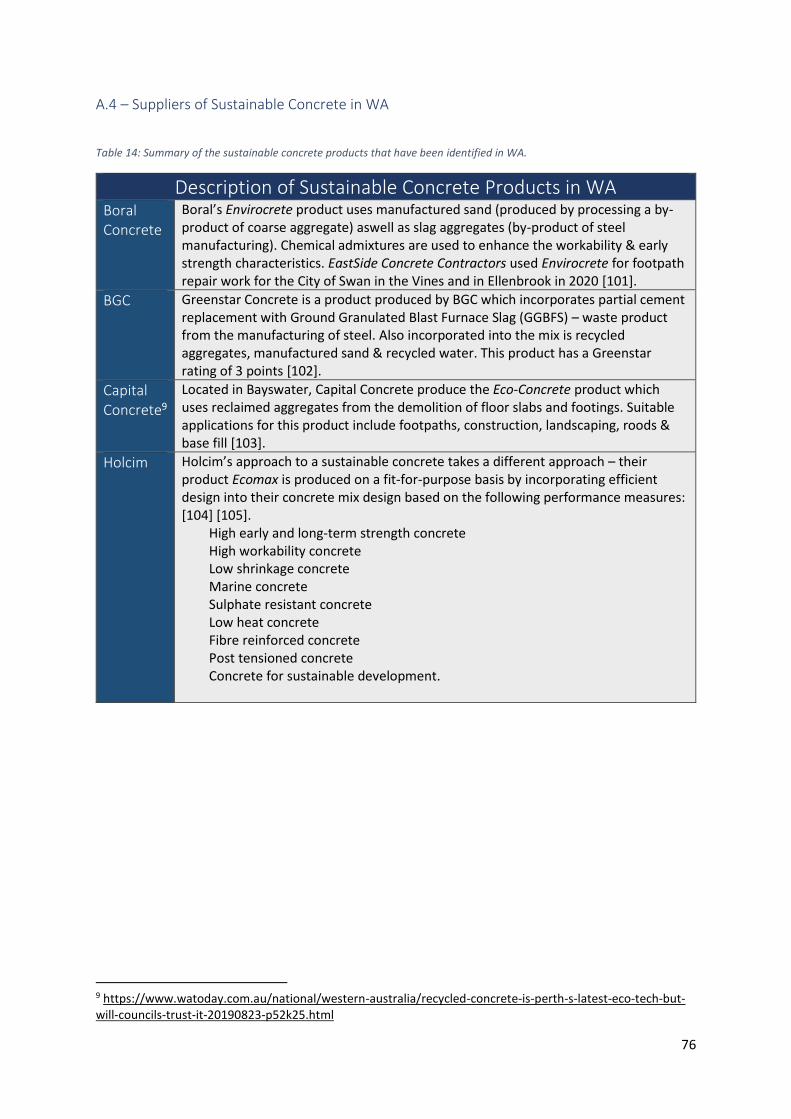
76
A.4 – Suppliers of Sustainable Concrete in WA
Table 14: Summary of the sustainable concrete products that have been identified in WA.
Description of Sustainable Concrete Products in WA Boral Concrete
Boral’s Envirocrete product uses manufactured sand (produced by processing a by-product of coarse aggregate) aswell as slag aggregates (by-product of steel manufacturing). Chemical admixtures are used to enhance the workability & early strength characteristics. EastSide Concrete Contractors used Envirocrete for footpath repair work for the City of Swan in the Vines and in Ellenbrook in 2020 [101].
BGC Greenstar Concrete is a product produced by BGC which incorporates partial cement replacement with Ground Granulated Blast Furnace Slag (GGBFS) – waste product from the manufacturing of steel. Also incorporated into the mix is recycled aggregates, manufactured sand & recycled water. This product has a Greenstar rating of 3 points [102].
Capital Concrete9
Located in Bayswater, Capital Concrete produce the Eco-Concrete product which uses reclaimed aggregates from the demolition of floor slabs and footings. Suitable applications for this product include footpaths, construction, landscaping, roods & base fill [103].
Holcim Holcim’s approach to a sustainable concrete takes a different approach – their product Ecomax is produced on a fit-for-purpose basis by incorporating efficient design into their concrete mix design based on the following performance measures: [104] [105].
High early and long-term strength concrete High workability concrete Low shrinkage concrete Marine concrete Sulphate resistant concrete Low heat concrete Fibre reinforced concrete Post tensioned concrete Concrete for sustainable development.
9 https://www.watoday.com.au/national/western-australia/recycled-concrete-is-perth-s-latest-eco-tech-but-will-councils-trust-it-20190823-p52k25.html
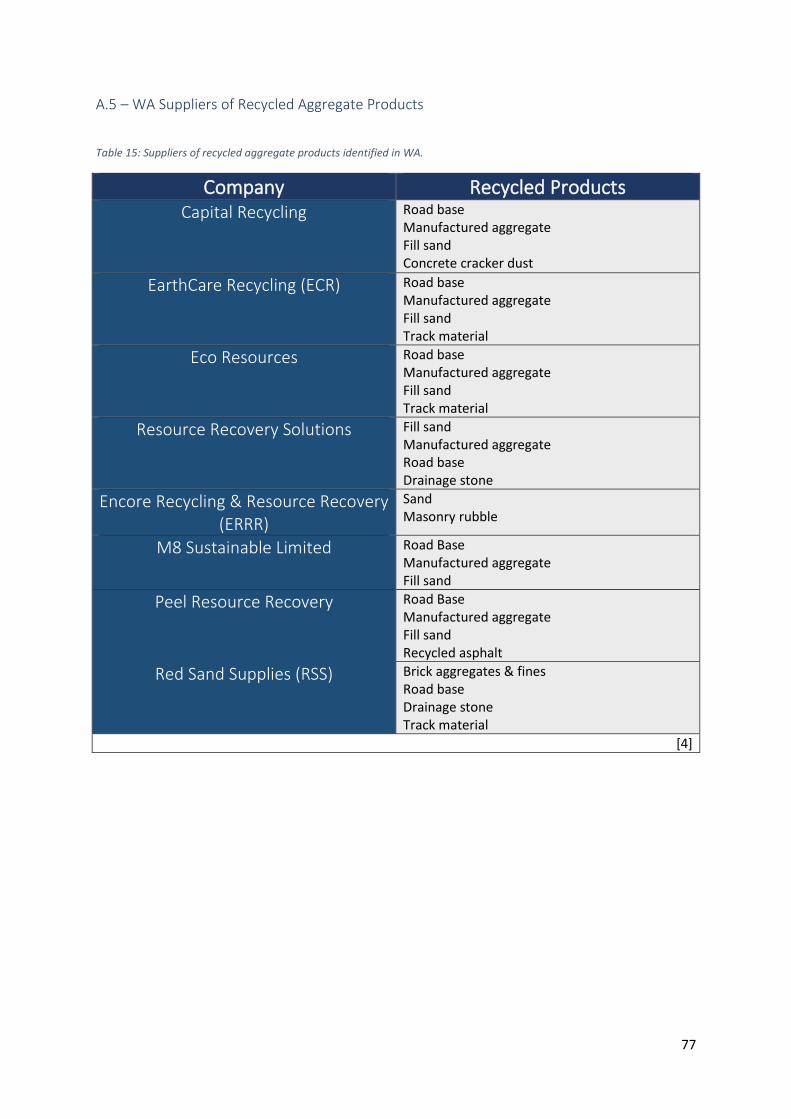
77
A.5 – WA Suppliers of Recycled Aggregate Products
Table 15: Suppliers of recycled aggregate products identified in WA.
Company Recycled Products Capital Recycling Road base
Manufactured aggregate Fill sand Concrete cracker dust
EarthCare Recycling (ECR) Road base Manufactured aggregate Fill sand Track material
Eco Resources Road base Manufactured aggregate Fill sand Track material
Resource Recovery Solutions Fill sand Manufactured aggregate Road base Drainage stone
Encore Recycling & Resource Recovery (ERRR)
Sand Masonry rubble
M8 Sustainable Limited Road Base Manufactured aggregate Fill sand
Peel Resource Recovery Road Base Manufactured aggregate Fill sand Recycled asphalt
Red Sand Supplies (RSS) Brick aggregates & fines Road base Drainage stone Track material
[4]
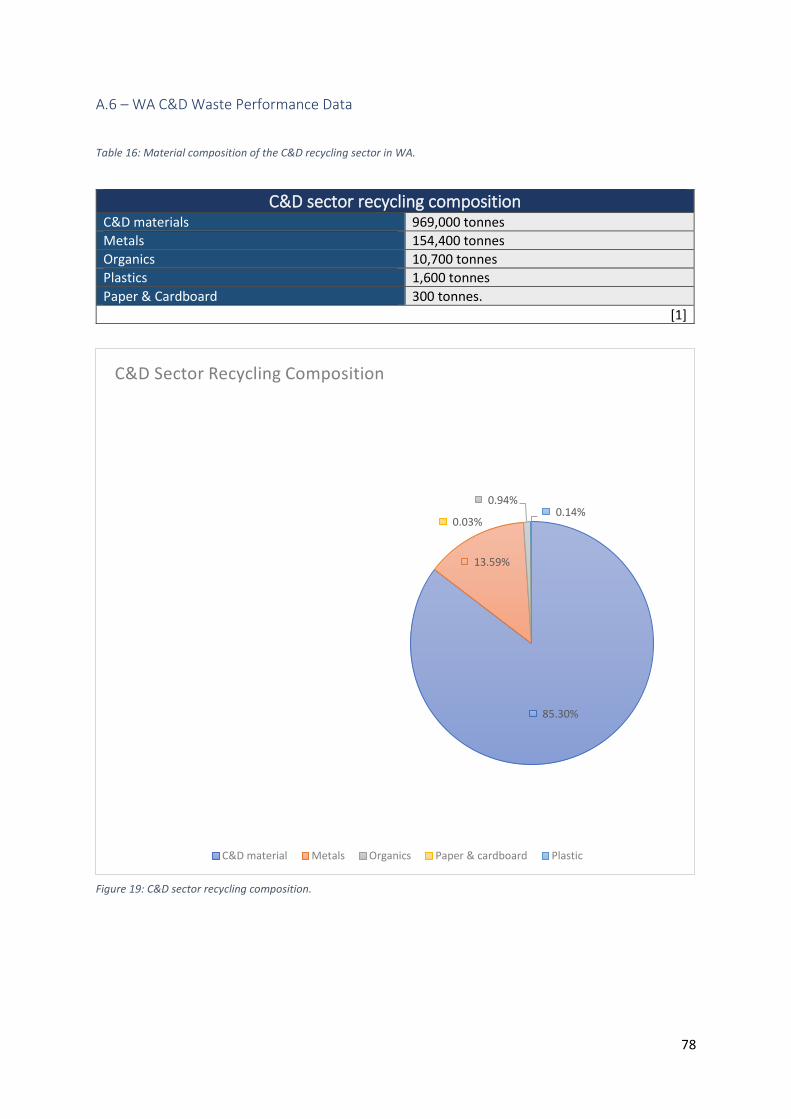
78
A.6 – WA C&D Waste Performance Data
Table 16: Material composition of the C&D recycling sector in WA.
C&D sector recycling composition
C&D materials 969,000 tonnes
Metals 154,400 tonnes
Organics 10,700 tonnes
Plastics 1,600 tonnes
Paper & Cardboard 300 tonnes.
[1]
85.30%
13.59%
0.94%
0.03%0.14%
C&D Sector Recycling Composition
C&D material Metals Organics Paper & cardboard Plastic
Figure 19: C&D sector recycling composition.
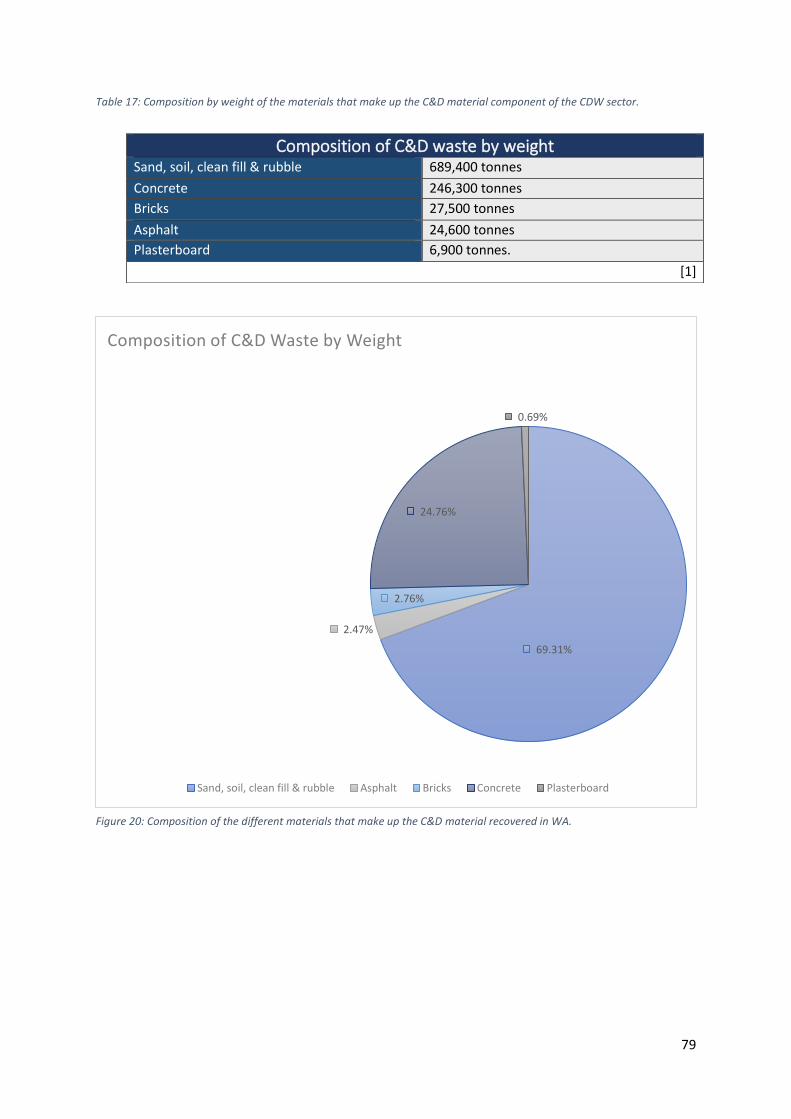
79
Table 17: Composition by weight of the materials that make up the C&D material component of the CDW sector.
Composition of C&D waste by weight
Sand, soil, clean fill & rubble 689,400 tonnes
Concrete 246,300 tonnes
Bricks 27,500 tonnes
Asphalt 24,600 tonnes
Plasterboard 6,900 tonnes.
[1]
69.31%
2.47%
2.76%
24.76%
0.69%
Composition of C&D Waste by Weight
Sand, soil, clean fill & rubble Asphalt Bricks Concrete Plasterboard
Figure 20: Composition of the different materials that make up the C&D material recovered in WA.
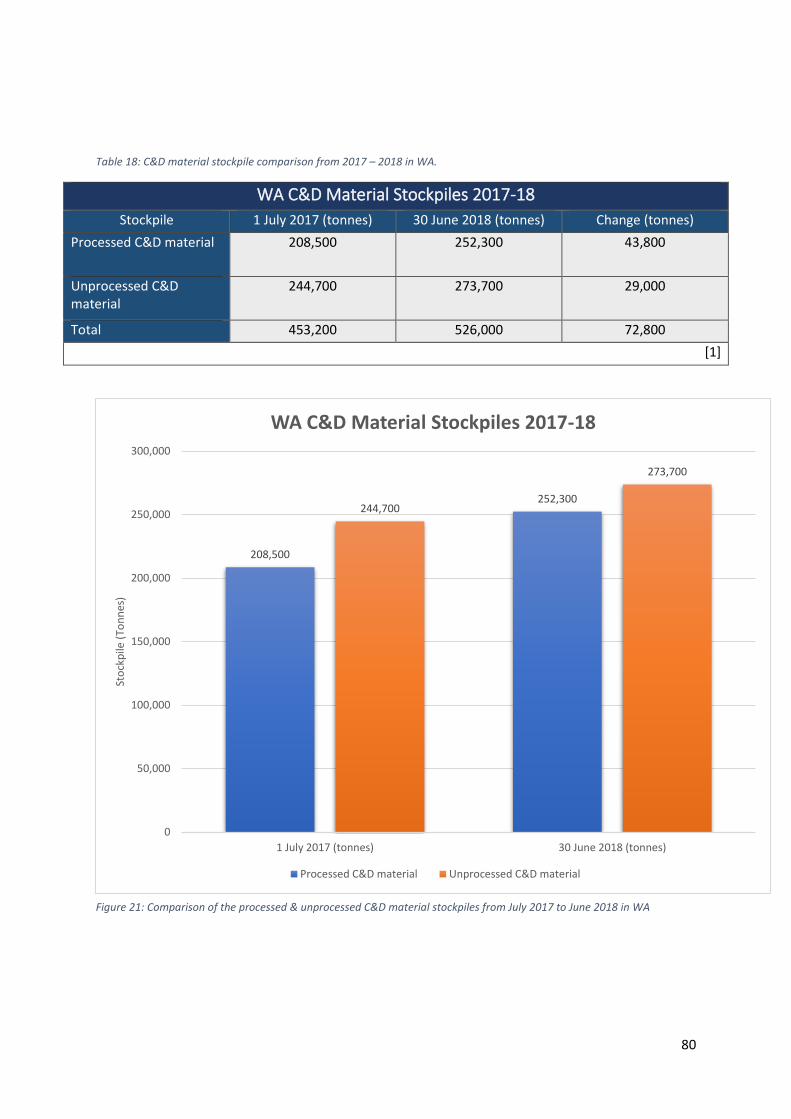
80
Table 18: C&D material stockpile comparison from 2017 – 2018 in WA.
WA C&D Material Stockpiles 2017-18
Stockpile 1 July 2017 (tonnes) 30 June 2018 (tonnes) Change (tonnes)
Processed C&D material 208,500 252,300 43,800
Unprocessed C&D material
244,700 273,700 29,000
Total 453,200 526,000 72,800
[1]
208,500
252,300244,700
273,700
0
50,000
100,000
150,000
200,000
250,000
300,000
1 July 2017 (tonnes) 30 June 2018 (tonnes)
Sto
ckp
ile (
Ton
nes
)
WA C&D Material Stockpiles 2017-18
Processed C&D material Unprocessed C&D material
Figure 21: Comparison of the processed & unprocessed C&D material stockpiles from July 2017 to June 2018 in WA
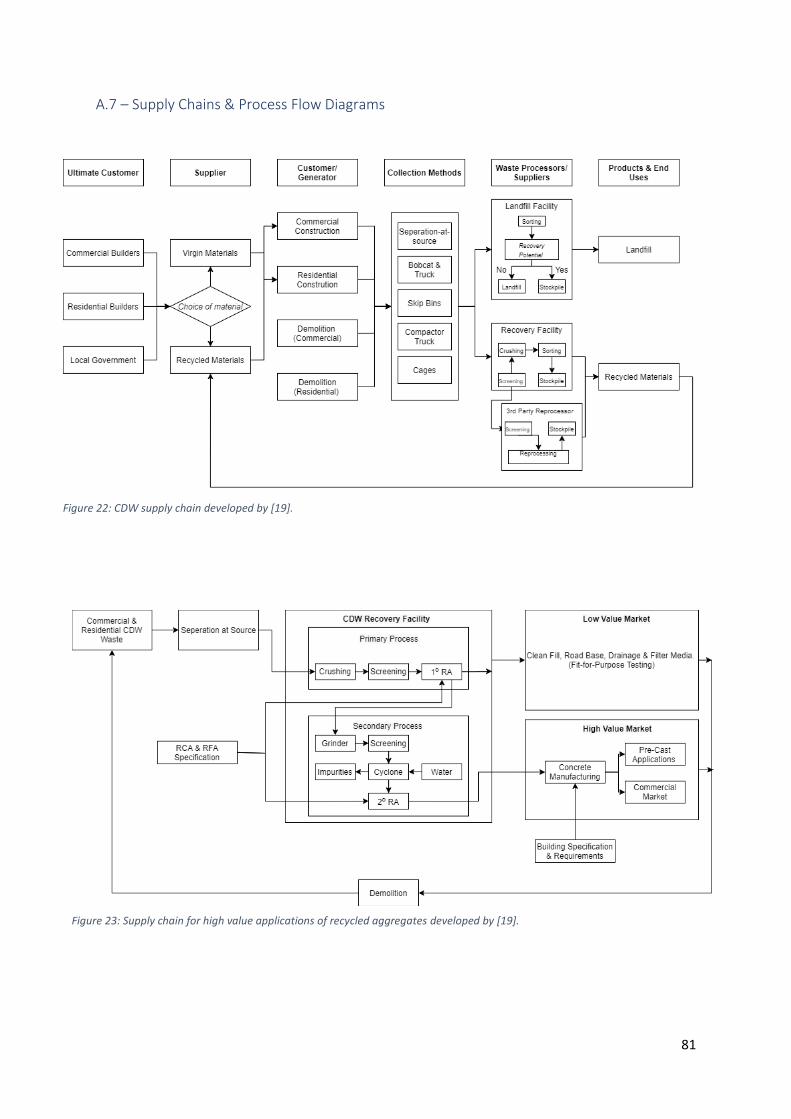
81
A.7 – Supply Chains & Process Flow Diagrams
Figure 22: CDW supply chain developed by [19].
Figure 23: Supply chain for high value applications of recycled aggregates developed by [19].
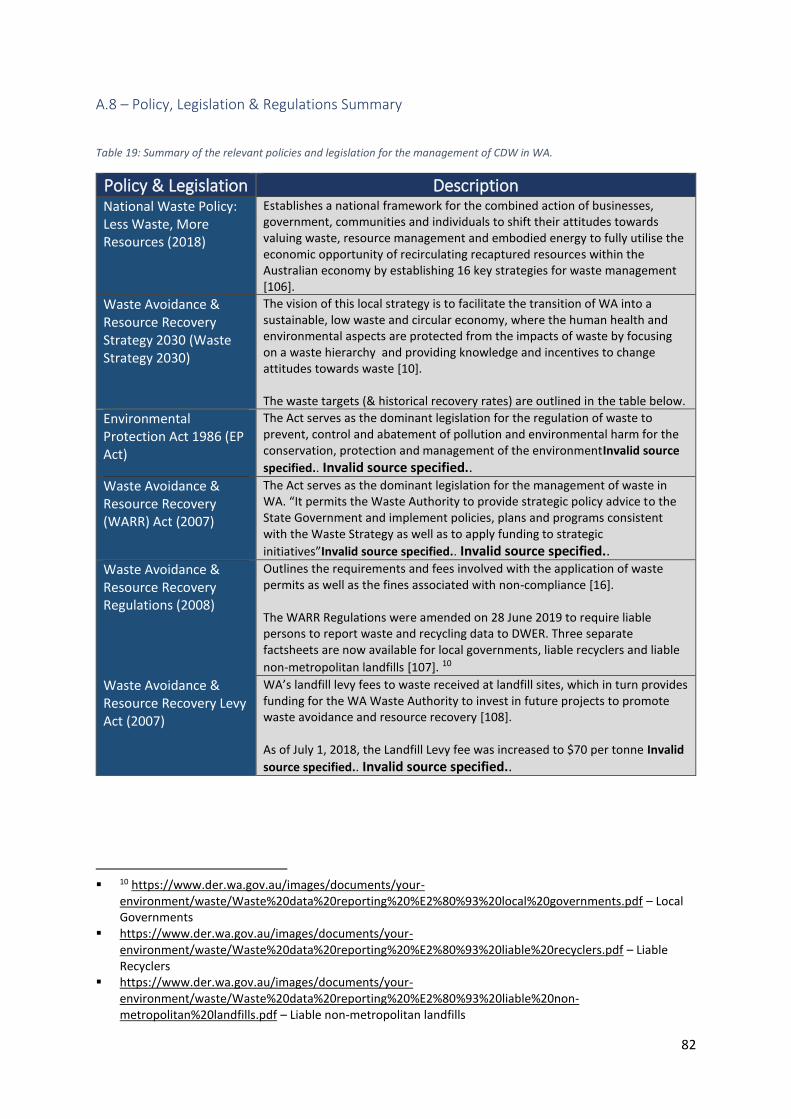
82
A.8 – Policy, Legislation & Regulations Summary
Table 19: Summary of the relevant policies and legislation for the management of CDW in WA.
Policy & Legislation Description National Waste Policy: Less Waste, More Resources (2018)
Establishes a national framework for the combined action of businesses, government, communities and individuals to shift their attitudes towards valuing waste, resource management and embodied energy to fully utilise the economic opportunity of recirculating recaptured resources within the Australian economy by establishing 16 key strategies for waste management [106].
Waste Avoidance & Resource Recovery Strategy 2030 (Waste Strategy 2030)
The vision of this local strategy is to facilitate the transition of WA into a sustainable, low waste and circular economy, where the human health and environmental aspects are protected from the impacts of waste by focusing on a waste hierarchy and providing knowledge and incentives to change attitudes towards waste [10]. The waste targets (& historical recovery rates) are outlined in the table below.
Environmental Protection Act 1986 (EP Act)
The Act serves as the dominant legislation for the regulation of waste to prevent, control and abatement of pollution and environmental harm for the conservation, protection and management of the environmentInvalid source
specified.. Invalid source specified..
Waste Avoidance & Resource Recovery (WARR) Act (2007)
The Act serves as the dominant legislation for the management of waste in WA. “It permits the Waste Authority to provide strategic policy advice to the State Government and implement policies, plans and programs consistent with the Waste Strategy as well as to apply funding to strategic
initiatives”Invalid source specified.. Invalid source specified..
Waste Avoidance & Resource Recovery Regulations (2008)
Outlines the requirements and fees involved with the application of waste permits as well as the fines associated with non-compliance [16]. The WARR Regulations were amended on 28 June 2019 to require liable persons to report waste and recycling data to DWER. Three separate factsheets are now available for local governments, liable recyclers and liable
non-metropolitan landfills [107]. 10
Waste Avoidance & Resource Recovery Levy Act (2007)
WA’s landfill levy fees to waste received at landfill sites, which in turn provides funding for the WA Waste Authority to invest in future projects to promote waste avoidance and resource recovery [108]. As of July 1, 2018, the Landfill Levy fee was increased to $70 per tonne Invalid
source specified.. Invalid source specified..
▪ 10 https://www.der.wa.gov.au/images/documents/your-
environment/waste/Waste%20data%20reporting%20%E2%80%93%20local%20governments.pdf – Local Governments
▪ https://www.der.wa.gov.au/images/documents/your-environment/waste/Waste%20data%20reporting%20%E2%80%93%20liable%20recyclers.pdf – Liable Recyclers
▪ https://www.der.wa.gov.au/images/documents/your-environment/waste/Waste%20data%20reporting%20%E2%80%93%20liable%20non-metropolitan%20landfills.pdf – Liable non-metropolitan landfills

83
Table 20: WA Waste Strategy 2030 targets for the different waste sectors.
Sector Strategy Targets 2014-15 2015-16 2016-17 2017-18
2020 2025 2030
MSW* 65% 67% 70% 40% 35% 33% 40%
C&I (WA)
70% 75% 80% 52% 46% 46% 45%
C&D (WA)
75% 77% 80% 42% 64% 77% 75%
Total (WA)
NA 70% 75% 42% 48% 51% 51%
*Perth Metro Region [1] & [2]
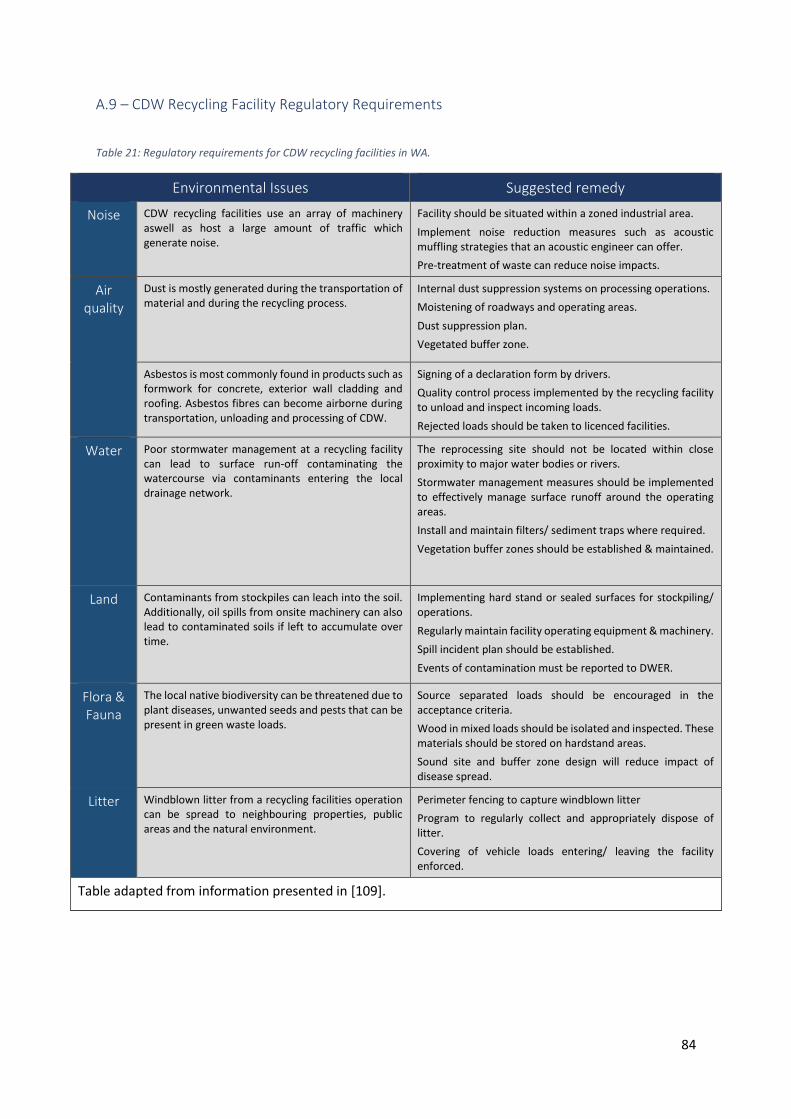
84
A.9 – CDW Recycling Facility Regulatory Requirements
Table 21: Regulatory requirements for CDW recycling facilities in WA.
Environmental Issues Suggested remedy
Noise
CDW recycling facilities use an array of machinery aswell as host a large amount of traffic which generate noise.
Facility should be situated within a zoned industrial area.
Implement noise reduction measures such as acoustic muffling strategies that an acoustic engineer can offer.
Pre-treatment of waste can reduce noise impacts.
Air quality
Dust is mostly generated during the transportation of material and during the recycling process.
Internal dust suppression systems on processing operations.
Moistening of roadways and operating areas.
Dust suppression plan.
Vegetated buffer zone.
Asbestos is most commonly found in products such as formwork for concrete, exterior wall cladding and roofing. Asbestos fibres can become airborne during transportation, unloading and processing of CDW.
Signing of a declaration form by drivers.
Quality control process implemented by the recycling facility to unload and inspect incoming loads.
Rejected loads should be taken to licenced facilities.
Water Poor stormwater management at a recycling facility can lead to surface run-off contaminating the watercourse via contaminants entering the local drainage network.
The reprocessing site should not be located within close proximity to major water bodies or rivers.
Stormwater management measures should be implemented to effectively manage surface runoff around the operating areas.
Install and maintain filters/ sediment traps where required.
Vegetation buffer zones should be established & maintained.
Land Contaminants from stockpiles can leach into the soil. Additionally, oil spills from onsite machinery can also lead to contaminated soils if left to accumulate over time.
Implementing hard stand or sealed surfaces for stockpiling/ operations.
Regularly maintain facility operating equipment & machinery.
Spill incident plan should be established.
Events of contamination must be reported to DWER.
Flora & Fauna
The local native biodiversity can be threatened due to plant diseases, unwanted seeds and pests that can be present in green waste loads.
Source separated loads should be encouraged in the acceptance criteria.
Wood in mixed loads should be isolated and inspected. These materials should be stored on hardstand areas.
Sound site and buffer zone design will reduce impact of disease spread.
Litter
Windblown litter from a recycling facilities operation can be spread to neighbouring properties, public areas and the natural environment.
Perimeter fencing to capture windblown litter
Program to regularly collect and appropriately dispose of litter.
Covering of vehicle loads entering/ leaving the facility enforced.
Table adapted from information presented in [109].

85
A.10 – Recycled Aggregates
Table 22: Summary of the recycled aggregates used in construction.
Summary of Recycled Aggregates in Construction
Aggregate Description Applications
Recycled Concrete Aggregate (RCA)
Crushed and clean waste concrete of at least 95% by weight of concrete with
typical total contamination > 1% of the bulk mass. Class 1A RCA has no more than
0.5% brick content.
Partial replacement (30%) for natural aggregate in concrete for sidewalks, kerbs
and gutters & structural concrete.
Recycled Concrete & Masonry (RCM)
Graded aggregate produced from sorted and clean waste concrete and masonry. Class 1B RCA is a class 1A RCA blended with no more than 30% crushed brick.
Road base course and subbase material.
Reclaimed Aggregate (RA)
Coarse aggregates reclaimed from returned concrete by separating the
aggregates from the water-cement slurry.
Up to 32-MPa concrete with 100% reclaimed aggregates, and as partial replacement of natural aggregate in
grades up to 80 MPa.
Reclaimed Asphalt Aggregate (RAP)
Old asphalt concrete. New asphaltic concrete pavement. RAP/RCA blends for Recycled Crushed
Concrete (RCC) in flexible pavement and sub-grade material.
Reclaimed Asphalt Pavement (RAA)
Reclaimed coarse aggregate and recycled asphalt granules from waste asphalt
concrete.
Concrete with penalties in mix adjustment.
Table adapted from information found in [110]
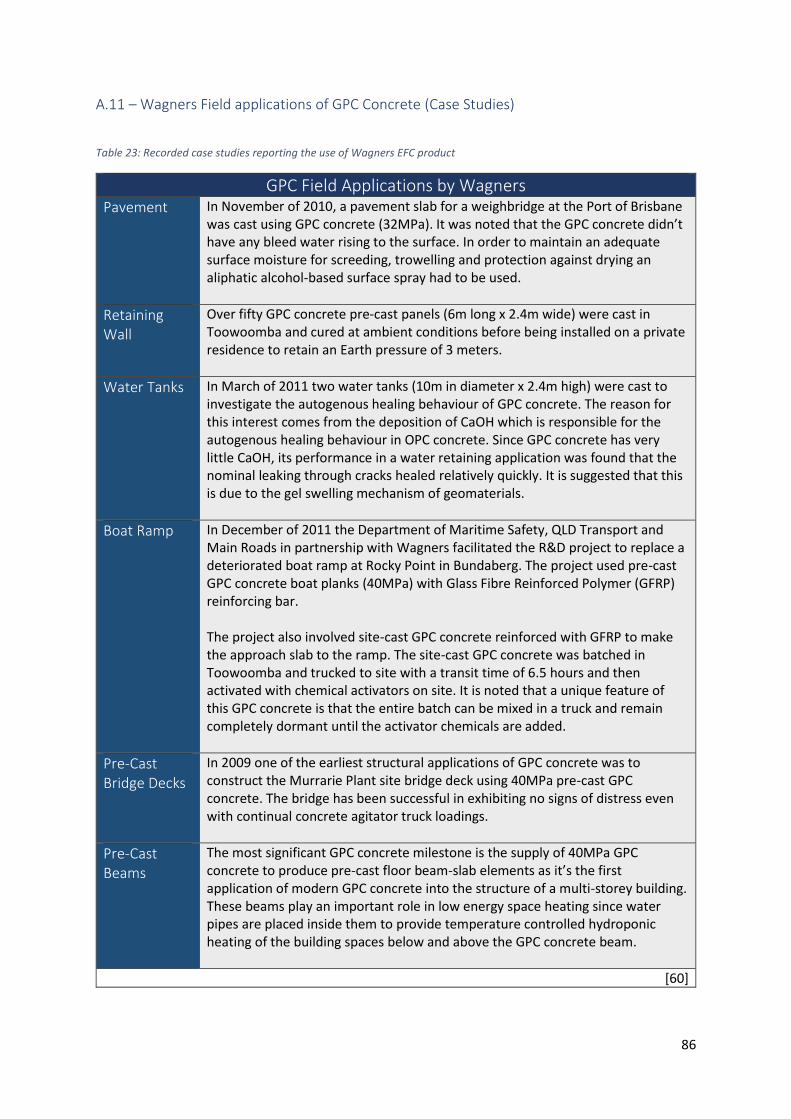
86
A.11 – Wagners Field applications of GPC Concrete (Case Studies)
Table 23: Recorded case studies reporting the use of Wagners EFC product
GPC Field Applications by Wagners
Pavement In November of 2010, a pavement slab for a weighbridge at the Port of Brisbane was cast using GPC concrete (32MPa). It was noted that the GPC concrete didn’t have any bleed water rising to the surface. In order to maintain an adequate surface moisture for screeding, trowelling and protection against drying an aliphatic alcohol-based surface spray had to be used.
Retaining Wall
Over fifty GPC concrete pre-cast panels (6m long x 2.4m wide) were cast in Toowoomba and cured at ambient conditions before being installed on a private residence to retain an Earth pressure of 3 meters.
Water Tanks In March of 2011 two water tanks (10m in diameter x 2.4m high) were cast to investigate the autogenous healing behaviour of GPC concrete. The reason for this interest comes from the deposition of CaOH which is responsible for the autogenous healing behaviour in OPC concrete. Since GPC concrete has very little CaOH, its performance in a water retaining application was found that the nominal leaking through cracks healed relatively quickly. It is suggested that this is due to the gel swelling mechanism of geomaterials.
Boat Ramp In December of 2011 the Department of Maritime Safety, QLD Transport and Main Roads in partnership with Wagners facilitated the R&D project to replace a deteriorated boat ramp at Rocky Point in Bundaberg. The project used pre-cast GPC concrete boat planks (40MPa) with Glass Fibre Reinforced Polymer (GFRP) reinforcing bar. The project also involved site-cast GPC concrete reinforced with GFRP to make the approach slab to the ramp. The site-cast GPC concrete was batched in Toowoomba and trucked to site with a transit time of 6.5 hours and then activated with chemical activators on site. It is noted that a unique feature of this GPC concrete is that the entire batch can be mixed in a truck and remain completely dormant until the activator chemicals are added.
Pre-Cast Bridge Decks
In 2009 one of the earliest structural applications of GPC concrete was to construct the Murrarie Plant site bridge deck using 40MPa pre-cast GPC concrete. The bridge has been successful in exhibiting no signs of distress even with continual concrete agitator truck loadings.
Pre-Cast Beams
The most significant GPC concrete milestone is the supply of 40MPa GPC concrete to produce pre-cast floor beam-slab elements as it’s the first application of modern GPC concrete into the structure of a multi-storey building. These beams play an important role in low energy space heating since water pipes are placed inside them to provide temperature controlled hydroponic heating of the building spaces below and above the GPC concrete beam.
[60]
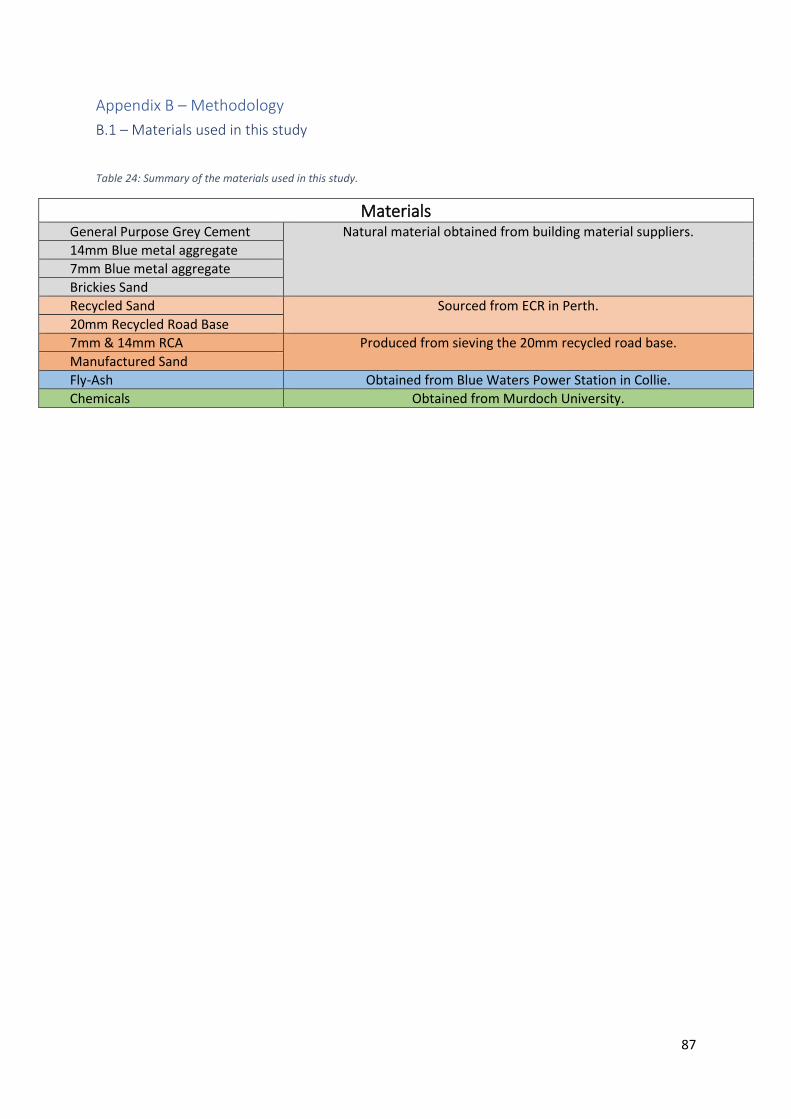
87
Appendix B – Methodology
B.1 – Materials used in this study
Table 24: Summary of the materials used in this study.
Materials General Purpose Grey Cement Natural material obtained from building material suppliers.
14mm Blue metal aggregate
7mm Blue metal aggregate
Brickies Sand
Recycled Sand Sourced from ECR in Perth. 20mm Recycled Road Base
7mm & 14mm RCA Produced from sieving the 20mm recycled road base.
Manufactured Sand
Fly-Ash Obtained from Blue Waters Power Station in Collie.
Chemicals Obtained from Murdoch University.
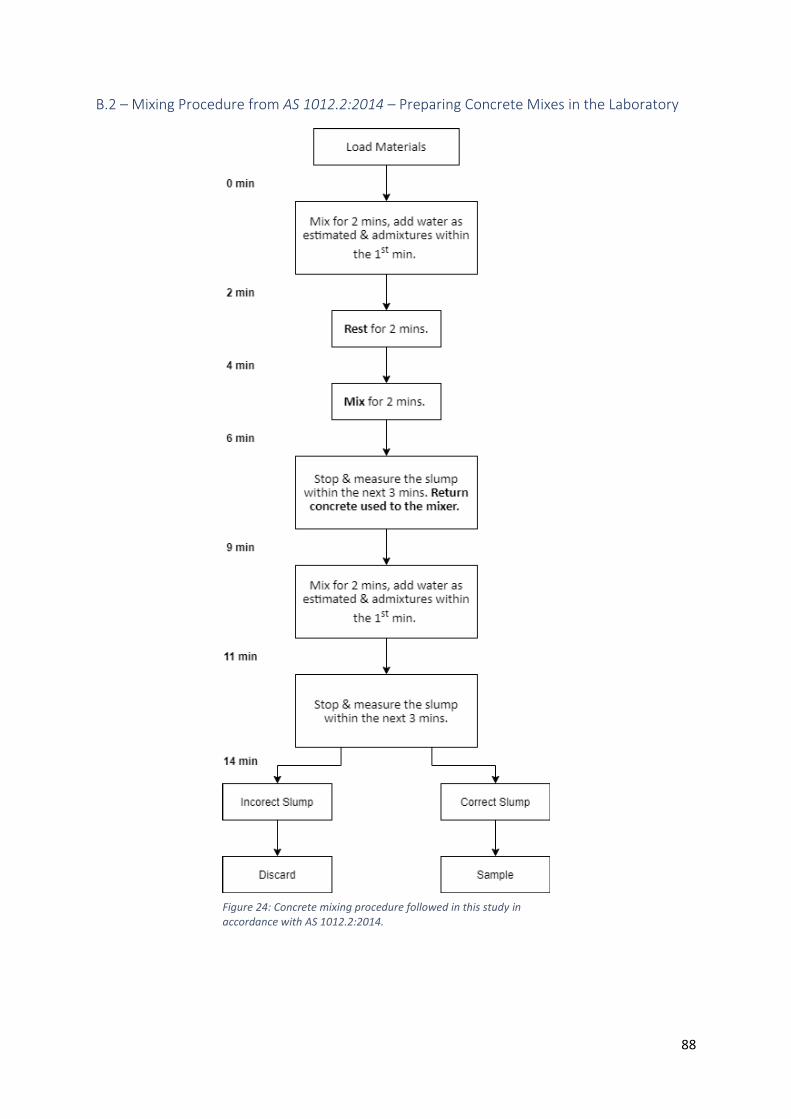
88
B.2 – Mixing Procedure from AS 1012.2:2014 – Preparing Concrete Mixes in the Laboratory
Figure 24: Concrete mixing procedure followed in this study in accordance with AS 1012.2:2014.
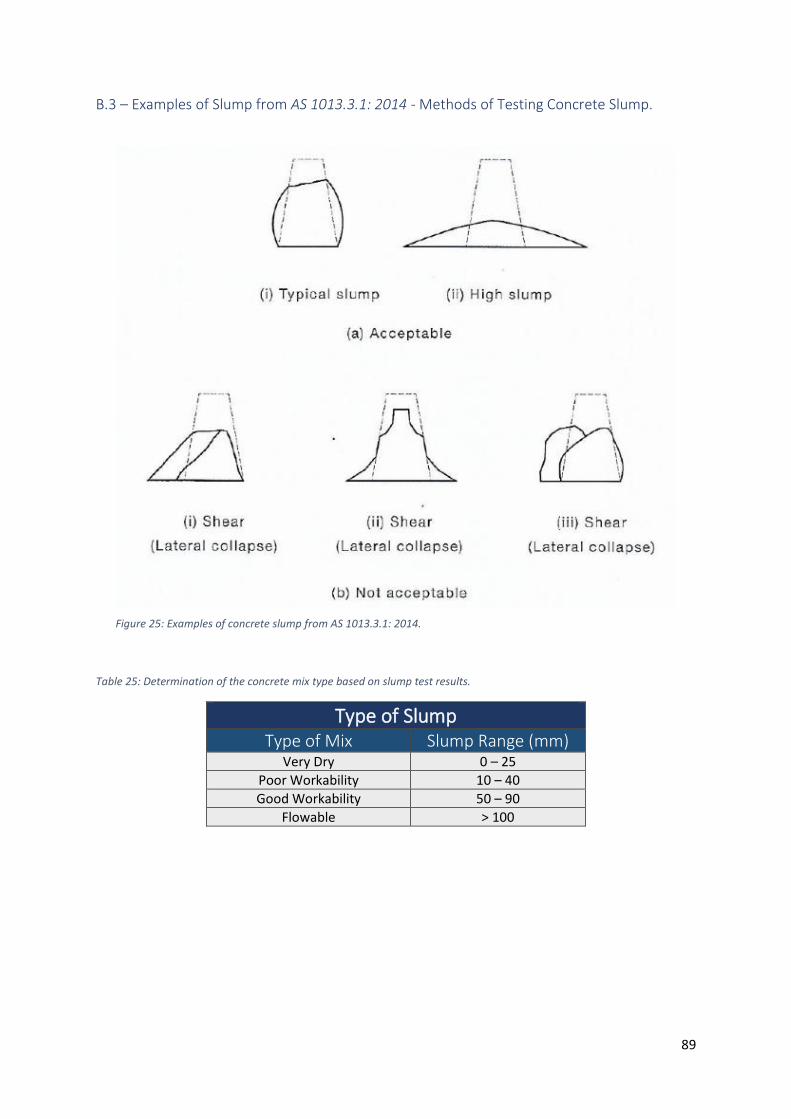
89
B.3 – Examples of Slump from AS 1013.3.1: 2014 - Methods of Testing Concrete Slump.
Table 25: Determination of the concrete mix type based on slump test results.
Type of Slump
Type of Mix Slump Range (mm) Very Dry 0 – 25
Poor Workability 10 – 40
Good Workability 50 – 90
Flowable > 100
Figure 25: Examples of concrete slump from AS 1013.3.1: 2014.
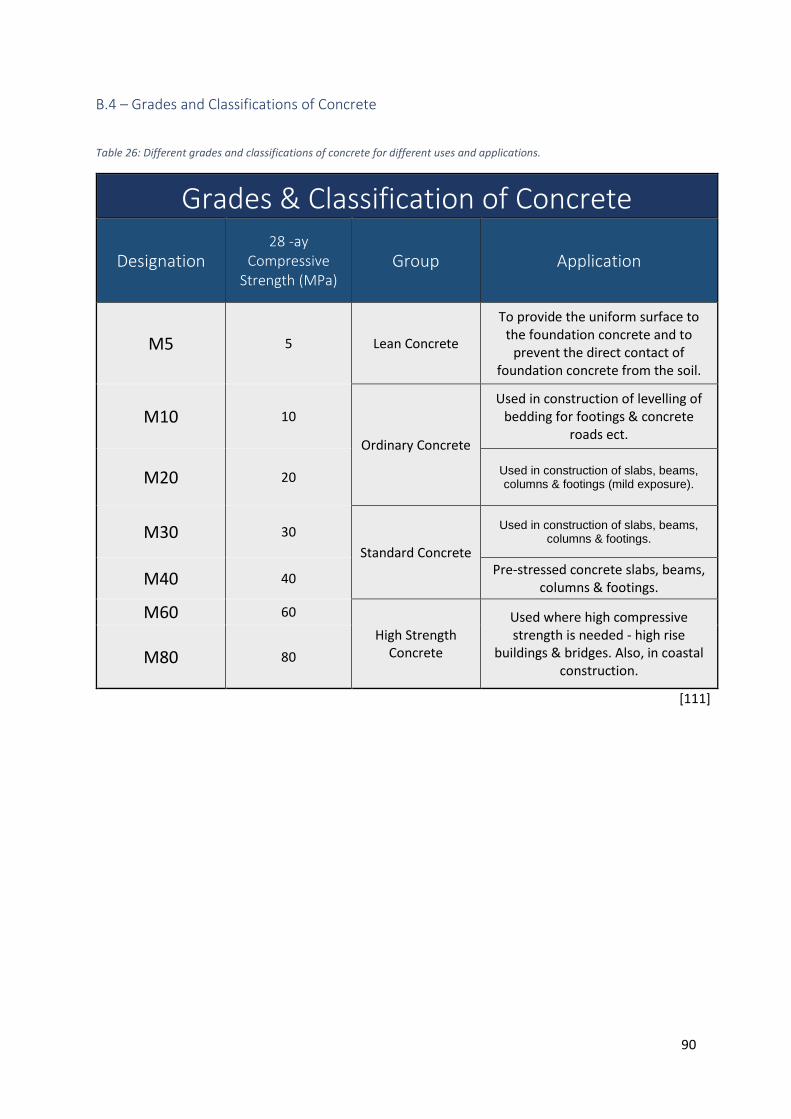
90
B.4 – Grades and Classifications of Concrete
Table 26: Different grades and classifications of concrete for different uses and applications.
Grades & Classification of Concrete
Designation 28 -ay
Compressive Strength (MPa)
Group Application
M5 5 Lean Concrete
To provide the uniform surface to the foundation concrete and to
prevent the direct contact of foundation concrete from the soil.
M10 10
Ordinary Concrete
Used in construction of levelling of bedding for footings & concrete
roads ect.
M20 20 Used in construction of slabs, beams, columns & footings (mild exposure).
M30 30
Standard Concrete
Used in construction of slabs, beams, columns & footings.
M40 40 Pre-stressed concrete slabs, beams,
columns & footings.
M60 60
High Strength Concrete
Used where high compressive strength is needed - high rise
buildings & bridges. Also, in coastal construction.
M80 80
[111]
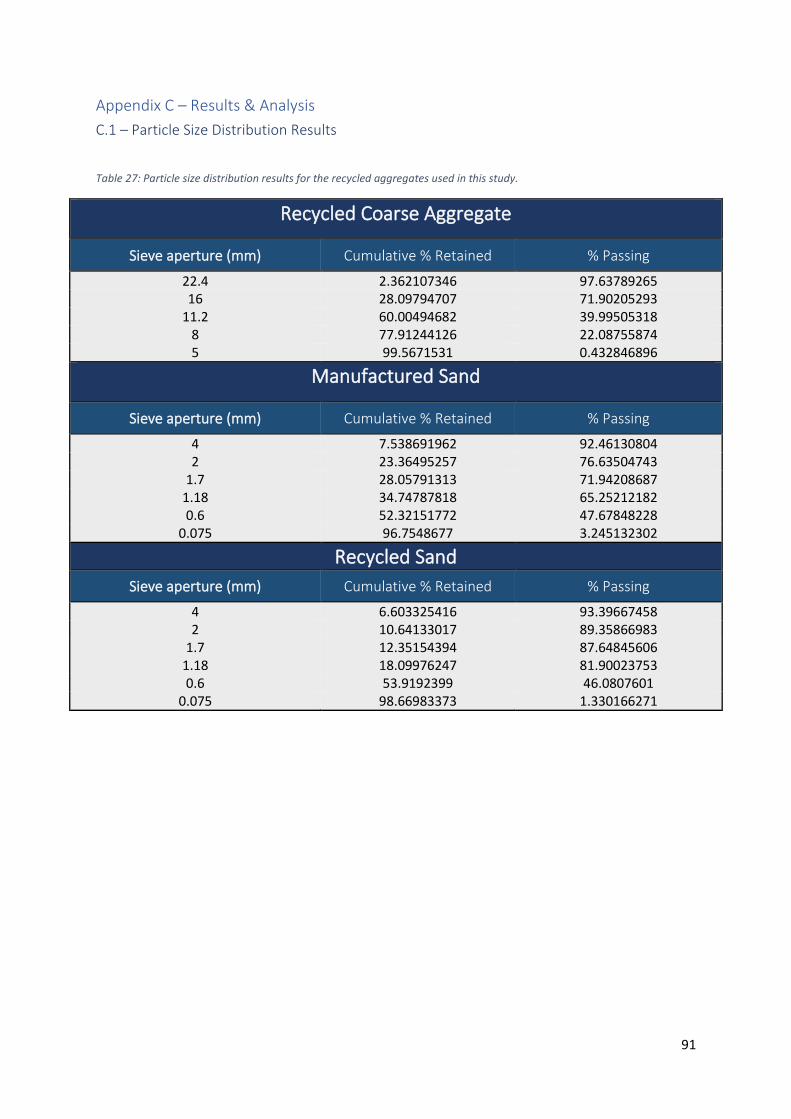
91
Appendix C – Results & Analysis
C.1 – Particle Size Distribution Results
Table 27: Particle size distribution results for the recycled aggregates used in this study.
Recycled Coarse Aggregate
Sieve aperture (mm) Cumulative % Retained % Passing
22.4 2.362107346 97.63789265 16 28.09794707 71.90205293
11.2 60.00494682 39.99505318 8 77.91244126 22.08755874 5 99.5671531 0.432846896
Manufactured Sand
Sieve aperture (mm) Cumulative % Retained % Passing
4 7.538691962 92.46130804 2 23.36495257 76.63504743
1.7 28.05791313 71.94208687 1.18 34.74787818 65.25212182 0.6 52.32151772 47.67848228
0.075 96.7548677 3.245132302
Recycled Sand
Sieve aperture (mm) Cumulative % Retained % Passing
4 6.603325416 93.39667458 2 10.64133017 89.35866983
1.7 12.35154394 87.64845606 1.18 18.09976247 81.90023753 0.6 53.9192399 46.0807601
0.075 98.66983373 1.330166271
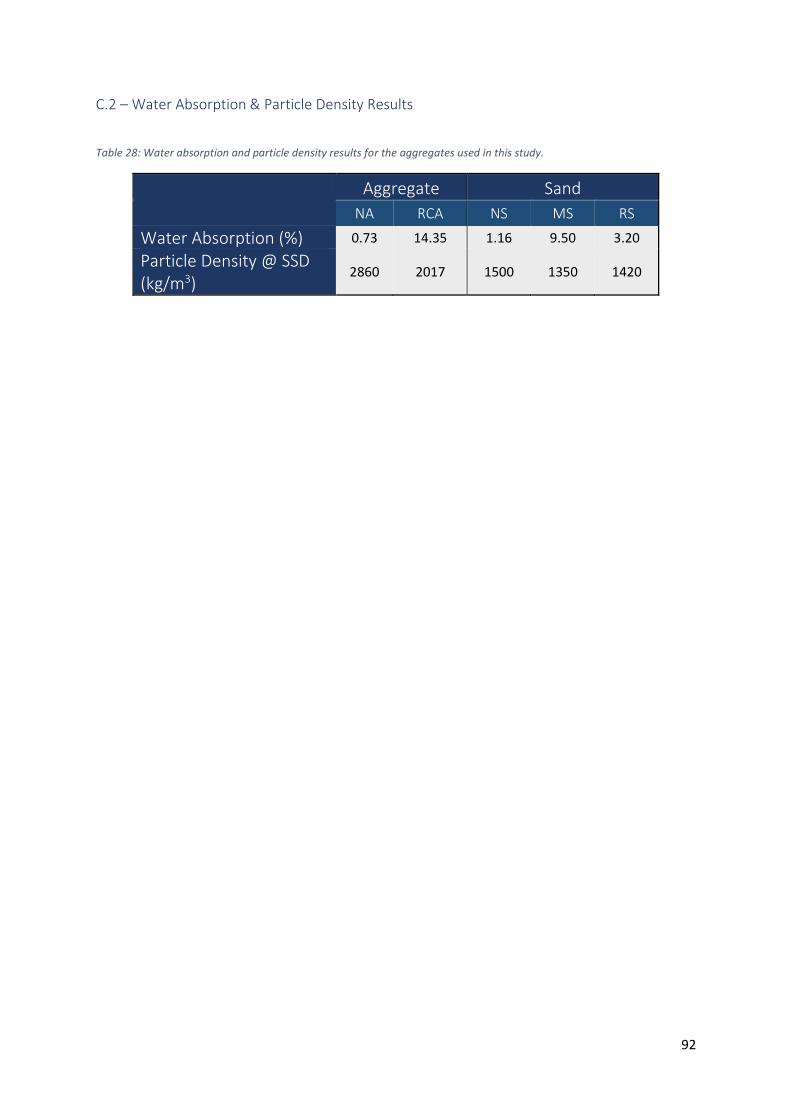
92
C.2 – Water Absorption & Particle Density Results
Table 28: Water absorption and particle density results for the aggregates used in this study.
Aggregate Sand
NA RCA NS MS RS
Water Absorption (%) 0.73 14.35 1.16 9.50 3.20
Particle Density @ SSD (kg/m3)
2860 2017 1500 1350 1420

93
C. 3 – Concrete Results
Table 29: Summary of the results for the Series 1 (OPC) concrete mixes obtained in this study.
Series 1: Portland Cement Concrete (OPC) Results
Specimen Name
Aggregate Sand Slump 1
(mm) Slump 2
(mm)
28-day Compressive
Strength (MPa)
OPC 1 Natural
Aggregate Natural Sand 65 50 51.5
OPC 2 RCA Natural Sand 50 46 33.5
OPC 3 RCA Recycled Sand 55 42 31.5
OPC 4 RCA Manufactured Sand 7 5 28
Table 30: Summary of the results for the Series 2 (GPC) concrete mixes obtained in this study.
Series 2: Geopolymer Cement Concrete (GPC) Results
Specimen Name
Aggregate Sand Slump 1
(mm) Slump 2
(mm)
28-day Compressive
Strength (MPa)
GPC 1 Natural
Aggregate Natural Sand 67 63 11.9
GPC 2 RCA Natural Sand 5 5 3.5
GPC 3 RCA Recycled Sand 95 80 6.3
GPC 4 RCA Manufactured Sand 13 12 0.9