resveratrol affects the expression of uric acid transporter by
TRANSCRIPT
MOLECULAR MEDICINE REPORTS 24: 564, 2021
Abstract. Resveratrol (RSV), a polyphenol, non‑flavonoid plant‑derived antitoxin, ameliorates hyperuricemia and kidney inflammation. The present study aimed to establish a model of high‑fat diet (HFD)‑induced insulin resistance (IR) and to determine the specific mechanism of RSV to improve kidney inflammation and reduce uric acid (UA). C57BL/6J mice were fed a HFD for 12 weeks and their glucose tolerance was evalu‑ated by intraperitoneal glucose tolerance testing. The mice were then administered RSV for 6 weeks, and blood and kidney samples were collected. Serum UA and insulin concentrations were determined using ELISA kits. Hematoxylin and eosin, periodic acid‑Schiff and Masson staining were performed to observe the pathological changes of the kidney, and electron microscopy was used to observe changes in the kidney ultra‑structure. The renal concentrations of interleukin (IL)‑6, IL‑18, IL‑1β and tumor necrosis factor‑α (TNF‑α) were measured using ELISA kits, and western blotting evaluated changes in the protein expression levels of various indicators. RSV significantly ameliorated HFD‑induced IR and reduced blood
UA levels. Long‑term IR can lead to lipid deposition, glycogen accumulation, inflammatory damage and fibrotic changes in the kidney of mice. This leads to a significant increase in the expression of UA transport‑related proteins, an increase in UA reabsorption and an increase in blood UA levels. Notably, RSV intervention was able to reverse this process. The effect of RSV may be achieved by inhibiting the NOD‑like receptor family, pyrin domain‑containing 3 (NLRP3) inflammasome and Toll‑like receptor 4 (TLR4)/myeloid differentiation factor 88/nuclear factor‑κB signaling pathway. In conclusion, RSV may improve kidney inflammation through TLR4 and NLRP3 signaling pathways, and reduce the expression of UA trans‑porter proteins in the kidney of insulin‑resistant mice, thereby reducing blood UA levels.
Introduction
Uric acid (UA) is a product of mammalian purine metabo‑lism. UA is synthesized in the liver and ~70% is secreted into kidney tubules; notably, the liver and kidney are the principal organs responsible for the regulation of serum UA (SUA) concentration (1). High SUA concentrations are associated with cardiovascular and cerebrovascular diseases, metabolic syndrome and renal insufficiency (2). The prevalence of hyperuricemia (HUA) and its complications have increased worldwide in recent decades (3).
The levels of UA in serum are partly regulated by urate transport‑related proteins; among them, urate trans‑porter 1 (URAT1) and glucose transporter 9 (GLUT9) serve an important role in renal UA reabsorption (4,5). It has been reported that the expression of GLUT9 and URAT1 is related to renal inflammation in an animal model of fructose‑induced HUA (6). In the inflammation system, Toll‑like receptor 4 (TLR4) and NOD‑like receptor family, pyrin domain‑containing 3 (NLRP3) serve an important role in regulating a cascade of events in the body (7‑9).
Resveratrol (RSV) is a polyphenol, non‑flavonoid antitoxin that is abundant in plant materials, including grapes, peanuts and Polygonum cuspidatum. RSV has been reported to exert anti‑inflammatory, anti‑oxidative, anti‑tumor and anti‑cardio‑vascular disease effects, to inhibit lipid peroxidation and to extend life in mice (10). Effects of RSV on amelioration of IR,
Resveratrol affects the expression of uric acid transporter by improving inflammation
XUEMEI ZHANG1,2, QIAN NIE1,3, ZHIMEI ZHANG1,3, JING ZHAO4, FENGXIAO ZHANG2, CHAO WANG3, XING WANG3 and GUANGYAO SONG1,3
1Department of Internal Medicine, Hebei Medical University; 2Department of Rheumatism and Immunology, 3Hebei Key Laboratory of Metabolic Diseases, 4Department of Oncology,
Hebei General Hospital, Shijiazhuang, Hebei 050000, P.R. China
Received March 26, 2021; Accepted May 27, 2021
DOI: 10.3892/mmr.2021.12203
Correspondence to: Dr Guangyao Song, Hebei Key Laboratory of Metabolic Diseases, Hebei General Hospital, 348 Heping West Road, Shijiazhuang, Hebei 050000, P.R. ChinaE‑mail: [email protected]
Abbreviations: RSV, resveratrol; IR, insulin resistance; HFD, high‑fat diet; UA, uric acid; SUA, serum uric acid; HUA, hyperuricemia; IPGTT, intraperitoneal glucose tolerance testing; TG, triglyceride; TC, total cholesterol; HDL‑C, high‑density lipoprotein‑cholesterol; LDL‑C, low‑density lipoprotein‑cholesterol; H&E, hematoxylin and eosin; PAS, periodic acid‑Schiff; IL‑6, interleukin‑6; IL‑18, interleukin‑18; IL‑1β, interleukin‑1β; TNF‑α, tumor necrosis factor‑α; GLUT9, glucose transporter 9; URAT1, urate transporter 1; MCP‑1, monocyte chemotactic protein‑1; NLRP3, NOD‑like receptor family, pyrin domain‑containing 3; ASC, apoptosis‑associated speck‑like protein; MyD88, myeloid differentiation factor 88; TRAF6, TNF receptor‑associated factor 6; TAK1, TGF‑β‑activated kinase 1; NF‑κB, nuclear factor‑κB; TLR4, Toll‑like receptor 4
Key words: RSV, UA, inflammation, GLUT9, URAT1
ZHANG et al: RESVERATROL AFFECTS URIC ACID TRANSPORTER BY IMPROVING INFLAMMATION2
and liver and kidney pathologies have been shown in several animal models (11,12).
The present study investigated the effects and mechanisms of RSV on high‑fat diet (HFD)‑induced HUA and renal inflam‑mation in mice. The present study aimed to verify whether RSV could affect the expression of GLUT9 and URAT1 in the kidney. Additionally, whether the effects of RSV were associated with suppression of the TLR4/myeloid differentia‑/myeloid differentia‑myeloid differentia‑tion factor 88 (MyD88)/nuclear factor‑κB (NF‑κB) signaling pathway and NLRP3 inflammasome were investigated.
Materials and methods
Animal model. A total of 30 6‑week‑old male C57BL/6J mice (weight, 21.0‑23.0 g) were purchased from Beijing Weitong Lihua Experimental Animal Center [license no. SCXK (Beijing, China) 2016‑0006] and housed in the Clinical Medical Research Center of Hebei General Hospital. The room temperature was controlled at 23‑25˚C and the relative humidity was ~60%; the mice were maintained under a 12‑h light/dark cycle and had free access to food and water. The present study was approved by the Ethics Committee of Hebei General Hospital Ethical Committee (approval no. 2019E367; Shijiazhuang, China) and was conducted in accordance with the international rules for the use of experimental animals.
After 1 week of adaptation, the mice were allocated to two groups: A control group (Con, n=10), which was fed a standard diet (D12450J: 20% protein, 70% carbohydrate, 10% fat, 3.85 kcal/g); and a HFD group (n=20), which was fed a HFD (D12492: 20% protein, 20% carbohydrate, 60% fat, 5.24 kcal/g). Both diets were purchased from Beijing Huafukang Biotechnology Co., Ltd. The body mass and food intake of the mice were recorded weekly during the study. After 12 weeks, intraperitoneal glucose tolerance testing (IPGTT) (13) was performed after 12 h of fasting, and the area under the curve (AUC) was calculated to confirm the development of glucose intolerance in the HFD group. AUC is calculated using the approximate trapezoidal area (The side length is the blood glucose value at different time points, the height is the time, and the AUC value is the sum of the four trapezoidal areas under the curve. AUC does not have a specific value that proves impaired glucose tolerance. It is based on the difference between the groups to compare the abnormalities of glucose tolerance.) Blood was taken from the tail vein at 0, 15, 30, 60 and 120 min to test glucose levels by an Accuchek Active Meter (ACCU‑CHEK Roche; Roche Diagnostics GmbH).A total of 10 mice from the HFD group were then randomly selected to form a HFD + RSV group, which was administered 100 mg/kg RSV (Sigma‑Aldrich; Merck KGaA) (14). The drug concentration of RSV intervention was obtained according to the reference (10). Our research group explored the concentra‑tion of RSV in a previous study (15), and 100 mg/kg RSV was revealed to exert beneficial effect on insulin sensitivity without toxicity. RSV was administered daily by gavage for 6 weeks, and the remaining mice in the HFD group and those in the Con group were administered vehicle (0.9% sodium chloride solution containing 0.1% DMSO) by gavage over the same time period.
At the end of this period, the mice were fasted for 12 h overnight, euthanized by cervical dislocation and blood was
collected by cardiac puncture. The right kidneys were quickly removed and rinsed with pre‑cooled 0.9% sodium chloride solution. A small piece of each kidney was fixed in 4% para‑formaldehyde (6 h; 4˚C), in addition, small pieces of kidney (1x1x2 mm) were fixed in transmission electron micros‑copy (TEM) fixing solution (TEM fixative; Wuhan Servicebio Technology Co., Ltd.), and the remaining tissue was frozen in liquid nitrogen for western blotting or ELISA and then stored at ‑80˚C.
Measurement of the serum concentrations of key substances. The serum concentrations of triglyceride (TG; cat. no. A110‑1‑1), total cholesterol (TC; cat. no. A111‑1‑1), high‑density l ipoprotein‑cholesterol (HDL‑C; cat. no. A112‑1‑1) and low‑density lipoprotein‑cholesterol (LDL‑C; cat. no. A113‑1‑1) were measured using kits from the Nanjing Jiancheng Bioengineering Institute according to manufac‑turer's protocol. SUA was measured using kit from Beijing Solarbio Science & Technology Co., Ltd. (cat. no. BC1365) and insulin concentrations were determined using ELISA kits from Alpco (cat. no. 80‑INSMSU‑E01) according to manu‑facturer's protocol. The Qualitative Insulin Sensitivity Check Index (QUICKI) was determined according to the equation: QUICKI = 1/[log(I0) + log(G0)]) (16), in which I0 is fasting insulin and G0 is fasting glucose.
Histological assessment of kidney tissue. The kidney samples fixed in 4% paraformaldehyde (6 h; 4˚C) were dehydrated using an alcohol gradient, clarified using xylene, embedded in paraf‑finand sectioned at 5‑µm thickness. Sections were then stained with H&E (Beijing Solarbio Science & Technology Co., Ltd.; cat. no. G1005, hematoxylin staining for 5 min, staining in eosin solution for 5 min, both at room temperature), periodic acid‑Schiff (PAS; Beijing Solarbio Science & Technology Co., Ltd.; cat. no. G1008, PAS dye solution B for 10‑15 min, staining with PAS A for 25‑30 min in the dark, staining with PAS C for 30 sec, all at room temperature) or Masson's trichrome(Beijing Solarbio Science & Technology Co., Ltd.; cat. no. G1006, Masson D for 6 min, Masson E for 1 min, both at room temperature) according to manufacturer's protocol, and examined under a light microscope (magnification, x400).
Electron microscopy. Kidney samples to be used for electron microscopy were, post‑fixed in 1% osmium tetroxide, dehy‑drated and embedded in Epon (1 h; 4˚C) in the longitudinal orientation. After an initial low‑power screening of semithin (300 nm) sections stained with toluidine blue to optimize the plane of sectioning, ultrathin (60 nm) longitudinal sections were cut for each sample. Briefly, the sections were mounted on copper grids, and stained with lead citrate and uranyl acetate (8 min; 37˚C). For each biopsy, ≥10 longitudinal sections were examined by TEM (HT7800/HT7700; Hitachi Ltd.) at an accelerating voltage of 80 kV. A minimum of 10 micrographs were taken at x2,500 magnification.
Measurement of the renal concentrations of interleukin (IL)‑6, IL‑18, IL‑1β and tumor necrosis factor‑α (TNF‑α). Briefly, ~0.3 g kidney tissue was added to 2.7 ml 0.9% sodium chlo‑ride and the tissue was homogenized on ice. The homogenate was then centrifuged at 1,500 x g at 4˚C for 10 min and the
MOLECULAR MEDICINE REPORTS 24: 564, 2021 3
supernatant was removed. The renal concentrations of IL‑6 (cat. no. 88‑7064; Thermo Fisher Scientific, Inc.), IL‑18 (cat. no. EK218‑24; Multi Sciences; www.liankebio.com), IL‑1β (cat. no. 88‑7013; Thermo Fisher Scientific, Inc.) and TNF‑α (cat. no. 88‑7324, Thermo Fisher Scientific, Inc.) were measured using ELISA kits, according to the manufacturer's instructions.
Western blotting. Kidney samples (~50 mg) were weighed on an electronic balance, then pre‑cooled 0.5‑ml aliquots of RIPA buffer (Beijing Solarbio Science & Technology Co., Ltd.; cat. no. G2002) were added, and the samples were homogenized and left at 4˚C overnight. Subsequently, the homogenates were centrifuged at 4˚C and 16,200 x g for 15 min and the super‑natants were collected. Lysates containing 50 µg protein were separated by SDS‑PAGE (stacking gel, 10%; resolving gel, 5%) and wet electro‑transferred to nitrocellulose membranes, which were blocked in buffer containing 5% skimmed milk powder at room temperature for 4 h. The membranes were then incubated with the following primary antibodies (dilution, 1:1,000) at 4˚C overnight: Anti‑GLUT9 (cat. no. 26486‑1‑AP), anti‑URAT1 (cat. no. 14937‑1‑AP), anti‑monocyte chemotactic protein‑1 (MCP‑1; cat no. 25542‑1‑AP), anti‑NLRP3 (cat. no. a5652; ABclonal Biotech Co., Ltd.), anti‑apoptosis‑associ‑ated speck‑like protein (ASC; cat. no. 67494‑1‑Ig), anti‑MyD88 (cat. no. BS‑1047R; BIOSS), anti‑TNF receptor‑associated factor 6 (TRAF6; cat. no. 66498‑1‑Ig), anti‑TGF‑β‑activated kinase 1 (TAK1; cat. no. 12330‑2‑AP), anti‑NF‑κB p65 (cat. no. 66535‑1‑Ig), anti‑caspase‑1 (cat. no. 22915‑1‑AP), anti‑TLR4 (cat. no. 19811‑1‑AP) and anti‑β‑actin (cat. no. 20536‑1‑AP) (Remaining antibodies except anti‑NLRP3 and anti‑MyD8 all purchased from ProteinTech Group, Inc.). After three washes with Tris‑buffered saline‑Tween‑20 (20%) solution, the membranes were incubated with horseradish peroxidase‑conju‑gated secondary antibodies (anti‑rabbit secondary antibody; dilution,1:8,000; cat. no. SA00001‑2; ProteinTech Group, Inc.; anti‑mouse secondary antibodies; dilution, 1:8,000; cat. no. GB23301; Beijing Solarbio Science & Technology Co., Ltd.) for 2 h at room temperature. Finally, enhanced chemilu‑minescence (Beijing Solarbio Science & Technology Co., Ltd.; cat. no. G2014) and X‑ray film exposure were used to identify specific protein bands. The optical densities of the target bands were measured using the Alpha software processing system (AlphaEaseFC 4.0; ProteinSimple).
Statistical analysis. All experiments are repeated three times. All data were analyzed using SPSS 22.0 software (IBM, Inc.) and are expressed as the mean ± SD. Normally distributed data were analyzed using the independent sample t‑test or one‑way ANOVA. One‑way ANOVA was used for statistical analysis followed by Bonferroni's multiple comparison test or Tamhane's multiple comparison test. P<0.05 was considered to indicate a statistically significant difference.
Results
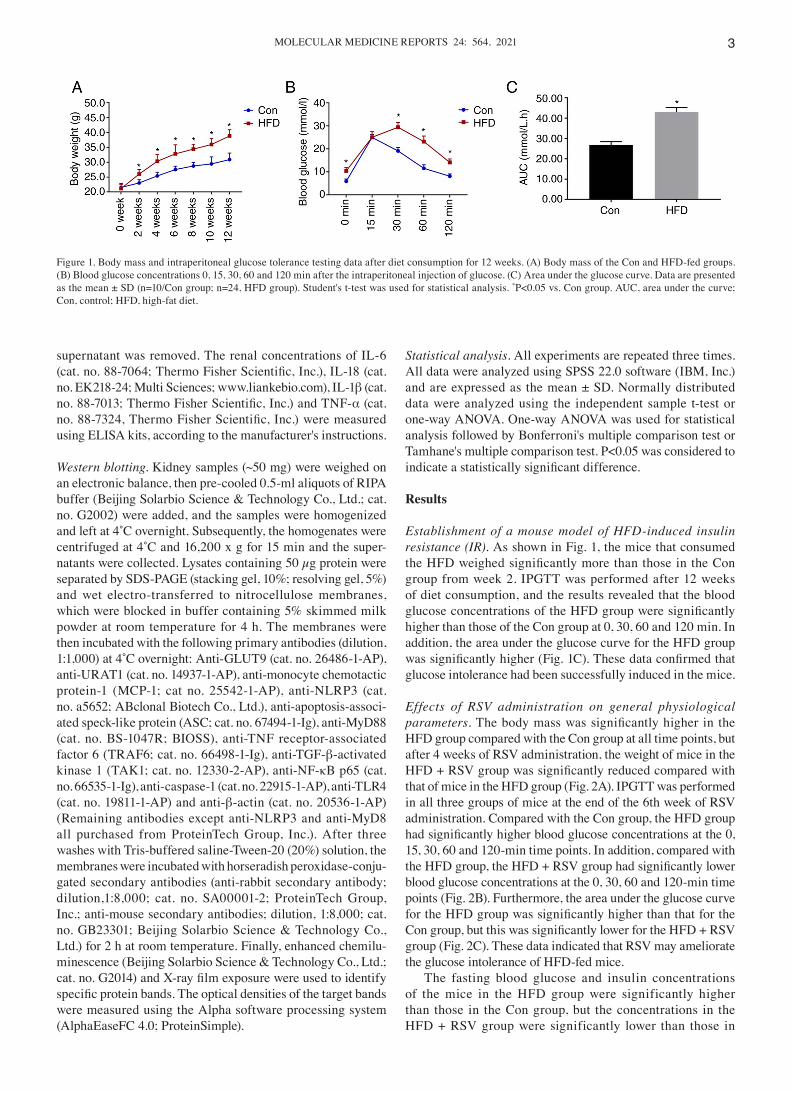
Establishment of a mouse model of HFD‑induced insulin resistance (IR). As shown in Fig. 1, the mice that consumed the HFD weighed significantly more than those in the Con group from week 2. IPGTT was performed after 12 weeks of diet consumption, and the results revealed that the blood glucose concentrations of the HFD group were significantly higher than those of the Con group at 0, 30, 60 and 120 min. In addition, the area under the glucose curve for the HFD group was significantly higher (Fig. 1C). These data confirmed that glucose intolerance had been successfully induced in the mice.
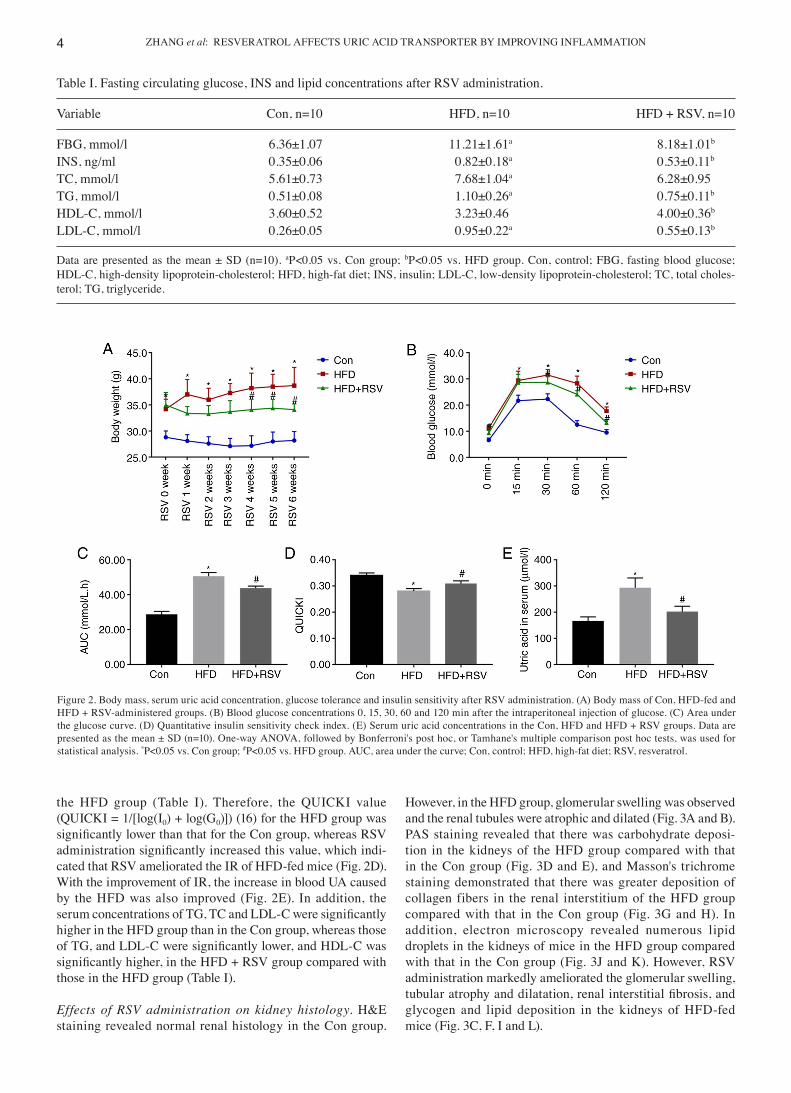
Effects of RSV administration on general physiological parameters. The body mass was significantly higher in the HFD group compared with the Con group at all time points, but after 4 weeks of RSV administration, the weight of mice in the HFD + RSV group was significantly reduced compared with that of mice in the HFD group (Fig. 2A). IPGTT was performed in all three groups of mice at the end of the 6th week of RSV administration. Compared with the Con group, the HFD group had significantly higher blood glucose concentrations at the 0, 15, 30, 60 and 120‑min time points. In addition, compared with the HFD group, the HFD + RSV group had significantly lower blood glucose concentrations at the 0, 30, 60 and 120‑min time points (Fig. 2B). Furthermore, the area under the glucose curve for the HFD group was significantly higher than that for the Con group, but this was significantly lower for the HFD + RSV group (Fig. 2C). These data indicated that RSV may ameliorate the glucose intolerance of HFD‑fed mice.
The fasting blood glucose and insulin concentrations of the mice in the HFD group were significantly higher than those in the Con group, but the concentrations in the HFD + RSV group were significantly lower than those in
Figure 1. Body mass and intraperitoneal glucose tolerance testing data after diet consumption for 12 weeks. (A) Body mass of the Con and HFD‑fed groups. (B) Blood glucose concentrations 0, 15, 30, 60 and 120 min after the intraperitoneal injection of glucose. (C) Area under the glucose curve. Data are presented as the mean ± SD (n=10/Con group; n=24, HFD group). Student's t‑test was used for statistical analysis. *P<0.05 vs. Con group. AUC, area under the curve; Con, control; HFD, high‑fat diet.
ZHANG et al: RESVERATROL AFFECTS URIC ACID TRANSPORTER BY IMPROVING INFLAMMATION4
the HFD group (Table I). Therefore, the QUICKI value (QUICKI = 1/[log(I0) + log(G0)]) (16) for the HFD group was significantly lower than that for the Con group, whereas RSV administration significantly increased this value, which indi‑cated that RSV ameliorated the IR of HFD‑fed mice (Fig. 2D). With the improvement of IR, the increase in blood UA caused by the HFD was also improved (Fig. 2E). In addition, the serum concentrations of TG, TC and LDL‑C were significantly higher in the HFD group than in the Con group, whereas those of TG, and LDL‑C were significantly lower, and HDL‑C was significantly higher, in the HFD + RSV group compared with those in the HFD group (Table I).
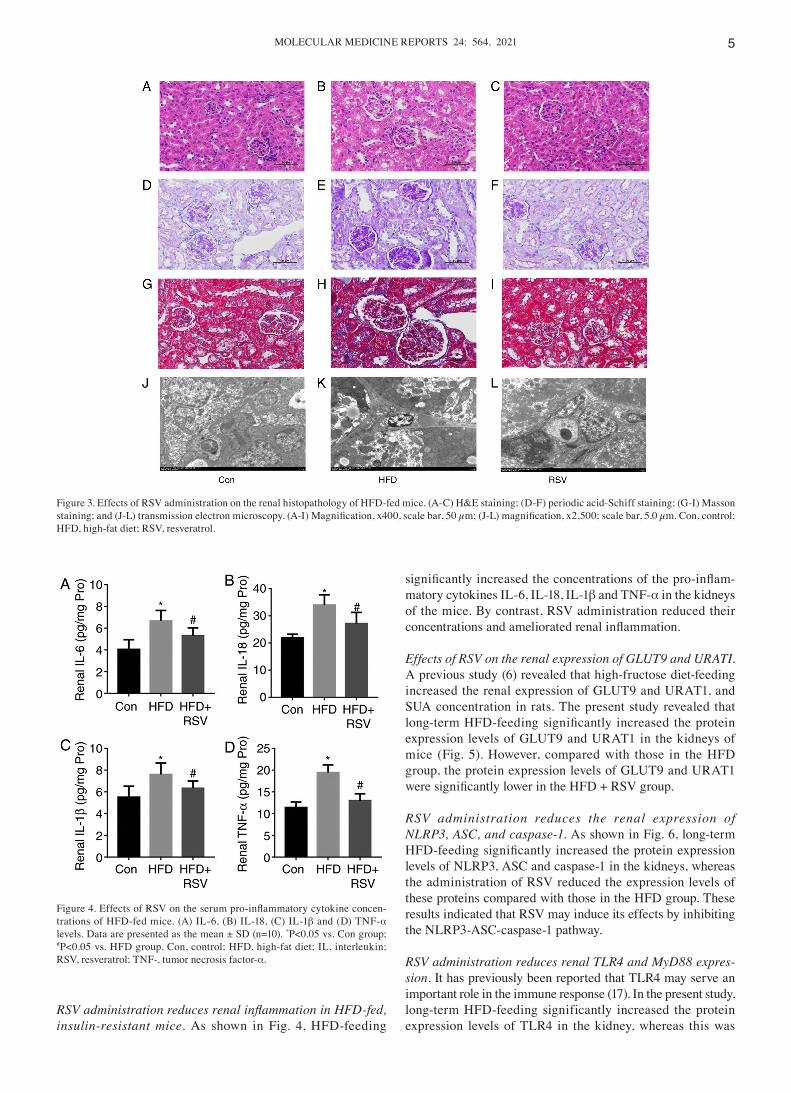
Effects of RSV administration on kidney histology. H&E staining revealed normal renal histology in the Con group.
However, in the HFD group, glomerular swelling was observed and the renal tubules were atrophic and dilated (Fig. 3A and B). PAS staining revealed that there was carbohydrate deposi‑tion in the kidneys of the HFD group compared with that in the Con group (Fig. 3D and E), and Masson's trichrome staining demonstrated that there was greater deposition of collagen fibers in the renal interstitium of the HFD group compared with that in the Con group (Fig. 3G and H). In addition, electron microscopy revealed numerous lipid droplets in the kidneys of mice in the HFD group compared with that in the Con group (Fig. 3J and K). However, RSV administration markedly ameliorated the glomerular swelling, tubular atrophy and dilatation, renal interstitial fibrosis, and glycogen and lipid deposition in the kidneys of HFD‑fed mice (Fig. 3C, F, I and L).
Table Ⅰ. Fasting circulating glucose, INS and lipid concentrations after RSV administration.
Variable Con, n=10 HFD, n=10 HFD + RSV, n=10
FBG, mmol/l 6.36±1.07 11.21±1.61a 8.18±1.01b
INS, ng/ml 0.35±0.06 0.82±0.18a 0.53±0.11b
TC, mmol/l 5.61±0.73 7.68±1.04a 6.28±0.95TG, mmol/l 0.51±0.08 1.10±0.26a 0.75±0.11b
HDL‑C, mmol/l 3.60±0.52 3.23±0.46 4.00±0.36b
LDL‑C, mmol/l 0.26±0.05 0.95±0.22a 0.55±0.13b
Data are presented as the mean ± SD (n=10). aP<0.05 vs. Con group; bP<0.05 vs. HFD group. Con, control; FBG, fasting blood glucose; HDL‑C, high‑density lipoprotein‑cholesterol; HFD, high‑fat diet; INS, insulin; LDL‑C, low‑density lipoprotein‑cholesterol; TC, total choles‑terol; TG, triglyceride.
Figure 2. Body mass, serum uric acid concentration, glucose tolerance and insulin sensitivity after RSV administration. (A) Body mass of Con, HFD‑fed and HFD + RSV‑administered groups. (B) Blood glucose concentrations 0, 15, 30, 60 and 120 min after the intraperitoneal injection of glucose. (C) Area under the glucose curve. (D) Quantitative insulin sensitivity check index. (E) Serum uric acid concentrations in the Con, HFD and HFD + RSV groups. Data are presented as the mean ± SD (n=10). One‑way ANOVA, followed by Bonferroni's post hoc, or Tamhane's multiple comparison post hoc tests, was used for statistical analysis. *P<0.05 vs. Con group; #P<0.05 vs. HFD group. AUC, area under the curve; Con, control; HFD, high‑fat diet; RSV, resveratrol.
MOLECULAR MEDICINE REPORTS 24: 564, 2021 5
RSV administration reduces renal inflammation in HFD‑fed, insulin‑resistant mice. As shown in Fig. 4, HFD‑feeding
significantly increased the concentrations of the pro‑inflam‑matory cytokines IL‑6, IL‑18, IL‑1β and TNF‑α in the kidneys of the mice. By contrast, RSV administration reduced their concentrations and ameliorated renal inflammation.
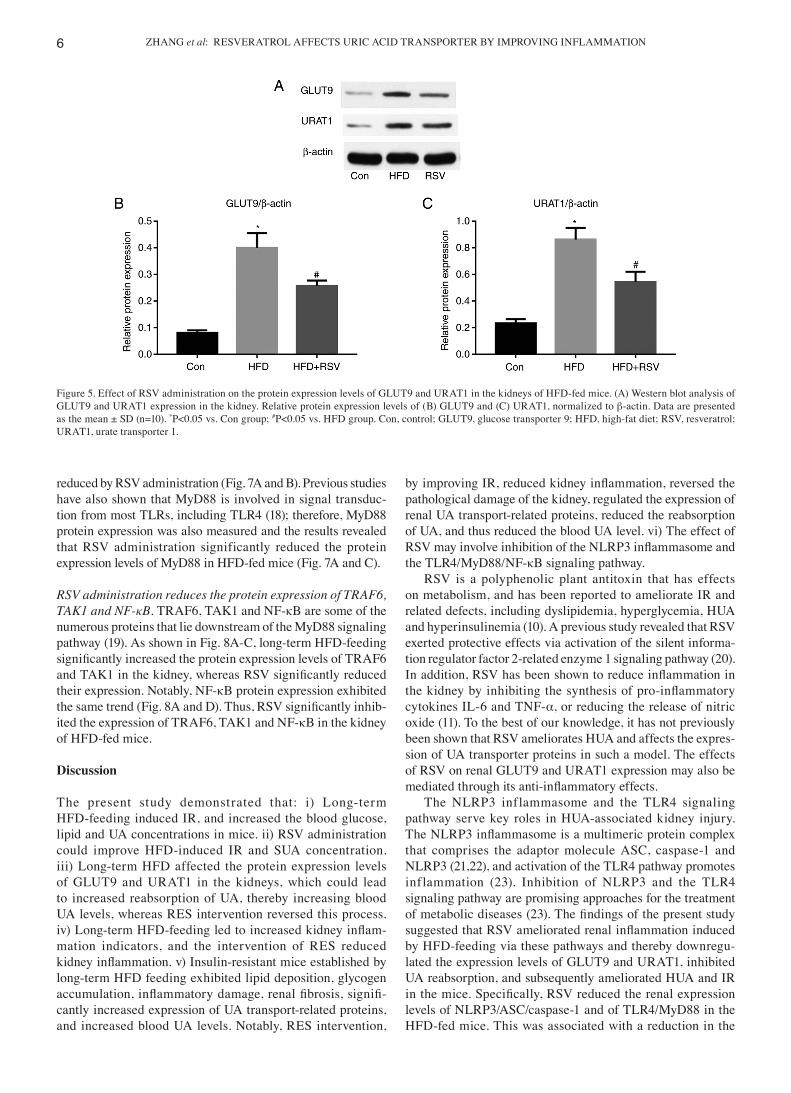
Effects of RSV on the renal expression of GLUT9 and URATI. A previous study (6) revealed that high‑fructose diet‑feeding increased the renal expression of GLUT9 and URAT1, and SUA concentration in rats. The present study revealed that long‑term HFD‑feeding significantly increased the protein expression levels of GLUT9 and URAT1 in the kidneys of mice (Fig. 5). However, compared with those in the HFD group, the protein expression levels of GLUT9 and URAT1 were significantly lower in the HFD + RSV group.
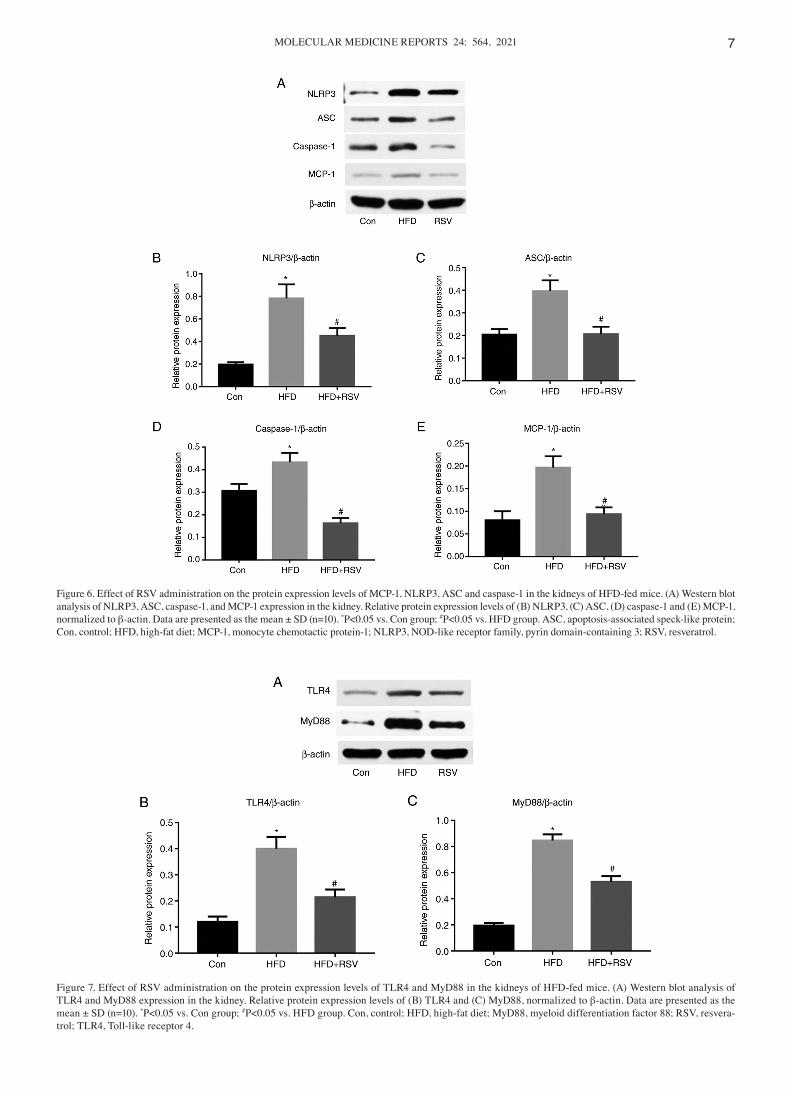
RSV administration reduces the renal expression of NLRP3, ASC, and caspase‑1. As shown in Fig. 6, long‑term HFD‑feeding significantly increased the protein expression levels of NLRP3, ASC and caspase‑1 in the kidneys, whereas the administration of RSV reduced the expression levels of these proteins compared with those in the HFD group. These results indicated that RSV may induce its effects by inhibiting the NLRP3‑ASC‑caspase‑1 pathway.
RSV administration reduces renal TLR4 and MyD88 expres‑sion. It has previously been reported that TLR4 may serve an important role in the immune response (17). In the present study, long‑term HFD‑feeding significantly increased the protein expression levels of TLR4 in the kidney, whereas this was
Figure 3. Effects of RSV administration on the renal histopathology of HFD‑fed mice. (A‑C) H&E staining; (D‑F) periodic acid‑Schiff staining; (G‑I) Masson staining; and (J‑L) transmission electron microscopy. (A‑I) Magnification, x400, scale bar, 50 µm; (J‑L) magnification, x2,500; scale bar, 5.0 µm. Con, control; HFD, high‑fat diet; RSV, resveratrol.
Figure 4. Effects of RSV on the serum pro‑inflammatory cytokine concen‑trations of HFD‑fed mice. (A) IL‑6, (B) IL‑18, (C) IL‑1β and (D) TNF‑α levels. Data are presented as the mean ± SD (n=10). *P<0.05 vs. Con group; #P<0.05 vs. HFD group. Con, control; HFD, high‑fat diet; IL, interleukin; RSV, resveratrol; TNF‑, tumor necrosis factor‑α.
ZHANG et al: RESVERATROL AFFECTS URIC ACID TRANSPORTER BY IMPROVING INFLAMMATION6
reduced by RSV administration (Fig. 7A and B). Previous studies have also shown that MyD88 is involved in signal transduc‑tion from most TLRs, including TLR4 (18); therefore, MyD88 protein expression was also measured and the results revealed that RSV administration significantly reduced the protein expression levels of MyD88 in HFD‑fed mice (Fig. 7A and C).
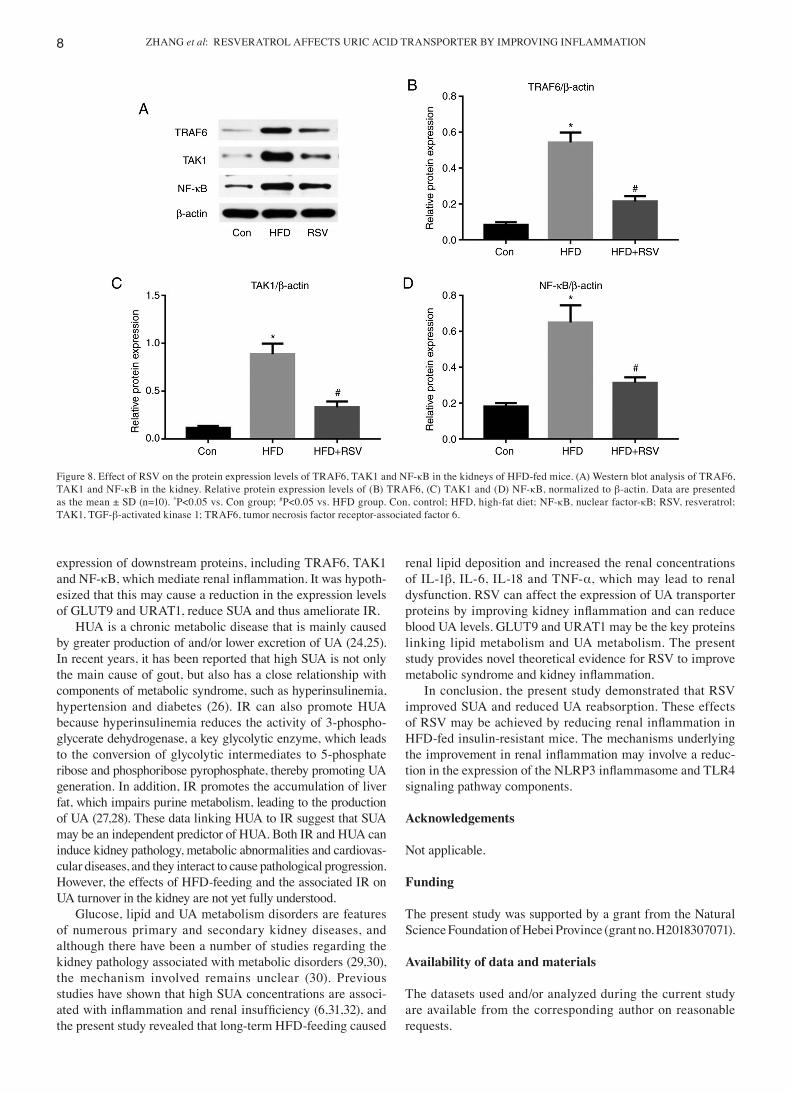
RSV administration reduces the protein expression of TRAF6, TAK1 and NF‑κB. TRAF6, TAK1 and NF‑κB are some of the numerous proteins that lie downstream of the MyD88 signaling pathway (19). As shown in Fig. 8A‑C, long‑term HFD‑feeding significantly increased the protein expression levels of TRAF6 and TAK1 in the kidney, whereas RSV significantly reduced their expression. Notably, NF‑κB protein expression exhibited the same trend (Fig. 8A and D). Thus, RSV significantly inhib‑ited the expression of TRAF6, TAK1 and NF‑κB in the kidney of HFD‑fed mice.
Discussion
The present study demonstrated that: i) Long‑term HFD‑feeding induced IR, and increased the blood glucose, lipid and UA concentrations in mice. ii) RSV administration could improve HFD‑induced IR and SUA concentration. iii) Long‑term HFD affected the protein expression levels of GLUT9 and URAT1 in the kidneys, which could lead to increased reabsorption of UA, thereby increasing blood UA levels, whereas RES intervention reversed this process. iv) Long‑term HFD‑feeding led to increased kidney inflam‑mation indicators, and the intervention of RES reduced kidney inflammation. v) Insulin‑resistant mice established by long‑term HFD feeding exhibited lipid deposition, glycogen accumulation, inflammatory damage, renal fibrosis, signifi‑cantly increased expression of UA transport‑related proteins, and increased blood UA levels. Notably, RES intervention,
by improving IR, reduced kidney inflammation, reversed the pathological damage of the kidney, regulated the expression of renal UA transport‑related proteins, reduced the reabsorption of UA, and thus reduced the blood UA level. vi) The effect of RSV may involve inhibition of the NLRP3 inflammasome and the TLR4/MyD88/NF‑κB signaling pathway.
RSV is a polyphenolic plant antitoxin that has effects on metabolism, and has been reported to ameliorate IR and related defects, including dyslipidemia, hyperglycemia, HUA and hyperinsulinemia (10). A previous study revealed that RSV exerted protective effects via activation of the silent informa‑tion regulator factor 2‑related enzyme 1 signaling pathway (20). In addition, RSV has been shown to reduce inflammation in the kidney by inhibiting the synthesis of pro‑inflammatory cytokines IL‑6 and TNF‑α, or reducing the release of nitric oxide (11). To the best of our knowledge, it has not previously been shown that RSV ameliorates HUA and affects the expres‑sion of UA transporter proteins in such a model. The effects of RSV on renal GLUT9 and URAT1 expression may also be mediated through its anti‑inflammatory effects.
The NLRP3 inflammasome and the TLR4 signaling pathway serve key roles in HUA‑associated kidney injury. The NLRP3 inflammasome is a multimeric protein complex that comprises the adaptor molecule ASC, caspase‑1 and NLRP3 (21,22), and activation of the TLR4 pathway promotes inflammation (23). Inhibition of NLRP3 and the TLR4 signaling pathway are promising approaches for the treatment of metabolic diseases (23). The findings of the present study suggested that RSV ameliorated renal inflammation induced by HFD‑feeding via these pathways and thereby downregu‑lated the expression levels of GLUT9 and URAT1, inhibited UA reabsorption, and subsequently ameliorated HUA and IR in the mice. Specifically, RSV reduced the renal expression levels of NLRP3/ASC/caspase‑1 and of TLR4/MyD88 in the HFD‑fed mice. This was associated with a reduction in the
Figure 5. Effect of RSV administration on the protein expression levels of GLUT9 and URAT1 in the kidneys of HFD‑fed mice. (A) Western blot analysis of GLUT9 and URAT1 expression in the kidney. Relative protein expression levels of (B) GLUT9 and (C) URAT1, normalized to β‑actin. Data are presented as the mean ± SD (n=10). *P<0.05 vs. Con group; #P<0.05 vs. HFD group. Con, control; GLUT9, glucose transporter 9; HFD, high‑fat diet; RSV, resveratrol; URAT1, urate transporter 1.
MOLECULAR MEDICINE REPORTS 24: 564, 2021 7
Figure 6. Effect of RSV administration on the protein expression levels of MCP‑1, NLRP3, ASC and caspase‑1 in the kidneys of HFD‑fed mice. (A) Western blot analysis of NLRP3, ASC, caspase‑1, and MCP‑1 expression in the kidney. Relative protein expression levels of (B) NLRP3, (C) ASC, (D) caspase‑1 and (E) MCP‑1, normalized to β‑actin. Data are presented as the mean ± SD (n=10). *P<0.05 vs. Con group; #P<0.05 vs. HFD group. ASC, apoptosis‑associated speck‑like protein; Con, control; HFD, high‑fat diet; MCP‑1, monocyte chemotactic protein‑1; NLRP3, NOD‑like receptor family, pyrin domain‑containing 3; RSV, resveratrol.
Figure 7. Effect of RSV administration on the protein expression levels of TLR4 and MyD88 in the kidneys of HFD‑fed mice. (A) Western blot analysis of TLR4 and MyD88 expression in the kidney. Relative protein expression levels of (B) TLR4 and (C) MyD88, normalized to β‑actin. Data are presented as the mean ± SD (n=10). *P<0.05 vs. Con group; #P<0.05 vs. HFD group. Con, control; HFD, high‑fat diet; MyD88, myeloid differentiation factor 88; RSV, resvera‑trol; TLR4, Toll‑like receptor 4.
ZHANG et al: RESVERATROL AFFECTS URIC ACID TRANSPORTER BY IMPROVING INFLAMMATION8
expression of downstream proteins, including TRAF6, TAK1 and NF‑κB, which mediate renal inflammation. It was hypoth‑esized that this may cause a reduction in the expression levels of GLUT9 and URAT1, reduce SUA and thus ameliorate IR.
HUA is a chronic metabolic disease that is mainly caused by greater production of and/or lower excretion of UA (24,25). In recent years, it has been reported that high SUA is not only the main cause of gout, but also has a close relationship with components of metabolic syndrome, such as hyperinsulinemia, hypertension and diabetes (26). IR can also promote HUA because hyperinsulinemia reduces the activity of 3‑phospho‑glycerate dehydrogenase, a key glycolytic enzyme, which leads to the conversion of glycolytic intermediates to 5‑phosphate ribose and phosphoribose pyrophosphate, thereby promoting UA generation. In addition, IR promotes the accumulation of liver fat, which impairs purine metabolism, leading to the production of UA (27,28). These data linking HUA to IR suggest that SUA may be an independent predictor of HUA. Both IR and HUA can induce kidney pathology, metabolic abnormalities and cardiovas‑cular diseases, and they interact to cause pathological progression. However, the effects of HFD‑feeding and the associated IR on UA turnover in the kidney are not yet fully understood.
Glucose, lipid and UA metabolism disorders are features of numerous primary and secondary kidney diseases, and although there have been a number of studies regarding the kidney pathology associated with metabolic disorders (29,30), the mechanism involved remains unclear (30). Previous studies have shown that high SUA concentrations are associ‑ated with inflammation and renal insufficiency (6,31,32), and the present study revealed that long‑term HFD‑feeding caused
renal lipid deposition and increased the renal concentrations of IL‑1β, IL‑6, IL‑18 and TNF‑α, which may lead to renal dysfunction. RSV can affect the expression of UA transporter proteins by improving kidney inflammation and can reduce blood UA levels. GLUT9 and URAT1 may be the key proteins linking lipid metabolism and UA metabolism. The present study provides novel theoretical evidence for RSV to improve metabolic syndrome and kidney inflammation.
In conclusion, the present study demonstrated that RSV improved SUA and reduced UA reabsorption. These effects of RSV may be achieved by reducing renal inflammation in HFD‑fed insulin‑resistant mice. The mechanisms underlying the improvement in renal inflammation may involve a reduc‑tion in the expression of the NLRP3 inflammasome and TLR4 signaling pathway components.
Acknowledgements
Not applicable.
Funding
The present study was supported by a grant from the Natural Science Foundation of Hebei Province (grant no. H2018307071).
Availability of data and materials
The datasets used and/or analyzed during the current study are available from the corresponding author on reasonable requests.
Figure 8. Effect of RSV on the protein expression levels of TRAF6, TAK1 and NF‑κB in the kidneys of HFD‑fed mice. (A) Western blot analysis of TRAF6, TAK1 and NF‑κB in the kidney. Relative protein expression levels of (B) TRAF6, (C) TAK1 and (D) NF‑κB, normalized to β‑actin. Data are presented as the mean ± SD (n=10). *P<0.05 vs. Con group; #P<0.05 vs. HFD group. Con, control; HFD, high‑fat diet; NF‑κB, nuclear factor‑κB; RSV, resveratrol; TAK1, TGF‑β‑activated kinase 1; TRAF6, tumor necrosis factor receptor‑associated factor 6.
MOLECULAR MEDICINE REPORTS 24: 564, 2021 9
Authors' contributions
XZ and GS conceived and designed the study. XZ, QN, ZZ, JZ, FZ, CW and XW acquired and analyzed the data. XZ, CW and GS confirmed the authenticity of all the raw data. XZ prepared the draft of the manuscript, including the figures. All authors read and approved the final manuscript.
Ethics approval and consent to participate
All animals received humane care in compliance with the Guide for the Care and Use of Laboratory Animals in China. The present study was approved by Hebei General Hospital Ethical Committee (approval no. 2019E389).
Patient consent for publication
Not applicable.
Competing interests
The authors declare that they have no competing interests.
References
1. El Ridi R and Tallima H: Physiological functions and pathogenic potential of uric acid: A review. J Adv Res 8: 487‑493, 2017.
2. Billiet L, Doaty S, Katz JD and Velasquez MT: Review of hyperuricemia as new marker for metabolic syndrome. ISRN Rheumatol 2014: 852954, 2014.
3. Sharaf El Din UAA, Salem MM and Abdulazim DO: Uric acid in the pathogenesis of metabolic, renal, and cardiovascular diseases: A review. J Adv Res 8: 537‑548, 2017.
4. Tan PK, Farrar JE, Gaucher EA and Miner JN: Coevolution of URAT1 and Uricase during Primate Evolution: Implications for Serum Urate Homeostasis and Gout. Mol Biol Evol 33: 2193‑2200, 2016.
5. Ebert K, Ludwig M, Geillinger KE, Schoberth GC, Essenwanger J, Stolz J, Daniel H and Witt H: Reassessment of GLUT7 and GLUT9 as Putative Fructose and Glucose Transporters. J Membr Biol 250: 171‑182, 2017.
6. Yang Y, Zhang DM, Liu JH, Hu LS, Xue QC, Ding XQ and Kong LD: Wuling San protects kidney dysfunction by inhibiting renal TLR4/MyD88 signaling and NLRP3 inflammasome activation in high fructose‑induced hyperuricemic mice. J Ethnopharmacol 169: 49‑59, 2015.
7. Akira S, Takeda K and Kaisho T: Toll‑like receptors: Critical proteins linking innate and acquired immunity. Nat Immunol 2: 675‑680, 2001.
8. Zeng XZ, Zhang YY, Yang Q, Wang S, Zou BH, Tan YH, Zou M, Liu SW and Li XJ: Artesunate attenuates LPS‑induced osteoclas‑togenesis by suppressing TLR4/TRAF6 and PLCγ1‑Ca2+‑NFATc1 signaling pathway. Acta Pharmacol Sin 41: 229‑236, 2020.
9. Shigeoka AA, Mueller JL, Kambo A, Mathison JC, King AJ, Hall WF, Correia JS, Ulevitch RJ, Hoffman HM and McKay DB: An inflammasome‑independent role for epithelial‑expressed Nlrp3 in renal ischemia‑reperfusion injury. J Immunol 185: 6277‑6285, 2010.
10. Thiel G and Rössler OG: Resveratrol regulates gene transcription via activation of stimulus‑responsive transcription factors. Pharmacol Res 117: 166‑176, 2017.
11. Cheng K, Song Z, Chen Y, Li S, Zhang Y, Zhang H, Zhang L, Wang C and Wang T: Resveratrol protects against renal damage via attenuation of inflammation and oxidative stress in high‑fat‑diet‑induced obese mice. Inflammation 42: 937‑945, 2019.
12. Saldanha JF, Leal VO, Stenvinkel P, Carraro‑Eduardo JC and Mafra D: Resveratrol: Why is it a promising therapy for chronic kidney disease patients? Oxid Med Cell Longev 2013: 963217, 2013.
13. Jørgensen MS, Tornqvist KS and Hvid H: Calculation of glucose dose for intraperitoneal glucose tolerance tests in lean and obese mice. J Am Assoc Lab Anim Sci 56: 95‑97, 2017.
14. Bhatt JK, Thomas S and Nanjan MJ: Resveratrol supplemen‑tation improves glycemic control in type 2 diabetes mellitus. Nutr Res 32: 537‑541, 2012.
15. Shu L, Hou G, Zhao H, Huang W, Song G and Ma H: Resveratrol improves high‑fat diet‑induced insulin resistance in mice by downregulating the lncRNA NONMMUT008655.2. Am J Transl Res 12: 1‑18, 2020.
16. Katz A, Nambi SS, Mather K, Baron AD, Follmann DA, Sullivan G and Quon MJ: Quantitative insulin sensitivity check index: A simple, accurate method for assessing insulin sensitivity in humans. J Clin Endocrinol Metab 85: 2402‑2410, 2000.
17. Brenner C, Simmonds RE, Wood S, Rose V, Feldmann M and Turner J: TLR signalling and adapter utilization in primary human in vitro differentiated adipocytes. Scand J Immunol 76: 359‑370, 2012.
18. O'Neill LA, Dunne A, Edjeback M, Gray P, Jefferies C and Wietek C: Mal and MyD88: Adapter proteins involved in signal transduction by Toll‑like receptors. J Endotoxin Res 9: 55‑59, 2003.
19. Verstak B, Nagpal K, Bottomley SP, Golenbock DT, Hertzog PJ and Mansell A: MyD88 adapter‑like (Mal)/TIRAP inter‑action with TRAF6 is critical for TLR2‑ and TLR4‑mediated NF‑kappaB proinflammatory responses. J Biol Chem 284: 24192‑24203, 2009.
20. Lagouge M, Argmann C, Gerhart‑Hines Z, Meziane H, Lerin C, Daussin F, Messadeq N, Milne J, Lambert P, Elliott P, et al: Resveratrol improves mitochondrial function and protects against metabolic disease by activating SIRT1 and PGC‑1alpha. Cell 127: 1109‑1122, 2006.
21. Zhao J, Wang H, Dai C, Wang H, Zhang H, Huang Y, Wang S, Gaskin F, Yang N and Fu SM: P2X7 blockade attenuates murine lupus nephritis by inhibiting activation of the NLRP3/ASC/caspase 1 pathway. Arthritis Rheum 65: 3176‑3185, 2013.
22. Zhou R, Yazdi AS, Menu P and Tschopp J: A role for mitochondria in NLRP3 inflammasome activation. Nature 469: 221‑225, 2011.
23. Roger T, David J, Glauser MP and Calandra T: MIF regulates innate immune responses through modulation of Toll‑like receptor 4. Nature 414: 920‑924, 2001.
24. Albert D, Scudder PN, Bagley P and Saag KG: Vascular conse‑quences of hyperuricemia and hypouricemia. Rheum Dis Clin North Am 45: 453‑464, 2019.
25. Kostka‑Jeziorny K, Widecka K and Tykarski A: Study of epide‑miological aspects of hyperuricemia in Poland. Cardiol J 26: 241‑252, 2019.
26. Zhang S, Wang Y, Cheng J, Huangfu N, Zhao R, Xu Z, Zhang F, Zheng W and Zhang D: Hyperuricemia and Cardiovascular Disease. Curr Pharm Des 25: 700‑709, 2019.
27. Doualla M, Halle MP, Moutchia J, Tegang S and Ashuntantang G: Determinants of hyperuricemia in non‑dialysed chronic kidney disease patients in three hospitals in Cameroon. BMC Nephrol 19: 169, 2018.
28. Yang H, Bai W, Gao L, Jiang J, Tang Y, Niu Y, Lin H and Li L: Mangiferin alleviates hypertension induced by hyperuricemia via increasing nitric oxide releases. J Pharmacol Sc 137: 154‑161, 2018.
29. Sha J, Sui B, Su X, Meng Q and Zhang C: Alteration of oxidative stress and inflammatory cytokines induces apoptosis in diabetic nephropathy. Mol Med Rep 16: 7715‑7723, 2017.
30. Mount PF and Juncos LA: Obesity‑Related CKD: When kidneys get the munchies. J Am Soc Nephrol 28: 3429‑3432, 2017.
31. Wang MX, Zhao XJ, Chen TY, Liu YL, Jiao RQ, Zhang JH, Ma CH, Liu JH, Pan Y and Kong LD: Nuciferine alleviates renal injury by inhibiting inflammatory responses in fructose‑fed rats. J Agric Food Chem 64: 7899‑7910, 2016.
32. Hu QH, Wang C, Li JM, Zhang DM and Kong LD: Allopurinol, rutin, and quercetin attenuate hyperuricemia and renal dysfunction in rats induced by fructose intake: Renal organic ion transporter involvement. Am J Physiol Renal Physiol 297: F1080‑F1091, 2009.
This work is licensed under a Creative Commons Attribution-NonCommercial-NoDerivatives 4.0 International (CC BY-NC-ND 4.0) License.