resurgere mines & minerals india ltd - nse
TRANSCRIPT
Stakeholders’ Education | Corporate Governance Research | Corporate Governance Score | Proxy Advisory
STAKEHOLDERS EMPOWERMENT SERVICES
1 | P A G E
SECTOR: MINING &MINERAL PRODUCTS REPORTING DATE: 31ST MAY, 2016
Resurgere Mines & Minerals India Ltd www.resurgere.in
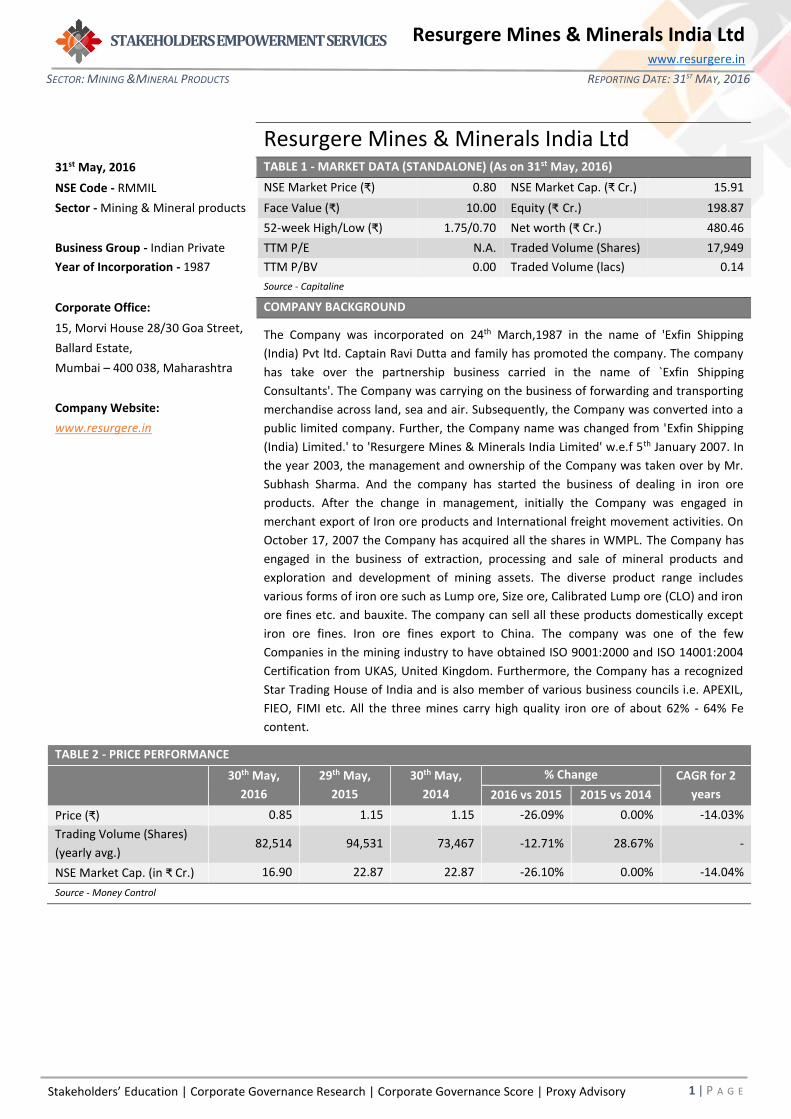
Resurgere Mines & Minerals India Ltd 31st May, 2016 TABLE 1 - MARKET DATA (STANDALONE) (As on 31st May, 2016)
NSE Code - RMMIL NSE Market Price (₹) 0.80 NSE Market Cap. (₹ Cr.) 15.91
Sector - Mining & Mineral products Face Value (₹) 10.00 Equity (₹ Cr.) 198.87
52-week High/Low (₹) 1.75/0.70 Net worth (₹ Cr.) 480.46
Business Group - Indian Private TTM P/E N.A. Traded Volume (Shares) 17,949
Year of Incorporation - 1987 TTM P/BV 0.00 Traded Volume (lacs) 0.14
Source - Capitaline
Corporate Office: COMPANY BACKGROUND
15, Morvi House 28/30 Goa Street, The Company was incorporated on 24th March,1987 in the name of 'Exfin Shipping
(India) Pvt ltd. Captain Ravi Dutta and family has promoted the company. The company
has take over the partnership business carried in the name of `Exfin Shipping
Consultants'. The Company was carrying on the business of forwarding and transporting
merchandise across land, sea and air. Subsequently, the Company was converted into a
public limited company. Further, the Company name was changed from 'Exfin Shipping
(India) Limited.' to 'Resurgere Mines & Minerals India Limited' w.e.f 5th January 2007. In
the year 2003, the management and ownership of the Company was taken over by Mr.
Subhash Sharma. And the company has started the business of dealing in iron ore
products. After the change in management, initially the Company was engaged in
merchant export of Iron ore products and International freight movement activities. On
October 17, 2007 the Company has acquired all the shares in WMPL. The Company has
engaged in the business of extraction, processing and sale of mineral products and
exploration and development of mining assets. The diverse product range includes
various forms of iron ore such as Lump ore, Size ore, Calibrated Lump ore (CLO) and iron
ore fines etc. and bauxite. The company can sell all these products domestically except
iron ore fines. Iron ore fines export to China. The company was one of the few
Companies in the mining industry to have obtained ISO 9001:2000 and ISO 14001:2004
Certification from UKAS, United Kingdom. Furthermore, the Company has a recognized
Star Trading House of India and is also member of various business councils i.e. APEXIL,
FIEO, FIMI etc. All the three mines carry high quality iron ore of about 62% - 64% Fe
content.
Ballard Estate,
Mumbai – 400 038, Maharashtra
Company Website:
www.resurgere.in
TABLE 2 - PRICE PERFORMANCE
30th May,
2016
29th May,
2015
30th May,
2014
% Change CAGR for 2
years 2016 vs 2015 2015 vs 2014
Price (₹) 0.85 1.15 1.15 -26.09% 0.00% -14.03%
Trading Volume (Shares)
(yearly avg.) 82,514 94,531 73,467 -12.71% 28.67% -
NSE Market Cap. (in ₹ Cr.) 16.90 22.87 22.87 -26.10% 0.00% -14.04%
Source - Money Control
Stakeholders’ Education | Corporate Governance Research | Corporate Governance Score | Proxy Advisory
STAKEHOLDERS EMPOWERMENT SERVICES
2 | P A G E
SECTOR: MINING &MINERAL PRODUCTS REPORTING DATE: 31ST MAY, 2016
Resurgere Mines & Minerals India Ltd www.resurgere.in
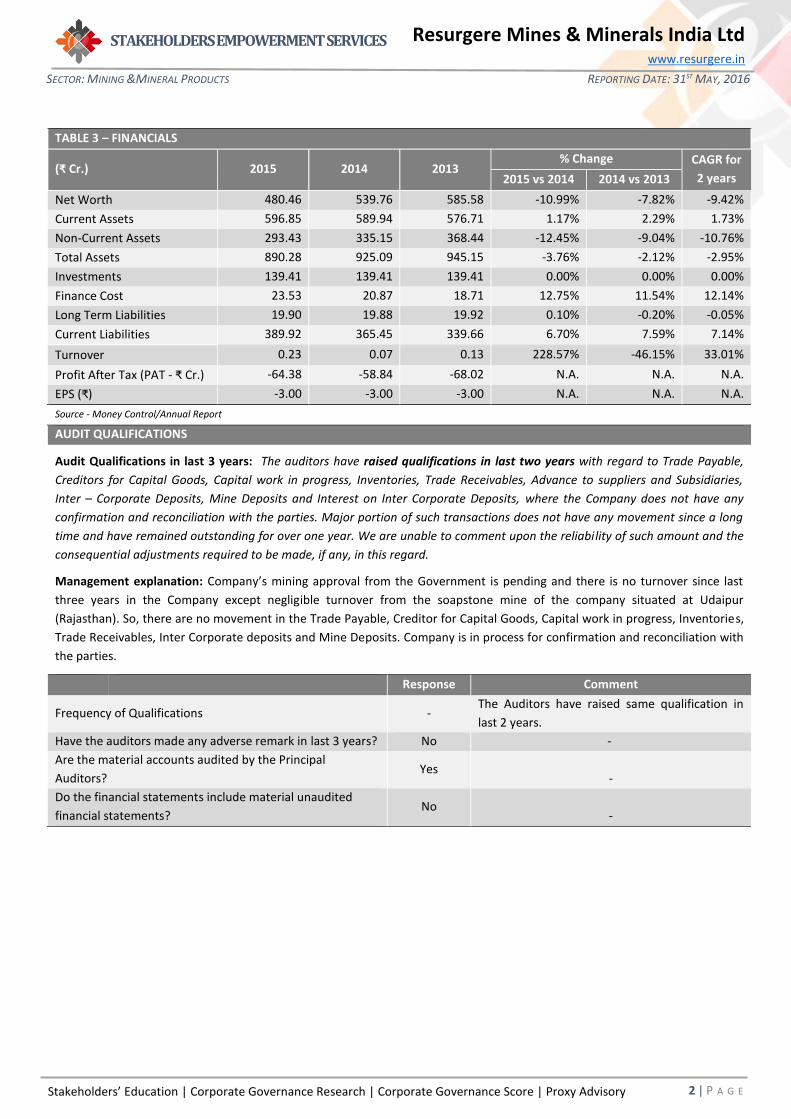
TABLE 3 – FINANCIALS
(₹ Cr.) 2015 2014 2013 % Change CAGR for
2 years 2015 vs 2014 2014 vs 2013
Net Worth 480.46 539.76 585.58 -10.99% -7.82% -9.42%
Current Assets 596.85 589.94 576.71 1.17% 2.29% 1.73%
Non-Current Assets 293.43 335.15 368.44 -12.45% -9.04% -10.76%
Total Assets 890.28 925.09 945.15 -3.76% -2.12% -2.95%
Investments 139.41 139.41 139.41 0.00% 0.00% 0.00%
Finance Cost 23.53 20.87 18.71 12.75% 11.54% 12.14%
Long Term Liabilities 19.90 19.88 19.92 0.10% -0.20% -0.05%
Current Liabilities 389.92 365.45 339.66 6.70% 7.59% 7.14%
Turnover 0.23 0.07 0.13 228.57% -46.15% 33.01%
Profit After Tax (PAT - ₹ Cr.) -64.38 -58.84 -68.02 N.A. N.A. N.A.
EPS (₹) -3.00 -3.00 -3.00 N.A. N.A. N.A.
Source - Money Control/Annual Report
AUDIT QUALIFICATIONS
Audit Qualifications in last 3 years: The auditors have raised qualifications in last two years with regard to Trade Payable,
Creditors for Capital Goods, Capital work in progress, Inventories, Trade Receivables, Advance to suppliers and Subsidiaries,
Inter – Corporate Deposits, Mine Deposits and Interest on Inter Corporate Deposits, where the Company does not have any
confirmation and reconciliation with the parties. Major portion of such transactions does not have any movement since a long
time and have remained outstanding for over one year. We are unable to comment upon the reliability of such amount and the
consequential adjustments required to be made, if any, in this regard.
Management explanation: Company’s mining approval from the Government is pending and there is no turnover since last
three years in the Company except negligible turnover from the soapstone mine of the company situated at Udaipur
(Rajasthan). So, there are no movement in the Trade Payable, Creditor for Capital Goods, Capital work in progress, Inventories,
Trade Receivables, Inter Corporate deposits and Mine Deposits. Company is in process for confirmation and reconciliation with
the parties.
Response Comment
Frequency of Qualifications - The Auditors have raised same qualification in
last 2 years.
Have the auditors made any adverse remark in last 3 years? No -
Are the material accounts audited by the Principal
Auditors? Yes
-
Do the financial statements include material unaudited
financial statements? No
-
Stakeholders’ Education | Corporate Governance Research | Corporate Governance Score | Proxy Advisory
STAKEHOLDERS EMPOWERMENT SERVICES
3 | P A G E
SECTOR: MINING &MINERAL PRODUCTS REPORTING DATE: 31ST MAY, 2016
Resurgere Mines & Minerals India Ltd www.resurgere.in
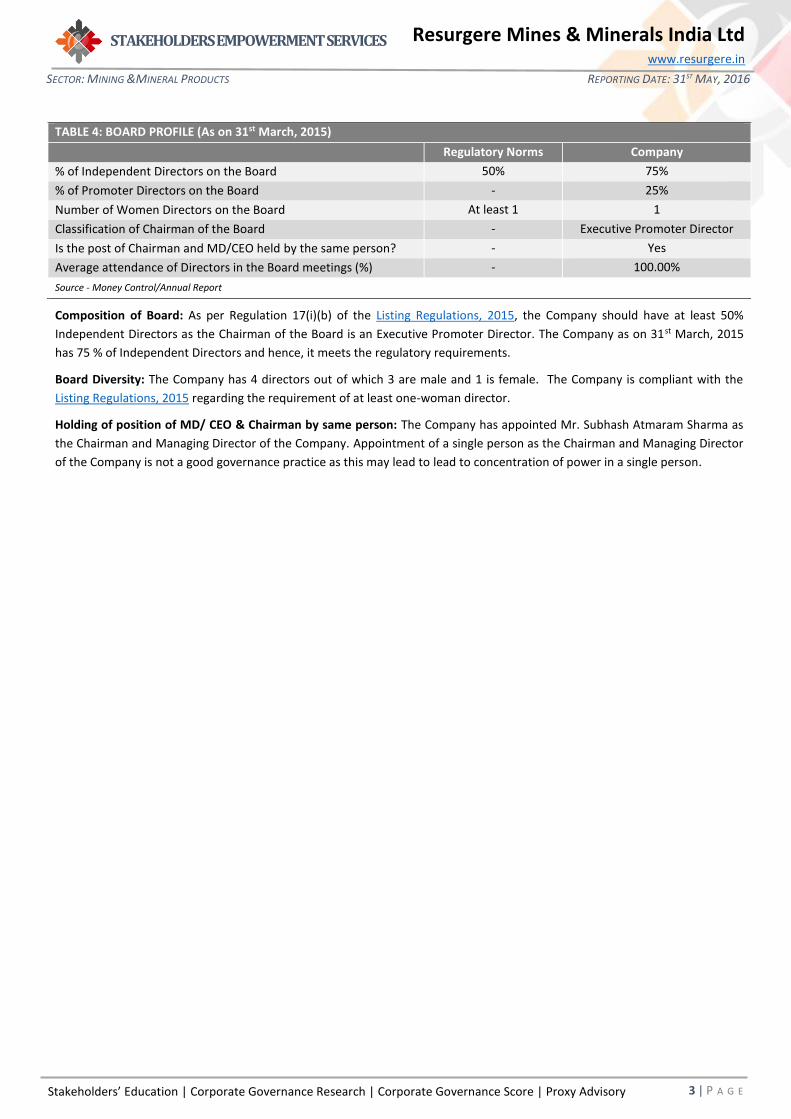
TABLE 4: BOARD PROFILE (As on 31st March, 2015)
Regulatory Norms Company
% of Independent Directors on the Board 50% 75%
% of Promoter Directors on the Board - 25%
Number of Women Directors on the Board At least 1 1
Classification of Chairman of the Board - Executive Promoter Director
Is the post of Chairman and MD/CEO held by the same person? - Yes
Average attendance of Directors in the Board meetings (%) - 100.00%
Source - Money Control/Annual Report
Composition of Board: As per Regulation 17(i)(b) of the Listing Regulations, 2015, the Company should have at least 50%
Independent Directors as the Chairman of the Board is an Executive Promoter Director. The Company as on 31st March, 2015
has 75 % of Independent Directors and hence, it meets the regulatory requirements.
Board Diversity: The Company has 4 directors out of which 3 are male and 1 is female. The Company is compliant with the
Listing Regulations, 2015 regarding the requirement of at least one-woman director.
Holding of position of MD/ CEO & Chairman by same person: The Company has appointed Mr. Subhash Atmaram Sharma as
the Chairman and Managing Director of the Company. Appointment of a single person as the Chairman and Managing Director
of the Company is not a good governance practice as this may lead to lead to concentration of power in a single person.
Stakeholders’ Education | Corporate Governance Research | Corporate Governance Score | Proxy Advisory
STAKEHOLDERS EMPOWERMENT SERVICES
4 | P A G E
SECTOR: MINING &MINERAL PRODUCTS REPORTING DATE: 31ST MAY, 2016
Resurgere Mines & Minerals India Ltd www.resurgere.in
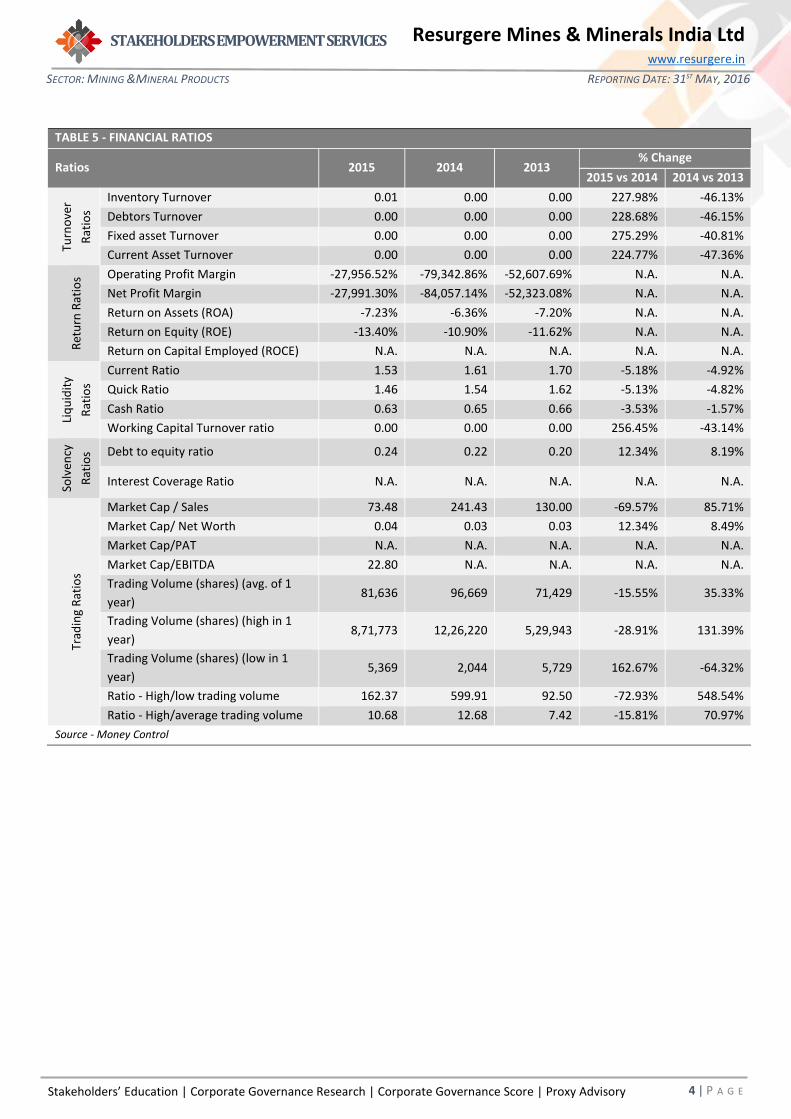
TABLE 5 - FINANCIAL RATIOS
Ratios 2015 2014 2013 % Change
2015 vs 2014 2014 vs 2013
Turn
ove
r
Rat
ios
Inventory Turnover 0.01 0.00 0.00 227.98% -46.13%
Debtors Turnover 0.00 0.00 0.00 228.68% -46.15%
Fixed asset Turnover 0.00 0.00 0.00 275.29% -40.81%
Current Asset Turnover 0.00 0.00 0.00 224.77% -47.36%
Ret
urn
Rat
ios Operating Profit Margin -27,956.52% -79,342.86% -52,607.69% N.A. N.A.
Net Profit Margin -27,991.30% -84,057.14% -52,323.08% N.A. N.A.
Return on Assets (ROA) -7.23% -6.36% -7.20% N.A. N.A.
Return on Equity (ROE) -13.40% -10.90% -11.62% N.A. N.A.
Return on Capital Employed (ROCE) N.A. N.A. N.A. N.A. N.A.
Liq
uid
ity
Rat
ios
Current Ratio 1.53 1.61 1.70 -5.18% -4.92%
Quick Ratio 1.46 1.54 1.62 -5.13% -4.82%
Cash Ratio 0.63 0.65 0.66 -3.53% -1.57%
Working Capital Turnover ratio 0.00 0.00 0.00 256.45% -43.14%
Solv
ency
Rat
ios Debt to equity ratio 0.24 0.22 0.20 12.34% 8.19%
Interest Coverage Ratio N.A. N.A. N.A. N.A. N.A.
Trad
ing
Rat
ios
Market Cap / Sales 73.48 241.43 130.00 -69.57% 85.71%
Market Cap/ Net Worth 0.04 0.03 0.03 12.34% 8.49%
Market Cap/PAT N.A. N.A. N.A. N.A. N.A.
Market Cap/EBITDA 22.80 N.A. N.A. N.A. N.A.
Trading Volume (shares) (avg. of 1
year) 81,636 96,669 71,429 -15.55% 35.33%
Trading Volume (shares) (high in 1
year) 8,71,773 12,26,220 5,29,943 -28.91% 131.39%
Trading Volume (shares) (low in 1
year) 5,369 2,044 5,729 162.67% -64.32%
Ratio - High/low trading volume 162.37 599.91 92.50 -72.93% 548.54%
Ratio - High/average trading volume 10.68 12.68 7.42 -15.81% 70.97%
Source - Money Control
Stakeholders’ Education | Corporate Governance Research | Corporate Governance Score | Proxy Advisory
STAKEHOLDERS EMPOWERMENT SERVICES
5 | P A G E
SECTOR: MINING &MINERAL PRODUCTS REPORTING DATE: 31ST MAY, 2016
Resurgere Mines & Minerals India Ltd www.resurgere.in
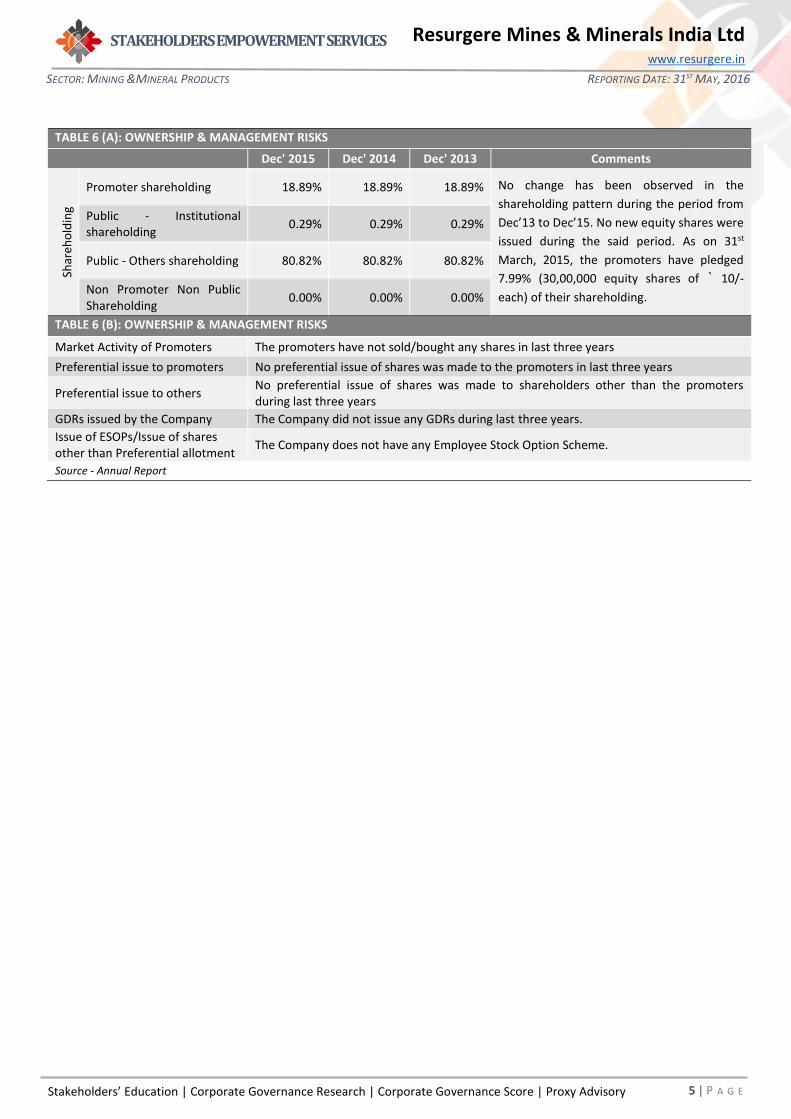
TABLE 6 (A): OWNERSHIP & MANAGEMENT RISKS
Dec' 2015 Dec' 2014 Dec' 2013 Comments
Shar
eho
ldin
g
Promoter shareholding 18.89% 18.89% 18.89% No change has been observed in the
shareholding pattern during the period from
Dec’13 to Dec’15. No new equity shares were
issued during the said period. As on 31st
March, 2015, the promoters have pledged
7.99% (30,00,000 equity shares of ` 10/-
each) of their shareholding.
Public - Institutional shareholding
0.29% 0.29% 0.29%
Public - Others shareholding 80.82% 80.82% 80.82%
Non Promoter Non Public Shareholding
0.00% 0.00% 0.00%
TABLE 6 (B): OWNERSHIP & MANAGEMENT RISKS
Market Activity of Promoters The promoters have not sold/bought any shares in last three years
Preferential issue to promoters No preferential issue of shares was made to the promoters in last three years
Preferential issue to others No preferential issue of shares was made to shareholders other than the promoters during last three years
GDRs issued by the Company The Company did not issue any GDRs during last three years.
Issue of ESOPs/Issue of shares other than Preferential allotment
The Company does not have any Employee Stock Option Scheme.
Source - Annual Report
Stakeholders’ Education | Corporate Governance Research | Corporate Governance Score | Proxy Advisory
STAKEHOLDERS EMPOWERMENT SERVICES
6 | P A G E
SECTOR: MINING &MINERAL PRODUCTS REPORTING DATE: 31ST MAY, 2016
Resurgere Mines & Minerals India Ltd www.resurgere.in
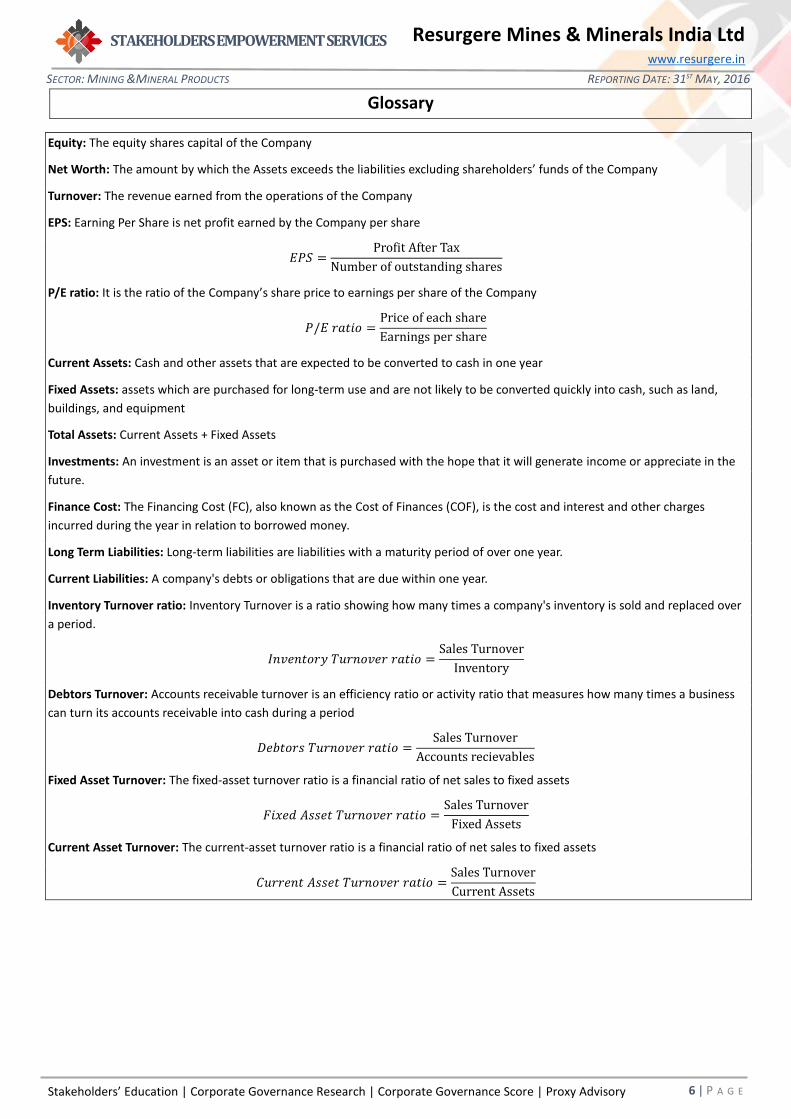
Glossary
Equity: The equity shares capital of the Company
Net Worth: The amount by which the Assets exceeds the liabilities excluding shareholders’ funds of the Company
Turnover: The revenue earned from the operations of the Company
EPS: Earning Per Share is net profit earned by the Company per share
𝐸𝑃𝑆 =Profit After Tax
Number of outstanding shares
P/E ratio: It is the ratio of the Company’s share price to earnings per share of the Company
𝑃/𝐸 𝑟𝑎𝑡𝑖𝑜 =Price of each share
Earnings per share
Current Assets: Cash and other assets that are expected to be converted to cash in one year
Fixed Assets: assets which are purchased for long-term use and are not likely to be converted quickly into cash, such as land,
buildings, and equipment
Total Assets: Current Assets + Fixed Assets
Investments: An investment is an asset or item that is purchased with the hope that it will generate income or appreciate in the
future.
Finance Cost: The Financing Cost (FC), also known as the Cost of Finances (COF), is the cost and interest and other charges
incurred during the year in relation to borrowed money.
Long Term Liabilities: Long-term liabilities are liabilities with a maturity period of over one year.
Current Liabilities: A company's debts or obligations that are due within one year.
Inventory Turnover ratio: Inventory Turnover is a ratio showing how many times a company's inventory is sold and replaced over
a period.
𝐼𝑛𝑣𝑒𝑛𝑡𝑜𝑟𝑦 𝑇𝑢𝑟𝑛𝑜𝑣𝑒𝑟 𝑟𝑎𝑡𝑖𝑜 =Sales Turnover
Inventory
Debtors Turnover: Accounts receivable turnover is an efficiency ratio or activity ratio that measures how many times a business
can turn its accounts receivable into cash during a period
𝐷𝑒𝑏𝑡𝑜𝑟𝑠 𝑇𝑢𝑟𝑛𝑜𝑣𝑒𝑟 𝑟𝑎𝑡𝑖𝑜 =Sales Turnover
Accounts recievables
Fixed Asset Turnover: The fixed-asset turnover ratio is a financial ratio of net sales to fixed assets
𝐹𝑖𝑥𝑒𝑑 𝐴𝑠𝑠𝑒𝑡 𝑇𝑢𝑟𝑛𝑜𝑣𝑒𝑟 𝑟𝑎𝑡𝑖𝑜 =Sales Turnover
Fixed Assets
Current Asset Turnover: The current-asset turnover ratio is a financial ratio of net sales to fixed assets
𝐶𝑢𝑟𝑟𝑒𝑛𝑡 𝐴𝑠𝑠𝑒𝑡 𝑇𝑢𝑟𝑛𝑜𝑣𝑒𝑟 𝑟𝑎𝑡𝑖𝑜 =Sales Turnover
Current Assets
Stakeholders’ Education | Corporate Governance Research | Corporate Governance Score | Proxy Advisory
STAKEHOLDERS EMPOWERMENT SERVICES
7 | P A G E
SECTOR: MINING &MINERAL PRODUCTS REPORTING DATE: 31ST MAY, 2016
Resurgere Mines & Minerals India Ltd www.resurgere.in
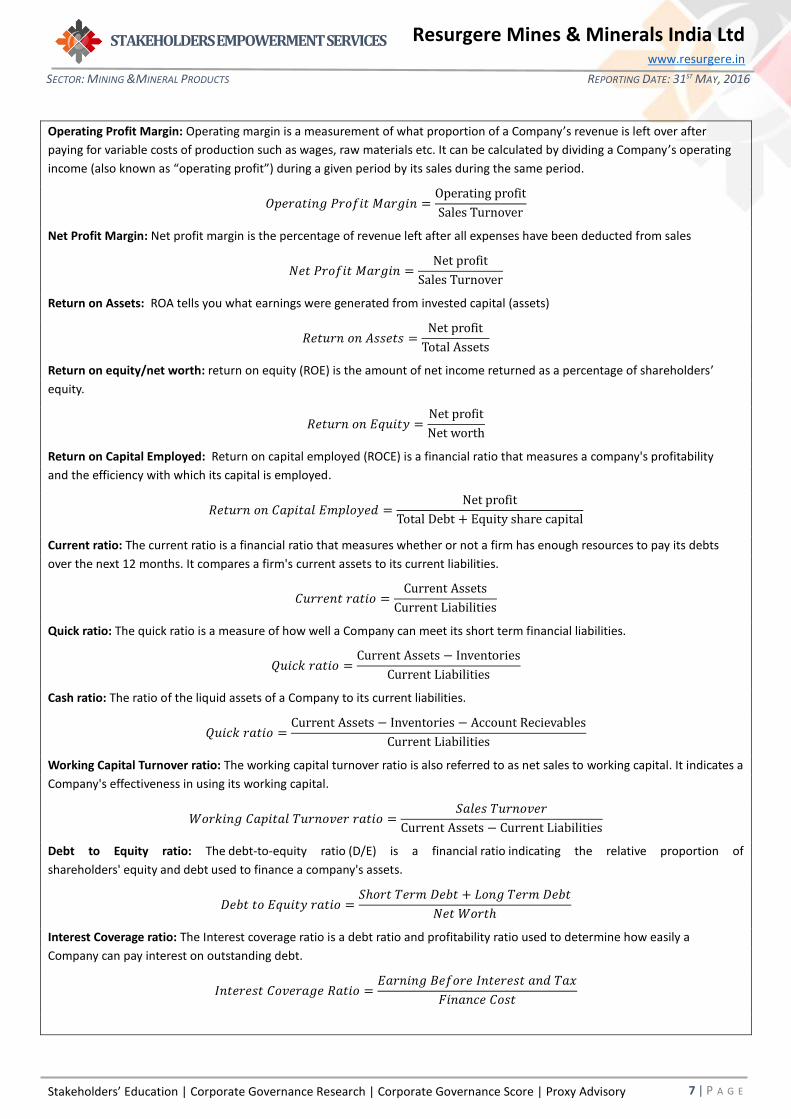
Operating Profit Margin: Operating margin is a measurement of what proportion of a Company’s revenue is left over after
paying for variable costs of production such as wages, raw materials etc. It can be calculated by dividing a Company’s operating
income (also known as “operating profit”) during a given period by its sales during the same period.
𝑂𝑝𝑒𝑟𝑎𝑡𝑖𝑛𝑔 𝑃𝑟𝑜𝑓𝑖𝑡 𝑀𝑎𝑟𝑔𝑖𝑛 =Operating profit
Sales Turnover
Net Profit Margin: Net profit margin is the percentage of revenue left after all expenses have been deducted from sales
𝑁𝑒𝑡 𝑃𝑟𝑜𝑓𝑖𝑡 𝑀𝑎𝑟𝑔𝑖𝑛 =Net profit
Sales Turnover
Return on Assets: ROA tells you what earnings were generated from invested capital (assets)
𝑅𝑒𝑡𝑢𝑟𝑛 𝑜𝑛 𝐴𝑠𝑠𝑒𝑡𝑠 =Net profit
Total Assets
Return on equity/net worth: return on equity (ROE) is the amount of net income returned as a percentage of shareholders’
equity.
𝑅𝑒𝑡𝑢𝑟𝑛 𝑜𝑛 𝐸𝑞𝑢𝑖𝑡𝑦 =Net profit
Net worth
Return on Capital Employed: Return on capital employed (ROCE) is a financial ratio that measures a company's profitability
and the efficiency with which its capital is employed.
𝑅𝑒𝑡𝑢𝑟𝑛 𝑜𝑛 𝐶𝑎𝑝𝑖𝑡𝑎𝑙 𝐸𝑚𝑝𝑙𝑜𝑦𝑒𝑑 =Net profit
Total Debt + Equity share capital
Current ratio: The current ratio is a financial ratio that measures whether or not a firm has enough resources to pay its debts
over the next 12 months. It compares a firm's current assets to its current liabilities.
𝐶𝑢𝑟𝑟𝑒𝑛𝑡 𝑟𝑎𝑡𝑖𝑜 =Current Assets
Current Liabilities
Quick ratio: The quick ratio is a measure of how well a Company can meet its short term financial liabilities.
𝑄𝑢𝑖𝑐𝑘 𝑟𝑎𝑡𝑖𝑜 =Current Assets − Inventories
Current Liabilities
Cash ratio: The ratio of the liquid assets of a Company to its current liabilities.
𝑄𝑢𝑖𝑐𝑘 𝑟𝑎𝑡𝑖𝑜 =Current Assets − Inventories − Account Recievables
Current Liabilities
Working Capital Turnover ratio: The working capital turnover ratio is also referred to as net sales to working capital. It indicates a
Company's effectiveness in using its working capital.
𝑊𝑜𝑟𝑘𝑖𝑛𝑔 𝐶𝑎𝑝𝑖𝑡𝑎𝑙 𝑇𝑢𝑟𝑛𝑜𝑣𝑒𝑟 𝑟𝑎𝑡𝑖𝑜 =𝑆𝑎𝑙𝑒𝑠 𝑇𝑢𝑟𝑛𝑜𝑣𝑒𝑟
Current Assets − Current Liabilities
Debt to Equity ratio: The debt-to-equity ratio (D/E) is a financial ratio indicating the relative proportion of
shareholders' equity and debt used to finance a company's assets.
𝐷𝑒𝑏𝑡 𝑡𝑜 𝐸𝑞𝑢𝑖𝑡𝑦 𝑟𝑎𝑡𝑖𝑜 =𝑆ℎ𝑜𝑟𝑡 𝑇𝑒𝑟𝑚 𝐷𝑒𝑏𝑡 + 𝐿𝑜𝑛𝑔 𝑇𝑒𝑟𝑚 𝐷𝑒𝑏𝑡
𝑁𝑒𝑡 𝑊𝑜𝑟𝑡ℎ
Interest Coverage ratio: The Interest coverage ratio is a debt ratio and profitability ratio used to determine how easily a
Company can pay interest on outstanding debt.
𝐼𝑛𝑡𝑒𝑟𝑒𝑠𝑡 𝐶𝑜𝑣𝑒𝑟𝑎𝑔𝑒 𝑅𝑎𝑡𝑖𝑜 =𝐸𝑎𝑟𝑛𝑖𝑛𝑔 𝐵𝑒𝑓𝑜𝑟𝑒 𝐼𝑛𝑡𝑒𝑟𝑒𝑠𝑡 𝑎𝑛𝑑 𝑇𝑎𝑥
𝐹𝑖𝑛𝑎𝑛𝑐𝑒 𝐶𝑜𝑠𝑡
Stakeholders’ Education | Corporate Governance Research | Corporate Governance Score | Proxy Advisory
STAKEHOLDERS EMPOWERMENT SERVICES
8 | P A G E
SECTOR: MINING &MINERAL PRODUCTS REPORTING DATE: 31ST MAY, 2016
Resurgere Mines & Minerals India Ltd www.resurgere.in
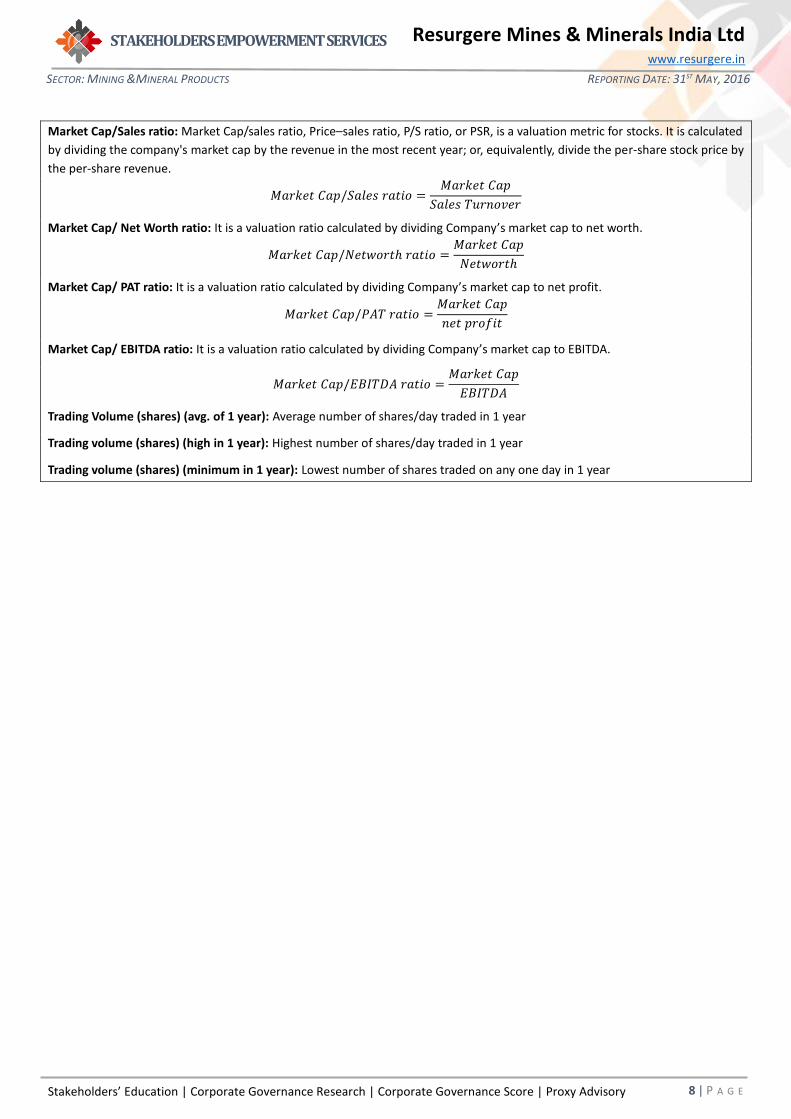
Market Cap/Sales ratio: Market Cap/sales ratio, Price–sales ratio, P/S ratio, or PSR, is a valuation metric for stocks. It is calculated
by dividing the company's market cap by the revenue in the most recent year; or, equivalently, divide the per-share stock price by
the per-share revenue.
𝑀𝑎𝑟𝑘𝑒𝑡 𝐶𝑎𝑝/𝑆𝑎𝑙𝑒𝑠 𝑟𝑎𝑡𝑖𝑜 =𝑀𝑎𝑟𝑘𝑒𝑡 𝐶𝑎𝑝
𝑆𝑎𝑙𝑒𝑠 𝑇𝑢𝑟𝑛𝑜𝑣𝑒𝑟
Market Cap/ Net Worth ratio: It is a valuation ratio calculated by dividing Company’s market cap to net worth.
𝑀𝑎𝑟𝑘𝑒𝑡 𝐶𝑎𝑝/𝑁𝑒𝑡𝑤𝑜𝑟𝑡ℎ 𝑟𝑎𝑡𝑖𝑜 =𝑀𝑎𝑟𝑘𝑒𝑡 𝐶𝑎𝑝
𝑁𝑒𝑡𝑤𝑜𝑟𝑡ℎ
Market Cap/ PAT ratio: It is a valuation ratio calculated by dividing Company’s market cap to net profit.
𝑀𝑎𝑟𝑘𝑒𝑡 𝐶𝑎𝑝/𝑃𝐴𝑇 𝑟𝑎𝑡𝑖𝑜 =𝑀𝑎𝑟𝑘𝑒𝑡 𝐶𝑎𝑝
𝑛𝑒𝑡 𝑝𝑟𝑜𝑓𝑖𝑡
Market Cap/ EBITDA ratio: It is a valuation ratio calculated by dividing Company’s market cap to EBITDA.
𝑀𝑎𝑟𝑘𝑒𝑡 𝐶𝑎𝑝/𝐸𝐵𝐼𝑇𝐷𝐴 𝑟𝑎𝑡𝑖𝑜 =𝑀𝑎𝑟𝑘𝑒𝑡 𝐶𝑎𝑝
𝐸𝐵𝐼𝑇𝐷𝐴
Trading Volume (shares) (avg. of 1 year): Average number of shares/day traded in 1 year
Trading volume (shares) (high in 1 year): Highest number of shares/day traded in 1 year
Trading volume (shares) (minimum in 1 year): Lowest number of shares traded on any one day in 1 year
Stakeholders’ Education | Corporate Governance Research | Corporate Governance Score | Proxy Advisory
STAKEHOLDERS EMPOWERMENT SERVICES
9 | P A G E
SECTOR: MINING &MINERAL PRODUCTS REPORTING DATE: 31ST MAY, 2016
Resurgere Mines & Minerals India Ltd www.resurgere.in
DISCLAIMER
Sources Company Information
Only publicly available data has been used while making the factsheet. Our
data sources include: BSE, NSE, SEBI, Capitaline, Moneycontrol, Businessweek,
Reuters, Annual Reports, IPO Documents and Company Website.
Analyst Certification
The analysts involved in development of this factsheet certify that no part of
any of the research analyst’s compensation was, is, or will be directly or
indirectly related to the contents of this factsheet.
Disclaimer
While SES has made every effort and has exercised due skill, care and diligence in compiling this factsheet based on publicly available information, it neither guarantees its accuracy, completeness or usefulness, nor assumes any liability whatsoever for any consequence from its use. This factsheet does not have any approval, express or implied, from any authority, nor is it required to have such approval. The users are strongly advised to exercise due diligence while using this factsheet.
This factsheet in no manner constitutes an offer, solicitation or advice to buy or sell securities, nor solicits votes or proxies on behalf of any party. SES, which is a not-for-profit Initiative or its staff, has no financial interest in the companies covered in this factsheet except what is disclosed on its website. The factsheet is released in India and SES has ensured that it is in accordance with Indian laws. Person resident outside India shall ensure that laws in their country are not violated while using this factsheet; SES shall not be responsible for any such violation.
All disputes subject to jurisdiction of High Court of Bombay, Mumbai.
SEBI Reg. No. INH000000016
This factsheet or any portion hereof may not
be reprinted, sold, reproduced or
redistributed without the written consent of
Stakeholders Empowerment Services
Contact Information
Stakeholders Empowerment Services
A 202, Muktangan,
Upper Govind Nagar,
Malad East,
Mumbai – 400 097
Tel +91 22 4022 0322
www.sesgovernance.com.
Research Analyst: Sumit Tank