results of proficiency test crude oil assay november 2019
TRANSCRIPT
Results of Proficiency Test Crude Oil Assay November 2019 Organised by: Institute for Interlaboratory Studies Spijkenisse, the Netherlands Authors: ing. C.M. Nijssen-Wester & A. Lewinska, MSc Correctors: ing. A.S. Noordman – de Neef & ing. R.J. Starink Report: iis19R02 == Revised == May 2020
Institute for Interlaboratory Studies Spijkenisse, May 2020
page 2 of 49 Crude Oil Assay: iis19R02 == Revised ==
SUMMARY OF CHANGES
This revised report replaces the original report iis19R02 of May 2020.
Because of a participant’s question iis discovered that the calculation of Effective Cut Point (ECP)
and Nminimum in appendix 1D had to be revised. These parameters are calculated from the SimDist
data of two overlapping fractions by calculating yields of fixed temperature intervals. The interval
chosen by iis was ten degrees Celsius, which is in line with method ASTM D2892. The method
describes in paragraph X2.4.2 to take intervals between five and fifteen degrees. ECP and
Nminimum are calculated from a line based on data from these intervals. The participant pointed out
that when calculating with intervals of 5 degrees this line would have more datapoints and therefore
be a better estimate of the slope and intersection of the line to calculate ECP and Nminimum. After
recalculation with 5 degrees intervals by iis, this was confirmed. Therefore a revised report was
made.
In this revised report, only the conclusions and tables of ECP and Nminimum were revised,
respectively in paragraph 4.1D and appendix 1D.
The following pages in this report have been revised:
- Paragraph 4.1D page 13 and 14 (page 12 and 13 in the orginal report)
- Appendix 1D: page 24 (page 23 in the original report)
- Page numbering was changed, due to the addition of this page. This affected the Content on
page 3 (page 2 in the original report).
Spijkenisse, May 2020 Institute for Interlaboratory Studies
Crude Oil Assay: iis19R02 == Revised == page 3 of 49
CONTENTS
1 INTRODUCTION ........................................................................................................................................... 4
2 SET UP .......................................................................................................................................................... 4
2.1 ACCREDITATION ......................................................................................................................................... 4
2.2 PROTOCOL .................................................................................................................................................. 4
2.3 CONFIDENTIALITY STATEMENT ............................................................................................................... 4
2.4 SAMPLES ...................................................................................................................................................... 5
2.5 STABILITY OF THE SAMPLES ................................................................................................................... 5
2.6 ANALYZES .................................................................................................................................................... 6
3 RESULTS ...................................................................................................................................................... 6
3.1 STATISTICS .................................................................................................................................................. 7
3.2 GRAPHICS .................................................................................................................................................... 7
3.3 Z-SCORES .................................................................................................................................................... 8
4 EVALUATION ................................................................................................................................................ 8
4.1 EVALUATION PER TEST ............................................................................................................................. 9
4.2 PERFORMANCE EVALUATION FOR THE GROUP OF LABORATORIES ............................................ 14
4.3 COMPARISON OF THE PROFICIENCY TEST OF NOVEMBER 2019 WITH PREVIOUS PTS ............ 15
5 CONCLUSION.............................................................................................................................................. 15
Appendices:
1. Data, statistical and graphic results ............................................................................................................ 17
A – Analysis of original sample .................................................................................................................. 17
B – Distillation results D2892 and D5236 ................................................................................................... 21
C – Analysis of distillation fractions ............................................................................................................. 27
D – Simulated distillation and Effective Cut Point D2892 .......................................................................... 42
2. True Boiling Point graph, Cumulative %M/M vs Temperature AET in °C ................................................. 44
3. True Boiling Point graph, Sulfur in %M/M vs Temperature AET in °C ...................................................... 45
4. True Boiling Point graph, Nitrogen in mg/kg vs Temperature AET in °C .................................................. 46
5. Details of Distillation and Pressure during ASTM D2892 and ASTM D5236 ............................................ 47
6. Number of participants per country ............................................................................................................. 48
7. Abbreviations and literature ......................................................................................................................... 49
Institute for Interlaboratory Studies Spijkenisse, May 2020
page 4 of 49 Crude Oil Assay: iis19R02 == Revised ==
1 INTRODUCTION
Since 2004, the Institute for Interlaboratory Studies organizes a proficiency scheme for Crude Oil Assay every two years. During the annual proficiency test program of 2019/2020, it was decided to continue the proficiency test for the Assay analyzes of Crude Oil. In this interlaboratory study 24 laboratories in 16 different countries registered for participation. See appendix 6 for the number of participants per country. In this report the results of this proficiency test for Crude Oil Assay are presented and discussed. This report is electronically available through the iis website www.iisnl.com.
2 SET UP
The Institute for Interlaboratory Studies (iis) in Spijkenisse, the Netherlands, was the organizer of this proficiency test. Sample analyzes for fit-for-use and homogeneity testing were subcontracted to an ISO/IEC17025 accredited laboratory. It was decided to send subsamples in 5 L cans, labelled #19225. Participants were requested to report rounded and unrounded test results. The unrounded test results were preferably used for statistical evaluation.
2.1 ACCREDITATION The Institute for Interlaboratory Studies in Spijkenisse, the Netherlands, is accredited in accordance with ISO/IEC17043:2010 (R007), since January 2000, by the Dutch Accreditation Council (Raad voor Accreditatie). This PT falls under the accredited scope. This ensures strict adherence to protocols for sample preparation and statistical evaluation and 100% confidentiality of participant’s data. Feedback from the participants on the reported data is encouraged and customer’s satisfaction is measured on regular basis by sending out questionnaires.
2.2 PROTOCOL
The protocol followed in the organization of this proficiency test was the one as described for proficiency testing in the report ‘iis Interlaboratory Studies: Protocol for the Organisation, Statistics and Evaluation’ of June 2018 (iis-protocol, version 3.5). This protocol is electronically available through the iis website www.iisnl.com, from the FAQ page.
2.3 CONFIDENTIALITY STATEMENT All data presented in this report must be regarded as confidential and are for use by the participating companies only. Disclosure of the information in this report is only allowed by means of the entire report. Use of the contents of this report for third parties is only allowed by written permission of the Institute for Interlaboratory Studies. Disclosure of the identity of one or more of the participating companies will be done only after receipt of a written agreement of the companies involved.
Spijkenisse, May 2020 Institute for Interlaboratory Studies
Crude Oil Assay: iis19R02 == Revised == page 5 of 49
2.4 SAMPLES
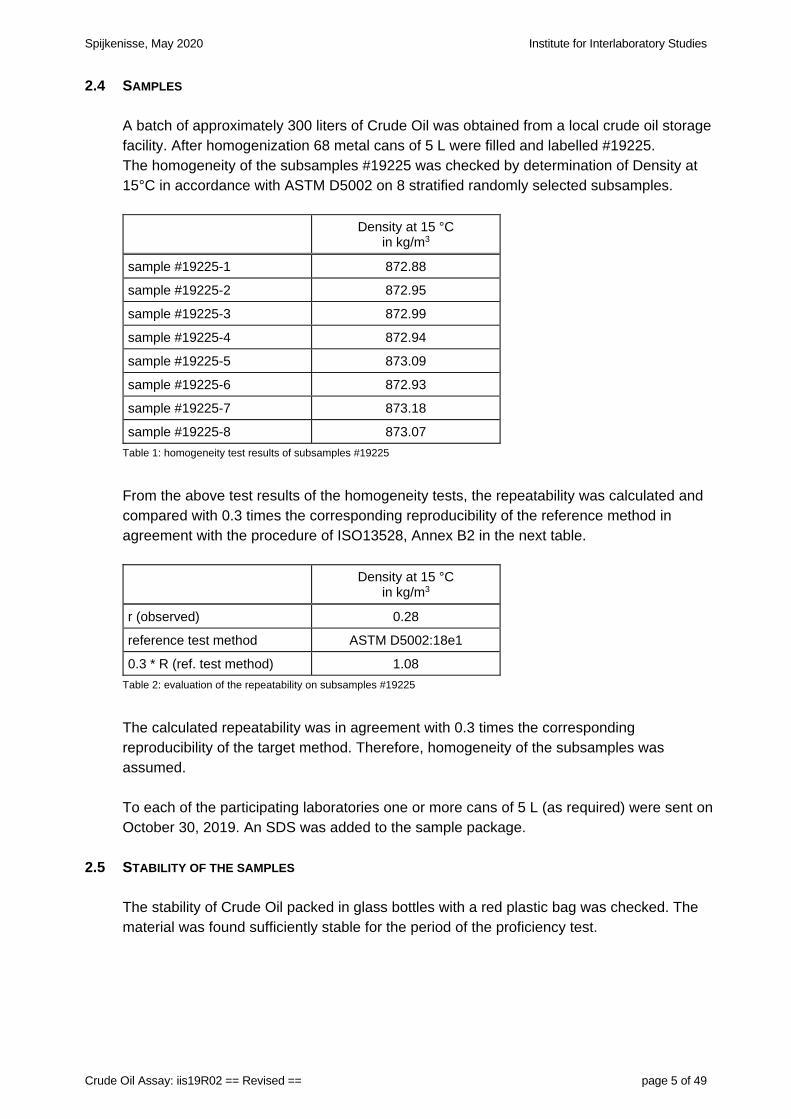
A batch of approximately 300 liters of Crude Oil was obtained from a local crude oil storage facility. After homogenization 68 metal cans of 5 L were filled and labelled #19225. The homogeneity of the subsamples #19225 was checked by determination of Density at 15°C in accordance with ASTM D5002 on 8 stratified randomly selected subsamples.
Density at 15 °C
in kg/m3
sample #19225-1 872.88
sample #19225-2 872.95
sample #19225-3 872.99
sample #19225-4 872.94
sample #19225-5 873.09
sample #19225-6 872.93
sample #19225-7 873.18
sample #19225-8 873.07
Table 1: homogeneity test results of subsamples #19225
From the above test results of the homogeneity tests, the repeatability was calculated and compared with 0.3 times the corresponding reproducibility of the reference method in agreement with the procedure of ISO13528, Annex B2 in the next table. Density at 15 °C
in kg/m3
r (observed) 0.28
reference test method ASTM D5002:18e1
0.3 * R (ref. test method) 1.08
Table 2: evaluation of the repeatability on subsamples #19225
The calculated repeatability was in agreement with 0.3 times the corresponding reproducibility of the target method. Therefore, homogeneity of the subsamples was assumed. To each of the participating laboratories one or more cans of 5 L (as required) were sent on October 30, 2019. An SDS was added to the sample package.
2.5 STABILITY OF THE SAMPLES The stability of Crude Oil packed in glass bottles with a red plastic bag was checked. The material was found sufficiently stable for the period of the proficiency test.
Institute for Interlaboratory Studies Spijkenisse, May 2020
page 6 of 49 Crude Oil Assay: iis19R02 == Revised ==
2.6 ANALYZES The participants were requested to determine on the original sample Density, Sulfur, Nitrogen and Water. The participants were further requested to determine a Crude Oil Assay consisting of a True Boiling Point Distillation in accordance with ASTM D2892 (collection of 8 fractions) and subsequently a distillation in accordance with ASTM D5236 (collection of 4 fractions). Also was requested to determine Density, Sulfur and Nitrogen on all fractions where possible. Furthermore, it was requested to determine: - on the light and heavy naphtha fractions (fractions 2 and 3) a PNA or PIONA analysis - on the combined fractions of light and medium gasoil (fractions 5 and 6) Flash Point
PMCC and a distillation - on the separate fractions of light Gasoil (fraction 5) and medium Gasoil (fraction 6) a
simulated distillation determination (on both fractions). It was explicitly requested to treat the sample as if it was a routine sample and to report the test results using the indicated units on the report form and not to round the results, but report as much significant figures as possible. It was also requested not to report ‘less than’ test results, which are above the detection limit, because such test results cannot be used for meaningful statistical evaluations. To get comparable test results, a detailed report form and a letter of instructions are prepared. On the report form the reporting units are given as well as the reference test methods that will be used during the evaluation. The detailed report form (as a word file) and the letter of instructions are both made available on the data entry portal www.kpmd.co.uk/sgs-iis/. The participating laboratories are also requested to confirm the sample receipt on this data entry portal. The letter of instructions can also be downloaded from the iis website www.iisnl.com.
3 RESULTS
During sixteen weeks after sample dispatch the test results of the individual laboratories were gathered by e-mail. The reported test results are tabulated per determination in appendix 1 of this report. The laboratories are presented by their code numbers. After the planned deadline, a reminder was sent to those laboratories that had not yet reported test results at that moment. After the deadline the available test results were screened for suspect data. A test result was called suspect in case the Huber Elimination Rule (a robust outlier test) found it to be an outlier. The laboratories that produced these suspect data were asked to check the raw data of reported test results (no reanalysis). Additional or corrected test results are used for data analysis and original test results are placed under 'Remarks' in the result tables in appendix 1. Test results that came in after the deadline were not taken into account in this screening for suspect data and thus these participants were not requested for checks.
Spijkenisse, May 2020 Institute for Interlaboratory Studies
Crude Oil Assay: iis19R02 == Revised == page 7 of 49
3.1 STATISTICS The protocol followed in the organization of this proficiency test was the one as described for proficiency testing in the report 'iis Interlaboratory Studies: Protocol for the Organization, Statistics and Evaluation' of June 2018 (iis-protocol, version 3.5). For the statistical evaluation, the unrounded (when available) figures were used instead of the rounded test results. Test results reported as '<…' or '>…' were not used in the statistical evaluation. First, the normality of the distribution of the various data sets per determination was checked by means of the Lilliefors-test, a variant of the Kolmogorov-Smirnov test and by the calculation of skewness and kurtosis. Evaluation of the three normality indicators in combination with the visual evaluation of the graphic Kernel Density plot, lead to judgement of the normality being either ‘unknown’, ‘OK’, ‘suspect’ or ‘not OK’. After removal of outliers, this check was repeated. If a data set does not have a normal distribution, the (results of the) statistical evaluation should be used with due care. According to ISO5725 the original test results per determination were submitted to Dixon’s and/or Grubbs' and/or Rosner’s outlier tests. Outliers are marked by D(0.01) for the Dixon’s test, by G(0.01) or DG(0.01) for the Grubbs’ test and by R(0.01) for the Rosner’s test. Stragglers are marked by D(0.05) for the Dixon’s test, by G(0.05) or DG(0.05) for the Grubbs’ test and by R(0.05) for the Rosner’s test. Both outliers and stragglers were not included in the calculations of averages and standard deviations. For each assigned value the uncertainty was determined in accordance with ISO13528. Subsequently the calculated uncertainty was evaluated against the respective requirement based on the target reproducibility in accordance with ISO13528. In this PT, the criterion of ISO13528, paragraph 9.2.1 was met for all evaluated tests, therefore, the uncertainty of all assigned values may be negligible and need not be included in the PT report.
Finally, the reproducibilities were calculated from the standard deviations by multiplying these with a factor of 2.8.
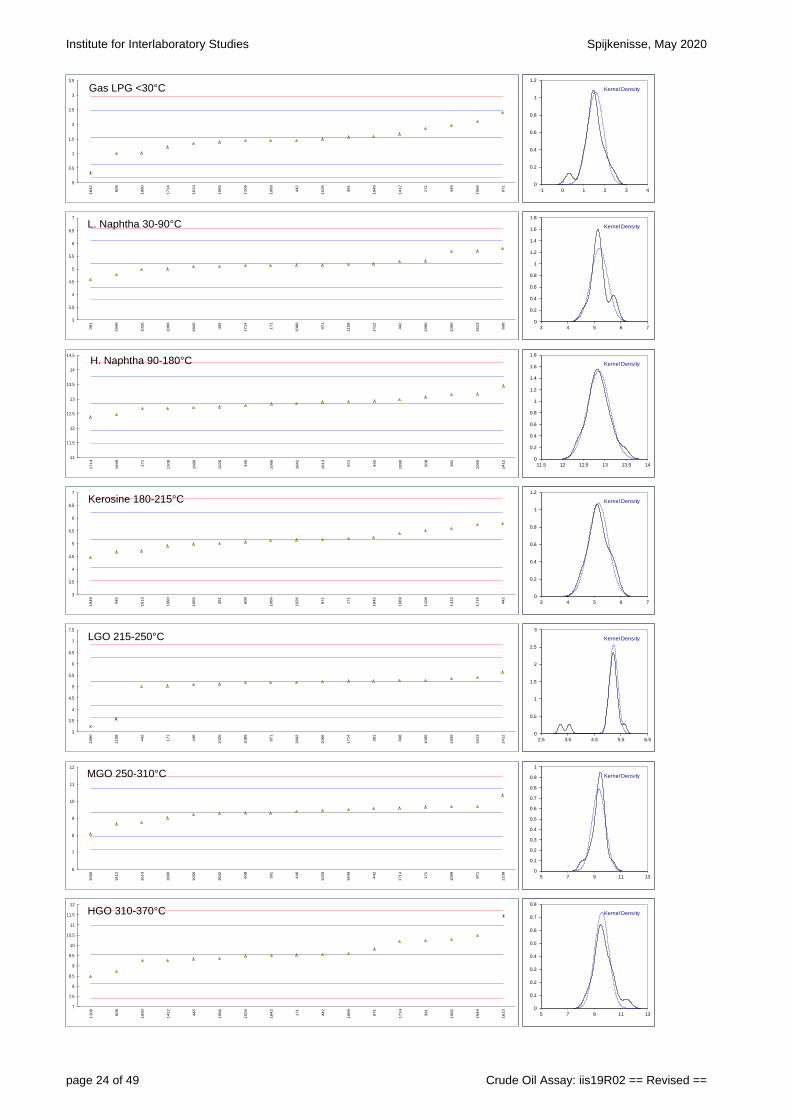
3.2 GRAPHICS In order to visualize the data against the reproducibilities from literature, Gauss plots were made, using the sorted data for one determination (see appendix 1). On the Y-axis the reported test results are plotted. The corresponding laboratory numbers are on the X-axis. The straight horizontal line presents the consensus value (a trimmed mean). The four striped lines, parallel to the consensus value line, are the +3s, +2s, -2s and -3s target reproducibility limits of the selected reference test method. Outliers and other data, which were excluded from the calculations, are represented as a cross. Accepted data are represented as a triangle. Furthermore, Kernel Density Graphs were made. The Kernel Density Graph is a method for producing a smooth Density approximation to a set of data that avoids some problems associated with histograms. Also, a normal Gauss curve was projected over the Kernel Density Graph for reference.
Institute for Interlaboratory Studies Spijkenisse, May 2020
page 8 of 49 Crude Oil Assay: iis19R02 == Revised ==
3.3 Z-SCORES
To evaluate the performance of the participating laboratories the z-scores were calculated. As it was decided to evaluate the performance of the participants in this proficiency test (PT) against the literature requirements e.g. ASTM reproducibilities, the z-scores were calculated using a target standard deviation. This results in an evaluation independent of the variations observed of this interlaboratory study. The target standard deviation was calculated from the literature reproducibility by division with 2.8. In case no literature reproducibility was available, other target values were used. In some cases, a reproducibility of a former iis proficiency test could be used. When a laboratory did use a test method with a reproducibility that is significantly different from the reproducibility of the reference test method used in this report, it is strongly advised to recalculate the z-score, while using the reproducibility of the actual test method used, this in order to evaluate whether the reported test result is fit-for-use. The z-scores were calculated according to: z(target) = (test result - average of PT) / target standard deviation The z(target) scores are listed in the result tables of appendix 1. Absolute values for z<2 are very common and absolute values for z>3 are very rare. The usual interpretation of z-scores is as follows: |z| < 1 good 1 < |z| < 2 satisfactory 2 < |z| < 3 questionable 3 < |z| unsatisfactory
4 EVALUATION
In the proficiency test no major problems were encountered with sample dispatch. After the period of five weeks from sample dispatch only eight participants had reported test results. Nine laboratories reported test results after the final reporting date, the last test results were submitted by the end of January 2020. Seven laboratories did not report any test results at all. Evaluation of test results and preparation of the final report were delayed by these late reported test results or waiting for the not reported test results. Not all laboratories were able to report all analyzes requested. In total 17 participants reported 184 numerical test results for the distillation fractions and 857 numerical test results for the determinations on the fractions. Observed were 4 outliers for the distillation test results and 31 outliers for the determinations, which is respectively 2.2% and 3.6% of the numerical test results. In proficiency studies outlier percentages of 3% - 7.5% are quite normal.
Spijkenisse, May 2020 Institute for Interlaboratory Studies
Crude Oil Assay: iis19R02 == Revised == page 9 of 49
Not all original data sets proved to have a normal Gaussian distribution. These are referred to as “not OK” or “suspect”. The statistical evaluation of these data sets should be used with due care, see also paragraph 3.1.
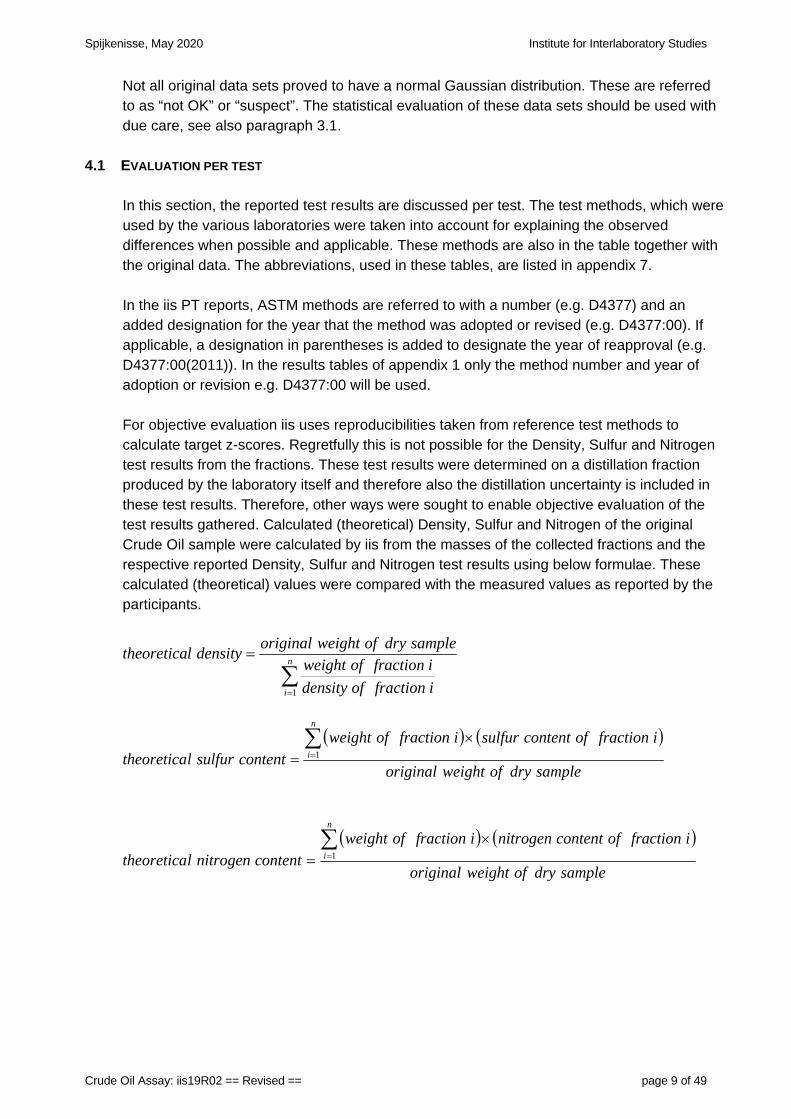
4.1 EVALUATION PER TEST In this section, the reported test results are discussed per test. The test methods, which were used by the various laboratories were taken into account for explaining the observed differences when possible and applicable. These methods are also in the table together with the original data. The abbreviations, used in these tables, are listed in appendix 7. In the iis PT reports, ASTM methods are referred to with a number (e.g. D4377) and an added designation for the year that the method was adopted or revised (e.g. D4377:00). If applicable, a designation in parentheses is added to designate the year of reapproval (e.g. D4377:00(2011)). In the results tables of appendix 1 only the method number and year of adoption or revision e.g. D4377:00 will be used. For objective evaluation iis uses reproducibilities taken from reference test methods to calculate target z-scores. Regretfully this is not possible for the Density, Sulfur and Nitrogen test results from the fractions. These test results were determined on a distillation fraction produced by the laboratory itself and therefore also the distillation uncertainty is included in these test results. Therefore, other ways were sought to enable objective evaluation of the test results gathered. Calculated (theoretical) Density, Sulfur and Nitrogen of the original Crude Oil sample were calculated by iis from the masses of the collected fractions and the respective reported Density, Sulfur and Nitrogen test results using below formulae. These calculated (theoretical) values were compared with the measured values as reported by the participants.
n
i ifractionofdensity
ifractionofweightsampledryofweightoriginal
densityltheoretica
1
sampledryofweightoriginal
ifractionofcontentsulfurifractionofweightcontentsulfurltheoretica
n
i
1
sampledryofweightoriginal
ifractionofcontentnitrogenifractionofweightcontentnitrogenltheoretica
n
i
1
Institute for Interlaboratory Studies Spijkenisse, May 2020
page 10 of 49 Crude Oil Assay: iis19R02 == Revised ==
4.1A - Analysis of the original sample (appendix 1A) Density: The Density determination on the original Crude Oil sample was not
problematic. One statistical outlier was observed. The calculated reproducibility after rejection of the statistical outlier is in good agreement with the requirements of ASTM D5002:19.
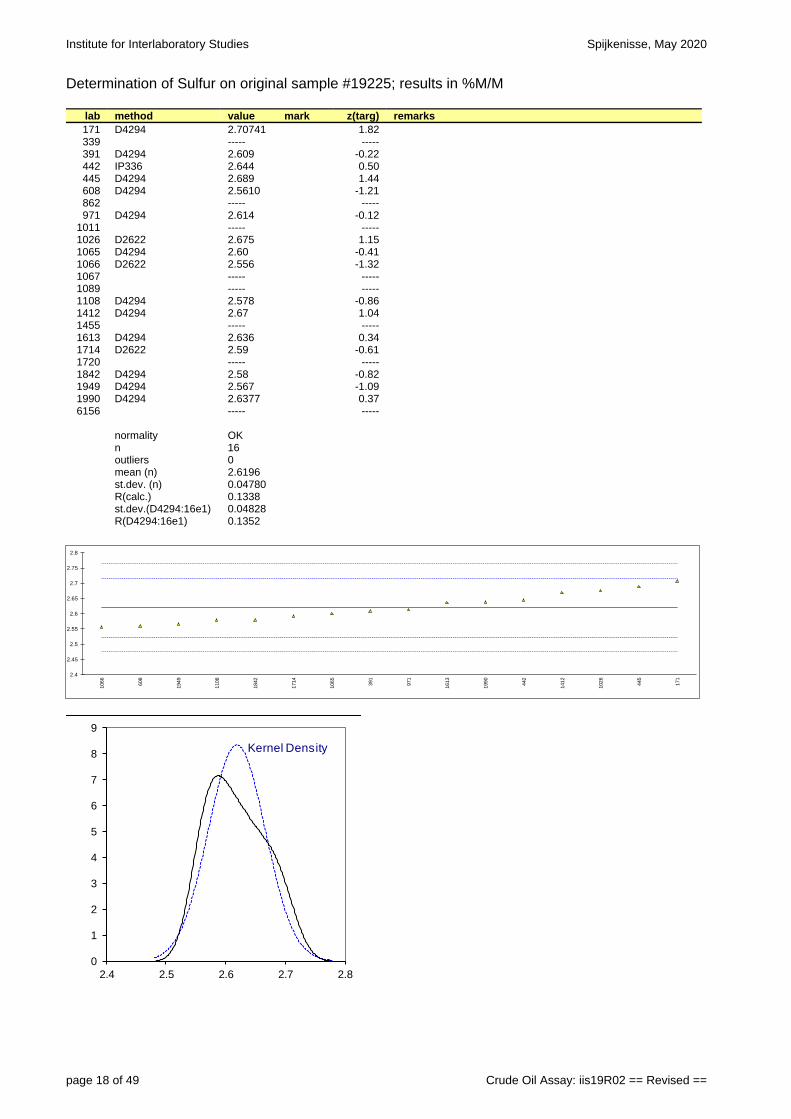
Sulfur: The Sulfur determination on the original Crude Oil sample was not
problematic. No statistical outliers were observed. The calculated reproducibility is in agreement with the requirements of ASTM D4294:16e1.
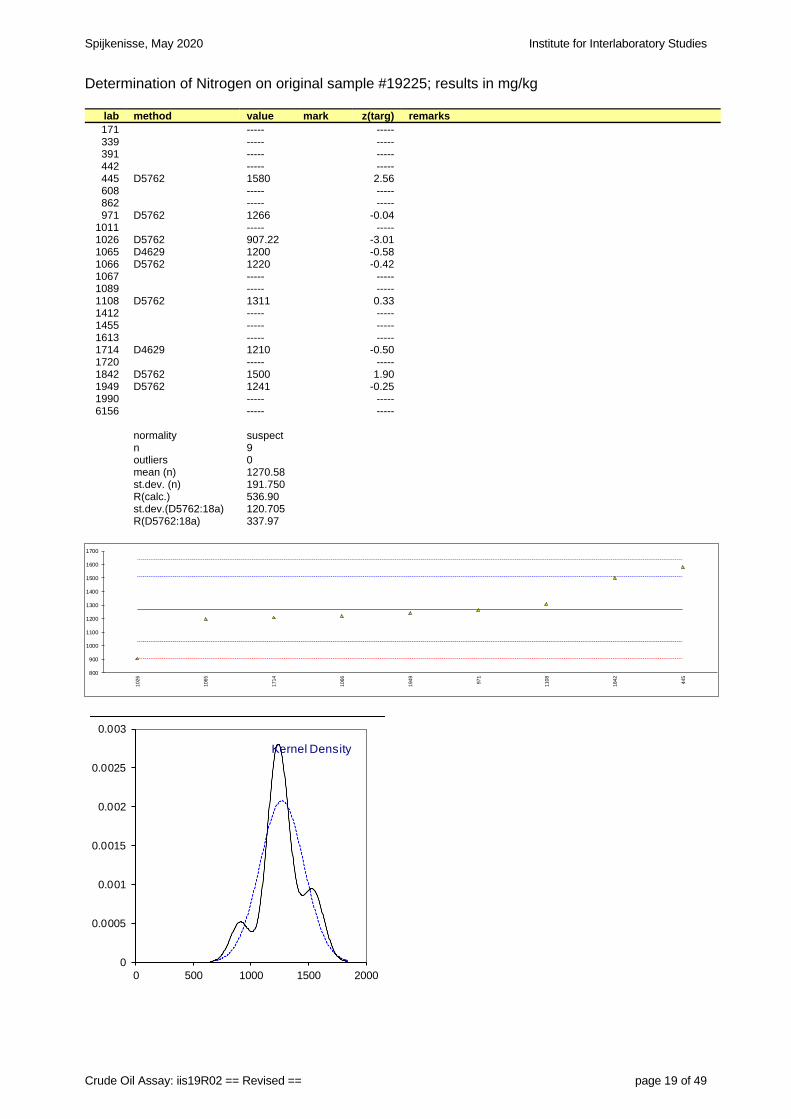
Nitrogen: The Nitrogen determination on the original Crude Oil sample was
problematic. No statistical outliers were observed. However, the calculated reproducibility is not in agreement with the requirements of ASTM D5762:18a.
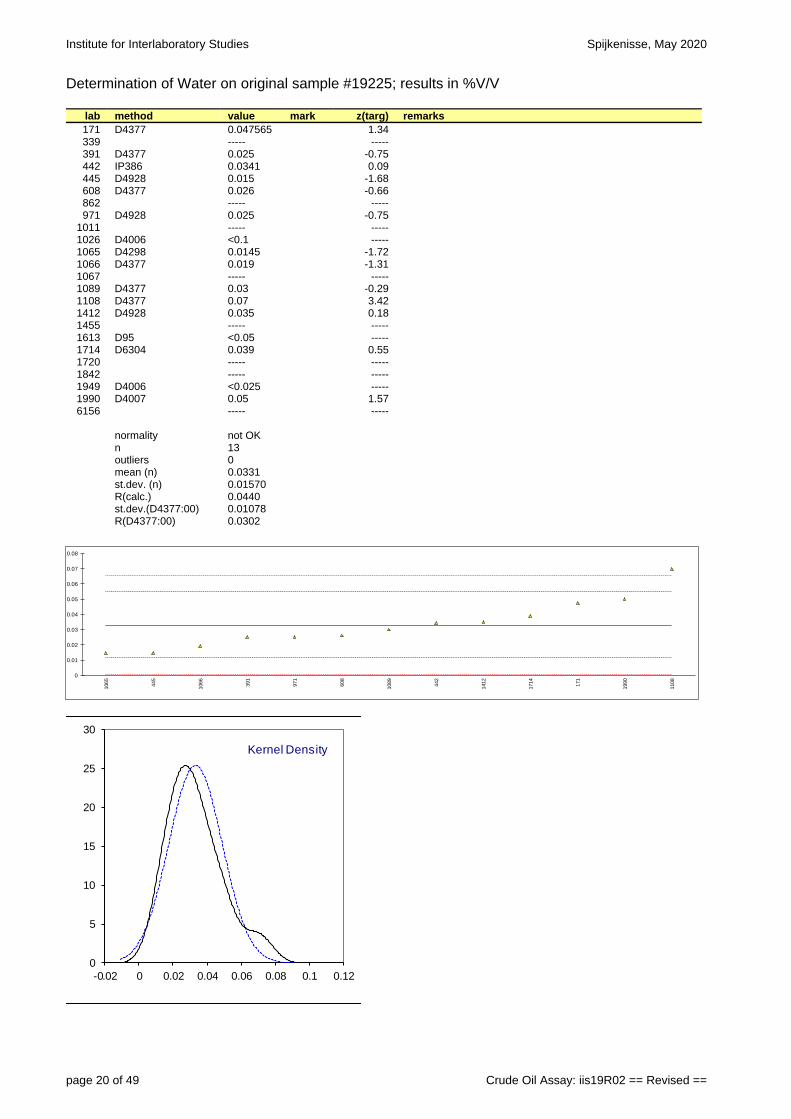
Water: The water determination on the original Crude Oil sample was problematic
at the low level of 0.03%V/V. No statistical outliers were observed. The calculated reproducibility is not in agreement with the requirements of ASTM D4377:00(2011). This method was withdrawn by ASTM in January 2020, because it was not reapproved within eight years.
4.1B - Distillation test results D2892 and D5236 (appendix 1B) In July 2018 a new version of ASTM D5236 and in November 2019 a new version of ASTM D2892 was published. This PT was dispatched at the end of October 2019. It was decided to use the version of 2019 for ASTM D2892 already because the reproducibilities were not affected compared to the earlier version. In total, seventeen laboratories reported distillation test results. Five laboratories only performed the atmospheric distillation (D2892) and twelve also the vacuum distillation (D5236). The details of the distillation(s) reported by the participants can be found in appendix 1B and 5. Looking at the pressure at the start of the atmospheric distillation (D2892), no participant reported to have used a starting pressure below atmospheric. ASTM D2892 states that it is not allowed to let the Observed Boiling Temperature of the liquid exceed 310°C or the Observed Vapor Temperature exceed 210°C (paragraph 10.3.7 of ASTM D2892). According to paragraphs 10.3 till 10.5 of the same method this can be prevented by lowering the pressure in the system. The method also states that after atmospheric pressure a pressure around 100 mmHg should be applied and if necessary or applicable also a lower pressure of between 100 and 2 mmHg is permitted in only one step. Laboratory 445 applied a pressure of 10 mmHg after the atmospheric pressure (fraction 4/5), skipping the pressure step of 100 mmHg. Two laboratories (608 and 1613) still applied a pressure of 100 mmHg for fraction 6, while the Observed Vapor Temperature was above 210°C. And laboratory 1065 applied a pressure for fraction 6 and 7 of 1.00 mmHg, which is not permitted according to ASTM D2892. These differences in temperature and/or pressure does not appear to have a significant effect on the reported test results of the fractions of the atmospheric distillation.

Spijkenisse, May 2020 Institute for Interlaboratory Studies
Crude Oil Assay: iis19R02 == Revised == page 11 of 49
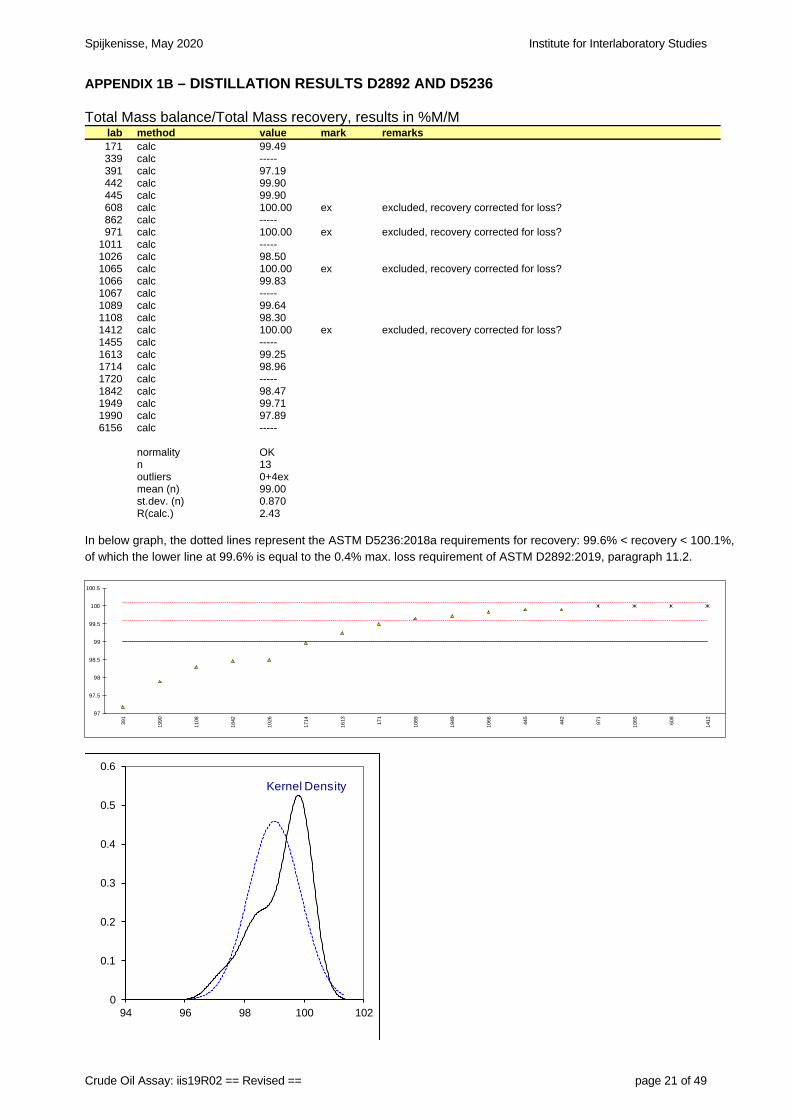
However, it appears to have an effect on the calculation of the Standard Efficiency Nminimum, calculated from the SimDist data from fraction 5 and 6. For ASTM D5236, all participants started the distillation at a pressure between 0.1 and 10 mmHg and no participant used a pressure lower than 0.1 mmHg, which is not permitted according to ASTM D5236. The evaluation of the Total Mass balance showed only five (!) recoveries that do meet the ASTM D2892 (paragraph 11.2) requirement of 0.4% max loss and the ASTM D5236 requirement of a recovery between 99.6 and 100.1%. Remarkably, four recoveries were equal to 100%. They were excluded in this table for it is highly unlikely that no loss occurred in both distillations. All laboratories reported a test result for the mass fraction for Gas (LPG), but some did not report the Density of this fraction. In order to calculate the individual volume recoveries, the consensus value of the group was used when the Density of Gas (LPG) was not reported. D2892: This distillation was not problematic. In total four statistical outliers were
observed. However, after rejection of the statistical outliers the calculated reproducibilities are in agreement with the requirements of ASTM D2892:19.
D5236: This distillation may be problematic. No statistical outliers were observed.
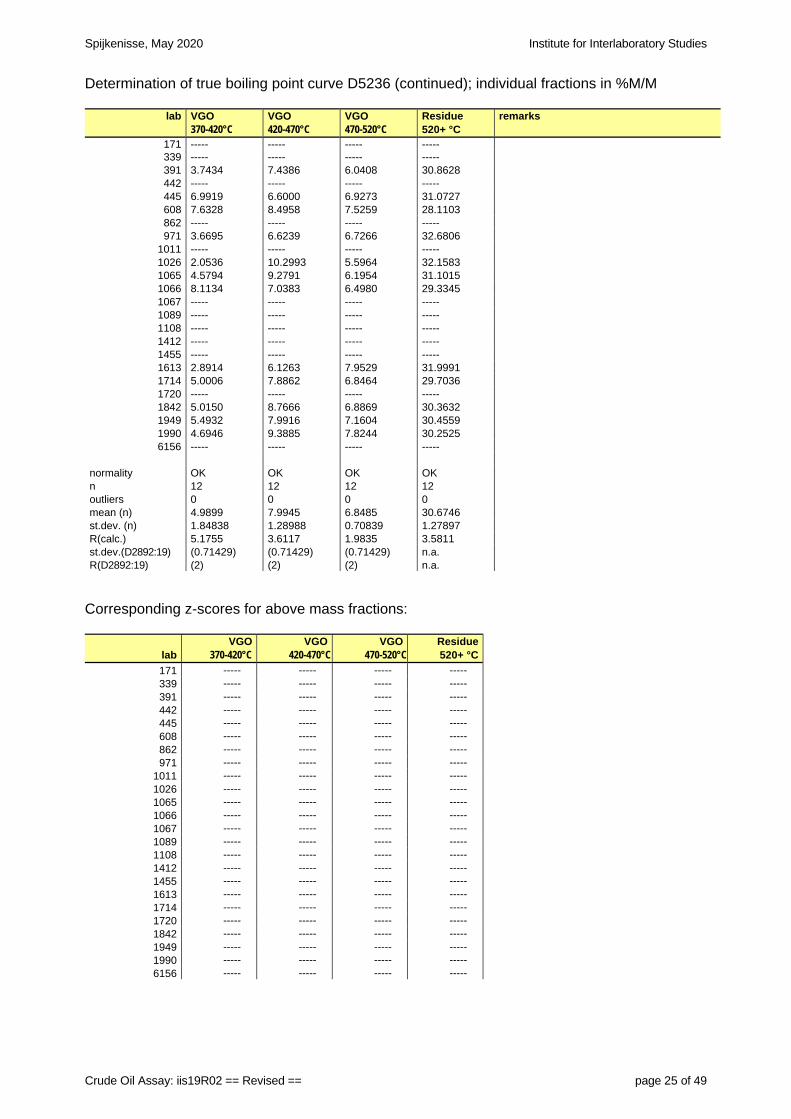
Since the reproducibility of ASTM D5236 is not expressed in mass %, but in °C per 10% liquid volume recovered, the reproducibility of this method cannot be used for the test results in this PT. Since ASTM D2892 also gives a reproducibility at lower operating pressure, this has been used as a guideline in the evaluation. Because of this, no z-scores were calculated. The calculated reproducibilities are all, but one, not in agreement with the requirements of ASTM D2892:19 (low pressure).
Graph Cumulative %M/M (appendix 2): The starts of the true boiling point curves (cumulative
%M/M vs temperature AET) of the laboratories show a high resemblance. The line for laboratory 1990 shows a small negative deviation along a part of 250°C-390°C. This is in line with the deviating test result found for this lab in fraction 5 of the distillation.
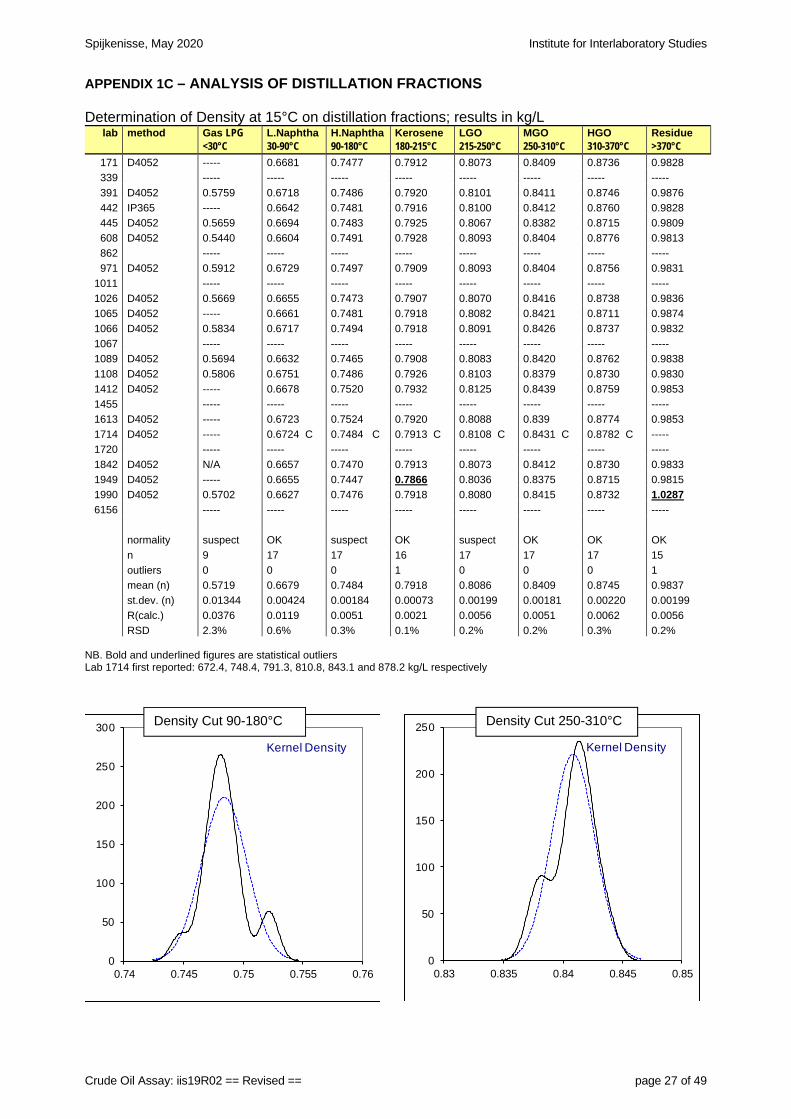
4.1C - Analysis of distillation fractions (appendix 1C) Density: The Density test results on the 12 collected distillation fractions show
relatively large differences between the reported test results of the participating laboratories, although in total only 3 statistical outliers were observed. Two other test results were excluded. The relatively large observed variations are most probably caused by differences in the distillations and not by differences in the performance of the Density determinations. In each case the observed reproducibility will be the sum of the (small) variation in the Density determination and the (large) variation caused by the distillation. Therefore, the observed reproducibilities were not
Institute for Interlaboratory Studies Spijkenisse, May 2020
page 12 of 49 Crude Oil Assay: iis19R02 == Revised ==
compared with the literature requirements and consequently no z-scores were calculated.
The average Density for the first fraction (gas <30°C) is 0.5719 kg/L, which is in good agreement with the Density of a mixture of C4 hydrocarbons and Isopentane.
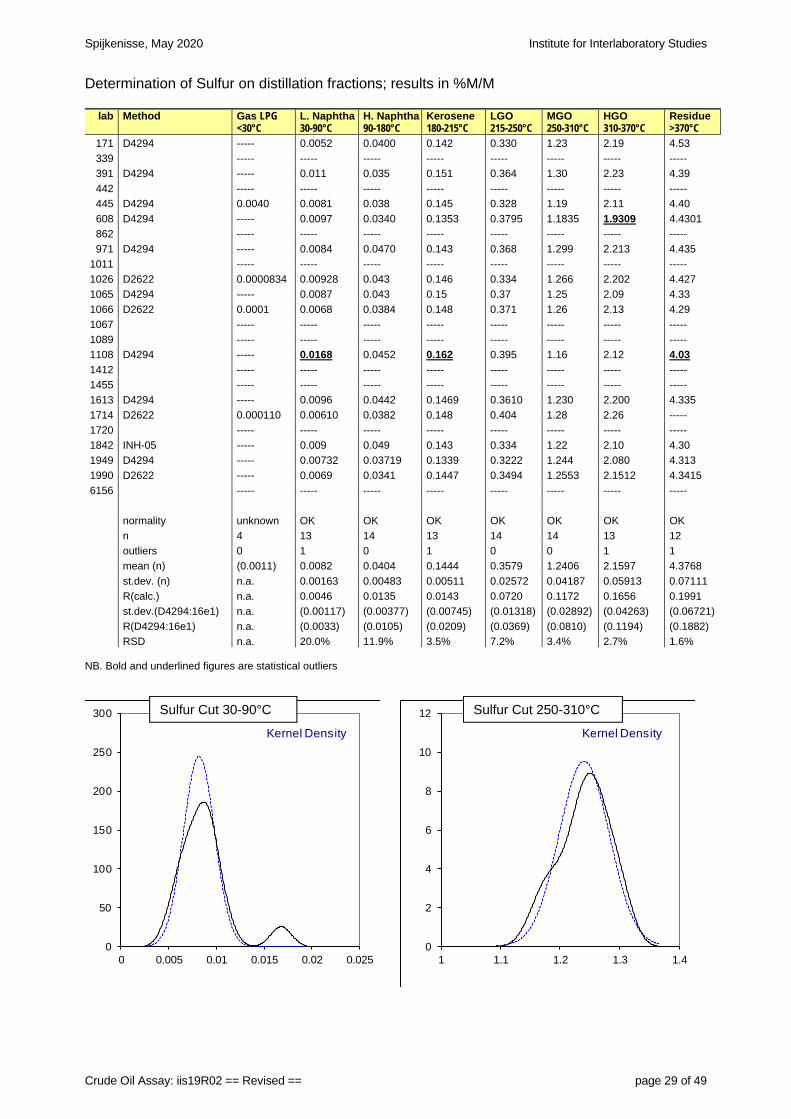
Sulfur: The Sulfur test results on the 12 collected distillation fractions show problems
for a few participating laboratories. In total seven statistical outliers were observed and another test result was excluded. The observed reproducibility per fraction will be the sum of the variation in the Sulfur determination and the variation caused by the distillation. Therefore, the observed reproducibilities were not compared with the literature requirements and consequently no z-scores were calculated.
Nitrogen: The Nitrogen test results on the 12 collected distillation fractions show
problems for a few participating laboratories. In total two statistical outliers were observed. The observed reproducibility per fraction will be the sum of the variation in the Nitrogen determination and the variation caused by the distillation. Therefore, the observed reproducibilities were not compared with the requirements and consequently no z-scores were calculated.
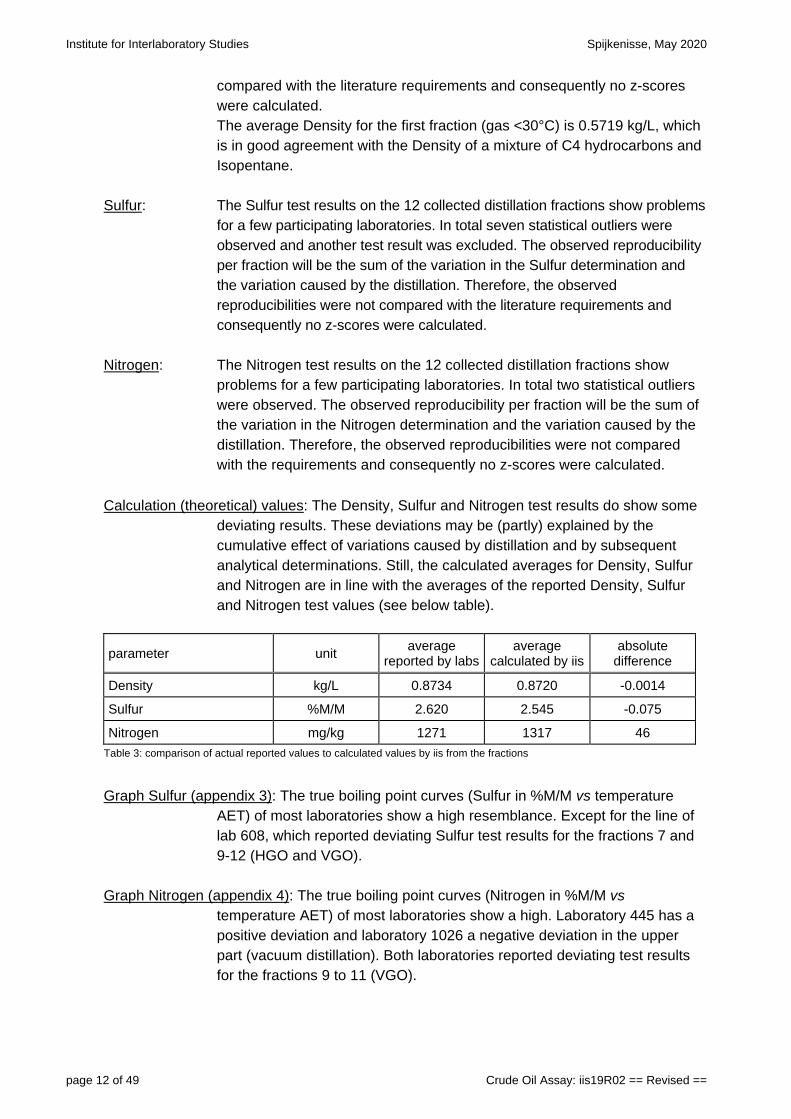
Calculation (theoretical) values: The Density, Sulfur and Nitrogen test results do show some deviating results. These deviations may be (partly) explained by the cumulative effect of variations caused by distillation and by subsequent analytical determinations. Still, the calculated averages for Density, Sulfur and Nitrogen are in line with the averages of the reported Density, Sulfur and Nitrogen test values (see below table).
parameter unit average
reported by labs average
calculated by iis absolute
difference
Density kg/L 0.8734 0.8720 -0.0014
Sulfur %M/M 2.620 2.545 -0.075
Nitrogen mg/kg 1271 1317 46
Table 3: comparison of actual reported values to calculated values by iis from the fractions
Graph Sulfur (appendix 3): The true boiling point curves (Sulfur in %M/M vs temperature
AET) of most laboratories show a high resemblance. Except for the line of lab 608, which reported deviating Sulfur test results for the fractions 7 and 9-12 (HGO and VGO).
Graph Nitrogen (appendix 4): The true boiling point curves (Nitrogen in %M/M vs
temperature AET) of most laboratories show a high. Laboratory 445 has a positive deviation and laboratory 1026 a negative deviation in the upper part (vacuum distillation). Both laboratories reported deviating test results for the fractions 9 to 11 (VGO).
Spijkenisse, May 2020 Institute for Interlaboratory Studies
Crude Oil Assay: iis19R02 == Revised == page 13 of 49
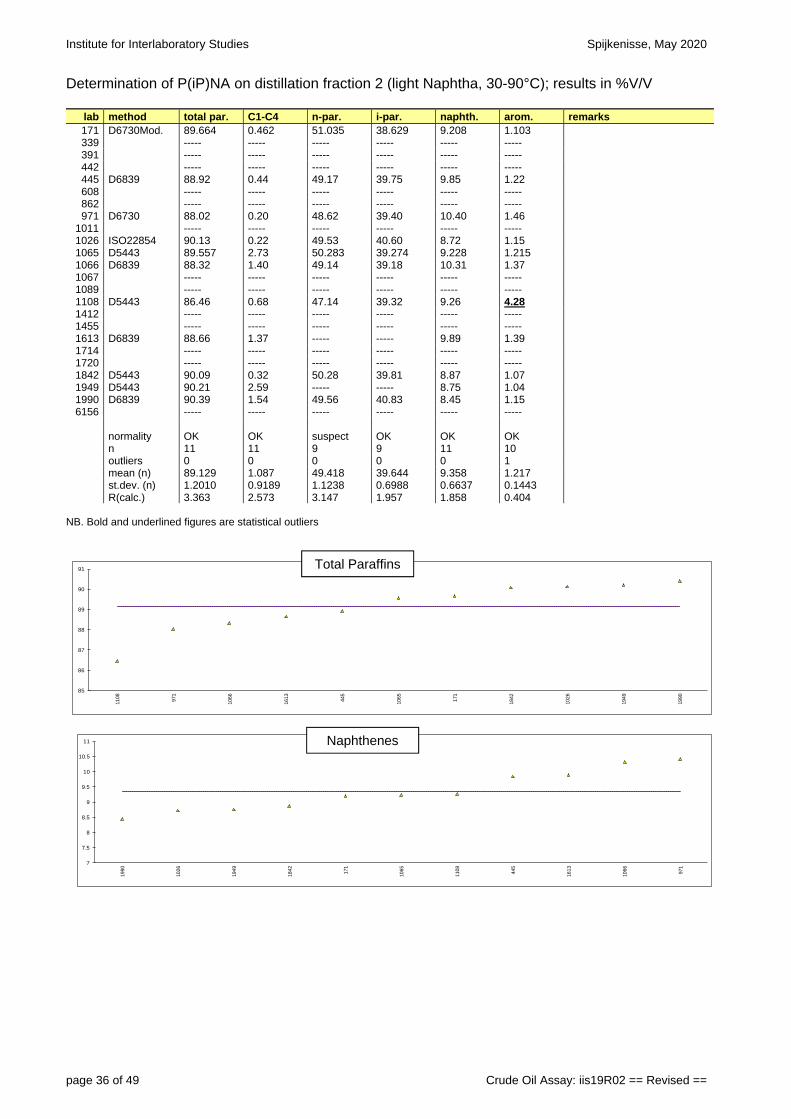
P(iP)NA: This determination was performed on fraction 2 (Light Naphtha) and on fraction 3 (Heavy Naphtha) only. On the Light Naphtha three statistical outliers were observed. More analytical problems were observed on fraction 3 (Heavy Naphtha). In total ten statistical outliers were observed. Each observed reproducibility will be the sum of the variation in the analytical method and the variation caused by the distillation D2892. Therefore, the observed reproducibilities were not compared with the requirements and consequently no z-scores were calculated. The variety of test methods used may partly explain the large variations observed during this PT.
The set-up of the correct integration window is most critical in the case of testing high naphthenic distillation fractions.
Flash point: This determination was performed on the combined fractions 5 and 6 only.
The determination was not problematic. One statistical outlier was observed. The calculated reproducibility after rejection of the statistical outlier is in agreement with the requirements of ASTM D93-A:19.
Distillation: This determination was performed on the combined fractions 5 and 6 only.
No analytical problems were encountered. Two statistical outliers were observed. Each observed reproducibility will be the sum of the variation in this distillation of the combined fractions and the variation caused by the D2892 distillation. Therefore, the observed reproducibilities were not compared with the requirements and consequently no z-scores were calculated.
4.1D - Simulated Distillation and Effective Cut Point D2892 SimDist: This determination was performed on both fractions 5 (Light Gasoil) and 6
(Medium Gasoil). This simulated distillation was performed by ten participants on both fractions. Most reported test results showed a close resemblance. In total three outliers were observed. The goal was to enable evaluation of the column efficiency in accordance with appendix X2 of ASTM D2892:19.
ECP/Nminimum: From the reported test results, the ECP (effective cut point) and the
Standard Efficiency Nminimum were calculated, based on temperature intervals of 5 degrees. The ECP for one laboratory did not meet the requirements of ASTM D2892:19. The Standard Efficiency Nminimum requirements of ASTM D2892:19 were met by four laboratories. A fifth laboratory was very close to the lower limit. One laboratory did not submit any Observed Vapor Temperatures, so the calculation could not be done. The other five laboratories were not in agreement with the requirements of ASTM D2892 and had either problems with pressure and/or temperature used in the distillation itself or with the determination of the Simulated Distillation test (see also the discussion on page 10). One laboratory submitted SimDist result in Fahrenheit, which had to be calculated to Celsius first.
Institute for Interlaboratory Studies Spijkenisse, May 2020
page 14 of 49 Crude Oil Assay: iis19R02 == Revised ==
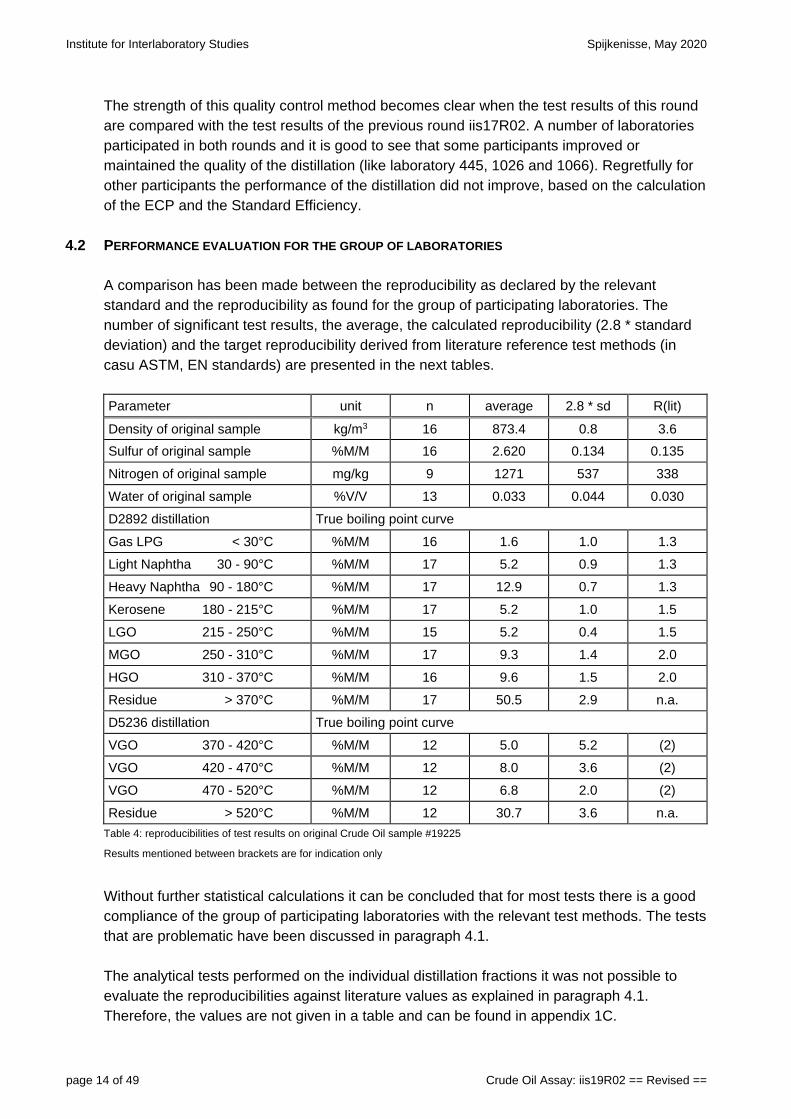
The strength of this quality control method becomes clear when the test results of this round are compared with the test results of the previous round iis17R02. A number of laboratories participated in both rounds and it is good to see that some participants improved or maintained the quality of the distillation (like laboratory 445, 1026 and 1066). Regretfully for other participants the performance of the distillation did not improve, based on the calculation of the ECP and the Standard Efficiency.
4.2 PERFORMANCE EVALUATION FOR THE GROUP OF LABORATORIES
A comparison has been made between the reproducibility as declared by the relevant standard and the reproducibility as found for the group of participating laboratories. The number of significant test results, the average, the calculated reproducibility (2.8 * standard deviation) and the target reproducibility derived from literature reference test methods (in casu ASTM, EN standards) are presented in the next tables.
Parameter unit n average 2.8 * sd R(lit)
Density of original sample kg/m3 16 873.4 0.8 3.6
Sulfur of original sample %M/M 16 2.620 0.134 0.135
Nitrogen of original sample mg/kg 9 1271 537 338
Water of original sample %V/V 13 0.033 0.044 0.030
D2892 distillation True boiling point curve
Gas LPG < 30°C %M/M 16 1.6 1.0 1.3
Light Naphtha 30 - 90°C %M/M 17 5.2 0.9 1.3
Heavy Naphtha 90 - 180°C %M/M 17 12.9 0.7 1.3
Kerosene 180 - 215°C %M/M 17 5.2 1.0 1.5
LGO 215 - 250°C %M/M 15 5.2 0.4 1.5
MGO 250 - 310°C %M/M 17 9.3 1.4 2.0
HGO 310 - 370°C %M/M 16 9.6 1.5 2.0
Residue > 370°C %M/M 17 50.5 2.9 n.a.
D5236 distillation True boiling point curve
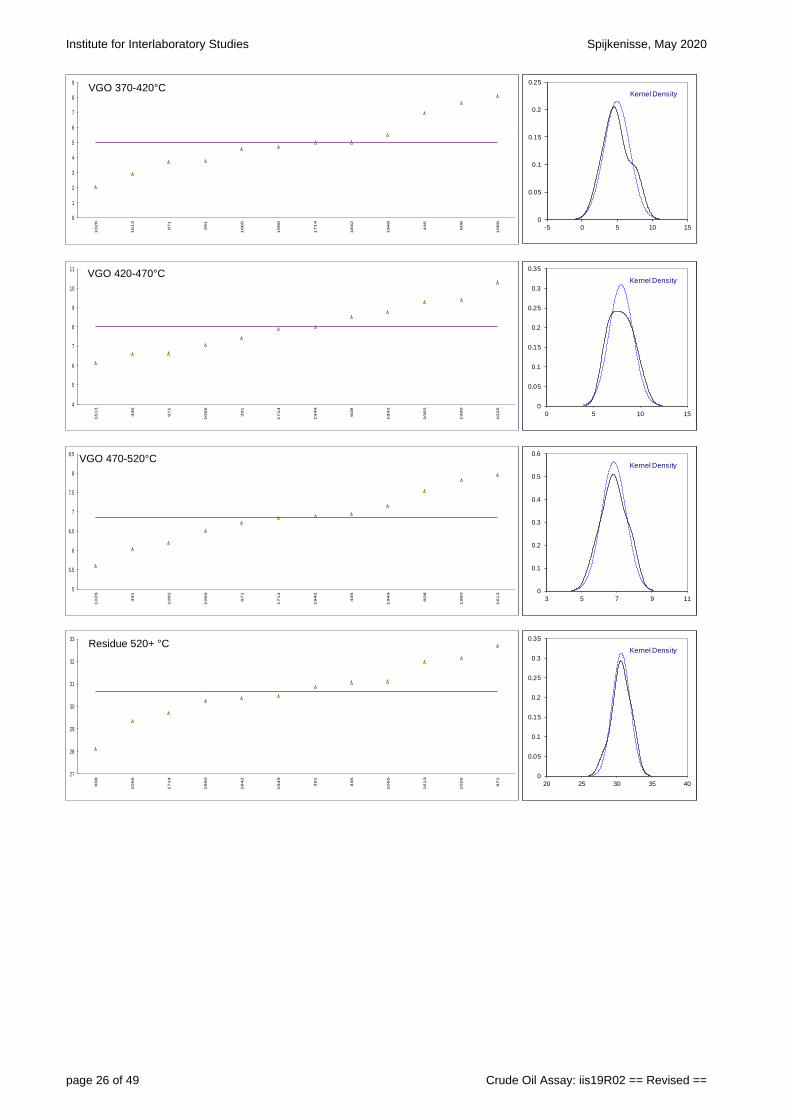
VGO 370 - 420°C %M/M 12 5.0 5.2 (2)
VGO 420 - 470°C %M/M 12 8.0 3.6 (2)
VGO 470 - 520°C %M/M 12 6.8 2.0 (2)
Residue > 520°C %M/M 12 30.7 3.6 n.a.
Table 4: reproducibilities of test results on original Crude Oil sample #19225
Results mentioned between brackets are for indication only
Without further statistical calculations it can be concluded that for most tests there is a good compliance of the group of participating laboratories with the relevant test methods. The tests that are problematic have been discussed in paragraph 4.1. The analytical tests performed on the individual distillation fractions it was not possible to evaluate the reproducibilities against literature values as explained in paragraph 4.1. Therefore, the values are not given in a table and can be found in appendix 1C.
Spijkenisse, May 2020 Institute for Interlaboratory Studies
Crude Oil Assay: iis19R02 == Revised == page 15 of 49
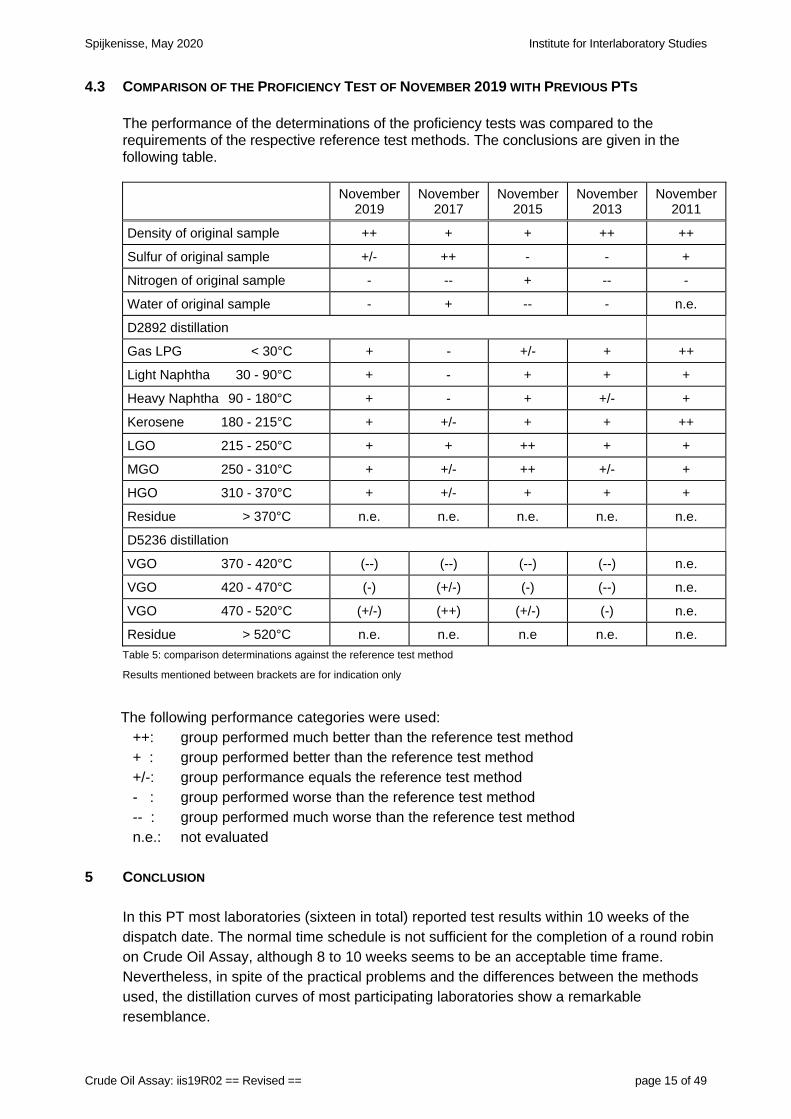
4.3 COMPARISON OF THE PROFICIENCY TEST OF NOVEMBER 2019 WITH PREVIOUS PTS
The performance of the determinations of the proficiency tests was compared to the requirements of the respective reference test methods. The conclusions are given in the following table.
November 2019
November 2017
November 2015
November 2013
November 2011
Density of original sample ++ + + ++ ++
Sulfur of original sample +/- ++ - - +
Nitrogen of original sample - -- + -- -
Water of original sample - + -- - n.e.
D2892 distillation
Gas LPG < 30°C + - +/- + ++
Light Naphtha 30 - 90°C + - + + +
Heavy Naphtha 90 - 180°C + - + +/- +
Kerosene 180 - 215°C + +/- + + ++
LGO 215 - 250°C + + ++ + +
MGO 250 - 310°C + +/- ++ +/- +
HGO 310 - 370°C + +/- + + +
Residue > 370°C n.e. n.e. n.e. n.e. n.e.
D5236 distillation
VGO 370 - 420°C (--) (--) (--) (--) n.e.
VGO 420 - 470°C (-) (+/-) (-) (--) n.e.
VGO 470 - 520°C (+/-) (++) (+/-) (-) n.e.
Residue > 520°C n.e. n.e. n.e n.e. n.e.
Table 5: comparison determinations against the reference test method
Results mentioned between brackets are for indication only
The following performance categories were used: ++: group performed much better than the reference test method
+ : group performed better than the reference test method +/-: group performance equals the reference test method - : group performed worse than the reference test method -- : group performed much worse than the reference test method n.e.: not evaluated 5 CONCLUSION
In this PT most laboratories (sixteen in total) reported test results within 10 weeks of the dispatch date. The normal time schedule is not sufficient for the completion of a round robin on Crude Oil Assay, although 8 to 10 weeks seems to be an acceptable time frame. Nevertheless, in spite of the practical problems and the differences between the methods used, the distillation curves of most participating laboratories show a remarkable resemblance.
Institute for Interlaboratory Studies Spijkenisse, May 2020
page 16 of 49 Crude Oil Assay: iis19R02 == Revised ==
Although it can be concluded that most of the participants have no problem with the determination in Crude Oil Assay analyzes in this PT, each participating laboratory will have to evaluate its performance in this study and decide about any corrective actions if necessary.
Spijkenisse, May 2020 Institute for Interlaboratory Studies
Crude Oil Assay: iis19R02 == Revised == page 17 of 49
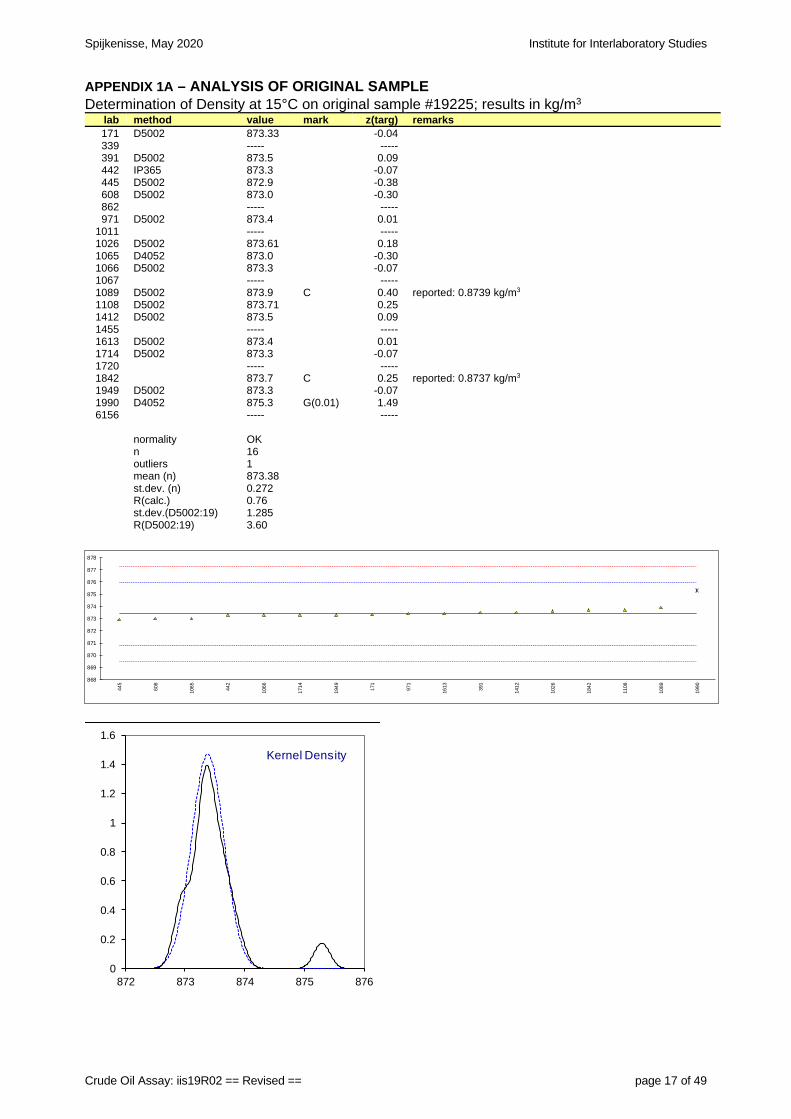
APPENDIX 1A – ANALYSIS OF ORIGINAL SAMPLE Determination of Density at 15°C on original sample #19225; results in kg/m3
lab method value mark z(targ) remarks 171 D5002 873.33 -0.04 339 ----- ----- 391 D5002 873.5 0.09 442 IP365 873.3 -0.07 445 D5002 872.9 -0.38 608 D5002 873.0 -0.30 862 ----- ----- 971 D5002 873.4 0.01
1011 ----- ----- 1026 D5002 873.61 0.18 1065 D4052 873.0 -0.30 1066 D5002 873.3 -0.07 1067 ----- ----- 1089 D5002 873.9 C 0.40 reported: 0.8739 kg/m3
1108 D5002 873.71 0.25 1412 D5002 873.5 0.09 1455 ----- ----- 1613 D5002 873.4 0.01 1714 D5002 873.3 -0.07 1720 ----- ----- 1842 873.7 C 0.25 reported: 0.8737 kg/m3 1949 D5002 873.3 -0.07 1990 D4052 875.3 G(0.01) 1.49 6156 ----- -----
normality OK n 16 outliers 1 mean (n) 873.38 st.dev. (n) 0.272 R(calc.) 0.76 st.dev.(D5002:19) 1.285 R(D5002:19) 3.60
868
869
870
871
872
873
874
875
876
877
878
445
608
106
5
442
106
6
171
4
194
9
171
971
161
3
391
141
2
102
6
184
2
110
8
108
9
199
0
0
0.2
0.4
0.6
0.8
1
1.2
1.4
1.6
872 873 874 875 876
Kernel Density
Institute for Interlaboratory Studies Spijkenisse, May 2020
page 18 of 49 Crude Oil Assay: iis19R02 == Revised ==
Determination of Sulfur on original sample #19225; results in %M/M
lab method value mark z(targ) remarks 171 D4294 2.70741 1.82 339 ----- ----- 391 D4294 2.609 -0.22 442 IP336 2.644 0.50 445 D4294 2.689 1.44 608 D4294 2.5610 -1.21 862 ----- ----- 971 D4294 2.614 -0.12
1011 ----- ----- 1026 D2622 2.675 1.15 1065 D4294 2.60 -0.41 1066 D2622 2.556 -1.32 1067 ----- ----- 1089 ----- ----- 1108 D4294 2.578 -0.86 1412 D4294 2.67 1.04 1455 ----- ----- 1613 D4294 2.636 0.34 1714 D2622 2.59 -0.61 1720 ----- ----- 1842 D4294 2.58 -0.82 1949 D4294 2.567 -1.09 1990 D4294 2.6377 0.37 6156 ----- -----
normality OK n 16 outliers 0 mean (n) 2.6196 st.dev. (n) 0.04780 R(calc.) 0.1338 st.dev.(D4294:16e1) 0.04828 R(D4294:16e1) 0.1352
2.4
2.45
2.5
2.55
2.6
2.65
2.7
2.75
2.8
106
6
608
194
9
110
8
184
2
171
4
106
5
391
971
161
3
199
0
442
141
2
102
6
445
171
0
1
2
3
4
5
6
7
8
9
2.4 2.5 2.6 2.7 2.8
Kernel Density
Spijkenisse, May 2020 Institute for Interlaboratory Studies
Crude Oil Assay: iis19R02 == Revised == page 19 of 49
Determination of Nitrogen on original sample #19225; results in mg/kg
lab method value mark z(targ) remarks 171 ----- ----- 339 ----- ----- 391 ----- ----- 442 ----- ----- 445 D5762 1580 2.56 608 ----- ----- 862 ----- ----- 971 D5762 1266 -0.04
1011 ----- ----- 1026 D5762 907.22 -3.01 1065 D4629 1200 -0.58 1066 D5762 1220 -0.42 1067 ----- ----- 1089 ----- ----- 1108 D5762 1311 0.33 1412 ----- ----- 1455 ----- ----- 1613 ----- ----- 1714 D4629 1210 -0.50 1720 ----- ----- 1842 D5762 1500 1.90 1949 D5762 1241 -0.25 1990 ----- ----- 6156 ----- -----
normality suspect n 9 outliers 0 mean (n) 1270.58 st.dev. (n) 191.750 R(calc.) 536.90 st.dev.(D5762:18a) 120.705 R(D5762:18a) 337.97
800
900
1000
1100
1200
1300
1400
1500
1600
1700
102
6
106
5
171
4
106
6
194
9
971
110
8
184
2
445
0
0.0005
0.001
0.0015
0.002
0.0025
0.003
0 500 1000 1500 2000
Kernel Density
Institute for Interlaboratory Studies Spijkenisse, May 2020
page 20 of 49 Crude Oil Assay: iis19R02 == Revised ==
Determination of Water on original sample #19225; results in %V/V
lab method value mark z(targ) remarks 171 D4377 0.047565 1.34 339 ----- ----- 391 D4377 0.025 -0.75 442 IP386 0.0341 0.09 445 D4928 0.015 -1.68 608 D4377 0.026 -0.66 862 ----- ----- 971 D4928 0.025 -0.75
1011 ----- ----- 1026 D4006 <0.1 ----- 1065 D4298 0.0145 -1.72 1066 D4377 0.019 -1.31 1067 ----- ----- 1089 D4377 0.03 -0.29 1108 D4377 0.07 3.42 1412 D4928 0.035 0.18 1455 ----- ----- 1613 D95 <0.05 ----- 1714 D6304 0.039 0.55 1720 ----- ----- 1842 ----- ----- 1949 D4006 <0.025 ----- 1990 D4007 0.05 1.57 6156 ----- -----
normality not OK n 13 outliers 0 mean (n) 0.0331 st.dev. (n) 0.01570 R(calc.) 0.0440 st.dev.(D4377:00) 0.01078 R(D4377:00) 0.0302
0
0.01
0.02
0.03
0.04
0.05
0.06
0.07
0.08
106
5
445
106
6
391
971
608
108
9
442
141
2
171
4
171
199
0
110
8
0
5
10
15
20
25
30
-0.02 0 0.02 0.04 0.06 0.08 0.1 0.12
Kernel Density
Spijkenisse, May 2020 Institute for Interlaboratory Studies
Crude Oil Assay: iis19R02 == Revised == page 21 of 49
APPENDIX 1B – DISTILLATION RESULTS D2892 AND D5236 Total Mass balance/Total Mass recovery, results in %M/M
lab method value mark remarks 171 calc 99.49 339 calc ----- 391 calc 97.19 442 calc 99.90 445 calc 99.90 608 calc 100.00 ex excluded, recovery corrected for loss? 862 calc ----- 971 calc 100.00 ex excluded, recovery corrected for loss?
1011 calc ----- 1026 calc 98.50 1065 calc 100.00 ex excluded, recovery corrected for loss? 1066 calc 99.83 1067 calc ----- 1089 calc 99.64 1108 calc 98.30 1412 calc 100.00 ex excluded, recovery corrected for loss? 1455 calc ----- 1613 calc 99.25 1714 calc 98.96 1720 calc ----- 1842 calc 98.47 1949 calc 99.71 1990 calc 97.89 6156 calc -----
normality OK n 13 outliers 0+4ex mean (n) 99.00 st.dev. (n) 0.870 R(calc.) 2.43
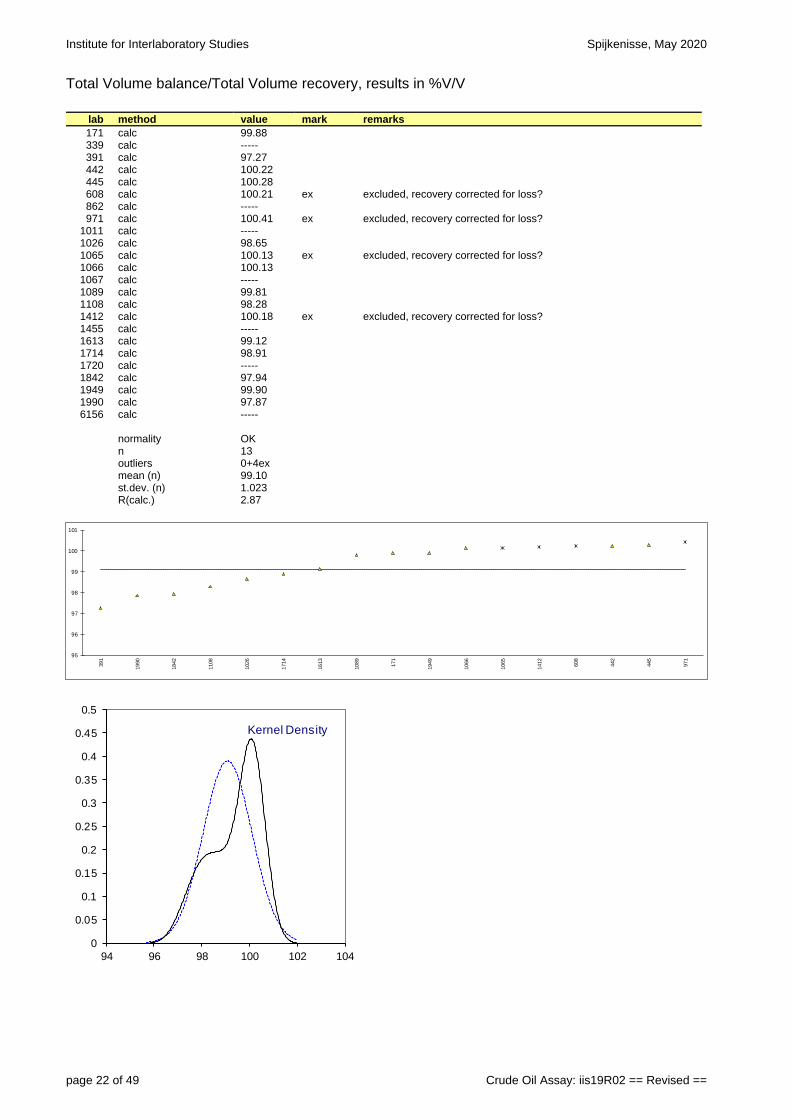
In below graph, the dotted lines represent the ASTM D5236:2018a requirements for recovery: 99.6% < recovery < 100.1%, of which the lower line at 99.6% is equal to the 0.4% max. loss requirement of ASTM D2892:2019, paragraph 11.2.
97
97.5
98
98.5
99
99.5
100
100.5
391
199
0
110
8
184
2
102
6
171
4
161
3
171
108
9
194
9
106
6
445
442
971
106
5
608
141
2
0
0.1
0.2
0.3
0.4
0.5
0.6
94 96 98 100 102
Kernel Density
Institute for Interlaboratory Studies Spijkenisse, May 2020
page 22 of 49 Crude Oil Assay: iis19R02 == Revised ==
Total Volume balance/Total Volume recovery, results in %V/V
lab method value mark remarks 171 calc 99.88 339 calc ----- 391 calc 97.27 442 calc 100.22 445 calc 100.28 608 calc 100.21 ex excluded, recovery corrected for loss? 862 calc ----- 971 calc 100.41 ex excluded, recovery corrected for loss?
1011 calc ----- 1026 calc 98.65 1065 calc 100.13 ex excluded, recovery corrected for loss? 1066 calc 100.13 1067 calc ----- 1089 calc 99.81 1108 calc 98.28 1412 calc 100.18 ex excluded, recovery corrected for loss? 1455 calc ----- 1613 calc 99.12 1714 calc 98.91 1720 calc ----- 1842 calc 97.94 1949 calc 99.90 1990 calc 97.87 6156 calc -----
normality OK n 13 outliers 0+4ex mean (n) 99.10 st.dev. (n) 1.023 R(calc.) 2.87
95
96
97
98
99
100
101
391
199
0
184
2
110
8
102
6
171
4
161
3
108
9
171
194
9
106
6
106
5
141
2
608
442
445
971
0
0.05
0.1
0.15
0.2
0.25
0.3
0.35
0.4
0.45
0.5
94 96 98 100 102 104
Kernel Density
Spijkenisse, May 2020 Institute for Interlaboratory Studies
Crude Oil Assay: iis19R02 == Revised == page 23 of 49
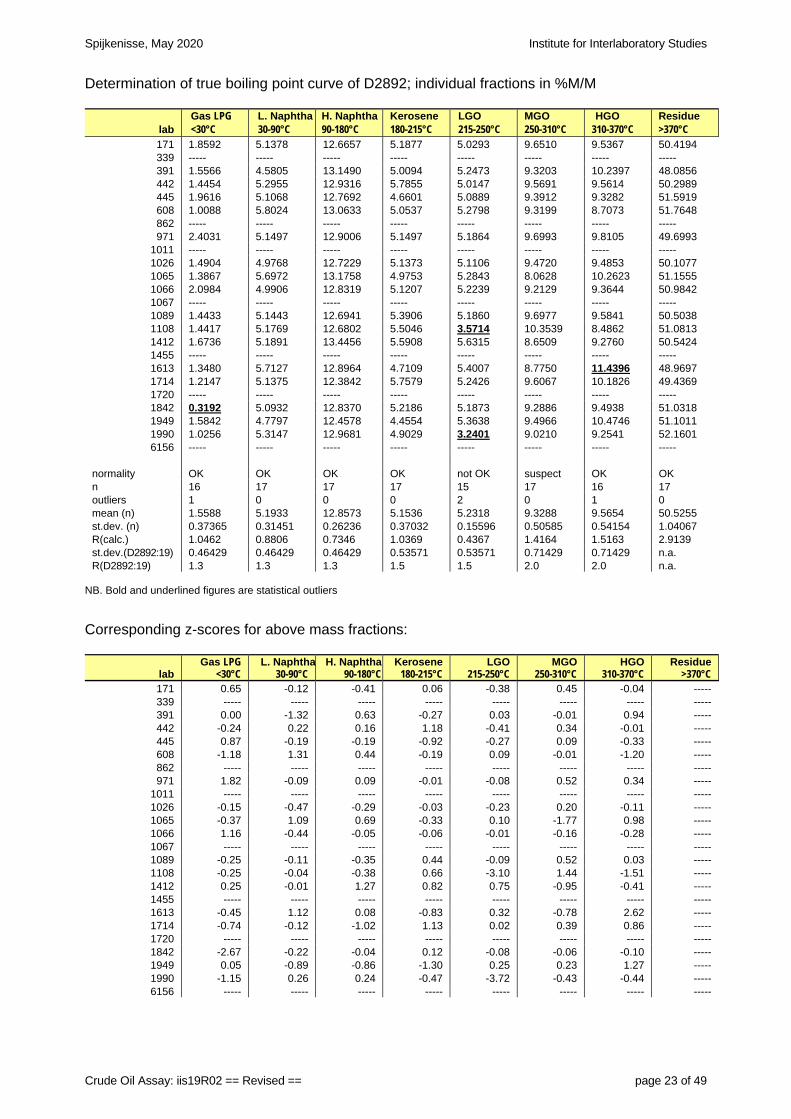
Determination of true boiling point curve of D2892; individual fractions in %M/M
lab Gas LPG <30°C
L. Naphtha 30-90°C
H. Naphtha 90-180°C
Kerosene 180-215°C
LGO 215-250°C
MGO 250-310°C
HGO 310-370°C
Residue >370°C
171 1.8592 5.1378 12.6657 5.1877 5.0293 9.6510 9.5367 50.4194 339 ----- ----- ----- ----- ----- ----- ----- ----- 391 1.5566 4.5805 13.1490 5.0094 5.2473 9.3203 10.2397 48.0856 442 1.4454 5.2955 12.9316 5.7855 5.0147 9.5691 9.5614 50.2989 445 1.9616 5.1068 12.7692 4.6601 5.0889 9.3912 9.3282 51.5919 608 1.0088 5.8024 13.0633 5.0537 5.2798 9.3199 8.7073 51.7648 862 ----- ----- ----- ----- ----- ----- ----- ----- 971 2.4031 5.1497 12.9006 5.1497 5.1864 9.6993 9.8105 49.6993
1011 ----- ----- ----- ----- ----- ----- ----- ----- 1026 1.4904 4.9768 12.7229 5.1373 5.1106 9.4720 9.4853 50.1077 1065 1.3867 5.6972 13.1758 4.9753 5.2843 8.0628 10.2623 51.1555 1066 2.0984 4.9906 12.8319 5.1207 5.2239 9.2129 9.3644 50.9842 1067 ----- ----- ----- ----- ----- ----- ----- ----- 1089 1.4433 5.1443 12.6941 5.3906 5.1860 9.6977 9.5841 50.5038 1108 1.4417 5.1769 12.6802 5.5046 3.5714 10.3539 8.4862 51.0813 1412 1.6736 5.1891 13.4456 5.5908 5.6315 8.6509 9.2760 50.5424 1455 ----- ----- ----- ----- ----- ----- ----- ----- 1613 1.3480 5.7127 12.8964 4.7109 5.4007 8.7750 11.4396 48.9697 1714 1.2147 5.1375 12.3842 5.7579 5.2426 9.6067 10.1826 49.4369 1720 ----- ----- ----- ----- ----- ----- ----- ----- 1842 0.3192 5.0932 12.8370 5.2186 5.1873 9.2886 9.4938 51.0318 1949 1.5842 4.7797 12.4578 4.4554 5.3638 9.4966 10.4746 51.1011 1990 1.0256 5.3147 12.9681 4.9029 3.2401 9.0210 9.2541 52.1601 6156 ----- ----- ----- ----- ----- ----- ----- -----
normality OK OK OK OK not OK suspect OK OK n 16 17 17 17 15 17 16 17 outliers 1 0 0 0 2 0 1 0 mean (n) 1.5588 5.1933 12.8573 5.1536 5.2318 9.3288 9.5654 50.5255 st.dev. (n) 0.37365 0.31451 0.26236 0.37032 0.15596 0.50585 0.54154 1.04067 R(calc.) 1.0462 0.8806 0.7346 1.0369 0.4367 1.4164 1.5163 2.9139 st.dev.(D2892:19) 0.46429 0.46429 0.46429 0.53571 0.53571 0.71429 0.71429 n.a. R(D2892:19) 1.3 1.3 1.3 1.5 1.5 2.0 2.0 n.a.
NB. Bold and underlined figures are statistical outliers
Corresponding z-scores for above mass fractions:
lab Gas LPG
<30°C L. Naphtha
30-90°C H. Naphtha
90-180°C Kerosene
180-215°C LGO
215-250°C MGO
250-310°C HGO
310-370°C Residue
>370°C 171 0.65 -0.12 -0.41 0.06 -0.38 0.45 -0.04 ----- 339 ----- ----- ----- ----- ----- ----- ----- ----- 391 0.00 -1.32 0.63 -0.27 0.03 -0.01 0.94 ----- 442 -0.24 0.22 0.16 1.18 -0.41 0.34 -0.01 ----- 445 0.87 -0.19 -0.19 -0.92 -0.27 0.09 -0.33 ----- 608 -1.18 1.31 0.44 -0.19 0.09 -0.01 -1.20 ----- 862 ----- ----- ----- ----- ----- ----- ----- ----- 971 1.82 -0.09 0.09 -0.01 -0.08 0.52 0.34 -----
1011 ----- ----- ----- ----- ----- ----- ----- ----- 1026 -0.15 -0.47 -0.29 -0.03 -0.23 0.20 -0.11 ----- 1065 -0.37 1.09 0.69 -0.33 0.10 -1.77 0.98 ----- 1066 1.16 -0.44 -0.05 -0.06 -0.01 -0.16 -0.28 ----- 1067 ----- ----- ----- ----- ----- ----- ----- ----- 1089 -0.25 -0.11 -0.35 0.44 -0.09 0.52 0.03 ----- 1108 -0.25 -0.04 -0.38 0.66 -3.10 1.44 -1.51 ----- 1412 0.25 -0.01 1.27 0.82 0.75 -0.95 -0.41 ----- 1455 ----- ----- ----- ----- ----- ----- ----- ----- 1613 -0.45 1.12 0.08 -0.83 0.32 -0.78 2.62 ----- 1714 -0.74 -0.12 -1.02 1.13 0.02 0.39 0.86 ----- 1720 ----- ----- ----- ----- ----- ----- ----- ----- 1842 -2.67 -0.22 -0.04 0.12 -0.08 -0.06 -0.10 ----- 1949 0.05 -0.89 -0.86 -1.30 0.25 0.23 1.27 ----- 1990 -1.15 0.26 0.24 -0.47 -3.72 -0.43 -0.44 ----- 6156 ----- ----- ----- ----- ----- ----- ----- -----
Institute for Interlaboratory Studies Spijkenisse, May 2020
page 24 of 49 Crude Oil Assay: iis19R02 == Revised ==
0
0.5
1
1.5
2
2.5
3
3.5
1842
608
1990
1714
1613
1065
1108
1089
442
1026
391
1949
1412
171
445
1066
971 0
0.2
0.4
0.6
0.8
1
1.2
-1 0 1 2 3 4
Kernel Density
3
3.5
4
4.5
5
5.5
6
6.5
7
391
1949
1026
1066
1842
445
1714
171
1089
971
1108
1412
442
1990
1065
1613
608 0
0.2
0.4
0.6
0.8
1
1.2
1.4
1.6
1.8
3 4 5 6 7
Kernel Density
11
11.5
12
12.5
13
13.5
14
14.5
1714
1949
171
1108
1089
1026
445
1066
1842
1613
971
442
1990
608
391
1065
1412 0
0.2
0.4
0.6
0.8
1
1.2
1.4
1.6
1.8
11.5 12 12.5 13 13.5 14
Kernel Density
3
3.5
4
4.5
5
5.5
6
6.5
7
1949
445
1613
1990
1065
391
608
1066
1026
971
171
1842
1089
1108
1412
1714
442 0
0.2
0.4
0.6
0.8
1
1.2
3 4 5 6 7
Kernel Density
3
3.5
4
4.5
5
5.5
6
6.5
7
7.5
1990
1108
442
171
445
1026
1089
971
1842
1066
1714
391
608
1065
1949
1613
1412 0
0.5
1
1.5
2
2.5
3
2.5 3.5 4.5 5.5 6.5
Kernel Density
6
7
8
9
10
11
12
1065
1412
1613
1990
1066
1842
608
391
445
1026
1949
442
1714
171
1089
971
1108 0
0.1
0.2
0.3
0.4
0.5
0.6
0.7
0.8
0.9
1
5 7 9 11 13
Kernel Density
7
7.5
8
8.5
9
9.5
10
10.5
11
11.5
12
1108
608
1990
1412
445
1066
1026
1842
171
442
1089
971
1714
391
1065
1949
1613 0
0.1
0.2
0.3
0.4
0.5
0.6
0.7
0.8
5 7 9 11 13
Kernel Density
Gas LPG <30°C
L. Naphtha 30-90°C
H. Naphtha 90-180°C
Kerosine 180-215°C
LGO 215-250°C
MGO 250-310°C
HGO 310-370°C
Spijkenisse, May 2020 Institute for Interlaboratory Studies
Crude Oil Assay: iis19R02 == Revised == page 25 of 49
Determination of true boiling point curve D5236 (continued); individual fractions in %M/M
lab
VGO 370-420°C
VGO 420-470°C
VGO 470-520°C
Residue 520+ °C
remarks
171 ----- ----- ----- ----- 339 ----- ----- ----- ----- 391 3.7434 7.4386 6.0408 30.8628 442 ----- ----- ----- ----- 445 6.9919 6.6000 6.9273 31.0727 608 7.6328 8.4958 7.5259 28.1103 862 ----- ----- ----- ----- 971 3.6695 6.6239 6.7266 32.6806
1011 ----- ----- ----- ----- 1026 2.0536 10.2993 5.5964 32.1583 1065 4.5794 9.2791 6.1954 31.1015 1066 8.1134 7.0383 6.4980 29.3345 1067 ----- ----- ----- ----- 1089 ----- ----- ----- ----- 1108 ----- ----- ----- ----- 1412 ----- ----- ----- ----- 1455 ----- ----- ----- ----- 1613 2.8914 6.1263 7.9529 31.9991 1714 5.0006 7.8862 6.8464 29.7036 1720 ----- ----- ----- ----- 1842 5.0150 8.7666 6.8869 30.3632 1949 5.4932 7.9916 7.1604 30.4559 1990 4.6946 9.3885 7.8244 30.2525 6156 ----- ----- ----- -----
normality OK OK OK OK n 12 12 12 12 outliers 0 0 0 0 mean (n) 4.9899 7.9945 6.8485 30.6746 st.dev. (n) 1.84838 1.28988 0.70839 1.27897 R(calc.) 5.1755 3.6117 1.9835 3.5811 st.dev.(D2892:19) (0.71429) (0.71429) (0.71429) n.a. R(D2892:19) (2) (2) (2) n.a.
Corresponding z-scores for above mass fractions:
lab VGO
370-420°C VGO
420-470°C VGO
470-520°C Residue 520+ °C
171 ----- ----- ----- ----- 339 ----- ----- ----- ----- 391 ----- ----- ----- ----- 442 ----- ----- ----- ----- 445 ----- ----- ----- ----- 608 ----- ----- ----- ----- 862 ----- ----- ----- ----- 971 ----- ----- ----- -----
1011 ----- ----- ----- ----- 1026 ----- ----- ----- ----- 1065 ----- ----- ----- ----- 1066 ----- ----- ----- ----- 1067 ----- ----- ----- ----- 1089 ----- ----- ----- ----- 1108 ----- ----- ----- ----- 1412 ----- ----- ----- ----- 1455 ----- ----- ----- ----- 1613 ----- ----- ----- ----- 1714 ----- ----- ----- ----- 1720 ----- ----- ----- ----- 1842 ----- ----- ----- ----- 1949 ----- ----- ----- ----- 1990 ----- ----- ----- ----- 6156 ----- ----- ----- -----
Institute for Interlaboratory Studies Spijkenisse, May 2020
page 26 of 49 Crude Oil Assay: iis19R02 == Revised ==
0
1
2
3
4
5
6
7
8
9
1026
1613
971
391
1065
1990
1714
1842
1949
445
608
1066
0
0.05
0.1
0.15
0.2
0.25
-5 0 5 10 15
Kernel Density
4
5
6
7
8
9
10
11
1613
445
971
1066
391
1714
1949
608
1842
1065
1990
1026
0
0.05
0.1
0.15
0.2
0.25
0.3
0.35
0 5 10 15
Kernel Density
5
5.5
6
6.5
7
7.5
8
8.5
1026
391
1065
1066
971
1714
1842
445
1949
608
1990
1613
0
0.1
0.2
0.3
0.4
0.5
0.6
3 5 7 9 11
Kernel Density
27
28
29
30
31
32
33
608
1066
1714
1990
1842
1949
391
445
1065
1613
1026
971
0
0.05
0.1
0.15
0.2
0.25
0.3
0.35
20 25 30 35 40
Kernel Density
VGO 370-420°C
VGO 420-470°C
VGO 470-520°C
Residue 520+ °C
Spijkenisse, May 2020 Institute for Interlaboratory Studies
Crude Oil Assay: iis19R02 == Revised == page 27 of 49
APPENDIX 1C – ANALYSIS OF DISTILLATION FRACTIONS Determination of Density at 15°C on distillation fractions; results in kg/L
lab
method Gas LPG <30°C
L.Naphtha 30-90°C
H.Naphtha 90-180°C
Kerosene 180-215°C
LGO 215-250°C
MGO 250-310°C
HGO 310-370°C
Residue >370°C
171 D4052 ----- 0.6681 0.7477 0.7912 0.8073 0.8409 0.8736 0.9828
339 ----- ----- ----- ----- ----- ----- ----- -----
391 D4052 0.5759 0.6718 0.7486 0.7920 0.8101 0.8411 0.8746 0.9876
442 IP365 ----- 0.6642 0.7481 0.7916 0.8100 0.8412 0.8760 0.9828
445 D4052 0.5659 0.6694 0.7483 0.7925 0.8067 0.8382 0.8715 0.9809
608 D4052 0.5440 0.6604 0.7491 0.7928 0.8093 0.8404 0.8776 0.9813
862 ----- ----- ----- ----- ----- ----- ----- -----
971 D4052 0.5912 0.6729 0.7497 0.7909 0.8093 0.8404 0.8756 0.9831
1011 ----- ----- ----- ----- ----- ----- ----- -----
1026 D4052 0.5669 0.6655 0.7473 0.7907 0.8070 0.8416 0.8738 0.9836
1065 D4052 ----- 0.6661 0.7481 0.7918 0.8082 0.8421 0.8711 0.9874
1066 D4052 0.5834 0.6717 0.7494 0.7918 0.8091 0.8426 0.8737 0.9832
1067 ----- ----- ----- ----- ----- ----- ----- -----
1089 D4052 0.5694 0.6632 0.7465 0.7908 0.8083 0.8420 0.8762 0.9838
1108 D4052 0.5806 0.6751 0.7486 0.7926 0.8103 0.8379 0.8730 0.9830
1412 D4052 ----- 0.6678 0.7520 0.7932 0.8125 0.8439 0.8759 0.9853
1455 ----- ----- ----- ----- ----- ----- ----- -----
1613 D4052 ----- 0.6723 0.7524 0.7920 0.8088 0.839 0.8774 0.9853
1714 D4052 ----- 0.6724 C 0.7484 C 0.7913 C 0.8108 C 0.8431 C 0.8782 C -----
1720 ----- ----- ----- ----- ----- ----- ----- -----
1842 D4052 N/A 0.6657 0.7470 0.7913 0.8073 0.8412 0.8730 0.9833
1949 D4052 ----- 0.6655 0.7447 0.7866 0.8036 0.8375 0.8715 0.9815
1990 D4052 0.5702 0.6627 0.7476 0.7918 0.8080 0.8415 0.8732 1.0287
6156 ----- ----- ----- ----- ----- ----- ----- -----
normality suspect OK suspect OK suspect OK OK OK
n 9 17 17 16 17 17 17 15
outliers 0 0 0 1 0 0 0 1
mean (n) 0.5719 0.6679 0.7484 0.7918 0.8086 0.8409 0.8745 0.9837
st.dev. (n) 0.01344 0.00424 0.00184 0.00073 0.00199 0.00181 0.00220 0.00199
R(calc.) 0.0376 0.0119 0.0051 0.0021 0.0056 0.0051 0.0062 0.0056
RSD 2.3% 0.6% 0.3% 0.1% 0.2% 0.2% 0.3% 0.2% NB. Bold and underlined figures are statistical outliers Lab 1714 first reported: 672.4, 748.4, 791.3, 810.8, 843.1 and 878.2 kg/L respectively
0
50
100
150
200
250
300
0.74 0.745 0.75 0.755 0.76
Kernel Density
Density Cut 90-180°C
0
50
100
150
200
250
0.83 0.835 0.84 0.845 0.85
Kernel Density
Density Cut 250-310°C
Institute for Interlaboratory Studies Spijkenisse, May 2020
page 28 of 49 Crude Oil Assay: iis19R02 == Revised ==
Determination of Density at 15°C on distillation fractions (continued); results in kg/L
lab
Method VGO 370-420°C
VGO 420-470°C
VGO 470-520°C
Residue >520°C
remarks
171 ----- ----- ----- ----- Residue >370°C: D5002
339 ----- ----- ----- -----
391 D4052 0.8979 0.9169 0.9397 1.0297 LPG: ISO8973/D4052
442 ----- ----- ----- -----
445 D4052 0.9113 0.9408 ex 0.9236 ex 1.0208 LPG: GC, Residue >370°C and >520°C: D70
608 D4052 0.9011 0.9252 0.9502 1.0323 LPG: D2163, Residue >520°C: D70
862 ----- ----- ----- -----
971 D4052 0.9006 0.9115 0.9331 1.0267
1011 ----- ----- ----- -----
1026 D4052 0.8990 0.9142 0.9382 1.0261 LPG: ISO8973
1065 D4052 0.9017 0.9196 0.9438 1.0301
1066 IP189/190 0.9052 0.9260 0.9457 1.0293 LPG: calc., VGO 370-520°C IP189/190, Residue >520°C D70
1067 ----- ----- ----- -----
1089 ----- ----- ----- ----- LPG: manual method
1108 ----- ----- ----- ----- LPG: D2598
1412 ----- ----- ----- -----
1455 ----- ----- ----- -----
1613 D4052 0.9045 0.9198 0.9401 1.0307
1714 D4052 0.9043 C 0.9228 C 0.9462 C 1.0276 C
1720 ----- ----- ----- -----
1842 D4052 0.9025 0.9199 0.9438 1.0312
1949 D4052 0.9020 0.9165 0.9387 1.0297
1990 D4052 0.9029 0.9171 0.9428 1.0294 LPG: D2598, Residue >520°C: D70
6156 ----- ----- ----- -----
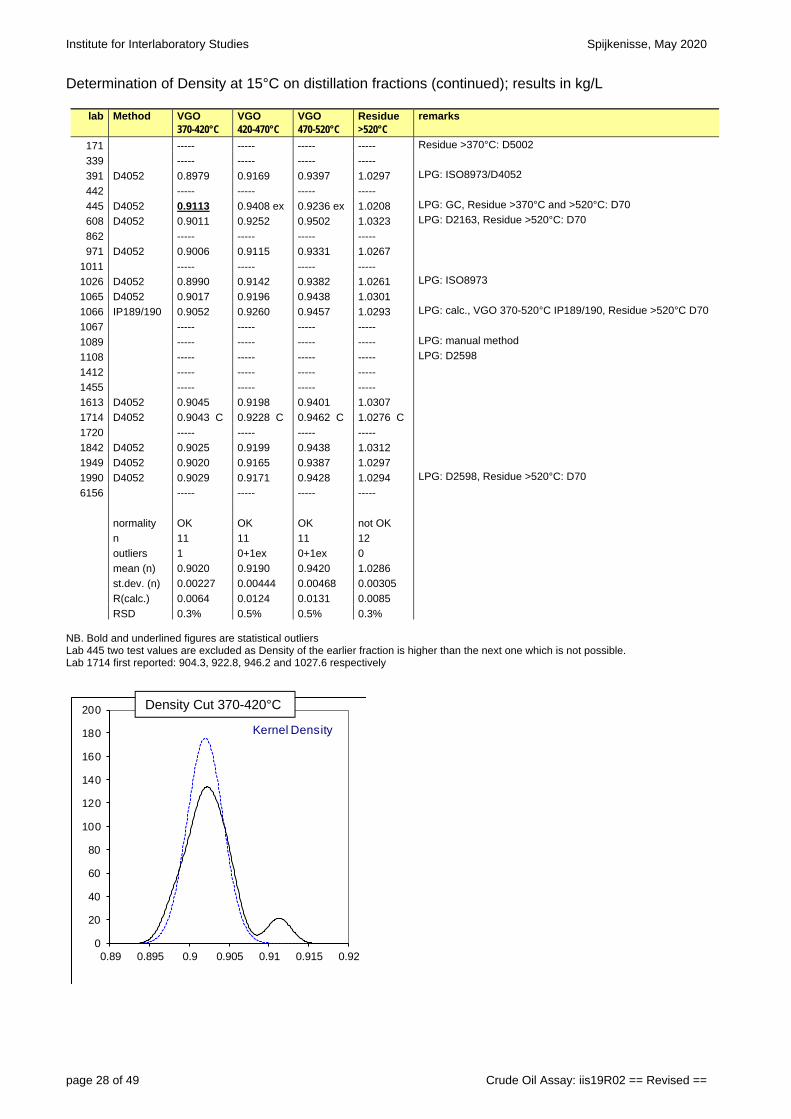
normality OK OK OK not OK
n 11 11 11 12
outliers 1 0+1ex 0+1ex 0
mean (n) 0.9020 0.9190 0.9420 1.0286
st.dev. (n) 0.00227 0.00444 0.00468 0.00305
R(calc.) 0.0064 0.0124 0.0131 0.0085
RSD 0.3% 0.5% 0.5% 0.3% NB. Bold and underlined figures are statistical outliers Lab 445 two test values are excluded as Density of the earlier fraction is higher than the next one which is not possible. Lab 1714 first reported: 904.3, 922.8, 946.2 and 1027.6 respectively
0
20
40
60
80
100
120
140
160
180
200
0.89 0.895 0.9 0.905 0.91 0.915 0.92
Kernel Density
Density Cut 370-420°C
Spijkenisse, May 2020 Institute for Interlaboratory Studies
Crude Oil Assay: iis19R02 == Revised == page 29 of 49
Determination of Sulfur on distillation fractions; results in %M/M
lab
Method Gas LPG <30°C
L. Naphtha 30-90°C
H. Naphtha 90-180°C
Kerosene 180-215°C
LGO 215-250°C
MGO 250-310°C
HGO 310-370°C
Residue >370°C
171 D4294 ----- 0.0052 0.0400 0.142 0.330 1.23 2.19 4.53
339 ----- ----- ----- ----- ----- ----- ----- -----
391 D4294 ----- 0.011 0.035 0.151 0.364 1.30 2.23 4.39
442 ----- ----- ----- ----- ----- ----- ----- -----
445 D4294 0.0040 0.0081 0.038 0.145 0.328 1.19 2.11 4.40
608 D4294 ----- 0.0097 0.0340 0.1353 0.3795 1.1835 1.9309 4.4301
862 ----- ----- ----- ----- ----- ----- ----- -----
971 D4294 ----- 0.0084 0.0470 0.143 0.368 1.299 2.213 4.435
1011 ----- ----- ----- ----- ----- ----- ----- -----
1026 D2622 0.0000834 0.00928 0.043 0.146 0.334 1.266 2.202 4.427
1065 D4294 ----- 0.0087 0.043 0.15 0.37 1.25 2.09 4.33
1066 D2622 0.0001 0.0068 0.0384 0.148 0.371 1.26 2.13 4.29
1067 ----- ----- ----- ----- ----- ----- ----- -----
1089 ----- ----- ----- ----- ----- ----- ----- -----
1108 D4294 ----- 0.0168 0.0452 0.162 0.395 1.16 2.12 4.03
1412 ----- ----- ----- ----- ----- ----- ----- -----
1455 ----- ----- ----- ----- ----- ----- ----- -----
1613 D4294 ----- 0.0096 0.0442 0.1469 0.3610 1.230 2.200 4.335
1714 D2622 0.000110 0.00610 0.0382 0.148 0.404 1.28 2.26 -----
1720 ----- ----- ----- ----- ----- ----- ----- -----
1842 INH-05 ----- 0.009 0.049 0.143 0.334 1.22 2.10 4.30
1949 D4294 ----- 0.00732 0.03719 0.1339 0.3222 1.244 2.080 4.313
1990 D2622 ----- 0.0069 0.0341 0.1447 0.3494 1.2553 2.1512 4.3415
6156 ----- ----- ----- ----- ----- ----- ----- -----
normality unknown OK OK OK OK OK OK OK
n 4 13 14 13 14 14 13 12
outliers 0 1 0 1 0 0 1 1
mean (n) (0.0011) 0.0082 0.0404 0.1444 0.3579 1.2406 2.1597 4.3768
st.dev. (n) n.a. 0.00163 0.00483 0.00511 0.02572 0.04187 0.05913 0.07111
R(calc.) n.a. 0.0046 0.0135 0.0143 0.0720 0.1172 0.1656 0.1991
st.dev.(D4294:16e1) n.a. (0.00117) (0.00377) (0.00745) (0.01318) (0.02892) (0.04263) (0.06721)
R(D4294:16e1) n.a. (0.0033) (0.0105) (0.0209) (0.0369) (0.0810) (0.1194) (0.1882)
RSD n.a. 20.0% 11.9% 3.5% 7.2% 3.4% 2.7% 1.6% NB. Bold and underlined figures are statistical outliers
0
2
4
6
8
10
12
1 1.1 1.2 1.3 1.4
Kernel Density
Sulfur Cut 250-310°C
0
50
100
150
200
250
300
0 0.005 0.01 0.015 0.02 0.025
Kernel Density
Sulfur Cut 30-90°C
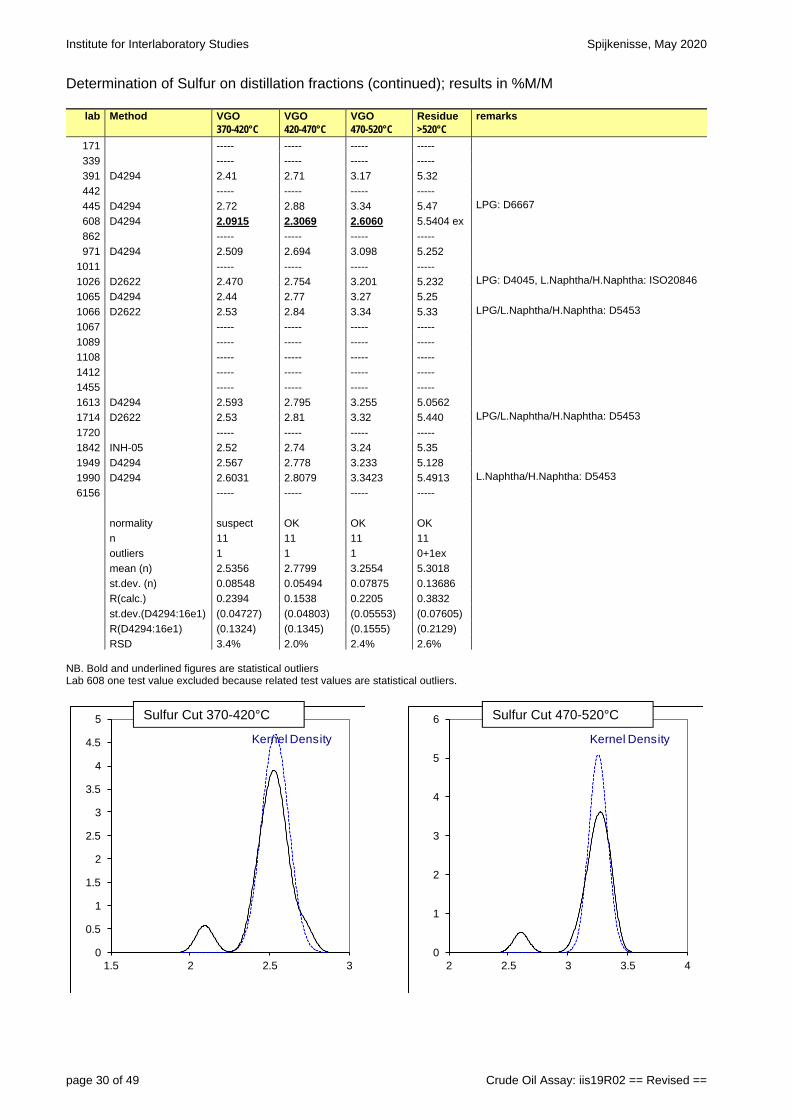
Institute for Interlaboratory Studies Spijkenisse, May 2020
page 30 of 49 Crude Oil Assay: iis19R02 == Revised ==
Determination of Sulfur on distillation fractions (continued); results in %M/M
lab
Method VGO 370-420°C
VGO 420-470°C
VGO 470-520°C
Residue >520°C
remarks
171 ----- ----- ----- -----
339 ----- ----- ----- -----
391 D4294 2.41 2.71 3.17 5.32
442 ----- ----- ----- -----
445 D4294 2.72 2.88 3.34 5.47 LPG: D6667
608 D4294 2.0915 2.3069 2.6060 5.5404 ex
862 ----- ----- ----- -----
971 D4294 2.509 2.694 3.098 5.252
1011 ----- ----- ----- -----
1026 D2622 2.470 2.754 3.201 5.232 LPG: D4045, L.Naphtha/H.Naphtha: ISO20846
1065 D4294 2.44 2.77 3.27 5.25
1066 D2622 2.53 2.84 3.34 5.33 LPG/L.Naphtha/H.Naphtha: D5453
1067 ----- ----- ----- -----
1089 ----- ----- ----- -----
1108 ----- ----- ----- -----
1412 ----- ----- ----- -----
1455 ----- ----- ----- -----
1613 D4294 2.593 2.795 3.255 5.0562
1714 D2622 2.53 2.81 3.32 5.440 LPG/L.Naphtha/H.Naphtha: D5453
1720 ----- ----- ----- -----
1842 INH-05 2.52 2.74 3.24 5.35
1949 D4294 2.567 2.778 3.233 5.128
1990 D4294 2.6031 2.8079 3.3423 5.4913 L.Naphtha/H.Naphtha: D5453
6156 ----- ----- ----- -----
normality suspect OK OK OK
n 11 11 11 11
outliers 1 1 1 0+1ex
mean (n) 2.5356 2.7799 3.2554 5.3018
st.dev. (n) 0.08548 0.05494 0.07875 0.13686
R(calc.) 0.2394 0.1538 0.2205 0.3832
st.dev.(D4294:16e1) (0.04727) (0.04803) (0.05553) (0.07605)
R(D4294:16e1) (0.1324) (0.1345) (0.1555) (0.2129)
RSD 3.4% 2.0% 2.4% 2.6% NB. Bold and underlined figures are statistical outliers Lab 608 one test value excluded because related test values are statistical outliers.
0
0.5
1
1.5
2
2.5
3
3.5
4
4.5
5
1.5 2 2.5 3
Kernel Density
Sulfur Cut 370-420°C
0
1
2
3
4
5
6
2 2.5 3 3.5 4
Kernel Density
Sulfur Cut 470-520°C
Spijkenisse, May 2020 Institute for Interlaboratory Studies
Crude Oil Assay: iis19R02 == Revised == page 31 of 49
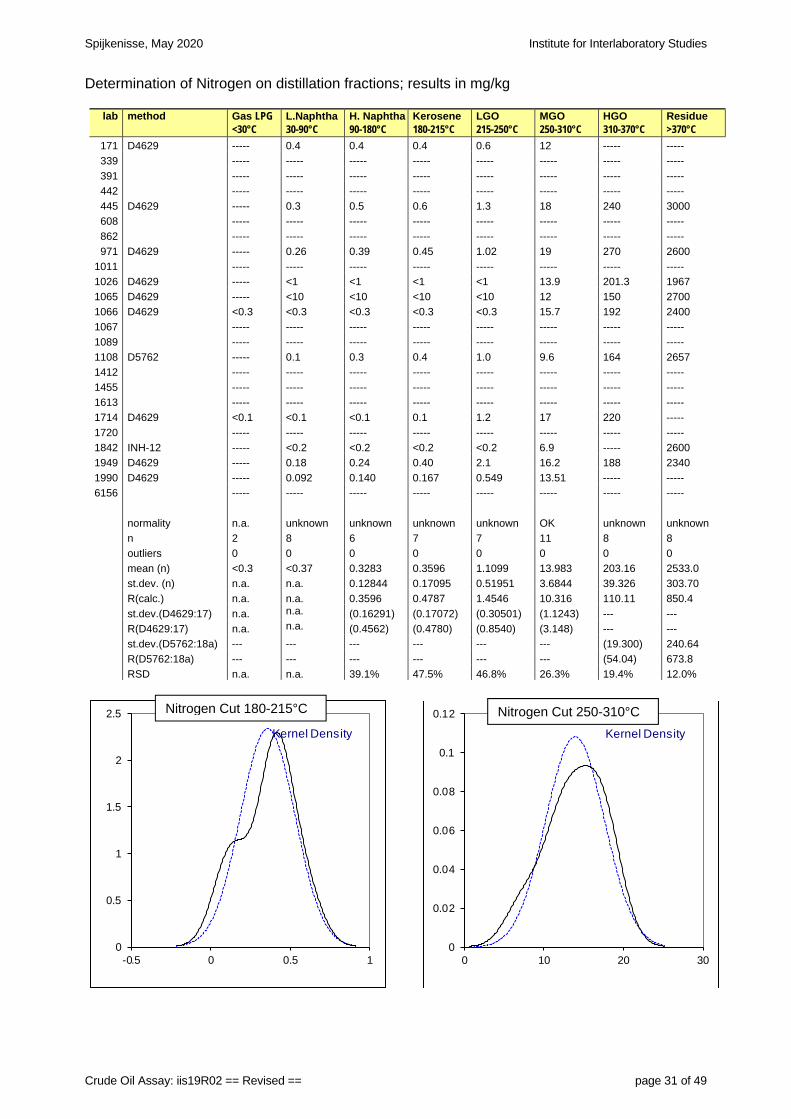
Determination of Nitrogen on distillation fractions; results in mg/kg
lab
method Gas LPG <30°C
L.Naphtha 30-90°C
H. Naphtha 90-180°C
Kerosene 180-215°C
LGO 215-250°C
MGO 250-310°C
HGO 310-370°C
Residue >370°C
171 D4629 ----- 0.4 0.4 0.4 0.6 12 ----- -----
339 ----- ----- ----- ----- ----- ----- ----- -----
391 ----- ----- ----- ----- ----- ----- ----- -----
442 ----- ----- ----- ----- ----- ----- ----- -----
445 D4629 ----- 0.3 0.5 0.6 1.3 18 240 3000
608 ----- ----- ----- ----- ----- ----- ----- -----
862 ----- ----- ----- ----- ----- ----- ----- -----
971 D4629 ----- 0.26 0.39 0.45 1.02 19 270 2600
1011 ----- ----- ----- ----- ----- ----- ----- -----
1026 D4629 ----- <1 <1 <1 <1 13.9 201.3 1967
1065 D4629 ----- <10 <10 <10 <10 12 150 2700
1066 D4629 <0.3 <0.3 <0.3 <0.3 <0.3 15.7 192 2400
1067 ----- ----- ----- ----- ----- ----- ----- -----
1089 ----- ----- ----- ----- ----- ----- ----- -----
1108 D5762 ----- 0.1 0.3 0.4 1.0 9.6 164 2657
1412 ----- ----- ----- ----- ----- ----- ----- -----
1455 ----- ----- ----- ----- ----- ----- ----- -----
1613 ----- ----- ----- ----- ----- ----- ----- -----
1714 D4629 <0.1 <0.1 <0.1 0.1 1.2 17 220 -----
1720 ----- ----- ----- ----- ----- ----- ----- -----
1842 INH-12 ----- <0.2 <0.2 <0.2 <0.2 6.9 ----- 2600
1949 D4629 ----- 0.18 0.24 0.40 2.1 16.2 188 2340
1990 D4629 ----- 0.092 0.140 0.167 0.549 13.51 ----- -----
6156 ----- ----- ----- ----- ----- ----- ----- -----
normality n.a. unknown unknown unknown unknown OK unknown unknown
n 2 8 6 7 7 11 8 8
outliers 0 0 0 0 0 0 0 0
mean (n) <0.3 <0.37 0.3283 0.3596 1.1099 13.983 203.16 2533.0
st.dev. (n) n.a. n.a. 0.12844 0.17095 0.51951 3.6844 39.326 303.70
R(calc.) n.a. n.a. 0.3596 0.4787 1.4546 10.316 110.11 850.4
st.dev.(D4629:17) n.a. n.a. (0.16291) (0.17072) (0.30501) (1.1243) --- ---
R(D4629:17) n.a. n.a. (0.4562) (0.4780) (0.8540) (3.148) --- ---
st.dev.(D5762:18a) --- --- --- --- --- --- (19.300) 240.64
R(D5762:18a) --- --- --- --- --- --- (54.04) 673.8
RSD n.a. n.a. 39.1% 47.5% 46.8% 26.3% 19.4% 12.0%
0
0.5
1
1.5
2
2.5
-0.5 0 0.5 1
Kernel Density
Nitrogen Cut 180-215°C
0
0.02
0.04
0.06
0.08
0.1
0.12
0 10 20 30
Kernel Density
Nitrogen Cut 250-310°C
Institute for Interlaboratory Studies Spijkenisse, May 2020
page 32 of 49 Crude Oil Assay: iis19R02 == Revised ==
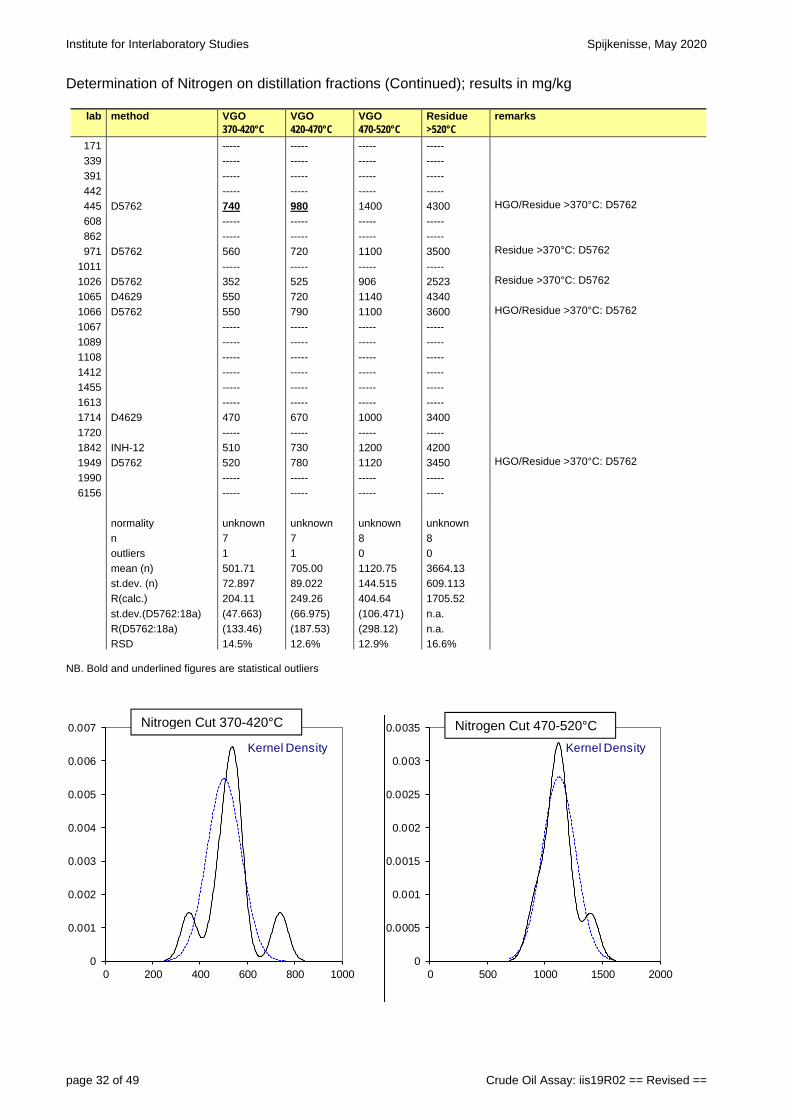
Determination of Nitrogen on distillation fractions (Continued); results in mg/kg
lab method VGO 370-420°C
VGO 420-470°C
VGO 470-520°C
Residue >520°C
remarks
171 ----- ----- ----- -----
339 ----- ----- ----- -----
391 ----- ----- ----- -----
442 ----- ----- ----- -----
445 D5762 740 980 1400 4300 HGO/Residue >370°C: D5762
608 ----- ----- ----- -----
862 ----- ----- ----- -----
971 D5762 560 720 1100 3500 Residue >370°C: D5762
1011 ----- ----- ----- -----
1026 D5762 352 525 906 2523 Residue >370°C: D5762
1065 D4629 550 720 1140 4340
1066 D5762 550 790 1100 3600 HGO/Residue >370°C: D5762
1067 ----- ----- ----- -----
1089 ----- ----- ----- -----
1108 ----- ----- ----- -----
1412 ----- ----- ----- -----
1455 ----- ----- ----- -----
1613 ----- ----- ----- -----
1714 D4629 470 670 1000 3400
1720 ----- ----- ----- -----
1842 INH-12 510 730 1200 4200
1949 D5762 520 780 1120 3450 HGO/Residue >370°C: D5762
1990 ----- ----- ----- -----
6156 ----- ----- ----- -----
normality unknown unknown unknown unknown
n 7 7 8 8
outliers 1 1 0 0
mean (n) 501.71 705.00 1120.75 3664.13
st.dev. (n) 72.897 89.022 144.515 609.113
R(calc.) 204.11 249.26 404.64 1705.52
st.dev.(D5762:18a) (47.663) (66.975) (106.471) n.a.
R(D5762:18a) (133.46) (187.53) (298.12) n.a.
RSD 14.5% 12.6% 12.9% 16.6% NB. Bold and underlined figures are statistical outliers
0
0.001
0.002
0.003
0.004
0.005
0.006
0.007
0 200 400 600 800 1000
Kernel Density
Nitrogen Cut 370-420°C
0
0.0005
0.001
0.0015
0.002
0.0025
0.003
0.0035
0 500 1000 1500 2000
Kernel Density
Nitrogen Cut 470-520°C
Spijkenisse, May 2020 Institute for Interlaboratory Studies
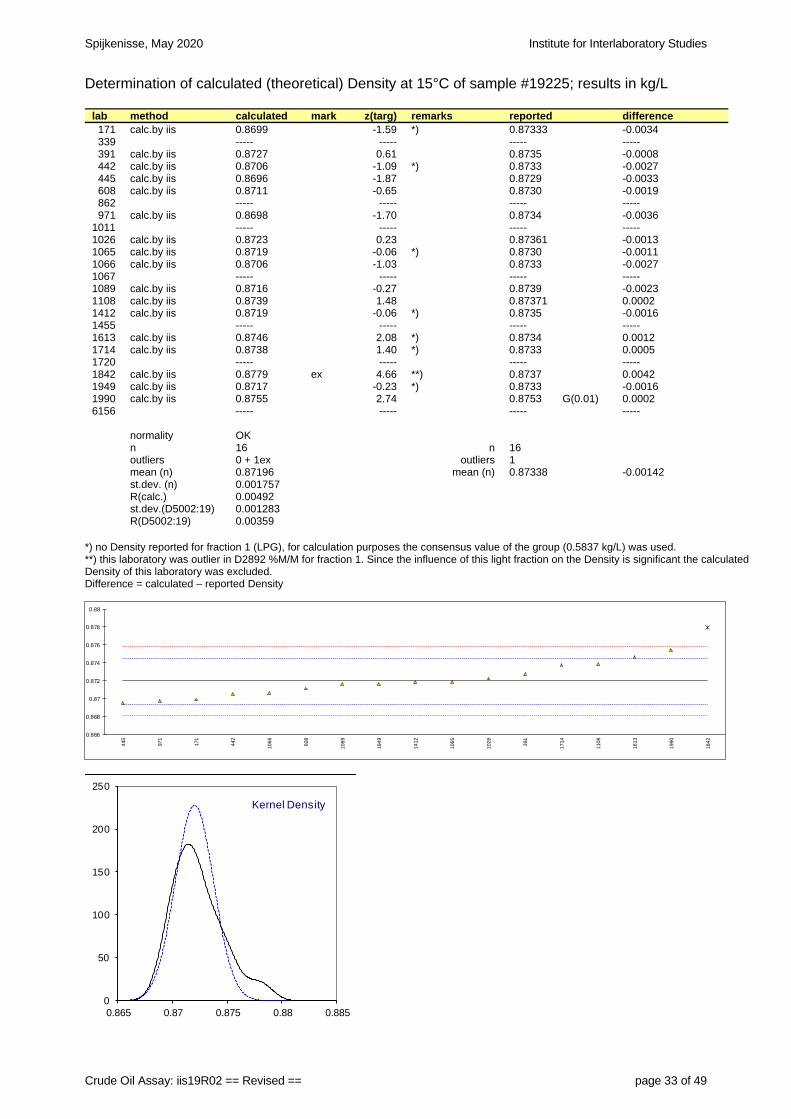
Crude Oil Assay: iis19R02 == Revised == page 33 of 49
Determination of calculated (theoretical) Density at 15°C of sample #19225; results in kg/L
lab method calculated mark z(targ) remarks reported difference 171 calc.by iis 0.8699 -1.59 *) 0.87333 -0.0034 339 ----- ----- ----- ----- 391 calc.by iis 0.8727 0.61 0.8735 -0.0008 442 calc.by iis 0.8706 -1.09 *) 0.8733 -0.0027 445 calc.by iis 0.8696 -1.87 0.8729 -0.0033 608 calc.by iis 0.8711 -0.65 0.8730 -0.0019 862 ----- ----- ----- ----- 971 calc.by iis 0.8698 -1.70 0.8734 -0.0036
1011 ----- ----- ----- ----- 1026 calc.by iis 0.8723 0.23 0.87361 -0.0013 1065 calc.by iis 0.8719 -0.06 *) 0.8730 -0.0011 1066 calc.by iis 0.8706 -1.03 0.8733 -0.0027 1067 ----- ----- ----- ----- 1089 calc.by iis 0.8716 -0.27 0.8739 -0.0023 1108 calc.by iis 0.8739 1.48 0.87371 0.0002 1412 calc.by iis 0.8719 -0.06 *) 0.8735 -0.0016 1455 ----- ----- ----- ----- 1613 calc.by iis 0.8746 2.08 *) 0.8734 0.0012 1714 calc.by iis 0.8738 1.40 *) 0.8733 0.0005 1720 ----- ----- ----- ----- 1842 calc.by iis 0.8779 ex 4.66 **) 0.8737 0.0042 1949 calc.by iis 0.8717 -0.23 *) 0.8733 -0.0016 1990 calc.by iis 0.8755 2.74 0.8753 G(0.01) 0.0002 6156 ----- ----- ----- -----
normality OK n 16 n 16 outliers 0 + 1ex outliers 1 mean (n) 0.87196 mean (n) 0.87338 -0.00142
st.dev. (n) 0.001757 R(calc.) 0.00492 st.dev.(D5002:19) 0.001283 R(D5002:19) 0.00359
*) no Density reported for fraction 1 (LPG), for calculation purposes the consensus value of the group (0.5837 kg/L) was used. **) this laboratory was outlier in D2892 %M/M for fraction 1. Since the influence of this light fraction on the Density is significant the calculated Density of this laboratory was excluded. Difference = calculated – reported Density
0.866
0.868
0.87
0.872
0.874
0.876
0.878
0.88
445
971
171
442
106
6
608
108
9
194
9
141
2
106
5
102
6
391
171
4
110
8
161
3
199
0
184
2
0
50
100
150
200
250
0.865 0.87 0.875 0.88 0.885
Kernel Density
Institute for Interlaboratory Studies Spijkenisse, May 2020
page 34 of 49 Crude Oil Assay: iis19R02 == Revised ==
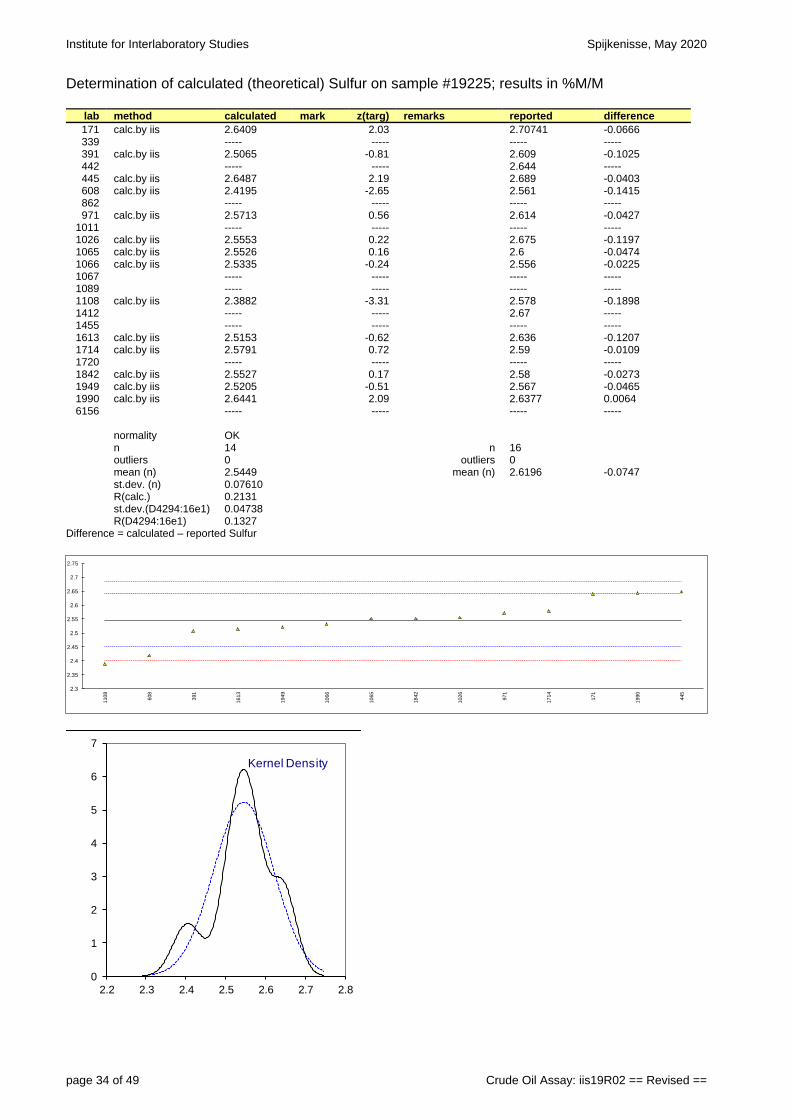
Determination of calculated (theoretical) Sulfur on sample #19225; results in %M/M
lab method calculated mark z(targ) remarks reported difference 171 calc.by iis 2.6409 2.03 2.70741 -0.0666 339 ----- ----- ----- ----- 391 calc.by iis 2.5065 -0.81 2.609 -0.1025 442 ----- ----- 2.644 ----- 445 calc.by iis 2.6487 2.19 2.689 -0.0403 608 calc.by iis 2.4195 -2.65 2.561 -0.1415 862 ----- ----- ----- ----- 971 calc.by iis 2.5713 0.56 2.614 -0.0427
1011 ----- ----- ----- ----- 1026 calc.by iis 2.5553 0.22 2.675 -0.1197 1065 calc.by iis 2.5526 0.16 2.6 -0.0474 1066 calc.by iis 2.5335 -0.24 2.556 -0.0225 1067 ----- ----- ----- ----- 1089 ----- ----- ----- ----- 1108 calc.by iis 2.3882 -3.31 2.578 -0.1898 1412 ----- ----- 2.67 ----- 1455 ----- ----- ----- ----- 1613 calc.by iis 2.5153 -0.62 2.636 -0.1207 1714 calc.by iis 2.5791 0.72 2.59 -0.0109 1720 ----- ----- ----- ----- 1842 calc.by iis 2.5527 0.17 2.58 -0.0273 1949 calc.by iis 2.5205 -0.51 2.567 -0.0465 1990 calc.by iis 2.6441 2.09 2.6377 0.0064 6156 ----- ----- ----- -----
normality OK n 14 n 16 outliers 0 outliers 0 mean (n) 2.5449 mean (n) 2.6196 -0.0747 st.dev. (n) 0.07610 R(calc.) 0.2131 st.dev.(D4294:16e1) 0.04738 R(D4294:16e1) 0.1327
Difference = calculated – reported Sulfur
2.3
2.35
2.4
2.45
2.5
2.55
2.6
2.65
2.7
2.75
110
8
608
391
161
3
194
9
106
6
106
5
184
2
102
6
971
171
4
171
199
0
445
0
1
2
3
4
5
6
7
2.2 2.3 2.4 2.5 2.6 2.7 2.8
Kernel Density
Spijkenisse, May 2020 Institute for Interlaboratory Studies
Crude Oil Assay: iis19R02 == Revised == page 35 of 49
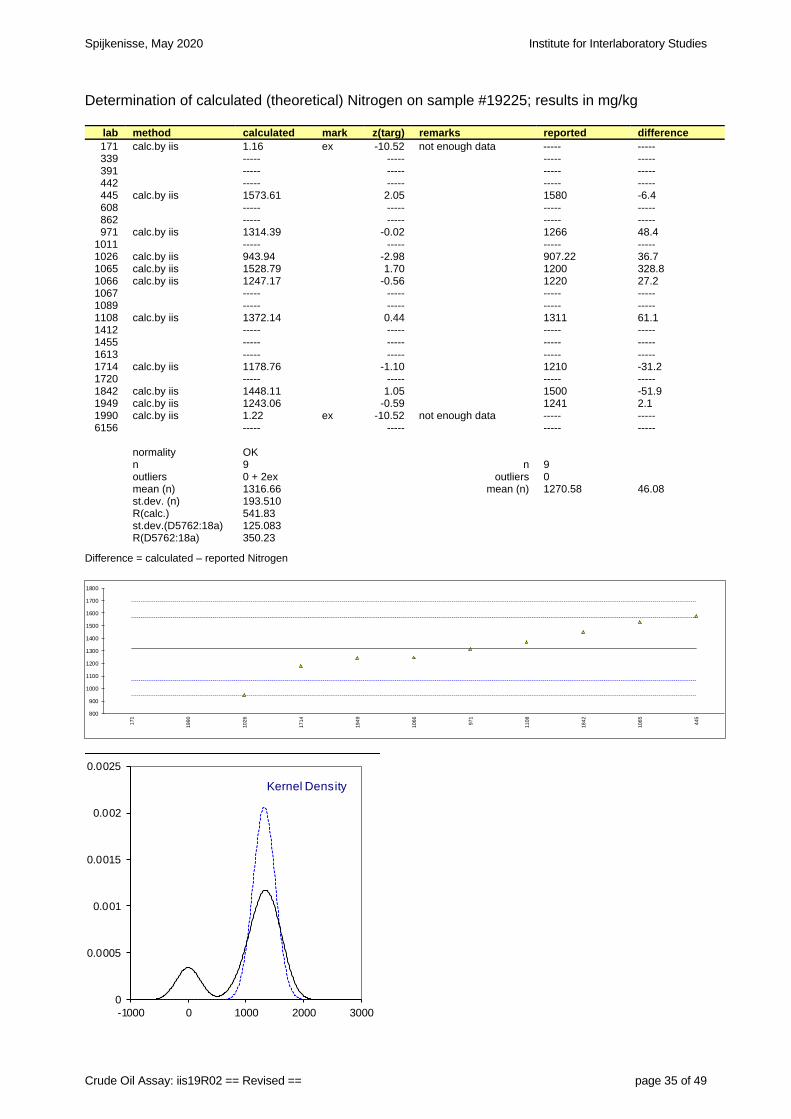
Determination of calculated (theoretical) Nitrogen on sample #19225; results in mg/kg
lab method calculated mark z(targ) remarks reported difference 171 calc.by iis 1.16 ex -10.52 not enough data ----- ----- 339 ----- ----- ----- ----- 391 ----- ----- ----- ----- 442 ----- ----- ----- ----- 445 calc.by iis 1573.61 2.05 1580 -6.4 608 ----- ----- ----- ----- 862 ----- ----- ----- ----- 971 calc.by iis 1314.39 -0.02 1266 48.4
1011 ----- ----- ----- ----- 1026 calc.by iis 943.94 -2.98 907.22 36.7 1065 calc.by iis 1528.79 1.70 1200 328.8 1066 calc.by iis 1247.17 -0.56 1220 27.2 1067 ----- ----- ----- ----- 1089 ----- ----- ----- ----- 1108 calc.by iis 1372.14 0.44 1311 61.1 1412 ----- ----- ----- ----- 1455 ----- ----- ----- ----- 1613 ----- ----- ----- ----- 1714 calc.by iis 1178.76 -1.10 1210 -31.2 1720 ----- ----- ----- ----- 1842 calc.by iis 1448.11 1.05 1500 -51.9 1949 calc.by iis 1243.06 -0.59 1241 2.1 1990 calc.by iis 1.22 ex -10.52 not enough data ----- ----- 6156 ----- ----- ----- -----
normality OK n 9 n 9 outliers 0 + 2ex outliers 0 mean (n) 1316.66 mean (n) 1270.58 46.08 st.dev. (n) 193.510 R(calc.) 541.83 st.dev.(D5762:18a) 125.083 R(D5762:18a) 350.23
Difference = calculated – reported Nitrogen
800
900
1000
1100
1200
1300
1400
1500
1600
1700
1800
171
199
0
102
6
171
4
194
9
106
6
971
110
8
184
2
106
5
445
0
0.0005
0.001
0.0015
0.002
0.0025
-1000 0 1000 2000 3000
Kernel Density
Institute for Interlaboratory Studies Spijkenisse, May 2020
page 36 of 49 Crude Oil Assay: iis19R02 == Revised ==
Determination of P(iP)NA on distillation fraction 2 (light Naphtha, 30-90°C); results in %V/V
lab method total par. C1-C4 n-par. i-par. naphth. arom. remarks 171 D6730Mod. 89.664 0.462 51.035 38.629 9.208 1.103 339 ----- ----- ----- ----- ----- ----- 391 ----- ----- ----- ----- ----- ----- 442 ----- ----- ----- ----- ----- ----- 445 D6839 88.92 0.44 49.17 39.75 9.85 1.22 608 ----- ----- ----- ----- ----- ----- 862 ----- ----- ----- ----- ----- ----- 971 D6730 88.02 0.20 48.62 39.40 10.40 1.46
1011 ----- ----- ----- ----- ----- ----- 1026 ISO22854 90.13 0.22 49.53 40.60 8.72 1.15 1065 D5443 89.557 2.73 50.283 39.274 9.228 1.215 1066 D6839 88.32 1.40 49.14 39.18 10.31 1.37 1067 ----- ----- ----- ----- ----- ----- 1089 ----- ----- ----- ----- ----- ----- 1108 D5443 86.46 0.68 47.14 39.32 9.26 4.28 1412 ----- ----- ----- ----- ----- ----- 1455 ----- ----- ----- ----- ----- ----- 1613 D6839 88.66 1.37 ----- ----- 9.89 1.39 1714 ----- ----- ----- ----- ----- ----- 1720 ----- ----- ----- ----- ----- ----- 1842 D5443 90.09 0.32 50.28 39.81 8.87 1.07 1949 D5443 90.21 2.59 ----- ----- 8.75 1.04 1990 D6839 90.39 1.54 49.56 40.83 8.45 1.15 6156 ----- ----- ----- ----- ----- -----
normality OK OK suspect OK OK OK n 11 11 9 9 11 10
outliers 0 0 0 0 0 1 mean (n) 89.129 1.087 49.418 39.644 9.358 1.217 st.dev. (n) 1.2010 0.9189 1.1238 0.6988 0.6637 0.1443 R(calc.) 3.363 2.573 3.147 1.957 1.858 0.404
NB. Bold and underlined figures are statistical outliers
85
86
87
88
89
90
91
110
8
971
106
6
161
3
445
106
5
171
184
2
102
6
194
9
199
0
Total Paraffins
7
7.5
8
8.5
9
9.5
10
10.5
11
199
0
102
6
194
9
184
2
171
106
5
110
8
445
161
3
106
6
971
Naphthenes
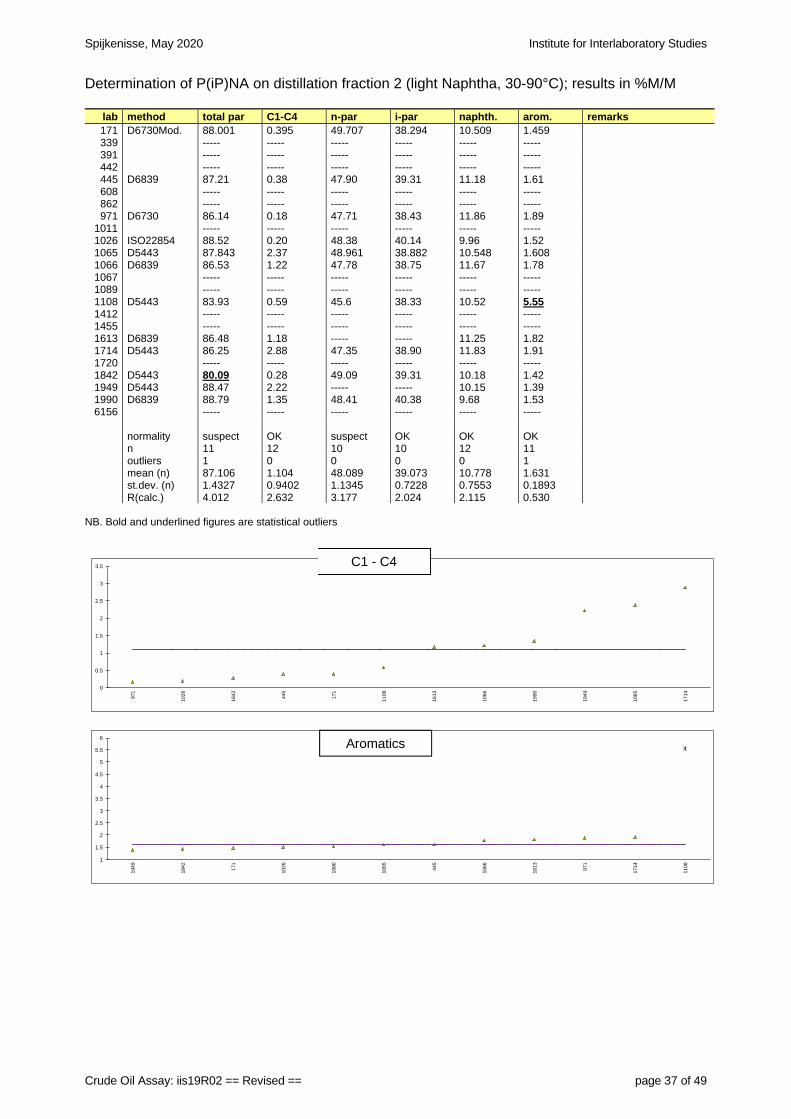
Spijkenisse, May 2020 Institute for Interlaboratory Studies
Crude Oil Assay: iis19R02 == Revised == page 37 of 49
Determination of P(iP)NA on distillation fraction 2 (light Naphtha, 30-90°C); results in %M/M
lab method total par C1-C4 n-par i-par naphth. arom. remarks 171 D6730Mod. 88.001 0.395 49.707 38.294 10.509 1.459 339 ----- ----- ----- ----- ----- ----- 391 ----- ----- ----- ----- ----- ----- 442 ----- ----- ----- ----- ----- ----- 445 D6839 87.21 0.38 47.90 39.31 11.18 1.61 608 ----- ----- ----- ----- ----- ----- 862 ----- ----- ----- ----- ----- ----- 971 D6730 86.14 0.18 47.71 38.43 11.86 1.89
1011 ----- ----- ----- ----- ----- ----- 1026 ISO22854 88.52 0.20 48.38 40.14 9.96 1.52 1065 D5443 87.843 2.37 48.961 38.882 10.548 1.608 1066 D6839 86.53 1.22 47.78 38.75 11.67 1.78 1067 ----- ----- ----- ----- ----- ----- 1089 ----- ----- ----- ----- ----- ----- 1108 D5443 83.93 0.59 45.6 38.33 10.52 5.55 1412 ----- ----- ----- ----- ----- ----- 1455 ----- ----- ----- ----- ----- ----- 1613 D6839 86.48 1.18 ----- ----- 11.25 1.82 1714 D5443 86.25 2.88 47.35 38.90 11.83 1.91 1720 ----- ----- ----- ----- ----- ----- 1842 D5443 80.09 0.28 49.09 39.31 10.18 1.42 1949 D5443 88.47 2.22 ----- ----- 10.15 1.39 1990 D6839 88.79 1.35 48.41 40.38 9.68 1.53 6156 ----- ----- ----- ----- ----- -----
normality suspect OK suspect OK OK OK n 11 12 10 10 12 11
outliers 1 0 0 0 0 1 mean (n) 87.106 1.104 48.089 39.073 10.778 1.631 st.dev. (n) 1.4327 0.9402 1.1345 0.7228 0.7553 0.1893 R(calc.) 4.012 2.632 3.177 2.024 2.115 0.530
NB. Bold and underlined figures are statistical outliers
0
0.5
1
1.5
2
2.5
3
3.5
971
102
6
184
2
445
171
110
8
161
3
106
6
199
0
194
9
106
5
171
4
C1 - C4
1
1.5
2
2.5
3
3.5
4
4.5
5
5.5
6
194
9
184
2
171
102
6
199
0
106
5
445
106
6
161
3
971
171
4
110
8
Aromatics
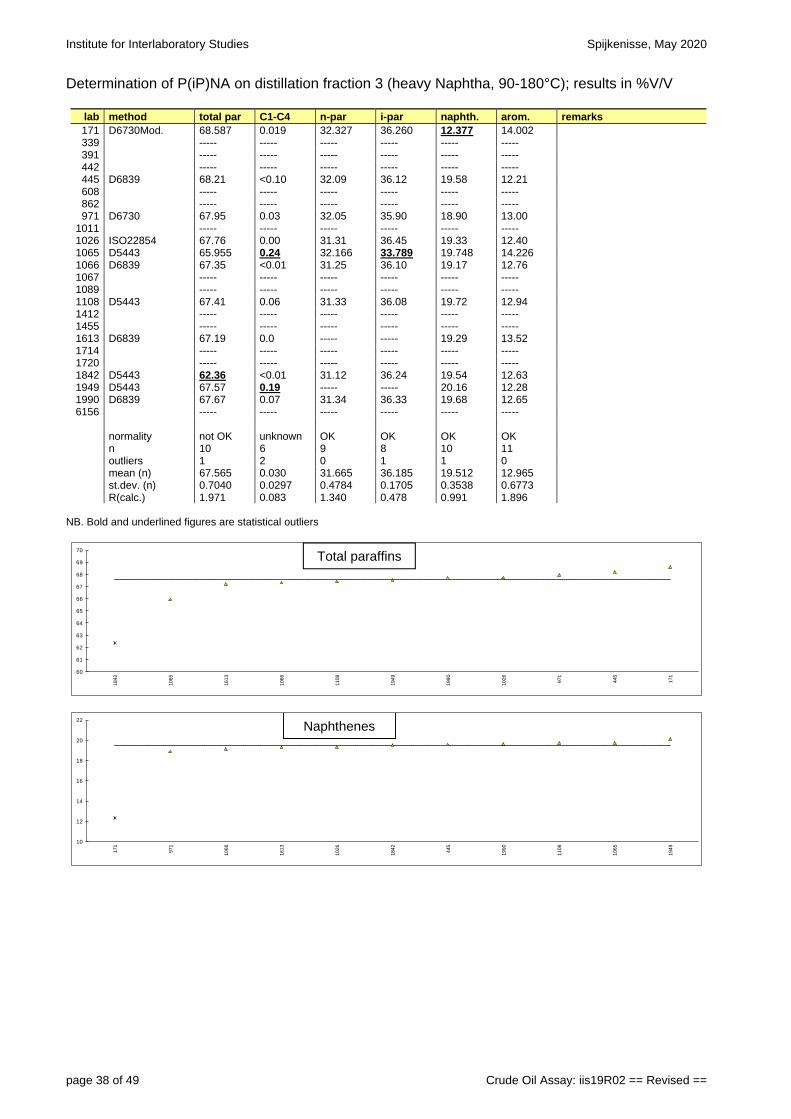
Institute for Interlaboratory Studies Spijkenisse, May 2020
page 38 of 49 Crude Oil Assay: iis19R02 == Revised ==
Determination of P(iP)NA on distillation fraction 3 (heavy Naphtha, 90-180°C); results in %V/V
lab method total par C1-C4 n-par i-par naphth. arom. remarks 171 D6730Mod. 68.587 0.019 32.327 36.260 12.377 14.002 339 ----- ----- ----- ----- ----- ----- 391 ----- ----- ----- ----- ----- ----- 442 ----- ----- ----- ----- ----- ----- 445 D6839 68.21 <0.10 32.09 36.12 19.58 12.21 608 ----- ----- ----- ----- ----- ----- 862 ----- ----- ----- ----- ----- ----- 971 D6730 67.95 0.03 32.05 35.90 18.90 13.00
1011 ----- ----- ----- ----- ----- ----- 1026 ISO22854 67.76 0.00 31.31 36.45 19.33 12.40 1065 D5443 65.955 0.24 32.166 33.789 19.748 14.226 1066 D6839 67.35 <0.01 31.25 36.10 19.17 12.76 1067 ----- ----- ----- ----- ----- ----- 1089 ----- ----- ----- ----- ----- ----- 1108 D5443 67.41 0.06 31.33 36.08 19.72 12.94 1412 ----- ----- ----- ----- ----- ----- 1455 ----- ----- ----- ----- ----- ----- 1613 D6839 67.19 0.0 ----- ----- 19.29 13.52 1714 ----- ----- ----- ----- ----- ----- 1720 ----- ----- ----- ----- ----- ----- 1842 D5443 62.36 <0.01 31.12 36.24 19.54 12.63 1949 D5443 67.57 0.19 ----- ----- 20.16 12.28 1990 D6839 67.67 0.07 31.34 36.33 19.68 12.65 6156 ----- ----- ----- ----- ----- -----
normality not OK unknown OK OK OK OK n 10 6 9 8 10 11
outliers 1 2 0 1 1 0 mean (n) 67.565 0.030 31.665 36.185 19.512 12.965 st.dev. (n) 0.7040 0.0297 0.4784 0.1705 0.3538 0.6773 R(calc.) 1.971 0.083 1.340 0.478 0.991 1.896
NB. Bold and underlined figures are statistical outliers
60
61
62
63
64
65
66
67
68
69
70
184
2
106
5
161
3
106
6
110
8
194
9
199
0
102
6
971
445
171
Total paraffins
10
12
14
16
18
20
22
171
971
106
6
161
3
102
6
184
2
445
199
0
110
8
106
5
194
9
Naphthenes
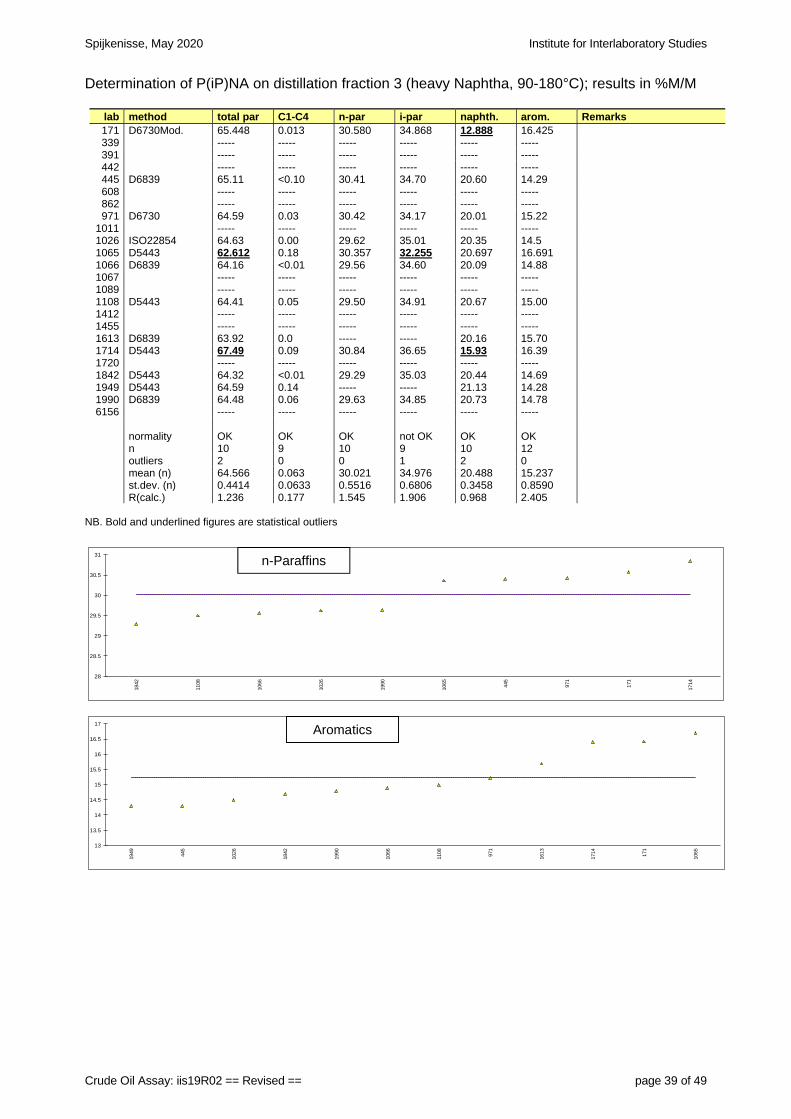
Spijkenisse, May 2020 Institute for Interlaboratory Studies
Crude Oil Assay: iis19R02 == Revised == page 39 of 49
Determination of P(iP)NA on distillation fraction 3 (heavy Naphtha, 90-180°C); results in %M/M
lab method total par C1-C4 n-par i-par naphth. arom. Remarks 171 D6730Mod. 65.448 0.013 30.580 34.868 12.888 16.425 339 ----- ----- ----- ----- ----- ----- 391 ----- ----- ----- ----- ----- ----- 442 ----- ----- ----- ----- ----- ----- 445 D6839 65.11 <0.10 30.41 34.70 20.60 14.29 608 ----- ----- ----- ----- ----- ----- 862 ----- ----- ----- ----- ----- ----- 971 D6730 64.59 0.03 30.42 34.17 20.01 15.22
1011 ----- ----- ----- ----- ----- ----- 1026 ISO22854 64.63 0.00 29.62 35.01 20.35 14.5 1065 D5443 62.612 0.18 30.357 32.255 20.697 16.691 1066 D6839 64.16 <0.01 29.56 34.60 20.09 14.88 1067 ----- ----- ----- ----- ----- ----- 1089 ----- ----- ----- ----- ----- ----- 1108 D5443 64.41 0.05 29.50 34.91 20.67 15.00 1412 ----- ----- ----- ----- ----- ----- 1455 ----- ----- ----- ----- ----- ----- 1613 D6839 63.92 0.0 ----- ----- 20.16 15.70 1714 D5443 67.49 0.09 30.84 36.65 15.93 16.39 1720 ----- ----- ----- ----- ----- ----- 1842 D5443 64.32 <0.01 29.29 35.03 20.44 14.69 1949 D5443 64.59 0.14 ----- ----- 21.13 14.28 1990 D6839 64.48 0.06 29.63 34.85 20.73 14.78 6156 ----- ----- ----- ----- ----- ----- normality OK OK OK not OK OK OK n 10 9 10 9 10 12
outliers 2 0 0 1 2 0 mean (n) 64.566 0.063 30.021 34.976 20.488 15.237 st.dev. (n) 0.4414 0.0633 0.5516 0.6806 0.3458 0.8590 R(calc.) 1.236 0.177 1.545 1.906 0.968 2.405
NB. Bold and underlined figures are statistical outliers
28
28.5
29
29.5
30
30.5
31
184
2
110
8
106
6
102
6
199
0
106
5
445
971
171
171
4
n-Paraffins
13
13.5
14
14.5
15
15.5
16
16.5
17
194
9
445
102
6
184
2
199
0
106
6
110
8
971
161
3
171
4
171
106
5
Aromatics
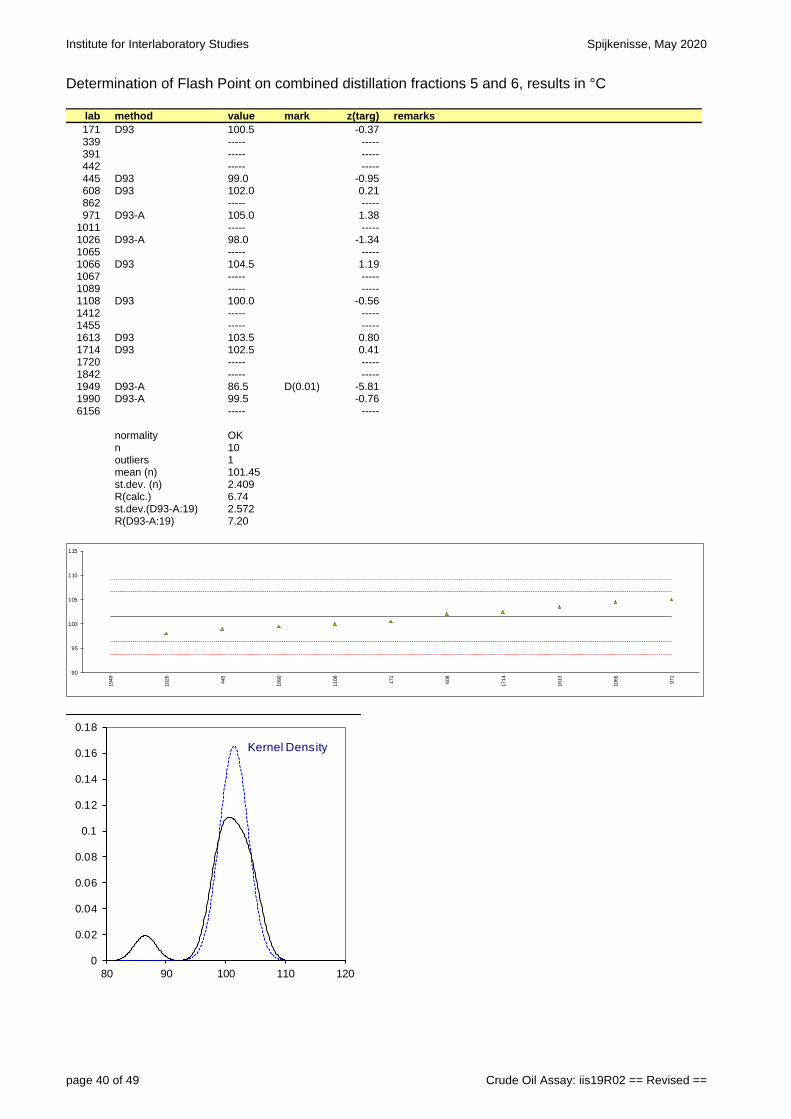
Institute for Interlaboratory Studies Spijkenisse, May 2020
page 40 of 49 Crude Oil Assay: iis19R02 == Revised ==
Determination of Flash Point on combined distillation fractions 5 and 6, results in °C
lab method value mark z(targ) remarks 171 D93 100.5 -0.37 339 ----- ----- 391 ----- ----- 442 ----- ----- 445 D93 99.0 -0.95 608 D93 102.0 0.21 862 ----- ----- 971 D93-A 105.0 1.38
1011 ----- ----- 1026 D93-A 98.0 -1.34 1065 ----- ----- 1066 D93 104.5 1.19 1067 ----- ----- 1089 ----- ----- 1108 D93 100.0 -0.56 1412 ----- ----- 1455 ----- ----- 1613 D93 103.5 0.80 1714 D93 102.5 0.41 1720 ----- ----- 1842 ----- ----- 1949 D93-A 86.5 D(0.01) -5.81 1990 D93-A 99.5 -0.76 6156 ----- -----
normality OK n 10 outliers 1 mean (n) 101.45 st.dev. (n) 2.409 R(calc.) 6.74 st.dev.(D93-A:19) 2.572 R(D93-A:19) 7.20
90
95
100
105
110
115
194
9
102
6
445
199
0
110
8
171
608
171
4
161
3
106
6
971
0
0.02
0.04
0.06
0.08
0.1
0.12
0.14
0.16
0.18
80 90 100 110 120
Kernel Density
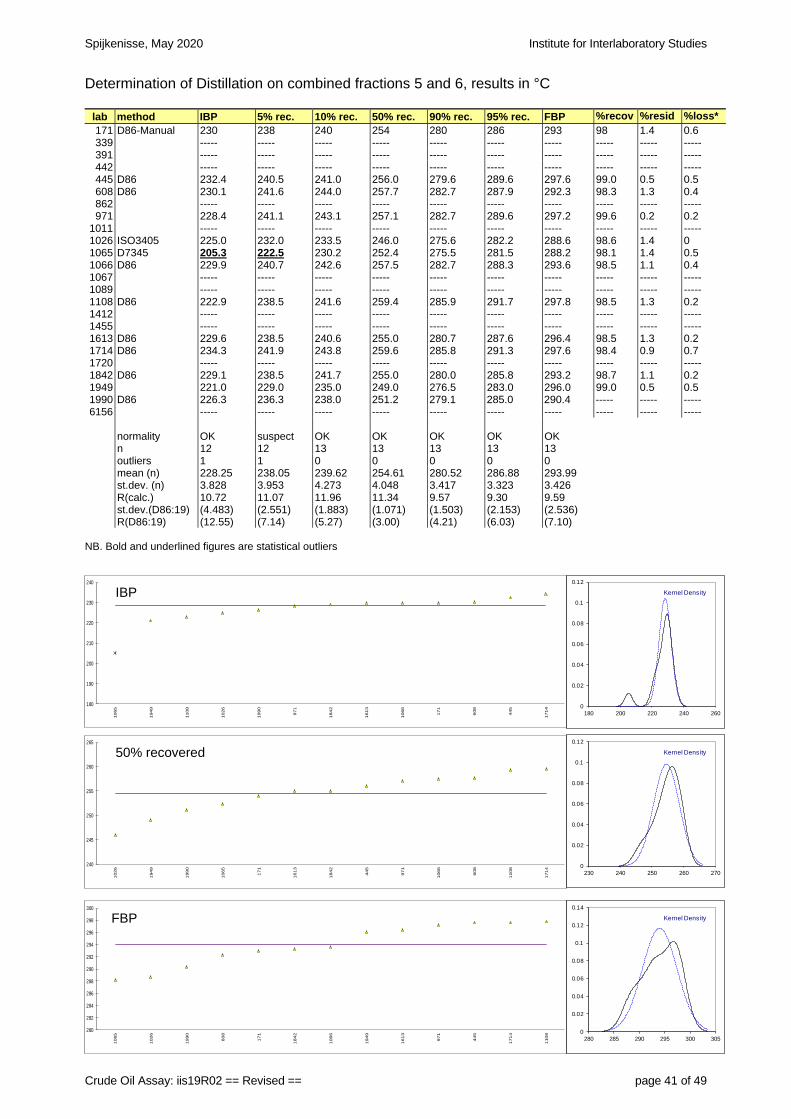
Spijkenisse, May 2020 Institute for Interlaboratory Studies
Crude Oil Assay: iis19R02 == Revised == page 41 of 49
Determination of Distillation on combined fractions 5 and 6, results in °C
lab method IBP 5% rec. 10% rec. 50% rec. 90% rec. 95% rec. FBP %recov %resid %loss* 171 D86-Manual 230 238 240 254 280 286 293 98 1.4 0.6 339 ----- ----- ----- ----- ----- ----- ----- ----- ----- ----- 391 ----- ----- ----- ----- ----- ----- ----- ----- ----- ----- 442 ----- ----- ----- ----- ----- ----- ----- ----- ----- ----- 445 D86 232.4 240.5 241.0 256.0 279.6 289.6 297.6 99.0 0.5 0.5 608 D86 230.1 241.6 244.0 257.7 282.7 287.9 292.3 98.3 1.3 0.4 862 ----- ----- ----- ----- ----- ----- ----- ----- ----- ----- 971 228.4 241.1 243.1 257.1 282.7 289.6 297.2 99.6 0.2 0.2
1011 ----- ----- ----- ----- ----- ----- ----- ----- ----- ----- 1026 ISO3405 225.0 232.0 233.5 246.0 275.6 282.2 288.6 98.6 1.4 0 1065 D7345 205.3 222.5 230.2 252.4 275.5 281.5 288.2 98.1 1.4 0.5 1066 D86 229.9 240.7 242.6 257.5 282.7 288.3 293.6 98.5 1.1 0.4 1067 ----- ----- ----- ----- ----- ----- ----- ----- ----- ----- 1089 ----- ----- ----- ----- ----- ----- ----- ----- ----- ----- 1108 D86 222.9 238.5 241.6 259.4 285.9 291.7 297.8 98.5 1.3 0.2 1412 ----- ----- ----- ----- ----- ----- ----- ----- ----- ----- 1455 ----- ----- ----- ----- ----- ----- ----- ----- ----- ----- 1613 D86 229.6 238.5 240.6 255.0 280.7 287.6 296.4 98.5 1.3 0.2 1714 D86 234.3 241.9 243.8 259.6 285.8 291.3 297.6 98.4 0.9 0.7 1720 ----- ----- ----- ----- ----- ----- ----- ----- ----- ----- 1842 D86 229.1 238.5 241.7 255.0 280.0 285.8 293.2 98.7 1.1 0.2 1949 221.0 229.0 235.0 249.0 276.5 283.0 296.0 99.0 0.5 0.5 1990 D86 226.3 236.3 238.0 251.2 279.1 285.0 290.4 ----- ----- ----- 6156 ----- ----- ----- ----- ----- ----- ----- ----- ----- -----
normality OK suspect OK OK OK OK OK n 12 12 13 13 13 13 13
outliers 1 1 0 0 0 0 0 mean (n) 228.25 238.05 239.62 254.61 280.52 286.88 293.99 st.dev. (n) 3.828 3.953 4.273 4.048 3.417 3.323 3.426 R(calc.) 10.72 11.07 11.96 11.34 9.57 9.30 9.59 st.dev.(D86:19) (4.483) (2.551) (1.883) (1.071) (1.503) (2.153) (2.536) R(D86:19) (12.55) (7.14) (5.27) (3.00) (4.21) (6.03) (7.10)
NB. Bold and underlined figures are statistical outliers
180
190
200
210
220
230
240
1065
1949
1108
1026
1990
971
1842
1613
1066
171
608
445
1714 0
0.02
0.04
0.06
0.08
0.1
0.12
180 200 220 240 260
Kernel DensityIBP
240
245
250
255
260
265
1026
1949
1990
1065
171
1613
1842
445
971
1066
608
1108
1714 0
0.02
0.04
0.06
0.08
0.1
0.12
230 240 250 260 270
Kernel Density50% recovered
280
282
284
286
288
290
292
294
296
298
300
1065
1026
1990
608
171
1842
1066
1949
1613
971
445
1714
1108 0
0.02
0.04
0.06
0.08
0.1
0.12
0.14
280 285 290 295 300 305
Kernel DensityFBP
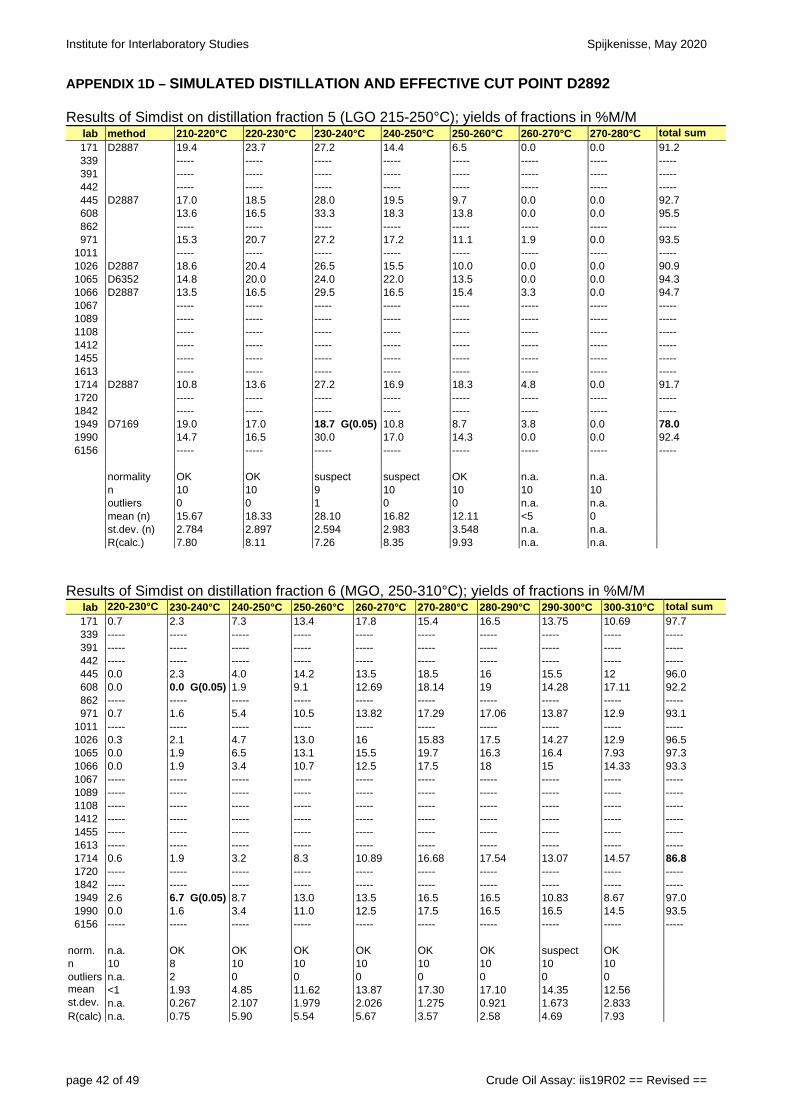
Institute for Interlaboratory Studies Spijkenisse, May 2020
page 42 of 49 Crude Oil Assay: iis19R02 == Revised ==
APPENDIX 1D – SIMULATED DISTILLATION AND EFFECTIVE CUT POINT D2892 Results of Simdist on distillation fraction 5 (LGO 215-250°C); yields of fractions in %M/M
lab method 210-220°C 220-230°C 230-240°C 240-250°C 250-260°C 260-270°C 270-280°C total sum 171 D2887 19.4 23.7 27.2 14.4 6.5 0.0 0.0 91.2 339 ----- ----- ----- ----- ----- ----- ----- ----- 391 ----- ----- ----- ----- ----- ----- ----- ----- 442 ----- ----- ----- ----- ----- ----- ----- ----- 445 D2887 17.0 18.5 28.0 19.5 9.7 0.0 0.0 92.7 608 13.6 16.5 33.3 18.3 13.8 0.0 0.0 95.5 862 ----- ----- ----- ----- ----- ----- ----- ----- 971 15.3 20.7 27.2 17.2 11.1 1.9 0.0 93.5
1011 ----- ----- ----- ----- ----- ----- ----- ----- 1026 D2887 18.6 20.4 26.5 15.5 10.0 0.0 0.0 90.9 1065 D6352 14.8 20.0 24.0 22.0 13.5 0.0 0.0 94.3 1066 D2887 13.5 16.5 29.5 16.5 15.4 3.3 0.0 94.7 1067 ----- ----- ----- ----- ----- ----- ----- ----- 1089 ----- ----- ----- ----- ----- ----- ----- ----- 1108 ----- ----- ----- ----- ----- ----- ----- ----- 1412 ----- ----- ----- ----- ----- ----- ----- ----- 1455 ----- ----- ----- ----- ----- ----- ----- ----- 1613 ----- ----- ----- ----- ----- ----- ----- ----- 1714 D2887 10.8 13.6 27.2 16.9 18.3 4.8 0.0 91.7 1720 ----- ----- ----- ----- ----- ----- ----- ----- 1842 ----- ----- ----- ----- ----- ----- ----- ----- 1949 D7169 19.0 17.0 18.7 G(0.05) 10.8 8.7 3.8 0.0 78.0 1990 14.7 16.5 30.0 17.0 14.3 0.0 0.0 92.4 6156 ----- ----- ----- ----- ----- ----- ----- -----
normality OK OK suspect suspect OK n.a. n.a. n 10 10 9 10 10 10 10 outliers 0 0 1 0 0 n.a. n.a. mean (n) 15.67 18.33 28.10 16.82 12.11 <5 0 st.dev. (n) 2.784 2.897 2.594 2.983 3.548 n.a. n.a. R(calc.) 7.80 8.11 7.26 8.35 9.93 n.a. n.a.
Results of Simdist on distillation fraction 6 (MGO, 250-310°C); yields of fractions in %M/M
lab 220-230°C 230-240°C 240-250°C 250-260°C 260-270°C 270-280°C 280-290°C 290-300°C 300-310°C total sum 171 0.7 2.3 7.3 13.4 17.8 15.4 16.5 13.75 10.69 97.7 339 ----- ----- ----- ----- ----- ----- ----- ----- ----- ----- 391 ----- ----- ----- ----- ----- ----- ----- ----- ----- ----- 442 ----- ----- ----- ----- ----- ----- ----- ----- ----- ----- 445 0.0 2.3 4.0 14.2 13.5 18.5 16 15.5 12 96.0 608 0.0 0.0 G(0.05) 1.9 9.1 12.69 18.14 19 14.28 17.11 92.2 862 ----- ----- ----- ----- ----- ----- ----- ----- ----- ----- 971 0.7 1.6 5.4 10.5 13.82 17.29 17.06 13.87 12.9 93.1
1011 ----- ----- ----- ----- ----- ----- ----- ----- ----- ----- 1026 0.3 2.1 4.7 13.0 16 15.83 17.5 14.27 12.9 96.5 1065 0.0 1.9 6.5 13.1 15.5 19.7 16.3 16.4 7.93 97.3 1066 0.0 1.9 3.4 10.7 12.5 17.5 18 15 14.33 93.3 1067 ----- ----- ----- ----- ----- ----- ----- ----- ----- ----- 1089 ----- ----- ----- ----- ----- ----- ----- ----- ----- ----- 1108 ----- ----- ----- ----- ----- ----- ----- ----- ----- ----- 1412 ----- ----- ----- ----- ----- ----- ----- ----- ----- ----- 1455 ----- ----- ----- ----- ----- ----- ----- ----- ----- ----- 1613 ----- ----- ----- ----- ----- ----- ----- ----- ----- ----- 1714 0.6 1.9 3.2 8.3 10.89 16.68 17.54 13.07 14.57 86.8 1720 ----- ----- ----- ----- ----- ----- ----- ----- ----- ----- 1842 ----- ----- ----- ----- ----- ----- ----- ----- ----- ----- 1949 2.6 6.7 G(0.05) 8.7 13.0 13.5 16.5 16.5 10.83 8.67 97.0 1990 0.0 1.6 3.4 11.0 12.5 17.5 16.5 16.5 14.5 93.5 6156 ----- ----- ----- ----- ----- ----- ----- ----- ----- -----
norm. n.a. OK OK OK OK OK OK suspect OK n 10 8 10 10 10 10 10 10 10 outliers n.a. 2 0 0 0 0 0 0 0 mean <1 1.93 4.85 11.62 13.87 17.30 17.10 14.35 12.56 st.dev. n.a. 0.267 2.107 1.979 2.026 1.275 0.921 1.673 2.833 R(calc) n.a. 0.75 5.90 5.54 5.67 3.57 2.58 4.69 7.93
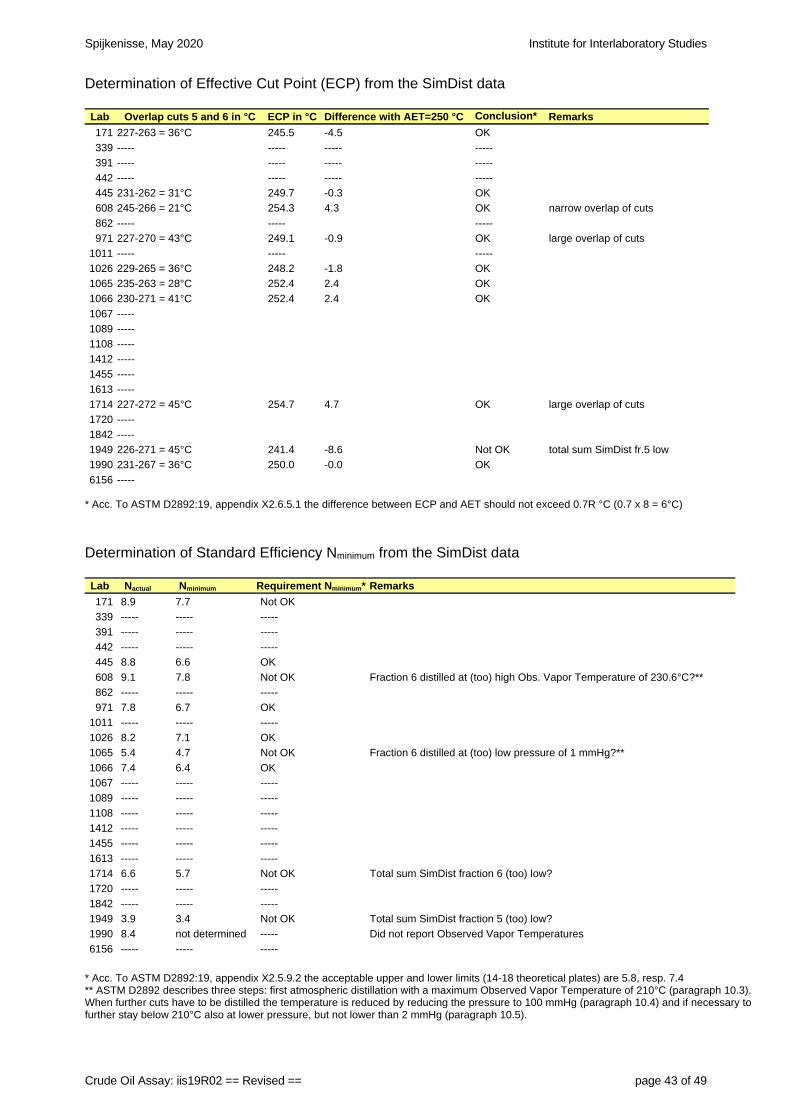
Spijkenisse, May 2020 Institute for Interlaboratory Studies
Crude Oil Assay: iis19R02 == Revised == page 43 of 49
Determination of Effective Cut Point (ECP) from the SimDist data Lab Overlap cuts 5 and 6 in °C ECP in °C Difference with AET=250 °C Conclusion* Remarks
171 227-263 = 36°C 245.5 -4.5 OK
339 ----- ----- ----- -----
391 ----- ----- ----- -----
442 ----- ----- ----- -----
445 231-262 = 31°C 249.7 -0.3 OK
608 245-266 = 21°C 254.3 4.3 OK narrow overlap of cuts
862 ----- ----- -----
971 227-270 = 43°C 249.1 -0.9 OK large overlap of cuts
1011 ----- ----- -----
1026 229-265 = 36°C 248.2 -1.8 OK
1065 235-263 = 28°C 252.4 2.4 OK
1066 230-271 = 41°C 252.4 2.4 OK
1067 -----
1089 -----
1108 -----
1412 -----
1455 -----
1613 -----
1714 227-272 = 45°C 254.7 4.7 OK large overlap of cuts
1720 -----
1842 -----
1949 226-271 = 45°C 241.4 -8.6 Not OK total sum SimDist fr.5 low
1990 231-267 = 36°C 250.0 -0.0 OK
6156 ----- * Acc. To ASTM D2892:19, appendix X2.6.5.1 the difference between ECP and AET should not exceed 0.7R °C (0.7 x 8 = 6°C)
Determination of Standard Efficiency Nminimum from the SimDist data Lab Nactual Nminimum Requirement Nminimum* Remarks
171 8.9 7.7 Not OK
339 ----- ----- -----
391 ----- ----- -----
442 ----- ----- -----
445 8.8 6.6 OK
608 9.1 7.8 Not OK Fraction 6 distilled at (too) high Obs. Vapor Temperature of 230.6°C?**
862 ----- ----- -----
971 7.8 6.7 OK
1011 ----- ----- -----
1026 8.2 7.1 OK
1065 5.4 4.7 Not OK Fraction 6 distilled at (too) low pressure of 1 mmHg?**
1066 7.4 6.4 OK
1067 ----- ----- -----
1089 ----- ----- -----
1108 ----- ----- -----
1412 ----- ----- -----
1455 ----- ----- -----
1613 ----- ----- -----
1714 6.6 5.7 Not OK Total sum SimDist fraction 6 (too) low?
1720 ----- ----- -----
1842 ----- ----- -----
1949 3.9 3.4 Not OK Total sum SimDist fraction 5 (too) low?
1990 8.4 not determined ----- Did not report Observed Vapor Temperatures
6156 ----- ----- -----
* Acc. To ASTM D2892:19, appendix X2.5.9.2 the acceptable upper and lower limits (14-18 theoretical plates) are 5.8, resp. 7.4 ** ASTM D2892 describes three steps: first atmospheric distillation with a maximum Observed Vapor Temperature of 210°C (paragraph 10.3). When further cuts have to be distilled the temperature is reduced by reducing the pressure to 100 mmHg (paragraph 10.4) and if necessary to further stay below 210°C also at lower pressure, but not lower than 2 mmHg (paragraph 10.5).
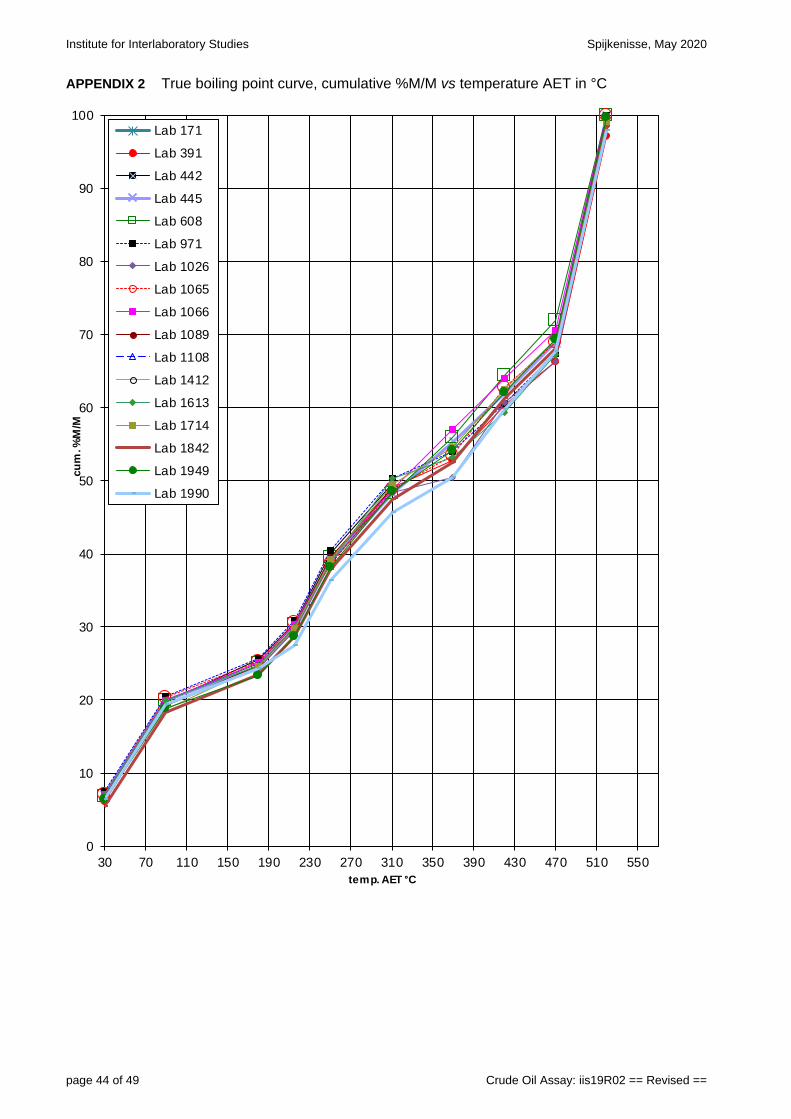
Institute for Interlaboratory Studies Spijkenisse, May 2020
page 44 of 49 Crude Oil Assay: iis19R02 == Revised ==
APPENDIX 2 True boiling point curve, cumulative %M/M vs temperature AET in °C
0
10
20
30
40
50
60
70
80
90
100
30 70 110 150 190 230 270 310 350 390 430 470 510 550
cum
. %M
/M
temp. AET °C
Lab 171
Lab 391
Lab 442
Lab 445
Lab 608
Lab 971
Lab 1026
Lab 1065
Lab 1066
Lab 1089
Lab 1108
Lab 1412
Lab 1613
Lab 1714
Lab 1842
Lab 1949
Lab 1990
Spijkenisse, May 2020 Institute for Interlaboratory Studies
Crude Oil Assay: iis19R02 == Revised == page 45 of 49
APPENDIX 3 True boiling point curve D2892, Sulfur in %M/M vs temperature AET in °C
0.0
1.0
2.0
3.0
4.0
5.0
6.0
30 70 110 150 190 230 270 310 350 390 430 470 510 550
Su
lph
ur
%M
/M
temp. AET °C
Lab 171
Lab 391
Lab 442
Lab 445
Lab 608
Lab 971
Lab 1026
Lab 1065
Lab 1066
Lab 1089
Lab 1108
Lab 1412
Lab 1613
Lab 1714
Lab 1949
Lab 1990
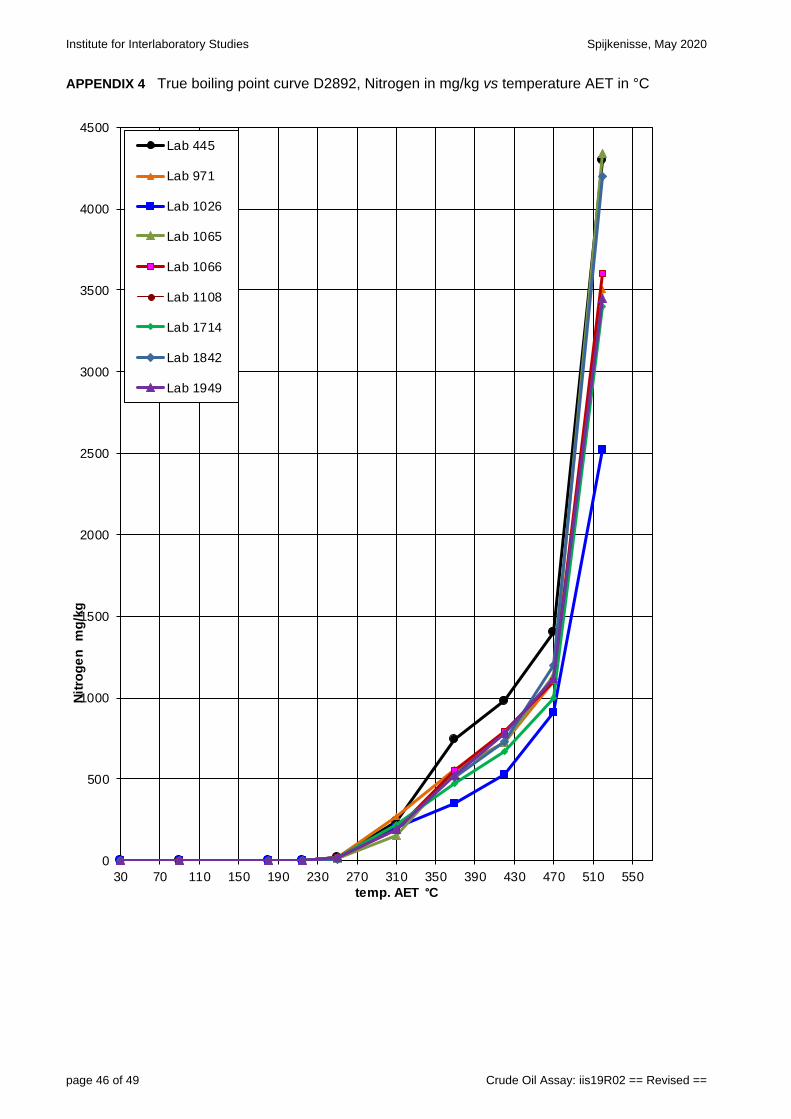
Institute for Interlaboratory Studies Spijkenisse, May 2020
page 46 of 49 Crude Oil Assay: iis19R02 == Revised ==
APPENDIX 4 True boiling point curve D2892, Nitrogen in mg/kg vs temperature AET in °C
0
500
1000
1500
2000
2500
3000
3500
4000
4500
30 70 110 150 190 230 270 310 350 390 430 470 510 550
Nit
rog
en
m
g/k
g
temp. AET °C
Lab 445
Lab 971
Lab 1026
Lab 1065
Lab 1066
Lab 1108
Lab 1714
Lab 1842
Lab 1949
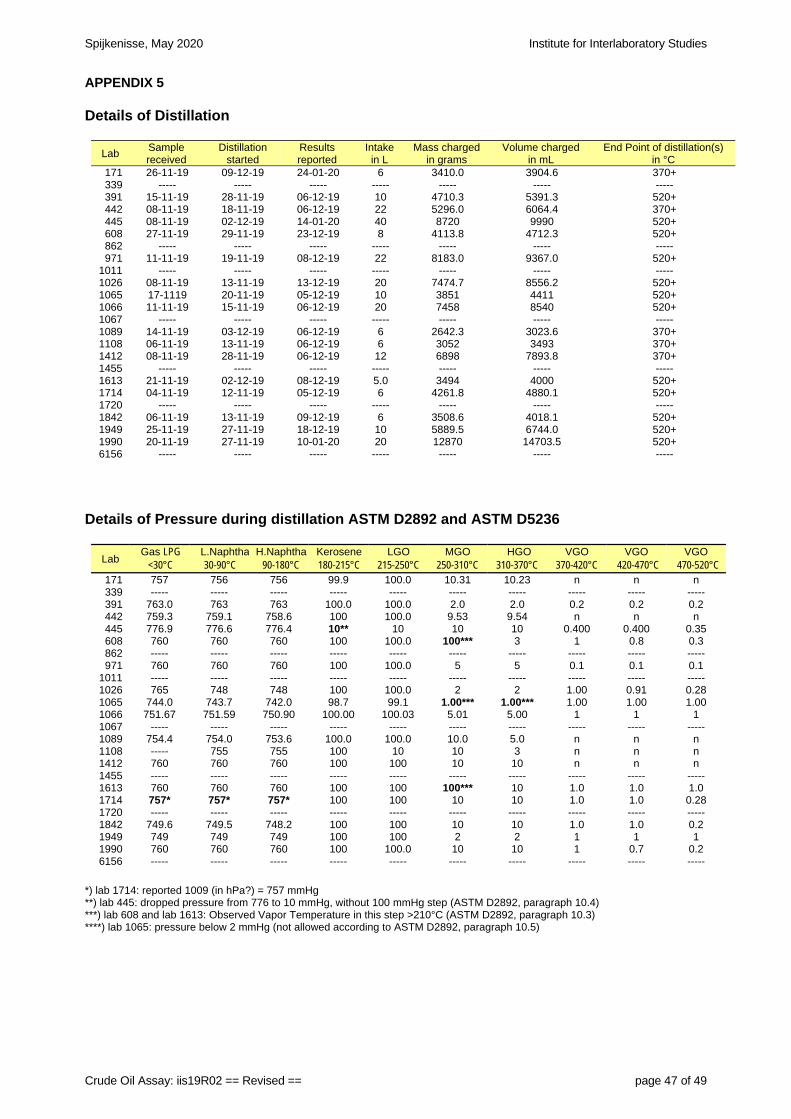
Spijkenisse, May 2020 Institute for Interlaboratory Studies
Crude Oil Assay: iis19R02 == Revised == page 47 of 49
APPENDIX 5 Details of Distillation
Lab Sample received
Distillation started
Results reported
Intake in L
Mass charged in grams
Volume charged in mL
End Point of distillation(s) in °C
171 26-11-19 09-12-19 24-01-20 6 3410.0 3904.6 370+ 339 ----- ----- ----- ----- ----- ----- ----- 391 15-11-19 28-11-19 06-12-19 10 4710.3 5391.3 520+ 442 08-11-19 18-11-19 06-12-19 22 5296.0 6064.4 370+ 445 08-11-19 02-12-19 14-01-20 40 8720 9990 520+ 608 27-11-19 29-11-19 23-12-19 8 4113.8 4712.3 520+ 862 ----- ----- ----- ----- ----- ----- ----- 971 11-11-19 19-11-19 08-12-19 22 8183.0 9367.0 520+
1011 ----- ----- ----- ----- ----- ----- ----- 1026 08-11-19 13-11-19 13-12-19 20 7474.7 8556.2 520+ 1065 17-1119 20-11-19 05-12-19 10 3851 4411 520+ 1066 11-11-19 15-11-19 06-12-19 20 7458 8540 520+ 1067 ----- ----- ----- ----- ----- ----- ----- 1089 14-11-19 03-12-19 06-12-19 6 2642.3 3023.6 370+ 1108 06-11-19 13-11-19 06-12-19 6 3052 3493 370+ 1412 08-11-19 28-11-19 06-12-19 12 6898 7893.8 370+ 1455 ----- ----- ----- ----- ----- ----- ----- 1613 21-11-19 02-12-19 08-12-19 5.0 3494 4000 520+ 1714 04-11-19 12-11-19 05-12-19 6 4261.8 4880.1 520+ 1720 ----- ----- ----- ----- ----- ----- ----- 1842 06-11-19 13-11-19 09-12-19 6 3508.6 4018.1 520+ 1949 25-11-19 27-11-19 18-12-19 10 5889.5 6744.0 520+ 1990 20-11-19 27-11-19 10-01-20 20 12870 14703.5 520+ 6156 ----- ----- ----- ----- ----- ----- -----
Details of Pressure during distillation ASTM D2892 and ASTM D5236
Lab Gas LPG
<30°C L.Naphtha30-90°C
H.Naphtha 90-180°C
Kerosene 180-215°C
LGO 215-250°C
MGO 250-310°C
HGO 310-370°C
VGO 370-420°C
VGO 420-470°C
VGO 470-520°C
171 757 756 756 99.9 100.0 10.31 10.23 n n n 339 ----- ----- ----- ----- ----- ----- ----- ----- ----- ----- 391 763.0 763 763 100.0 100.0 2.0 2.0 0.2 0.2 0.2 442 759.3 759.1 758.6 100 100.0 9.53 9.54 n n n 445 776.9 776.6 776.4 10** 10 10 10 0.400 0.400 0.35 608 760 760 760 100 100.0 100*** 3 1 0.8 0.3 862 ----- ----- ----- ----- ----- ----- ----- ----- ----- ----- 971 760 760 760 100 100.0 5 5 0.1 0.1 0.1
1011 ----- ----- ----- ----- ----- ----- ----- ----- ----- ----- 1026 765 748 748 100 100.0 2 2 1.00 0.91 0.28 1065 744.0 743.7 742.0 98.7 99.1 1.00*** 1.00*** 1.00 1.00 1.00 1066 751.67 751.59 750.90 100.00 100.03 5.01 5.00 1 1 1 1067 ----- ----- ----- ----- ----- ----- ----- ----- ----- ----- 1089 754.4 754.0 753.6 100.0 100.0 10.0 5.0 n n n 1108 ----- 755 755 100 10 10 3 n n n 1412 760 760 760 100 100 10 10 n n n 1455 ----- ----- ----- ----- ----- ----- ----- ----- ----- ----- 1613 760 760 760 100 100 100*** 10 1.0 1.0 1.0 1714 757* 757* 757* 100 100 10 10 1.0 1.0 0.28 1720 ----- ----- ----- ----- ----- ----- ----- ----- ----- ----- 1842 749.6 749.5 748.2 100 100 10 10 1.0 1.0 0.2 1949 749 749 749 100 100 2 2 1 1 1 1990 760 760 760 100 100.0 10 10 1 0.7 0.2 6156 ----- ----- ----- ----- ----- ----- ----- ----- ----- -----
*) lab 1714: reported 1009 (in hPa?) = 757 mmHg **) lab 445: dropped pressure from 776 to 10 mmHg, without 100 mmHg step (ASTM D2892, paragraph 10.4) ***) lab 608 and lab 1613: Observed Vapor Temperature in this step >210°C (ASTM D2892, paragraph 10.3) ****) lab 1065: pressure below 2 mmHg (not allowed according to ASTM D2892, paragraph 10.5)
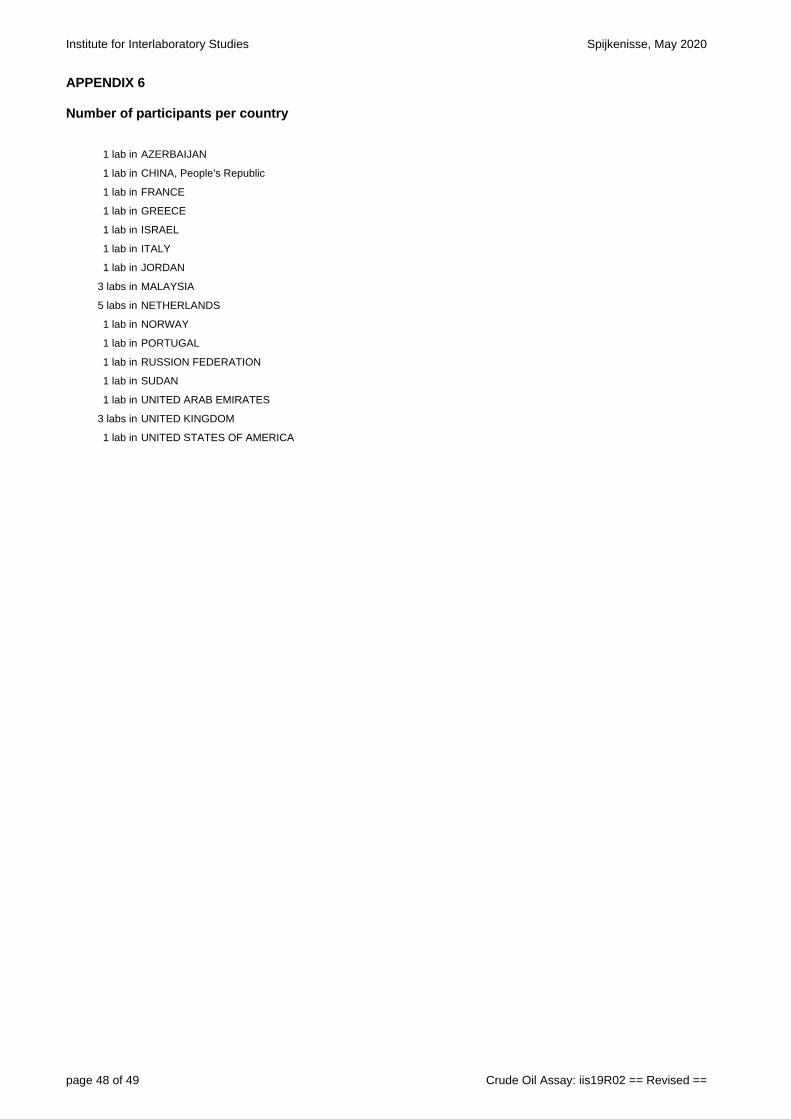
Institute for Interlaboratory Studies Spijkenisse, May 2020
page 48 of 49 Crude Oil Assay: iis19R02 == Revised ==
APPENDIX 6 Number of participants per country
1 lab in AZERBAIJAN
1 lab in CHINA, People's Republic
1 lab in FRANCE
1 lab in GREECE
1 lab in ISRAEL
1 lab in ITALY
1 lab in JORDAN
3 labs in MALAYSIA
5 labs in NETHERLANDS
1 lab in NORWAY
1 lab in PORTUGAL
1 lab in RUSSION FEDERATION
1 lab in SUDAN
1 lab in UNITED ARAB EMIRATES
3 labs in UNITED KINGDOM
1 lab in UNITED STATES OF AMERICA
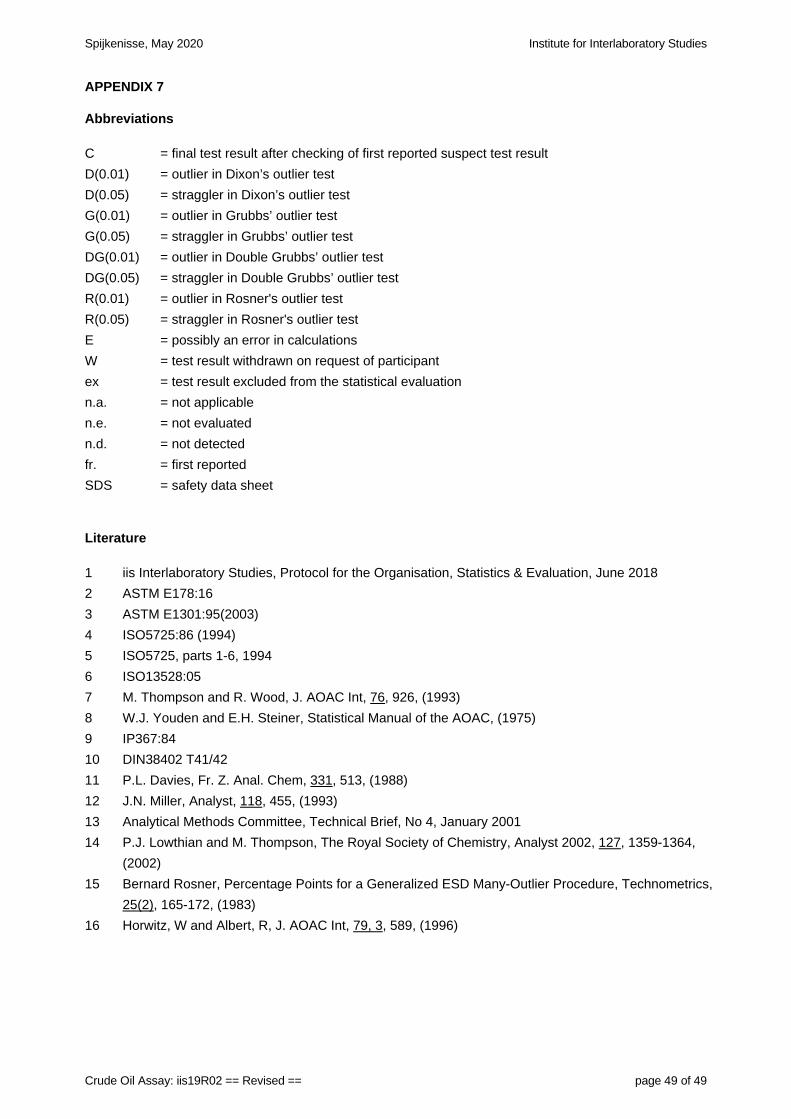
Spijkenisse, May 2020 Institute for Interlaboratory Studies
Crude Oil Assay: iis19R02 == Revised == page 49 of 49
APPENDIX 7 Abbreviations
C = final test result after checking of first reported suspect test result
D(0.01) = outlier in Dixon’s outlier test
D(0.05) = straggler in Dixon’s outlier test
G(0.01) = outlier in Grubbs’ outlier test
G(0.05) = straggler in Grubbs’ outlier test
DG(0.01) = outlier in Double Grubbs’ outlier test
DG(0.05) = straggler in Double Grubbs’ outlier test
R(0.01) = outlier in Rosner's outlier test
R(0.05) = straggler in Rosner's outlier test
E = possibly an error in calculations
W = test result withdrawn on request of participant
ex = test result excluded from the statistical evaluation
n.a. = not applicable
n.e. = not evaluated
n.d. = not detected
fr. = first reported
SDS = safety data sheet
Literature
1 iis Interlaboratory Studies, Protocol for the Organisation, Statistics & Evaluation, June 2018
2 ASTM E178:16
3 ASTM E1301:95(2003)
4 ISO5725:86 (1994)
5 ISO5725, parts 1-6, 1994
6 ISO13528:05
7 M. Thompson and R. Wood, J. AOAC Int, 76, 926, (1993)
8 W.J. Youden and E.H. Steiner, Statistical Manual of the AOAC, (1975)
9 IP367:84
10 DIN38402 T41/42
11 P.L. Davies, Fr. Z. Anal. Chem, 331, 513, (1988)
12 J.N. Miller, Analyst, 118, 455, (1993)
13 Analytical Methods Committee, Technical Brief, No 4, January 2001
14 P.J. Lowthian and M. Thompson, The Royal Society of Chemistry, Analyst 2002, 127, 1359-1364,
(2002)
15 Bernard Rosner, Percentage Points for a Generalized ESD Many-Outlier Procedure, Technometrics,
25(2), 165-172, (1983)
16 Horwitz, W and Albert, R, J. AOAC Int, 79, 3, 589, (1996)