restoration assessment: i- phosphorus and nitrogen dynamics versus phytoplankton biomass in...
TRANSCRIPT
International Journal of Management Sciences and Business Research, 2013 Vol. 2, Issue 5. (ISSN: 2226-8235)
http://www.ijmsbr.com Page 31
Restoration Assessment: I- Phosphorus and Nitrogen dynamics
versus phytoplankton biomass in Al-Hawizeh marshland, Iraq Author’s Detail:
1) Sama Samir AlMaarofi
1* (Correspondent author)
Biology Department, University of
Waterloo, Waterloo-Ontario Canada Cell phone: +9647808030529; 2)
Ali Abdul Zahra Douabul Marine Environmental Chemistry, Marine Science Center, University of Basra,
Iraq
Abstract
Inundation of the Mesopotamian marshlands, southern Iraq, brings the anticipation of restoring the destroyed
habitat to life again. It is important from the restoration point of view to study the relationship between water
quality parameters and marshland’s productivity. Al-Hawizeh, one of the three main marshlands of the
Mesopotamia, has been studied intensively after re-flooding in April 2003. During the desiccation period, the
marshland features three significant parts: never dried, semidried, and completely dried areas. The main goal
of this study is to find whether the newly re-flooded marshes in Al-Hawizeh exhibit healthy nutrient dynamics in
contrast to their primary production biomass.Water quality parameters and chlorophyll-a concentrations were
monitored on a monthly basis from May 2006 to April 2007 ineight marshes in Hawizeh. The result indicates
significant differences (P> 0.005) between the selected marshes in Al-Hawizeh, whichsuggest that Al-Hawizeh
marshland system is not a one homogeneous ecosystem as used to be pre desiccation period. Also, there was a
relationship between chlorophyll-a and both TP and TN concentrations;however, the relationship between
chlorophyll-a and TN was stronger than TP. In conclusion, the overall water quality assessment suggests a
good prospective recovery ability of the semi dried marshes and marshes has a river water input comparing to
the completely dried marshes in Al-Hawizeh.
Key words: Mesopotamian marshes, restoration assessment, water quality assessment; phosphorus variation,
nitrogen variation, chlorophyll-a.
1.1 Introduction
Thirteen years after the desiccation of the
Mesopotamian marshlands, and the beginning of
their re-inundation in April 2003, still there is a
hopeful expectation that these ecosystems will
return to their natural condition. This study focused
on variation in Phosphorus (P)and nitrogen (N),
and their implication for the restoration process of
Al-Hawizeh marshland specifically as a part of the
Mesopotamian marshlands. P and N are two of the
most important nutrients for plant growth and they
represent two of the most common limiting factors
for the aquatic systems (Mitsch & Gosselink,
2000). Therefore, they tend to be the most limiting
nutrients for the production of the organic matter
via photosynthesis (Wetzel, 2001). Their variation
also plays a role in the distribution and diversity of
the phytoplankton, periphyton, and macrophytes
(Dillon &Rigler, 1974; McCauley et al., 1989;
Radwan, 2005; Panigrahiet al., 2007). It is
important from the restoration point of view to
study P and N availability and distribution in the
newly inundated marshes in Al-Hawizeh
marshland. The main goal ofthis study is to find
whether the newly re-flooded marshes in Al-
Hawizeh exhibit healthy nutrient dynamics in
contrast to their primary production biomass.
Normally, phytoplankton standing crop increases
when there is enough nutrient supply (Dillon
&Rigler, 1974). This study attempt to compare the
total P (TP) and total N (TN) distribution and their
correlation with phytoplankton biomass,
represented by chlorophyll-a, in eight marshes
inAl-Hawizeh marshland and test the differences of
physical-chemical and nutrients variation among
the selected station in Al-Hawizeh marshland.
1.2 Study site descriptions
Al-Hawizeh is a mix of permanent and seasonal
open water, mudflats, and inundated plains of fresh
water marshes, dominated by emergent aquatic
plants such as Phragmites and Typha. Since the
desiccation of the Mesopotamia in 1993, the north
part of the Al-Hawizeh (Al-Udhaim marsh)
retained water from the Iranian side that share part
of Al-Hawizeh under their territories. Al-Udhaim
kept its original size and environmental features;
and therefore it is important for the restoration
assessment point of view. Also, the seasonal water
flow from Al-Udhaim into the south west allows a
grate portion of North West Al-Hawizeh to be
partially wet. In contrast, the rest of the Al-
Hawizeh marshes were completely dried.
Historically, the Al-Hawizeh marshland was a one
unique and homogeneous ecosystem. The damage
caused by desiccation processes left remarkable
effects on, especially in the central and southern
parts of the marshland. For example, the
construction of embankments disturbed the land
sediment by moving it to create these embankments
and still affects the flow of water.
1.3 Material and methods
Field sampling:Fieldwork was carried out on a
monthly basis starting in May 2006 to April 2007.
The monthly variation of TP, TN, and chlorophyll-
International Journal of Management Sciences and Business Research, 2013 Vol. 2, Issue 5. (ISSN: 2226-8235)
http://www.ijmsbr.com Page 32
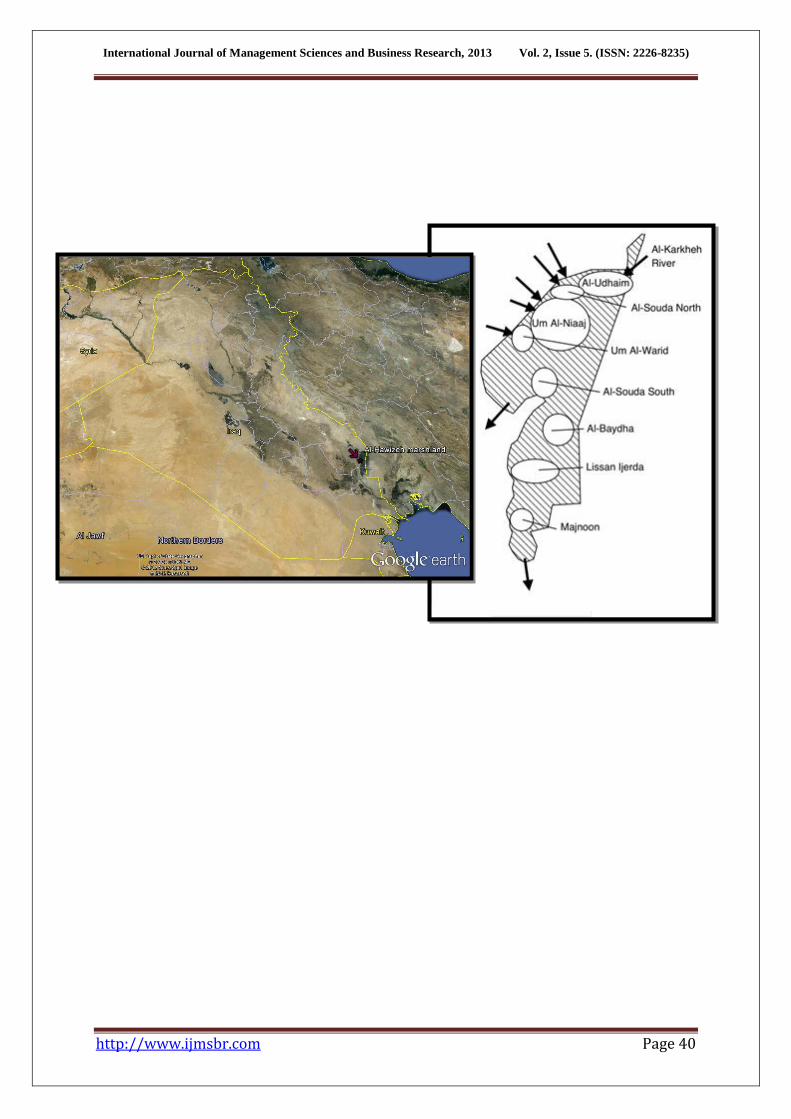
a were studied ineight marshes in Hawizeh (Figure
1, Table 1). The sampling stations were selected to
represent different hydrological status of Al-
Hawizeh from desiccation to inundation. According
to the hydrological status, the marshes were divided
into three groups: the first group includes Al-
Udhaim the ever-wet marsh, the second group
includes the marshes that has water supply from
rivers and partially dried, the third group include
the southern marshes that completely dried and
became a desert.At each station, triplicate surface
water samples (30 cm bellow the water surface)
and triplicate bottom water samples (30 cm above
the sediment surface)were collected from two
depths using aVan Dorn bottle sampler. Physical
and chemical parameters including water
temperature, salinity, dissolved oxygen, and pH
were measured using the WTW Multi-meter model
350i. Water column depth was measured using an
extendable ruler. Light penetration was measured
using a Secchi disk.The water samples were filtered
immediately in the field using pre-weighed GF/F
0.7 µm pore-size filters. The filtrate (500 ml) was
transferred into translucent polyethylene screw-cap
bottles. Bottles were pre-rinsed with the filtrate
twice. Filtrates used to determine nitrite (NO2),
nitrate (NO3), and orthophosphate (PO4) were
preserved with 5 drops of chloroform (Staintonet
al.,1977). Another 50 ml of filtrate was transferred
into screw-cappedtest tubes and digested with 1.5
ml of 3% potassium persulfate for the
determination of total dissolved P (TDP)
concentrations (Menzel& Corwin, 1965). To
determine total dissolved N (TDN) concentrations,
30 ml of the filtrate was transferred into a screw-
capped test tube and digested with 4 ml of
oxidation reagent (Valderrama, 1981). Filters with
particulate matter were transferred immediately to
disposable Petri-dishes and stored at 4 °C
(Staintonet al., 1977; Wetzel & Likens, 1991) in
order to determine particulate P (PP)particulate
N(PN). Filters used to determine chlorophyll-a
were preserved by adding 5 ml of 1% magnesium
chloride to each filter and were transferred
immediately to dark amber scintillation vials and
stored at 4 °C until the time of analysis (Staintonet
al. 1977).
Laboratory analysis: The ascorbic acid method
described by Staintonet al. (1977) was used to
determine PO4concentrations. PO4 samples were
measured using a 1 cm quartz cell in a Shimadzu
spectrophotometer at 885 nm.The concentrations of
DP in the water samples and PP on the filters were
determined according to the method described by
Staintonet al.(1977). The sum of DP and PP is the
TP concentration.The pink azo dye method
described by Stanintonet al. (1977) was used to
determined NO2 concentrations in the water.
Samples used to determine NO3 concentration were
reduced toNO2 by passing them through a
cadmium-copper column and measured as
described by Stanintonet al. (1977). The DN
concentrations in the water were measured by the
method described by Valderrama (1981). The PN
samples were packed in 7 x 5 mm nickel capsules.
The elemental analysis developed by Zimmermann
& Keefe (1997) was used to determine the
particulate organic N (PON) concentration in the
water. The concentration of dissolved organic N
(DON) was calculated approximately by
subtracting the concentrations of NO2 and NO3
from the concentrations of DN as the previous
studies presented in Hussain (1994)found very low
concentrations of NH4 in the Iraqi marshes(less
than 1 µg N/l), the TN concentrations then were
calculated by the summation of DN and PON in the
water samples.TSS concentrations were determined
according to the gravimetrically method that
described by Staintonet al.(1977) using a Sartorius
balance.Chlorophyll-a concentrations were
measured according to the monochromatric method
described in Lorenzen (1967).
Data analysis:The General Linear Model (GLM)
in Systat was used to test the relationships between
chlorophyll-a and TP and TN (Smith, 1982; Prairie
et al., 1989; Kufel, 2001). The analysis of
covariance (ANCOVA) in Systatwas used to
identify the relationship between chlorophyll-a
concentration and TP and TN concentration in the
selected marshes in order to find which nutrient is
the main factor control the phytoplankton
production in these marshes.t-test analysis was
used to determine the difference of water physical
and chemical parameters, TP concentrations, TN
concentrations, and chlorophyll-a concentrations in
the surface water samples and near bottom.
1.4 Results
Comparison of water physical and chemical
parameters, TP concentrations, TN concentrations,
and chlorophyll-a concentrations in the surface
water samples and near bottom water samples in
the eight marshes of Al-Hawizeh revealed no
significant differences (paired t-test P> 0.005). As
a result, the data within the marshes were averaged
to show one value per station.
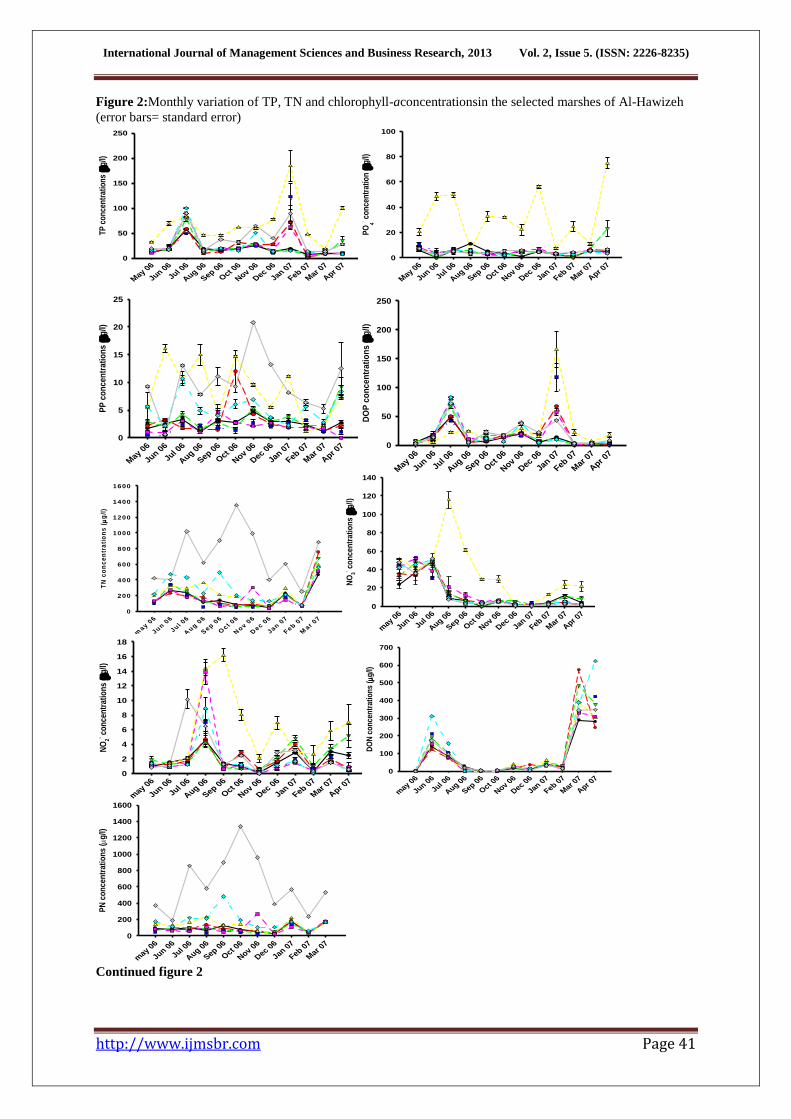
TP and TN concentrations in Al-Hawizeh
underwent both spatial and temporal variation
(Table 4, Figure 3). TP and TN were high during
the summer and winter. The average concentrations
of TP and TN were 30.9 µg/l and 245.0 µg/l,
respectively. The highest average concentration of
TP was 68.4 µg/l recorded in Umm Al-Warid,
while the lowest average concentration of TP was
18.6 µg/l found in Al-Udhaim. The highest average
concentration of TN was 711.7 µg/l found in
Majnoon, while the lowest average concentration
was 123.6 µg/l found in Al-Souda south.
Chlorophyll-a concentration in Al-Hawizeh also
underwent seasonal variation (Table 5, Figure 3).
International Journal of Management Sciences and Business Research, 2013 Vol. 2, Issue 5. (ISSN: 2226-8235)
http://www.ijmsbr.com Page 33
Among all of the eight marshes, chlorophyll-a
concentration was high during the summer and
early fall then its concentration dropped during
winter. During the study period, Majnoon had the
highest chlorophyll-a among the other marshes. Its
concentrations ranged from 1.6 µg/l to 26.2 µg/l.
On the other hand, the Al-Baydha marsh had the
lowest chlorophyll-a concentrations among the
other marshes, its concentration ranged from <0.1
µg/l to 3.2 µg/l.
The correlations between chlorophyll-a and water
physical and chemical parameters, as well as with
TP and TN concentration, are differ among the
selected marshes if Al-Hawizeh(Table 6).In the Al-
Udhaim, chlorophyll-a variation was strongly
influenced by the light penetration and dissolved
oxygen rather than P and N concentrations.
However, P and N were the main factors that
influenced the chlorophyll-a variation in the
marshes that are close to the rivers. P and N
concentrations were also the main factors that
correlated with the variation of chlorophyll-a in the
Al-Souda south marsh. In the southern marshes,
chlorophyll-a varied according to both water
quality parameters and P and N concentration.
Chlorophyll-a variation in the selected marshes
were positively correlated to the water temperature.
It is worth mentioning that cholrophyll-a variation
in the Al-Baydha marsh is not correlated to any
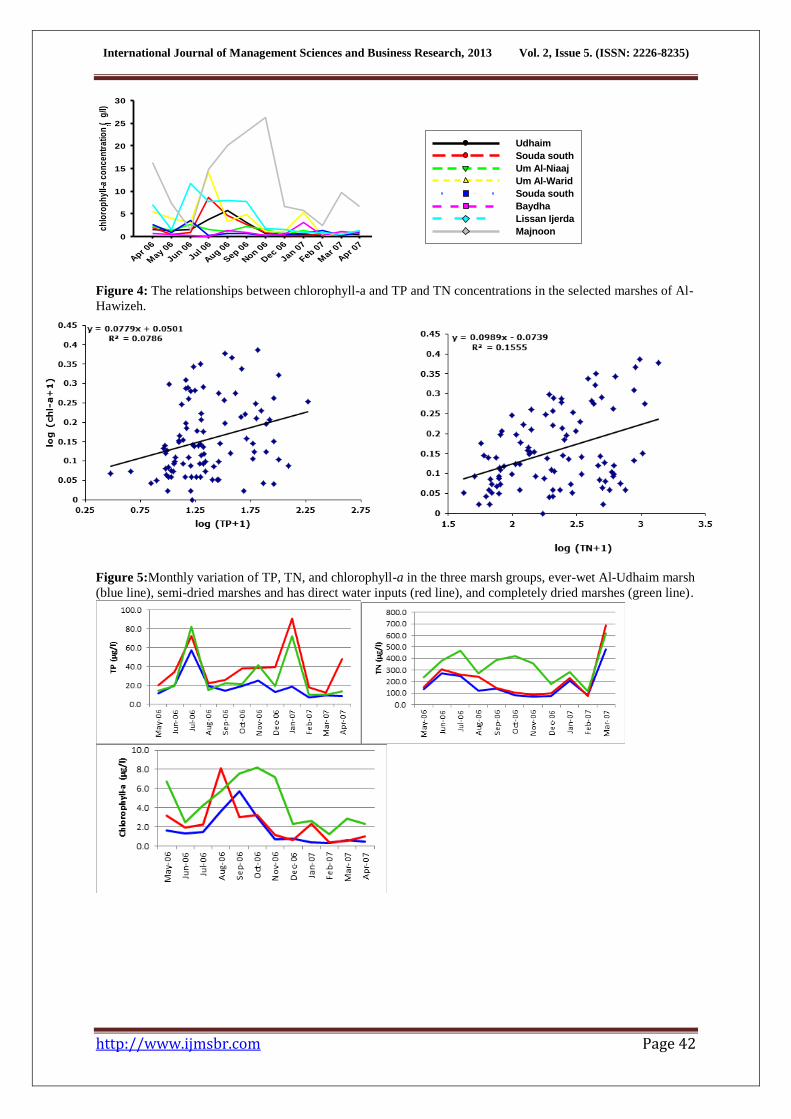
water quality parameter or nutrient.The GLM
analysis shows a significant relationship between
chlorophyll-a and TP (P= 0.006) and TN (P=
0.000). However, the relationship between
chlorophyll-aand TN was stronger (Figure 4; Table
7). In addition, the GLM was also used to look at
the effect of marsh and month on the variation of
TP and TN. In this case the analyses revealed no
significant relationships (Table 7).
Based on the history of the eight marshes the t- test
analysis shows that the three groups of marshes are
different based on some water physical and
chemical parameters, TP and TN concentrations
(Table 8). The analysis shows that the undisturbed
marsh (Al-Udhaim) is significantly different from
the marshes that are close to the rivers and partially
dried (Al-Souda north, Um Al-Niaaj, and Um Al-
Warid) in light penetration, TSS, and TP. In
addition, Al-Udhaim is also significantly different
from the completely dried marshes (Al-Souda
south, Al-Baydha, Lissan Ijerda, and Majnoon) in
salinity, LP, TSS, TN, and chlorophyll-a.
The variation of TP and TN between the selected
marshes indicates that the southern marshes are
high in TN comparing to the undisturbed marsh
(Figure 5). On the other hand, the partially dried
marshes have the highest concentration of TP
among the other marshes. As a result, the
phytoplankton productivity as it presented by
chlorophyll-a is higher in the southern marshes
than the undisturbed marsh.
1.5 Discussion
1.5.1 Phosphorus and nitrogen dynamics
Natural and artificial impacts likely influenced the
TP and TN variation within Al-Hawizeh
marshland. Rivers are the main natural factors
influenced the TP and TN variation within Al-
Hawizeh, especially in the marshes that have direct
water supply (Hussain, 1994). For example, the
high concentration of TP and TN found in the Um
Al-Warid marsh is mostly contributed to its direct
water inputthat affect by chemical fertilizers, which
were applied heavily during the study period,
especially when the farmers prepare their farms for
sowing crops (IMWR-CRIM, 2006). Vegetation
cover is also a main factor that effects the variation
of TP and TN in Al-Hawizeh (Alwan, 1994). The
density and variation of plants species among the
seasons have a major impact on the TP and TN in
which P and N concentrations will vary depend on
the efficiency by removal plants and/or
complexation(Hambrightet al., 1998; Zoharyet al.,
1998; Radwan, 2005; Kraket al., 2006).
Constructed embankments are the main artificial
factors influencing the P and N variation in Al-
Hawizeh marshland. The field observations
indicate that these embankments have a major
influence on water currents and the circulation of
water. These embankments divide the marshland
into many parts and isolate them from the
wholeecosystem (UNEP, 2001). The embankments
can slow water currents and thus lead to inefficient
nutrient circulation. This will eventually affect the
P and N transportation between the marshes
(Mahamed, 2008). The inefficient P and N
circulation could affect the vegetation cover and
water quality in Hour Al-Hawizeh.
TP and TN concentrations exhibited different
seasonal patterns among the marshes during the
study period. Temporal variation of P and N
fractions in the eight marshes indicates that DIP
and DIN concentrations were low in spring, which
is mainly due to uptake by plants during the
growing season (Gophen2000;Okbah, 2005;
Panigrahiet al., 2007). DOP and DON are present
in high concentrations in late spring and reach their
highest level in summer. This is likely because of
the increased bacterial decomposition of dead
phytoplankton and macrophytes, which is enhanced
by the increase in temperature (Gophen, 2000). The
increase in evaporation and decrease in water level
also affects the TP and TN concentration in
summer (Karhet al., 2006). In winter, the increase
of TP and TN is mainly due to the low plant uptake
(Hussain, 1994). PP concentration was lower than
the PN concentration within the marshes during the
study period. This is could be due to two reasons:
first, it might relate to the low amount of P-
containing particles actually entering the system, or
the suspended particulate matter in top sediment
International Journal of Management Sciences and Business Research, 2013 Vol. 2, Issue 5. (ISSN: 2226-8235)
http://www.ijmsbr.com Page 34
layer is nitrogen rich. It is well known that N
content in living organisms is much higher than P
and eventually, after the decay of these organisms,
the released amount of N will be higher than P.
Second, it could be that the rate of PP solubilization
into DOP or DIP is higher than for PN
solubilization into DOP or DON, which could be
true because the concentration of DOP and DIP are
also lower than DON and DIN.
In this study, an extremely high concentration of
TP and TN was found in some of the marshes. This
is mainly because of the differences between
marshes location and hydrological history. For
example, TP and TN concentrations are likely
influences by the rivers, especially in the marshes
located close to water inputs. The differences
between each inlet in nutrient eventually will have
a significant impact on the vegetation cover in
these marshes (Mahamed, 2008). For example, the
high average concentration of TP and TN in Um
Al-Warid marsh was likely due to the impact of its
water input; and the high concentration of TN in
the southern marshes, especially PN, was either due
to the wide fluctuation of the water column depth
within the seasons that led to re-suspension the top
sediment layer, as I observed in the Majnoon
marsh, or due to the density of plankton as I
observed in the Lissan Ijerda marsh (Mahamed,
2008).
P and N concentrations in some of the pre-
desiccation studies of the Mesopotamian marshes
were within the range of P and N concentrations
that I found during my study (Hussain, 1994).
However, higher concentrations of P and N
fractions were found in different pre-desiccation
studies (Hussain, 1994). In addition, concentrations
of P and N fractions in my study were close to
some of the recent studies that were done in the
Mesopotamian marshes after re-flooding (USAID,
2006) where some of the pre-inundation studies
indicated higher values of P and N within the
Mesopotamian marshes than found in this study
(Richardson et al., 2005; Richardson &Hussain,
2006, USAID, 2006).
1.5.2 Chlorophyll-a variation in Hour Al-
Hawizeh
The difference in the seasonal variation of the
chlorophyll-a between the eight marshes of Al-
Hawizeh was likely dependent on their location and
vegetation cover (Alwan, 1994). It may be also
associated with the ability of these marshes to
provide appropriate conditions for phytoplankton
growth. The temporal variations of chlorophyll-ain
were strongly influenced by the water temperature.
The highest concentration of chlorophyll-a was
observed in summer (July to September 2006)
reflecting the highest peak of phytoplankton mass
(Zoharyet al., 1998; Benson-Evans et al., 1999).
Phytoplankton can tolerate a certain temperature;
when the water temperature becomes greater than
35 °C, phytoplankton growth declines (Alwan,
1994). In fall, the slight decrease of the temperature
stimulates phytoplankton to grow again and may
have led to the increase the chlorophyll-a (Alwan,
1993). This situation does not last long, and
biomass decreases when the temperature drops to
<10 °C in winter. Also the variation of chlorophyll-
a was influenced by the availability of TP and TN
within the marshes. For example, the high amount
of chlorophyll-a found in the Majnoon and lissan
Ijerda marshes is related to the high concentrations
of TN, while the low concentrations of TP and TN
in Al-Baydha marsh could be a reasons behind the
low amount of chlorophyll-a in this marsh. Light
penetration is also a main factor that could affect
the variation of chlorophyll-a (Yaqoub, 1994;
Radwan, 2005). Turbid water conditions affect the
light penetration which is very important for
phytoplankton growth, and thus decrease the
amount of chlorophyll-a. In this study, the average
concentrations of chlorophyll-a in Al-Hawizeh
marshland were low compared to other studies
done in the Mesopotamian marshes and other
similar wetlands (Zoharyet al., 1998; Gophen,
2000; Radwan, 2005).
Chlorophyll-a variation in the eight marshes
responded differently to TP and TN concentrations.
In this study, there was relationship between
chlorophyll-a and TP and TN, but this relation is
relatively weak. This is mainly because the
differences between TP and TN within in different
parts of Al-Hawizeh (IMWR-CRIM, 2006). Low
concentrations of TP and TN and poor water
quality conditions could also affect the strength of
the relationship. Different studies found significant
relationships between phytoplankton biomass
(chlorophyll) and P and N concentrations (Gophen,
2000; Kufel, 2001; Panigrahiet al., 2007). Light
limitation or grazing could also affect the
relationship between chlorophyll-a and TP and TN.
The study by Radwan (2005) found chlorophyll-a
concentrations were correlated to water quality
parameters (water temperature, transparency, and
dissolved oxygen) and P. In Kufel (2001) study, the
concentration of chlorophyll-a was not correlated
to either P or N concentration in the mesotrophic
Great Masurian Lakes, while chlorophyll-a was
correlated to the P and N concentration in the
eutrophic lakes. Zooplankton grazing could also be
a reason for poor chlorophyll-nutrient relationship
(Kufel, 1999, Kufel, 2001).
Since phytoplankton biomass (chlorophyll-a)can
reflect the productivity of the marshlandit also can
reveal the restoration process of the system. The
undisturbed marsh is low in chlorophyll-a, which
means low productive. This is mainly because of
the low concentration of P and N in this marsh. The
high amount chlorophyll-a in some of the
completely dried marshes reflect the success of
International Journal of Management Sciences and Business Research, 2013 Vol. 2, Issue 5. (ISSN: 2226-8235)
http://www.ijmsbr.com Page 35
restoration process, especially in the Lissan Ijerda
and Majnoon marshes. This is mainly because these
marshes have high concentrations of TP and TN
(Mahamed, 2008). Rivers also affect the restoration
process of the marshes that located close their input
by the amount of P and N load. Although TP and
TN were available in the Al-Baydha marsh, the
amount of chlorophyll-a was so low which slow the
restoration of this marsh. It is hard to judge whether
the low concentrations of chlorophyll-a in the Al-
Baydha marsh was related to the poor water quality
conditions or to the lack of P and N. This issue
could be an interesting point to focus on in the
future studies.
1.6 Conclusions
The study indicate that each marsh within Al-
Hawizeh is a well-mixed aquatic system since there
are no significant differences between the water
quality parameters between surface and near
bottom water samples.The temporal and spatial
variations of TP and TN concentrations in Al-
Hawizeh were likely influenced by natural (water
input, vegetation cover) and artificial (constructed
embankments) impacts. There was a relationship
between chlorophyll-a and both TP and TN
concentrations;however, the relationship between
chlorophyll-a and TN concentration was stronger
than TP. The success of the restoration process of
Al-Hawizeh varied among the different marshes
according to the hydrology and the drying history
of the marsh.The significant differences among the
marshes in Al-Hawizeh suggest that this marshland
system is not a one homogeneous system as used to
be pre desiccation period and the main reason can
be due to the constructed embankments that divide
the marshland into several parts and isolate some of
these parts completely from being a one active
ecosystem as it should be.
1.7 References
Alwan A. 1994. Aquatic plants of southern marshes
of Iraq, pp 127-144.
Benson-Evans, K., Antoine R., and Antoine S.
1999.Studies of the water quality and
algae of Liangorse Lake.Aquatic
Conservation: Marine and Freshwater
Ecosystems9:425–439.
Dillon, P. J. and Rigler, F. H. 1974.The
phosphorus-chlorophyll relationship in
lakes.Limnol.Ocen.19 (5): 767-773.
Fustec, E., Boët, P., Amezal, A., and Fauchon, N.
1999.Methodology for multifunctional
assessment of riverine wetlands in the
Seine River basin.Hydrobiologia410:
213–221.
Gophen M. 2000. Nutrient and plant dynamics in
Lake Agmon Wetlands (Hula Valley,
Israel): A review with emphasis on
Typhadomingensis (1994-1999).
Hydrobiologia441: 25–36.
Hambright, K. D., Bar-Ilan, I., and Eckert, W.
1998.General water chemistry and quality
in a newly-created subtropical wetland
lake.Wetlands Ecol. & Manage.6: 121-
132.
Hussain N. 1994. Ahwar of Iraq: An
Environmental Approach. Marine Science
Center, Basra, Iraq.pp 298. (in Arabic).
Iraqi Ministry of Water Resources-Centre for the
Restoration of Marshes (IMWR-CRIM)
2006.Studying the rehabilitation of Al-
Hawizeh marsh ecological system.Volume
1, pp 79 and Volume 2, pp 62.
Krah, M., McCarthy, T. S., Huntsman-Maphila, P.,
Wolski, P., Annegarn H.; and Sethebe, K.
2006.Nutrient budget in the seasonal
wetland of the Okavango Delta,
Botswana.Wet. Ecol. Manage.14:253 –
267.
Kufel, L. 1999. Dimicticversus polymicticmasurian
lakes: similarities and differences in
chlorophyll-nutrients–SD relationships.
Kluwer Academic
Publishers.Hydrobiologia.408/409: 389–
394.
Kufel, L. 2001. Uncoupling of chlorophyll and
nutrients in lakes–possible reasons,
expected consequences.Kluwer Academic
Publishers.Hydrobiologia.443: 59–67.
Lorenzen, C. J. 1967. Determination of chlorophyll
and pheopigments: Spectrophotometric
equations. Limnol.Oceanogr.12: 343-346.
Mahamed, 2008.Phosphorus and nitrogen in Al-
Hawizeh wetland, southern Iraq. MSc.
Thesis, University of Waterloo, Canada
McCauley, E.; Downing,A.; and Watson, S. 1989.
Sigmoid relationships between nutrients
and chlorophyll among lakes.Can. j.
Fish.Aquat. Sci.46: 1171-1175.
Menzel, D. W. and Corwin, N. 1965.The
measurement of total P in seawater based
on the liberation of organically bound
fractions by persulfate
oxidation.Limnol.Oceanogr.10: 280-282.
Mitsch W. J. and Gosselink J. G. (3 Ed.) 2000.
Wetlands. Van Nostrand Reinhold, New
York, pp 920.
Okbah, M. 2005. Nitrogen and phosphorus species
of Lake Burullus water (Egypt). Egyptian
J. Aq. Res. 31 (1): 186–191.
Panigrahi, S., Acharya, B. C., Panigrahy, R. C.,
Nayak, B. K., Banarjee, K., and Sarkar, S.
K. 2007. Anthropogenic impact on water
quality of Chilika lagoon RAMSAR site:
A statistical approach. Wet. Ecol.
Manage.,15:113–126.
UNEP, H. 2001. The Mesopotamian Marshlands:
Demise of an Ecosystem, Division of
International Journal of Management Sciences and Business Research, 2013 Vol. 2, Issue 5. (ISSN: 2226-8235)
http://www.ijmsbr.com Page 36
Early Warning and Assessment, United
Nations Environment Program (UNEP)
Nairobi, Kenya. pp 46.
Prairie, T., Duarte, C. M., and Kalff I.,
1989.Unifying nutrient-chlorophylI
relationships in lakes.Can. I. Fish.
Aquat.Scie.46: 1176-1182.
Radwan, A. M. 2005. Some factors affecting the
primary production of phytoplankton in
Lake Burullus. Egyptian J. Aq. Res. 31(2):
72-88.
Richardson, C. J. and Hussain, N. A.
2006.Restoring the Garden of Eden: An
Ecological Assessment of the Marshes of
Iraq.Science (Bio), 56 (6): 477-488.
Richardson, C. J. Reiss, P., Hussain, N. A.,
Alwash, A. J., Pool, D. J. 2005. The
restoration potential of the Mesopotamian
marshes of Iraq.Scie.307: 1307-1310.
Smith, V. H. 1982. The nitrogen and phosphorus
dependence of algal biomass in lakes: an
empirical and theoretical analysis.
Limnol.Oceanogr.27: 1101-1112.
Stainton, M. P., Capel, M. J., and Armstrong, F. A.
J. (2 Ed.) 1977. The chemical analysis of
fresh water. Can. Fish. Mar. Serv. Misc.
Spec. Publ. No. 25:1-255.
United States Agency for International
Development (USAID) 2006.Iraq
Marshlands Restoration Program.Final
Report. Volume 4, Changes in soil and
water characteristics of the marshes. pp
60.
Valderrama, J. C. 1981. The simultaneous analysis
of total nitrogen and total phosphorus in
natural waters.Mar. Chem.10:109-122.
Wetzel, R. G. (3 Ed.) 2001. Limnology: lake and
river ecosystem. The nitrogen cycle,
Chapter 7: 205-23. Elesvier Science
(USA).
Wetzel, R. G. and Likens, G. E. (2 Ed.) 1991.
Limnological analyses, 81-106. Springer-
Verlag, New York.
Yaqoub, A. 1992.Algae of southern Iraq marshes,
145-149. In: Ahwar of Iraq: An
Environmental Approach. Marine Science
Center, Basra University, Hussein, N. A.
(Ed.) 1992. (in Arabic)
Zimmermann, C. F. and Keefe, C. W.
1997.Determination of Carbone and
Nitrogen in Sediment and Particulate of
Estuarine /Coastal Water using Elemental
Analysis.National Exposure Research
Laboratory.US.EPA.Method
440.0.Revision 1.4.
Zohary, T., Fishbein, T., Kaplan, B., and
Pollingher, U. 1998.Phytoplankton-
metaphyton seasonal dynamics in a newly-
created subtropical wetland lake.Wet.
Ecol.Manage6: 133–14.
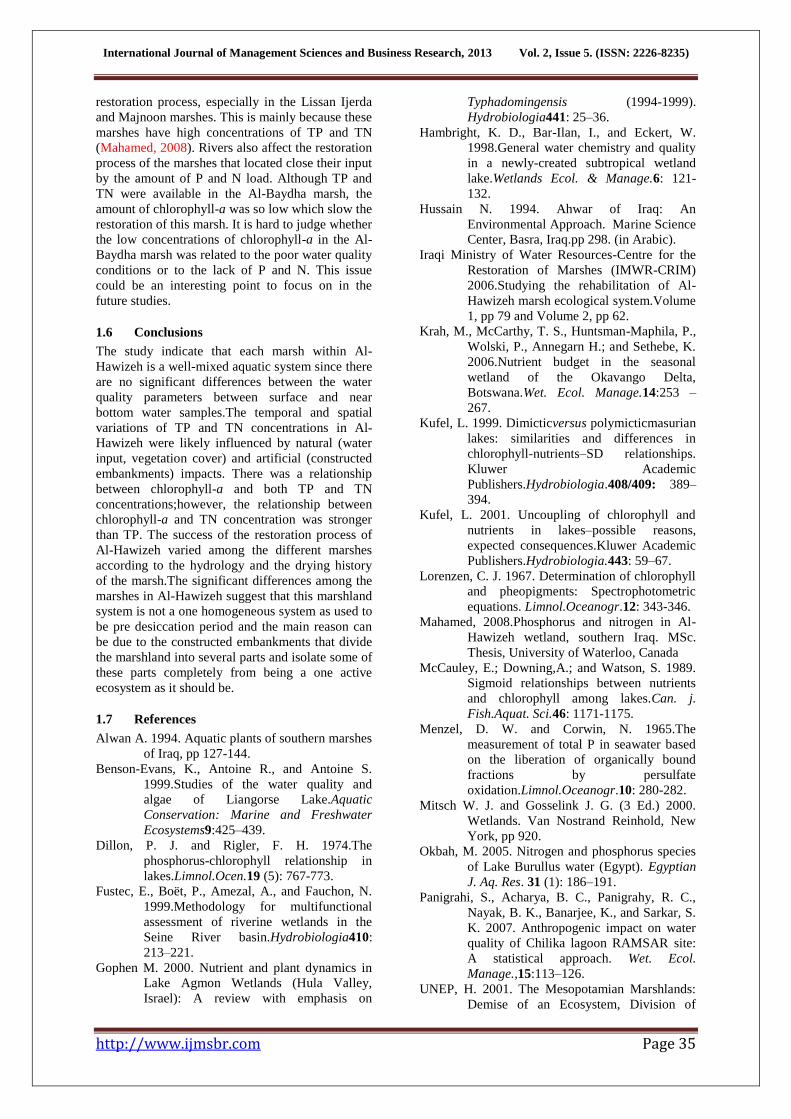
Table 1: ecological characteristics of the studied marshes of Al-Hawizeh during the study period from May
2006 to April 2007 and the hydrological status of each marsh during the desiccation period.
Marsh Coordinat
es
Siz
e
Hydrolo
gy
Physical
characterist
ics
Vegetation
Status
during
desiccati
on
Al-
Udhai
m
31˚41'30"
N
47˚46'35"
E
10
0
km2
Revrine
marsh
system
Deep, open
water and
inundated
plains of
fresh water
Potamogetoncrispus, Najas minor,
Phragmitesaustralis. Ever-wet
Al-
Souda
north
31˚40'23"
N
47˚40'0" E
70
km2
Revrine
marsh
system
Shallow
inundated
plains of
fresh water
Potamogetoncrispus,Ceratophyllumde
mersum
Semi
dried
Umm
Al-
Niaaj
31˚36'0" N
47˚37'20"
E
30
0
km2
Revrine
marsh
system
Deep, open
water and
inundated
plains of
fresh water
Phragmitesaustralis,
Ceratophyllumdemersum,
Potamogetonleucenus, Najas minor
Semi
dried
Um Al-
Warid
31˚34'47"
N
47˚31'7" E
50
km2
Revrine
marsh
system
Deep,
inundated
plains of
fresh water
Potamogeton sp., Potamogetoncrispus,
Phragmitesaustralis
Complete
ly dried
Al-
Souda
south
31˚25'15"
N
47˚36'56"
E
50
km2
Seasonal
water
flow
Shallow,
seasonal
inundated
plains of
fresh water
Phragmitesaustralis, Najas minor Complete
ly dried
Al- 31˚22'1" N 30 Annual Open water Myriophyllumspicatum Complete
International Journal of Management Sciences and Business Research, 2013 Vol. 2, Issue 5. (ISSN: 2226-8235)
http://www.ijmsbr.com Page 37
Baydha 47˚38'46"
E
km2
water
flow
area,
seasonal
inundated
plains of
fresh water
ly dried
Lissan
Ijerda
31˚17'27"
N
47˚34'37"
E
30
0
km2
Annual
water
flow
Shallow,
inundated
plains of
fresh water
Phragmitesaustralis, Najas minor Complete
ly dried
Majnoo
n
31˚7'59" N
47˚35'33"
E
20
0
km2
Annual
water
flow
Shallow,
inundated
plains of
fresh water
Phragmitesaustralis,
Myriophyllumspicatum
Complete
ly dried
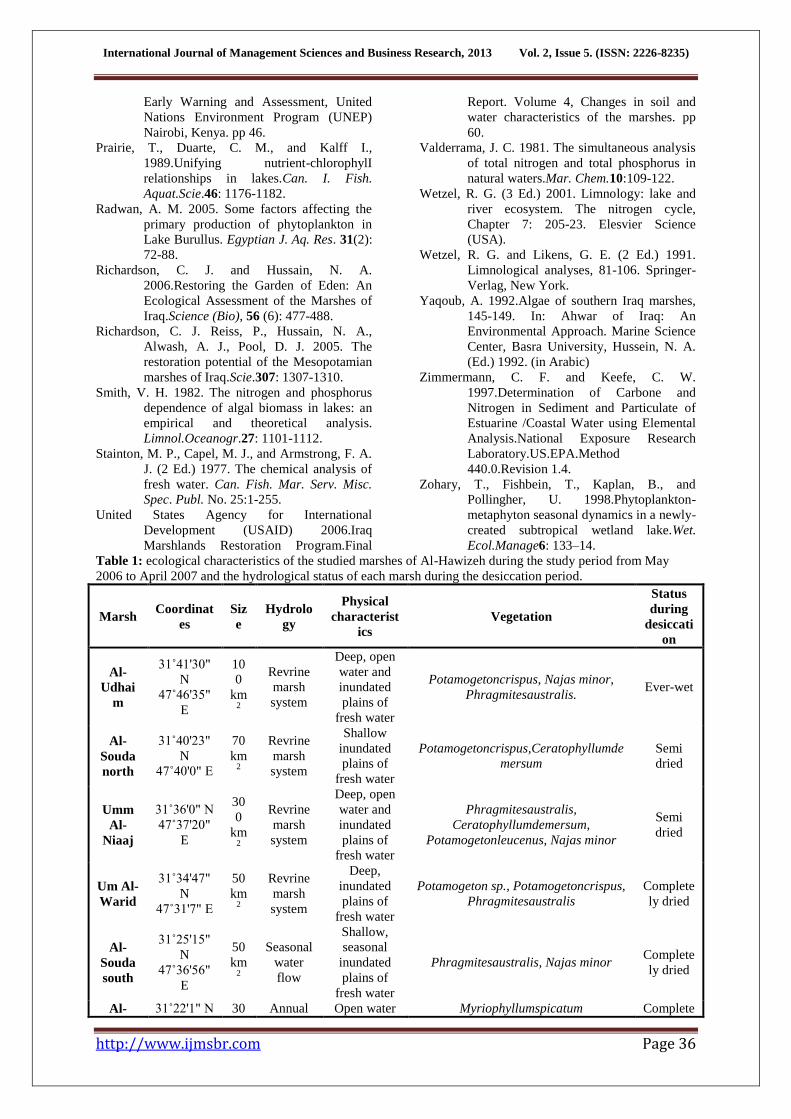
Table2:Average and range of monthly water temperature (WT), salinity, dissolved oxygen (DO), pH, total
suspended solids (TSS), light penetration (LP), and water column depth (WCD) in the selected marshes of Al-
Hawizeh from May 2006 to April 2007.
Udhai
m
Souda
north
Um Al-
Niaaj
Um Al-
Warid
Souda
south Baydha
Lissan
Ijerda
Majnoo
n
WT
°C
average 21.9 22.2 22.7 21.1 22.1 21.6 22.2 22.9
range 10.0-
31.9
10.1-
31.5
10.9-
31.6 9.4-31.1 9.8-31.1 9.6-31.5 9.9-33.0
10.7-
32.2
Salinity
ppt
average 0.7 0.7 0.6 0.5 0.9 0.9 1.4 1.1
range 0.5-0.9 0.5-1.0 0.4-0.9 0.2-0.8 0.6-1.3 0.6-1.1 1.0-1.8 0.9-1.3
DO
mg/l
average 7.4 6.5 9.2 7.8 2.1 7.1 7.7 7.0
range 5.2-10.6 1.7-9.2 6.1-11.8 5.4-11.1 0.3-7.9 4.8-9.0 4.1-10.0 0.9-11.5
pH average 7.8 7.7 8.2 8.1 7.2 7.8 8.1 8.1
range 7.5-8.3 7.3-8.0 7.9-8.6 7.9-8.6 6.6-7.6 7.5-8.1 7.5-8.5 6.7-8.5
TSS
mg/l
average 1.6 2.3 1.5 10.3 4.6 3.0 4.8 70.5
range 0.3-2.9 0.2-7.7 0.4-2.7 2.0-20.5 1.2-24.8 1.5-6.7 1.5-1.-1 0.6-
219.3
LP
cm
average 190 250 230 130 50 230 220 140
range 170-220 200-310 210-250 50-250 50-180 190-300 130-340 30-80
WCD
m
average 2.1 2.6 2.4 2.3 2.4 2.4 1.7 1.5
range 1.7-2.5 2.2-3.1 2.1-2.7 2.0-2.7 1.0-2.1 1.9-3.0 1.3-3.4 1.0-2.5
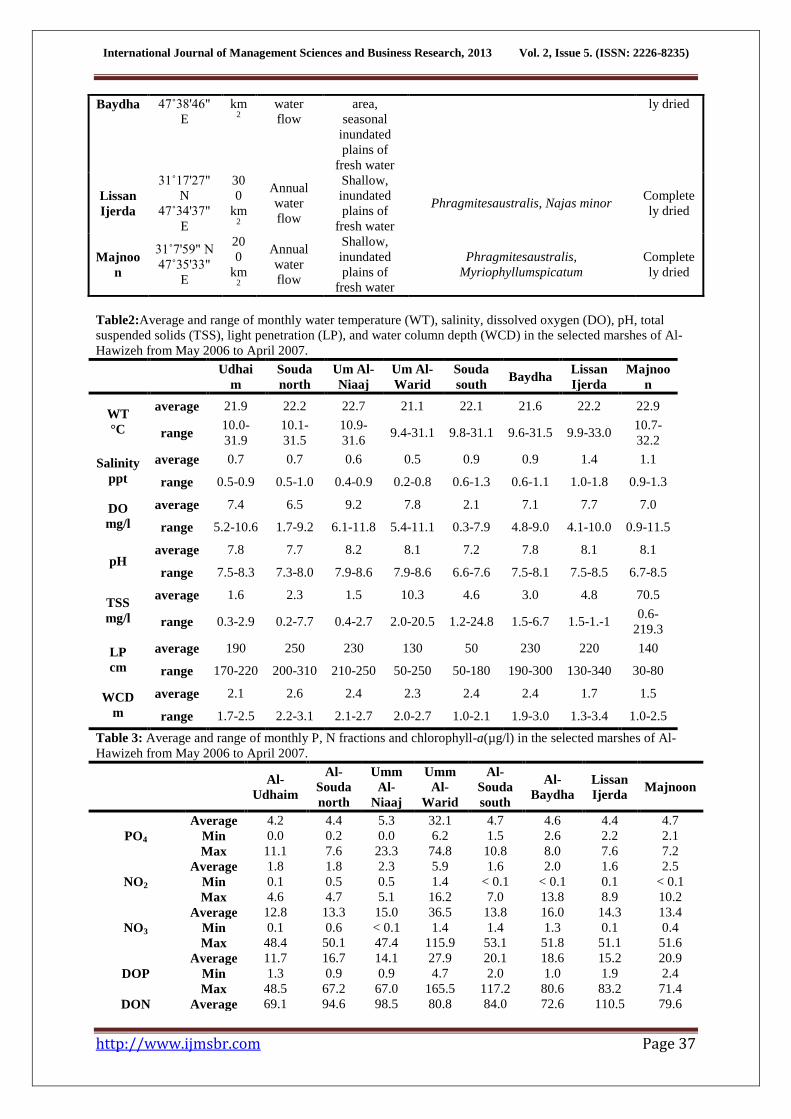
Table 3: Average and range of monthly P, N fractions and chlorophyll-a(µg/l) in the selected marshes of Al-
Hawizeh from May 2006 to April 2007.
Al-
Udhaim
Al-
Souda
north
Umm
Al-
Niaaj
Umm
Al-
Warid
Al-
Souda
south
Al-
Baydha
Lissan
Ijerda Majnoon
PO4
Average 4.2 4.4 5.3 32.1 4.7 4.6 4.4 4.7
Min 0.0 0.2 0.0 6.2 1.5 2.6 2.2 2.1
Max 11.1 7.6 23.3 74.8 10.8 8.0 7.6 7.2
NO2
Average 1.8 1.8 2.3 5.9 1.6 2.0 1.6 2.5
Min 0.1 0.5 0.5 1.4 < 0.1 < 0.1 0.1 < 0.1
Max 4.6 4.7 5.1 16.2 7.0 13.8 8.9 10.2
NO3
Average 12.8 13.3 15.0 36.5 13.8 16.0 14.3 13.4
Min 0.1 0.6 < 0.1 1.4 1.4 1.3 0.1 0.4
Max 48.4 50.1 47.4 115.9 53.1 51.8 51.1 51.6
DOP
Average 11.7 16.7 14.1 27.9 20.1 18.6 15.2 20.9
Min 1.3 0.9 0.9 4.7 2.0 1.0 1.9 2.4
Max 48.5 67.2 67.0 165.5 117.2 80.6 83.2 71.4
DON Average 69.1 94.6 98.5 80.8 84.0 72.6 110.5 79.6
International Journal of Management Sciences and Business Research, 2013 Vol. 2, Issue 5. (ISSN: 2226-8235)
http://www.ijmsbr.com Page 38
Al-
Udhaim
Al-
Souda
north
Umm
Al-
Niaaj
Umm
Al-
Warid
Al-
Souda
south
Al-
Baydha
Lissan
Ijerda Majnoon
Min < 0.1 < 0.1 < 0.1 < 0.1 < 0.1 < 0.1 < 0.1 < 0.1
Max 288.2 571.9 483.8 390.9 421.8 328.7 622.5 346.8
PP
Average 2.6 3.1 3.4 8.5 1.8 2.0 5.2 9.8
Min 1.0 1.3 1.7 1.1 0.5 0.0 2.2 0.6
Max 4.7 12.0 9.3 16.1 3.2 4.6 10.7 20.8
PN
Average 91.5 90.7 85.1 129.5 66.9 92.6 181.7 628.2
Min 31.0 29.0 33.8 31.0 23.0 23.0 59.0 188.0
Max 181.0 174.0 178.0 230.0 167.0 267.0 483.0 1342.0
TP
Average 18.6 24.0 22.4 68.4 26.6 25.1 24.0 38.3
Min 6.9 2.0 3.6 18.5 8.4 6.0 8.1 13.6
Max 57.5 72.6 76.7 184.0 122.8 89.6 100.0 89.6
TN
Average 146.0 182.8 160.7 225.8 123.6 160.4 249.0 711.7
Min 44.8 66.6 55.5 50.6 41.8 40.7 76.8 250.8
Max 462.4 751.8 675.9 580.4 502.6 510.2 561.3 1352.0
Chlorophyll-a
Average 1.7 1.9 1.4 3.7 1.0 0.8 4.2 11.7
Min 0.3 0.3 0.4 0.1 0.1 <0.1 0.4 1.6
Max 5.7 8.7 2.7 14.0 3.6 3.2 11.6 26.2
Table 4:Pearson correlation coefficients between chlorophyll-a and water temperature (WT), dissolved oxygen
(DO), light penetration (LP), total phosphorus (TP), total nitrogen (TN), orthophosphate (PO4), nitrite (NO2),
and nitrate (NO3) in the selected marshes of Al-Hawizeh from May 2006 to April 2007.
WT DO LP TP TN PO4 NO2
NO3
Al-Udhaim 0.7 -0.6 -0.8 0.0 -0.2 0.4 0.2 -0.1
Al-Souda north 0.6 -0.3 -0.7 -0.3 -0.2 -0.1 0.5 0.0
Um Al-Niaaj 0.5 0.1 -0.5 0.7 -0.4 0.3 -0.2 0.5
Um Al-Warid 0.6 0.4 -0.1 0.1 0.3 -0.4 0.5 0.8
Al-Souda south 0.4 -0.3 -0.2 0.1 -0.2 0.4 -0.3 0.6
Al-Byadha -0.4 0.1 0.4 0.3 0.1 -0.3 -0.3 -0.3
Lissa Ijerda 0.8 -0.7 -0.4 0.5 0.1 0.4 0.3 0.4
Majnoon 0.4 0.1 -0.5 -0.1 0.8 0.3 -0.4 -0.2
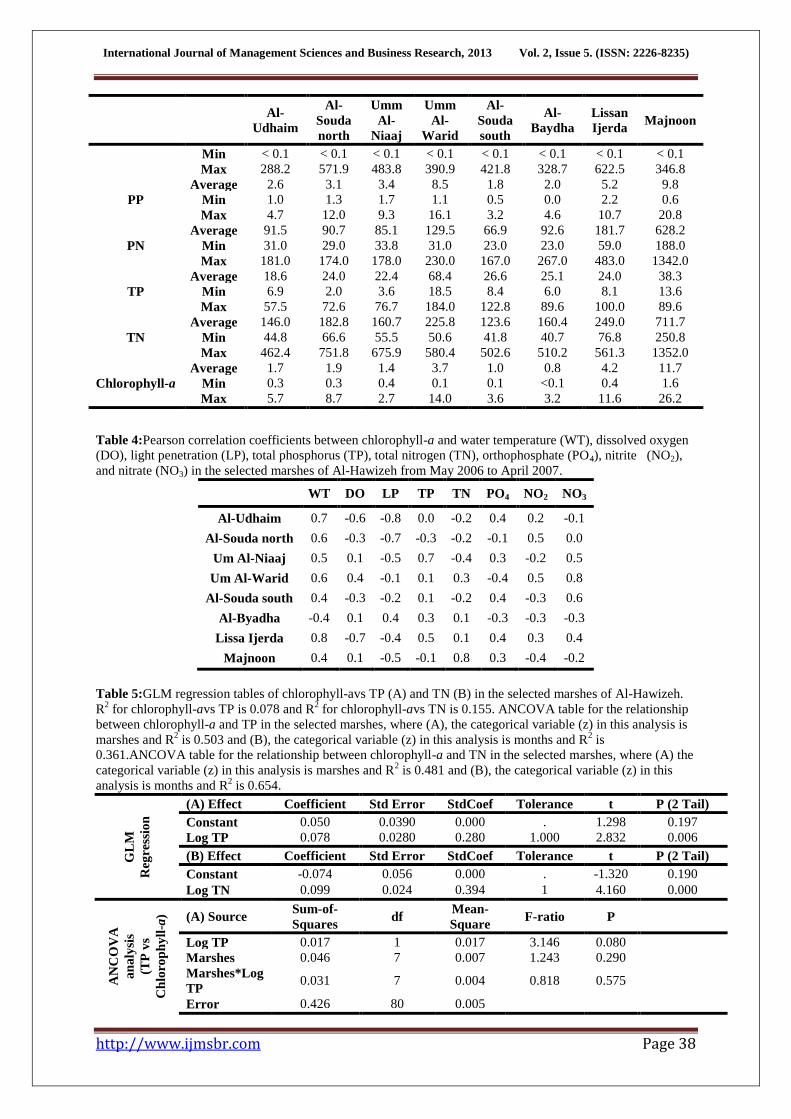
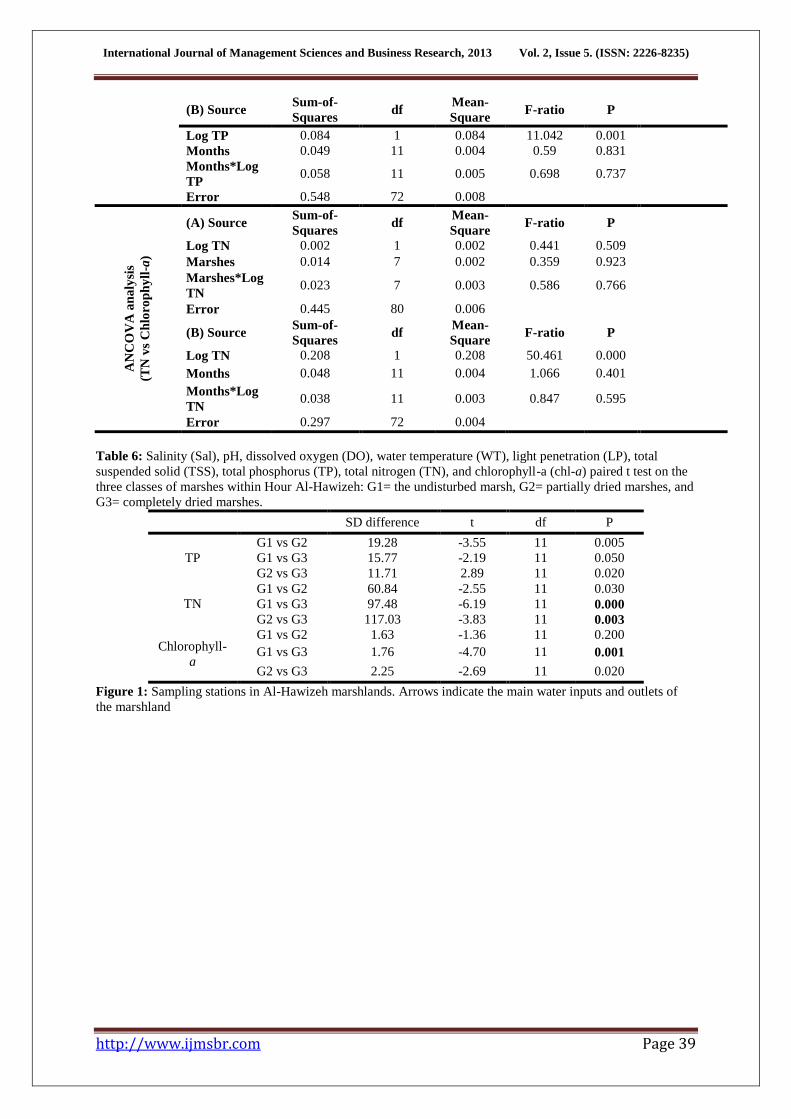
Table 5:GLM regression tables of chlorophyll-avs TP (A) and TN (B) in the selected marshes of Al-Hawizeh.
R2 for chlorophyll-avs TP is 0.078 and R
2 for chlorophyll-avs TN is 0.155. ANCOVA table for the relationship
between chlorophyll-a and TP in the selected marshes, where (A), the categorical variable (z) in this analysis is
marshes and R2 is 0.503 and (B), the categorical variable (z) in this analysis is months and R
2 is
0.361.ANCOVA table for the relationship between chlorophyll-a and TN in the selected marshes, where (A) the
categorical variable (z) in this analysis is marshes and R2 is 0.481 and (B), the categorical variable (z) in this
analysis is months and R2 is 0.654.
GL
M
Reg
ress
ion
(A) Effect Coefficient Std Error StdCoef Tolerance t P (2 Tail)
Constant 0.050 0.0390 0.000 . 1.298 0.197
Log TP 0.078 0.0280 0.280 1.000 2.832 0.006
(B) Effect Coefficient Std Error StdCoef Tolerance t P (2 Tail)
Constant -0.074 0.056 0.000 . -1.320 0.190
Log TN 0.099 0.024 0.394 1 4.160 0.000
AN
CO
VA
an
aly
sis
(TP
vs
Ch
loro
ph
yll
-a) (A) Source
Sum-of-
Squares df
Mean-
Square F-ratio P
Log TP 0.017 1 0.017 3.146 0.080
Marshes 0.046 7 0.007 1.243 0.290
Marshes*Log
TP 0.031 7 0.004 0.818 0.575
Error 0.426 80 0.005
International Journal of Management Sciences and Business Research, 2013 Vol. 2, Issue 5. (ISSN: 2226-8235)
http://www.ijmsbr.com Page 39
(B) Source Sum-of-
Squares df
Mean-
Square F-ratio P
Log TP 0.084 1 0.084 11.042 0.001
Months 0.049 11 0.004 0.59 0.831
Months*Log
TP 0.058 11 0.005 0.698 0.737
Error 0.548 72 0.008
AN
CO
VA
an
aly
sis
(TN
vs
Ch
loro
ph
yll
-a)
(A) Source Sum-of-
Squares df
Mean-
Square F-ratio P
Log TN 0.002 1 0.002 0.441 0.509
Marshes 0.014 7 0.002 0.359 0.923
Marshes*Log
TN 0.023 7 0.003 0.586 0.766
Error 0.445 80 0.006
(B) Source Sum-of-
Squares df
Mean-
Square F-ratio P
Log TN 0.208 1 0.208 50.461 0.000
Months 0.048 11 0.004 1.066 0.401
Months*Log
TN 0.038 11 0.003 0.847 0.595
Error 0.297 72 0.004
Table 6: Salinity (Sal), pH, dissolved oxygen (DO), water temperature (WT), light penetration (LP), total
suspended solid (TSS), total phosphorus (TP), total nitrogen (TN), and chlorophyll-a (chl-a) paired t test on the
three classes of marshes within Hour Al-Hawizeh: G1= the undisturbed marsh, G2= partially dried marshes, and
G3= completely dried marshes.
SD difference t df P
TP
G1 vs G2 19.28 -3.55 11 0.005
G1 vs G3 15.77 -2.19 11 0.050
G2 vs G3 11.71 2.89 11 0.020
TN
G1 vs G2 60.84 -2.55 11 0.030
G1 vs G3 97.48 -6.19 11 0.000
G2 vs G3 117.03 -3.83 11 0.003
Chlorophyll-
a
G1 vs G2 1.63 -1.36 11 0.200
G1 vs G3 1.76 -4.70 11 0.001
G2 vs G3 2.25 -2.69 11 0.020
Figure 1: Sampling stations in Al-Hawizeh marshlands. Arrows indicate the main water inputs and outlets of
the marshland
International Journal of Management Sciences and Business Research, 2013 Vol. 2, Issue 5. (ISSN: 2226-8235)
http://www.ijmsbr.com Page 40
International Journal of Management Sciences and Business Research, 2013 Vol. 2, Issue 5. (ISSN: 2226-8235)
http://www.ijmsbr.com Page 41
Figure 2:Monthly variation of TP, TN and chlorophyll-aconcentrationsin the selected marshes of Al-Hawizeh
(error bars= standard error)
Continued figure 2
May 0
6
Jun 06
Jul 06
Aug 06
Sep 06
Oct 0
6
Nov 06
Dec 06
Jan 07
Feb 07
Mar 0
7
Apr 07
TP
co
nce
ntr
atio
ns
( g
/l)
0
50
100
150
200
250
May 0
6
Jun 06
Jul 06
Aug 06
Sep 06
Oct 0
6
Nov 06
Dec 06
Jan 07
Feb 07
Mar 0
7
Apr 07
PO
4- co
nce
ntr
atio
n (
g/l)
0
20
40
60
80
100
May
06
Jun 06
Jul 06
Aug 0
6
Sep 06
Oct 0
6
Nov 0
6
Dec 0
6
Jan 07
Feb 07
Mar 0
7
Apr 0
7
PP
co
ncen
trati
on
s (
g/l)
0
5
10
15
20
25
May
06
Jun 0
6
Jul 0
6
Aug 0
6
Sep 0
6
Oct
06
Nov
06
Dec
06
Jan 0
7
Feb 0
7
Mar
07
Apr 0
7
DO
P c
on
ce
ntr
ati
on
s (
g/l
)
0
50
100
150
200
250
may 0
6
Jun
06
Jul 0
6
Au
g 0
6
Sep
06
Oct
06
No
v 06
Dec 0
6
Jan 0
7
Feb
07
Mar
07
TN
co
nc
en
tra
tio
ns
(
g/l
)
0
200
400
600
800
1000
1200
1400
1600
Al-U dhaim
Al-Souda north
U m Al-N iaaj
U m Al-W arid
Al-Souda south
Al-B aydha
Lissan Ijerda
M ajnoon
may 0
6
Jun 06
Jul 06
Aug 06
Sep 06
Oct 0
6
Nov 06
Dec 06
Jan 07
Feb 07
Mar 0
7
Apr 07
NO
3
- co
ncen
trati
on
s (
g/l)
0
20
40
60
80
100
120
140
may 0
6
Jun 06
Jul 06
Aug 06
Sep 06
Oct 0
6
Nov 06
Dec 06
Jan 07
Feb 07
Mar 0
7
Apr 07
NO
2- co
nce
ntr
atio
ns
( g
/l)
0
2
4
6
8
10
12
14
16
18
may 0
6
Jun 06
Jul 06
Aug 06
Sep 06
Oct 0
6
Nov 06
Dec 06
Jan 07
Feb 07
Mar 0
7
Apr 07
DO
N c
on
cen
trat
ion
s (
g/l)
0
100
200
300
400
500
600
700
may 0
6
Jun 06
Jul 06
Aug 06
Sep 06
Oct 0
6
Nov 06
Dec 06
Jan 07
Feb 07
Mar 0
7
PN
co
nce
ntr
atio
ns
( g
/l)
0
200
400
600
800
1000
1200
1400
1600
International Journal of Management Sciences and Business Research, 2013 Vol. 2, Issue 5. (ISSN: 2226-8235)
http://www.ijmsbr.com Page 42
Udhaim
Souda south
Um Al-Niaaj
Um Al-Warid
Souda south
Baydha
Lissan Ijerda
Majnoon
Figure 4: The relationships between chlorophyll-a and TP and TN concentrations in the selected marshes of Al-
Hawizeh.
Figure 5:Monthly variation of TP, TN, and chlorophyll-a in the three marsh groups, ever-wet Al-Udhaim marsh
(blue line), semi-dried marshes and has direct water inputs (red line), and completely dried marshes (green line).
Apr 06
May 0
6
Jun 06
Jul 06
Aug 06
Sep 06
Non 06
Dec 06
Jan 07
Feb 07
Mar 0
7
Apr 07
chlo
rop
hyl
l-a c
on
cen
trat
ion
(g
/l)
0
5
10
15
20
25
30
Udhaim
Souda north
Um Al-Niaaj
Um Al-Warid
Souda south
Baydha
Lissan Ijerda
Majnoon