responses of rat p2x2 receptors to ultrashort pulses of atp provide insights into atp binding and...
TRANSCRIPT
The
Jour
nal o
f G
ener
al P
hysi
olo
gy
J. Gen. Physiol. © The Rockefeller University Press $15.00Volume 130 Number 2 August 2007 183–201http://www.jgp.org/cgi/doi/10.1085/jgp.200709779
183
A RT I C L E
Responses of Rat P2X2 Receptors to Ultrashort Pulses of ATP Provide Insights into ATP Binding and Channel Gating
Luciano Moffatt1,2 and Richard I. Hume1
1Department of Molecular, Cellular, and Developmental Biology, University of Michigan, Ann Arbor, MI 481092Instituto de Química Física de los Materiales, Medio Ambiente y Energía, Consejo Nacional de Investigaciones Científi cas y Técnicas, Facultad de Ciencias Exactas y Naturales, Universidad de Buenos Aires, Buenos Aires, 1428, Argentina
To gain insight into the way that P2X2 receptors localized at synapses might function, we explored the properties of outside-out patches containing many of these channels as ATP was very rapidly applied and removed. Using a new method to calibrate the speed of exchange of solution over intact patches, we were able to reliably produce applications of ATP lasting <200 μs. For all concentrations of ATP, there was a delay of at least 80 μs between the time when ATP arrived at the receptor and the fi rst detectable fl ow of inward current. In response to 200-μs pulses of ATP, the time constant of the rising phase of the current was 600 μs. Thus, most channel openings occurred when no free ATP was present. The current deactivated with a time constant of 60 ms. The amplitude of the peak response to a brief pulse of a saturating concentration of ATP was 70% of that obtained during a long application of the same concentration of ATP. Thus, ATP leaves fully liganded channels without producing an opening at least 30% of the time. Extensive kinetic modeling revealed three different schemes that fi t the data well, a sequential model and two allosteric models. To account for the delay in opening at saturating ATP, it was necessary to incor-porate an intermediate closed state into all three schemes. These kinetic properties indicate that responses to ATP at synapses that use homomeric P2X2 receptors would be expected to greatly outlast the duration of the synaptic ATP transient produced by a single presynaptic spike. Like NMDA receptors, P2X2 receptors provide the potential for complex patterns of synaptic integration over a time scale of hundreds of milliseconds.
I N T R O D U C T I O N
P2X receptors are ligand-gated cation channels with no
structural similarity to the nicotinic receptor family or
to the glutamate receptor family. Their natural agonist
is ATP, and P2X2, P2X4, and P2X6 receptors are broadly
expressed in the central nervous systems of vertebrates
(North, 2002). There is evidence that P2X2 receptors
may play a role in certain forms of LTP (Pankratov
et al., 2002) and in presynaptic facilitation at synapses
onto hippocampal interneurons (Khakh et al., 2003),
but the role of purine-gated channels at many synapses
in the mammalian central nervous system remains un-
clear. There is strong evidence that P2X2 receptors are
postsynaptic effectors at synapses in the enteric nervous
system (Ren et al., 2003).
To understand transmission at puringeric synapses it is
important to determine the response of these receptors
to pulses of neurotransmitter of duration comparable
to those occurring at synapses. Studies of other systems
indicate that neurotransmitters reach their receptors at
the postsynaptic membrane by diffusion in 0.1 ms or
less and their concentration drops with time constants
of hundreds of microseconds to a few milliseconds
(Land et al., 1984; Reid et al., 1998; Bartoletti et al., 1999;
Stiles et al., 1999; Diamond, 2001). The main mechanism
determining the dynamics of the neurotransmitter action
at the submillisecond time scale seems to be diffusion
(Stiles et al., 1999), which depends on the geometry of
the synaptic cleft (Bartoletti et al., 1999). At longer time
scales enzymatic cleavage is important for terminating
the action of acetylcholine (ACh) (Rogers et al., 1966)
and ATP (Westfall et al., 1996) while transmembrane
transport contributes to clearance of glutamate (Tong
and Jahr, 1994), glycine (Zafra et al., 1995), and GABA
(Hell et al., 1991). Once neurotransmitter is present
at an appreciable concentration, many ligand-gated chan-
nels open in the submillisecond range. For instance,
GABAA receptors can open at 1.8–6.7 ms−1 (Jayaraman
et al., 1999), glycine receptors at 2.2 ms−1 (Grewer,
1999), AMPA receptors at 9.5–80 ms−1 (Li et al., 2002;
Li et al., 2003), and nicotinic ACh receptors at 9.4 ms−1
(Matsubara et al., 1992). In contrast, NMDA receptors
have been reported to open much more slowly at
0.065 ms−1 (Banke and Traynelis, 2003), although single
channel analysis suggests that after accounting for pre-
opening states, the actual opening times are much faster
(Popescu and Auerbach, 2003). The opening rate of P2X
receptors has not been directly measured, although kinetic
analysis of P2X2 single channel recordings predicts a
value of 1.1 ms−1 (Ding and Sachs, 1999).
Correspondence to Luciano Moffatt: [email protected]
The online version of this article contains supplemental material.
Abbreviations used in this paper: ACh, acetylcholine; MWC, Monod,
Wyman, Changeux.
on March 15, 2016
jgp.rupress.orgD
ownloaded from
Published July 30, 2007
http://jgp.rupress.org/content/suppl/2007/07/30/jgp.200709779.DC1.html Supplemental Material can be found at:

184 Dynamic Responses of P2X2 Receptors
In this work we developed improved methods for ac-
curately determining the duration of brief applications
of transmitter to outside-out patches, and then directly
measured the responses of P2X2 receptors to very rapid
application and removal of ATP. In addition to provid-
ing insight into the expected duration of synaptic re-
sponses, these data allowed us to test kinetic models for
the transitions between states. These data suggest the
presence of an intermediate closed state between the
fully liganded channel and the open state, as has re-
cently been suggested for heteromeric glycine recep-
tors (Burzomato et al., 2004). During this intermediate
closed state, the ATP is trapped in the binding site and
the energetic barrier that precedes the opening of the
unbound channel has been signifi cantly lowered.
M AT E R I A L S A N D M E T H O D S
Outside-out Patch recordingP2X2 receptors were expressed transiently in human embryonic kidney (HEK) 293T cells. Cells growing in 10 mm diameter wells were transfected with 0.2 μg of a pcDNA3 plasmid driving expres-sion of enhanced green fl uorescent protein (EGFP), 2 μg of a pcDNA1 plasmid driving expression of P2X2, and 6 μl of Fugene 6, split the following day over poly-L-lysine–coated coverslips bro-ken into chips with a diameter of 500 μm, and recorded from 1 or 2 d after splitting. Outside-out patch recordings were obtained using 8–18 MΩ pipettes fi lled with (in mM) 145 CsFl, 10 EGTA, 10 HEPES, 5 NaCl, and 1.3 MgCl2. EGTA was neutralized with KOH. Patches were clamped at −60 mV with a DAGAN 3900 patch-clamp amplifi er (Dagan). The patch clamp head stage was mounted on a Burleigh Model PCS-1000 with a PCS-250 patch clamp driver (EXFO Life Sciences)
ATP (Sigma-Aldrich) was dissolved in the perfusion solution, which contained (in mM) 150 NaCl, 2 KCl, 1.3 MgCl2, 10 HEPES, pH 7.4. We compensated for the chelation of Mg+2 by ATP by add-ing MgCl2 to our solutions such that all solutions contained 1 mM free Mg+2, as determined by the program Bound and Determined (Brooks and Storey, 1992). Currents were low-pass fi ltered at 10 kHz with a four-pole Bessel fi lter and digitized at 50 kHz (Digi-data 1322A, Axon Instruments). All experiments were done at room temperature (22°C).
Ultrashort pulses generationThe solution switching approach we used was based on the move-ment of the boundary between two streams of solution of differ-ent composition across the tip of the recording micropipette (Fig. 1 A). The movement of the drug application pipette was con-trolled by a piezoelectric device (Burleigh LSS-3100 Ultra-Fast Solution Switching System, EXFO Life Sciences). When appropriate calibrations were made, this system was capable of moving solu-tion interfaces over the pipette with 10–90% rise or fall times of 100 μs as measured with intact patches. Drugs were applied from 3-barrel square glass pipettes (Warner Instrument) pulled to a barrel width of 100 μm. Each barrel was connected by PE10 diameter tubing to a micromanifold so that up to four different solutions could be tested. The solution that was allowed to fl ow was selected by computer controlled pinch valves (BPS-8, ALA Scien-tifi c Instruments), and the rate of fl ow out of the pipette was con-trolled by applying constant pressure of 100 torr to the solution reservoirs (2PK+, ALA Scientifi c Instruments). Once the com-mand signal to the valves was changed, it required 20 s to change the solution fl owing out of the barrel. When a valve was shut and
then reopened it required <20 ms to reestablish the fl ow of that solution and produce a sharp interface between the two solutions fl owing out of adjacent barrels.
One important factor that affects the speed of solution ex-change is the position of the recording pipette relative to the drug application pipette. The tip of the recording pipette was held perpendicular to the fl ow of solution by the placement of the micromanipulators on the table. The height of the recording pipette tip was set 17 μm below the bottom of the septum of the drug application pipette by using the calibrated focus knob on the microscope, and the lateral distance between the drug appli-cation pipette and the recording pipettes was set to 17 μm by a reticule in the eyepiece. As the drug application pipette entered the solution at 45° this placed the recording tip 25 μm straight ahead of the septum.
As one approach to calibrating the drug application system, small movements of the liquid boundary were detected by changes in the liquid junction potential at the open tip of a pipette located
Figure 1. Properties of solution exchange with open-tipped re-cording pipettes. (A) Diagram of system for rapidly changing the solution bathing outside-out patches. Different solutions fl ow through the two barrels of the pipette, and outfl ow is controlled by pressure applied to the solution reservoirs and by the opening and closing of solenoid valves. The arrow indicates the direction of movement of the drug application pipette in response to control pulses from the computer. A second computer controlled a piezo-electric manipulator that could be used to adjust the position of the recording pipette relative to the solution interface. (B) The change in junction potential when the solution boundary between 150 mM NaCl and 1.5 mM NaCl was moved across the recording pipette at low speed (40 μm/s). The 33-mV shift indicates that these data are as predicted from the Henderson equation. (C) The junction potential measured at closely spaced distances indicated that the 10–90% range of the concentration profi le is 0.7 μm.
on March 15, 2016
jgp.rupress.orgD
ownloaded from
Published July 30, 2007
Moffatt and Hume 185
near the interface between solutions. In these experiments, the recording pipette was fi lled with internal recording solution while the drug application barrels contained 150 mM NaCl and 1.5 mM NaCl, respectively (Fig. 1 B). The expected junction potential of the pipette tip relative to the test solution should be described by the Henderson formula (Barry and Lynch, 1991):
( )
( )
⎛ ⎞−⎜ ⎟= − ⎜ ⎟− ⎜ ⎟⎝ ⎠
∑ ∑
∑ ∑
2
2 2ln ,
i i iO iI i i iIi i
IOi i iO iI i i iO
i i
z u c c z u cRT
VF z u c c z u c
(1)
where VIO is the junction potential between the solution I and J, zi, and ui refers to the valence, mobility, and concentration of each one of the ions present at each side of the boundary. When the drug application pipette was held fi xed, and the recording pi-pette moved very slowly across the boundary (30 μm/s, Fig. 1 B), the junction potential was in equilibrium at all points. In this way the boundary was measured and the concentration profi le calcu-lated. As expected, the potential difference between the two solu-tions was 33 mV and changes in the concentration across the boundary could be described by the error function (Sachs, 1999). These experiments indicate that at the rate of solution fl ow we used, the boundary had a 10–90% width of 0.7–0.9 μm (Fig. 1 C).
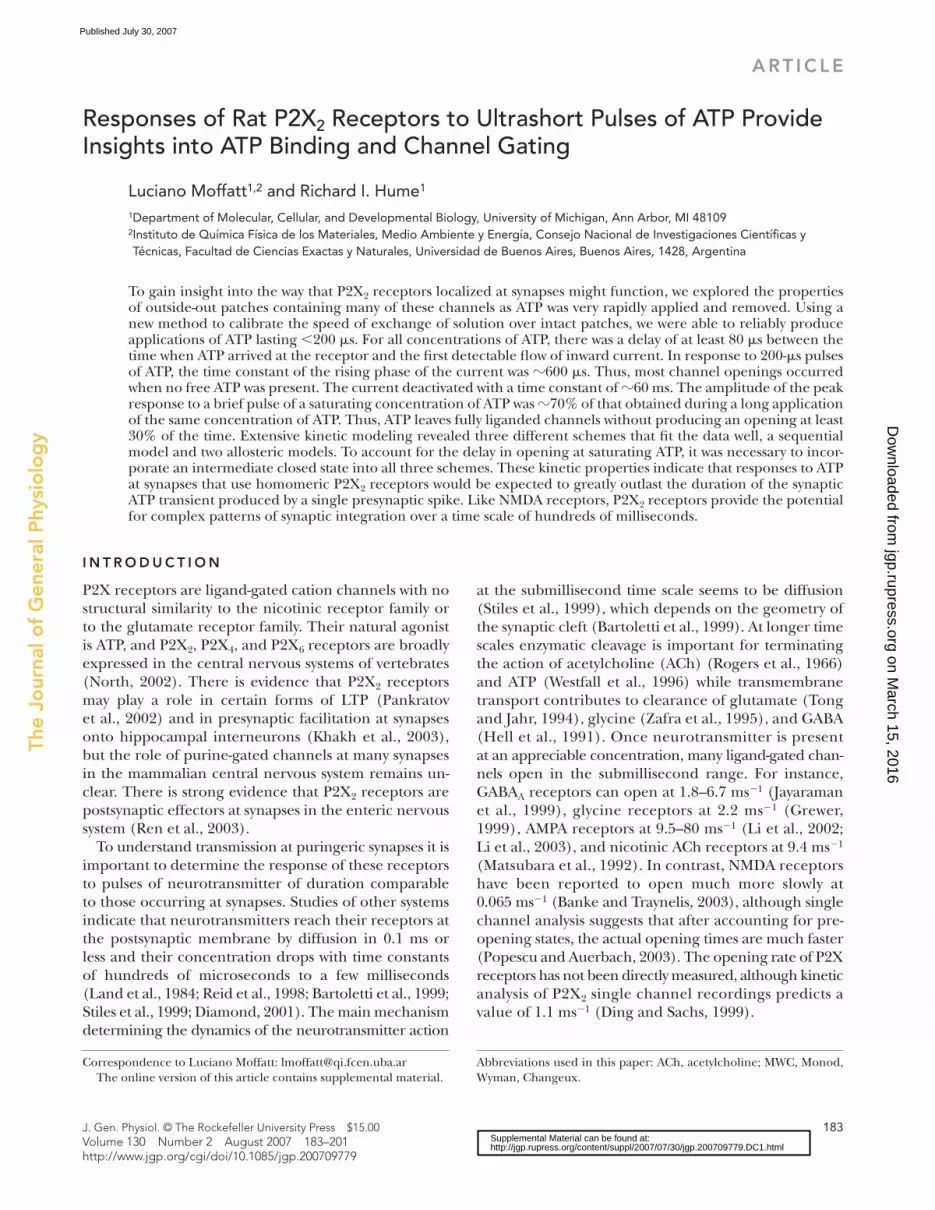
To improve the temporal resolution of the solution switcher we measured the solution exchanger vibrational dynamics. In this way we could minimize the mechanical vibrations induced in the piezo-stage and application pipette, which otherwise can lead to multiple undesired transitions of the solution across the patch (Stilson et al., 2001). The dynamics of the solution exchanger were modeled by its transfer function, which was experimentally determined by the methods of Stiltson et al. In brief, we measured the potential changes due to the movement of the liquid bound-ary across the open tip of a pipette after the application of 200 μs square voltage pulses of various amplitudes to the piezo translator when the recording tip was positioned at a variety of locations rel-ative to the solution interface. Once the transfer function was cal-culated from these data, the optimal input (i.e, the voltage applied to the piezo-stage) for any desired output was calculated by the methods previously described (Stilson et al., 2001). The com-mand stimulus necessary to produce a 200-μs response was quite complex, beginning and ending many milliseconds before and after the detectable movement (Fig. 2 A).
The fi nal adjustment of the recording pipette relative to the so-lution interface was done as illustrated in Fig. 2 B. We changed the position of the recording pipette in 0.67-μm steps by chang-ing the voltage coming into the X axis controller of the microma-nipulator that held the patch clamp head stage (Model PCS-1000 with a PCS-250 patch clamp driver, EXFO Life Sciences). Re-sponses to a constant stimulus delivered to the drug application piezo at 12 different positions of the recording pipette are shown in Fig. 2 B. As the pipette was placed more distant from the inter-face, the latency until a detectable response was observed got lon-ger, the duration of the response got shorter, and fi nally the response ceased to reach a level equal to the full junction poten-tial produced by the low NaCl solution. From the increase in la-tency (180 μs over the 8-μm displacement, Fig. 2 B, dashed lines) the velocity of the moving boundary can be estimated to be 45 μm/ms. As the interface thickness was shown above to be 0.7 μm, the predicted 10–90% rise time is 16 μs. However, at the posi-tion that produced a response lasting 200 μs (thick line) the ac-tual 10–90% rise time was 85 μs (Fig. 2 C).
Our data were usually fi ltered at 10 kHz with a 4-pole Bessel fi l-ter, so it was possible that this fi lter was the cause of the unexpect-edly slow response. One approach to test this was to simply set the fi lter to a higher cutoff frequency, while a second approach was to simulate the effect of a Bessel fi lter using Matlab. Both approaches
demonstrated that at most 7 μs of the increase in rise time was due to the fi lter. A plausible explanation for the slower than ex-pected rise time of the optimized response is that ions have to dif-fuse over the unstirred layer created at the tip of the pipette (Sachs, 1999). The region around the patch is subject to both convection and diffusion. Diffusion of different molecules varies
Figure 2. Movements of the solution boundary between 150 and 1.5 mM NaCl can be made very rapidly. (A) The optimal com-mand potential to the piezo driver moving the drug application pipette necessary to damp out vibrations was complex. The top traces show the command potential, and the bottom trace shows a single sharp spike in the junction potential. The time course of the junction potential waveform at higher temporal resolution is illustrated in the inset box. (B) The pipette junction potential in response to a fi xed stimulus to the piezo controlling the position of the drug application pipette is plotted for 12 different posi-tions of the recording pipette. In all cases the recording pipette began in the 150 mM NaCl solution and the initial potential was 0 mV. The top trace was obtained when the recording pipette was close to the boundary, and each subsequent trace was 0.67 μm more distant. The heavy black trace indicates a position where this stimulus produced a pulse lasting 200 μs. The dashed lines indicate the difference between the latency until a response be-gan at the position closest to the boundary and the beginning of a response in each subsequent trace. The velocity of the piezo movement was estimated from these lines to be 45 μm/ms. (C) Predicted and observed time courses of the solution exchange. The thin line indicates the concentration profi le expected based on a velocity of the piezo of 45 μm/ms. The thick line indicates the concentration profi le actually obtained, and was calculated from the thick trace in B using the Henderson equation.
on March 15, 2016
jgp.rupress.orgD
ownloaded from
Published July 30, 2007
186 Dynamic Responses of P2X2 Receptors
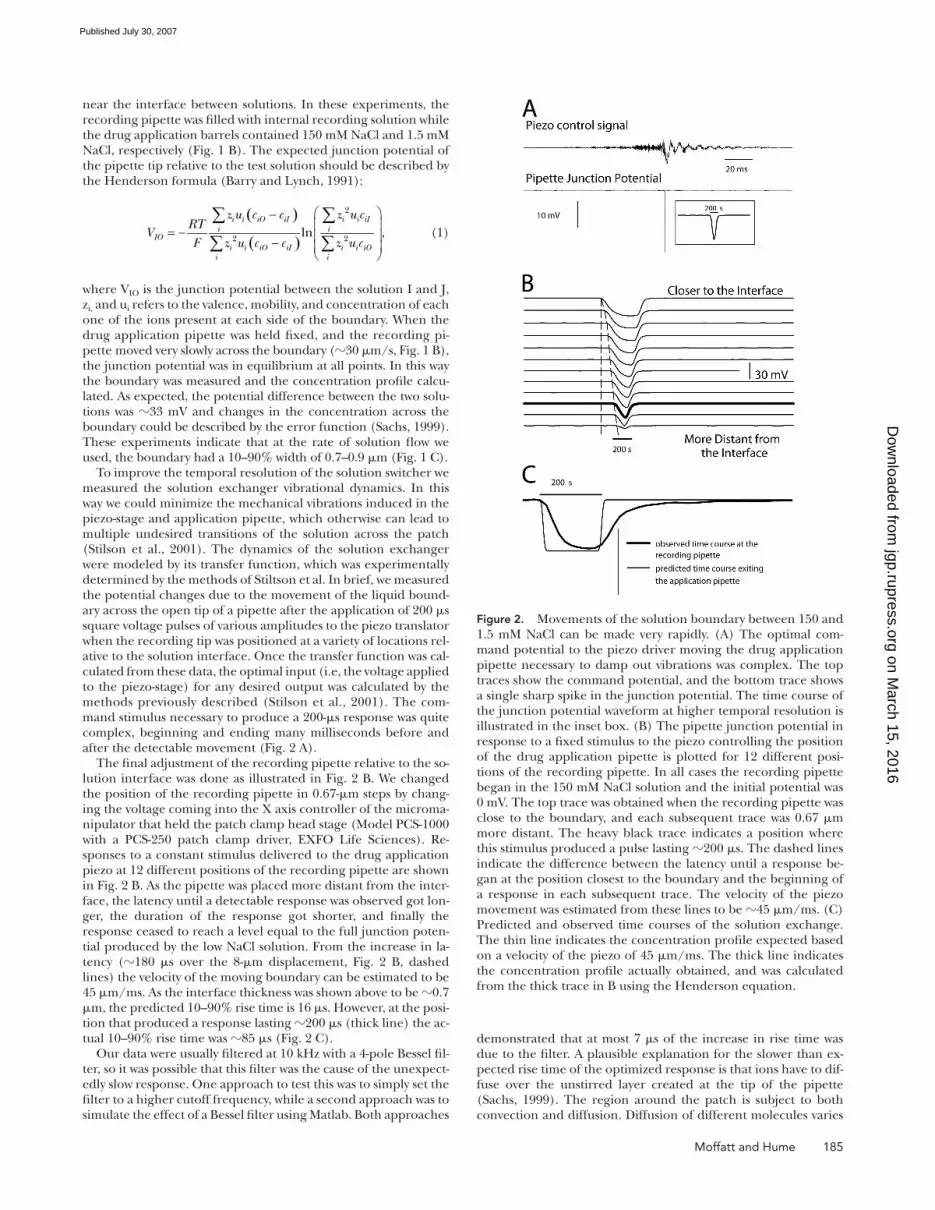
according to size, the diffusion coeffi cient of Na being approxi-mately fi ve times faster than that for ATP. A slower diffusion coeffi cient also steepens the gradient across the boundary and in-creases the time needed to cross the unstirred layer at the tip of the recording pipette. To estimate the contribution of both ef-fects we simulated the expected changes in the concentration seen at the patch using a numerical integration of the convection diffusion equation: ⋅∇ − ∇ = −∂ ∂2 / ,v C D C C t where v is the vec-tor velocity of the fl uid, C is the concentration, and D is the diffu-sion coeffi cient. We solved the result for the one-dimensional case along the axis in which the drug application pipette moves. Following results of Sachs, we assume that velocity is maximal up until one reaches a distance of approximately three times the ra-dius of the patch, and that the velocity comes to 0 at the patch (Fig. 3 A). To simulate conditions close to our experiments we set the initial distribution to be the result of crossing the 0.7-μm boundary at 45 μm ms−1 (Fig. 3 B). We set the distance between the exit point of the drug application pipette and the patch to be 25 μm (since it was the position set in the actual experiments), and by adjusting the parameters representing the velocity and the radius of the pipette (which determine the shape of the velocity fi eld near the patch) we found a good agreement with the data using a velocity of 60 μm ms−1 and a patch radius of 1.2 μm (Fig. 3 B). At the exit point of the drug application pipette the rise time is 16 μs and it begins with no delay. It requires 350 μs for the concentration change to begin 20 μm away, and the rise time remained rapid (30 μs) for both sodium and ATP. It takes 150 μs to travel the last 5 μm, where the velocity of the fl uid drops to zero. The rise time decreases to 100 μs with the predicted exchange of ATP delayed by 20 μs with respect to the exchange of Na.
Experimental ProtocolsApplication of high concentrations of ATP for hundreds of milli-seconds resulted in desensitization. Furthermore, the responses of outside-out patches containing P2X2 receptors ran down over time. To deal with these complications, we tested patches no sooner than 1 min after the previous stimulus and sandwiched each test concentration between two normalizing stimuli (1 mM ATP for 10 ms). The amplitude of the test response was then nor-malized to the average of the two normalizing responses. With this paradigm, the variability in amplitude between successive normalizing responses (spaced 2 min apart) was <10% in most trials. Trials in which the amplitude of the normalizing responses changed by >10% were not included in the analysis.
Data Analysis, Kinetic Modeling, and Statistical AnalysisWe used custom written functions in MATLAB 6.5 for fi tting the data. For fi tting exponential functions or exponential matrices we used the built in function lsqrnonlin, using the options “Large-Scale on” and “LevenbergMarquardt on.” We fed the algorithm with the raw data during the pulse but averaged the data at loga-rithmically spaced intervals (10 points per decade) after the pulse ended. In this way we reduced the size of the data vector from 200,000 to 100, without losing signifi cant information, allowing us to rapidly fi t large datasets and complex models. In some cases, the fi t was forced to obey a particular constraint (that the EC50 matched the experimentally obtained value) by adding a penalty to the squared sum when the constraint was not matched. To get estimates of the standard errors in the parameter determinations we used a bootstrapapproach (Kraushaar and Jonas, 2000). A bal-anced resampling was obtained by concatenating 100 copies of the original set of traces and generating a random permutation of the all 100*ntraces. Subsequently, 100 bootstrap replications were read as successive blocks of length ntraces. Each bootstrap replica was refi tted using the best fi t values of the original traces set as the initial values. Errors were estimated from percentile intervals.
Online Supplemental MaterialDifferent aspects of the kinetic analysis are described in detail in the online supplemental material (available at http://www.jgp.org/cgi/content/full/jgp200709779/DC1). The supplemental material includes two approaches to the kinetic analysis of Scheme 1,
Figure 3. Numerical analysis of the predicted concentration profi le at the recording pipette based on the one-dimensional diffusion-convection equation. (A) Velocity as a function of the distance from the tip used for the numerical integration. The maximal velocity is the fl uid velocity (v). These data were ob-tained from a two-dimensional integration of the Bernoulli equa-tion by Sachs (1999) and represent the values that would be obtained for a recording pipette with a radius of 1.2 μm. (B) The predicted time course of appearance and disappearance of ATP and Na in response to stimulus that produces a 200-μs duration response at the patch. The amplitudes of all responses are nor-malized to 100% of the maximum response at that point. The pa-rameters used for the fi t were diffusion coeffi cientNa = 1.133, diffusion coeffi cientATP = 0.36, fl uid velocity = 60 μm/ms, re-cording pipette radius = 1.2 μm. (C) The measured time course of the open tip junction potential as the NaCl concentration or the MgATP concentration increased and decreased between 1 and 10 mM. The junction potential values were normalized to fa-cilitate their comparison. The dashed line indicates the maximum amplitude of the junction potential for a long pulse.
on March 15, 2016
jgp.rupress.orgD
ownloaded from
Published July 30, 2007
Moffatt and Hume 187
(1) split analysis and (2) global fi tting; also, it contains (3) a discussion over the performance of the discarded Schemes 2 and 3 and (4) the parametrization procedure of allosteric model Schemes 6 and 7. Moreover, four supplemental fi gures are pro-vided: (Fig. S1) the fi ts to all explored models replotted in a lin-ear amplitude axis; (Fig. S2) an expanded view of Scheme 6; and (Figs. S3 and S4) expanded views of Scheme 7.
R E S U LT S
Exchange Time on Intact PatchesWhen recording pipettes with outside-out patches were
placed at the position that our experiments on open-
tipped pipettes suggested would yield optimized re-
sponses, we found a striking variability between patches
in the rise time kinetics of recombinant P2X2 receptors.
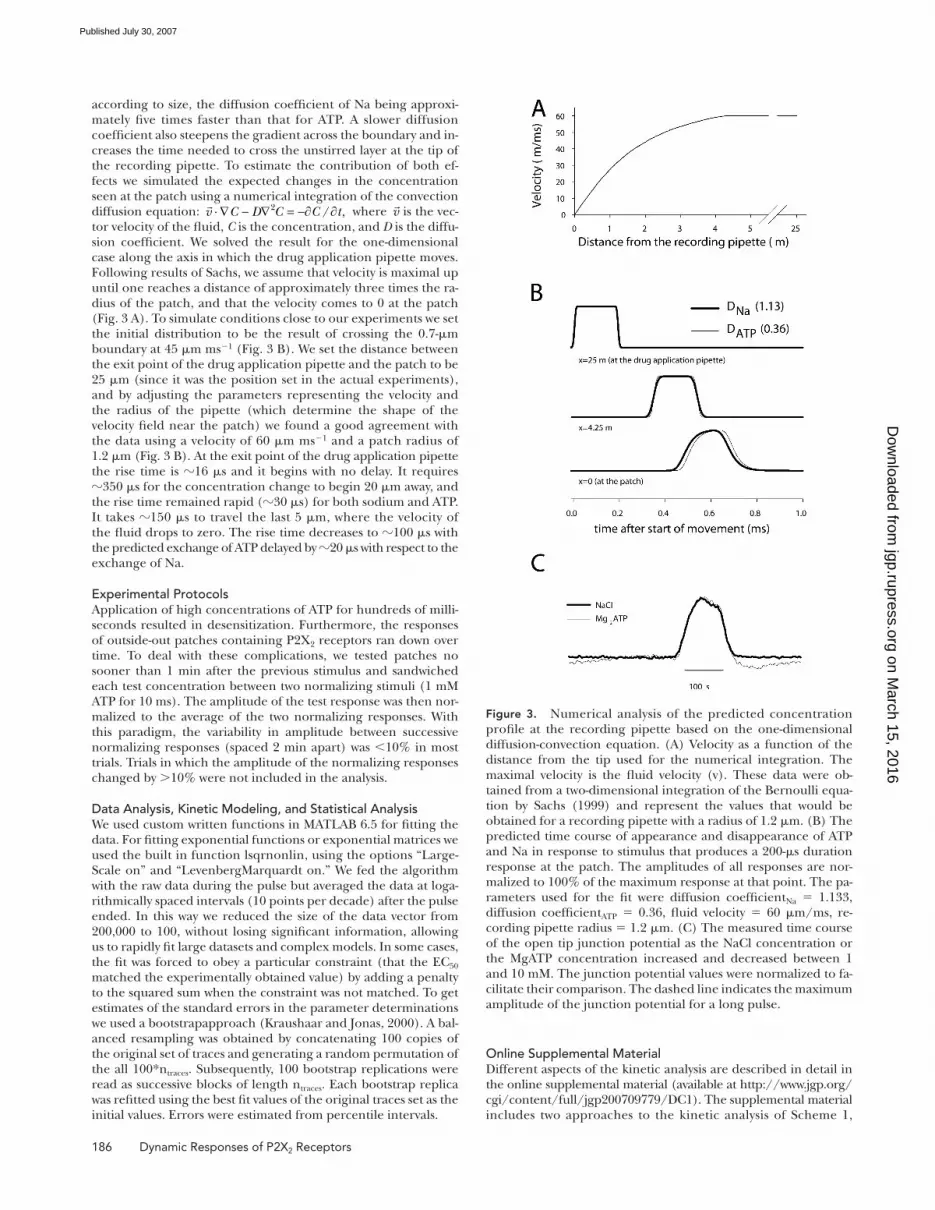
For the majority of patches exposed to 1 mM ATP, the
10–50% rise time was <1 ms, but in some patches it was 5
or even 10 ms and the response began with a substantial
delay (Fig. 4). All of these patches were ruptured at the
end of the experiment and the speed of exchange mea-
sured based on the open tip junction potential was uni-
formly rapid, confi rming that the recording pipettes were
properly positioned. We also found that for some patches,
the time course of the response to 1 mM ATP changed
dramatically over time. We hypothesized that the large
outside-out patches that we made in order to obtain cur-
rents of suffi cient magnitude might sometimes partially
fold over on themselves, and thus impede solution ex-
change. We therefore developed a method for estimating
the speed of solution exchange that could be performed
on intact patches expressing P2X2 receptors.
The intact patch calibration method fi rst opens the
P2X2 channels with ATP and then alters the cation com-
position of the solution, replacing most of the Na+ with
NMDG+, which is much less permeable than sodium.
When ATP is present continuously, changes in the cur-
rent arise not because of any conformational change in
the P2X2 channel but because of the changes in the
concentration of extracellular Na that reach the chan-
nel. The published literature indicates that PNa/PNMDG
is 0.03 following brief applications of ATP to oocytes or
HEK293 cells, but can increase to 0.12 if prolonged ap-
plication of ATP allows the channel to enter the mega-
pore state (Khakh et al., 1999; Virginio et al., 1999).
The changes in current observed after the exchange of
Na for NMDG should be described by the Goldman-
Hodgkin-Katz equation: (2)
[ ] [ ] ( )( )
− ⋅ −⋅= ⋅ ⋅ ⋅
− −
22
exp /,
1 exp /
Xint extX X X
X
X X z FE RTE FI P z
RT z FE RT
where Px is the membrane permeability for the ion x, E
is the membrane potential, and [X]int and [X]ext are the
concentration of the ion x at the internal and external
side of the patch. For constant membrane potential and
permeability, the equation states that the total current
is a linear function of the concentration of sodium and
NMDG. That means that the measured current is a linear
function of the extent of solution switching.
The results of an on-patch assessment of the speed of
solution exchange are presented in Fig. 5. Because we
were limited to rapidly switching between only two bar-
rels, the actual experimental protocol was slightly more
complex than would be necessary if rapid switching be-
tween three solutions were possible. In this experiment,
one barrel contained standard sodium containing exter-
nal solution with no ATP, while the other barrel con-
tained 100 μM ATP in NMDG external solution. The
patch was placed on the side of the interface containing
no ATP. About 200 ms before each trace, the fl ow from
this barrel was temporarily shut off by a computer-
controlled valve. This allowed the solution coming out of
the ATP containing barrel to mix at the patch, so the so-
lution initially bathing the patch was an undefi ned mix-
ture that contained a suffi cient amount of ATP to open
many channels and suffi cient sodium to drive an inward
current. 35 ms before the beginning of each trace, fl ow
was reinitiated through the 0 ATP barrel. This returned
the patch to a 0 NMDG, 0 ATP environment within 10
ms, but because the time constant of decay of the ATP-
activated currents following ATP removal is >50 ms, in-
ward currents were readily observed for a few hundred
milliseconds until the currents returned to baseline.
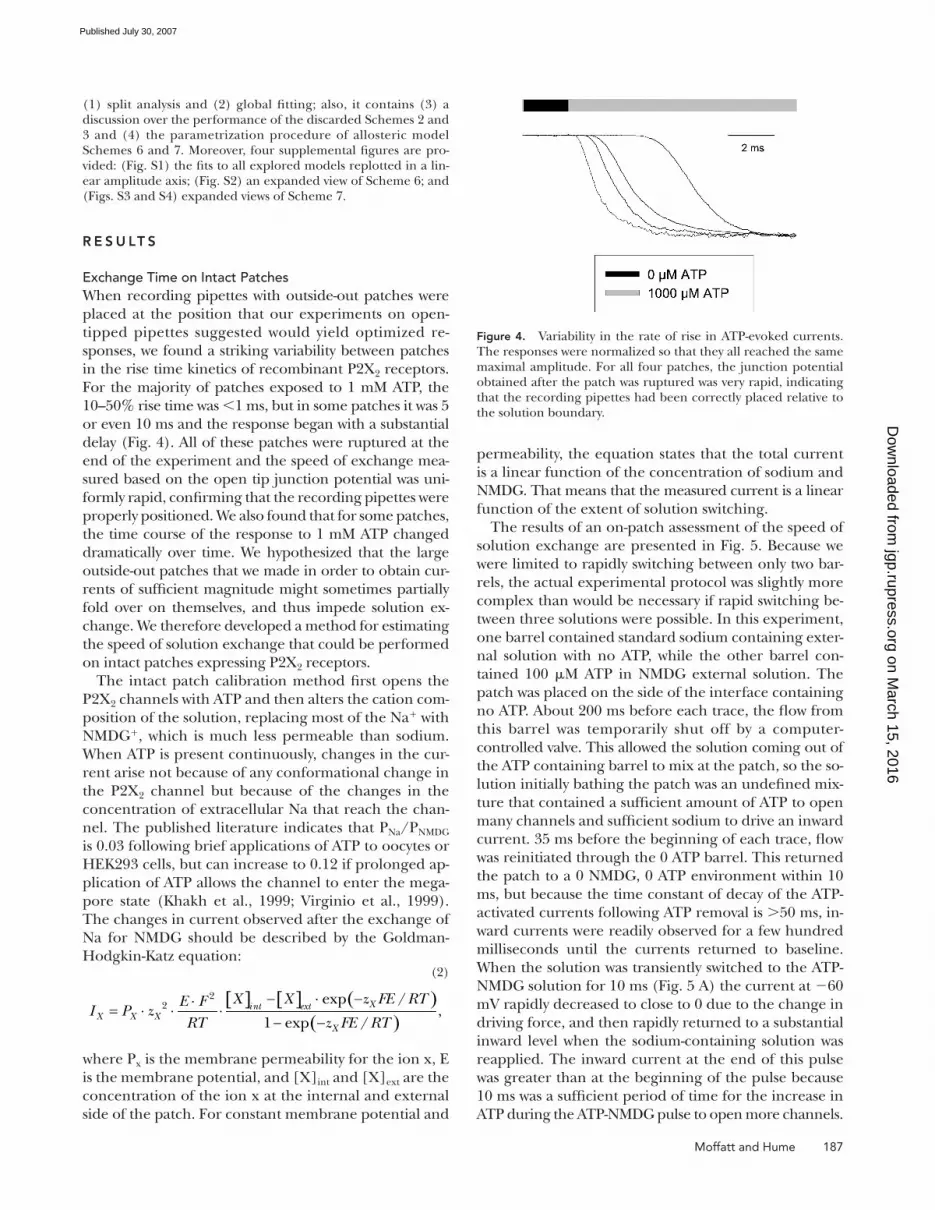
When the solution was transiently switched to the ATP-
NMDG solution for 10 ms (Fig. 5 A) the current at −60
mV rapidly decreased to close to 0 due to the change in
driving force, and then rapidly returned to a substantial
inward level when the sodium-containing solution was
reapplied. The inward current at the end of this pulse
was greater than at the beginning of the pulse because
10 ms was a suffi cient period of time for the increase in
ATP during the ATP-NMDG pulse to open more channels.
Figure 4. Variability in the rate of rise in ATP-evoked currents. The responses were normalized so that they all reached the same maximal amplitude. For all four patches, the junction potential obtained after the patch was ruptured was very rapid, indicating that the recording pipettes had been correctly placed relative to the solution boundary.
on March 15, 2016
jgp.rupress.orgD
ownloaded from
Published July 30, 2007
188 Dynamic Responses of P2X2 Receptors
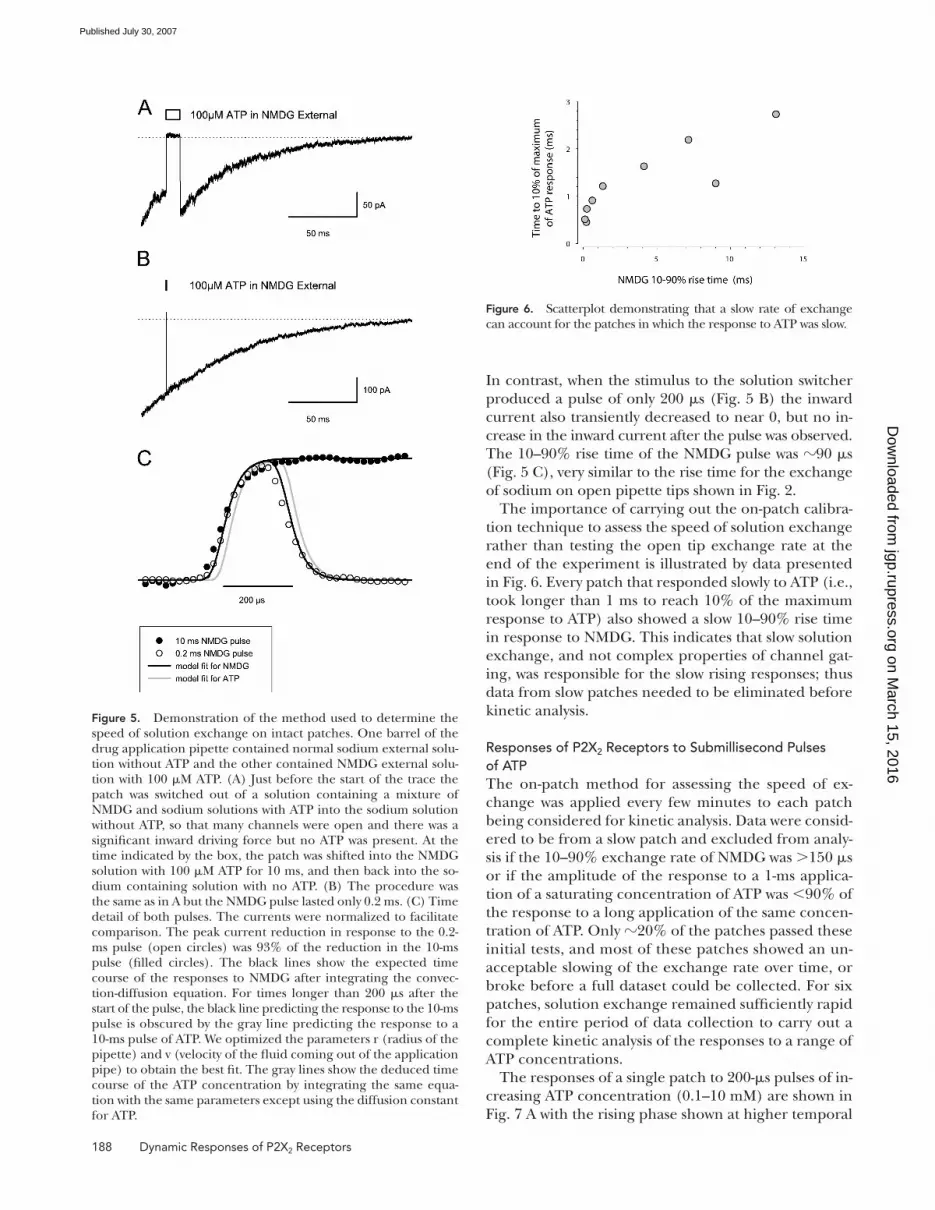
In contrast, when the stimulus to the solution switcher
produced a pulse of only 200 μs (Fig. 5 B) the inward
current also transiently decreased to near 0, but no in-
crease in the inward current after the pulse was observed.
The 10–90% rise time of the NMDG pulse was 90 μs
(Fig. 5 C), very similar to the rise time for the exchange
of sodium on open pipette tips shown in Fig. 2.
The importance of carrying out the on-patch calibra-
tion technique to assess the speed of solution exchange
rather than testing the open tip exchange rate at the
end of the experiment is illustrated by data presented
in Fig. 6. Every patch that responded slowly to ATP (i.e.,
took longer than 1 ms to reach 10% of the maximum
response to ATP) also showed a slow 10–90% rise time
in response to NMDG. This indicates that slow solution
exchange, and not complex properties of channel gat-
ing, was responsible for the slow rising responses; thus
data from slow patches needed to be eliminated before
kinetic analysis.
Responses of P2X2 Receptors to Submillisecond Pulses of ATPThe on-patch method for assessing the speed of ex-
change was applied every few minutes to each patch
being considered for kinetic analysis. Data were consid-
ered to be from a slow patch and excluded from analy-
sis if the 10–90% exchange rate of NMDG was >150 μs
or if the amplitude of the response to a 1-ms applica-
tion of a saturating concentration of ATP was <90% of
the response to a long application of the same concen-
tration of ATP. Only 20% of the patches passed these
initial tests, and most of these patches showed an un-
acceptable slowing of the exchange rate over time, or
broke before a full dataset could be collected. For six
patches, solution exchange remained suffi ciently rapid
for the entire period of data collection to carry out a
complete kinetic analysis of the responses to a range of
ATP concentrations.
The responses of a single patch to 200-μs pulses of in-
creasing ATP concentration (0.1–10 mM) are shown in
Fig. 7 A with the rising phase shown at higher temporal
Figure 5. Demonstration of the method used to determine the speed of solution exchange on intact patches. One barrel of the drug application pipette contained normal sodium external solu-tion without ATP and the other contained NMDG external solu-tion with 100 μM ATP. (A) Just before the start of the trace the patch was switched out of a solution containing a mixture of NMDG and sodium solutions with ATP into the sodium solution without ATP, so that many channels were open and there was a signifi cant inward driving force but no ATP was present. At the time indicated by the box, the patch was shifted into the NMDG solution with 100 μM ATP for 10 ms, and then back into the so-dium containing solution with no ATP. (B) The procedure was the same as in A but the NMDG pulse lasted only 0.2 ms. (C) Time detail of both pulses. The currents were normalized to facilitate comparison. The peak current reduction in response to the 0.2-ms pulse (open circles) was 93% of the reduction in the 10-ms pulse (fi lled circles). The black lines show the expected time course of the responses to NMDG after integrating the convec-tion-diffusion equation. For times longer than 200 μs after the start of the pulse, the black line predicting the response to the 10-ms pulse is obscured by the gray line predicting the response to a 10-ms pulse of ATP. We optimized the parameters r (radius of the pipette) and v (velocity of the fl uid coming out of the application pipe) to obtain the best fi t. The gray lines show the deduced time course of the ATP concentration by integrating the same equa-tion with the same parameters except using the diffusion constant for ATP.
Figure 6. Scatterplot demonstrating that a slow rate of exchange can account for the patches in which the response to ATP was slow.
on March 15, 2016
jgp.rupress.orgD
ownloaded from
Published July 30, 2007
Moffatt and Hume 189
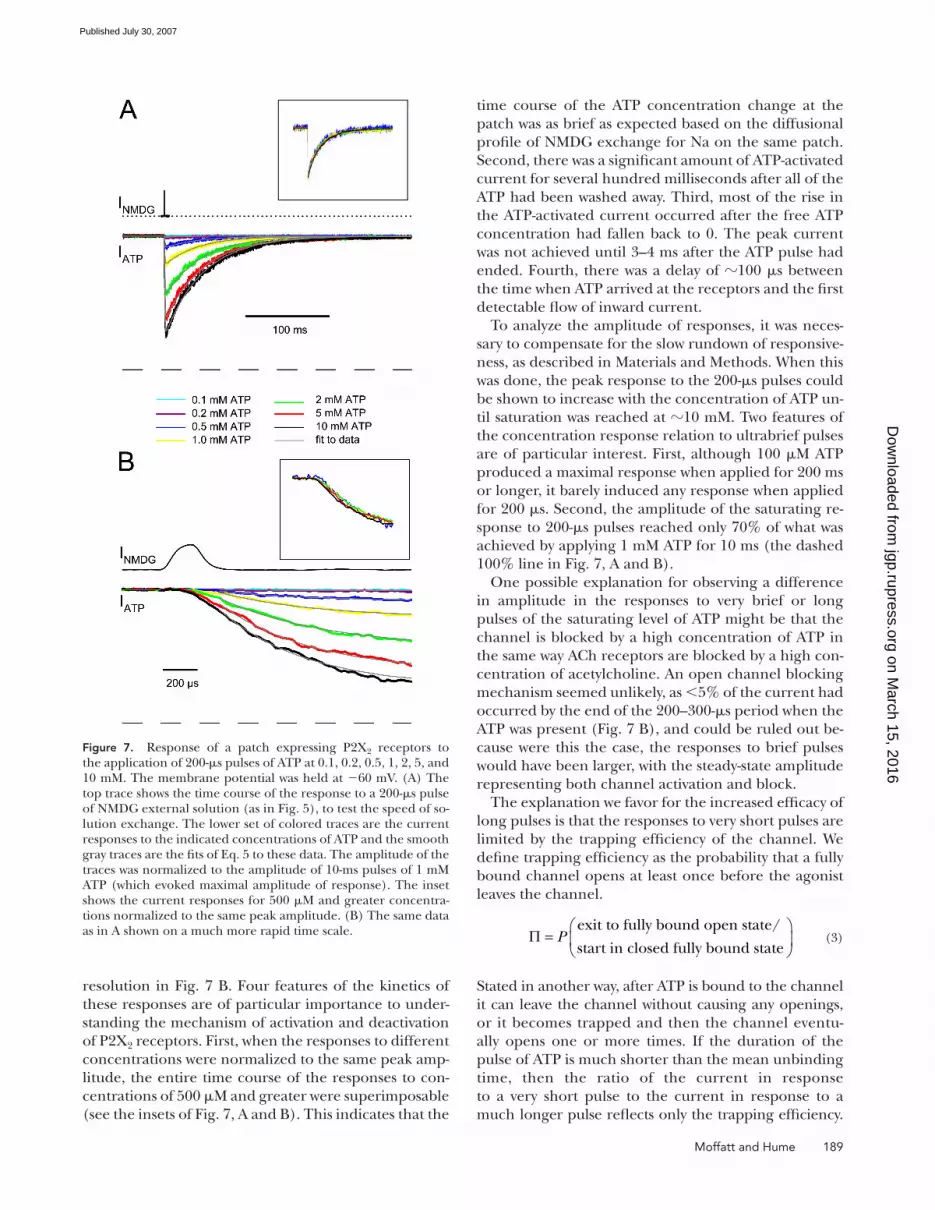
time course of the ATP concentration change at the
patch was as brief as expected based on the diffusional
profi le of NMDG exchange for Na on the same patch.
Second, there was a signifi cant amount of ATP-activated
current for several hundred milliseconds after all of the
ATP had been washed away. Third, most of the rise in
the ATP-activated current occurred after the free ATP
concentration had fallen back to 0. The peak current
was not achieved until 3–4 ms after the ATP pulse had
ended. Fourth, there was a delay of 100 μs between
the time when ATP arrived at the receptors and the fi rst
detectable fl ow of inward current.
To analyze the amplitude of responses, it was neces-
sary to compensate for the slow rundown of responsive-
ness, as described in Materials and Methods. When this
was done, the peak response to the 200-μs pulses could
be shown to increase with the concentration of ATP un-
til saturation was reached at 10 mM. Two features of
the concentration response relation to ultrabrief pulses
are of particular interest. First, although 100 μM ATP
produced a maximal response when applied for 200 ms
or longer, it barely induced any response when applied
for 200 μs. Second, the amplitude of the saturating re-
sponse to 200-μs pulses reached only 70% of what was
achieved by applying 1 mM ATP for 10 ms (the dashed
100% line in Fig. 7, A and B).
One possible explanation for observing a difference
in amplitude in the responses to very brief or long
pulses of the saturating level of ATP might be that the
channel is blocked by a high concentration of ATP in
the same way ACh receptors are blocked by a high con-
centration of acetylcholine. An open channel blocking
mechanism seemed unlikely, as <5% of the current had
occurred by the end of the 200–300-μs period when the
ATP was present (Fig. 7 B), and could be ruled out be-
cause were this the case, the responses to brief pulses
would have been larger, with the steady-state amplitude
representing both channel activation and block.
The explanation we favor for the increased effi cacy of
long pulses is that the responses to very short pulses are
limited by the trapping effi ciency of the channel. We
defi ne trapping effi ciency as the probability that a fully
bound channel opens at least once before the agonist
leaves the channel.
⎛ ⎞Π = ⎜ ⎟
⎝ ⎠
exit to fully bound open state/
start in closed fully bound stateP
(3)
Stated in another way, after ATP is bound to the channel
it can leave the channel without causing any openings,
or it becomes trapped and then the channel eventu-
ally opens one or more times. If the duration of the
pulse of ATP is much shorter than the mean unbinding
time, then the ratio of the current in response
to a very short pulse to the current in response to a
much longer pulse refl ects only the trapping effi ciency.
Figure 7. Response of a patch expressing P2X2 receptors to the application of 200-μs pulses of ATP at 0.1, 0.2, 0.5, 1, 2, 5, and 10 mM. The membrane potential was held at −60 mV. (A) The top trace shows the time course of the response to a 200-μs pulse of NMDG external solution (as in Fig. 5), to test the speed of so-lution exchange. The lower set of colored traces are the current responses to the indicated concentrations of ATP and the smooth gray traces are the fi ts of Eq. 5 to these data. The amplitude of the traces was normalized to the amplitude of 10-ms pulses of 1 mM ATP (which evoked maximal amplitude of response). The inset shows the current responses for 500 μM and greater concentra-tions normalized to the same peak amplitude. (B) The same data as in A shown on a much more rapid time scale.
resolution in Fig. 7 B. Four features of the kinetics of
these responses are of particular importance to under-
standing the mechanism of activation and deactivation
of P2X2 receptors. First, when the responses to different
concentrations were normalized to the same peak amp-
litude, the entire time course of the responses to con-
centrations of 500 μM and greater were superimposable
(see the insets of Fig. 7, A and B). This indicates that the
on March 15, 2016
jgp.rupress.orgD
ownloaded from
Published July 30, 2007
190 Dynamic Responses of P2X2 Receptors
We interpret our results in that sense; for 200-μs pulses that
saturated the receptor with ATP, 30% of the time the ago-
nist left the receptor without inducing a single opening.
The responses once ATP had fallen to a negligible
level were well described by a biexponential function
with a delay (see gray lines in Fig. 7, A and B):
δ δ⎛ ⎞⎛ ⎞ ⎛ ⎞− −⎜ ⎟= ⋅ − − −⎜ ⎟ ⎜ ⎟⎜ ⎟⎜ ⎟τ τ⎝ ⎠⎝ ⎠⎝ ⎠
( ) exp exp .decay rise
t t t ty t A
(4)
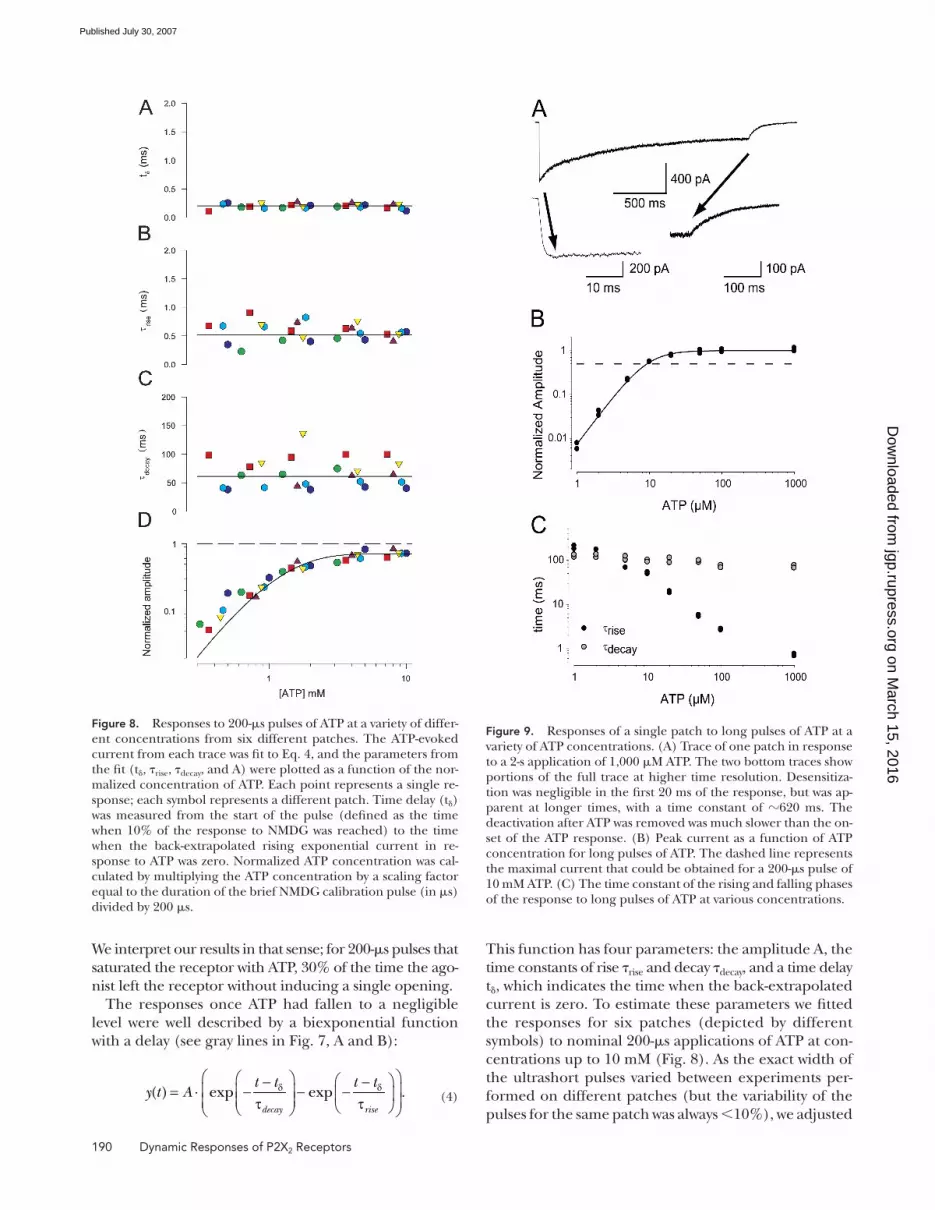
This function has four parameters: the amplitude A, the
time constants of rise τrise and decay τdecay, and a time delay
tδ, which indicates the time when the back-extrapolated
current is zero. To estimate these parameters we fi tted
the responses for six patches (depicted by different
symbols) to nominal 200-μs applications of ATP at con-
centrations up to 10 mM (Fig. 8). As the exact width of
the ultrashort pulses varied between experiments per-
formed on different patches (but the variability of the
pulses for the same patch was always <10%), we adjusted
Figure 8. Responses to 200-μs pulses of ATP at a variety of differ-ent concentrations from six different patches. The ATP-evoked current from each trace was fi t to Eq. 4, and the parameters from the fi t (tδ, τrise, τdecay, and A) were plotted as a function of the nor-malized concentration of ATP. Each point represents a single re-sponse; each symbol represents a different patch. Time delay (tδ) was measured from the start of the pulse (defi ned as the time when 10% of the response to NMDG was reached) to the time when the back-extrapolated rising exponential current in re-sponse to ATP was zero. Normalized ATP concentration was cal-culated by multiplying the ATP concentration by a scaling factor equal to the duration of the brief NMDG calibration pulse (in μs) divided by 200 μs.
Figure 9. Responses of a single patch to long pulses of ATP at a variety of ATP concentrations. (A) Trace of one patch in response to a 2-s application of 1,000 μM ATP. The two bottom traces show portions of the full trace at higher time resolution. Desensitiza-tion was negligible in the fi rst 20 ms of the response, but was ap-parent at longer times, with a time constant of 620 ms. The deactivation after ATP was removed was much slower than the on-set of the ATP response. (B) Peak current as a function of ATP concentration for long pulses of ATP. The dashed line represents the maximal current that could be obtained for a 200-μs pulse of 10 mM ATP. (C) The time constant of the rising and falling phases of the response to long pulses of ATP at various concentrations.
on March 15, 2016
jgp.rupress.orgD
ownloaded from
Published July 30, 2007
Moffatt and Hume 191
the values of the concentrations by multiplying them by
a scaling factor equal to the duration of the NMDG cali-
bration pulse (in μs) divided by 200 μs.
The time constants and delay time did not system-
atically vary with the applied ATP in the analyzed range
(Fig. 8, A–C), confi rming that the application of ATP
was essentially instantaneous relative to the kinetics of
these channels. However there was some variability in
the value of the time constants among different patches.
For the rise time the coeffi cient of variation was of 27%
between patches and 23% within the same patch (n =
36 traces, 3–14 per patch); for the decay time, the co-
effi cient of variation was 44% between patches and 17%
within the same patch, and for the delay time, 16% be-
tween patches and 23% between traces of the same
patch. The average value for the delay time tδ was 0.20 ms,
for τrise was 0.57 ms, and for τdecay was 62.4 ms.
In contrast to the concentration independence of the
kinetic properties of the responses to ultrashort pulses,
the amplitude of the response increased sharply as con-
centration was increased and saturated at 70% of the
amplitude in response to a long application of ATP (Fig.
8 D). The slope of this relation suggests that more than
one ATP must be bound to effi ciently open the channel.
According to this idea, the smaller peak current at lower
concentrations occurs because fewer and fewer receptors
were able to bind a suffi cient number of ATP molecules to
open with high probability. Assuming that the purinergic
receptor is a trimer (North, 2002), as an initial model we
can postulate a sigmoid function that is the sum of three
exponential functions described by the equation
(5)
( )= − − ⋅ + ⋅ − ⋅ − ⋅ − ⋅max( ) 1 exp( 3 ) 3 exp( 2 ) 3 exp( ) ,a a aA x A k x k x k x
where x is the integral over time of the ATP concentra-
tion during the pulse. This equation has only two pa-
rameters to fi t: the saturating amplitude Amax and the
apparent association constant ka. The fi t of the data to
this equation was excellent at high and medium con-
centrations, but there was a noticeable deviation at the
lowest concentrations, where the currents were larger
than predicted. This discrepancy will be addressed in
the second part of the Results.
For ATP concentrations of 200 μM or greater (the
range used in the experiments with 200-μs pulses), 10 ms
was suffi cient to produce responses that reached the
peak amplitude, yet short enough to elicit negligible de-
sensitization (Fig. 9 A). For longer applications of high
concentrations of ATP there was obvious desensitiza-
tion with a time constant of 628 ± 13.4 ms (n = 6). The
steady-state concentration response relation revealed by
2-s pulses had an EC50 of 9.8 μM and a Hill coeffi cient
of 1.8 (Fig. 9 B). The rise time for long pulses was a
steep function of ATP concentration, with the time con-
stant decreasing from over 100 ms at low concentrations
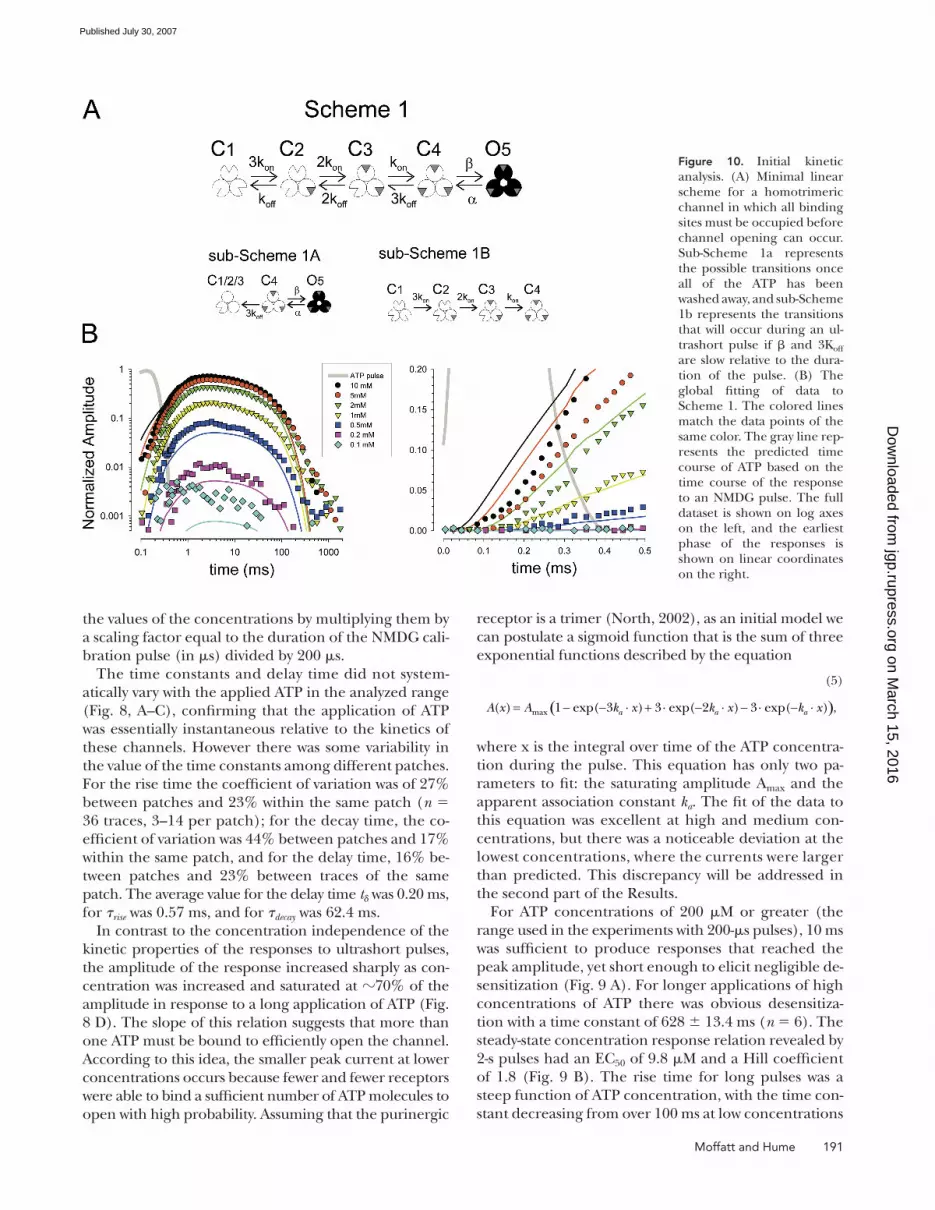
Figure 10. Initial kinetic analysis. (A) Minimal linear scheme for a homotrimeric channel in which all binding sites must be occupied before channel opening can occur. Sub-Scheme 1a represents the possible transitions once all of the ATP has been washed away, and sub-Scheme 1b represents the transitions that will occur during an ul-trashort pulse if β and 3Koff are slow relative to the dura-tion of the pulse. (B) The global fi tting of data to Scheme 1. The colored lines match the data points of the same color. The gray line rep-resents the predicted time course of ATP based on the time course of the response to an NMDG pulse. The full dataset is shown on log axes on the left, and the earliest phase of the responses is shown on linear coordinates on the right.
on March 15, 2016
jgp.rupress.orgD
ownloaded from
Published July 30, 2007
192 Dynamic Responses of P2X2 Receptors
to 0.72 ms at 1 mM (Fig. 9 C). This latter value is quite
similar to the time constant of the rise in response to
200-μs pulses of saturating levels of ATP. The time con-
stant of the falling phase after ATP was rapidly washed
away was independent of the concentration of ATP and
averaged 99 ms, which is within the range observed for
patches studied with brief pulses.
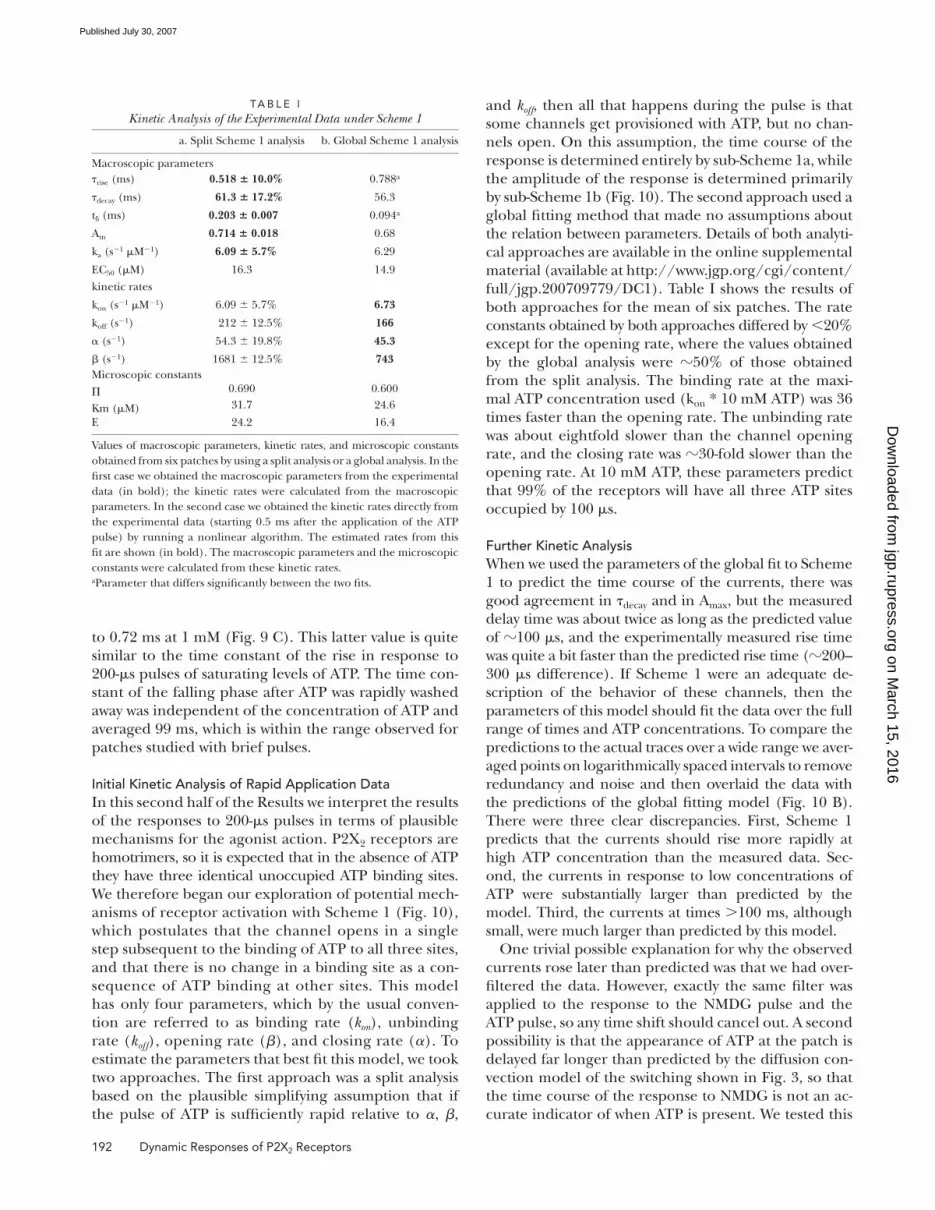
Initial Kinetic Analysis of Rapid Application DataIn this second half of the Results we interpret the results
of the responses to 200-μs pulses in terms of plausible
mechanisms for the agonist action. P2X2 receptors are
homotrimers, so it is expected that in the absence of ATP
they have three identical unoccupied ATP binding sites.
We therefore began our exploration of potential mech-
anisms of receptor activation with Scheme 1 (Fig. 10),
which postulates that the channel opens in a single
step subsequent to the binding of ATP to all three sites,
and that there is no change in a binding site as a con-
sequence of ATP binding at other sites. This model
has only four parameters, which by the usual conven-
tion are referred to as binding rate (kon), unbinding
rate (koff), opening rate (β), and closing rate (α). To
estimate the parameters that best fi t this model, we took
two approaches. The fi rst approach was a split analysis
based on the plausible simplifying assumption that if
the pulse of ATP is suffi ciently rapid relative to α, β,
and koff, then all that happens during the pulse is that
some channels get provisioned with ATP, but no chan-
nels open. On this assumption, the time course of the
response is determined entirely by sub-Scheme 1a, while
the amplitude of the response is determined primar ily
by sub-Scheme 1b (Fig. 10). The second approach used a
global fi tting method that made no assumptions about
the relation between parameters. Details of both analyti-
cal approaches are available in the online supplemental
material (available at http://www.jgp.org/cgi/content/
full/jgp.200709779/DC1). Table I shows the results of
both approaches for the mean of six patches. The rate
constants obtained by both approaches differed by <20%
except for the opening rate, where the values obtained
by the global analysis were 50% of those obtained
from the split analysis. The binding rate at the maxi-
mal ATP concentration used (kon * 10 mM ATP) was 36
times faster than the opening rate. The unbinding rate
was about eightfold slower than the channel opening
rate, and the closing rate was 30-fold slower than the
opening rate. At 10 mM ATP, these parameters predict
that 99% of the receptors will have all three ATP sites
occupied by 100 μs.
Further Kinetic AnalysisWhen we used the parameters of the global fi t to Scheme
1 to predict the time course of the currents, there was
good agreement in τdecay and in Amax, but the measured
delay time was about twice as long as the predicted value
of 100 μs, and the experimentally measured rise time
was quite a bit faster than the predicted rise time (200–
300 μs difference). If Scheme 1 were an adequate de-
scription of the behavior of these channels, then the
parameters of this model should fi t the data over the full
range of times and ATP concentrations. To compare the
predictions to the actual traces over a wide range we aver-
aged points on logarithmically spaced intervals to remove
redundancy and noise and then overlaid the data with
the predictions of the global fi tting model (Fig. 10 B).
There were three clear discrepancies. First, Scheme 1
predicts that the currents should rise more rapidly at
high ATP concentration than the measured data. Sec-
ond, the currents in response to low concentrations of
ATP were substantially larger than predicted by the
model. Third, the currents at times >100 ms, although
small, were much larger than predicted by this model.
One trivial possible explanation for why the observed
currents rose later than predicted was that we had over-
fi ltered the data. However, exactly the same fi lter was
applied to the response to the NMDG pulse and the
ATP pulse, so any time shift should cancel out. A second
possibility is that the appearance of ATP at the patch is
delayed far longer than predicted by the diffusion con-
vection model of the switching shown in Fig. 3, so that
the time course of the response to NMDG is not an ac-
curate indicator of when ATP is present. We tested this
TA B L E IKinetic Analysis of the Experimental Data under Scheme 1
a. Split Scheme 1 analysis b. Global Scheme 1 analysis
Macroscopic parameters
τrise (ms) 0.518 ± 10.0% 0.788a
τdecay (ms) 61.3 ± 17.2% 56.3
tδ (ms) 0.203 ± 0.007 0.094a
Am 0.714 ± 0.018 0.68
ka (s−1 μM−1) 6.09 ± 5.7% 6.29
EC50 (μM) 16.3 14.9
kinetic rates
kon (s−1 μM−1) 6.09 ± 5.7% 6.73
koff (s−1) 212 ± 12.5% 166
α (s−1) 54.3 ± 19.8% 45.3
β (s−1) 1681 ± 12.5% 743
Microscopic constants
Π 0.690 0.600
Km (μM) 31.7 24.6
E 24.2 16.4
Values of macroscopic parameters, kinetic rates, and microscopic constants
obtained from six patches by using a split analysis or a global analysis. In the
fi rst case we obtained the macroscopic parameters from the experimental
data (in bold); the kinetic rates were calculated from the macroscopic
parameters. In the second case we obtained the kinetic rates directly from
the experimental data (starting 0.5 ms after the application of the ATP
pulse) by running a nonlinear algorithm. The estimated rates from this
fi t are shown (in bold). The macroscopic parameters and the microscopic
constants were calculated from these kinetic rates.aParameter that differs signifi cantly between the two fi ts.
on March 15, 2016
jgp.rupress.orgD
ownloaded from
Published July 30, 2007
Moffatt and Hume 193
possibility by modeling. We added an additional param-
eter to be optimized in the global fi tting model, which
represented a fi xed delay until the ATP appeared. Not
surprisingly, this succeeded in predicting the delay and
rise time within the experimental error, something that
Scheme 1 alone failed to do. However, this time-shifted
version of Scheme 1 (Fig. 11 B) did a poorer job than
the original Scheme 1 at predicting the responses at
early times to high agonist concentration.
As technical artifacts could not account for the failure
of Scheme 1, we expanded our modeling to include
additional states. We used two alternative strategies: (1) to
fi nd a kinetic scheme that minimizes the number of
states and connections between them, following a previ-
ous study by Ding and Sachs (1999) or (2) the strategy
used by Horrigan and Aldrich (2002) “to defi ne the
simplest mechanism rather than the gating scheme with
the fewest kinetic states that can account for the data.”
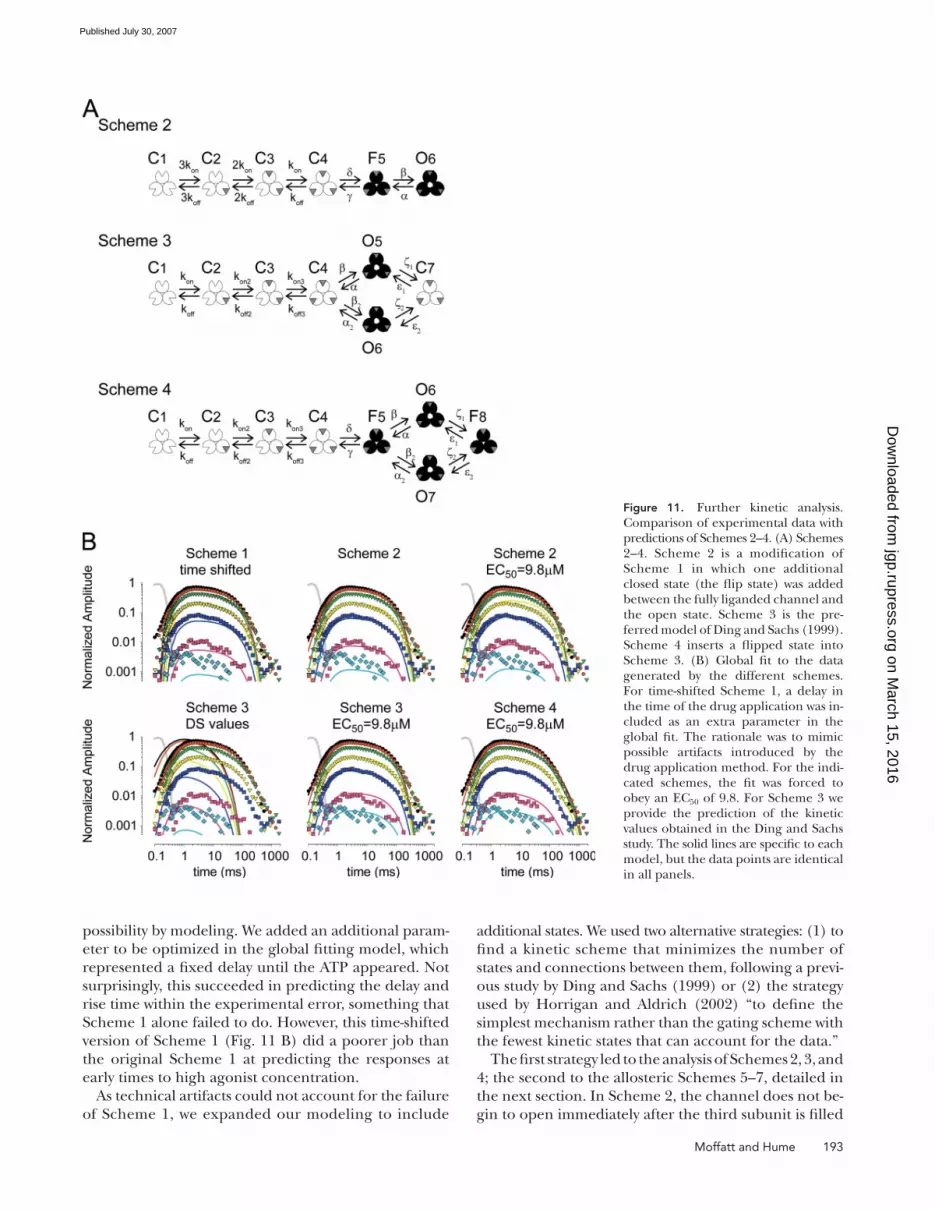
The fi rst strategy led to the analysis of Schemes 2, 3, and
4; the second to the allosteric Schemes 5–7, detailed in
the next section. In Scheme 2, the channel does not be-
gin to open immediately after the third subunit is fi lled
Figure 11. Further kinetic analysis. Comparison of experimental data with predictions of Schemes 2–4. (A) Schemes 2–4. Scheme 2 is a modifi cation of Scheme 1 in which one additional closed state (the fl ip state) was added between the fully liganded channel and the open state. Scheme 3 is the pre-ferred model of Ding and Sachs (1999). Scheme 4 inserts a fl ipped state into Scheme 3. (B) Global fi t to the data generated by the different schemes. For time-shifted Scheme 1, a delay in the time of the drug application was in-cluded as an extra parameter in the global fi t. The rationale was to mimic possible artifacts introduced by the drug application method. For the indi-cated schemes, the fi t was forced to obey an EC50 of 9.8. For Scheme 3 we provide the prediction of the kinetic values obtained in the Ding and Sachs study. The solid lines are specifi c to each model, but the data points are identical in all panels.
on March 15, 2016
jgp.rupress.orgD
ownloaded from
Published July 30, 2007
194 Dynamic Responses of P2X2 Receptors
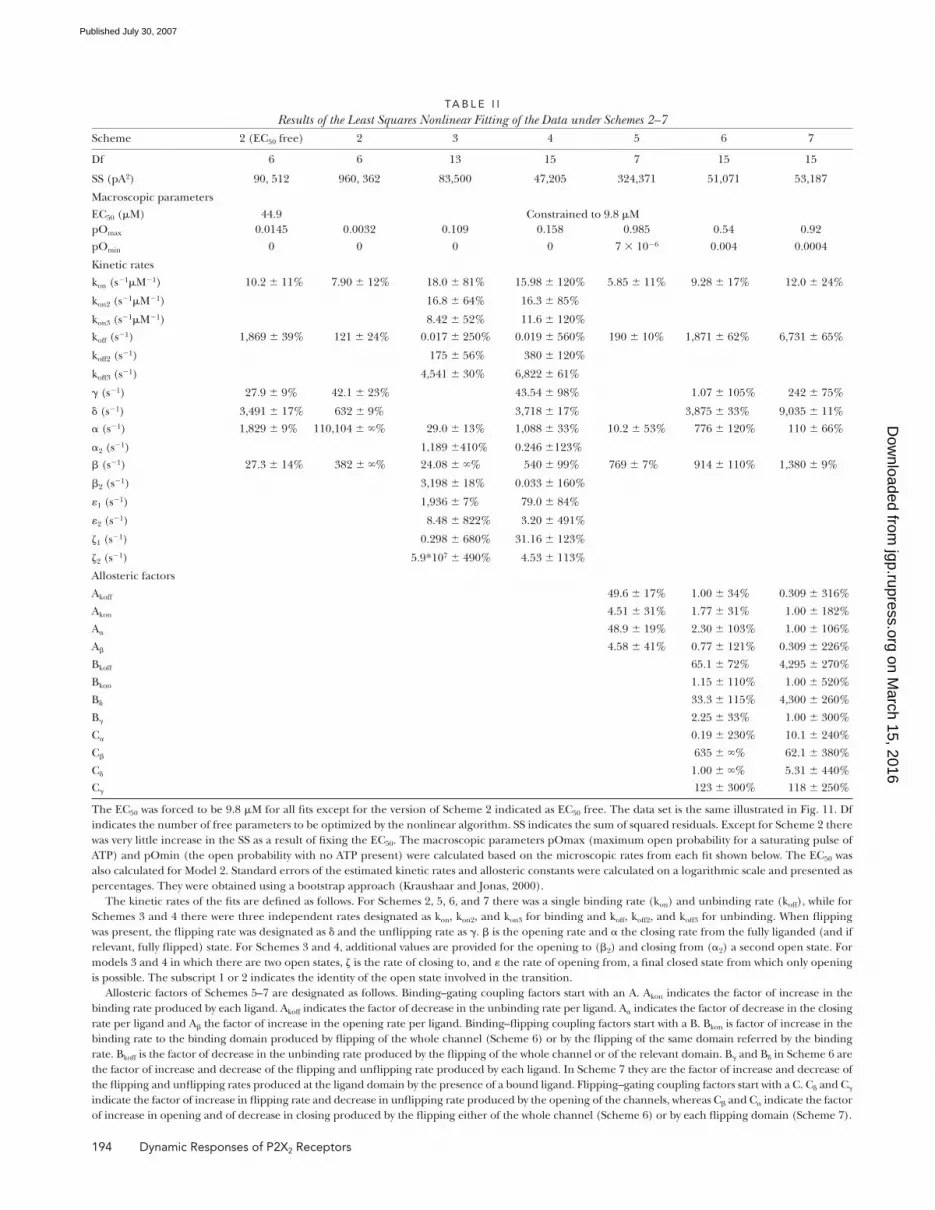
TA B L E I I
Results of the Least Squares Nonlinear Fitting of the Data under Schemes 2–7Scheme 2 (EC50 free) 2 3 4 5 6 7
Df 6 6 13 15 7 15 15
SS (pA2) 90, 512 960, 362 83,500 47,205 324,371 51,071 53,187
Macroscopic parameters
EC50 (μM) 44.9 Constrained to 9.8 μM
pOmax 0.0145 0.0032 0.109 0.158 0.985 0.54 0.92
pOmin 0 0 0 0 7 × 10⁻⁶ 0.004 0.0004
Kinetic rates
kon (s−1μM−1) 10.2 ± 11% 7.90 ± 12% 18.0 ± 81% 15.98 ± 120% 5.85 ± 11% 9.28 ± 17% 12.0 ± 24%
kon2 (s−1μM−1) 16.8 ± 64% 16.3 ± 85%
kon3 (s−1μM−1) 8.42 ± 52% 11.6 ± 120%
koff (s−1) 1,869 ± 39% 121 ± 24% 0.017 ± 250% 0.019 ± 560% 190 ± 10% 1,871 ± 62% 6,731 ± 65%
koff2 (s−1) 175 ± 56% 380 ± 120%
koff3 (s−1) 4,541 ± 30% 6,822 ± 61%
γ (s−1) 27.9 ± 9% 42.1 ± 23% 43.54 ± 98% 1.07 ± 105% 242 ± 75%
δ (s−1) 3,491 ± 17% 632 ± 9% 3,718 ± 17% 3,875 ± 33% 9,035 ± 11%
α (s−1) 1,829 ± 9% 110,104 ± ∞% 29.0 ± 13% 1,088 ± 33% 10.2 ± 53% 776 ± 120% 110 ± 66%
α2 (s−1) 1,189 ±410% 0.246 ±123%
β (s−1) 27.3 ± 14% 382 ± ∞% 24.08 ± ∞% 540 ± 99% 769 ± 7% 914 ± 110% 1,380 ± 9%
β2 (s−1) 3,198 ± 18% 0.033 ± 160%
ε1 (s−1) 1,936 ± 7% 79.0 ± 84%
ε2 (s−1) 8.48 ± 822% 3.20 ± 491%
ζ1 (s−1) 0.298 ± 680% 31.16 ± 123%
ζ2 (s−1) 5.9*107 ± 490% 4.53 ± 113%
Allosteric factors
Akoff 49.6 ± 17% 1.00 ± 34% 0.309 ± 316%
Akon 4.51 ± 31% 1.77 ± 31% 1.00 ± 182%
Aα 48.9 ± 19% 2.30 ± 103% 1.00 ± 106%
Aβ 4.58 ± 41% 0.77 ± 121% 0.309 ± 226%
Bkoff 65.1 ± 72% 4,295 ± 270%
Bkon 1.15 ± 110% 1.00 ± 520%
Bδ 33.3 ± 115% 4,300 ± 260%
Bγ 2.25 ± 33% 1.00 ± 300%
Cα 0.19 ± 230% 10.1 ± 240%
Cβ 635 ± ∞% 62.1 ± 380%
Cδ 1.00 ± ∞% 5.31 ± 440%
Cγ 123 ± 300% 118 ± 250%
The EC50 was forced to be 9.8 μM for all fi ts except for the version of Scheme 2 indicated as EC50 free. The data set is the same illustrated in Fig. 11. Df
indicates the number of free parameters to be optimized by the nonlinear algorithm. SS indicates the sum of squared residuals. Except for Scheme 2 there
was very little increase in the SS as a result of fi xing the EC50. The macroscopic parameters pOmax (maximum open probability for a saturating pulse of
ATP) and pOmin (the open probability with no ATP present) were calculated based on the microscopic rates from each fi t shown below. The EC50 was
also calculated for Model 2. Standard errors of the estimated kinetic rates and allosteric constants were calculated on a logarithmic scale and presented as
percentages. They were obtained using a bootstrap approach (Kraushaar and Jonas, 2000).
The kinetic rates of the fi ts are defi ned as follows. For Schemes 2, 5, 6, and 7 there was a single binding rate (kon) and unbinding rate (koff), while for
Schemes 3 and 4 there were three independent rates designated as kon, kon2, and kon3 for binding and koff, koff2, and koff3 for unbinding. When fl ipping
was present, the fl ipping rate was designated as δ and the unfl ipping rate as γ. β is the opening rate and α the closing rate from the fully liganded (and if
relevant, fully fl ipped) state. For Schemes 3 and 4, additional values are provided for the opening to (β2) and closing from (α2) a second open state. For
models 3 and 4 in which there are two open states, ζ is the rate of closing to, and ε the rate of opening from, a fi nal closed state from which only opening
is possible. The subscript 1 or 2 indicates the identity of the open state involved in the transition.
Allosteric factors of Schemes 5–7 are designated as follows. Binding–gating coupling factors start with an A. Akon indicates the factor of increase in the
binding rate produced by each ligand. Akoff indicates the factor of decrease in the unbinding rate per ligand. Aα indicates the factor of decrease in the closing
rate per ligand and Aβ the factor of increase in the opening rate per ligand. Binding–fl ipping coupling factors start with a B. Bkon is factor of increase in the
binding rate to the binding domain produced by fl ipping of the whole channel (Scheme 6) or by the fl ipping of the same domain referred by the binding
rate. Bkoff is the factor of decrease in the unbinding rate produced by the fl ipping of the whole channel or of the relevant domain. Bγ and Bδ in Scheme 6 are
the factor of increase and decrease of the fl ipping and unfl ipping rate produced by each ligand. In Scheme 7 they are the factor of increase and decrease of
the fl ipping and unfl ipping rates produced at the ligand domain by the presence of a bound ligand. Flipping–gating coupling factors start with a C. Cδ and Cγ
indicate the factor of increase in fl ipping rate and decrease in unfl ipping rate produced by the opening of the channels, whereas Cβ and Cα indicate the factor
of increase in opening and of decrease in closing produced by the fl ipping either of the whole channel (Scheme 6) or by each fl ipping domain (Scheme 7).
on March 15, 2016
jgp.rupress.orgD
ownloaded from
Published July 30, 2007
Moffatt and Hume 195
but rather has to pass through an intermediate closed
state F5, which, following (Colquhoun and Sivilotti,
2004), we call a fl ipped state. Scheme 3 is the preferred
scheme found by Ding and Sachs (1999); it branches
into two open states that converged on a fi nal closed
state. Scheme 4 branches in the same way, but from the
fl ipped state. Results for Schemes 2–4 are illustrated in
Fig. 11 B and the optimized parameters are presented in
Table II. For each scheme we also provide the predicted
value of the macroscopic parameters EC50 and minimal
and maximal open probability. A detailed discussion on
the performance of Schemes 2 and 3 is available in the
online supplemental material (available at http://www
.jgp.org/cgi/content/full/jgp.200709779/DC1).
Scheme 4 fi t the data well over the full range of con-
centrations and times. However, from a mechanistic
point of view it is rather complex. First, Scheme 4 con-
siders that the binding and unbinding rates are depen-
dent on the number of molecules already bound. Since
binding sites are likely to be far apart in the receptor,
this suggests the presence of additional conformational
changes associated with changes in the occupancy of the
binding sites. The nature and kinetics of these confor-
mational changes are not addressed by Scheme 4. Sec-
ond, in Scheme 4 the channel can only open after the
three binding sites are occupied and the channel has
entered into the fl ipped state. In mechanistic terms, this
is the same as saying that there is an “infi nite” coupling
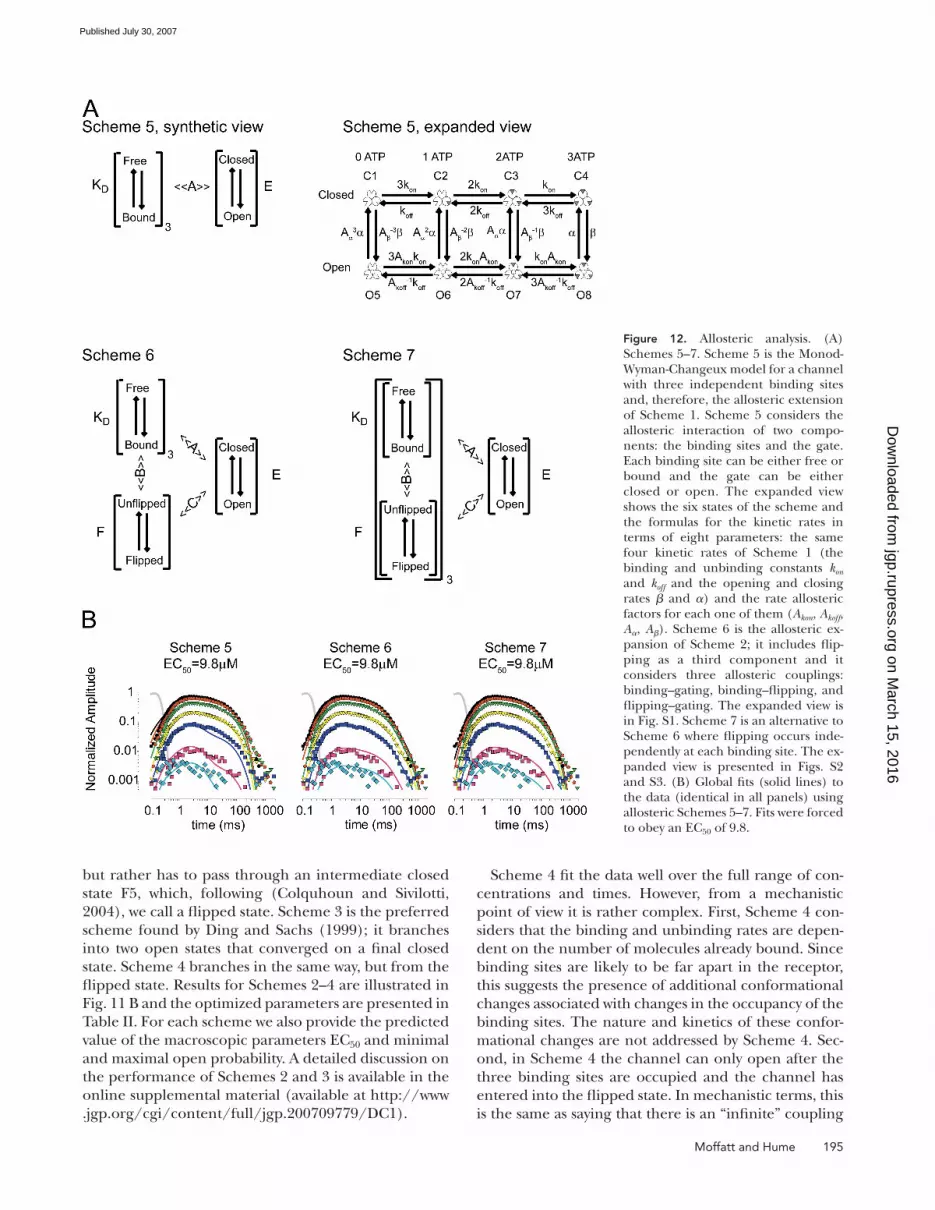
Figure 12. Allosteric analysis. (A) Schemes 5–7. Scheme 5 is the Monod-Wyman-Changeux model for a channel with three independent binding sites and, therefore, the allosteric extension of Scheme 1. Scheme 5 considers the allosteric interaction of two compo-nents: the binding sites and the gate. Each binding site can be either free or bound and the gate can be either closed or open. The expanded view shows the six states of the scheme and the formulas for the kinetic rates in terms of eight parameters: the same four kinetic rates of Scheme 1 (the binding and unbinding constants kon and koff and the opening and closing rates β and α) and the rate allosteric factors for each one of them (Akon, Akoff, Aα, Aβ). Scheme 6 is the allosteric ex-pansion of Scheme 2; it includes fl ip-ping as a third component and it considers three allosteric couplings: binding–gating, binding–fl ipping, and fl ipping–gating. The expanded view is in Fig. S1. Scheme 7 is an alternative to Scheme 6 where fl ipping occurs inde-pendently at each binding site. The ex-panded view is presented in Figs. S2 and S3. (B) Global fi ts (solid lines) to the data (identical in all panels) using allosteric Schemes 5–7. Fits were forced to obey an EC50 of 9.8.
on March 15, 2016
jgp.rupress.orgD
ownloaded from
Published July 30, 2007
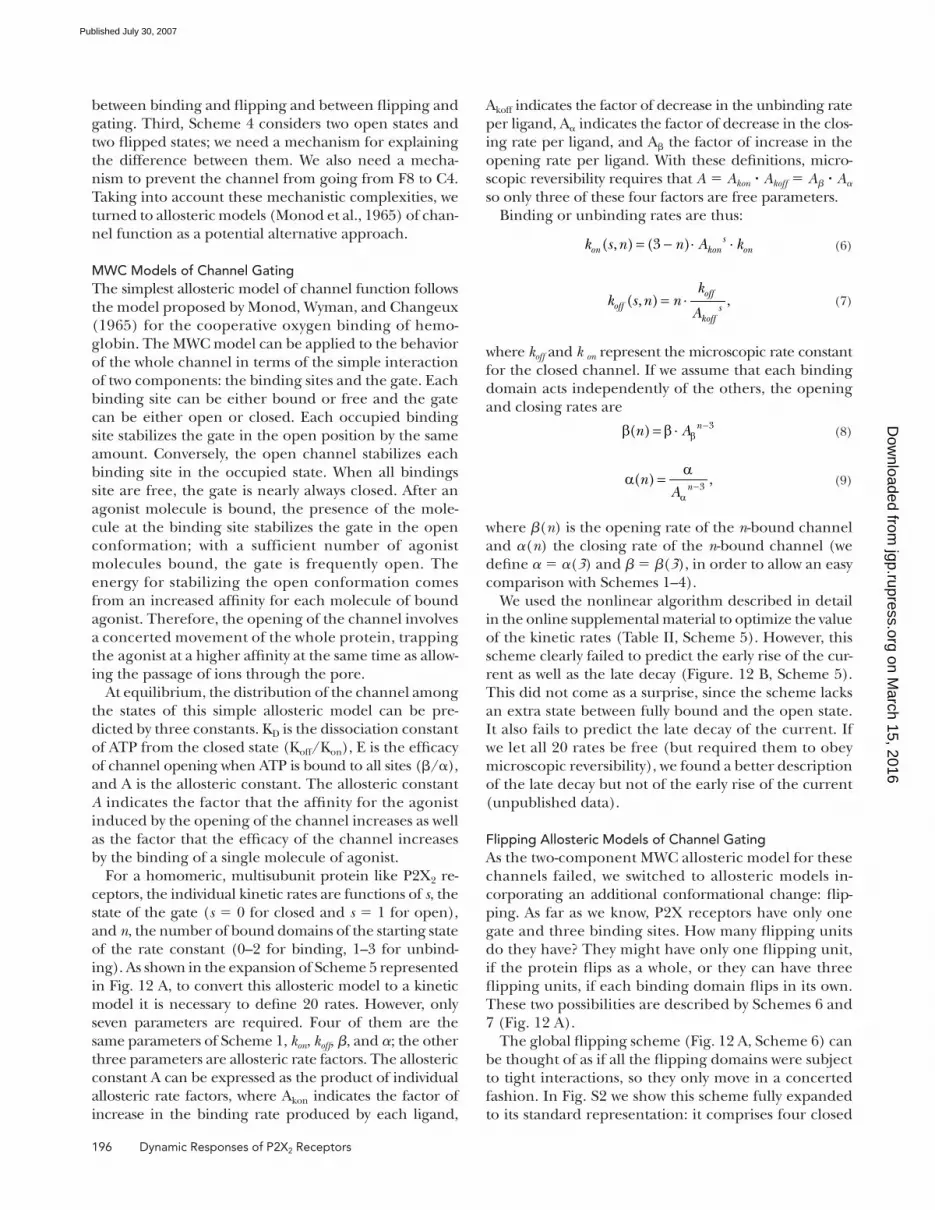
196 Dynamic Responses of P2X2 Receptors
between binding and fl ipping and between fl ipping and
gating. Third, Scheme 4 considers two open states and
two fl ipped states; we need a mechanism for explaining
the difference between them. We also need a mecha-
nism to prevent the channel from going from F8 to C4.
Taking into account these mechanistic complexities, we
turned to allosteric models (Monod et al., 1965) of chan-
nel function as a potential alternative approach.
MWC Models of Channel GatingThe simplest allosteric model of channel function follows
the model proposed by Monod, Wyman, and Changeux
(1965) for the cooperative oxygen binding of hemo-
globin. The MWC model can be applied to the behavior
of the whole channel in terms of the simple interaction
of two components: the binding sites and the gate. Each
binding site can be either bound or free and the gate
can be either open or closed. Each occupied binding
site stabilizes the gate in the open position by the same
amount. Conversely, the open channel stabilizes each
binding site in the occupied state. When all bindings
site are free, the gate is nearly always closed. After an
agonist molecule is bound, the presence of the mole-
cule at the binding site stabilizes the gate in the open
conformation; with a sufficient number of agonist
molecules bound, the gate is frequently open. The
energy for stabilizing the open conformation comes
from an increased affi nity for each molecule of bound
agonist. Therefore, the opening of the channel involves
a concerted movement of the whole protein, trapping
the agonist at a higher affi nity at the same time as allow-
ing the passage of ions through the pore.
At equilibrium, the distribution of the channel among
the states of this simple allosteric model can be pre-
dicted by three constants. KD is the dissociation constant
of ATP from the closed state (Koff/Kon), E is the effi cacy
of channel opening when ATP is bound to all sites (β/α),
and A is the allosteric constant. The allosteric constant
A indicates the factor that the affi nity for the agonist
induced by the opening of the channel increases as well
as the factor that the effi cacy of the channel increases
by the binding of a single molecule of agonist.
For a homomeric, multisubunit protein like P2X2 re-
ceptors, the individual kinetic rates are functions of s, the
state of the gate (s = 0 for closed and s = 1 for open),
and n, the number of bound domains of the starting state
of the rate constant (0–2 for binding, 1–3 for unbind-
ing). As shown in the expansion of Scheme 5 represented
in Fig. 12 A, to convert this allosteric model to a kinetic
model it is necessary to defi ne 20 rates. However, only
seven parameters are required. Four of them are the
same parameters of Scheme 1, kon, koff, β, and α; the other
three parameters are allosteric rate factors. The allosteric
constant A can be expressed as the product of individual
allosteric rate factors, where Akon indicates the factor of
increase in the binding rate produced by each ligand,
Akoff indicates the factor of decrease in the unbinding rate
per ligand, Aα indicates the factor of decrease in the clos-
ing rate per ligand, and Aβ the factor of increase in the
opening rate per ligand. With these defi nitions, micro-
scopic reversibility requires that A = Akon ∙ Akoff = Aβ ∙ Aα
so only three of these four factors are free parameters.
Binding or unbinding rates are thus:
= − ⋅ ⋅( , ) (3 ) s
on kon onk s n n A k
(6)
= ⋅( , ) ,off
off skoff
kk s n n
A
(7)
where koff and k on represent the microscopic rate constant
for the closed channel. If we assume that each binding
domain acts independently of the others, the opening
and closing rates are
−
ββ = β ⋅ 3( ) nn A (8)
−
α
αα =
3( ) ,nn
A
(9)
where β(n) is the opening rate of the n-bound channel
and α(n) the closing rate of the n-bound channel (we
defi ne α = α(3) and β = β(3), in order to allow an easy
comparison with Schemes 1–4).
We used the nonlinear algorithm described in detail
in the online supplemental material to optimize the value
of the kinetic rates (Table II, Scheme 5). However, this
scheme clearly failed to predict the early rise of the cur-
rent as well as the late decay (Figure. 12 B, Scheme 5).
This did not come as a surprise, since the scheme lacks
an extra state between fully bound and the open state.
It also fails to predict the late decay of the current. If
we let all 20 rates be free (but required them to obey
microscopic reversibility), we found a better description
of the late decay but not of the early rise of the current
(unpublished data).
Flipping Allosteric Models of Channel GatingAs the two-component MWC allosteric model for these
channels failed, we switched to allosteric models in-
corporating an additional conformational change: fl ip-
ping. As far as we know, P2X receptors have only one
gate and three binding sites. How many fl ipping units
do they have? They might have only one fl ipping unit,
if the protein fl ips as a whole, or they can have three
fl ipping units, if each binding domain fl ips in its own.
These two possibilities are described by Schemes 6 and
7 (Fig. 12 A).
The global fl ipping scheme (Fig. 12 A, Scheme 6) can
be thought of as if all the fl ipping domains were subject
to tight interactions, so they only move in a concerted
fashion. In Fig. S2 we show this scheme fully expanded
to its standard representation: it comprises four closed
on March 15, 2016
jgp.rupress.orgD
ownloaded from
Published July 30, 2007
Moffatt and Hume 197
unflipped states (C1–C4), four closed flipped states
(F5–F8), and the eight open versions of them all (O9–O16).
In this scheme, the fl ipping ratio increases exponen-
tially with the number of occupied binding sites and
the opening ratio increases in the fl ipped state. This
scheme is analogous to the mechanism postulated by
the Colquhoun group recently for heteromeric glycine
receptors (Burzomato et al., 2004), although the scheme
presented here considers more states and connections.
In the localized fl ipping scheme (Fig. 12 A, Scheme
7), each binding domain fl ips independently and it is
coupled allosterically to its occupancy state. It comprises
40 states (Figs. S3 and S4): four closed unfl ipped states
(C1–C4 with 0–3 bound agonist), six single-fl ipped
states (F5–F10), six double-fl ipped states (F11–F16),
and four triple-fl ipped states (F17–F20) and the 20
open versions of them (O21–O40). The gate is alloste-
rically coupled to the fl ipped domains. The opening
rate increases exponentially with the number of fl ipped
domains (Fig. S2). This scheme is analogous to the pos-
tulated mechanisms of coupling of voltage sensor acti-
vation and Ca2+ binding in the BK channel in which the
interaction occurs only in the same subunit (Horrigan
and Aldrich, 2002). In this scheme, there is no coupled
movement of the channel; the opening of the gate re-
sults from the independent contribution of each fl ip-
ping unit.
Global analyses were performed and the least square
algorithm converged for both Schemes 6 and 7. Both
schemes did an excellent job of reproducing the data
obtained for responses to ultrabrief pulses at durations
up to 800 ms, but poorly predicted the residual current
at longer times (Fig. 12 B, Schemes 6 and 7). None of
the explored schemes predicted the desensitization
found after hundreds of milliseconds.
D I S C U S S I O N
At many chemical synapses the vesicular release mecha-
nism produces a very brief pulse of neurotransmitter
that transiently achieves a high local concentration at
the postsynaptic receptors. To explore the consequences
of a brief appearance of ATP at purinergic synapses, we
developed methods that allowed us to apply and remove
ATP from patches expressing P2X2 receptors within 200
μs. In previous studies of this type on glutamate, GABA,
and ACh receptors (Colquhoun et al., 1992; Franke
et al., 1992; Dzubay and Jahr, 1996), the speed of solution
exchange was assessed by measuring the junction po-
tential produced by solutions of different composition
when the patch was ruptured at the end of the experi-
ment. We found that this was not an adequate test of the
speed of exchange, as it was common to fi nd patches
that gave quite slow responses to ATP concentration
jumps even though the speed of the subsequent junc-
tion potentials indicated that the recording and drug
application pipettes were optimally positioned for fast
exchange. It seems likely that the slow patches had
folded back onto themselves and produced an extra
barrier to diffusion. To deal with this problem, we devel-
oped a calibration method that can be applied to intact
patches. This general approach to measuring solution
exchange time (changing the permeant ions without
changing channel gating) should probably be applied
in all future experiments of this type, regardless of the
specifi c ligand and receptor under study.
Physiological ImplicationsOur rationale for carrying out these experiments was that
rapidly applying ATP to outside-out patches expressing
P2X2 receptors would allow us to gain insight into the
way that P2X2 receptors localized at synapses might
function. Are there in fact synapses that use P2X2 recep-
tors? Light level immunohistochemistry has demon-
strated that the P2X2 protein is widely expressed in the
mammalian central nervous system (Kanjhan et al.,
1999), and immunoelectron microscopy has demon-
strated the presence of P2X2 subunits at synapses in the
cerebellum and hippocampus (Rubio and Soto, 2001) and
in the retina (Puthussery and Fletcher, 2006). There is
physiological evidence for purinergic synaptic signaling
in all three of these regions of the CNS (Burnstock, 2007)
but because of the absence of subunit-specifi c antagonists
and because P2X2 subunits readily form heteromeric
complexes with other P2X subunits, this is insuffi cient
evidence to conclude that homomeric P2X2 receptors
are present at these synapses. Indeed, in systems in-
volved in pain sensation (Cockayne et al., 2005) and
taste sensation (Finger et al., 2005) both the P2X2 and
P2X3 genes need to be knocked out in order to produce
a large diminution in the sensory response, suggesting
that homomeric P2X2 and P2X3 receptors may be rare
in these sensory cells. In contrast, most sympathetic
neurons from P2X2 knockout mice have virtually no re-
sponse to exogenous ATP, suggesting that their normal
responses are dominated by homomeric P2X2 receptors
(Cockayne et al., 2005). Most relevant of all, S type my-
enteric neurons, which normally receive fast excitatory
postsynaptic potentials (EPSPs) that have a cholinergic
and a purinergic component, have no detectable puri-
nergic component to the fast EPSP in P2X2 knockout
mice (Ren et al., 2003). As all P2X receptor subunits
(with the possible exception of P2X6) can form func-
tional homomeric receptors, the implication of this
work is that the purinergic component at these synapses
is due exclusively to homomeric P2X2 receptors. Given
that P2X2 receptors are present at synapses, is the ATP
transient fast? Recent work suggests that ATP release
from glial cells (Cotrina et al., 2000; Stout et al., 2002)
and from rodent taste receptor cells (Huang et al., 2007;
Romanov et al., 2007) may be through connexin or pan-
nexin hemichannels; the kinetics of this type of release
on March 15, 2016
jgp.rupress.orgD
ownloaded from
Published July 30, 2007
198 Dynamic Responses of P2X2 Receptors
mechanism is unknown. However, the release of ATP
from neurons in the mouse cortex appears to be
by conventional fast calcium-dependent exocytosis
(Pankratov et al., 2007) as does ATP release onto the
S type myenteric neurons.
Another important question is how similar the ki-
netics of the ATP responses we measured in patches are
to responses of P2X2 receptors present at synapses.
This is of concern because a number of factors, includ-
ing channel density, patch excision, and the level of ex-
tracellular calcium, are known to dramatically alter the
properties of these receptors.
The density of channels in patches and whole cells
can be estimated by dividing the peak current by the es-
timated surface area, and then scaling the result by the
single channel current and the maximum open proba-
bility. This yields an estimate of 100 channels per μm2
in our patches, but an average density of only 0.5–5
channels per μm2 in dissociated neurons from superior
cervical ganglia, dorsal root ganglia, and nodose gan-
glia (Cockayne et al., 2005). At low expression levels,
P2X2 receptors expressed in oocytes have a high EC50
(Clyne et al., 2003), and ATP is less likely to trigger the
megapore state that allows large cations like NMDG to
permeate the membrane (Fujiwara and Kubo, 2004).
The likely single channel manifestation of these density-
dependent effects is that when a patch contains more
than one functional channel, it is common to see non-
independent gating and the kinetic properties of the
channels in these patches are quite different from
patches with only one channel (Ding and Sachs, 2002).
The observation that nonindependent gating appears
when as few as two channels are in a patch (Ding and
Sachs, 2002) suggests that channels have a high pros-
perity to interact with each other whenever possible.
Theobservation that once the peak current per oocyte
exceeds 10 μA (which corresponds to less than six chan-
nels per μm2) the effect of channel density on the EC50
has saturated (Clyne et al., 2003) supports the same in-
terpretation. Furthermore, P2X2 receptors are known
to be clustered on the cell surface (Khakh et al., 2001;
Ren et al., 2003), especially at synapses. Therefore P2X2
receptors at synapses are likely to be in the high density
state, as are the receptors in our patches.
A second issue of relevance to the properties of the
channels we studied is that we performed our experi-
ments in the presence of 1 mM magnesium, but with no
external calcium, while both calcium and magnesium
would be present at millimolar levels at synapses in vivo.
The rationale for this choice was that P2X2 currents in
outside-out patches desensitize much more rapidly than
P2X2 currents from intact cells (Zhou and Hume, 1998).
Recent work suggests that the loss of membrane-bound
phosphoinositides may be responsible for the change in
channel properties following patch excision (Fujiwara
and Kubo, 2006). This accelerated desensitization was
also demonstrated to depend on extracellular calcium
(Ding and Sachs, 2000). Furthermore, the steady-state
desensitization of outside-out patches exposed to milli-
molar calcium is much more extensive (reaching nearly
100%) than for intact cells, and the recovery from de-
sensitization has a half time of nearly 10 min, meaning
that these patches are unable to respond at all to a sec-
ond application of ATP for several minutes. In contrast,
purinergic synapses on myenteric neurons show no such
rundown. By eliminating extracellular calcium from
the recording solution, we were able to produce steady-
state responses in outside-out patches that more closely
matched the responses of intact cells, and to observe
many ATP responses from a single patch. Thus P2X2 re-
ceptors in outside-out patches have properties most
similar to the endogenous receptors when they are stud-
ied in the absence of calcium. However, it must be rec-
ognized that the receptors in these patches are unlikely
to behave identically to channels present at synapses, so
the detailed kinetic modeling we have performed should
be regarded as providing only the best available infor-
mation as to how synaptic receptors would behave.
A striking observation of the current study was the
relatively slow activation and very slow deactivation of
P2X2 receptors in outside-out patches. For ATP pulses
of 0.2 ms, most channel openings occurred after the
free ATP concentration had fallen back to 0, with the
peak response occurring at 4 ms and the full response
lasting for >500 ms. These properties stand in great
contrast to AMPA type glutamate receptors, which are
also nonselective cation channels, but respond very rap-
idly to the appearance and disappearance of glutamate
(Colquhoun et al., 1992). The kinetic properties of
P2X2 receptors much more closely resemble the prop-
erties of the NMDA receptors found at glutamatergic
synapses (Dzubay and Jahr, 1996). Interestingly, NMDA
receptors and P2X2 receptors are both calcium perme-
able (MacDermott et al., 1986; Mayer and Westbrook,
1987; Evans et al., 1996) and modulated by extracellular
pH and extracellular zinc. However, the modulation is
oppositely directed, with elevated zinc or protons inhib-
iting NMDA receptors (Westbrook and Mayer, 1987;
Tang et al., 1990; Traynelis and Cull-Candy, 1990), but
potentiating P2X2 receptors (Wildman et al., 1998;
Clyne et al., 2002). Similarly, membrane potential also
has opposite effects, with depolarization inhibiting P2X2
receptors due to voltage-dependent gating (Zhou and
Hume, 1998) while depolarization increases current
through NMDA receptors due to a decrease in magne-
sium binding in the pore (Mayer et al., 1984). Thus,
P2X2 receptors have properties capable of producing a
substantial synaptically gated calcium infl ux under con-
ditions under which NMDA receptors are nonfunctional.
The voltage-dependent gating of NMDA receptors is
essential for the computations performed by circuits
involved in learning and forgetting (Xia et al., 1996).
on March 15, 2016
jgp.rupress.orgD
ownloaded from
Published July 30, 2007
Moffatt and Hume 199
P2X2 receptors are very widely expressed in the mam-
malian central nervous system (North, 2002), and it
will be of great interest to determine whether the mod-
ulations by membrane potential and by binding ions
also play a special role in the computations of the neu-
rons that express them.
Kinetic Modeling of P2X2 Receptor CurrentsOur modeling approach was guided by two highly rele-
vant sets of previous results. Ding and Sachs (1999) per-
formed a single channel analysis of P2X2 receptor currents
in single channel patches. We therefore attempted to fi t
our data with their preferred kinetic scheme that requires
all three agonist binding sites to be occupied in order
for channels to open (Scheme 3). Our experimental ap-
proach differs from theirs because we knew the time of
appearance of ATP at the channels, while their approach
was based on studying channels opening and closing with
a steady concentration of ATP present. We therefore had
the potential to discover kinetic information that was not
available in the previous study.
The second modeling approach was motivated by re-
cent studies suggesting that although glycine α subunits
can form homopentameric receptors, not all agonist
sites need to be occupied to get a maximal effect (Gentet
and Clements, 2002; Beato et al., 2004). Colquhoun
and Silvilotti (2004) speculated that “after three of the
M2 domains of the α subunits have rotated, and broken
out of the side-to-side bonds in the hydrophobic gate,
this ring is destabilized as much as possible.” We thought
it possible that the trimeric P2X2 receptors might open
with fewer than three bound ATP, because heteromeric
P2X2/P2X3 receptors can open in response to α,β
methylene ATP, an agonist that produces little or no re-
sponse in P2X2 receptors. Opening from the less then
fully liganded state is a natural property of MWC type
models of channel gating.
For two reasons it was not expected that the parame-
ters reported by Ding and Sachs (1999) from patches
with very few channels would describe our data. First,
P2X2 receptors are voltage dependent (Zhou and
Hume, 1998) and we used a different holding potential
than in the Ding and Sachs study. Second, we studied
receptors at high density, and several studies have indi-
cated that the properties of P2X2 receptors change as
density increases (Ding and Sachs, 2002; Clyne et al.,
2003; Fujiwara and Kubo, 2004). We therefore allowed
our fi tting algorithm to select the optimal parameters.
Scheme 3 predicts that at suffi ciently high ATP concen-
tration, channel opening should be virtually instanta-
neous, but we found that there was a measurable delay
between when ATP arrives and when currents can be
detected. One simple way to account for this delay is to
postulate an additional closed state interposed between
the triply liganded state and the open state (Scheme 4).
By analogy to recent work on glycine receptors, we refer
to this hypothesized state as a fl ipped state. Introducing
a fl ipped state into a model without allosteric interac-
tions (Scheme 2) was not able to reproduce our data,
but two very different types of allosteric models with a
fl ipped state fi t the data well. In Scheme 4, there is
highly signifi cant cooperativity between each binding
step, while in Schemes 6 and 7, there is negligible coop-
erativity of binding. Rather, the major allosteric coupling
is between binding and fl ipping or fl ipping and open-
ing. A specifi c prediction of the MWC models is that the
rate of opening of partially liganded receptors is not
zero. By analogy to studies of nicotinic acetylcholine re-
ceptors, it might be easiest to further explore this issue
in mutant receptors that have increased effi cacy.
We thank members of the Hume laboratory for critical reading of the manuscript. Computational resources were provided by the Center for the Study of Complex Systems, University of Michigan.
This work was supported by National Institutes of Health grant NS039196 (R.I. Hume) and by Agencia Nacional de Promoción Científi ca y Técnológica PICT 06-12345 (L. Moffatt).
Olaf S. Andersen served as editor.
Submitted: 8 March 2007Accepted: 13 July 2007
R E F E R E N C E S Banke, T.G., and S.F. Traynelis. 2003. Activation of NR1/NR2B
NMDA receptors. Nat. Neurosci. 6:144–152.
Barry, P.H., and J.W. Lynch. 1991. Liquid junction potentials and small
cell effects in patch-clamp analysis. J. Membr. Biol. 121:101–117.
Bartoletti, S., B.D. Flury, and D.G. Nel. 1999. Allometric extension.
Biometrics. 55:1210–1214.
Beato, M., P.J. Groot-Kormelink, D. Colquhoun, and L.G. Sivilotti.
2004. The activation mechanism of α1 homomeric glycine recep-
tors. J. Neurosci. 24:895–906.
Brooks, S.P., and K.B. Storey. 1992. Bound and determined: a com-
puter program for making buffers of defi ned ion concentrations.
Anal. Biochem. 201:119–126.
Burnstock, G. 2007. Physiology and pathophysiology of purinergic
neurotransmission. Physiol. Rev. 87:659–797.
Burzomato, V., M. Beato, P.J. Groot-Kormelink, D. Colquhoun, and
L.G. Sivilotti. 2004. Single-channel behavior of heteromeric α1β
glycine receptors: an attempt to detect a conformational change
before the channel opens. J. Neurosci. 24:10924–10940.
Clyne, J.D., L.D. LaPointe, and R.I. Hume. 2002. The role of histi-
dine residues in modulation of the rat P2X2 purinoceptor by zinc
and pH. J. Physiol. 539:347–359.
Clyne, J.D., T.C. Brown, and R.I. Hume. 2003. Expression level depen-
dent changes in the properties of P2X2 receptors. Neuropharmacology. 44:403–412.
Cockayne, D.A., P.M. Dunn, Y. Zhong, W.F. Rong, S.G. Hamilton,
G.E. Knight, H.Z. Ruan, B. Ma, P. Yip, P. Nunn, et al. 2005. P2X(2)
knockout mice and P2X(2)/P2X(3) double knockout mice re-
veal a role for the P2X(2) receptor subunit in mediating multiple
sensory effects of ATP. J. Physiol. 567:621–639.
Colquhoun, D., and L.G. Sivilotti. 2004. Function and structure
in glycine receptors and some of their relatives. Trends Neurosci. 27:337–344.
Colquhoun, D., P. Jonas, and B. Sakmann. 1992. Action of brief
pulses of glutamate on AMPA/kainate receptors in patches
from different neurones of rat hippocampal slices. J. Physiol. 458:261–287.
on March 15, 2016
jgp.rupress.orgD
ownloaded from
Published July 30, 2007
200 Dynamic Responses of P2X2 Receptors
Cotrina, M.L., J.H. Lin, J.C. Lopez-Garcia, C.C. Naus, and M.
Nedergaard. 2000. ATP-mediated glia signaling. J. Neurosci. 20:2835–2844.
Diamond, J.S. 2001. Neuronal glutamate transporters limit activa-
tion of NMDA receptors by neurotransmitter spillover on CA1
pyramidal cells. J. Neurosci. 21:8328–8338.
Ding, S., and F. Sachs. 1999. Single channel properties of P2X2 pu-
rinoceptors. J. Gen. Physiol. 113:695–719.
Ding, S., and F. Sachs. 2000. Inactivation of P2X(2) purinoceptors
by divalent cations. J. Physiol. 522:199–214.
Ding, S., and F. Sachs. 2002. Evidence for non-independent gating
of P2X2 receptors expressed in Xenopus oocytes. BMC Neurosci. 3:17.
Dzubay, J.A., and C.E. Jahr. 1996. Kinetics of NMDA channel open-
ing. J. Neurosci. 16:4129–4134.
Evans, R.J., C. Lewis, C. Virginio, K. Lundstrom, G. Buell, A.
Surprenant, and R.A. North. 1996. Ionic permeability of, and
divalent cation effects on, two ATP-gated cation channels (P2X
receptors) expressed in mammalian cells. J. Physiol. 497:413–422.
Finger, T.E., V. Danilova, J. Barrows, D.L. Bartel, A.J. Vigers, L.
Stone, G. Hellekant, and S.C. Kinnamon. 2005. ATP signaling is
crucial for communication from taste buds to gustatory nerves.
Science. 310:1495–1499.
Franke, C., D. Koltgen, H. Hatt, and J. Dudel. 1992. Activation and
desensitization of embryonic-like receptor channels in mouse mus-
cle by acetylcholine concentration steps. J. Physiol. 451:145–158.
Fujiwara, Y., and Y. Kubo. 2004. Density-dependent changes of the pore
properties of the P2X2 receptor channel. J. Physiol. 558:31–43.
Fujiwara, Y., and Y. Kubo. 2006. Regulation of the desensitization
and ion selectivity of ATP-gated P2X2 channels by phosphoinosi-
tides. J. Physiol. 576:135–149.
Gentet, L.J., and J.D. Clements. 2002. Binding site stoichiometry
and the effects of phosphorylation on human α1 homomeric gly-
cine receptors. J. Physiol. 544:97–106.
Grewer, C. 1999. Investigation of the α1-glycine receptor channel-
opening kinetics in the submillisecond time domain. Biophys. J. 77:727–738.
Hell, J.W., L. Edelmann, J. Hartinger, and R. Jahn. 1991. Functional
reconstitution of the γ-aminobutyric acid transporter from
synaptic vesicles using artifi cial ion gradients. Biochemistry. 30:11795–11800.
Horrigan, F.T., and R.W. Aldrich. 2002. Coupling between voltage
sensor activation, Ca2+ binding and channel opening in large con-
ductance (BK) potassium channels. J. Gen. Physiol. 120:267–305.
Huang, Y.J., Y. Maruyama, G. Dvoryanchikov, E. Pereira, N.
Chaudhari, and S.D. Roper. 2007. The role of pannexin 1 hemi-
channels in ATP release and cell-cell communication in mouse
taste buds. Proc. Natl. Acad. Sci. USA. 104:6436–6441.
Jayaraman, V., S. Thiran, and G.P. Hess. 1999. How fast does the
γ-aminobutyric acid receptor channel open? Kinetic investigations
in the microsecond time region using a laser-pulse photolysis
technique. Biochemistry. 38:11372–11378.
Kanjhan, R., G.D. Housley, L.D. Burton, D.L. Christie, A. Kippenberger,
P.R. Thorne, L. Luo, and A.F. Ryan. 1999. Distribution of the
P2X(2) receptor subunit of the ATP-gated ion channels in the rat
central nervous system. J. Comp. Neurol. 407:11–32.
Khakh, B.S., X.R. Bao, C. Labarca, and H.A. Lester. 1999. Neuronal
P2X transmitter-gated cation channels change their ion selectiv-
ity in seconds. Nat. Neurosci. 2:322–330.
Khakh, B.S., W.B. Smith, C.S. Chiu, D.H. Ju, N. Davidson, and H.A.
Lester. 2001. Activation-dependent changes in receptor distribu-
tion and dendritic morphology in hippocampal neurons express-
ing P2X(2)-green fl uorescent protein receptors. Proc. Natl. Acad. Sci. USA. 98:5288–5293. (published erratum appears in Proc. Natl. Acad. Sci. USA. 2001. 98:7647)
Khakh, B.S., D. Gittermann, D.A. Cockayne, and A. Jones. 2003.
ATP modulation of excitatory synapses onto interneurons.
J. Neurosci. 23:7426–7437.
Kraushaar, U., and P. Jonas. 2000. Effi cacy and stability of quantal
GABA release at a hippocampal interneuron-principal neuron
synapse. J. Neurosci. 20:5594–5607.
Land, B.R., W.V. Harris, E.E. Salpeter, and M.M. Salpeter. 1984.
Diffusion and binding constants for acetylcholine derived from
the falling phase of miniature endplate currents. Proc. Natl. Acad. Sci. USA. 81:1594–1598.
Li, G., W. Pei, and L. Niu. 2003. Channel-opening kinetics of
GluR2Q(fl ip) AMPA receptor: a laser-pulse photolysis study.
Biochemistry. 42:12358–12366.
Li, H., L.M. Nowak, K.R. Gee, and G.P. Hess. 2002. Mechanism of
glutamate receptor-channel function in rat hippocampal neurons
investigated using the laser-pulse photolysis (LaPP) technique.
Biochemistry. 41:4753–4759.
MacDermott, A.B., M.L. Mayer, and G.L. Westbrook. 1986. NMDA-
receptor activation increases cytoplasmic calcium concentration
in cultured spinal cord neurones. Nature. 321:519–522.
Matsubara, N., A.P. Billington, and G.P. Hess. 1992. How fast does
an acetylcholine receptor channel open? Laser-pulse photolysis
of an inactive precursor of carbamoylcholine in the microsecond
time region with BC3H1 cells. Biochemistry. 31:5507–5514.
Mayer, M.L., G.L. Westbrook, and P.B. Buthrie. 1984. Voltage-
dependent block by Mg2+ of NMDA responses in spinal cord neu-
rones. Nature. 309:261–263.
Mayer, M.L., and G.L. Westbrook. 1987. Permeation and block of
N-methyl-d-aspartic acid receptor channels by divalent cations in
mouse cultured central neurones. J. Physiol. 394:501–527.
Monod, J., J. Wyman, and J.P. Changeux. 1965. On nature of alloste-
ric transitions—a plausible model. J. Mol. Biol. 12:88–118.
North, R.A. 2002. Molecular physiology of P2X receptors. Physiol. Rev. 82:1013–1067.
Pankratov, Y., U. Lalo, A. Verkhratsky, and R.A. North. 2007. Quantal
release of ATP in mouse cortex. J. Gen. Physiol. 129:257–265.
Pankratov, Y.V., U.V. Lalo, and O.A. Krishtal. 2002. Role for P2X
receptors in long-term potentiation. J. Neurosci. 22:8363–8369.
Popescu, G., and A. Auerbach. 2003. Model gating of NMDA re-
ceptors and the shape of their synaptic response. Nat. Neurosci. 6:476–483.
Puthussery, T., and E.L. Fletcher. 2006. P2X2 receptors on ganglion
and amacrine cells in cone pathways of the rat retina. J. Comp. Neurol. 496:595–609.
Reid, C.A., J.M. Bekkers, and J.D. Clements. 1998. N- and P/Q-type
Ca2+ channels mediate transmitter release with a similar coopera-
tivity at rat hippocampal autapses. J. Neurosci. 18:2849–2855.
Ren, J., X.C. Bian, M. DeVries, B. Schnegelsberg, D.A. Cockayne,
A. Ford, and J.J. Galligan. 2003. P2X(2) subunits contribute to
fast synaptic excitation in myenteric neurons of the mouse small
intestine. J. Physiol. 552:809–821.
Rogers, A.W., Z. Darzynkiewicz, E.A. Barnard, and M.M. Salpeter.
1966. Number and location of acetylcholinesterase molecules at
motor endplates of the mouse. Nature. 210:1003–1006.
Romanov, R.A., O.A. Rogachevskaja, M.F. Bystrova, P. Jiang, R.F.
Margolskee, and S.S. Kolesnikov. 2007. Afferent neurotransmis-
sion mediated by hemichannels in mammalian taste cells. EMBO J. 26:657–667.
Rubio, M.E., and F. Soto. 2001. Distinct localization of P2X re-
ceptors at excitatory postsynaptic specializations. J. Neurosci. 21:641–653.
Sachs, F. 1999. Practical limits on the maximal speed of solution
exchange for patch clamp experiments. Biophys. J. 77:682–690.
Stiles, J.R., I.V. Kovyazina, E.E. Salpeter, and M.M. Salpeter. 1999.
The temperature sensitivity of miniature endplate currents
on March 15, 2016
jgp.rupress.orgD
ownloaded from
Published July 30, 2007
Moffatt and Hume 201
is mostly governed by channel gating: evidence from opti-
mized recordings and Monte Carlo simulations. Biophys. J. 77:1177–1187.
Stilson, S., A. McClellan, and S. Devasia. 2001. High-speed solution
switching using piezo-based micropositioning stages. IEEE Trans. Biomed. Eng. 48:806–814.
Stout, C.E., J.L. Costantin, C.C. Naus, and A.C. Charles. 2002. Inter-
cellular calcium signaling in astrocytes via ATP release through
connexin hemichannels. J. Biol. Chem. 277:10482–10488.
Tang, C.M., M. Dichter, and M. Morad. 1990. Modulation of the
N-methyl-d-aspartate channel by extracellular H+. Proc. Natl. Acad. Sci. USA. 87:6445–6449.
Tong, G., and C.E. Jahr. 1994. Block of glutamate transporters po-
tentiates postsynaptic excitation. Neuron. 13:1195–1203.
Traynelis, S.F., and S.G. Cull-Candy. 1990. Proton inhibition of
N-methyl-d-aspartate receptors in cerebellar neurons. Nature. 345:347–350.
Virginio, C., A. MacKenzie, F.A. Rassendren, R.A. North, and A.
Surprenant. 1999. Pore dilation of neuronal P2X receptor chan-
nels. Nat. Neurosci. 2:315–321.
Westbrook, G.L., and M.L. Mayer. 1987. Micromolar concentrations
of Zn2+ antagonize NMDA and GABA responses of hippocampal
neurons. Nature. 328:640–643.
Westfall, T.D., C. Kennedy, and P. Sneddon. 1996. Enhancement of
sympathetic purinergic neurotransmission in the guinea-pig iso-
lated vas deferens by the novel ecto-ATPase inhibitor ARL 67156.
Br. J. Pharmacol. 117:867–872.
Wildman, S.S., B.F. King, and G. Burnstock. 1998. Zn2+ modulation
of ATP-responses at recombinant P2X2 receptors and its depen-
dence on extracellular pH. Br. J. Pharmacol. 123:1214–1220.
Xia, Z., H. Dudek, C.K. Miranti, and M.E. Greenberg. 1996.
Calcium infl ux via the NMDA receptor induces immediate early
gene transcription by a MAP kinase/ERK-dependent mechanism.
J. Neurosci. 16:5425–5436.
Zafra, F., C. Aragon, L. Olivares, N. Danbolt, C. Gimenez, and J.
Storm-Mathisen. 1995. Glycine transporters are differentially ex-
pressed among CNS cells. J. Neurosci. 15:3952–3969.
Zhou, Z., and R.I. Hume. 1998. Two mechanisms for inward rectifi -
cation of current fl ow through the purinoceptor P2X(2) class of
ATP-gated channels. J. Physiol. 507:353–364.
on March 15, 2016
jgp.rupress.orgD
ownloaded from
Published July 30, 2007