response to comments of reviewers
TRANSCRIPT
1
Response to comments of Reviewers
Manuscript doi:10.5194/hess-2017-189, 2017
Title: Spatial Extent of Future Changes in the Hydrologic Cycle Components in Ganga Basin using Ranked
CORDEX RCMs
Authors: Jatin Anand, Manjula Devak, Ashvani Kumar Gosain, Rakesh Khosa and Dhanya C.T. 5
We would like to express our gratitude to the referees for constructive and helpful comments. We have revised
the manuscript based on these comments and hope that the revised manuscript reads better and is acceptable. Our
specific responses to the reviewer’s comments are given below.
10 Response to Comments of Reviewer #2
Comment: For example, what are the reasons for using SWAT?
Response: As rightly mentioned by the reviewer, a wide range of hydrological models are available (e.g., SWAT, 15 VIC, TOPMODEL etc.). However, SWAT is deployed in the present study, due to its widely-known versatility.
Arnold et al. (1999) in his study used SWAT model to simulate the entire U.S.A. for river discharges at around
6000 gauging stations. Gosain et al., (2006) modeled twelve large river catchments in India with the purpose of
quantifying the climate change impact on hydrology. Faramarzi et al., (2013) used the African model to study the
impact of climate change in Africa. Abbaspour et al., (2015) simulated hydrology and water quality for entire 20 Europe. Also. the larger capacity of ArcGIS now allows building finer resolution large-scale models, which could
be calibrated using powerful parallel processing (Rouholahnejad et al., 2012). It includes a snow module,
permitting the delimitation of up to ten elevation bands with associated precipitation and temperature lapse rates
(Fontaine et al., 2002; Rahman et al., 2013). Also, SWAT allows users to define simulation of irrigation water on
cropland on the basis of five alternative sources: stream reach, reservoir, shallow aquifer, deep aquifer, or a water 25 body source external to the watershed (Gassman et al., 2007). In addition to it, SWAT provide the users Reservoir
operation and inclusion of domestic water demands, which other models lack. Furthermore, SWAT allows the
users to limit the size of catchment based on the gauge and reservoir sites, which the other grid based models lack
and is an important factor considering the size of the basin. The wide range of SWAT applications, underscores
that the model is a very flexible and robust tool that can be used to simulate a variety of watershed problems. 30 Moreover, the process of developing SWAT model for a given watershed has also been significantly facilitated
by the development of GIS-based interfaces, which provide a direct means of translating digital topographic, land
use, and soil data into model inputs. Also, it is an open source code which ensures the improvement in the
simulation accuracy of key processes.
35 Manuscript is revised by adding the following lines. Vide Pg. 7, lines 11-18 of the revised manuscript.
“SWAT has inbuilt snow module to capture and simulate snowmelt hydrology, permitting the delimitation of up
to ten elevation bands with associated precipitation and temperature lapse rates (Fontaine et al., 2002; Rahman
et al., 2013). In addition, SWAT allows users to add lapse rate for both precipitation (PLAPS) and temperature
(TLAPS) which is very essential in the study region considered. In this study, sub-basin has been divided into ten 40
2
elevation bands. Furthermore, in SWAT the date and net volume of irrigation water can be set according to the
actual condition along with the irrigation water source (surface rivers, reservoirs or groundwater, etc). Also, the
domestic, ecological and industrial water in the model can be added in the model as “consumptive use water”.”
5 -----------------------------------------X-------------------------------------------X------------------------
Comment: Why was RCP4.5 used?
Response: In the IPCC 4th Assessment Report, the emission scenarios were fabricated in view of the storylines 10 that were gathered into an all the more financially concerned advancement or a more ecological and sustainable
advancement, and into a more globalized world or an all the more regionally developing world. While, In the
IPCC 5th Assessment Report, the scenarios are based on total anthropogenic radiative forcings towards the end
of the 21st century. Economic models can take diverse ways to achieve distinctive radiative forcings that are
equivalent to distinctive concentration paths of the greenhouse gases, the so-called Representative Concentration 15 Pathway scenarios (RCPs). The different scenarios are marked as: RCP 8.5, RCP 4.5 and RCP 2.6, which
correspond to radiative forcings of 8.5 Wm−2, 4.5 Wm−2, and 2.6 Wm−2, respectively. The first RCP is the most
skeptical and results in a worldwide warming towards the end of the 21st century of about 4˚C, whereas the last
RCP is the most optimistic and corresponds to a global warming of about 1˚C. Then again, RCP 4.5 can be
reasoned as neither extreme (RCP 8.5), nor mild (RCP 2.5); but the moderate degree scenario, which can be 20 helpful in capturing the average response of the catchment. The RCP 4.5 resembles around to B1 scenario in IPCC
4th Assessment Report, the radiative forcing increases almost linearly up to about the year 2060 and then slows
down the increase rate until the end of the century where it stabilizes. Moreover, the forcing pathway of the
RCP4.5 scenario is similar to a several climate policy situations and numerous low-emissions reference
conditions, such as the SRES B1 scenario. In this work, the results are shown for RCP 4.5 scenario. 25
Manuscript is revised by adding the following lines. Vide Pg. 6, lines 8-26 of the revised manuscript.
In the IPCC 4th Assessment Report, the emission scenarios were fabricated in view of the storylines that were
gathered into an all the more financially concerned advancement or a more ecological and sustainable
advancement, and into a more globalized world or an all the more regionally developing world. While, In the 30 IPCC 5th Assessment Report, the scenarios are based on total anthropogenic radiative forcings towards the end
of the 21st century. Economic models can take diverse ways to achieve distinctive radiative forcings that are
equivalent to distinctive concentration paths of the greenhouse gases, the so-called Representative Concentration
Pathway scenarios (RCPs). The different scenarios are marked as: RCP 8.5, RCP 4.5 and RCP 2.6, which
correspond to radiative forcings of 8.5 Wm−2, 4.5 Wm−2, and 2.6 Wm−2, respectively. The first RCP is the most 35 skeptical and results in a worldwide warming towards the end of the 21st century of about 4˚C, whereas the last
RCP is the most optimistic and corresponds to a global warming of about 1˚C. Then again, RCP 4.5 can be
reasoned as neither extreme (RCP 8.5), nor mild (RCP 2.5); but the moderate degree scenario, which can be
helpful in capturing the average response of the catchment. The RCP 4.5 resembles around to B1 scenario in
IPCC 4th Assessment Report, the radiative forcing increases almost linearly up to about the year 2060 and then 40
3
slows down the increase rate until the end of the century where it stabilizes. Apparently, RCP 4.5 is a stabilization
scenario in which total radiative forcing is stabilized just after 2100, without exceeding the long-run radiative
forcing target level. Moreover, the forcing pathway of the RCP4.5 scenario is similar to a several climate policy
situations and numerous low-emissions reference conditions, such as the SRES B1 scenario (Wise et al., 2009).
Thus, in this study, RCP 4.5 scenario is adopted to study the impact of climate change on the different hydrologic 5 components and the results are shown for the same.ˆ’
-----------------------------------------X-------------------------------------------X------------------------
Comment: Why were the RCMs evaluated on the basis of streamflow and not precipitation? 10
Response: Streamflow is an important component for ensuring proper management and ensuring sustainable use
of water wealth. However, just analysing precipitation and temperature does not give us the complete picture of
the inherent hydrology of the basin. As, just determining the increase or decrease in the precipitation and
temperature doesn’t provide any information whatsoever about the streamflow being generated or for that matter 15 how much recharge that may happen or how much evapotranspiration occurred in the watershed. While, all the
stakeholders and managers and policy makers are more likely to be interested on the availability of water for that
matter. Moreover, other important hydrological components such as recharge and base flow can’t be figured out
just by analysing the precipitation. Also, ET can be an important factor when assessing the hydrological
characteristic of the basin. Hence, it was necessary to rank the RCMs based on the end product, i.e. streamflow. 20 Here, we tried to establish which RCM performed better in mimicking the hydrology of the basin (surface runoff
in this case – the only observed variable). The comparison with respect to observed runoff, however, indirectly
take into account the precipitation characteristics also, since all the other parameters used in the model are same.
Manuscript is revised by adding the following lines. Vide Pg. 12, lines 7-13 of the revised manuscript. 25 “SWAT model developed for Ganga river basin is calibrated manually by following a systematic approach
(Arnold et al., 2012). At first, upstream gauge is calibrated and the parameters corresponding to that gauge site
are kept constant while the parameters of the sub-basins between upstream gauge and the next downstream gauge
site is calibrated. The same approach was repeated for the next downstream stations till we reach the outlet of
the catchment (Farakka). Once the model has been established competent enough to mimic the hydrology of the 30 entire basin, then it is simulated using the outputs from different RCMs, using same set of calibrated parameters.”
Manuscript is revised by adding the following lines. Vide Pg. 16, lines 6-9 of the revised manuscript.
“The ranking of RCMs is done to establish, which RCM performed better in mimicking the hydrology of the basin
(surface runoff in this case – the only observed variable). The comparison with respect to observed runoff, 35 however, indirectly take into account the precipitation characteristics also, since all the other parameters used
in the model are same.”
-----------------------------------------X-------------------------------------------X------------------------
4
Comment: The hydrological model has been calibrated with discharge measurements at various points on the
Ganga and its tributaries. However, this river system is both highly regulated by surface water infrastructure and
strongly influenced by anthropogenic activities within the basin. Clearly the assumption that such factors are
stationary is false (as the authors acknowledge), which leads me to question the validity and utility of projections
of surface runoff using this approach. This should be discussed in more detail. 5
Response: The authors agree with the reviewer comment that the river system is highly regulated by surface water
infrastructure and strongly influenced by anthropogenic activities. Also, the authors agree that the stationarity is
not going to be there in terms of how the available water is going to be utilized in the basin. However, the authors
would like to add that to determine the way the available water is going to be utilised in the basin is beyond the 10 scope of the study. For example, the irrigation efficiency at present in India hovers around 0.35-0.45, but that
can’t be said to be keep on continuing as farmers are getting things automated and adopting the new and advanced
practices that are currently available. Moreover, the cropping pattern in this region is quite unpredictable where
few decades back there was no paddy crops grown in the Punjab and Haryana (western region of the basin) part,
but has become a dominant grown crop by leap and bounds and requires huge amount of water. Also, the basin 15 has seen the farmers moving from food crops to cash crops that have considerable impact on the seasonal
availability of water. Then again, there is a continuous increase in industrial demand which cannot be pre-
determined as the numbers as well as source keeps on changing.
Thus, it can be safely said that the results obtained is the most optimistic one and suffice the main objective of the
study i.e. to determine the available water in the wake of changing climate and remind the policy makers and 20 stakeholders to make the management policy for sustainable management of water before the things change for
the worse.
-----------------------------------------X-------------------------------------------X------------------------
25 Comment: Further, the authors do not really justify their choice of SWAT. Why not a process-based, distributed
model such as VIC, which has previously been used to assess hydrological change in the Ganga basin (e.g.
Chawla and Mujumdar (2015), who also consider land use change)?
Response: As rightly mentioned by the reviewer, a wide range of hydrological models are available (e.g., SWAT, 30 VIC, TOPMODEL etc.). However, SWAT is deployed in the present study, due to its widely-known versatility.
Arnold et al. (1999) in his study used SWAT model to simulate the entire U.S.A. for river discharges at around
6000 gauging stations. Gosain et al., (2006) modeled twelve large river catchments in India with the purpose of
quantifying the climate change impact on hydrology. Faramarzi et al., (2013) used the African model to study the
impact of climate change in Africa. Abbaspour et al., (2015) simulated hydrology and water quality for entire 35 Europe. Also. the larger capacity of ArcGIS now allows building finer resolution large-scale models, which could
be calibrated using powerful parallel processing (Rouholahnejad et al., 2012). It includes a snow module,
permitting the delimitation of up to ten elevation bands with associated precipitation and temperature lapse rates
(Fontaine et al., 2002; Rahman et al., 2013). Also, SWAT allows users to define simulation of irrigation water on
cropland on the basis of five alternative sources: stream reach, reservoir, shallow aquifer, deep aquifer, or a water 40
5
body source external to the watershed (Gassman et al., 2007) which is not possible in the other models. In addition
to it, SWAT provide the users Reservoir operation and inclusion of domestic water demands, which other models
lack. Furthermore, SWAT allows the users to limit the size of catchment based on the gauge and reservoir sites,
which the other grid based models lack and is an important factor considering the size of the basin. The wide
range of SWAT applications, underscores that the model is a very flexible and robust tool that can be used to 5 simulate a variety of watershed problems. Moreover, the process of developing SWAT model for a given
watershed has also been significantly facilitated by the development of GIS-based interfaces, which provide a
direct means of translating digital topographic, land use, and soil data into model inputs. Also, it is an open source
code which ensures the improvement in the simulation accuracy of key processes.
10
-----------------------------------------X-------------------------------------------X------------------------
Comment: What is the reason for choosing to rank RCMs according to surface runoff? In my opinion the
performance of RCMs should be evaluated using precipitation. Do the same three models perform best if you use 15 precipitation, not surface runoff, for evaluation purposes?
Response: Once the model has been established competent enough to mimic the hydrology of the entire basin,
then it is simulated using the outputs from different RCMs, using same set of calibrated parameters. Here, we
tried to establish which RCM performed better in mimicking the hydrology of the basin (surface runoff in this 20 case – the only observed variable). The comparison with respect to observed runoff, however, indirectly take into
account the precipitation characteristics also, since all the other parameters used in the model are same.
Manuscript is revised by adding the following lines. Vide Pg. 12, lines 7-13 of the revised manuscript.
“SWAT model developed for Ganga river basin is calibrated manually by following a systematic approach 25 (Arnold et al., 2012). At first, upstream gauge is calibrated and the parameters corresponding to that gauge site
are kept constant while the parameters of the sub-basins between upstream gauge and the next downstream gauge
site is calibrated. The same approach was repeated for the next downstream stations till we reach the outlet of
the catchment (Farakka). Once the model has been established competent enough to mimic the hydrology of the
entire basin, then it is simulated using the outputs from different RCMs, using same set of calibrated parameters.” 30 Manuscript is revised by adding the following lines. Vide Pg. 16, lines 6-9 of the revised manuscript.
“The ranking of RCMs is done to establish, which RCM performed better in mimicking the hydrology of the basin
(surface runoff in this case – the only observed variable). The comparison with respect to observed runoff,
however, indirectly take into account the precipitation characteristics also, since all the other parameters used 35 in the model are same.”
-----------------------------------------X-------------------------------------------X------------------------
6
Comment: Throughout the manuscript the authors attribute some of the change in surface runoff to changes in
snowmelt. While snowmelt is undoubtedly an important factor in the Himalayas, I cannot imagine the relative
contribution in, say, Farakka is very high. Maybe I’m wrong, but in any case the authors must first quantify the
contribution of snowmelt to surface runoff and place any discussion of the impact of changes in snowmelt in this
context. 5
Response: The quantification of snowmelt to snowmelt to surface runoff has been done and also impact of
changes in snowmelt has been quantified (Figure S1 in supplementary material). The authors agree that the relative
contribution at Farakka is very small but in the context of snow dominant and areas downstream to it is very
essential. 10
-----------------------------------------X-------------------------------------------X------------------------
Comment: Since the aim of the paper is to assess the spatial extent of future changes in hydrology it should 15 quantify the relative contribution of various hydrological processes to streamflow at different points in
the basin. This would be an interesting study. Presently, however, readers are left with little understanding
about the reason for the spatial variability in surface runoff apart from the precipitation pattern.
Response: Thanks for bringing this into the notice of the authors. Requisite changes are made during the 20 manuscript revision. Results pertaining to the quantitative assessment of the different hydrologic components for
different tributaries of Ganga basin has been added in Section 6.4 (Pg. 26)
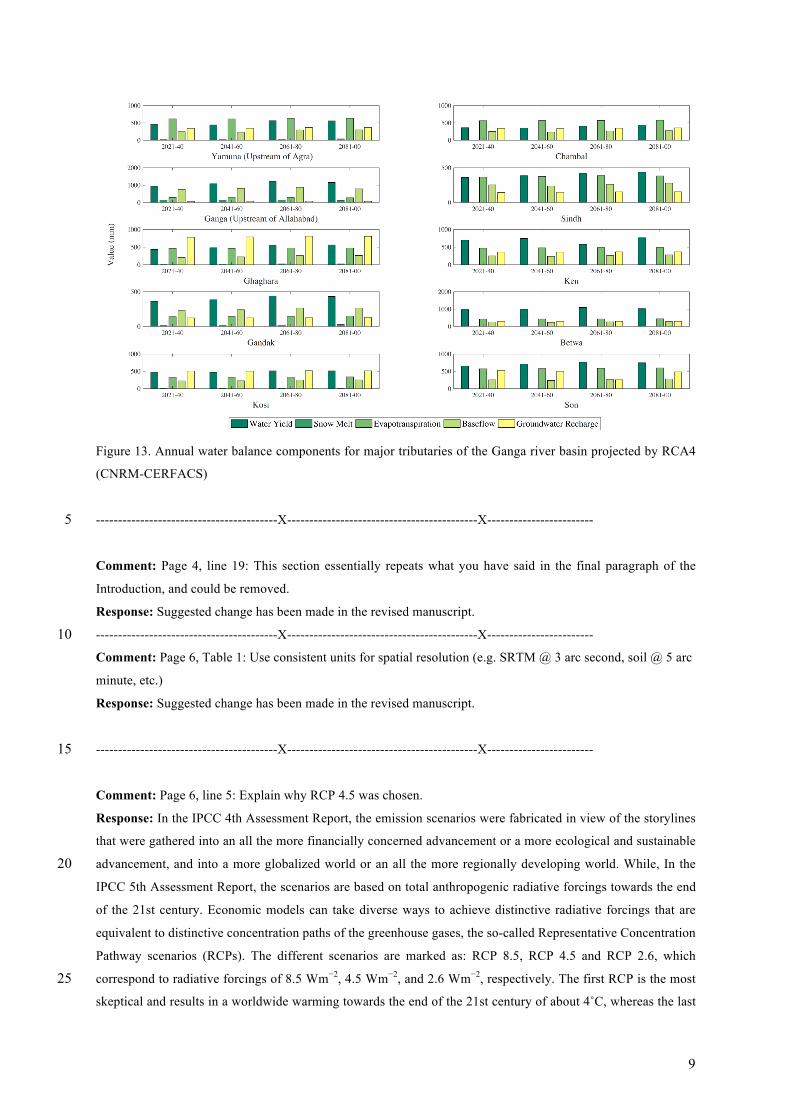
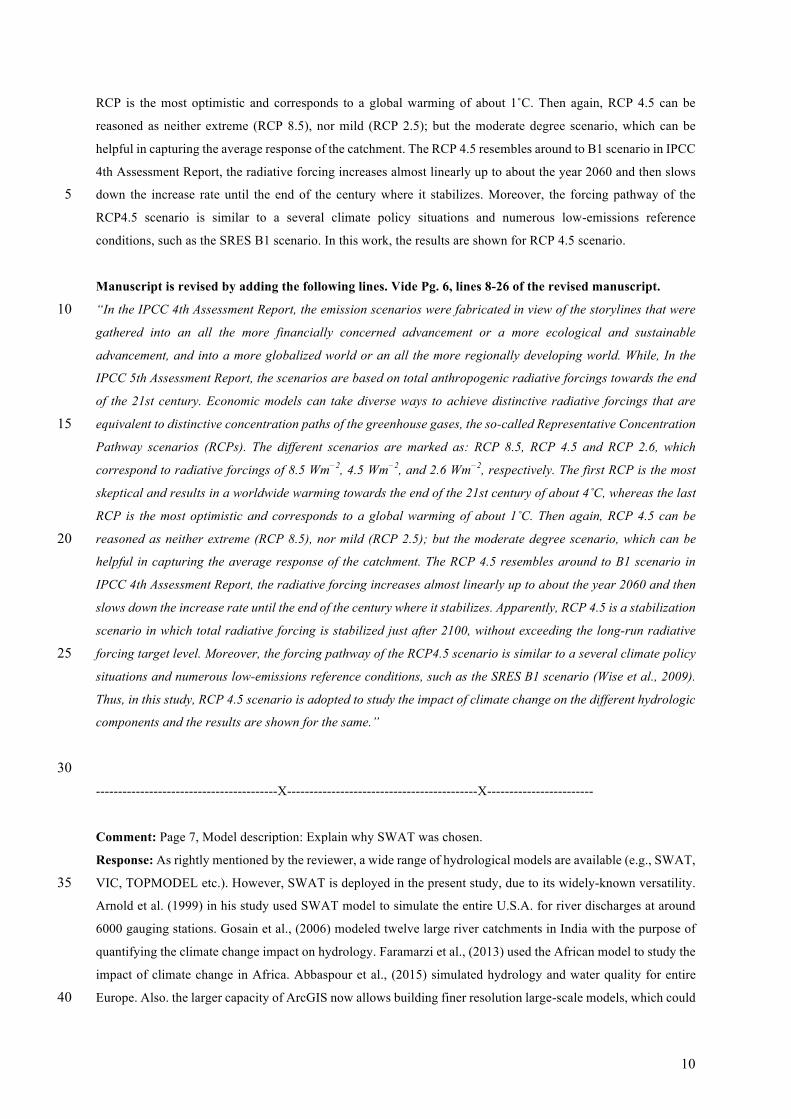
Manuscript is revised by adding the following lines. Vide Pg. 26, lines 4-11 of the revised manuscript.
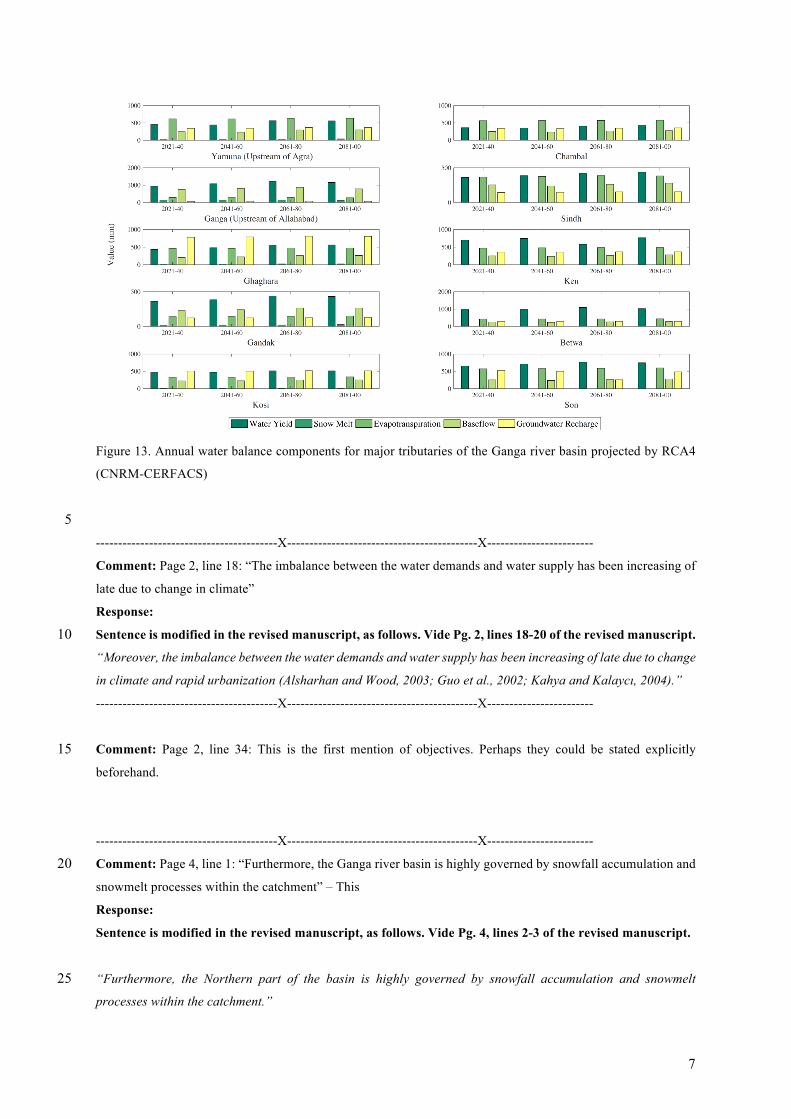
“Apparently, in the order to tackle the water management issues proficiently, it is important to quantify and 25 analyze the different hydrologic components within the basin for different system. Water balance is an important
component in SWAT model as it involves all the processes happening within the watershed area (Fletcher et al.,
2013; Shawul et al., 2013). The analysis of the results projected by RCA4 (CNRM-CERFACS) for the different
systems of Ganga river basin show that the water yield and evapotranspiration has the major share in the water
balance (Figure 13). Further examination of results reveal that the Upper Ganga River System (Upstream of 30 Allahabad) have made the largest contribution to the water yield in the catchment while Chambal and Sindh river
systems have the lowest contribution in the total water yield (Figure 13).”
7
Figure 13. Annual water balance components for major tributaries of the Ganga river basin projected by RCA4
(CNRM-CERFACS)
5 -----------------------------------------X-------------------------------------------X------------------------
Comment: Page 2, line 18: “The imbalance between the water demands and water supply has been increasing of
late due to change in climate”
Response:
Sentence is modified in the revised manuscript, as follows. Vide Pg. 2, lines 18-20 of the revised manuscript. 10 “Moreover, the imbalance between the water demands and water supply has been increasing of late due to change
in climate and rapid urbanization (Alsharhan and Wood, 2003; Guo et al., 2002; Kahya and Kalaycı, 2004).”
-----------------------------------------X-------------------------------------------X------------------------
Comment: Page 2, line 34: This is the first mention of objectives. Perhaps they could be stated explicitly 15 beforehand.
-----------------------------------------X-------------------------------------------X------------------------
Comment: Page 4, line 1: “Furthermore, the Ganga river basin is highly governed by snowfall accumulation and 20 snowmelt processes within the catchment” – This
Response:
Sentence is modified in the revised manuscript, as follows. Vide Pg. 4, lines 2-3 of the revised manuscript.
“Furthermore, the Northern part of the basin is highly governed by snowfall accumulation and snowmelt 25 processes within the catchment.”
8
-----------------------------------------X-------------------------------------------X------------------------
Comment: The following claim, that “snowmelt processes provide most of the surface water during non-monsoon
season” is at best misleading and should be explained further.
Response: 5 Sentence is modified in the revised manuscript, as follows. Vide Pg. 4, lines 3-5 of the revised manuscript.
“Since snowmelt processes is one of the major contributor to the surface water during non-monsoon season in
this region of the basin, its monitoring is important in hydrologic simulations.”
10 -----------------------------------------X-------------------------------------------X------------------------
Comment: Page 4, line 25: “The primary sources of water in the river are precipitation, base flow, and snowmelt
water from the Himalayas” - again, this statement fails to recognise that the relative importance of these sources
changes as the river moves downstream. Meltwater may well be an important component of discharge in Rishikesh 15 or Haridwar, but in Patna or Farukka, say, I would imagine it’s contribution would be very small. In any case the
contribution of the various hydrological processes should be quantified.
Response: Thanks for bringing this into the notice of the authors. Requisite changes are made during the
manuscript revision. Results pertaining to the quantitative assessment of the different hydrologic components for
different tributaries of Ganga basin has been added in Section 6.4 (Pg. 26) 20 Manuscript is revised by adding the following lines. Vide Pg. 26, lines 4-11 of the revised manuscript.
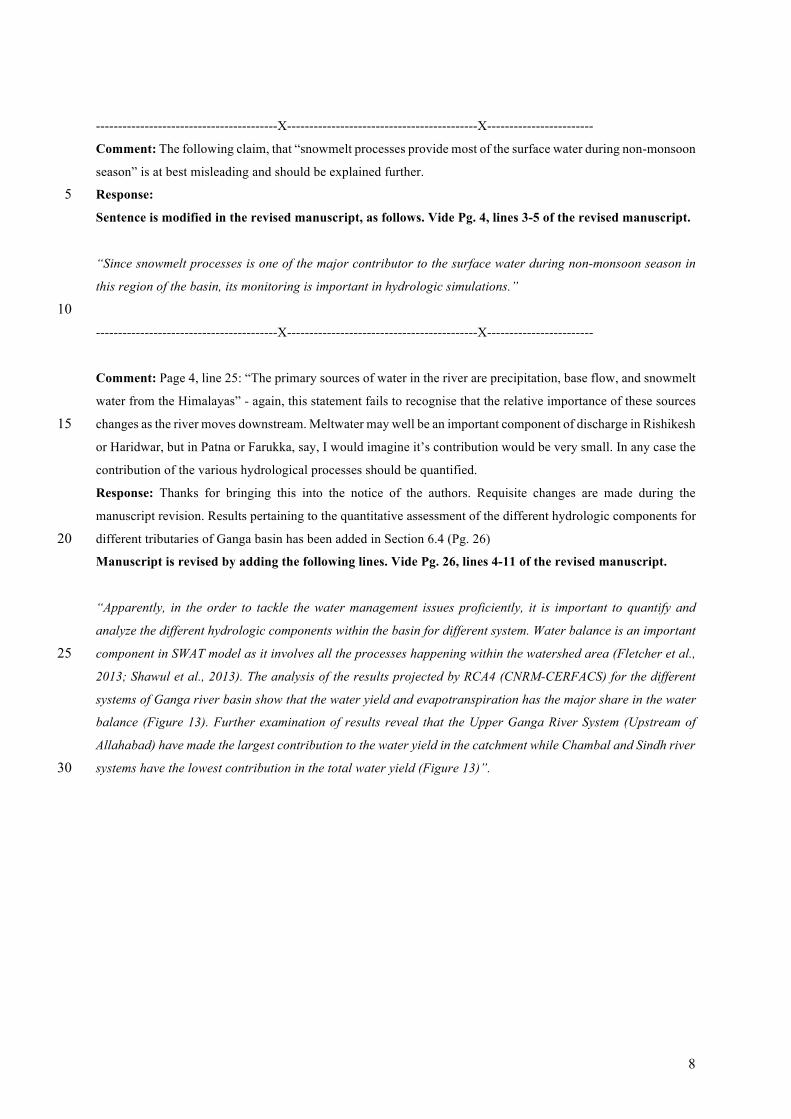
“Apparently, in the order to tackle the water management issues proficiently, it is important to quantify and
analyze the different hydrologic components within the basin for different system. Water balance is an important
component in SWAT model as it involves all the processes happening within the watershed area (Fletcher et al., 25 2013; Shawul et al., 2013). The analysis of the results projected by RCA4 (CNRM-CERFACS) for the different
systems of Ganga river basin show that the water yield and evapotranspiration has the major share in the water
balance (Figure 13). Further examination of results reveal that the Upper Ganga River System (Upstream of
Allahabad) have made the largest contribution to the water yield in the catchment while Chambal and Sindh river
systems have the lowest contribution in the total water yield (Figure 13)”. 30
9
Figure 13. Annual water balance components for major tributaries of the Ganga river basin projected by RCA4
(CNRM-CERFACS)
-----------------------------------------X-------------------------------------------X------------------------ 5
Comment: Page 4, line 19: This section essentially repeats what you have said in the final paragraph of the
Introduction, and could be removed.
Response: Suggested change has been made in the revised manuscript.
-----------------------------------------X-------------------------------------------X------------------------ 10 Comment: Page 6, Table 1: Use consistent units for spatial resolution (e.g. SRTM @ 3 arc second, soil @ 5 arc
minute, etc.)
Response: Suggested change has been made in the revised manuscript.
-----------------------------------------X-------------------------------------------X------------------------ 15
Comment: Page 6, line 5: Explain why RCP 4.5 was chosen.
Response: In the IPCC 4th Assessment Report, the emission scenarios were fabricated in view of the storylines
that were gathered into an all the more financially concerned advancement or a more ecological and sustainable
advancement, and into a more globalized world or an all the more regionally developing world. While, In the 20 IPCC 5th Assessment Report, the scenarios are based on total anthropogenic radiative forcings towards the end
of the 21st century. Economic models can take diverse ways to achieve distinctive radiative forcings that are
equivalent to distinctive concentration paths of the greenhouse gases, the so-called Representative Concentration
Pathway scenarios (RCPs). The different scenarios are marked as: RCP 8.5, RCP 4.5 and RCP 2.6, which
correspond to radiative forcings of 8.5 Wm−2, 4.5 Wm−2, and 2.6 Wm−2, respectively. The first RCP is the most 25 skeptical and results in a worldwide warming towards the end of the 21st century of about 4˚C, whereas the last
10
RCP is the most optimistic and corresponds to a global warming of about 1˚C. Then again, RCP 4.5 can be
reasoned as neither extreme (RCP 8.5), nor mild (RCP 2.5); but the moderate degree scenario, which can be
helpful in capturing the average response of the catchment. The RCP 4.5 resembles around to B1 scenario in IPCC
4th Assessment Report, the radiative forcing increases almost linearly up to about the year 2060 and then slows
down the increase rate until the end of the century where it stabilizes. Moreover, the forcing pathway of the 5 RCP4.5 scenario is similar to a several climate policy situations and numerous low-emissions reference
conditions, such as the SRES B1 scenario. In this work, the results are shown for RCP 4.5 scenario.
Manuscript is revised by adding the following lines. Vide Pg. 6, lines 8-26 of the revised manuscript.
“In the IPCC 4th Assessment Report, the emission scenarios were fabricated in view of the storylines that were 10 gathered into an all the more financially concerned advancement or a more ecological and sustainable
advancement, and into a more globalized world or an all the more regionally developing world. While, In the
IPCC 5th Assessment Report, the scenarios are based on total anthropogenic radiative forcings towards the end
of the 21st century. Economic models can take diverse ways to achieve distinctive radiative forcings that are
equivalent to distinctive concentration paths of the greenhouse gases, the so-called Representative Concentration 15 Pathway scenarios (RCPs). The different scenarios are marked as: RCP 8.5, RCP 4.5 and RCP 2.6, which
correspond to radiative forcings of 8.5 Wm−2, 4.5 Wm−2, and 2.6 Wm−2, respectively. The first RCP is the most
skeptical and results in a worldwide warming towards the end of the 21st century of about 4˚C, whereas the last
RCP is the most optimistic and corresponds to a global warming of about 1˚C. Then again, RCP 4.5 can be
reasoned as neither extreme (RCP 8.5), nor mild (RCP 2.5); but the moderate degree scenario, which can be 20 helpful in capturing the average response of the catchment. The RCP 4.5 resembles around to B1 scenario in
IPCC 4th Assessment Report, the radiative forcing increases almost linearly up to about the year 2060 and then
slows down the increase rate until the end of the century where it stabilizes. Apparently, RCP 4.5 is a stabilization
scenario in which total radiative forcing is stabilized just after 2100, without exceeding the long-run radiative
forcing target level. Moreover, the forcing pathway of the RCP4.5 scenario is similar to a several climate policy 25 situations and numerous low-emissions reference conditions, such as the SRES B1 scenario (Wise et al., 2009).
Thus, in this study, RCP 4.5 scenario is adopted to study the impact of climate change on the different hydrologic
components and the results are shown for the same.”
30 -----------------------------------------X-------------------------------------------X------------------------
Comment: Page 7, Model description: Explain why SWAT was chosen.
Response: As rightly mentioned by the reviewer, a wide range of hydrological models are available (e.g., SWAT,
VIC, TOPMODEL etc.). However, SWAT is deployed in the present study, due to its widely-known versatility. 35 Arnold et al. (1999) in his study used SWAT model to simulate the entire U.S.A. for river discharges at around
6000 gauging stations. Gosain et al., (2006) modeled twelve large river catchments in India with the purpose of
quantifying the climate change impact on hydrology. Faramarzi et al., (2013) used the African model to study the
impact of climate change in Africa. Abbaspour et al., (2015) simulated hydrology and water quality for entire
Europe. Also. the larger capacity of ArcGIS now allows building finer resolution large-scale models, which could 40
11
be calibrated using powerful parallel processing (Rouholahnejad et al., 2012). It includes a snow module,
permitting the delimitation of up to ten elevation bands with associated precipitation and temperature lapse rates
(Fontaine et al., 2002; Rahman et al., 2013). Also, SWAT allows users to define simulation of irrigation water on
cropland on the basis of five alternative sources: stream reach, reservoir, shallow aquifer, deep aquifer, or a water
body source external to the watershed (Gassman et al., 2007). In addition to it, SWAT provide the users Reservoir 5 operation and inclusion of domestic water demands, which other models lack. Furthermore, SWAT allows the
users to limit the size of catchment based on the gauge and reservoir sites, which the other grid based models lack
and is an important factor considering the size of the basin. The wide range of SWAT applications, underscores
that the model is a very flexible and robust tool that can be used to simulate a variety of watershed problems.
Moreover, the process of developing SWAT model for a given watershed has also been significantly facilitated 10
by the development of GIS-based interfaces, which provide a direct means of translating digital topographic, land
use, and soil data into model inputs. Also, it is an open source code which ensures the improvement in the
simulation accuracy of key processes.
Manuscript is revised by adding the following lines. Vide Pg. 7, lines 11-18 of the revised manuscript. 15 “SWAT has inbuilt snow module to capture and simulate snowmelt hydrology, permitting the delimitation of up
to ten elevation bands with associated precipitation and temperature lapse rates (Fontaine et al., 2002; Rahman
et al., 2013). In addition, SWAT allows users to add lapse rate for both precipitation (PLAPS) and temperature
(TLAPS) which is very essential in the study region considered. In this study, sub-basin has been divided into ten
elevation bands. Furthermore, in SWAT the date and net volume of irrigation water can be set according to the 20 actual condition along with the irrigation water source (surface rivers, reservoirs or groundwater, etc). Also, the
domestic, ecological and industrial water in the model can be added in the model as “consumptive use water”.”
-----------------------------------------X-------------------------------------------X------------------------ 25
Comment: Page 7, line 3: Why is it relevant that the model is computationally efficient? In fact these first two
sentences does not fit very well and the paragraph would make more sense if it started with the third sentence.
Response: Suggested change has been made in the revised manuscript.
30 -----------------------------------------X-------------------------------------------X------------------------
Comment: Page 7, line 10: Not sure what is meant by ‘vivid methods’ - perhaps ‘various methods’ would be
more appropriate.
Response: Suggested change has been made in the revised manuscript. 35 Sentence is modified in the revised manuscript, as follows. Vide Pg. 7, lines 8-10 of the revised manuscript.
“Model offers various methods such as, Hargreaves, Priestley-Taylor or Penman-Monteith methods for the
quantification of evapotranspiration.”
-----------------------------------------X-------------------------------------------X------------------------ 40
12
Comment: Page 7, line 13: ‘The SWAT model is used to assess the impact of land use changes...’ would be more
clear. Moreover it would help readers if you provide some references to back up this assertion.
Response: Suggested change has been made in the revised manuscript.
Sentence is modified in the revised manuscript, as follows. Vide Pg. 7, lines 18-19 of the revised manuscript.
5 “The SWAT model is used to assess the impact of land use changes on water supplies and erosion in large-scale
catchments (Li et al., 2016; Marhaento et al., 2017).”
-----------------------------------------X-------------------------------------------X------------------------
10 Comment: Page 11, line 23: See previous comments about the relative contribution of snowmelt to baseflow.
Why is baseflow attributed to snowmelt? What is the relative importance of groundwater?
Response: Suggested change has been made in the revised manuscript.
Sentence is modified in the revised manuscript, as follows. Vide Pg. 12, lines 20-22 of the revised
manuscript. 15
“High values of NSE and R2 indicate that the model has been able to capture high flows, while the low values of
PBias show that the low flows attributed mostly from the baseflow and snowmelt has also been captured quiet
well by the model (Fig. 3).“
20 The authors would like to add that the stress has been given on the snowmelt part as the various calibration sites
like Rishikesh, Uttarkashi and Joshipath are higly influenced by snow hydrology. And, rigorous calibration and
validation was required to calibrate these sites, especially low flows, which was snowmelt in this case.
-----------------------------------------X-------------------------------------------X------------------------ 25
Comment: Page 11, line 24: It’s not clear what is meant by ‘intrinsic nature’ - consider rewording.
Sentence is modified in the revised manuscript, as follows. Vide Pg. 12, lines 22-23 of the revised
manuscript.
30 “In general, SWAT model is able to capture the inherent nature of catchment in terms of surface runoff very
precisely.”
-----------------------------------------X-------------------------------------------X------------------------ 35
References
Abbaspour, K. C., Rouholahnejad, E., Vaghefi, S., Srinivasan, R., Yang, H. and Kløve, B.: A continental-scale
hydrology and water quality model for Europe: Calibration and uncertainty of a high-resolution large-scale SWAT 40
13
model, J. Hydrol., 524, 733–752, doi:10.1016/j.jhydrol.2015.03.027, 2015.
Faramarzi, M., Abbaspour, K. C., Ashraf Vaghefi, S., Farzaneh, M. R., Zehnder, A. J. B., Srinivasan, R. and
Yang, H.: Modeling impacts of climate change on freshwater availability in Africa, J. Hydrol., 480, 85–101,
doi:10.1016/j.jhydrol.2012.12.016, 2013.
Fontaine, T. A., Cruickshank, T. S., Arnold, J. G. and Hotchkiss, R. H.: Development of a snowfall–snowmelt 5 routine for mountainous terrain for the soil water assessment tool (SWAT), J. Hydrol., 262(1–4), 209–223,
doi:10.1016/S0022-1694(02)00029-X, 2002.
Gassman, P. W., Reyes, M. R., Green, C. H. and Arnold, J. G.: The soil and water assessment tool: Historical
development, applications, and future research directions, Trans. Asabe, 50(4), 1211–1250, doi:10.1.1.88.6554,
2007. 10 Gosain, A. K., Rao, S. and Basuray, D.: Climate change impact assessment on hydrology of Indian river basins,
Current, 90(3), 346–353 [online] Available from: http://www.ias.ac.in/currsci/feb102006/346.pdf, 2006.
Li, J., Li, G., Zhou, S. and Chen, F.: Quantifying the Effects of Land Surface Change on Annual Runoff
Considering Precipitation Variability by SWAT, Water Resour. Manag., 30(3), 1071–1084, doi:10.1007/s11269-
015-1211-8, 2016. 15 Marhaento, H., Booij, M. J., Rientjes, T. H. M. and Hoekstra, A. Y.: Attribution of changes in the water balance
of a tropical catchment to land use change using the SWAT model, Hydrol. Process., 31(11), 2029–2040,
doi:10.1002/hyp.11167, 2017.
Rahman, K., Maringanti, C., Beniston, M., Widmer, F., Abbaspour, K. and Lehmann, A.: Streamflow Modeling
in a Highly Managed Mountainous Glacier Watershed Using SWAT: The Upper Rhone River Watershed Case in 20 Switzerland, Water Resour. Manag., 27(2), 323–339, doi:10.1007/s11269-012-0188-9, 2013.
Rouholahnejad, E., Abbaspour, K. C., Vejdani, M., Srinivasan, R., Schulin, R. and Lehmann, A.: A parallelization
framework for calibration of hydrological models, Environ. Model. Softw., 31, 28–36,
doi:10.1016/j.envsoft.2011.12.001, 2012.
Wise, M., Calvin, K., Thomson, A., Clarke, L., Bond-Lamberty, B., Sands, R., Smith, S. J., Janetos, A. and 25 Edmonds, J.: Implications of limiting CO2 concentrations for land use and energy., Science, 324(5931), 1183–6,
doi:10.1126/science.1168475, 2009.