research report 38
TRANSCRIPT
Research Report
CRC for Water Quality and Treatment
Private Mail Bag 3Salisbury SOUTH AUSTRALIA 5108
Tel: (08) 8259 0351Fax: (08) 8259 0228
E-mail: [email protected]: www.waterquality.crc.org.au
The Cooperative Research Centre (CRC) for Water Quality and Treatment is Australia’s national drinking water research centre. An unincorporated joint venture between 29 different organisations from the Australian water industry, major universities, CSIRO, and local and state governments, the CRC combines expertise in water quality and public health.
The CRC for Water Quality and Treatment is established and supported under the Federal Government’s Cooperative Research Centres Program.
• ACTEWCorporation
• AustralianWaterQualityCentre
• AustralianWaterServicesPtyLtd
• BrisbaneCityCouncil
• CentreforAppropriate
Technology Inc
• CityWestWaterLimited
• CSIRO
• CurtinUniversityofTechnology
• DepartmentofHumanServices
Victoria
• GriffithUniversity
• MelbourneWaterCorporation
• MonashUniversity
• OricaAustraliaPtyLtd
• PowerandWaterCorporation
• QueenslandHealthPathology&
Scientific Services
• RMITUniversity
• SouthAustralian
Water Corporation
• SouthEastWaterLtd
• SydneyCatchmentAuthority
• SydneyWaterCorporation
• TheUniversityofAdelaide
• TheUniversityof
New South Wales
• TheUniversityofQueensland
• UnitedWaterInternationalPtyLtd
• UniversityofSouthAustralia
• UniversityofTechnology,Sydney
• WaterCorporation
• WaterServicesAssociation
of Australia
• YarraValleyWaterLtd
The Cooperative Research Centre for Water Quality and Treatment is an unincorporated joint venture between:
38
Development of Combined TreatmentProcesses for the Removal ofRecalcitrant Organic Matter
Developm
ent of Com
bined Treatment Processes for the R
emoval of R
ecalcitrant Organic M
atter Research R
eport 38
Development of Combined Treatment Processes for the Removal of Recalcitrant Organic Matter
Rolando Fabris, Chris Chow, Thuy Tran, Stephen Gray and Mary Drikas
Research Report No 38
DEVELOPMENT OF COMBINED TREATMENT PROCESSES FOR THE REMOVAL OF RECALCITRANT ORGANIC MATTER
2
© CRC for Water Quality and Treatment 2008
DISCLAIMER The Cooperative Research Centre for Water Quality and Treatment and individual contributors are not responsible for the outcomes of any actions taken on the basis of information in this research report, nor for any errors and omissions.
The Cooperative Research Centre for Water Quality and Treatment and individual contributors disclaim all and any liability to any person in respect of anything, and the consequences of anything, done or omitted to be done by a person in reliance upon the whole or any part of this research report.
The research report does not purport to be a comprehensive statement and analysis of its subject matter, and if further expert advice is required the services of a competent professional should be sought.
Cooperative Research Centre for Water Quality and Treatment Private Mail Bag 3 Salisbury SA 5108 AUSTRALIA Telephone: +61 8 8259 0351 Fax: +61 8 8259 0228 E-mail: [email protected] Web site: www.waterquality.crc.org.au Development of Combined Treatment Processes for the Removal of Recalcitrant Organic Matter
Research Report 38 ISBN 1876616636
CRC FOR WATER QUALITY AND TREATMENT – RESEARCH REPORT 38
3
FOREWORD
The aim of this project was to study treatment options for the removal of recalcitrant natural organic matter (NOM) and methods to limit its effect on microfiltration membranes. The treatment options evaluated were coagulation, adsorption, ion exchange resins and UV irradiation. The project assessed the ability of each process, alone and in combination, to remove the recalcitrant NOM. Reduction in the level of NOM before disinfection can minimise the formation of disinfection by-products and reduce the disinfectant residual required to control bacterial regrowth in the distribution system. The study aimed to identify particular processes or steps in these processes that are more suited for removal of the problematic components of NOM. This would allow modification of current treatment processes to maximise efficiency of treatment and removal of NOM and may lead to development of novel processes to better and more economically reduce NOM. In order to understand the impact of recalcitrant NOM on various treatment processes, a major component of this project was to characterise the recalcitrant NOM.
The project was conducted at 4 separate research nodes, AWQC, CSIRO, RMIT and the University of NSW. The work undertaken at RMIT and the University of NSW are reported separately in theses prepared for admission to a Masters degree and a degree for Doctor of Philosophy. The respective titles of these theses are “Development of pre-treatment strategies to reduce flux loss” and “Development of combined membrane treatment processes”. The study undertaken at the AWQC focussed on coagulation and alterative treatment. In order to study the treatment process in depth, a number of characterisation techniques were applied to study the organic matter before and after treatment, for the identification of the removable and non-removable components of the NOM. This can provide a better understanding of the mechanism of the coagulation process and the impact that the NOM character has on this process. This may then allow modification of current treatment processes to maximise efficiency of treatment in an automated and continuous basis. The study undertaken at CSIRO focussed on identifying the chemical components of NOM that lead to significant fouling of microfiltation (MF) membranes and developing techniques to reduce the rate of NOM fouling. The studies at the AWQC and CSIRO are summarised in this report.
Research Officers: Rolando Fabris, Dr. Chris Chow, Dr. Thuy Tran, Dr. Stephen Gray and Dr. Brian Bolto
Project Students: Eun Kyung Lee, Lea Fiedler, Maxime Favier, Huy Tien Ngo, Mario Kaiser, Sebastian Bauer, Stephan Rainer, Rebecca Naughton.
Project Leader: Mary Drikas
Research Nodes: Australian Water Quality Centre, CSIRO Manufacturing and Infrastructure Technology.
Acknowledgements: Dr. John van Leeuwen (CWSS), Assoc. Prof. Vicki Chen (UNSW), Prof. Peter Majewski (IWRI), Dr. Theodore Lo, plus Miriam Nedic and members of the Water Treatment Unit, AWQC.
CRC for Water Quality and Treatment Project No. 2.4.0.3 - Development of Combined Treatment Processes for the Removal of Recalcitrant Organic Matter
DEVELOPMENT OF COMBINED TREATMENT PROCESSES FOR THE REMOVAL OF RECALCITRANT ORGANIC MATTER
4
EXECUTIVE SUMMARY
This project focussed on the development of rapid analytical tools to characterise the recalcitrant organics and the development of treatment methods to remove those compounds, and methods to limit their impact on membrane processes. The project work could be separated into 4 interrelated sections; characterisation techniques and applications, advancement in established treatment processes, characterisation of organic membrane fouling and techniques to reduce the impact of fouling, and investigation of novel treatments for improved recalcitrant NOM removal.
Over the course of the project, several advanced NOM characterisation techniques were developed or refined to aid in understanding the changes produced by the various treatment methods investigated as part of the project milestones. These included rapid fractionation, reverse phase HPLC, delta high performance size exclusion chromatography (ΔHPSEC), HPSEC with DOC detection and bacterial regrowth potential (BRP). Their application within the project was proven to be critical to advancing the interpretation of data obtained.
Some of the most easily implemented improvements to traditional water treatment practices would include adaptations of existing technologies. An important component of this project was the investigation of improvements in coagulants and application of activated carbon that would not require extensive modification of treatment plant infrastructure, but may offer improvements in DOC removal. This eventually translated into the concept of the combined treatment, utilising the benefits of multiple treatment technologies to produce higher quality treated water.
As a potentially powerful technology for water treatment, there was considerable focus within the project in investigating membrane filtration and specifically the significant impact that NOM in the water source has on the filtration properties. Once a deeper understanding was achieved of the types of organic matter that are responsible for fouling of membranes, techniques for reducing or mitigating the organic fouling were advanced including the development of specific pre-treatments such as coagulation using poly-silicato iron (PSI).
Over the course of the project, several novel treatment techniques were also investigated. These were conducted primarily in collaboration with other research groups and also through student projects. The techniques were not well represented in the literature with regards to drinking water treatment, identifying a necessity to conduct some preliminary evaluation of their effectiveness for NOM removal. Techniques evaluated included ultrasonication, a self-assembled monolayer (SAM) silica adsorbent and electrocoagulation.
This project increased our understanding of the impact of treatment processes on recalcitrant organics and clarified the impact of these organics on the health aspects of drinking water quality. Rapid organic characterisation tools were developed to analyse raw and treated waters to increase our understanding of the treatment process, and to guide plant operators to optimise treatment processes. Developments of better treatments to remove recalcitrant NOM, in the form of add-on processes to existing treatment processes were investigated. Better understanding of which NOM components are major microfiltration (MF) foulants was achieved and several possible membrane conditioning process were developed to reduce the rate of MF fouling. While this research project has presented several questions that require future work, it is believed that the goals of the project were successfully achieved and a better concept of future research needs has been identified.
CRC FOR WATER QUALITY AND TREATMENT – RESEARCH REPORT 38
5
TABLE OF CONTENTS
Foreward................................................................................................................................................. 3 Executive Summary .............................................................................................................................. 4 Introduction.......................................................................................................................................... 14 1 Characterisation ............................................................................................................................... 18
1.1 Application of Rapid Fractionation Technique ............................................................................. 18 1.1.1 Introduction............................................................................................................................ 18 1.1.2 Materials and Methods.......................................................................................................... 19
1.1.2.1 Source waters and Treatment methods ......................................................................... 19 1.1.2.2 Analytical Methods ......................................................................................................... 19 1.1.2.3 Experimental Procedures ............................................................................................... 20
1.1.3 Results and Discussion......................................................................................................... 20 1.1.3.1 Water Quality, Plant Operation and Performance.......................................................... 20 1.1.3.2 The Link between Source Water Organic Character and Treatment Performance ....... 22 1.1.3.3 The Link between Treated Water Quality and Distribution System Performance.......... 26
1.1.4 Conclusion............................................................................................................................. 27 1.1.5 References............................................................................................................................ 28 1.1.6 Appendix 1 ............................................................................................................................ 29
1.2 LC techniques .............................................................................................................................. 31 1.2.1 Reverse phase HPLC ........................................................................................................... 31
1.2.1.1 Introduction..................................................................................................................... 31 1.2.1.2 Results and Discussion .................................................................................................. 31
1.2.2 Advancement in HPLC interpretation.................................................................................... 36 1.2.3 HPSEC-DOC......................................................................................................................... 38
1.2.3.1 Introduction..................................................................................................................... 38 1.2.3.2 Materials and Methods ................................................................................................... 39 1.2.3.3 Results and Discussion .................................................................................................. 41 1.2.3.4 Further modifications to system...................................................................................... 46 1.2.3.5 Conclusions .................................................................................................................... 50
1.3 Bacterial Regrowth Potential ....................................................................................................... 51 1.3.1 Introduction............................................................................................................................ 51 1.3.2 Methods................................................................................................................................. 51
1.3.2.1 BRP analysis .................................................................................................................. 51 1.3.3 Results and Discussion......................................................................................................... 52
1.3.3.1 Mt. Pleasant BRP survey................................................................................................ 52 1.3.3.2 Pilot plant trials ............................................................................................................... 53 1.3.3.3 Laboratory effects on BRP ............................................................................................. 54
1.3.4 Conclusion............................................................................................................................. 56 1.3.5 References............................................................................................................................ 56
1.4 Australian / Norwegian Water Quality Survey.............................................................................. 57 1.4.1 Introduction............................................................................................................................ 57 1.4.2 Materials and Methods.......................................................................................................... 57
1.4.2.1 Norwegian Source Waters.............................................................................................. 57 1.4.2.2 Australian Source Waters............................................................................................... 58 1.4.2.3 Instrumental Analyses .................................................................................................... 58
1.4.3 Results and Discussion......................................................................................................... 59 1.4.3.1 Water Quality Observations............................................................................................ 59 1.4.3.2 Source Water Characterisation ...................................................................................... 60
DEVELOPMENT OF COMBINED TREATMENT PROCESSES FOR THE REMOVAL OF RECALCITRANT ORGANIC MATTER
6
1.4.3.3 Disinfection and DBPs.................................................................................................... 61 1.4.3.4 Treated Water Characterisation ..................................................................................... 63
1.4.4 Conclusion............................................................................................................................. 66 1.4.5 References............................................................................................................................ 67
2 Established Treatments ................................................................................................................... 69 2.1 Alternative Coagulants................................................................................................................. 69
2.1.1 Introduction............................................................................................................................ 69 2.1.2 Materials and Methods.......................................................................................................... 70
2.1.2.1 Source Waters................................................................................................................ 70 2.1.2.2 Chemicals ....................................................................................................................... 70 2.1.2.3 Experimental conditions ................................................................................................. 70 2.1.2.4 Instrumental Analyses .................................................................................................... 70
2.1.3 Results and Discussion......................................................................................................... 71 2.1.4 Conclusion............................................................................................................................. 75 2.1.5 References............................................................................................................................ 75
2.2 Application of Chitosan ................................................................................................................ 77 2.2.1 Introduction............................................................................................................................ 77 2.2.2 Materials and methods.......................................................................................................... 77
2.2.2.1 Source waters................................................................................................................. 77 2.2.2.2 Chitosan.......................................................................................................................... 78 2.2.2.3 Jar test conditions........................................................................................................... 78 2.2.2.4 Combined treatments ..................................................................................................... 79 2.2.2.5 Instrumental analyses..................................................................................................... 79
2.2.3 Results and Discussion......................................................................................................... 79 2.2.3.1 Chitosan coagulation evaluation..................................................................................... 79 2.2.3.2 Chitosan practical application......................................................................................... 82
2.2.4 Conclusion............................................................................................................................. 84 2.2.5 References............................................................................................................................ 84
2.3 Application of Activated Carbon................................................................................................... 86 2.3.1 Introduction............................................................................................................................ 86 2.3.2 Materials and Methods.......................................................................................................... 86
2.3.2.1 Water source .................................................................................................................. 86 2.3.2.2 Chemicals ....................................................................................................................... 86 2.3.2.3 Instrumental Analyses .................................................................................................... 87
2.3.3 Results and Discussion......................................................................................................... 87 2.3.4 Conclusions........................................................................................................................... 90 2.3.5 References............................................................................................................................ 90
2.4 Combined Treatments ................................................................................................................. 92 2.4.1 Introduction............................................................................................................................ 92 2.4.2 Materials and Methods.......................................................................................................... 92 2.4.3 Results and Discussion......................................................................................................... 93 2.4.4 Conclusion............................................................................................................................. 96 2.4.5 References............................................................................................................................ 97
CRC FOR WATER QUALITY AND TREATMENT – RESEARCH REPORT 38
7
3 Membrane Processes....................................................................................................................... 98 3.1 Characterising Organic Membrane Fouling................................................................................. 98
3.1.1 Introduction............................................................................................................................ 98 3.1.2 Materials and Methods........................................................................................................ 101
3.1.2.1 Water Sources.............................................................................................................. 101 3.1.2.2 Water Characterisation................................................................................................. 102 3.1.2.3 Alum Treatment ............................................................................................................ 103 3.1.2.4 Membranes................................................................................................................... 103 3.1.2.5 Method.......................................................................................................................... 103
3.1.3 Results and Discussion....................................................................................................... 103 3.1.3.1 Membrane Type ........................................................................................................... 103 3.1.3.2 NOM Concentration...................................................................................................... 109 3.1.3.3 Effect of pH................................................................................................................... 110 3.1.3.4 Addition of alum............................................................................................................ 111
3.1.4 Conclusions......................................................................................................................... 113 3.1.5 References.......................................................................................................................... 114
3.2 Mitigation of Organic Membrane Fouling................................................................................... 116 3.2.1 Introduction.......................................................................................................................... 116 3.2.2 Materials and Methods........................................................................................................ 117
3.2.2.1 Water sources............................................................................................................... 117 3.2.2.2 Coagulants.................................................................................................................... 117 3.2.2.3 Jar test experiments ..................................................................................................... 118 3.2.2.4 Floc size and density .................................................................................................... 118 3.2.2.5 NOM characterisation................................................................................................... 118 3.2.2.6 Membrane filtration....................................................................................................... 119 3.2.2.7 Surface characterisation of the membranes after filtration........................................... 119
3.2.3 Results and Discussion....................................................................................................... 119 3.2.3.1 Evaluation of coagulation performance ........................................................................ 119 3.2.3.2 UV and turbidity removals ............................................................................................ 121 3.2.3.3 Floc size and density .................................................................................................... 122 3.2.3.4 Membrane fouling after coagulation pre-treatments..................................................... 123 3.2.3.5 Pilot Plant Tests............................................................................................................ 130
3.2.4 Conclusions......................................................................................................................... 130 3.2.5 References.......................................................................................................................... 131
3.3 Pre-Treatments for Membrane Filtration.................................................................................... 133 3.3.1 Introduction.......................................................................................................................... 133 3.3.2 Materials and methods........................................................................................................ 134
3.3.2.1 Source waters............................................................................................................... 134 3.3.2.2 Pre-treatments.............................................................................................................. 134 3.3.2.3 Membrane configurations ............................................................................................. 135 3.3.2.4 Instrumental analyses................................................................................................... 136 3.3.2.5 Membrane fouling......................................................................................................... 136
3.3.3 Results and Discussion....................................................................................................... 136 3.3.3.1 Pre-treated water quality .............................................................................................. 136 3.3.3.2 Flat sheet fouling experiments...................................................................................... 138 3.3.3.3 Submerged hollow fibre experiments ........................................................................... 142
3.3.4 Conclusion........................................................................................................................... 144 3.3.5 References.......................................................................................................................... 145
DEVELOPMENT OF COMBINED TREATMENT PROCESSES FOR THE REMOVAL OF RECALCITRANT ORGANIC MATTER
8
4 Novel Treatments ........................................................................................................................... 146 4.1 Ultrasonication ........................................................................................................................... 146
4.1.1 Introduction.......................................................................................................................... 146 4.1.2 Materials and Methods........................................................................................................ 146
4.1.2.1 Sonicator probe specifications...................................................................................... 146 4.1.2.2 Coagulation trial conditions .......................................................................................... 146 4.1.2.3 Analysed Parameters ................................................................................................... 147
4.1.3 Results and Discussion....................................................................................................... 147 4.1.3.1 Low frequency sonolysis .............................................................................................. 147 4.1.3.2 Conventional power sonolysis ...................................................................................... 148
4.1.4 Conclusions......................................................................................................................... 150 4.1.5 References.......................................................................................................................... 150
4.2 Silica Self Assembled Monolayers (SAM) ................................................................................. 151 4.2.1 Introduction.......................................................................................................................... 151 4.2.2 Materials and Methods........................................................................................................ 152
4.2.2.1 Preparation and characterisation of SAM coated silica powder and quartz sand........ 152 4.2.2.2 Source Water for Water Treatment Experiment ........................................................... 152 4.2.2.3 Analytical Methods ....................................................................................................... 152 4.2.2.4 Treatment Experiment .................................................................................................. 152
4.2.3 Results and Discussion....................................................................................................... 153 4.2.3.1 Characterisation of NH2-SAM powder and sand .......................................................... 153 4.2.3.2 Removal of Natural Organic Matter.............................................................................. 153 4.2.3.3 Treatment experiment using NH2-SAM sand in column mode..................................... 156
4.2.4 Conclusion........................................................................................................................... 157 4.2.5 References.......................................................................................................................... 158
4.3 Electrocoagulation ..................................................................................................................... 159 4.3.1 Introduction.......................................................................................................................... 159 4.3.2 Theory ................................................................................................................................. 160 4.3.3 Materials and Methods........................................................................................................ 161
4.3.3.1 Water sample................................................................................................................ 161 4.3.3.2 Chemicals, electrodes and electronic equipment......................................................... 161 4.3.3.3 Analyses ....................................................................................................................... 161 4.3.3.4 Procedures ................................................................................................................... 161
4.3.4 Results and Discussion....................................................................................................... 164 4.3.5 Conclusions......................................................................................................................... 172 4.3.6 References.......................................................................................................................... 173 4.3.7 Appendices.......................................................................................................................... 174
Conclusions and Key Findings ........................................................................................................ 176 References ......................................................................................................................................... 181 Project Related Publications ............................................................................................................ 191 Papers in Progress............................................................................................................................ 193
CRC FOR WATER QUALITY AND TREATMENT – RESEARCH REPORT 38
9
LIST OF FIGURES
1. Characterisation
Figure 1.1 Seasonal variation of water quality, (DOC and specific alum demand).................................... 21 Figure 1.2 The impact of inlet DOC on alum dose and specific alum demand.......................................... 22 Figure 1.3 Seasonal variation of organic character in Happy Valley and Myponga reservoirs.................. 23 Figure 1.4 Seasonal variation of organic fractions in inlet water................................................................ 24 Figure 1.5 Correlation between VHA and specific alum demand and plant alum dose............................. 25 Figure 1.6 Correlation between 3 day chlorine demand against DOC, UV254 and VHA . .......................... 26 Figure 1.7 Comparison of rapid fractionation 500 mL & 300 mL procedure. ............................................. 29 Figure 1.8 Rapid fractionation 300 mL schematic and protocol. ................................................................ 30 Figure 1.9 Reverse phase chromatography injection volume comparison. ............................................... 31 Figure 1.10 Areas for component peaks of Myponga enhanced coagulation set ...................................... 33 Figure 1.11 Myponga raw reverse phase chromatogram and calculated peak areas ............................... 34 Figure 1.12 Myponga raw derived fractions, % of total. ............................................................................. 34 Figure 1.13 Myponga raw true fractions, % of total.................................................................................... 35 Figure 1.14 Delta HPSEC of Myponga alum jar test series. ...................................................................... 36 Figure 1.15 Delta HPSEC of NOM removed by various activated carbons following alum treatment....... 37 Figure 1.16 Delta HPSEC for Copi Hollow River rapid fractionated series................................................ 37 Figure 1.17 Functional principle of a HPSEC-Column ............................................................................... 38 Figure 1.18 HPSEC-DOC apparatus layout. .............................................................................................. 39 Figure 1.19 Flow chart of the HPSEC-DOC............................................................................................... 40 Figure 1.20 Organic carbon analyser wet chemistry oxidation arrangement............................................. 40 Figure 1.21 Raw data representation of Myponga raw water. ................................................................... 41 Figure 1.22 UV and the DOC response versus true DOC. ........................................................................ 42 Figure 1.23 Relationship between molecular weight and retention time for PSS standards. .................... 42 Figure 1.24 Processed Myponga raw water HPSEC-DOC........................................................................ 43 Figure 1.25 DOC detector response versus calculated true DOC concentration. ..................................... 44 Figure 1.26 UV response versus DOC for applied organic carbon sources. ............................................. 45 Figure 1.27 Baseline monitoring during early stages of system optimisation. ........................................... 46 Figure 1.28 (a) Molecular weight standard chromatograms and calibration curve. ................................... 47 Figure 1.29 DOC calibration curve for 1.5 mL sample injection................................................................. 48 Figure 1.30 Full calibrated and time corrected chromatograms for Happy Valley and XAD-4 fraction...... 49 Figure 1.31 Mt. Pleasant BRP trends over the period April ’04 to June ’05............................................... 52 Figure 1.32 BRP in selected South Australian metropolitan WTP raw and treated waters. ...................... 53 Figure 1.33 Relationship of BRP to applied alum dose for 4 pilot plant trials ............................................ 53 Figure 1.34 Laboratory contamination test using Milli-Q and Mt. Pleasant water...................................... 55 Figure 1.35 Fraction concentrations for Norwegian and Australian drinking water sources...................... 60 Figure 1.36 Molecular weight distribution for Norwegian and Australian drinking water sources.............. 61 Figure 1.37 Chlorine demand (24 hours) and specific chlorine demand ................................................... 62 Figure 1.38 Trihalomethane formation potential (THMFP) and specific THMFP. ...................................... 62 Figure 1.39 Fraction percentage of raw remaining after treatment ............................................................ 64 Figure 1.40 Molecular weight distribution by (HPSEC) .............................................................................. 64 Figure 1.41 Weight and number average molecular weight (Mw, Mn) ...................................................... 65 Figure 1.42 Change in polydispersity (Δρ) of UV absorbing organic matter after treatment. .................... 66
DEVELOPMENT OF COMBINED TREATMENT PROCESSES FOR THE REMOVAL OF RECALCITRANT ORGANIC MATTER
10
2. Established Treatments
Figure 2.1 Average molecular weight correlation with DOC for Copi Hollow and Myponga...................... 72 Figure 2.2 Percentage fractions remaining at most effective conditions for all coagulants ....................... 72 Figure 2.3 THMFP and specific THMFP for Copi Hollow and Myponga Reservoir ................................... 73 Figure 2.4 Cl2 demand and specific Cl2 demand for Copi Hollow and Myponga Reservoir....................... 74 Figure 2.5 Turbidity using chitosan and alum for treatment of Copi Hollow and Myponga Reservoir ....... 80 Figure 2.6 Colour using chitosan and alum on Copi Hollow and Myponga Reservoir ............................... 80 Figure 2.7 Percentage DOC removed for chitosan dose range treatment................................................. 81 Figure 2.8 Percentage DOC removed for chitosan pH range treatment.................................................... 81 Figure 2.9 Chlorine demand and trihalomethane formation potential (THMFP) for chitosan treatment .... 82 Figure 2.10 Percent removal of DOC with alum and 3 different PACs. ..................................................... 87 Figure 2.11 Fraction composition of the treated waters following alum with carbon treatment ................. 89 Figure 2.12 Delta HPSEC of removed fractions of NOM ........................................................................... 89 Figure 2.13 Combined treatment protocol.................................................................................................. 93 Figure 2.14 Surface contour plots indicating influence of PAC and alum dose ......................................... 95 Figure 2.15 MW distributions of combined treatments of Myponga Reservoir and Mannum water. ......... 96
3. Membrane Processes
Figure 3.1 Specific UV spectra of some Australian NOM samples at various wavelengths .................... 101 Figure 3.2 NOM fractionation procedure .................................................................................................. 102 Figure 3.3 Flux decline and backwashing comparisons for the four membranes - Bendigo ................... 104 Figure 3.4 Flux decline and backwashing comparisons for the four membranes - Meredith................... 105 Figure 3.5 HPSEC-DOC data for Meredith and Bendigo Waters............................................................. 105 Figure 3.6 HPSEC-DOC and HPSEC-UV254 data for Bendigo Water and Meredith Water ..................... 106 Figure 3.7 HPSEC data for Bendigo concentrate. ................................................................................... 107 Figure 3.8 HPSEC data for Meredith Water ............................................................................................. 108 Figure 3.9 Flux decline curves for Meredith Water and PVDF-2 for various NOM concentrations.......... 110 Figure 3.10 Effect of alum addition on PP membrane performance with Bendigo water ........................ 112 Figure 3.11 Effect of various coagulant doses on membrane fouling ...................................................... 116 Figure 3.12 Ouyen water - effect of coagulant doses for iron-based coagulants on residual DOC......... 120 Figure 3.13 Ouyen water - effect of coagulant doses for Al-based coagulants on residual DOC............ 120 Figure 3.14 Meredith water - effect of coagulant doses for Al and Fe-based coagulants on DOC.......... 121 Figure 3.15 Ouyen water - effect of coagulant doses for Al and Fe-based coagulants on UV254 ............ 122 Figure 3.16 Meredith water - effect of coagulant doses for Al and Fe-based coagulants on UV254......... 122 Figure 3.17 Ouyen water - optical images after pre-treatment with PSI-1 ............................................... 123 Figure 3.18 Ouyen water - optical images after pre-treatment with ACH ................................................ 123 Figure 3.19 Turbidity reading of PSI-1 compared with alum coagulant at dose 2 as a function of time.. 123 Figure 3.20 Relative fluxes for Ouyen water through PP membrane at dose 2....................................... 124 Figure 3.21 SEM & EDS spectrum of the PP membrane surface after 5 L of ACH treated Ouyen water125 Figure 3.22 SEM & EDS of the PP membrane surface after 5 L of PSI-1 treated Ouyen water ............. 125 Figure 3.23 Relative flux for Ouyen water through PVDF-2 membrane at dose 2................................... 126 Figure 3.24 SEM & EDS of PVDF-2 membrane surface after 5 L of ACH treated Ouyen water............. 127 Figure 3.25 SEM & EDS of PVDF-2 membrane surface after 5 L of PSI-1 Ouyen treated water ........... 128 Figure 3.26 Back-scattered electrons (BSE) image corresponding to the SEM image in Figure 3.25 .... 128 Figure 3.27 Relative flux for Meredith water through PP membrane at dose 2 ....................................... 129 Figure 3.28 Relative flux for Meredith water through PVDF-2 membrane at dose 2 ............................... 129 Figure 3.29 Pre-treatment protocol for membrane fouling experiments .................................................. 134
CRC FOR WATER QUALITY AND TREATMENT – RESEARCH REPORT 38
11
Figure 3.30 Schematics of dead-end unstirred filtration set-up and SHF setup ...................................... 135 Figure 3.31 Pre-treatment DOC molecular weight distributions for Myponga Reservoir ......................... 137 Figure 3.32 Pre-treatment DOC molecular weight distributions for Woronora Dam................................ 138 Figure 3.33 Fouling profile (foulant resistance) versus permeate volume ............................................... 138 Figure 3.34 Accumulated foulant resistances at a permeate volume of 1000 mL ................................... 139 Figure 3.35 Foulant resistance benefit analysis of pre-treatments for Myponga and Worornora water .. 139 Figure 3.36 Impact of flat-sheet MF fouling on retention of high MW colloidal NOM - Myponga............. 140 Figure 3.37 Impact of flat-sheet MF fouling on retention of high MW colloidal NOM - Woronora............ 141 Figure 3.38 SEM of Woronora and Myponga flat sheet membrane after fouling and rinsing. ................. 142 Figure 3.39 Transmembrane pressure (TMP) during submerged hollow fibre (SHF) filtration................ 143 Figure 3.40 Accumulated TMP rise at a permeate volume of 1000 mL during SHF filtration.................. 144 Figure 3.41 Impact of SHF-MF fouling on retention of high MW colloidal NOM ...................................... 144
4. Novel Treatments
Figure 4.1 Molecular weight distribution for Hope Valley ultrasonication trial samples ........................... 148 Figure 4.2 Water quality parameters for alun treatments with and without sonication. ........................... 149 Figure 4.3 MW distribution of sonicated Hope Valley water and alum treated Hope Valley.................... 149 Figure 4.4 Formation of a sulfonate SAM on a solid substrate ................................................................ 151 Figure 4.5 DOC removal with dose and contact time using NH2-SAM powder at pH 6........................... 154 Figure 4.6 MW distribution of raw and treated water samples after NH2-SAM treatment........................ 154 Figure 4.7 Colour and DOC removal with dose and contact time using NH2-SAM sand at pH 6. ........... 155 Figure 4.8 Treated water quality of Hope Valley raw water after NH2-SAM sand column mode............. 157 Figure 4.9 Aztec Flotation Jar Test Apparatus and Electrocoagulation apparatus. ................................. 162 Figure 4.10 Performance comparisons between alum and ferric chloride............................................... 164 Figure 4.11 Apparent molecular weight distribution of electrocaugulated waters.................................... 165 Figure 4.12 Performance comparison between aluminium EC and alum................................................ 166 Figure 4.13 Performance comparison between iron EC and ferric chloride ............................................ 167 Figure 4.14 Electrocoagulation/flotation using aluminium and titanium electrodes ................................. 169
DEVELOPMENT OF COMBINED TREATMENT PROCESSES FOR THE REMOVAL OF RECALCITRANT ORGANIC MATTER
12
LIST OF TABLES
1. Characterisation
Table 1.1 Carbon source oxidation efficiency testing of DOC detector. .................................................... 44 Table 1.2 Linear regression equations for the DOC responses................................................................. 44 Table 1.3 Linear regression equations for UV response............................................................................ 45 Table 1.4 Effect of various laboratory processes and water treatment chemicals on BRP ....................... 54 Table 1.5 Hope Valley laboratory process contamination tests ................................................................. 56 Table 1.6 Water quality parameters for Norwegian and Australian drinking water sources ...................... 58 Table 1.7 THMFP speciation for Norwegian and Australian drinking water sources................................. 63
2. Established Treatments
Table 2.1 Best DOC removal conditions in Copi Hollow and Myponga Reservoir..................................... 71 Table 2.2 DOC and bacterial regrowth potential using Myponga Reservoir water .................................... 74 Table 2.3 Raw water quality ....................................................................................................................... 78 Table 2.4 Water quality parameters for combined treatments of Myponga Reservoir water..................... 83 Table 2.5 Water quality parameters for raw, alum treated and alum + PAC treated. ................................ 88 Table 2.6 NMR observable carbon content................................................................................................ 90 Table 2.7 Myponga combined treatment water quality parameters ........................................................... 93 Table 2.8 Mannum combined treatment water quality parameters............................................................ 94
3. Membrane Processes
Table 3.1 Summary of UF and some NF membrane performances .......................................................... 99 Table 3.2 Summary of MF membrane performances .............................................................................. 100 Table 3.3 Properties of the waters utilised ............................................................................................... 101 Table 3.4 NOM fractions in Bendigo and Meredith raw waters................................................................ 102 Table 3.5 Membrane properties ............................................................................................................... 103 Table 3.6 DOC concentration effect on membrane flux and throughput.................................................. 109 Table 3.7 Performance of different membranes at varying pH ................................................................ 111 Table 3.8 Flux changes caused by adding 30 mg/L of alum to Bendigo water........................................ 112 Table 3.9 Flux changes caused by adding 30 mg/L of alum to Meredith water....................................... 112 Table 3.10 Characteristics of waters ........................................................................................................ 117 Table 3.11 Formation of polysilicic acid and its derivatives ..................................................................... 118 Table 3.12 NOM fractions in Ouyen and Meredith raw waters ................................................................ 119 Table 3.13 Properties of the two membranes utilised ............................................................................. 119 Table 3.14 Fractions removed by various coagulants.............................................................................. 121 Table 3.15 Summary of performance of PP membrane for Ouyen water................................................ 124 Table 3.16 Summary of performance of PVDF-2 membrane for Ouyen water........................................ 126 Table 3.17 Summary of performance of PP and PVDF-2 membranes for Meredith water...................... 129 Table 3.18 Treated water quality parameters for Myponga Reservoir and Woronora Dam .................... 137 Table 3.19 Percentages of reversible resistance after flat sheet filtration ............................................... 143
4. Novel Treatments
Table 4.1 Ultrasonication conditions for low frequency 200 W sonicator................................................. 147 Table 4.2 Water quality parameters for direct sonication of Hope Valley Reservoir water...................... 148 Table 4.3 Water quality parameters for alum treated and sonicated Hope Valley Reservoir water. ....... 148 Table 4.4 Treated water quality after NH2-SAM powder treatment and regeneration ............................. 156 Table 4.5 NOM characteristics of raw Myponga Reservoir water ............................................................ 161
CRC FOR WATER QUALITY AND TREATMENT – RESEARCH REPORT 38
13
Table 4.6 Summary of parameters in electrocoagulation experiments.................................................... 162 Table 4.7 Plan of electrocoagulation/electrolysis experiments ................................................................ 163 Table 4.8 DOC concentrations of electrocoagulation using different material ......................................... 168 Table 4.9 Results of Myponga aluminium electroflotation jar tests .......................................................... 170 Table 4.10 Treated water DOC after aluminium electrocoagulation ........................................................ 170 Table 4.11 Alum jar test on raw and electrolysed water from Myponga Reservoir.................................. 171 Table 4.12 Alum jar test on raw and electrolysed water from Myponga Reservoir.................................. 171 Table 4.13 Biological activity expressed as average acetate carbon equivalent. .................................... 171
DEVELOPMENT OF COMBINED TREATMENT PROCESSES FOR THE REMOVAL OF RECALCITRANT ORGANIC MATTER
14
INTRODUCTION
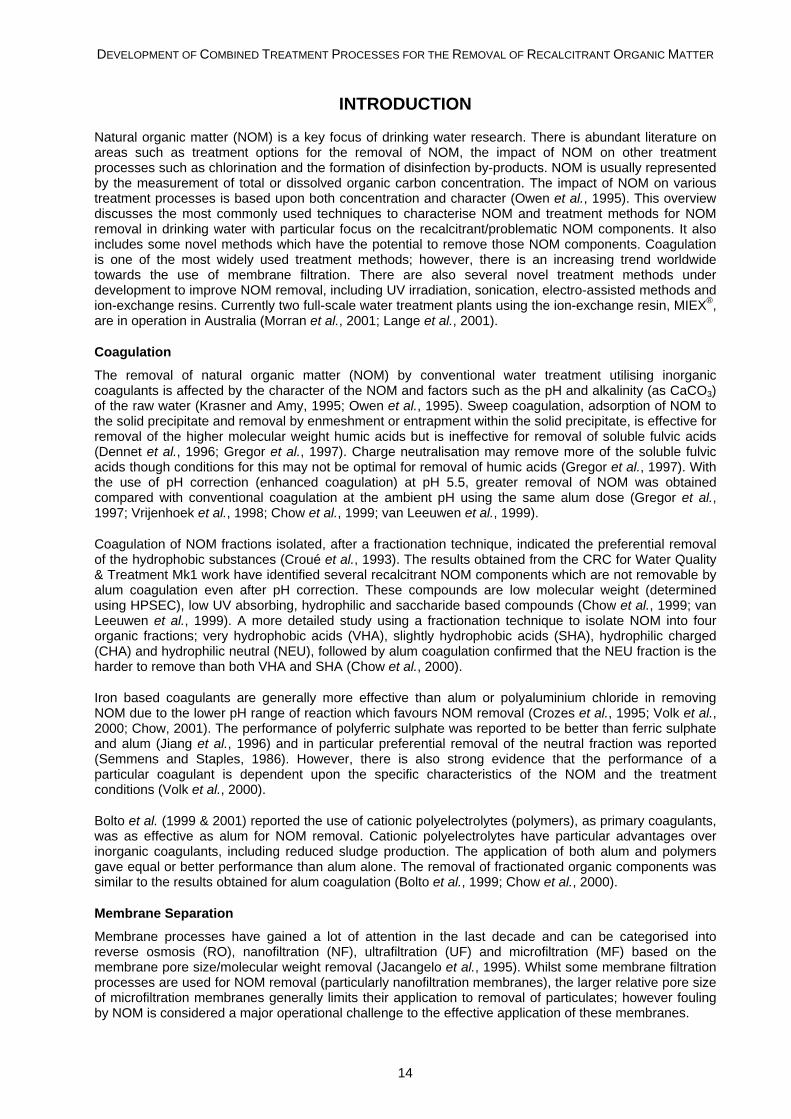
Natural organic matter (NOM) is a key focus of drinking water research. There is abundant literature on areas such as treatment options for the removal of NOM, the impact of NOM on other treatment processes such as chlorination and the formation of disinfection by-products. NOM is usually represented by the measurement of total or dissolved organic carbon concentration. The impact of NOM on various treatment processes is based upon both concentration and character (Owen et al., 1995). This overview discusses the most commonly used techniques to characterise NOM and treatment methods for NOM removal in drinking water with particular focus on the recalcitrant/problematic NOM components. It also includes some novel methods which have the potential to remove those NOM components. Coagulation is one of the most widely used treatment methods; however, there is an increasing trend worldwide towards the use of membrane filtration. There are also several novel treatment methods under development to improve NOM removal, including UV irradiation, sonication, electro-assisted methods and ion-exchange resins. Currently two full-scale water treatment plants using the ion-exchange resin, MIEX®, are in operation in Australia (Morran et al., 2001; Lange et al., 2001).
Coagulation
The removal of natural organic matter (NOM) by conventional water treatment utilising inorganic coagulants is affected by the character of the NOM and factors such as the pH and alkalinity (as CaCO3) of the raw water (Krasner and Amy, 1995; Owen et al., 1995). Sweep coagulation, adsorption of NOM to the solid precipitate and removal by enmeshment or entrapment within the solid precipitate, is effective for removal of the higher molecular weight humic acids but is ineffective for removal of soluble fulvic acids (Dennet et al., 1996; Gregor et al., 1997). Charge neutralisation may remove more of the soluble fulvic acids though conditions for this may not be optimal for removal of humic acids (Gregor et al., 1997). With the use of pH correction (enhanced coagulation) at pH 5.5, greater removal of NOM was obtained compared with conventional coagulation at the ambient pH using the same alum dose (Gregor et al., 1997; Vrijenhoek et al., 1998; Chow et al., 1999; van Leeuwen et al., 1999).
Coagulation of NOM fractions isolated, after a fractionation technique, indicated the preferential removal of the hydrophobic substances (Croué et al., 1993). The results obtained from the CRC for Water Quality & Treatment Mk1 work have identified several recalcitrant NOM components which are not removable by alum coagulation even after pH correction. These compounds are low molecular weight (determined using HPSEC), low UV absorbing, hydrophilic and saccharide based compounds (Chow et al., 1999; van Leeuwen et al., 1999). A more detailed study using a fractionation technique to isolate NOM into four organic fractions; very hydrophobic acids (VHA), slightly hydrophobic acids (SHA), hydrophilic charged (CHA) and hydrophilic neutral (NEU), followed by alum coagulation confirmed that the NEU fraction is the harder to remove than both VHA and SHA (Chow et al., 2000).
Iron based coagulants are generally more effective than alum or polyaluminium chloride in removing NOM due to the lower pH range of reaction which favours NOM removal (Crozes et al., 1995; Volk et al., 2000; Chow, 2001). The performance of polyferric sulphate was reported to be better than ferric sulphate and alum (Jiang et al., 1996) and in particular preferential removal of the neutral fraction was reported (Semmens and Staples, 1986). However, there is also strong evidence that the performance of a particular coagulant is dependent upon the specific characteristics of the NOM and the treatment conditions (Volk et al., 2000).
Bolto et al. (1999 & 2001) reported the use of cationic polyelectrolytes (polymers), as primary coagulants, was as effective as alum for NOM removal. Cationic polyelectrolytes have particular advantages over inorganic coagulants, including reduced sludge production. The application of both alum and polymers gave equal or better performance than alum alone. The removal of fractionated organic components was similar to the results obtained for alum coagulation (Bolto et al., 1999; Chow et al., 2000).
Membrane Separation
Membrane processes have gained a lot of attention in the last decade and can be categorised into reverse osmosis (RO), nanofiltration (NF), ultrafiltration (UF) and microfiltration (MF) based on the membrane pore size/molecular weight removal (Jacangelo et al., 1995). Whilst some membrane filtration processes are used for NOM removal (particularly nanofiltration membranes), the larger relative pore size of microfiltration membranes generally limits their application to removal of particulates; however fouling by NOM is considered a major operational challenge to the effective application of these membranes.
CRC FOR WATER QUALITY AND TREATMENT – RESEARCH REPORT 38
15
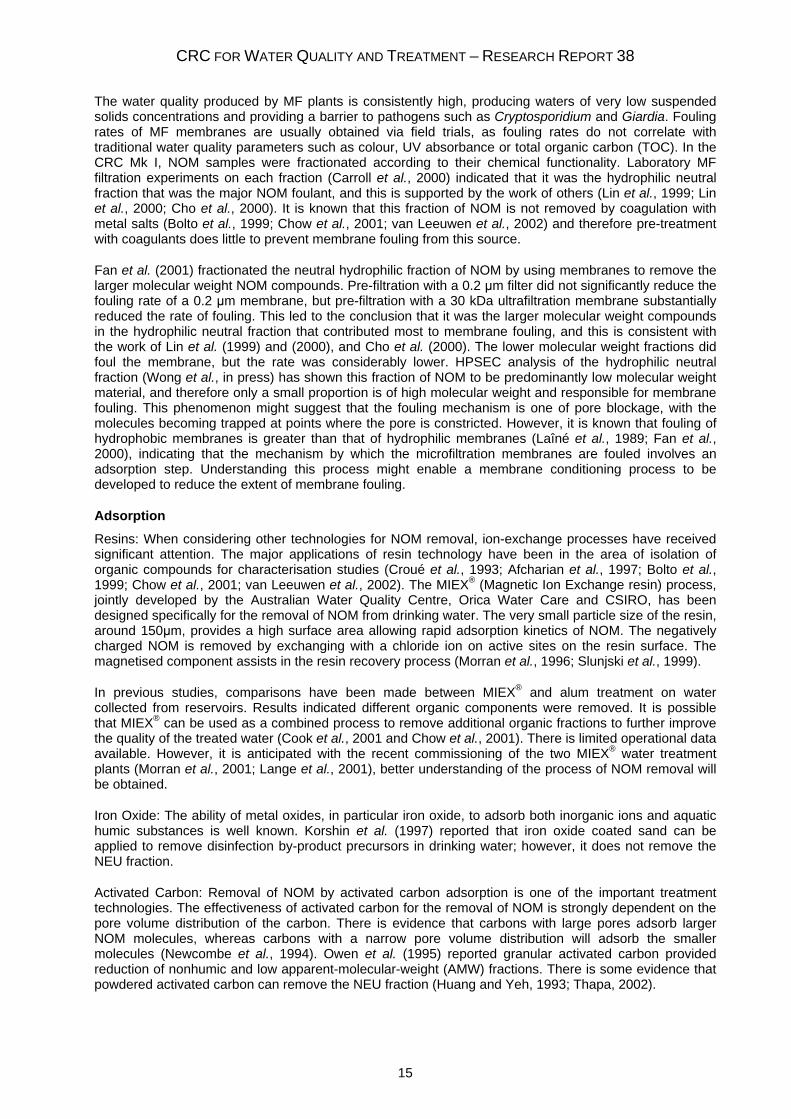
The water quality produced by MF plants is consistently high, producing waters of very low suspended solids concentrations and providing a barrier to pathogens such as Cryptosporidium and Giardia. Fouling rates of MF membranes are usually obtained via field trials, as fouling rates do not correlate with traditional water quality parameters such as colour, UV absorbance or total organic carbon (TOC). In the CRC Mk I, NOM samples were fractionated according to their chemical functionality. Laboratory MF filtration experiments on each fraction (Carroll et al., 2000) indicated that it was the hydrophilic neutral fraction that was the major NOM foulant, and this is supported by the work of others (Lin et al., 1999; Lin et al., 2000; Cho et al., 2000). It is known that this fraction of NOM is not removed by coagulation with metal salts (Bolto et al., 1999; Chow et al., 2001; van Leeuwen et al., 2002) and therefore pre-treatment with coagulants does little to prevent membrane fouling from this source.
Fan et al. (2001) fractionated the neutral hydrophilic fraction of NOM by using membranes to remove the larger molecular weight NOM compounds. Pre-filtration with a 0.2 μm filter did not significantly reduce the fouling rate of a 0.2 μm membrane, but pre-filtration with a 30 kDa ultrafiltration membrane substantially reduced the rate of fouling. This led to the conclusion that it was the larger molecular weight compounds in the hydrophilic neutral fraction that contributed most to membrane fouling, and this is consistent with the work of Lin et al. (1999) and (2000), and Cho et al. (2000). The lower molecular weight fractions did foul the membrane, but the rate was considerably lower. HPSEC analysis of the hydrophilic neutral fraction (Wong et al., in press) has shown this fraction of NOM to be predominantly low molecular weight material, and therefore only a small proportion is of high molecular weight and responsible for membrane fouling. This phenomenon might suggest that the fouling mechanism is one of pore blockage, with the molecules becoming trapped at points where the pore is constricted. However, it is known that fouling of hydrophobic membranes is greater than that of hydrophilic membranes (Laîné et al., 1989; Fan et al., 2000), indicating that the mechanism by which the microfiltration membranes are fouled involves an adsorption step. Understanding this process might enable a membrane conditioning process to be developed to reduce the extent of membrane fouling.
Adsorption
Resins: When considering other technologies for NOM removal, ion-exchange processes have received significant attention. The major applications of resin technology have been in the area of isolation of organic compounds for characterisation studies (Croué et al., 1993; Afcharian et al., 1997; Bolto et al., 1999; Chow et al., 2001; van Leeuwen et al., 2002). The MIEX® (Magnetic Ion Exchange resin) process, jointly developed by the Australian Water Quality Centre, Orica Water Care and CSIRO, has been designed specifically for the removal of NOM from drinking water. The very small particle size of the resin, around 150μm, provides a high surface area allowing rapid adsorption kinetics of NOM. The negatively charged NOM is removed by exchanging with a chloride ion on active sites on the resin surface. The magnetised component assists in the resin recovery process (Morran et al., 1996; Slunjski et al., 1999).
In previous studies, comparisons have been made between MIEX® and alum treatment on water collected from reservoirs. Results indicated different organic components were removed. It is possible that MIEX® can be used as a combined process to remove additional organic fractions to further improve the quality of the treated water (Cook et al., 2001 and Chow et al., 2001). There is limited operational data available. However, it is anticipated with the recent commissioning of the two MIEX® water treatment plants (Morran et al., 2001; Lange et al., 2001), better understanding of the process of NOM removal will be obtained.
Iron Oxide: The ability of metal oxides, in particular iron oxide, to adsorb both inorganic ions and aquatic humic substances is well known. Korshin et al. (1997) reported that iron oxide coated sand can be applied to remove disinfection by-product precursors in drinking water; however, it does not remove the NEU fraction.
Activated Carbon: Removal of NOM by activated carbon adsorption is one of the important treatment technologies. The effectiveness of activated carbon for the removal of NOM is strongly dependent on the pore volume distribution of the carbon. There is evidence that carbons with large pores adsorb larger NOM molecules, whereas carbons with a narrow pore volume distribution will adsorb the smaller molecules (Newcombe et al., 1994). Owen et al. (1995) reported granular activated carbon provided reduction of nonhumic and low apparent-molecular-weight (AMW) fractions. There is some evidence that powdered activated carbon can remove the NEU fraction (Huang and Yeh, 1993; Thapa, 2002).
DEVELOPMENT OF COMBINED TREATMENT PROCESSES FOR THE REMOVAL OF RECALCITRANT ORGANIC MATTER
16
Novel Methods
A host of very promising techniques based on various technologies that do not rely solely on chemical additions are being developed. Techniques such as UV irradiation, electro-assisted oxidation methods and sonication have been applied in the water industry combined with other treatment processes. Applications of these techniques are more prominent in the wastewater industry, particularly for removal of contaminants. However, in recent literature these techniques have gradually gained momentum in the drinking water area. The main application in drinking water has focussed on disinfection but the potential to removal recalcitrant NOM has not been explored.
UV Radiation: Photochemistry of NOM has a significant influence on the chromophores and properties of NOM. UV radiation has been widely used for the disinfection of drinking water, but it has also been shown to remove dissolved organics including NOM by mineralisation to carbon dioxide (Frimmel, 1998; Parkinson et al., 1999). Wang et al. (2000) demonstrated the rate of humic acid oxidation is greatly increased with combined UV/H2O2.
Sonication: In the sono-oxidation process, ultrasound plays a dual role of reactant and catalyst. As reactant, ultrasound could be responsible for the sonolytic degradation of the organic molecules. As catalyst, ultrasound causes sonolysis of oxidant molecules H2O2 to create oxidising free radicals, such as hydroxyl and perhydroxyl radicals. Chemat et al. (2001) reported sono-oxidation combined with hydrogen peroxide can reduce total organic carbon concentration by half in approximately 60 minutes.
Electro-assisted Methods: The main applications of electro-assisted methods are in the wastewater industry with a few applications in the drinking water industry. Electrocoagulation (EC) is the most well known technique in this class (Mills, 2000). Despite the fact that it has reached a profitable commercialisation stage, it has received very little scientific attention. In the EC process, the coagulant is generated in situ by electrolytic oxidation of an appropriate anode material (aluminium or iron). The removal mechanism can be considered similar to coagulation with chemical coagulants, however, the complete mechanisms of EC are not clearly understood (Mollah et al., 2001). Electrochemical oxidation deals with charge transfer at the interface between an electrically conductive (or semi-conductive) material and an ionic conductor as well as the reactions within the electrolytes and the resulting equilibrium. The main objective of the process is to oxidise the organics present to water and carbon dioxide. The process can be controlled by adjusting the electrode potential and electrode material (Grimm et al., 1998). However, all these methods are degradative rather than removal techniques and the by-products formed in these processes require further investigation.
Characterisation methods
There is a lot of available literature on development of analytical methods to characterise NOM. Techniques such as fractionation using resins and structural analysis using analytical instrumentation, have been developed worldwide. In addition, there is also a fairly large portion of the available literature focussed on linking NOM characteristics with treatability (Croué et al., 1993; Owen et al., 1995; Gjessing et al., 1998). Characterisation of the fractionated NOM performed by Wong et al. (2002), showed each fraction to be a cocktail of chemical species. The strongly hydrophobic fraction generally consisted of higher proportions of aliphatic and unsaturated carbon and lower proportions of alkoxyl and carbonyl carbon than the weakly hydrophobic fraction. The hydrophilic fractions contained high proportions of carbohydrates, and it is speculated that the charged hydrophilic material would contain protein material and the neutral hydrophilic fraction would contain sugars, alcohols and ketones. van Leeuwen et al. (2002) have also characterised similar NOM fractions, and found that the neutral hydrophilic fraction contained the most saccharide material as well as the highest concentration of nitrogen containing compounds. Both Wong et al (2002) and van Leeuwen et al. (2002) showed that the composition of the neutral hydrophilic fraction varied between raw water samples, with the neutral hydrophilic fraction containing more aromatic and nitrogen-containing compounds in one water source than the other. These attempts to characterise the NOM fractions demonstrate that while some separation of the chemical species is effected by the fractionation procedure, the NOM fractions are still complex in nature. Furthermore, there is significant variability between fractionated NOM from different water sources.
Rapid Organic Fractionation: Organic fractionation is generally used to isolate and characterise organic matter (Croué et al., 1993). As with other complex instrumental analysis, it has provided considerable knowledge in understanding the impact of NOM on treatment processes. However, this fractionation is time consuming, requires a high level of skill and the results are not in a form that can be interpreted easily by the treatment operators. In previous studies, a rapid fractionation technique based on the full
CRC FOR WATER QUALITY AND TREATMENT – RESEARCH REPORT 38
17
fractionation scheme mentioned earlier has been developed (Chow et al., 2004). This analytical technique has a rapid turn-around time, which is suitable to assist the treatment operator to optimise the treatment process.
UV Absorbance Measurement: UV absorbance measurement is one of the simplest characterisation methods and has been widely adopted by the water industry. It has been reported as a surrogate parameter to monitor the concentration of NOM (Edzwald et al., 1985; Wang and Hsieh, 2001). In addition, UV tends to give a measure of unsaturated bonds that are potential sites with which chlorine can react. The UV absorbance of NOM is potentially related to its chlorine demand (Powell et al., 2000). It is also reported that it can provide a measure of overall disinfection by-product formation after chlorination (Korshin et al., 1997; Li et al., 1998).
High Performance Liquid Chromatography (HPLC): High performance size exclusion chromatography (HPSEC) separates molecules based on their size. This technique has proved to be useful in characterising organic compounds and linking results with NOM removal using various treatment methods (Gjessing et al., 1998; Bolto et al., 1999; Chow et al., 2000; Cook et al., 2001; van Leeuwen et al., 2002). In addition, the application of HPSEC to determine the molecular size distribution of NOM has shown significant correlation with chlorine demand (Vuoria et al., 1998). There is another HPLC technique (reverse phase HPLC), which has been reported as a characterisation tool for NOM (Owen et al., 1995; Gjessing et al., 1998). This technique is potentially useful for characterising NOM in relation to the water treatment process, however, there is little reported in the literature.
DEVELOPMENT OF COMBINED TREATMENT PROCESSES FOR THE REMOVAL OF RECALCITRANT ORGANIC MATTER
18
1 CHARACTERISATION
1.1 Application of Rapid Fractionation Technique1
1.1.1 Introduction
Natural organic matter (NOM) is an important topic in drinking water treatment. Considerable research effort has occurred worldwide to link NOM character to treatability. Reduction in NOM before disinfection can minimise the formation of disinfection by-products and reduce the chlorine dose required to control bacterial regrowth in the distribution system, resulting in water of higher quality for consumers.
The removal of NOM by conventional water treatment utilising inorganic coagulants is affected by the character of the NOM and factors such as the pH and alkalinity of the raw water (Krasner and Amy 1995; Owen et al. 1995). A number of characterisation techniques have been developed to enable a better understanding of the impact of organic compounds on the treatment processes. General analytical techniques, such as dissolved organic carbon (DOC) and UV absorbance measurements have been used as surrogate parameters to monitor the concentration of NOM and they are widely accepted by water treatment operators as parameters to assess treatment plant performance. UV absorbance measurement is one of the simplest characterisation methods and there are also several advanced analytical techniques developed to characterise NOM based on humic/non-humic fractions, the hydrophobic/hydrophilic character and molecular weights (Edzwald et al. 1985; Wang et al. 2000).
NOM can be isolated based on either the chemical or physical properties of the compounds. Commonly used isolation techniques include ion-exchange resins or ultrafiltration membranes with different nominal molecular weight cutoffs. In general, organic fractionation is used as an isolation procedure (Croué et al. 1993). As such, this technique is not commonly used as an analytical technique in the drinking water industry to optimise treatment processes. In an earlier alum flocculation study using isolated organic fractions from two Australian reservoirs, it was established that the removal efficiency was highly influenced by the character of the fractions (Chow et al., 2000; van Leeuwen et al. 2002).
A rapid fractionation (analytical) technique based on measuring the organic carbon concentrations before and after contact with the resins (DAX-8, XAD-4 and IRA-958) has been reported recently (Chow et al., 2004). The concentration of four NOM fractions, very hydrophobic acids (VHA), slightly hydrophobic acids (SHA), hydrophilic charged (CHA) and hydrophilic neutral (NEU), in the sample can be determined based on subtraction of the organic carbon concentrations of subsequent resin effluents. This technique was successfully applied in a jar test experiment and the results showed that particular NOM fraction removal was dependent upon treatment conditions, such as applied alum dose, pH etc., and these can be optimised based on the character of the organic matter present in the source water (Chow et al. 2004).
In this paper, the impact of organic character on treatment plant performance (coagulation and disinfection) due to seasonal variation is reported. The organic character of water sources for the Happy Valley and Myponga water treatment plants (WTPs) was monitored using the rapid fractionation technique over an eighteen month period together with DOC, UV254, colour and molecular weight distribution measurement using high performance size exclusion chromatography (HPSEC). The results were then used to establish a link between organic character and treatment plant operation conditions such as applied alum dose and DOC removal performance.
The organic characterisation work was then extended to study the impact of organic character on disinfection. Disinfection is the final phase of the treatment process and the presence of a disinfectant residual can assist greatly the maintenance of water quality throughout the distribution system. Chlorine is the most widely used disinfectant for the supply of potable water. It is highly reactive with organic and inorganic compounds found in bulk water and on distribution system infrastructure surfaces. The organic characterisation results obtained were linked with the disinfection process which included chlorine demand and trihalomethane (THM) formation.
1 This chapter is based on the following paper: Chow, C.W.K, Fabris, R. and Drikas, M. (2004) A Rapid Fractionation
Technique to Characterise Natural Organic Matter for the Optimisation of Water Treatment Processes. Journal of Water Supply: Research and Technology – AQUA 53(2), 85-92.
CRC FOR WATER QUALITY AND TREATMENT – RESEARCH REPORT 38
19
1.1.2 Materials and Methods
1.1.2.1 Source waters and Treatment methods
The Happy Valley Water Treatment Plant is situated 15 km south of Adelaide and is the largest water treatment plant in South Australia with the design capacity of 850 ML per day. The plant employs coagulation/flocculation, sedimentation and filtration processes. The source is primarily from the River Murray and is supplemented by the Mt Bold catchment. The Myponga Water Treatment plant is located about 50 km south of Adelaide. It has a production capacity of 50 ML per day and employs the dissolved air flotation-filtration (DAFF) process. The source water is only from natural catchment. The water is generally high in colour and organic content and low in turbidity. Both treatment plants use alum (Al2(SO4)3·18H2O) and a cationic polymer for coagulation and chlorine as the disinfectant.
Treatment is required to ensure water quality compliance with the Australian Drinking Water Guidelines (NHMRC/AWRC 1996) as well as satisfying various contractual targets. Coagulation at both treatment plants was optimised for DOC removal by adjusting alum dose and coagulation pH. The coagulation pH used at Happy Valley WTP ranged from 6.6-6.9. A lower coagulation pH was used at Myponga WTP 6.1 ± 0.1 to achieve a higher DOC removal. Dose rates for alum and chlorine are reviewed monthly and adjusted in light of process and network water quality trends (Holmes and Oemcke 2002).
1.1.2.2 Analytical Methods
Ultrapure water used in these experiments was obtained from a Milli-Q® purification system (Millipore, France). Water samples were 0.45 μm filtered prior to analyses except pH and turbidity measurements. General water quality parameters, pH (pH 320, WTW, Germany), turbidity (2100AN, Hach, USA) and dissolved organic carbon (DOC) (820, Sievers Instruments Inc., USA) were determined using the methods described in Standard Methods (APHA et al. 1998). The UV absorbance at 254nm (UV254) was measured using a UV/VIS spectrophotometer (Model 918, GBC Scientific Equipment Ltd., Australia) with a 1 cm quartz cell (APHA et al. 1998). Colour was determined using the method described in Bennett and Drikas (1993) with a 5 cm cell.
The apparent molecular weight of the UV absorbing compounds was determined using high performance size exclusion chromatography (HPSEC). A Shodex KW 802.5 packed column (Shoko Co. Ltd., Japan) was used with a Waters 2690 separation module and 996 photodiode array detector. The carrier solvent was a 0.1 M phosphate buffer solution (pH 6.80) adjusted to an ionic strength of 1.0 M with sodium chloride. The flow rate was 1 mL/min. Calibration was performed using polystyrene sulfonate (PSS) standards (Polysciences Inc. MA) of molecular weights 35,000, 18,000, 8,000 and 4,600 Daltons. Detection was based on UV absorbance (260 nm/cm). The procedure was based on the method described by Chin et al. (1994). The chromatogram can also be used to determine average molecular weight based on the weight average (Mw) formula:
∑=
∑=
×= n
t tUV
n
twM
1 260
1MWt 260tUV
………………………………… (1)
The rapid fractionation technique was reported in Chow et al. (2004), which was modified from the method published by Croué et al. (1994) and Bolto et al. (1999) and resulted in determining the concentration of four fractions: VHA, (adsorbed by DAX-8), SHA, (adsorbed by XAD-4), CHA, (adsorbed by IRA-958) and NEU, that was not adsorbed on any of the ion exchange resins. Three 20 cm (length) x 13 mm internal diameter (ID) glass columns for DAX-8, XAD-4 and IRA-958 resins respectively were set up in series. DAX-8, XAD-4 and IRA-958 resins were supplied by Supelco (Belefonte, PA, U.S.A.). Sodium hydroxide, hydrochloric acid and sodium chloride solutions used for pH adjustment and cleaning/regeneration of resins were prepared from AR grade chemicals.
Chlorine decay was determined by dosing an appropriate volume of saturated chlorine solution into 1 litre of (plant or jar test) treated water stored in an amber bottle. The dose selection criterion was to achieve 0.5 mg/L chlorine residual at the end of 72 hours (3 day). At predetermined times 100 mL samples were
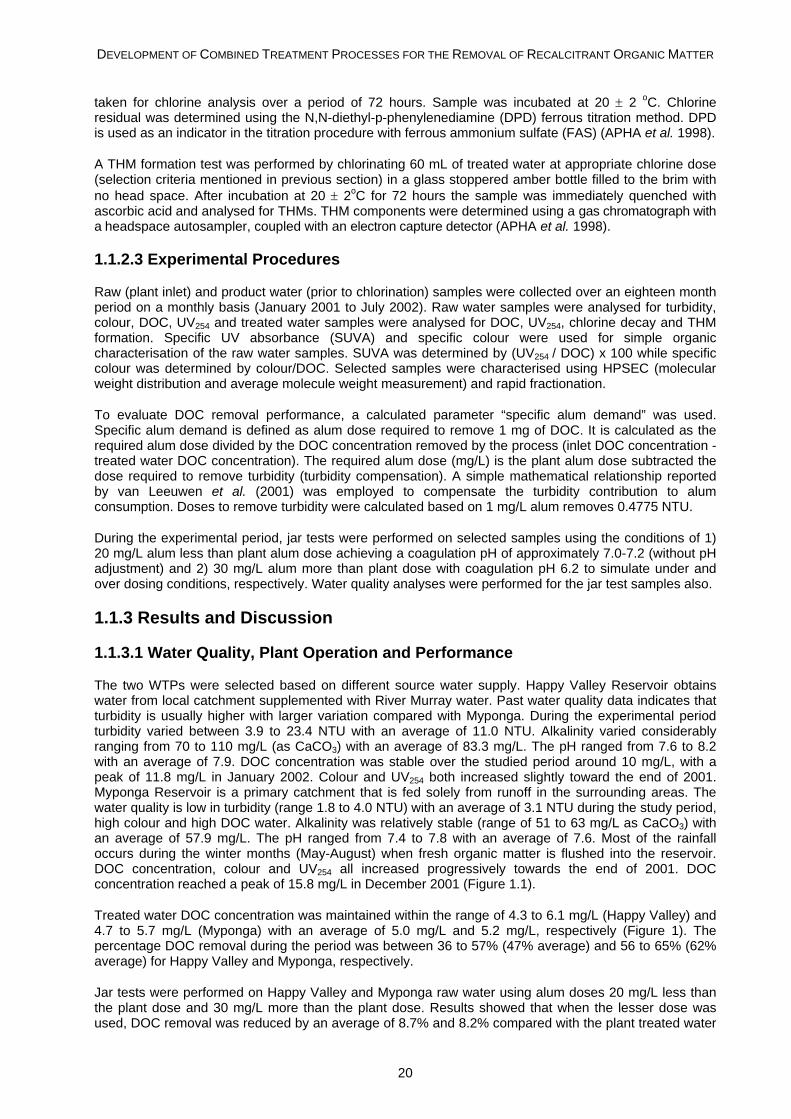
DEVELOPMENT OF COMBINED TREATMENT PROCESSES FOR THE REMOVAL OF RECALCITRANT ORGANIC MATTER
20
taken for chlorine analysis over a period of 72 hours. Sample was incubated at 20 ± 2 oC. Chlorine residual was determined using the N,N-diethyl-p-phenylenediamine (DPD) ferrous titration method. DPD is used as an indicator in the titration procedure with ferrous ammonium sulfate (FAS) (APHA et al. 1998).
A THM formation test was performed by chlorinating 60 mL of treated water at appropriate chlorine dose (selection criteria mentioned in previous section) in a glass stoppered amber bottle filled to the brim with no head space. After incubation at 20 ± 2oC for 72 hours the sample was immediately quenched with ascorbic acid and analysed for THMs. THM components were determined using a gas chromatograph with a headspace autosampler, coupled with an electron capture detector (APHA et al. 1998).
1.1.2.3 Experimental Procedures
Raw (plant inlet) and product water (prior to chlorination) samples were collected over an eighteen month period on a monthly basis (January 2001 to July 2002). Raw water samples were analysed for turbidity, colour, DOC, UV254 and treated water samples were analysed for DOC, UV254, chlorine decay and THM formation. Specific UV absorbance (SUVA) and specific colour were used for simple organic characterisation of the raw water samples. SUVA was determined by (UV254 / DOC) x 100 while specific colour was determined by colour/DOC. Selected samples were characterised using HPSEC (molecular weight distribution and average molecule weight measurement) and rapid fractionation.
To evaluate DOC removal performance, a calculated parameter “specific alum demand” was used. Specific alum demand is defined as alum dose required to remove 1 mg of DOC. It is calculated as the required alum dose divided by the DOC concentration removed by the process (inlet DOC concentration - treated water DOC concentration). The required alum dose (mg/L) is the plant alum dose subtracted the dose required to remove turbidity (turbidity compensation). A simple mathematical relationship reported by van Leeuwen et al. (2001) was employed to compensate the turbidity contribution to alum consumption. Doses to remove turbidity were calculated based on 1 mg/L alum removes 0.4775 NTU.
During the experimental period, jar tests were performed on selected samples using the conditions of 1) 20 mg/L alum less than plant alum dose achieving a coagulation pH of approximately 7.0-7.2 (without pH adjustment) and 2) 30 mg/L alum more than plant dose with coagulation pH 6.2 to simulate under and over dosing conditions, respectively. Water quality analyses were performed for the jar test samples also.
1.1.3 Results and Discussion
1.1.3.1 Water Quality, Plant Operation and Performance
The two WTPs were selected based on different source water supply. Happy Valley Reservoir obtains water from local catchment supplemented with River Murray water. Past water quality data indicates that turbidity is usually higher with larger variation compared with Myponga. During the experimental period turbidity varied between 3.9 to 23.4 NTU with an average of 11.0 NTU. Alkalinity varied considerably ranging from 70 to 110 mg/L (as CaCO3) with an average of 83.3 mg/L. The pH ranged from 7.6 to 8.2 with an average of 7.9. DOC concentration was stable over the studied period around 10 mg/L, with a peak of 11.8 mg/L in January 2002. Colour and UV254 both increased slightly toward the end of 2001. Myponga Reservoir is a primary catchment that is fed solely from runoff in the surrounding areas. The water quality is low in turbidity (range 1.8 to 4.0 NTU) with an average of 3.1 NTU during the study period, high colour and high DOC water. Alkalinity was relatively stable (range of 51 to 63 mg/L as CaCO3) with an average of 57.9 mg/L. The pH ranged from 7.4 to 7.8 with an average of 7.6. Most of the rainfall occurs during the winter months (May-August) when fresh organic matter is flushed into the reservoir. DOC concentration, colour and UV254 all increased progressively towards the end of 2001. DOC concentration reached a peak of 15.8 mg/L in December 2001 (Figure 1.1).
Treated water DOC concentration was maintained within the range of 4.3 to 6.1 mg/L (Happy Valley) and 4.7 to 5.7 mg/L (Myponga) with an average of 5.0 mg/L and 5.2 mg/L, respectively (Figure 1). The percentage DOC removal during the period was between 36 to 57% (47% average) and 56 to 65% (62% average) for Happy Valley and Myponga, respectively.
Jar tests were performed on Happy Valley and Myponga raw water using alum doses 20 mg/L less than the plant dose and 30 mg/L more than the plant dose. Results showed that when the lesser dose was used, DOC removal was reduced by an average of 8.7% and 8.2% compared with the plant treated water
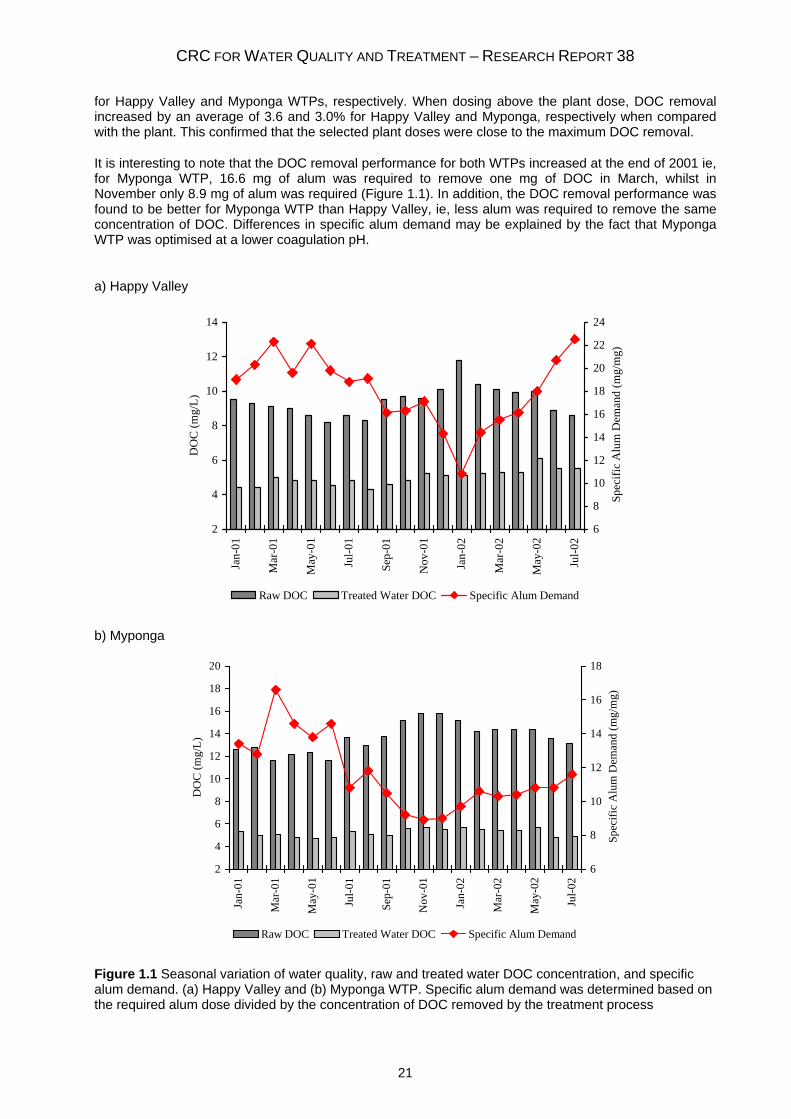
CRC FOR WATER QUALITY AND TREATMENT – RESEARCH REPORT 38
21
for Happy Valley and Myponga WTPs, respectively. When dosing above the plant dose, DOC removal increased by an average of 3.6 and 3.0% for Happy Valley and Myponga, respectively when compared with the plant. This confirmed that the selected plant doses were close to the maximum DOC removal.
It is interesting to note that the DOC removal performance for both WTPs increased at the end of 2001 ie, for Myponga WTP, 16.6 mg of alum was required to remove one mg of DOC in March, whilst in November only 8.9 mg of alum was required (Figure 1.1). In addition, the DOC removal performance was found to be better for Myponga WTP than Happy Valley, ie, less alum was required to remove the same concentration of DOC. Differences in specific alum demand may be explained by the fact that Myponga WTP was optimised at a lower coagulation pH.
a) Happy Valley
2
4
6
8
10
12
14
Jan-
01
Mar
-01
May
-01
Jul-0
1
Sep-
01
Nov
-01
Jan-
02
Mar
-02
May
-02
Jul-0
2
DO
C (m
g/L)
6
8
10
12
14
16
18
20
22
24
Spec
ific
Alu
m D
eman
d (m
g/m
g)
Raw DOC Treated Water DOC Specific Alum Demand
b) Myponga
2
4
6
8
10
12
14
16
18
20
Jan-
01
Mar
-01
May
-01
Jul-0
1
Sep-
01
Nov
-01
Jan-
02
Mar
-02
May
-02
Jul-0
2
DO
C (m
g/L)
6
8
10
12
14
16
18
Spec
ific
Alu
m D
eman
d (m
g/m
g)
Raw DOC Treated Water DOC Specific Alum Demand
Figure 1.1 Seasonal variation of water quality, raw and treated water DOC concentration, and specific alum demand. (a) Happy Valley and (b) Myponga WTP. Specific alum demand was determined based on the required alum dose divided by the concentration of DOC removed by the treatment process
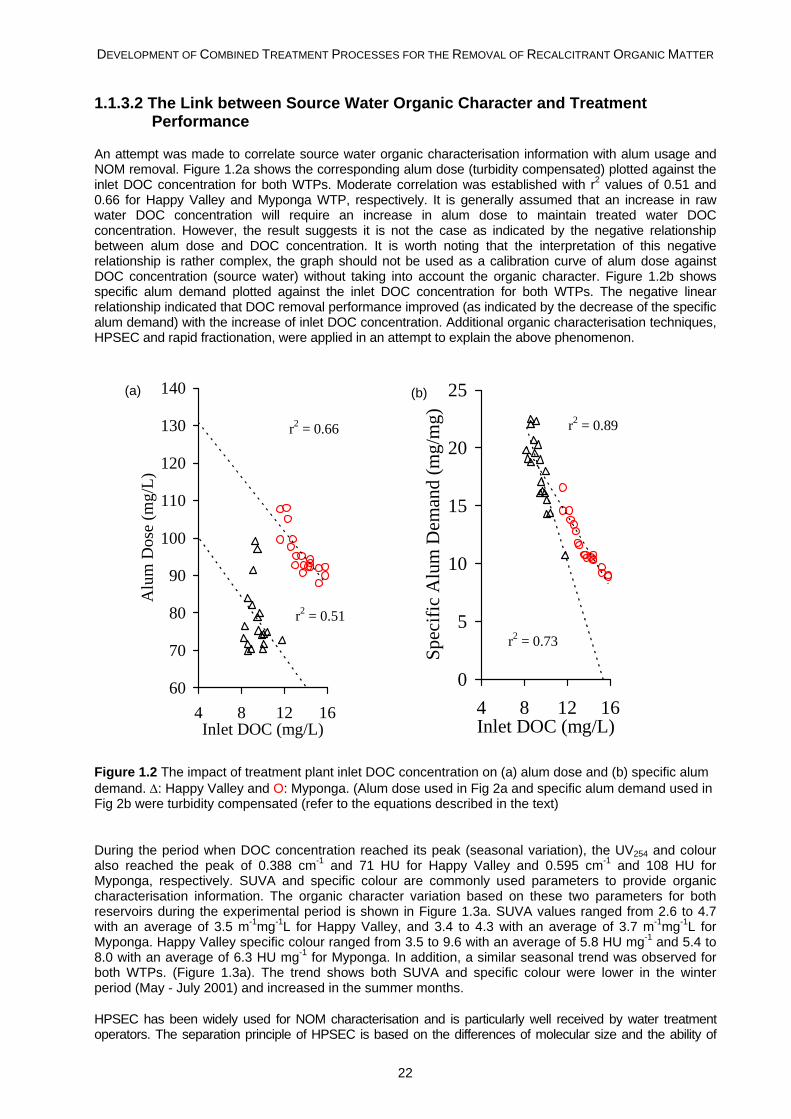
DEVELOPMENT OF COMBINED TREATMENT PROCESSES FOR THE REMOVAL OF RECALCITRANT ORGANIC MATTER
22
1.1.3.2 The Link between Source Water Organic Character and Treatment Performance
An attempt was made to correlate source water organic characterisation information with alum usage and NOM removal. Figure 1.2a shows the corresponding alum dose (turbidity compensated) plotted against the inlet DOC concentration for both WTPs. Moderate correlation was established with r2 values of 0.51 and 0.66 for Happy Valley and Myponga WTP, respectively. It is generally assumed that an increase in raw water DOC concentration will require an increase in alum dose to maintain treated water DOC concentration. However, the result suggests it is not the case as indicated by the negative relationship between alum dose and DOC concentration. It is worth noting that the interpretation of this negative relationship is rather complex, the graph should not be used as a calibration curve of alum dose against DOC concentration (source water) without taking into account the organic character. Figure 1.2b shows specific alum demand plotted against the inlet DOC concentration for both WTPs. The negative linear relationship indicated that DOC removal performance improved (as indicated by the decrease of the specific alum demand) with the increase of inlet DOC concentration. Additional organic characterisation techniques, HPSEC and rapid fractionation, were applied in an attempt to explain the above phenomenon.
r2 = 0.66
r2 = 0.51
60
70
80
90
100
110
120
130
140
4 8 12 16Inlet DOC (mg/L)
Alu
m D
ose
(mg/
L)
r2 = 0.89
r2 = 0.73
0
5
10
15
20
25
4 8 12 16Inlet DOC (mg/L)
Spec
ific
Alu
m D
eman
d (m
g/m
g)
Figure 1.2 The impact of treatment plant inlet DOC concentration on (a) alum dose and (b) specific alum demand. Δ: Happy Valley and O: Myponga. (Alum dose used in Fig 2a and specific alum demand used in Fig 2b were turbidity compensated (refer to the equations described in the text)
During the period when DOC concentration reached its peak (seasonal variation), the UV254 and colour also reached the peak of 0.388 cm-1 and 71 HU for Happy Valley and 0.595 cm-1 and 108 HU for Myponga, respectively. SUVA and specific colour are commonly used parameters to provide organic characterisation information. The organic character variation based on these two parameters for both reservoirs during the experimental period is shown in Figure 1.3a. SUVA values ranged from 2.6 to 4.7 with an average of 3.5 m-1mg-1L for Happy Valley, and 3.4 to 4.3 with an average of 3.7 m-1mg-1L for Myponga. Happy Valley specific colour ranged from 3.5 to 9.6 with an average of 5.8 HU mg-1 and 5.4 to 8.0 with an average of 6.3 HU mg-1 for Myponga. In addition, a similar seasonal trend was observed for both WTPs. (Figure 1.3a). The trend shows both SUVA and specific colour were lower in the winter period (May - July 2001) and increased in the summer months.
HPSEC has been widely used for NOM characterisation and is particularly well received by water treatment operators. The separation principle of HPSEC is based on the differences of molecular size and the ability of
(a) (b)
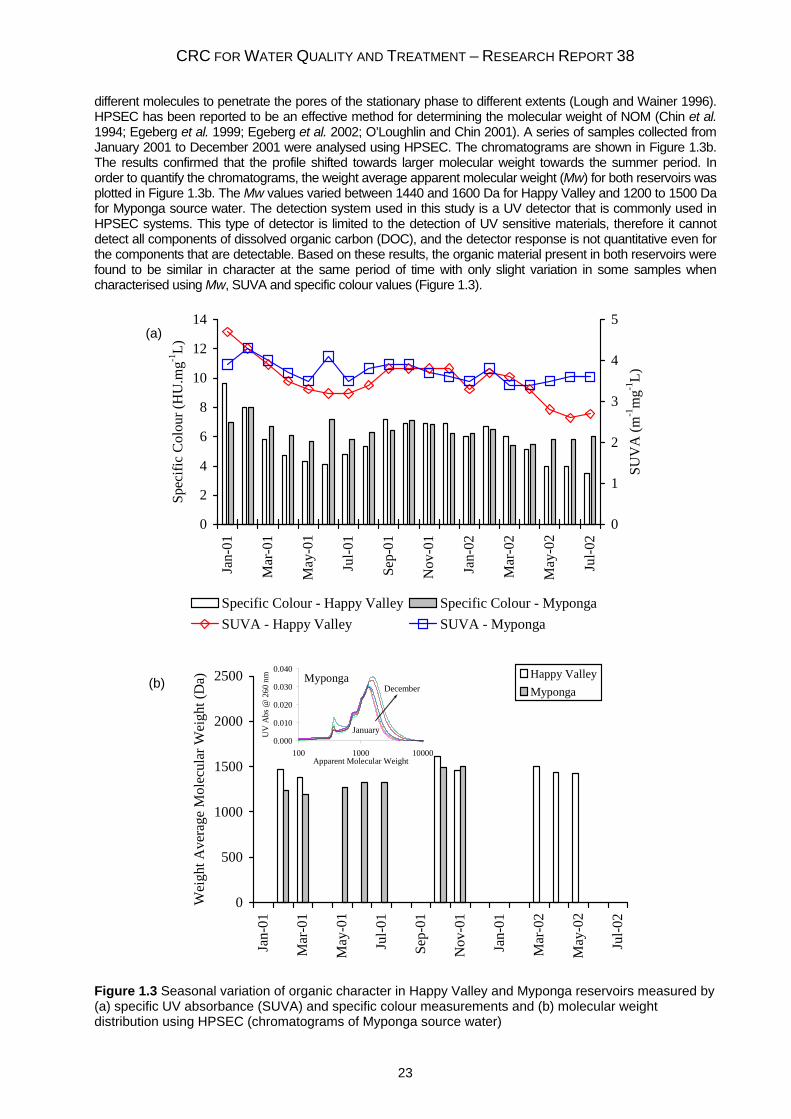
CRC FOR WATER QUALITY AND TREATMENT – RESEARCH REPORT 38
23
different molecules to penetrate the pores of the stationary phase to different extents (Lough and Wainer 1996). HPSEC has been reported to be an effective method for determining the molecular weight of NOM (Chin et al. 1994; Egeberg et al. 1999; Egeberg et al. 2002; O’Loughlin and Chin 2001). A series of samples collected from January 2001 to December 2001 were analysed using HPSEC. The chromatograms are shown in Figure 1.3b. The results confirmed that the profile shifted towards larger molecular weight towards the summer period. In order to quantify the chromatograms, the weight average apparent molecular weight (Mw) for both reservoirs was plotted in Figure 1.3b. The Mw values varied between 1440 and 1600 Da for Happy Valley and 1200 to 1500 Da for Myponga source water. The detection system used in this study is a UV detector that is commonly used in HPSEC systems. This type of detector is limited to the detection of UV sensitive materials, therefore it cannot detect all components of dissolved organic carbon (DOC), and the detector response is not quantitative even for the components that are detectable. Based on these results, the organic material present in both reservoirs were found to be similar in character at the same period of time with only slight variation in some samples when characterised using Mw, SUVA and specific colour values (Figure 1.3).
0
2
4
6
8
10
12
14
Jan-
01
Mar
-01
May
-01
Jul-0
1
Sep-
01
Nov
-01
Jan-
02
Mar
-02
May
-02
Jul-0
2
Spec
ific
Col
our (
HU
.mg-1
L)
0
1
2
3
4
5
SUV
A (m
-1m
g-1L)
Specific Colour - Happy Valley Specific Colour - MypongaSUVA - Happy Valley SUVA - Myponga
0
500
1000
1500
2000
2500
Jan-
01
Mar
-01
May
-01
Jul-0
1
Sep-
01
Nov
-01
Jan-
01
Mar
-02
May
-02
Jul-0
2
Wei
ght A
vera
ge M
olec
ular
Wei
ght (
Da) Happy Valley
Myponga
0.000
0.010
0.020
0.030
0.040
100 1000 10000Apparent Molecular Weight
UV
Abs
@ 2
60 n
m
January
DecemberMyponga
Figure 1.3 Seasonal variation of organic character in Happy Valley and Myponga reservoirs measured by (a) specific UV absorbance (SUVA) and specific colour measurements and (b) molecular weight distribution using HPSEC (chromatograms of Myponga source water)
(a)
(b)
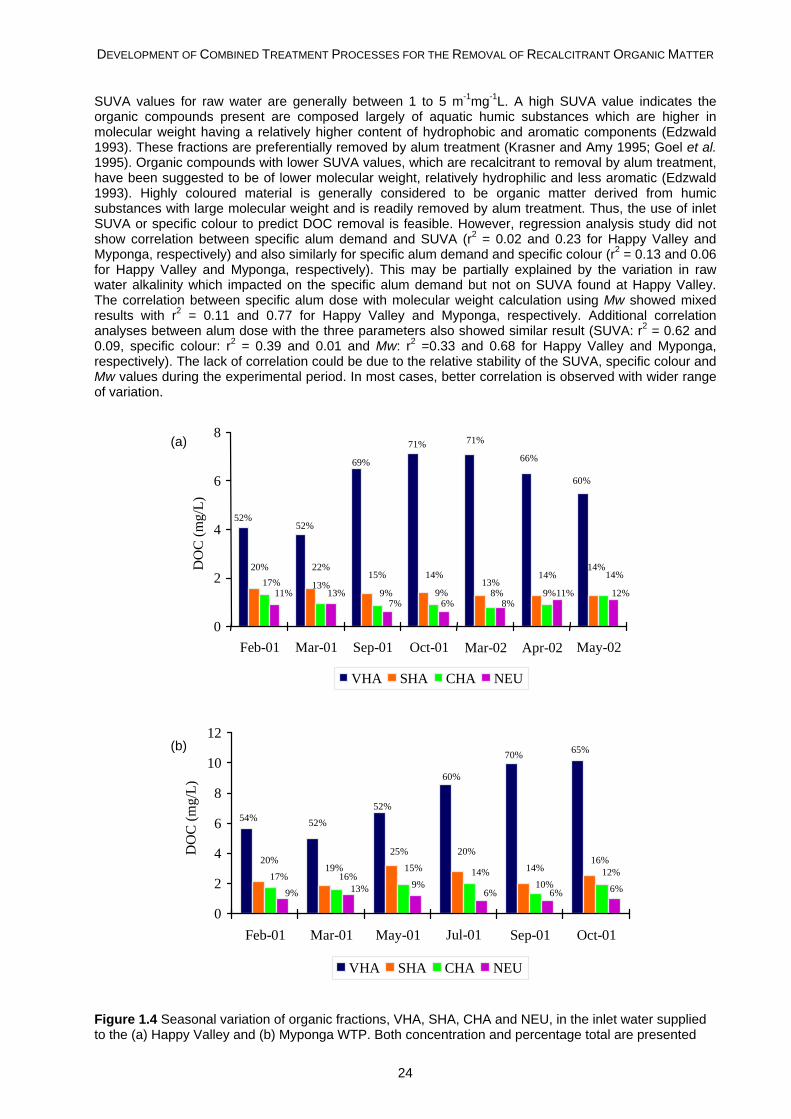
DEVELOPMENT OF COMBINED TREATMENT PROCESSES FOR THE REMOVAL OF RECALCITRANT ORGANIC MATTER
24
SUVA values for raw water are generally between 1 to 5 m-1mg-1L. A high SUVA value indicates the organic compounds present are composed largely of aquatic humic substances which are higher in molecular weight having a relatively higher content of hydrophobic and aromatic components (Edzwald 1993). These fractions are preferentially removed by alum treatment (Krasner and Amy 1995; Goel et al. 1995). Organic compounds with lower SUVA values, which are recalcitrant to removal by alum treatment, have been suggested to be of lower molecular weight, relatively hydrophilic and less aromatic (Edzwald 1993). Highly coloured material is generally considered to be organic matter derived from humic substances with large molecular weight and is readily removed by alum treatment. Thus, the use of inlet SUVA or specific colour to predict DOC removal is feasible. However, regression analysis study did not show correlation between specific alum demand and SUVA (r2 = 0.02 and 0.23 for Happy Valley and Myponga, respectively) and also similarly for specific alum demand and specific colour (r2 = 0.13 and 0.06 for Happy Valley and Myponga, respectively). This may be partially explained by the variation in raw water alkalinity which impacted on the specific alum demand but not on SUVA found at Happy Valley. The correlation between specific alum dose with molecular weight calculation using Mw showed mixed results with r2 = 0.11 and 0.77 for Happy Valley and Myponga, respectively. Additional correlation analyses between alum dose with the three parameters also showed similar result (SUVA: r2 = 0.62 and 0.09, specific colour: r2 = 0.39 and 0.01 and Mw: r2 =0.33 and 0.68 for Happy Valley and Myponga, respectively). The lack of correlation could be due to the relative stability of the SUVA, specific colour and Mw values during the experimental period. In most cases, better correlation is observed with wider range of variation.
0
2
4
6
8
Feb-01
Mar-01
Sep-01
Oct-01
Mar-02 Apr-02 May-02
DO
C (m
g/L)
VHA SHA CHA NEU
52%
20% 17%
11%
52%
22%
13%13%
69%
15%
9%7%
71%
14%
9%6%
71%
13%8%
8%
66%
14%
9%11%
60%
14% 14%
12%
0
2
4
6
8
10
12
Feb-01 Mar-01 May-01 Jul-01 Sep-01 Oct-01
DO
C (m
g/L)
VHA SHA CHA NEU
54%
20% 17%
9%
52%
19%16%
13%
52%
25%
15%
9%
60%
20%
14%
6%
70%
14%
10%6%
65%
16% 12%
6%
Figure 1.4 Seasonal variation of organic fractions, VHA, SHA, CHA and NEU, in the inlet water supplied to the (a) Happy Valley and (b) Myponga WTP. Both concentration and percentage total are presented
(a)
(b)
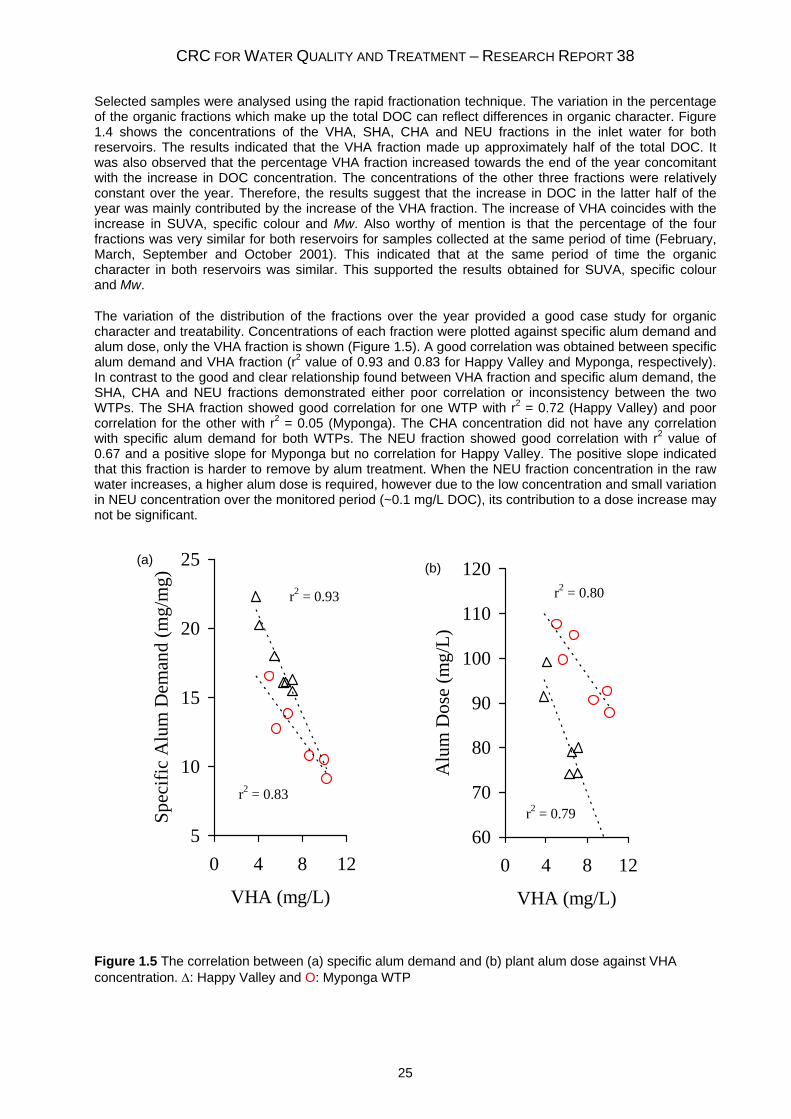
CRC FOR WATER QUALITY AND TREATMENT – RESEARCH REPORT 38
25
Selected samples were analysed using the rapid fractionation technique. The variation in the percentage of the organic fractions which make up the total DOC can reflect differences in organic character. Figure 1.4 shows the concentrations of the VHA, SHA, CHA and NEU fractions in the inlet water for both reservoirs. The results indicated that the VHA fraction made up approximately half of the total DOC. It was also observed that the percentage VHA fraction increased towards the end of the year concomitant with the increase in DOC concentration. The concentrations of the other three fractions were relatively constant over the year. Therefore, the results suggest that the increase in DOC in the latter half of the year was mainly contributed by the increase of the VHA fraction. The increase of VHA coincides with the increase in SUVA, specific colour and Mw. Also worthy of mention is that the percentage of the four fractions was very similar for both reservoirs for samples collected at the same period of time (February, March, September and October 2001). This indicated that at the same period of time the organic character in both reservoirs was similar. This supported the results obtained for SUVA, specific colour and Mw.
The variation of the distribution of the fractions over the year provided a good case study for organic character and treatability. Concentrations of each fraction were plotted against specific alum demand and alum dose, only the VHA fraction is shown (Figure 1.5). A good correlation was obtained between specific alum demand and VHA fraction (r2 value of 0.93 and 0.83 for Happy Valley and Myponga, respectively). In contrast to the good and clear relationship found between VHA fraction and specific alum demand, the SHA, CHA and NEU fractions demonstrated either poor correlation or inconsistency between the two WTPs. The SHA fraction showed good correlation for one WTP with r2 = 0.72 (Happy Valley) and poor correlation for the other with r2 = 0.05 (Myponga). The CHA concentration did not have any correlation with specific alum demand for both WTPs. The NEU fraction showed good correlation with r2 value of 0.67 and a positive slope for Myponga but no correlation for Happy Valley. The positive slope indicated that this fraction is harder to remove by alum treatment. When the NEU fraction concentration in the raw water increases, a higher alum dose is required, however due to the low concentration and small variation in NEU concentration over the monitored period (~0.1 mg/L DOC), its contribution to a dose increase may not be significant.
r2 = 0.83
r2 = 0.93
5
10
15
20
25
0 4 8 12
VHA (mg/L)
Spec
ific
Alu
m D
eman
d (m
g/m
g)
r2 = 0.80
r2 = 0.79
60
70
80
90
100
110
120
0 4 8 12
VHA (mg/L)
Alu
m D
ose
(mg/
L)
Figure 1.5 The correlation between (a) specific alum demand and (b) plant alum dose against VHA concentration. Δ: Happy Valley and O: Myponga WTP
(a) (b)
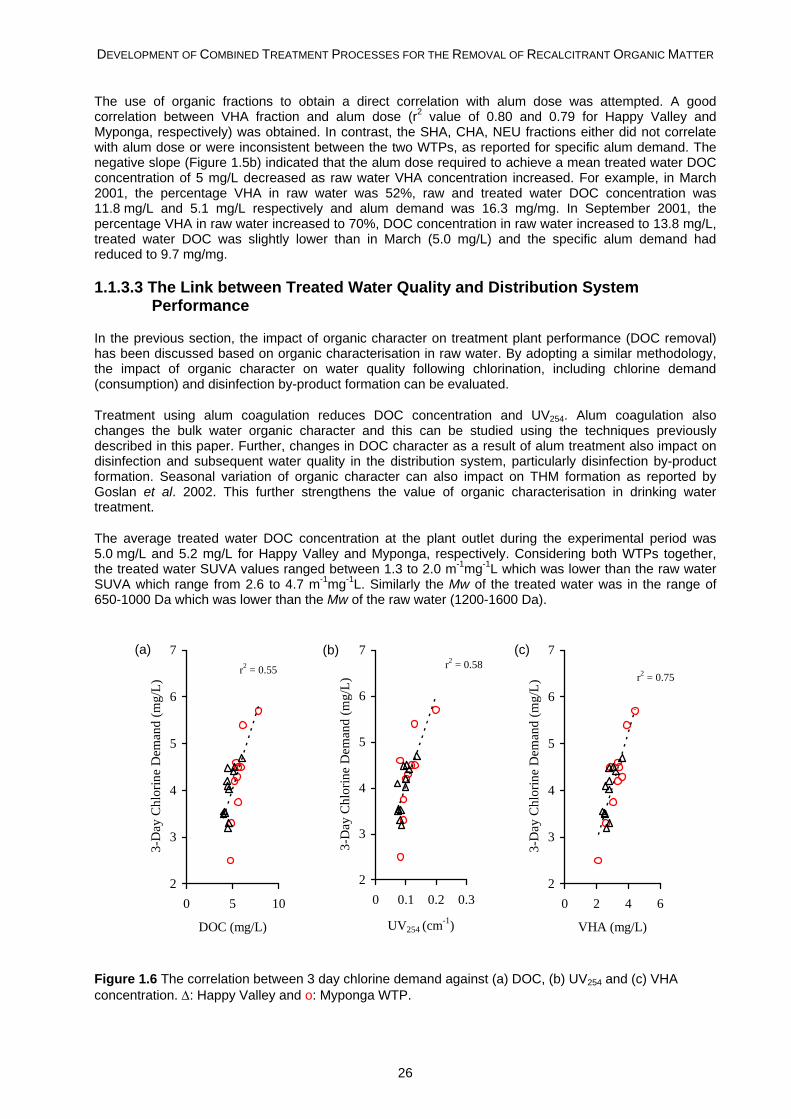
DEVELOPMENT OF COMBINED TREATMENT PROCESSES FOR THE REMOVAL OF RECALCITRANT ORGANIC MATTER
26
The use of organic fractions to obtain a direct correlation with alum dose was attempted. A good correlation between VHA fraction and alum dose (r2 value of 0.80 and 0.79 for Happy Valley and Myponga, respectively) was obtained. In contrast, the SHA, CHA, NEU fractions either did not correlate with alum dose or were inconsistent between the two WTPs, as reported for specific alum demand. The negative slope (Figure 1.5b) indicated that the alum dose required to achieve a mean treated water DOC concentration of 5 mg/L decreased as raw water VHA concentration increased. For example, in March 2001, the percentage VHA in raw water was 52%, raw and treated water DOC concentration was 11.8 mg/L and 5.1 mg/L respectively and alum demand was 16.3 mg/mg. In September 2001, the percentage VHA in raw water increased to 70%, DOC concentration in raw water increased to 13.8 mg/L, treated water DOC was slightly lower than in March (5.0 mg/L) and the specific alum demand had reduced to 9.7 mg/mg.
1.1.3.3 The Link between Treated Water Quality and Distribution System Performance
In the previous section, the impact of organic character on treatment plant performance (DOC removal) has been discussed based on organic characterisation in raw water. By adopting a similar methodology, the impact of organic character on water quality following chlorination, including chlorine demand (consumption) and disinfection by-product formation can be evaluated.
Treatment using alum coagulation reduces DOC concentration and UV254. Alum coagulation also changes the bulk water organic character and this can be studied using the techniques previously described in this paper. Further, changes in DOC character as a result of alum treatment also impact on disinfection and subsequent water quality in the distribution system, particularly disinfection by-product formation. Seasonal variation of organic character can also impact on THM formation as reported by Goslan et al. 2002. This further strengthens the value of organic characterisation in drinking water treatment.
The average treated water DOC concentration at the plant outlet during the experimental period was 5.0 mg/L and 5.2 mg/L for Happy Valley and Myponga, respectively. Considering both WTPs together, the treated water SUVA values ranged between 1.3 to 2.0 m-1mg-1L which was lower than the raw water SUVA which range from 2.6 to 4.7 m-1mg-1L. Similarly the Mw of the treated water was in the range of 650-1000 Da which was lower than the Mw of the raw water (1200-1600 Da).
r2 = 0.55
2
3
4
5
6
7
0 5 10
DOC (mg/L)
3-D
ay C
hlor
ine
Dem
and
(mg/
L)
r2 = 0.58
2
3
4
5
6
7
0 0.1 0.2 0.3
UV254 (cm-1)
3-D
ay C
hlor
ine
Dem
and
(mg/
L)
r2 = 0.75
2
3
4
5
6
7
0 2 4 6
VHA (mg/L)
3-D
ay C
hlor
ine
Dem
and
(mg/
L)
Figure 1.6 The correlation between 3 day chlorine demand against (a) DOC, (b) UV254 and (c) VHA concentration. Δ: Happy Valley and o: Myponga WTP.
(a) (b) (c)
CRC FOR WATER QUALITY AND TREATMENT – RESEARCH REPORT 38
27
Three-day chlorine demand (consumption) was determined for plant treated waters and waters generated using jar tests with a range of alum doses. This provided water samples with different DOC concentration and character. In Figure 1.6, the correlation of treated water DOC, UV254 and VHA concentration were used to link organic character with chlorine demand. The 3-day chlorine demand data correlated best with VHA (r2 = 0.75) followed by UV254 (r2 = 0.58) and DOC (r2 = 0.55). Poor correlation was found between the other fractions, SHA, CHA and NEU with chlorine demand showing an r2 less than 0.2. This indicated that the character of these organic fractions did not show a clear relationship to chlorine demand. From an operational point of view, as these fractions comprise relatively small percentages of the bulk DOC concentration, they were not considered parameters of concern. Similarly, SUVA and Mw using HPSEC, were also evaluated and the r2 values determined by regression analysis were found to be 0.35 and 0.06 for SUVA and Mw, respectively. From these results, VHA concentration was found to be the best parameter to correlate with chlorine demand.
The attempt to link organic character, DOC, UV254 , SUVA and VHA, SHA, CHA, NEU and Mw, with THM formation did not show a strong correlation. The best three correlating parameters were found to be UV254, DOC and VHA with r2 value of 0.48, 0.41 and 0.32, respectively. The lack of correlation with THM formation and only moderate correlation in the case of chlorine demand could be due to similarity of organic character of all the treated waters within this experimental set. Despite the fact that water treated using jar tests produced treated water with different quality, they were still relatively similar in their reactivity with chlorine. Therefore no clear correlation was apparent in the regression study.
1.1.4 Conclusion
There has been an increasing emphasis on improved water quality and operators of water utilities have become more aware of the impact of NOM on their treatment processes. This study shows that by improving the understanding of the NOM character, it is possible to optimise treatment. This can improve NOM removal and lead to reduced chlorine demand and disinfection by-products.
The use of the simple characterisation tool, such as SUVA, did not establish a link with DOC removal and applied alum dose. The use of the fractionation technique and HPSEC showed that the peak DOC concentration found during the summer of 2001 was mainly caused by the increase in concentration of the VHA fraction and consequently high molecular weight compounds as well. This correlated well with the performance of the treatment process which showed that applied alum dose decreased at the end of the year, due to ease of removal of the VHA fraction.
The current water treatment practice to optimise alum dose for the two WTPs based on the treated water quality as feed back control worked well. However, in this work we have demonstrated the link between organic character and DOC removal performance. When applying this technique to characterise raw water NOM, the appropriate coagulant dose can be selected to remove the majority of the coagulable NOM based on the concentrations of the fractions. It is possible to employ these techniques as organic character indicators to fine-tune the treatment process and potentially customise the treatment conditions to address the particular water character, hence achieving the goal of maximum NOM removal.
When considering distribution system performance, the control of disinfectant residual is an important factor. The goal of many water quality managers is to maintain a residual disinfectant concentration throughout the distribution system to prevent microbiological contamination while being palatable to customers. This work demonstrated the rapid fractionation technique can be used as a tool to predict chlorine demand, although the overall correlation of the sample set was not significant enough to be considered ideal. However, the obtained r2 figure for the correlation between VHA and chlorine demand is better than other commonly used parameters such as UV254 and DOC for the two studied WTPs.
DEVELOPMENT OF COMBINED TREATMENT PROCESSES FOR THE REMOVAL OF RECALCITRANT ORGANIC MATTER
28
1.1.5 References
APHA, AWWA and WEF (1998) Standard Methods For The Examination of Water and Waste Water, 20th Edition, American Public Health Association, Washington, DC.
Bennett LE and Drikas M (1993) The evaluation of colour in natural waters. Water Research 27(7), 1209-1218.
Bolto B, Abbt-Braum G, Dixon D, Eldridge R, Frimmel F, Hesse S, King S and Toifl M (1999) Experimental evaluation of cationic polyelectrolytes for removing natural organic matter from water. Water Science & Technology 40(9), 71-79.
Chin YP, Aiken G and O'Loughlin E (1994) Molecular weight, polydispersity and spectroscopic properties of aquatic humic substances. Environmental Science & Technology 28(11), 1853-1858.
Chow C, Fabris R and Drikas M (2004) A rapid fractionation technique to characterise natural organic matter for the optimisation of water treatment processes. Journal of Water Science Research & Technology 53(2), 85-92.
Chow CWK, van Leeuwen JA, Fabris R, King S, Withers N, Spark KM and Drikas M (2000) Enhanced coagulation for removal of dissolved organic carbon with alum - A fractionation approach. Proceedings of the 3rd AWWA WaterTECH Conference, Sydney, NSW.
Croue J-P, Martin B, Deguin A, and Legube B (1994) Isolation and characterisation of dissolved hydrophobic and hydrophilic organic substances of a reservoir water, natural organic matter in drinking water. American Water Works Association, Denver, p. 73.
Edzwald JK (1993) Coagulation in drinking water treatment: Particles, organics and coagulants. Water Science & Technology 27(11), 21-35.
Edzwald JK, Becker WC and Wattier KL (1985) Surrogate parameters for monitoring organic matter and THM precursors. Journal of the American Water Works Association 77(4), 122-132.
Egeberg PK, Christy AA and Eikenes M (2002) The molecular size of natural organic matter (NOM) by diffusimetry and seven other methods. Water Research 36, 925-932. Egeberg PK, Eikenes M and Gjessing ET (1999) Organic nitrogen distribution in NOM size classes.
Environment International 25(2-3), 225-236. Goel S, Hozalski RM and Bouwer EJ (1995) Biodegradation of NOM: Effect of NOM source and ozone
dose. Journal of the American Water Works Association 87(1), 90-105. Goslan EH, Fearing DA, Banks J, Wilson D, Hills P, Campbell AT and Parsons SA (2002) Seasonal
variations in the disinfection by-product precursor profile of a reservoir water. Journal of Water Science Research & Technology 51(8), 475-482.
Holmes M and Oemcke D (2002) Optimisation of conventional water treatment processes in Adelaide, South Australia. Proceedings of the IWA 3rd World Water Congress, April 7-12, Paper no. e20132a, Melbourne, Australia.
Krasner SW and Amy G (1995) Jar-test evaluations of enhanced coagulation. Journal of the American Water Works Association 87(10), 93-107.
Lough WJ and Wainer IW (1996) High performance liquid chromatography fundamental principles and practice. Blackie Academic & Professional, New York.
NHMRC/AWRC (1996) Australian Drinking Water Guidelines, National Health & Medical Research Council, and Agriculture & Resource Management Councils of Australia and New Zealand, Canberra.
O’Loughlin E and Chin YP (2001) Effect of detector wavelength on the determination of the molecular weight of humic substances by high-pressure size exclusion chromatography. Water Research 35(1), 333-338.
Owen DM, Amy GL, Chowdbury ZK, Paode R, McCoy G and Viscosil K (1995) NOM characterisation and treatability. Journal of the American Water Works Association 87(1), 46-63.
van Leeuwen JA, Fabris R, Sledz L and van Leeuwen JK (2001) Modelling enhanced alum treatment of southern Australian raw waters for drinking purposes. International Congress on Modelling and Simulation. MODSIM 2001. 10-13th December 2001. ANU, Canberra, Australia. Vol. 4, 1907-1912.
van Leeuwen J, Chow C, Fabris R, Withers N, Page D and Drikas M (2002) Application of a fractionation technique for the better understanding of the removal of NOM by alum coagulation. Water Science & Technology: Water Supply 2(5-6), 427–433.
Wang GS, Heieh ST and Hong CS (2000) Destruction of humic acid in water by UV light - Catalyzed oxidation with hydrogen peroxide. Water Research 34(15), 3882-3887.
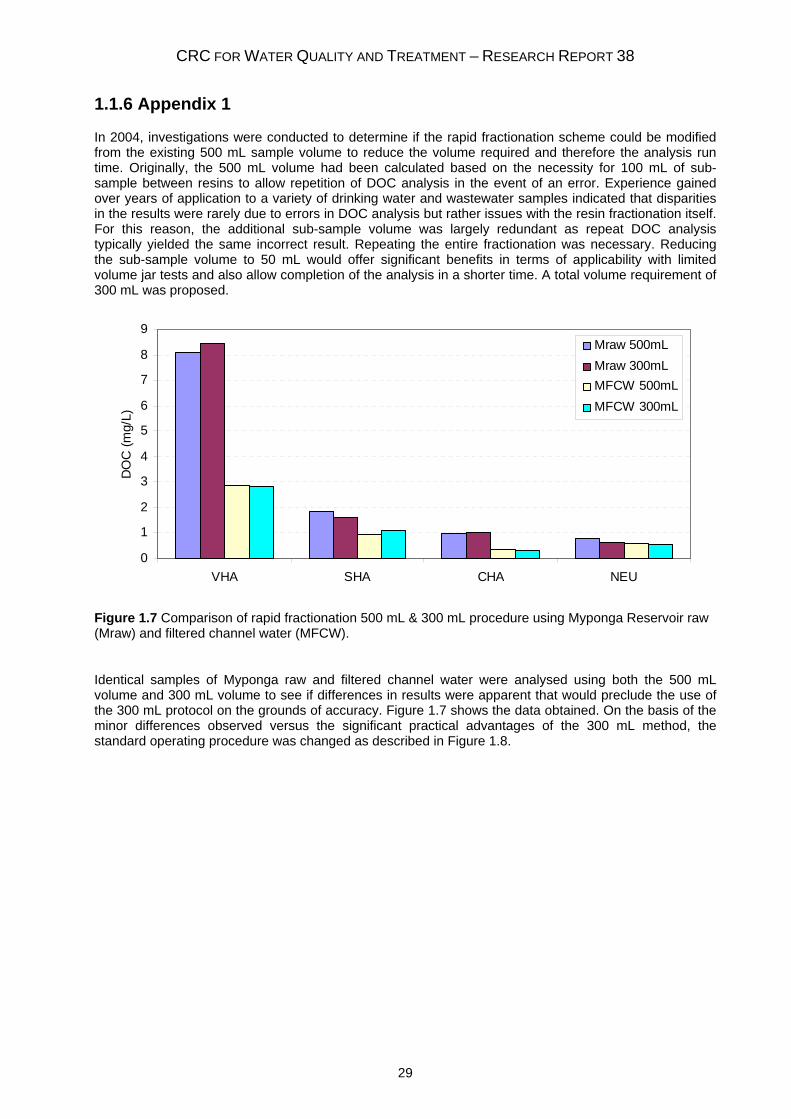
CRC FOR WATER QUALITY AND TREATMENT – RESEARCH REPORT 38
29
1.1.6 Appendix 1
In 2004, investigations were conducted to determine if the rapid fractionation scheme could be modified from the existing 500 mL sample volume to reduce the volume required and therefore the analysis run time. Originally, the 500 mL volume had been calculated based on the necessity for 100 mL of sub-sample between resins to allow repetition of DOC analysis in the event of an error. Experience gained over years of application to a variety of drinking water and wastewater samples indicated that disparities in the results were rarely due to errors in DOC analysis but rather issues with the resin fractionation itself. For this reason, the additional sub-sample volume was largely redundant as repeat DOC analysis typically yielded the same incorrect result. Repeating the entire fractionation was necessary. Reducing the sub-sample volume to 50 mL would offer significant benefits in terms of applicability with limited volume jar tests and also allow completion of the analysis in a shorter time. A total volume requirement of 300 mL was proposed.
0
1
2
3
4
5
6
7
8
9
VHA SHA CHA NEU
DO
C (m
g/L)
Mraw 500mLMraw 300mLMFCW 500mLMFCW 300mL
Figure 1.7 Comparison of rapid fractionation 500 mL & 300 mL procedure using Myponga Reservoir raw (Mraw) and filtered channel water (MFCW).
Identical samples of Myponga raw and filtered channel water were analysed using both the 500 mL volume and 300 mL volume to see if differences in results were apparent that would preclude the use of the 300 mL protocol on the grounds of accuracy. Figure 1.7 shows the data obtained. On the basis of the minor differences observed versus the significant practical advantages of the 300 mL method, the standard operating procedure was changed as described in Figure 1.8.
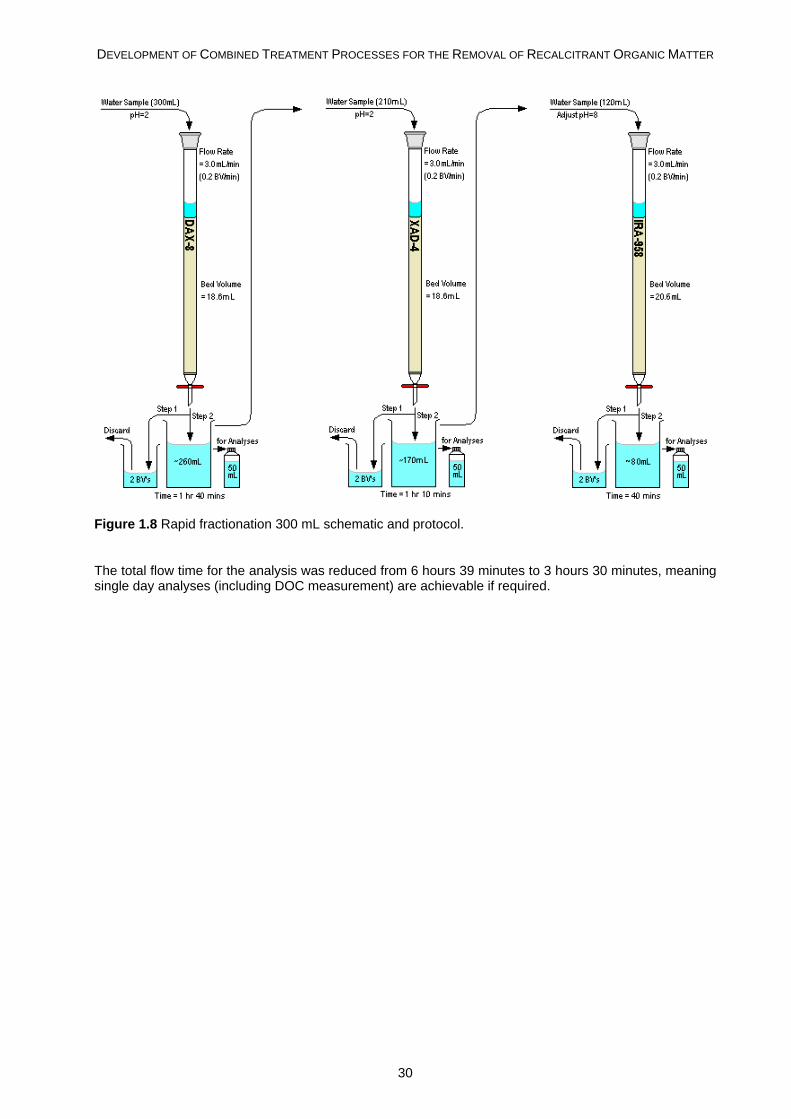
DEVELOPMENT OF COMBINED TREATMENT PROCESSES FOR THE REMOVAL OF RECALCITRANT ORGANIC MATTER
30
Figure 1.8 Rapid fractionation 300 mL schematic and protocol.
The total flow time for the analysis was reduced from 6 hours 39 minutes to 3 hours 30 minutes, meaning single day analyses (including DOC measurement) are achievable if required.
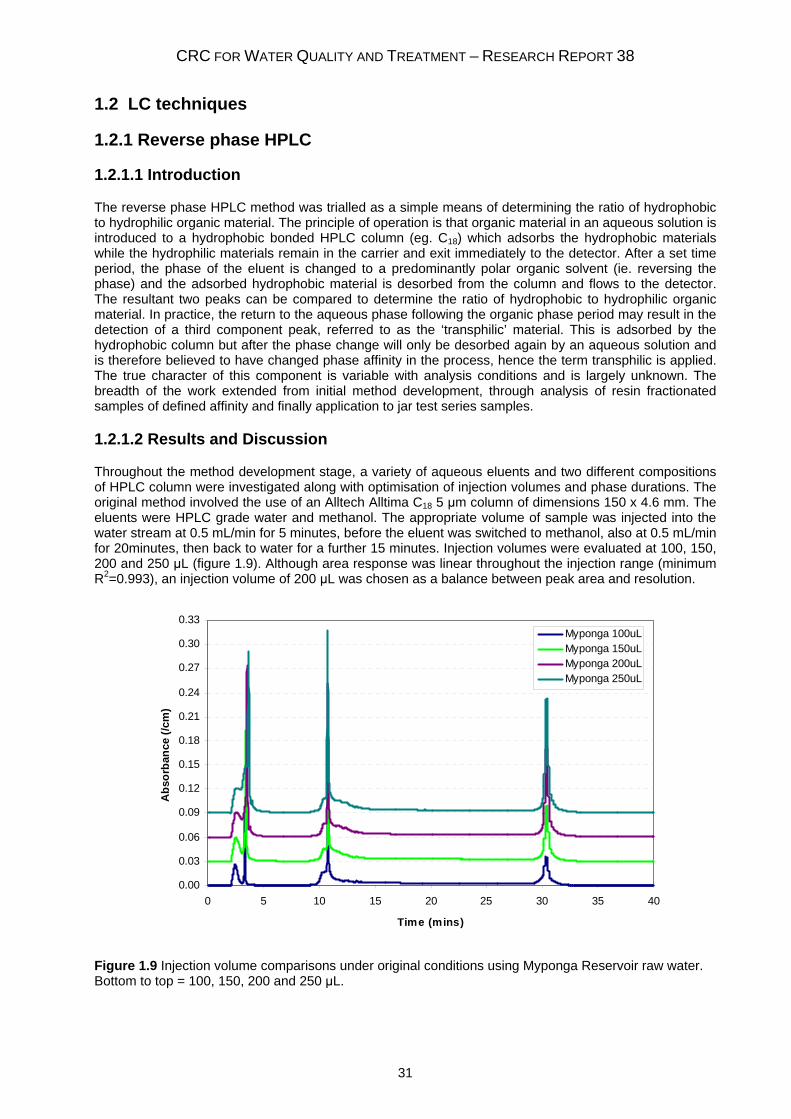
CRC FOR WATER QUALITY AND TREATMENT – RESEARCH REPORT 38
31
1.2 LC techniques
1.2.1 Reverse phase HPLC
1.2.1.1 Introduction
The reverse phase HPLC method was trialled as a simple means of determining the ratio of hydrophobic to hydrophilic organic material. The principle of operation is that organic material in an aqueous solution is introduced to a hydrophobic bonded HPLC column (eg. C18) which adsorbs the hydrophobic materials while the hydrophilic materials remain in the carrier and exit immediately to the detector. After a set time period, the phase of the eluent is changed to a predominantly polar organic solvent (ie. reversing the phase) and the adsorbed hydrophobic material is desorbed from the column and flows to the detector. The resultant two peaks can be compared to determine the ratio of hydrophobic to hydrophilic organic material. In practice, the return to the aqueous phase following the organic phase period may result in the detection of a third component peak, referred to as the ‘transphilic’ material. This is adsorbed by the hydrophobic column but after the phase change will only be desorbed again by an aqueous solution and is therefore believed to have changed phase affinity in the process, hence the term transphilic is applied. The true character of this component is variable with analysis conditions and is largely unknown. The breadth of the work extended from initial method development, through analysis of resin fractionated samples of defined affinity and finally application to jar test series samples.
1.2.1.2 Results and Discussion
Throughout the method development stage, a variety of aqueous eluents and two different compositions of HPLC column were investigated along with optimisation of injection volumes and phase durations. The original method involved the use of an Alltech Alltima C18 5 μm column of dimensions 150 x 4.6 mm. The eluents were HPLC grade water and methanol. The appropriate volume of sample was injected into the water stream at 0.5 mL/min for 5 minutes, before the eluent was switched to methanol, also at 0.5 mL/min for 20minutes, then back to water for a further 15 minutes. Injection volumes were evaluated at 100, 150, 200 and 250 μL (figure 1.9). Although area response was linear throughout the injection range (minimum R2=0.993), an injection volume of 200 μL was chosen as a balance between peak area and resolution.
0.00
0.03
0.06
0.09
0.12
0.15
0.18
0.21
0.24
0.27
0.30
0.33
0 5 10 15 20 25 30 35 40
Time (mins)
Abs
orba
nce
(/cm
)
Myponga 100uLMyponga 150uLMyponga 200uLMyponga 250uL
Figure 1.9 Injection volume comparisons under original conditions using Myponga Reservoir raw water. Bottom to top = 100, 150, 200 and 250 μL.
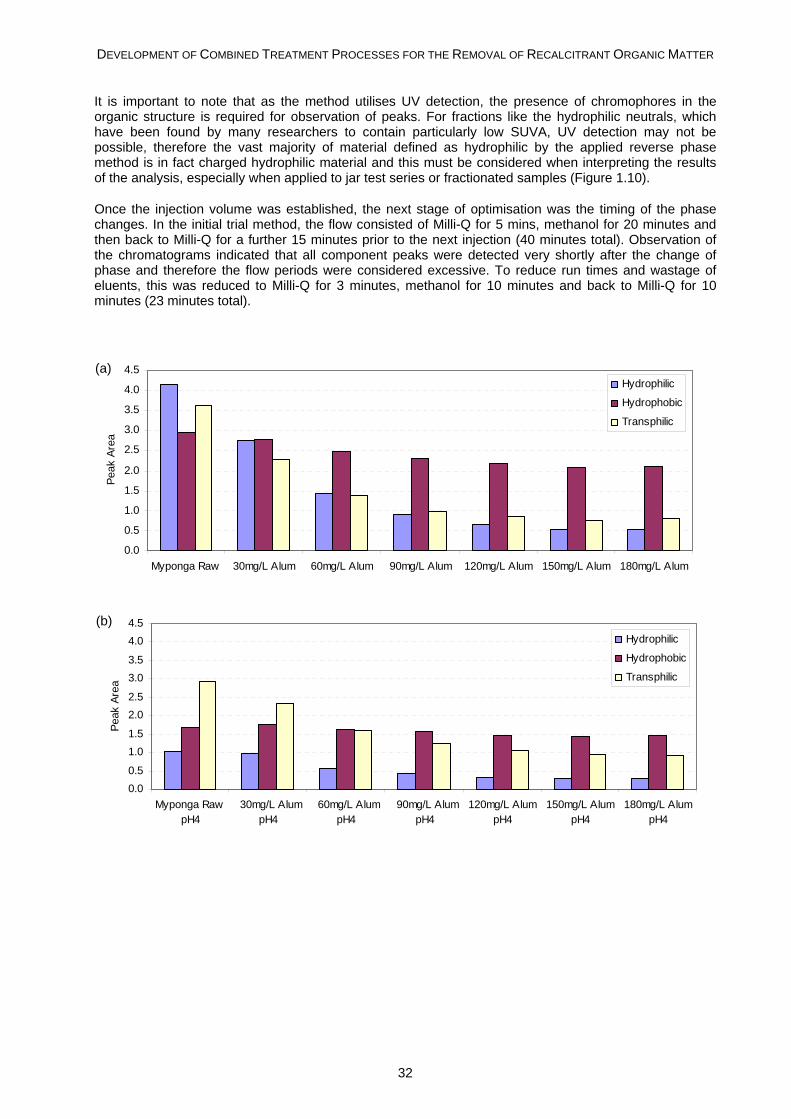
DEVELOPMENT OF COMBINED TREATMENT PROCESSES FOR THE REMOVAL OF RECALCITRANT ORGANIC MATTER
32
It is important to note that as the method utilises UV detection, the presence of chromophores in the organic structure is required for observation of peaks. For fractions like the hydrophilic neutrals, which have been found by many researchers to contain particularly low SUVA, UV detection may not be possible, therefore the vast majority of material defined as hydrophilic by the applied reverse phase method is in fact charged hydrophilic material and this must be considered when interpreting the results of the analysis, especially when applied to jar test series or fractionated samples (Figure 1.10).
Once the injection volume was established, the next stage of optimisation was the timing of the phase changes. In the initial trial method, the flow consisted of Milli-Q for 5 mins, methanol for 20 minutes and then back to Milli-Q for a further 15 minutes prior to the next injection (40 minutes total). Observation of the chromatograms indicated that all component peaks were detected very shortly after the change of phase and therefore the flow periods were considered excessive. To reduce run times and wastage of eluents, this was reduced to Milli-Q for 3 minutes, methanol for 10 minutes and back to Milli-Q for 10 minutes (23 minutes total).
0.0
0.5
1.0
1.5
2.0
2.5
3.0
3.5
4.0
4.5
Myponga Raw 30mg/L Alum 60mg/L Alum 90mg/L Alum 120mg/L Alum 150mg/L Alum 180mg/L Alum
Peak
Are
a
Hydrophilic
Hydrophobic
Transphilic
0.00.5
1.01.5
2.02.5
3.03.5
4.04.5
Myponga RawpH4
30mg/L Alum pH4
60mg/L Alum pH4
90mg/L Alum pH4
120mg/L AlumpH4
150mg/L AlumpH4
180mg/L AlumpH4
Peak
Are
a
Hydrophilic
Hydrophobic
Transphilic
(a)
(b)
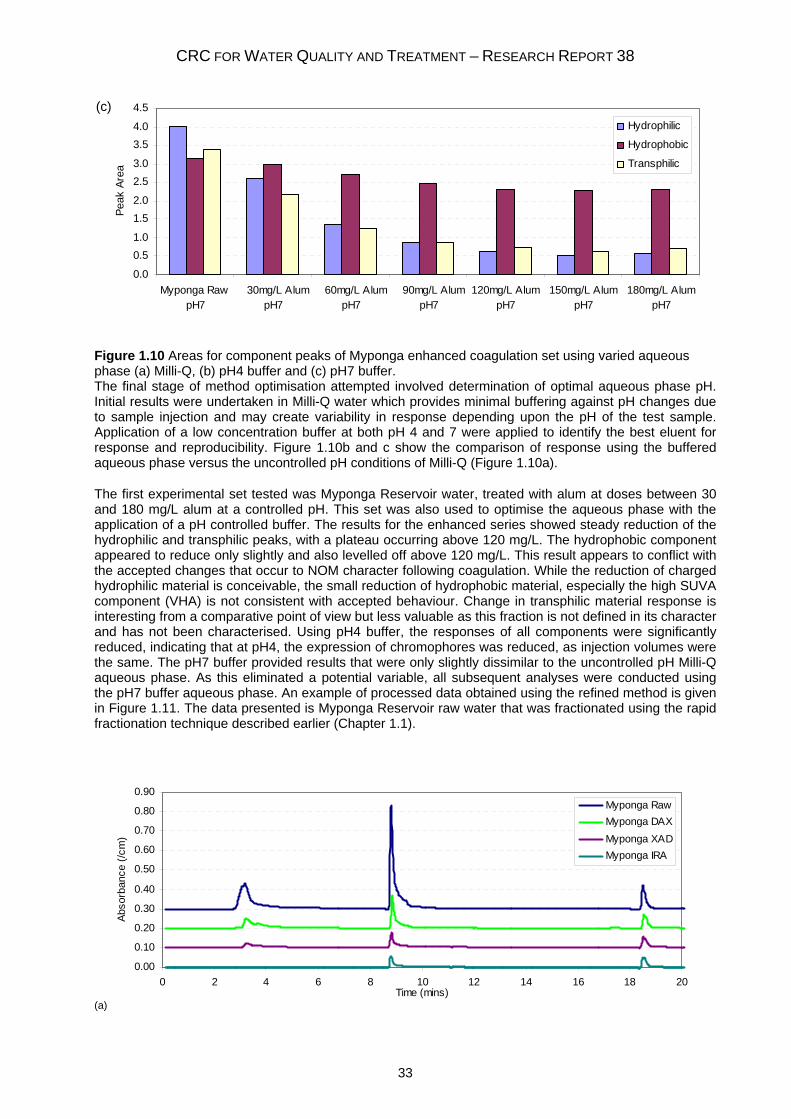
CRC FOR WATER QUALITY AND TREATMENT – RESEARCH REPORT 38
33
0.0
0.51.0
1.52.0
2.53.0
3.54.0
4.5
Myponga RawpH7
30mg/L AlumpH7
60mg/L AlumpH7
90mg/L AlumpH7
120mg/L AlumpH7
150mg/L AlumpH7
180mg/L AlumpH7
Peak
Are
aHydrophilic
Hydrophobic
Transphilic
Figure 1.10 Areas for component peaks of Myponga enhanced coagulation set using varied aqueous phase (a) Milli-Q, (b) pH4 buffer and (c) pH7 buffer. The final stage of method optimisation attempted involved determination of optimal aqueous phase pH. Initial results were undertaken in Milli-Q water which provides minimal buffering against pH changes due to sample injection and may create variability in response depending upon the pH of the test sample. Application of a low concentration buffer at both pH 4 and 7 were applied to identify the best eluent for response and reproducibility. Figure 1.10b and c show the comparison of response using the buffered aqueous phase versus the uncontrolled pH conditions of Milli-Q (Figure 1.10a).
The first experimental set tested was Myponga Reservoir water, treated with alum at doses between 30 and 180 mg/L alum at a controlled pH. This set was also used to optimise the aqueous phase with the application of a pH controlled buffer. The results for the enhanced series showed steady reduction of the hydrophilic and transphilic peaks, with a plateau occurring above 120 mg/L. The hydrophobic component appeared to reduce only slightly and also levelled off above 120 mg/L. This result appears to conflict with the accepted changes that occur to NOM character following coagulation. While the reduction of charged hydrophilic material is conceivable, the small reduction of hydrophobic material, especially the high SUVA component (VHA) is not consistent with accepted behaviour. Change in transphilic material response is interesting from a comparative point of view but less valuable as this fraction is not defined in its character and has not been characterised. Using pH4 buffer, the responses of all components were significantly reduced, indicating that at pH4, the expression of chromophores was reduced, as injection volumes were the same. The pH7 buffer provided results that were only slightly dissimilar to the uncontrolled pH Milli-Q aqueous phase. As this eliminated a potential variable, all subsequent analyses were conducted using the pH7 buffer aqueous phase. An example of processed data obtained using the refined method is given in Figure 1.11. The data presented is Myponga Reservoir raw water that was fractionated using the rapid fractionation technique described earlier (Chapter 1.1).
(a)
0.00
0.10
0.20
0.30
0.40
0.50
0.60
0.70
0.80
0.90
0 2 4 6 8 10 12 14 16 18 20Time (mins)
Abso
rban
ce (/
cm)
Myponga RawMyponga DAXMyponga XADMyponga IRA
(c)
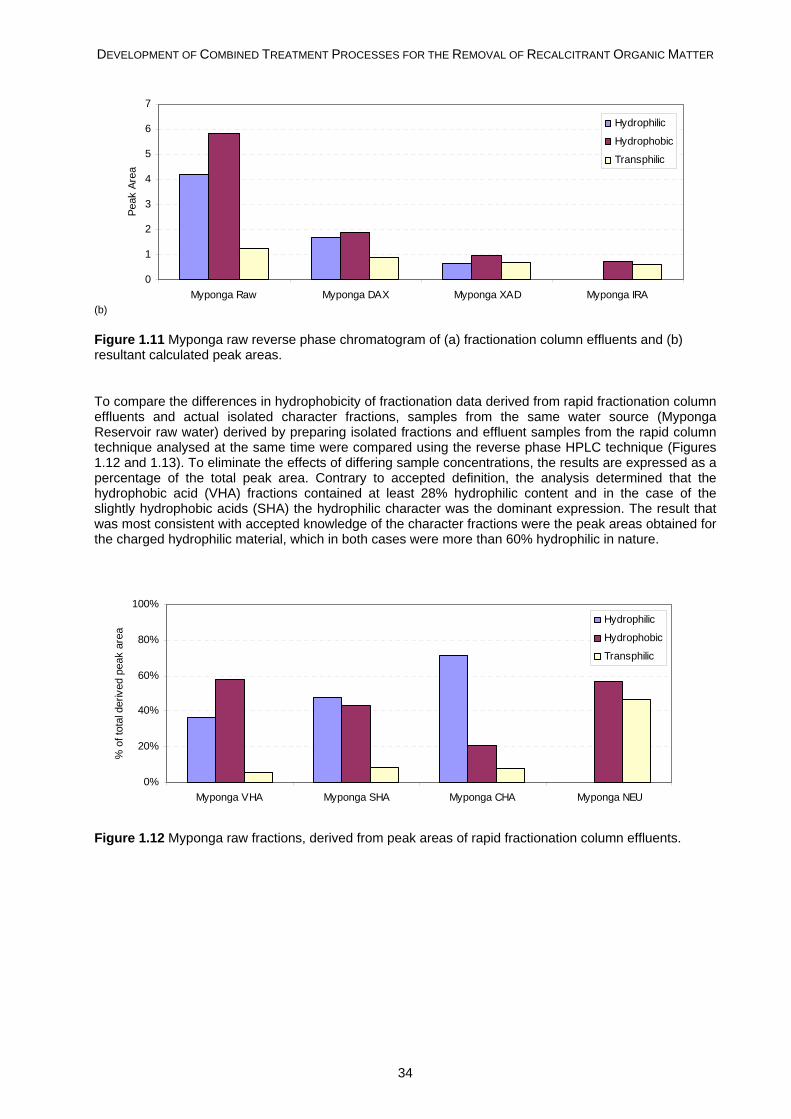
DEVELOPMENT OF COMBINED TREATMENT PROCESSES FOR THE REMOVAL OF RECALCITRANT ORGANIC MATTER
34
(b)
0
1
2
3
4
5
6
7
Myponga Raw Myponga DAX Myponga XAD Myponga IRA
Peak
Are
aHydrophilic
Hydrophobic
Transphilic
Figure 1.11 Myponga raw reverse phase chromatogram of (a) fractionation column effluents and (b) resultant calculated peak areas.
To compare the differences in hydrophobicity of fractionation data derived from rapid fractionation column effluents and actual isolated character fractions, samples from the same water source (Myponga Reservoir raw water) derived by preparing isolated fractions and effluent samples from the rapid column technique analysed at the same time were compared using the reverse phase HPLC technique (Figures 1.12 and 1.13). To eliminate the effects of differing sample concentrations, the results are expressed as a percentage of the total peak area. Contrary to accepted definition, the analysis determined that the hydrophobic acid (VHA) fractions contained at least 28% hydrophilic content and in the case of the slightly hydrophobic acids (SHA) the hydrophilic character was the dominant expression. The result that was most consistent with accepted knowledge of the character fractions were the peak areas obtained for the charged hydrophilic material, which in both cases were more than 60% hydrophilic in nature.
0%
20%
40%
60%
80%
100%
Myponga VHA Myponga SHA Myponga CHA Myponga NEU
% o
f tot
al d
eriv
ed p
eak
area
Hydrophilic
Hydrophobic
Transphilic
Figure 1.12 Myponga raw fractions, derived from peak areas of rapid fractionation column effluents.
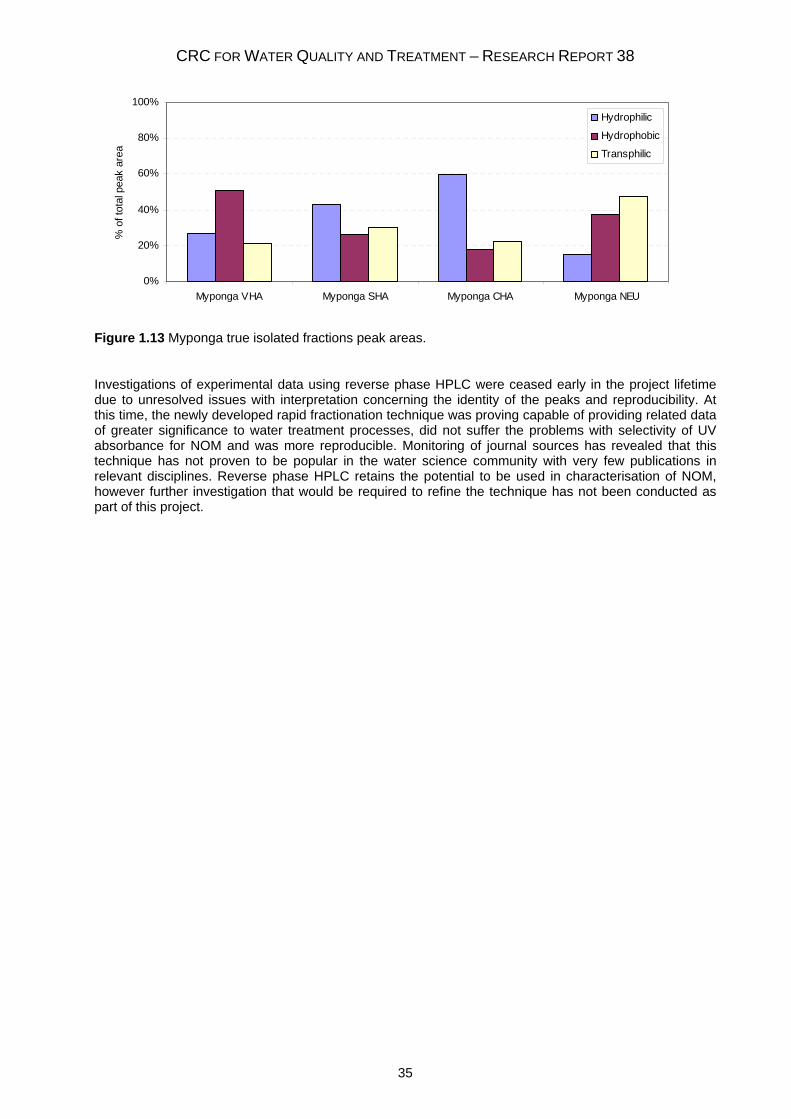
CRC FOR WATER QUALITY AND TREATMENT – RESEARCH REPORT 38
35
0%
20%
40%
60%
80%
100%
Myponga VHA Myponga SHA Myponga CHA Myponga NEU
% o
f tot
al p
eak
area
Hydrophilic
Hydrophobic
Transphilic
Figure 1.13 Myponga true isolated fractions peak areas.
Investigations of experimental data using reverse phase HPLC were ceased early in the project lifetime due to unresolved issues with interpretation concerning the identity of the peaks and reproducibility. At this time, the newly developed rapid fractionation technique was proving capable of providing related data of greater significance to water treatment processes, did not suffer the problems with selectivity of UV absorbance for NOM and was more reproducible. Monitoring of journal sources has revealed that this technique has not proven to be popular in the water science community with very few publications in relevant disciplines. Reverse phase HPLC retains the potential to be used in characterisation of NOM, however further investigation that would be required to refine the technique has not been conducted as part of this project.
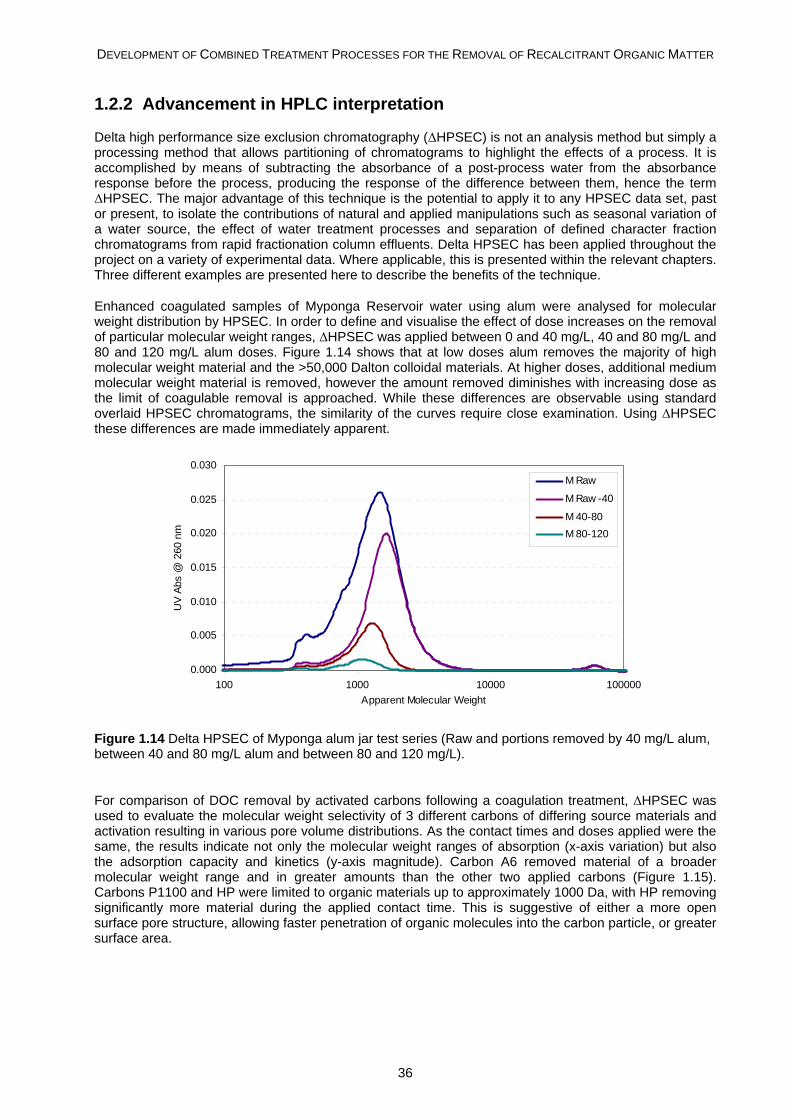
DEVELOPMENT OF COMBINED TREATMENT PROCESSES FOR THE REMOVAL OF RECALCITRANT ORGANIC MATTER
36
1.2.2 Advancement in HPLC interpretation
Delta high performance size exclusion chromatography (ΔHPSEC) is not an analysis method but simply a processing method that allows partitioning of chromatograms to highlight the effects of a process. It is accomplished by means of subtracting the absorbance of a post-process water from the absorbance response before the process, producing the response of the difference between them, hence the term ΔHPSEC. The major advantage of this technique is the potential to apply it to any HPSEC data set, past or present, to isolate the contributions of natural and applied manipulations such as seasonal variation of a water source, the effect of water treatment processes and separation of defined character fraction chromatograms from rapid fractionation column effluents. Delta HPSEC has been applied throughout the project on a variety of experimental data. Where applicable, this is presented within the relevant chapters. Three different examples are presented here to describe the benefits of the technique.
Enhanced coagulated samples of Myponga Reservoir water using alum were analysed for molecular weight distribution by HPSEC. In order to define and visualise the effect of dose increases on the removal of particular molecular weight ranges, ΔHPSEC was applied between 0 and 40 mg/L, 40 and 80 mg/L and 80 and 120 mg/L alum doses. Figure 1.14 shows that at low doses alum removes the majority of high molecular weight material and the >50,000 Dalton colloidal materials. At higher doses, additional medium molecular weight material is removed, however the amount removed diminishes with increasing dose as the limit of coagulable removal is approached. While these differences are observable using standard overlaid HPSEC chromatograms, the similarity of the curves require close examination. Using ΔHPSEC these differences are made immediately apparent.
0.000
0.005
0.010
0.015
0.020
0.025
0.030
100 1000 10000 100000Apparent Molecular Weight
UV
Abs
@ 2
60 n
m
M Raw
M Raw -40
M 40-80M 80-120
Figure 1.14 Delta HPSEC of Myponga alum jar test series (Raw and portions removed by 40 mg/L alum, between 40 and 80 mg/L alum and between 80 and 120 mg/L).
For comparison of DOC removal by activated carbons following a coagulation treatment, ΔHPSEC was used to evaluate the molecular weight selectivity of 3 different carbons of differing source materials and activation resulting in various pore volume distributions. As the contact times and doses applied were the same, the results indicate not only the molecular weight ranges of absorption (x-axis variation) but also the adsorption capacity and kinetics (y-axis magnitude). Carbon A6 removed material of a broader molecular weight range and in greater amounts than the other two applied carbons (Figure 1.15). Carbons P1100 and HP were limited to organic materials up to approximately 1000 Da, with HP removing significantly more material during the applied contact time. This is suggestive of either a more open surface pore structure, allowing faster penetration of organic molecules into the carbon particle, or greater surface area.
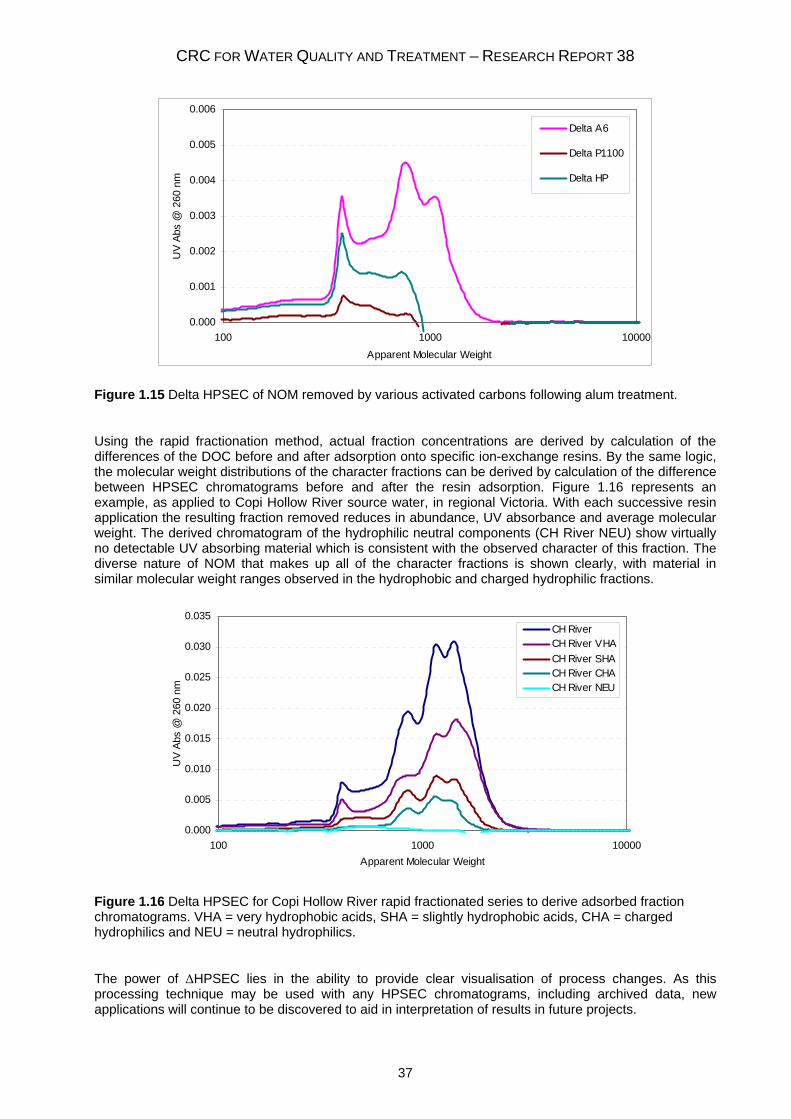
CRC FOR WATER QUALITY AND TREATMENT – RESEARCH REPORT 38
37
0.000
0.001
0.002
0.003
0.004
0.005
0.006
100 1000 10000Apparent Molecular Weight
UV
Abs
@ 2
60 n
m
Delta A6
Delta P1100
Delta HP
Figure 1.15 Delta HPSEC of NOM removed by various activated carbons following alum treatment.
Using the rapid fractionation method, actual fraction concentrations are derived by calculation of the differences of the DOC before and after adsorption onto specific ion-exchange resins. By the same logic, the molecular weight distributions of the character fractions can be derived by calculation of the difference between HPSEC chromatograms before and after the resin adsorption. Figure 1.16 represents an example, as applied to Copi Hollow River source water, in regional Victoria. With each successive resin application the resulting fraction removed reduces in abundance, UV absorbance and average molecular weight. The derived chromatogram of the hydrophilic neutral components (CH River NEU) show virtually no detectable UV absorbing material which is consistent with the observed character of this fraction. The diverse nature of NOM that makes up all of the character fractions is shown clearly, with material in similar molecular weight ranges observed in the hydrophobic and charged hydrophilic fractions.
0.000
0.005
0.010
0.015
0.020
0.025
0.030
0.035
100 1000 10000Apparent Molecular Weight
UV
Abs
@ 2
60 n
m
CH RiverCH River VHACH River SHACH River CHACH River NEU
Figure 1.16 Delta HPSEC for Copi Hollow River rapid fractionated series to derive adsorbed fraction chromatograms. VHA = very hydrophobic acids, SHA = slightly hydrophobic acids, CHA = charged hydrophilics and NEU = neutral hydrophilics.
The power of ΔHPSEC lies in the ability to provide clear visualisation of process changes. As this processing technique may be used with any HPSEC chromatograms, including archived data, new applications will continue to be discovered to aid in interpretation of results in future projects.
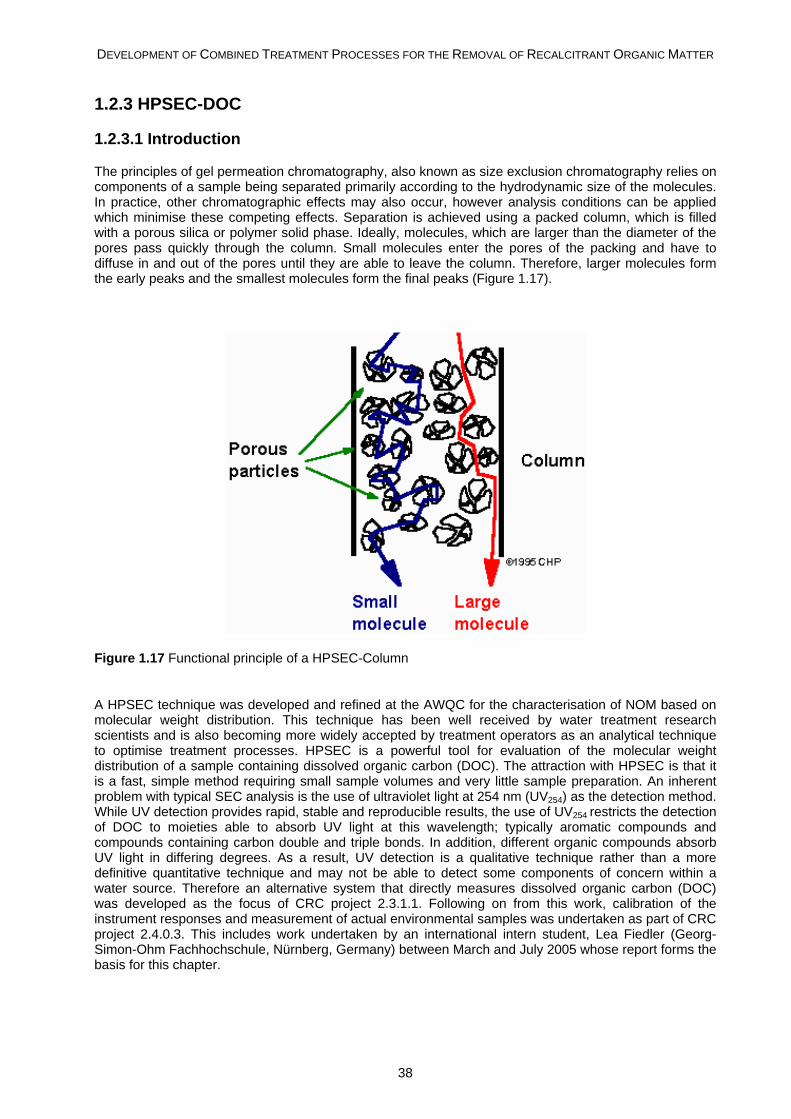
DEVELOPMENT OF COMBINED TREATMENT PROCESSES FOR THE REMOVAL OF RECALCITRANT ORGANIC MATTER
38
1.2.3 HPSEC-DOC
1.2.3.1 Introduction
The principles of gel permeation chromatography, also known as size exclusion chromatography relies on components of a sample being separated primarily according to the hydrodynamic size of the molecules. In practice, other chromatographic effects may also occur, however analysis conditions can be applied which minimise these competing effects. Separation is achieved using a packed column, which is filled with a porous silica or polymer solid phase. Ideally, molecules, which are larger than the diameter of the pores pass quickly through the column. Small molecules enter the pores of the packing and have to diffuse in and out of the pores until they are able to leave the column. Therefore, larger molecules form the early peaks and the smallest molecules form the final peaks (Figure 1.17).
Figure 1.17 Functional principle of a HPSEC-Column
A HPSEC technique was developed and refined at the AWQC for the characterisation of NOM based on molecular weight distribution. This technique has been well received by water treatment research scientists and is also becoming more widely accepted by treatment operators as an analytical technique to optimise treatment processes. HPSEC is a powerful tool for evaluation of the molecular weight distribution of a sample containing dissolved organic carbon (DOC). The attraction with HPSEC is that it is a fast, simple method requiring small sample volumes and very little sample preparation. An inherent problem with typical SEC analysis is the use of ultraviolet light at 254 nm (UV254) as the detection method. While UV detection provides rapid, stable and reproducible results, the use of UV254 restricts the detection of DOC to moieties able to absorb UV light at this wavelength; typically aromatic compounds and compounds containing carbon double and triple bonds. In addition, different organic compounds absorb UV light in differing degrees. As a result, UV detection is a qualitative technique rather than a more definitive quantitative technique and may not be able to detect some components of concern within a water source. Therefore an alternative system that directly measures dissolved organic carbon (DOC) was developed as the focus of CRC project 2.3.1.1. Following on from this work, calibration of the instrument responses and measurement of actual environmental samples was undertaken as part of CRC project 2.4.0.3. This includes work undertaken by an international intern student, Lea Fiedler (Georg-Simon-Ohm Fachhochschule, Nürnberg, Germany) between March and July 2005 whose report forms the basis for this chapter.
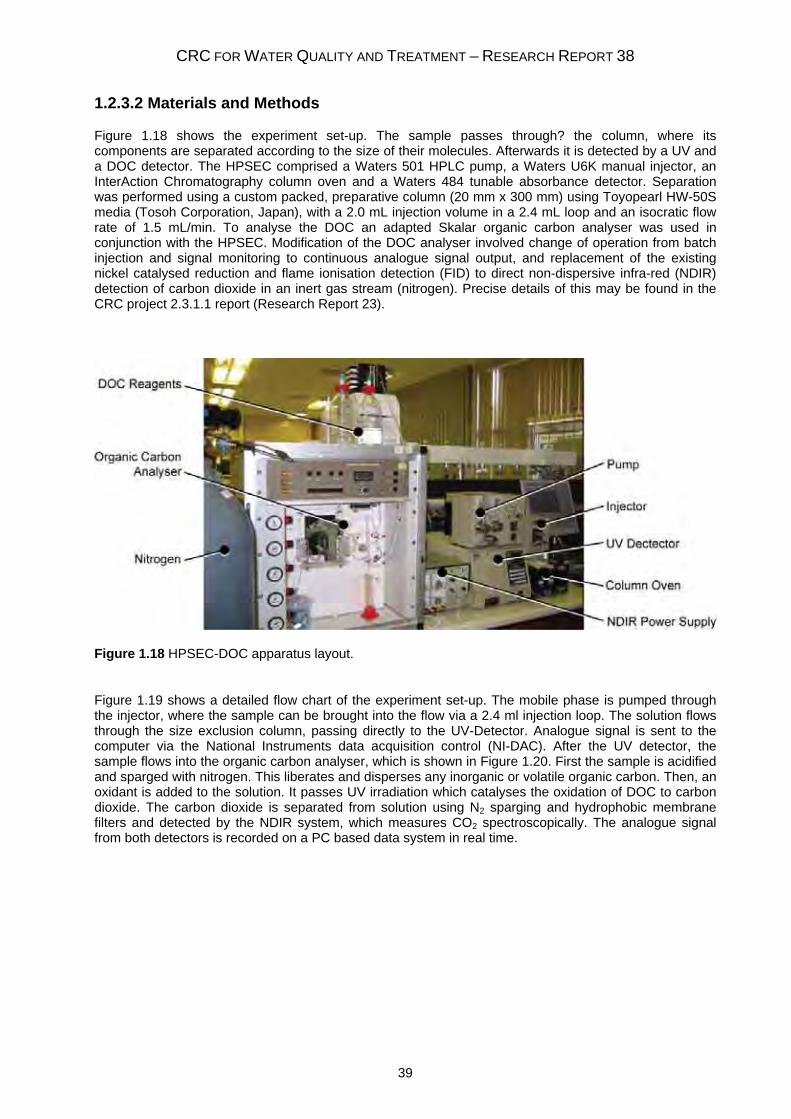
CRC FOR WATER QUALITY AND TREATMENT – RESEARCH REPORT 38
39
1.2.3.2 Materials and Methods
Figure 1.18 shows the experiment set-up. The sample passes through? the column, where its components are separated according to the size of their molecules. Afterwards it is detected by a UV and a DOC detector. The HPSEC comprised a Waters 501 HPLC pump, a Waters U6K manual injector, an InterAction Chromatography column oven and a Waters 484 tunable absorbance detector. Separation was performed using a custom packed, preparative column (20 mm x 300 mm) using Toyopearl HW-50S media (Tosoh Corporation, Japan), with a 2.0 mL injection volume in a 2.4 mL loop and an isocratic flow rate of 1.5 mL/min. To analyse the DOC an adapted Skalar organic carbon analyser was used in conjunction with the HPSEC. Modification of the DOC analyser involved change of operation from batch injection and signal monitoring to continuous analogue signal output, and replacement of the existing nickel catalysed reduction and flame ionisation detection (FID) to direct non-dispersive infra-red (NDIR) detection of carbon dioxide in an inert gas stream (nitrogen). Precise details of this may be found in the CRC project 2.3.1.1 report (Research Report 23).
Figure 1.18 HPSEC-DOC apparatus layout.
Figure 1.19 shows a detailed flow chart of the experiment set-up. The mobile phase is pumped through the injector, where the sample can be brought into the flow via a 2.4 ml injection loop. The solution flows through the size exclusion column, passing directly to the UV-Detector. Analogue signal is sent to the computer via the National Instruments data acquisition control (NI-DAC). After the UV detector, the sample flows into the organic carbon analyser, which is shown in Figure 1.20. First the sample is acidified and sparged with nitrogen. This liberates and disperses any inorganic or volatile organic carbon. Then, an oxidant is added to the solution. It passes UV irradiation which catalyses the oxidation of DOC to carbon dioxide. The carbon dioxide is separated from solution using N2 sparging and hydrophobic membrane filters and detected by the NDIR system, which measures CO2 spectroscopically. The analogue signal from both detectors is recorded on a PC based data system in real time.
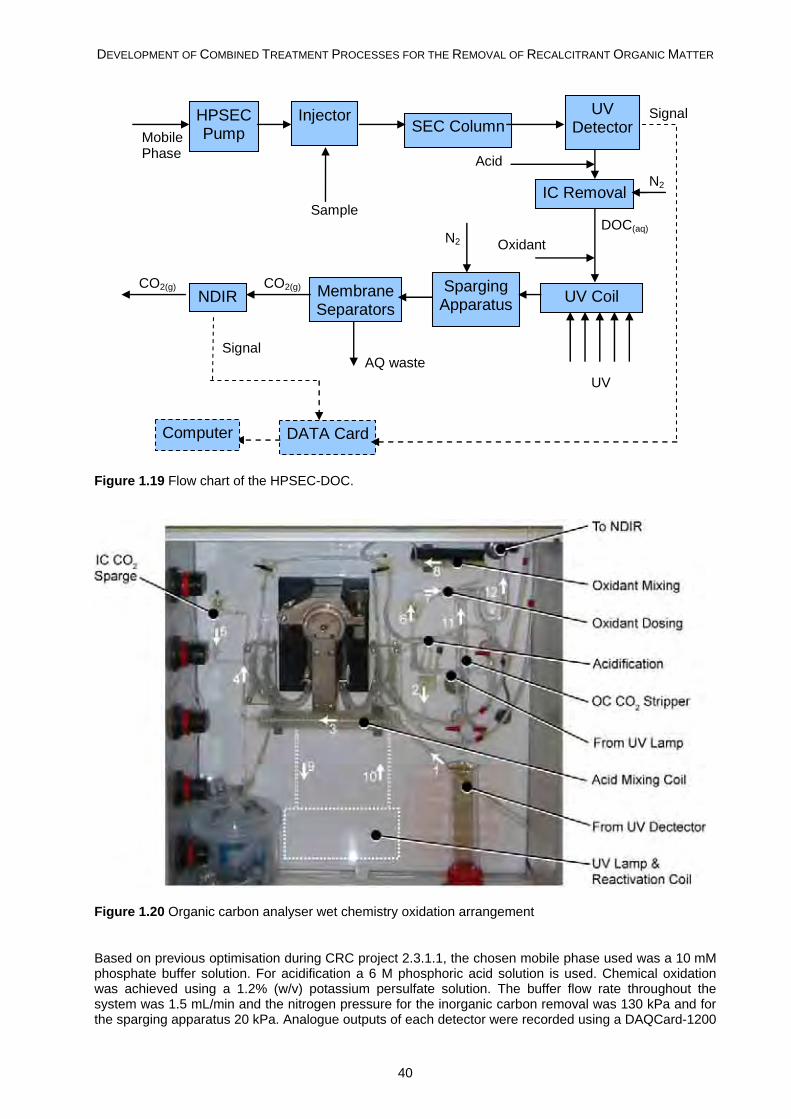
DEVELOPMENT OF COMBINED TREATMENT PROCESSES FOR THE REMOVAL OF RECALCITRANT ORGANIC MATTER
40
HPSEC Pump
InjectorSEC Column
UV Detector
IC Removal
DATA CardComputer
UV Coil NDIR MembraneSeparators
N2
AQ waste
CO2(g)
Oxidant
Sample
Acid
DOC(aq)
UV
Signal
Signal
CO2(g)
N2
Sparging Apparatus
Mobile Phase
Figure 1.19 Flow chart of the HPSEC-DOC.
Figure 1.20 Organic carbon analyser wet chemistry oxidation arrangement
Based on previous optimisation during CRC project 2.3.1.1, the chosen mobile phase used was a 10 mM phosphate buffer solution. For acidification a 6 M phosphoric acid solution is used. Chemical oxidation was achieved using a 1.2% (w/v) potassium persulfate solution. The buffer flow rate throughout the system was 1.5 mL/min and the nitrogen pressure for the inorganic carbon removal was 130 kPa and for the sparging apparatus 20 kPa. Analogue outputs of each detector were recorded using a DAQCard-1200
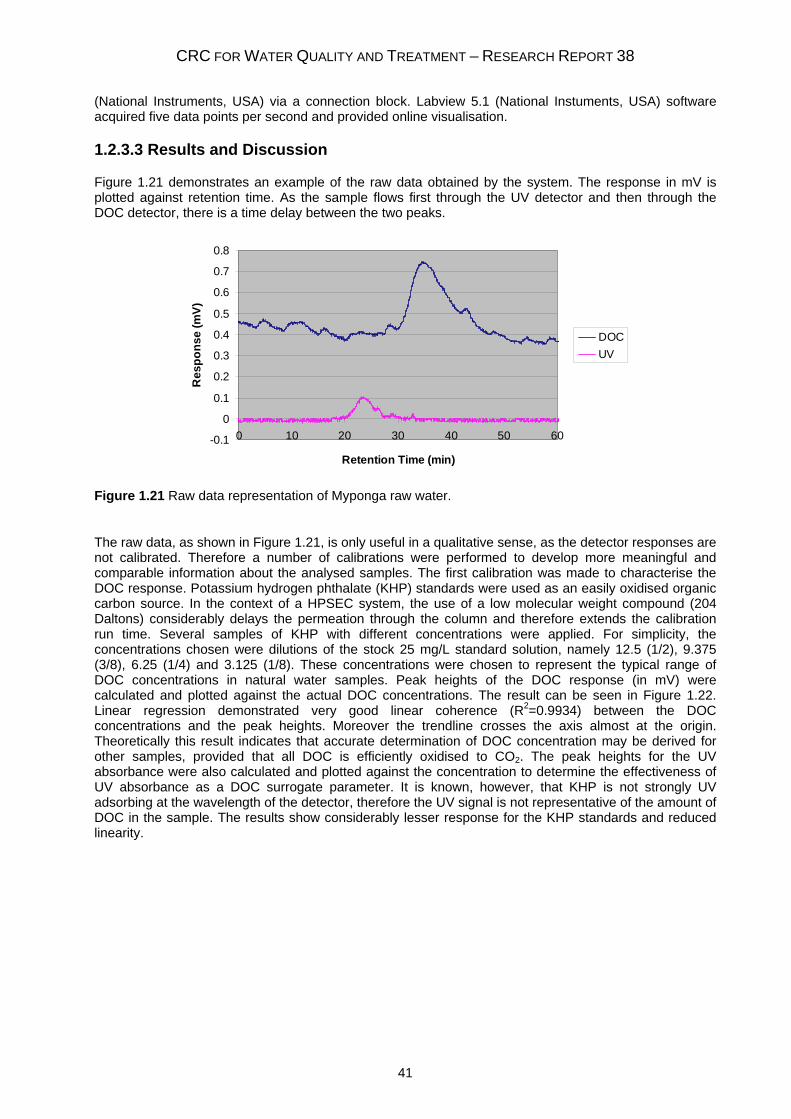
CRC FOR WATER QUALITY AND TREATMENT – RESEARCH REPORT 38
41
(National Instruments, USA) via a connection block. Labview 5.1 (National Instuments, USA) software acquired five data points per second and provided online visualisation.
1.2.3.3 Results and Discussion
Figure 1.21 demonstrates an example of the raw data obtained by the system. The response in mV is plotted against retention time. As the sample flows first through the UV detector and then through the DOC detector, there is a time delay between the two peaks.
-0.1
0
0.1
0.2
0.3
0.4
0.5
0.6
0.7
0.8
0 10 20 30 40 50 60
Retention Time (min)
Res
pons
e (m
V)
DOCUV
Figure 1.21 Raw data representation of Myponga raw water.
The raw data, as shown in Figure 1.21, is only useful in a qualitative sense, as the detector responses are not calibrated. Therefore a number of calibrations were performed to develop more meaningful and comparable information about the analysed samples. The first calibration was made to characterise the DOC response. Potassium hydrogen phthalate (KHP) standards were used as an easily oxidised organic carbon source. In the context of a HPSEC system, the use of a low molecular weight compound (204 Daltons) considerably delays the permeation through the column and therefore extends the calibration run time. Several samples of KHP with different concentrations were applied. For simplicity, the concentrations chosen were dilutions of the stock 25 mg/L standard solution, namely 12.5 (1/2), 9.375 (3/8), 6.25 (1/4) and 3.125 (1/8). These concentrations were chosen to represent the typical range of DOC concentrations in natural water samples. Peak heights of the DOC response (in mV) were calculated and plotted against the actual DOC concentrations. The result can be seen in Figure 1.22. Linear regression demonstrated very good linear coherence (R2=0.9934) between the DOC concentrations and the peak heights. Moreover the trendline crosses the axis almost at the origin. Theoretically this result indicates that accurate determination of DOC concentration may be derived for other samples, provided that all DOC is efficiently oxidised to CO2. The peak heights for the UV absorbance were also calculated and plotted against the concentration to determine the effectiveness of UV absorbance as a DOC surrogate parameter. It is known, however, that KHP is not strongly UV adsorbing at the wavelength of the detector, therefore the UV signal is not representative of the amount of DOC in the sample. The results show considerably lesser response for the KHP standards and reduced linearity.
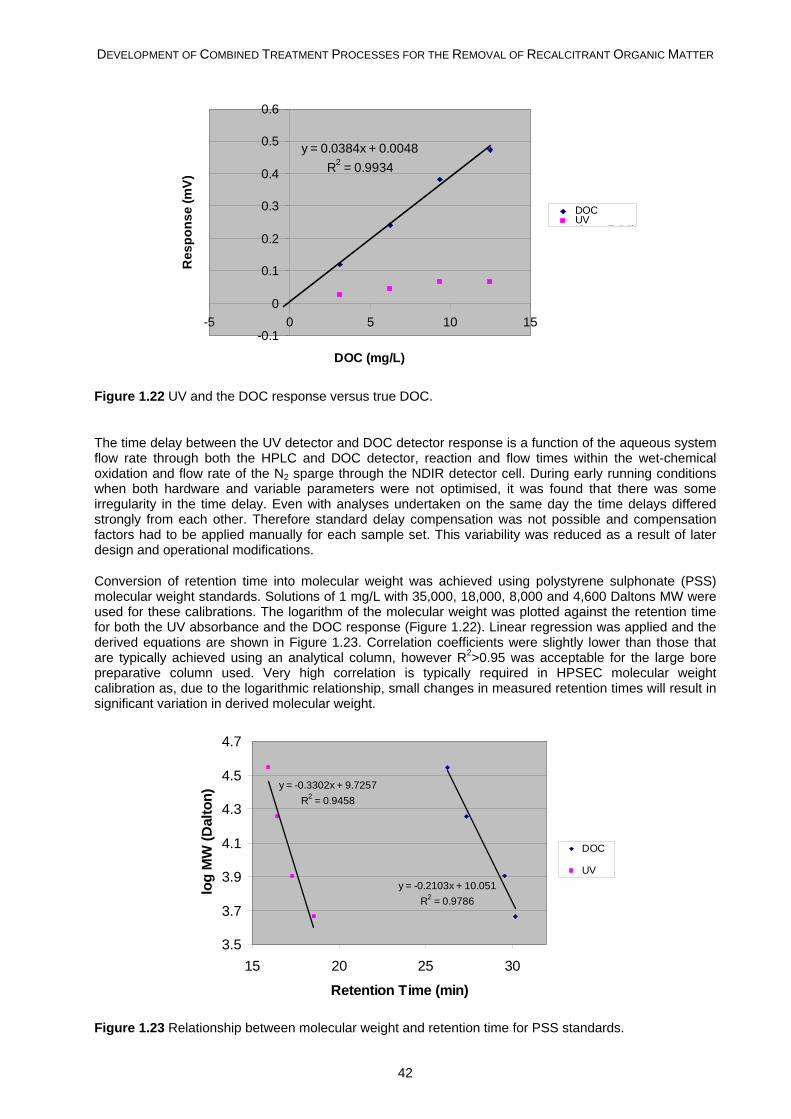
DEVELOPMENT OF COMBINED TREATMENT PROCESSES FOR THE REMOVAL OF RECALCITRANT ORGANIC MATTER
42
y = 0.0384x + 0.0048R2 = 0.9934
-0.1
0
0.1
0.2
0.3
0.4
0.5
0.6
-5 0 5 10 15
DOC (mg/L)
Res
pons
e (m
V)
DOCUVLi (DOC)
Figure 1.22 UV and the DOC response versus true DOC.
The time delay between the UV detector and DOC detector response is a function of the aqueous system flow rate through both the HPLC and DOC detector, reaction and flow times within the wet-chemical oxidation and flow rate of the N2 sparge through the NDIR detector cell. During early running conditions when both hardware and variable parameters were not optimised, it was found that there was some irregularity in the time delay. Even with analyses undertaken on the same day the time delays differed strongly from each other. Therefore standard delay compensation was not possible and compensation factors had to be applied manually for each sample set. This variability was reduced as a result of later design and operational modifications.
Conversion of retention time into molecular weight was achieved using polystyrene sulphonate (PSS) molecular weight standards. Solutions of 1 mg/L with 35,000, 18,000, 8,000 and 4,600 Daltons MW were used for these calibrations. The logarithm of the molecular weight was plotted against the retention time for both the UV absorbance and the DOC response (Figure 1.22). Linear regression was applied and the derived equations are shown in Figure 1.23. Correlation coefficients were slightly lower than those that are typically achieved using an analytical column, however R2>0.95 was acceptable for the large bore preparative column used. Very high correlation is typically required in HPSEC molecular weight calibration as, due to the logarithmic relationship, small changes in measured retention times will result in significant variation in derived molecular weight.
y = -0.3302x + 9.7257R2 = 0.9458
y = -0.2103x + 10.051R2 = 0.9786
3.5
3.7
3.9
4.1
4.3
4.5
4.7
15 20 25 30
Retention Time (min)
log
MW
(Dal
ton)
DOC
UV
Figure 1.23 Relationship between molecular weight and retention time for PSS standards.
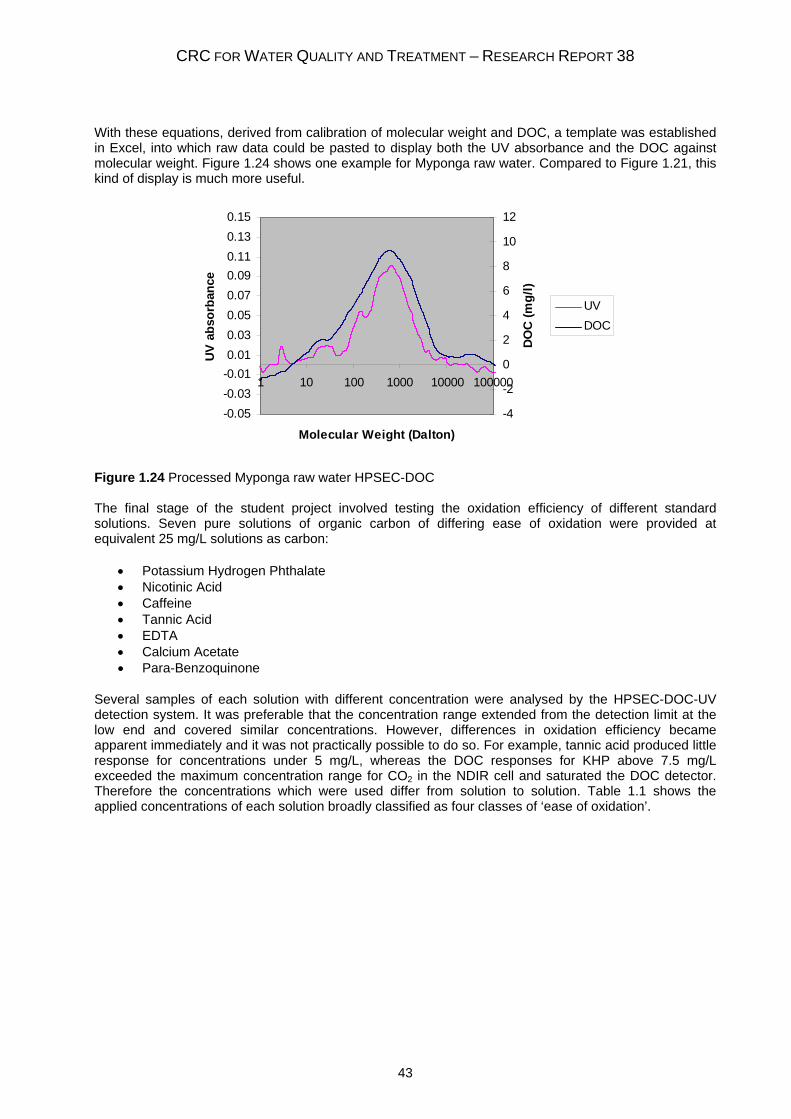
CRC FOR WATER QUALITY AND TREATMENT – RESEARCH REPORT 38
43
With these equations, derived from calibration of molecular weight and DOC, a template was established in Excel, into which raw data could be pasted to display both the UV absorbance and the DOC against molecular weight. Figure 1.24 shows one example for Myponga raw water. Compared to Figure 1.21, this kind of display is much more useful.
-0.05-0.03-0.010.010.030.050.070.090.110.130.15
1 10 100 1000 10000 100000
Molecular Weight (Dalton)
UV
abs
orba
nce
-4
-2
0
2
4
6
8
10
12
DO
C (m
g/l)
UVDOC
Figure 1.24 Processed Myponga raw water HPSEC-DOC The final stage of the student project involved testing the oxidation efficiency of different standard solutions. Seven pure solutions of organic carbon of differing ease of oxidation were provided at equivalent 25 mg/L solutions as carbon:
• Potassium Hydrogen Phthalate • Nicotinic Acid • Caffeine • Tannic Acid • EDTA • Calcium Acetate • Para-Benzoquinone
Several samples of each solution with different concentration were analysed by the HPSEC-DOC-UV detection system. It was preferable that the concentration range extended from the detection limit at the low end and covered similar concentrations. However, differences in oxidation efficiency became apparent immediately and it was not practically possible to do so. For example, tannic acid produced little response for concentrations under 5 mg/L, whereas the DOC responses for KHP above 7.5 mg/L exceeded the maximum concentration range for CO2 in the NDIR cell and saturated the DOC detector. Therefore the concentrations which were used differ from solution to solution. Table 1.1 shows the applied concentrations of each solution broadly classified as four classes of ‘ease of oxidation’.
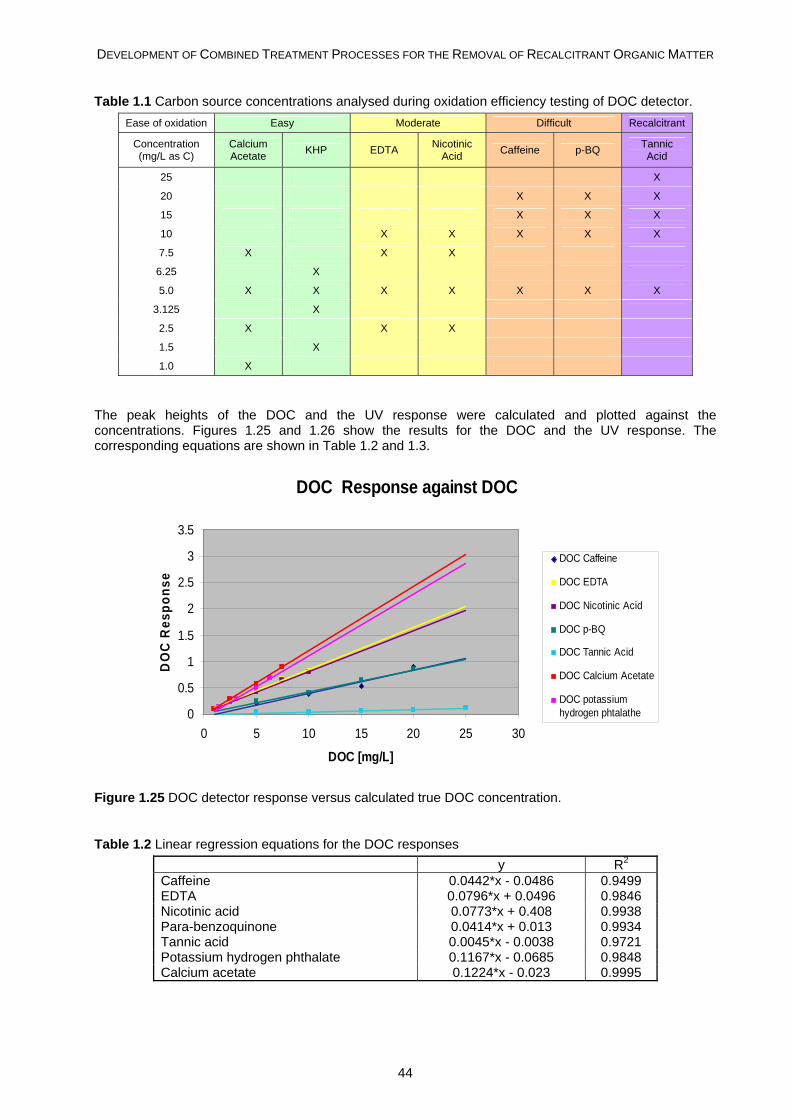
DEVELOPMENT OF COMBINED TREATMENT PROCESSES FOR THE REMOVAL OF RECALCITRANT ORGANIC MATTER
44
Table 1.1 Carbon source concentrations analysed during oxidation efficiency testing of DOC detector. Ease of oxidation Easy Moderate Difficult Recalcitrant
Concentration (mg/L as C)
Calcium Acetate KHP EDTA Nicotinic
Acid Caffeine p-BQ Tannic Acid
25 X
20 X X X
15 X X X
10 X X X X X
7.5 X X X
6.25 X
5.0 X X X X X X X
3.125 X
2.5 X X X
1.5 X
1.0 X
The peak heights of the DOC and the UV response were calculated and plotted against the concentrations. Figures 1.25 and 1.26 show the results for the DOC and the UV response. The corresponding equations are shown in Table 1.2 and 1.3.
DOC Response against DOC
0
0.5
1
1.5
2
2.5
3
3.5
0 5 10 15 20 25 30
DOC [mg/L]
DO
C R
espo
nse
DOC Caffeine
DOC EDTA
DOC Nicotinic Acid
DOC p-BQ
DOC Tannic Acid
DOC Calcium Acetate
DOC potassiumhydrogen phtalathe
Figure 1.25 DOC detector response versus calculated true DOC concentration.
Table 1.2 Linear regression equations for the DOC responses y R2 Caffeine 0.0442*x - 0.0486 0.9499 EDTA 0.0796*x + 0.0496 0.9846 Nicotinic acid 0.0773*x + 0.408 0.9938 Para-benzoquinone 0.0414*x + 0.013 0.9934 Tannic acid 0.0045*x - 0.0038 0.9721 Potassium hydrogen phthalate 0.1167*x - 0.0685 0.9848 Calcium acetate 0.1224*x - 0.023 0.9995
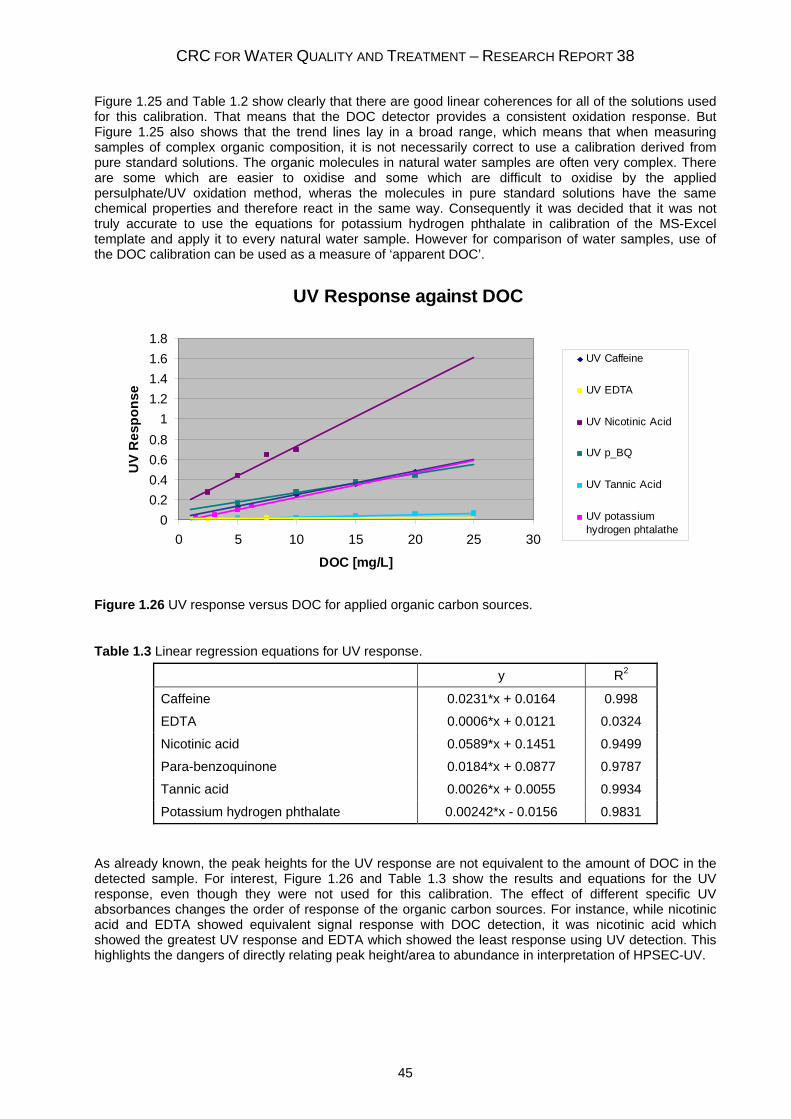
CRC FOR WATER QUALITY AND TREATMENT – RESEARCH REPORT 38
45
Figure 1.25 and Table 1.2 show clearly that there are good linear coherences for all of the solutions used for this calibration. That means that the DOC detector provides a consistent oxidation response. But Figure 1.25 also shows that the trend lines lay in a broad range, which means that when measuring samples of complex organic composition, it is not necessarily correct to use a calibration derived from pure standard solutions. The organic molecules in natural water samples are often very complex. There are some which are easier to oxidise and some which are difficult to oxidise by the applied persulphate/UV oxidation method, wheras the molecules in pure standard solutions have the same chemical properties and therefore react in the same way. Consequently it was decided that it was not truly accurate to use the equations for potassium hydrogen phthalate in calibration of the MS-Excel template and apply it to every natural water sample. However for comparison of water samples, use of the DOC calibration can be used as a measure of ‘apparent DOC’.
UV Response against DOC
00.20.40.60.8
11.21.41.61.8
0 5 10 15 20 25 30
DOC [mg/L]
UV
Res
pons
e
UV Caffeine
UV EDTA
UV Nicotinic Acid
UV p_BQ
UV Tannic Acid
UV potassiumhydrogen phtalathe
Figure 1.26 UV response versus DOC for applied organic carbon sources.
Table 1.3 Linear regression equations for UV response.
y R2
Caffeine 0.0231*x + 0.0164 0.998
EDTA 0.0006*x + 0.0121 0.0324
Nicotinic acid 0.0589*x + 0.1451 0.9499
Para-benzoquinone 0.0184*x + 0.0877 0.9787
Tannic acid 0.0026*x + 0.0055 0.9934
Potassium hydrogen phthalate 0.00242*x - 0.0156 0.9831
As already known, the peak heights for the UV response are not equivalent to the amount of DOC in the detected sample. For interest, Figure 1.26 and Table 1.3 show the results and equations for the UV response, even though they were not used for this calibration. The effect of different specific UV absorbances changes the order of response of the organic carbon sources. For instance, while nicotinic acid and EDTA showed equivalent signal response with DOC detection, it was nicotinic acid which showed the greatest UV response and EDTA which showed the least response using UV detection. This highlights the dangers of directly relating peak height/area to abundance in interpretation of HPSEC-UV.
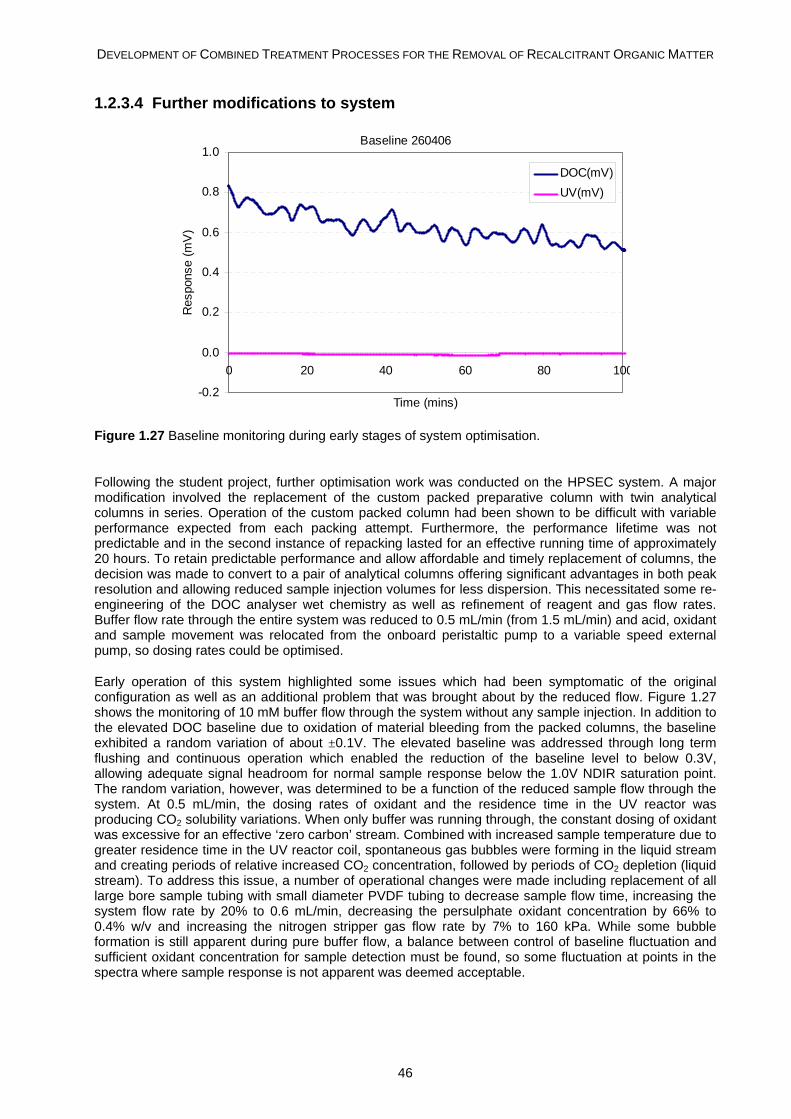
DEVELOPMENT OF COMBINED TREATMENT PROCESSES FOR THE REMOVAL OF RECALCITRANT ORGANIC MATTER
46
1.2.3.4 Further modifications to system
Baseline 260406
-0.2
0.0
0.2
0.4
0.6
0.8
1.0
0 20 40 60 80 100
Time (mins)
Res
pons
e (m
V)
DOC(mV)UV(mV)
Figure 1.27 Baseline monitoring during early stages of system optimisation.
Following the student project, further optimisation work was conducted on the HPSEC system. A major modification involved the replacement of the custom packed preparative column with twin analytical columns in series. Operation of the custom packed column had been shown to be difficult with variable performance expected from each packing attempt. Furthermore, the performance lifetime was not predictable and in the second instance of repacking lasted for an effective running time of approximately 20 hours. To retain predictable performance and allow affordable and timely replacement of columns, the decision was made to convert to a pair of analytical columns offering significant advantages in both peak resolution and allowing reduced sample injection volumes for less dispersion. This necessitated some re-engineering of the DOC analyser wet chemistry as well as refinement of reagent and gas flow rates. Buffer flow rate through the entire system was reduced to 0.5 mL/min (from 1.5 mL/min) and acid, oxidant and sample movement was relocated from the onboard peristaltic pump to a variable speed external pump, so dosing rates could be optimised.
Early operation of this system highlighted some issues which had been symptomatic of the original configuration as well as an additional problem that was brought about by the reduced flow. Figure 1.27 shows the monitoring of 10 mM buffer flow through the system without any sample injection. In addition to the elevated DOC baseline due to oxidation of material bleeding from the packed columns, the baseline exhibited a random variation of about ±0.1V. The elevated baseline was addressed through long term flushing and continuous operation which enabled the reduction of the baseline level to below 0.3V, allowing adequate signal headroom for normal sample response below the 1.0V NDIR saturation point. The random variation, however, was determined to be a function of the reduced sample flow through the system. At 0.5 mL/min, the dosing rates of oxidant and the residence time in the UV reactor was producing CO2 solubility variations. When only buffer was running through, the constant dosing of oxidant was excessive for an effective ‘zero carbon’ stream. Combined with increased sample temperature due to greater residence time in the UV reactor coil, spontaneous gas bubbles were forming in the liquid stream and creating periods of relative increased CO2 concentration, followed by periods of CO2 depletion (liquid stream). To address this issue, a number of operational changes were made including replacement of all large bore sample tubing with small diameter PVDF tubing to decrease sample flow time, increasing the system flow rate by 20% to 0.6 mL/min, decreasing the persulphate oxidant concentration by 66% to 0.4% w/v and increasing the nitrogen stripper gas flow rate by 7% to 160 kPa. While some bubble formation is still apparent during pure buffer flow, a balance between control of baseline fluctuation and sufficient oxidant concentration for sample detection must be found, so some fluctuation at points in the spectra where sample response is not apparent was deemed acceptable.
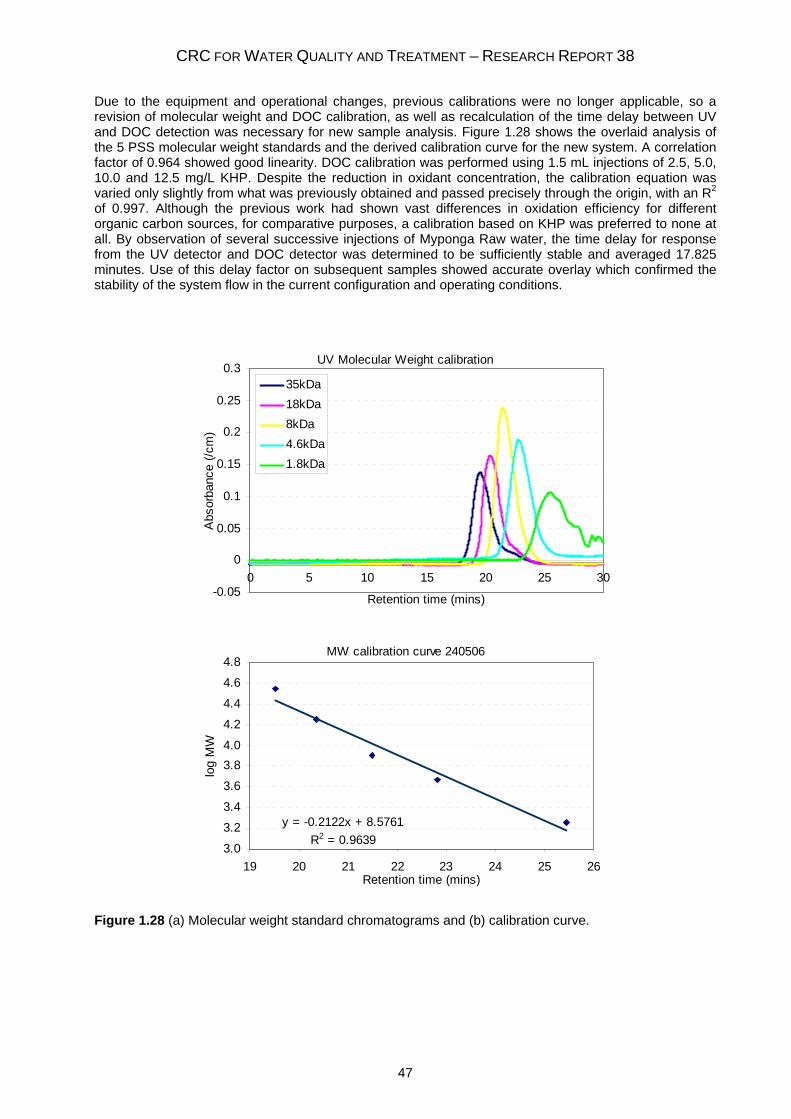
CRC FOR WATER QUALITY AND TREATMENT – RESEARCH REPORT 38
47
Due to the equipment and operational changes, previous calibrations were no longer applicable, so a revision of molecular weight and DOC calibration, as well as recalculation of the time delay between UV and DOC detection was necessary for new sample analysis. Figure 1.28 shows the overlaid analysis of the 5 PSS molecular weight standards and the derived calibration curve for the new system. A correlation factor of 0.964 showed good linearity. DOC calibration was performed using 1.5 mL injections of 2.5, 5.0, 10.0 and 12.5 mg/L KHP. Despite the reduction in oxidant concentration, the calibration equation was varied only slightly from what was previously obtained and passed precisely through the origin, with an R2 of 0.997. Although the previous work had shown vast differences in oxidation efficiency for different organic carbon sources, for comparative purposes, a calibration based on KHP was preferred to none at all. By observation of several successive injections of Myponga Raw water, the time delay for response from the UV detector and DOC detector was determined to be sufficiently stable and averaged 17.825 minutes. Use of this delay factor on subsequent samples showed accurate overlay which confirmed the stability of the system flow in the current configuration and operating conditions.
UV Molecular Weight calibration
-0.05
0
0.05
0.1
0.15
0.2
0.25
0.3
0 5 10 15 20 25 30
Retention time (mins)
Abs
orba
nce
(/cm
)
35kDa18kDa8kDa4.6kDa1.8kDa
MW calibration curve 240506
y = -0.2122x + 8.5761R2 = 0.9639
3.0
3.2
3.4
3.6
3.84.0
4.2
4.4
4.6
4.8
19 20 21 22 23 24 25 26Retention time (mins)
log
MW
Figure 1.28 (a) Molecular weight standard chromatograms and (b) calibration curve.
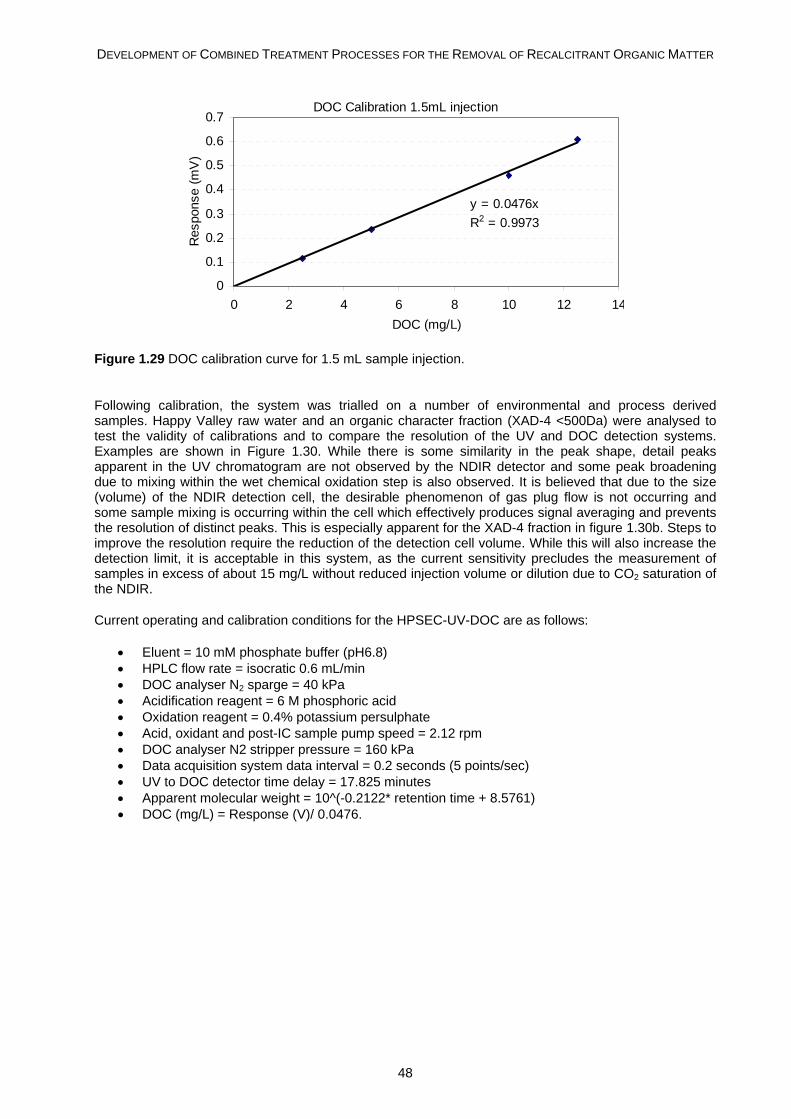
DEVELOPMENT OF COMBINED TREATMENT PROCESSES FOR THE REMOVAL OF RECALCITRANT ORGANIC MATTER
48
DOC Calibration 1.5mL injection
y = 0.0476xR2 = 0.9973
0
0.1
0.2
0.3
0.4
0.5
0.6
0.7
0 2 4 6 8 10 12 14DOC (mg/L)
Res
pons
e (m
V)
Figure 1.29 DOC calibration curve for 1.5 mL sample injection.
Following calibration, the system was trialled on a number of environmental and process derived samples. Happy Valley raw water and an organic character fraction (XAD-4 <500Da) were analysed to test the validity of calibrations and to compare the resolution of the UV and DOC detection systems. Examples are shown in Figure 1.30. While there is some similarity in the peak shape, detail peaks apparent in the UV chromatogram are not observed by the NDIR detector and some peak broadening due to mixing within the wet chemical oxidation step is also observed. It is believed that due to the size (volume) of the NDIR detection cell, the desirable phenomenon of gas plug flow is not occurring and some sample mixing is occurring within the cell which effectively produces signal averaging and prevents the resolution of distinct peaks. This is especially apparent for the XAD-4 fraction in figure 1.30b. Steps to improve the resolution require the reduction of the detection cell volume. While this will also increase the detection limit, it is acceptable in this system, as the current sensitivity precludes the measurement of samples in excess of about 15 mg/L without reduced injection volume or dilution due to CO2 saturation of the NDIR.
Current operating and calibration conditions for the HPSEC-UV-DOC are as follows:
• Eluent = 10 mM phosphate buffer (pH6.8) • HPLC flow rate = isocratic 0.6 mL/min • DOC analyser N2 sparge = 40 kPa • Acidification reagent = 6 M phosphoric acid • Oxidation reagent = 0.4% potassium persulphate • Acid, oxidant and post-IC sample pump speed = 2.12 rpm • DOC analyser N2 stripper pressure = 160 kPa • Data acquisition system data interval = 0.2 seconds (5 points/sec) • UV to DOC detector time delay = 17.825 minutes • Apparent molecular weight = 10^(-0.2122* retention time + 8.5761) • DOC (mg/L) = Response (V)/ 0.0476.
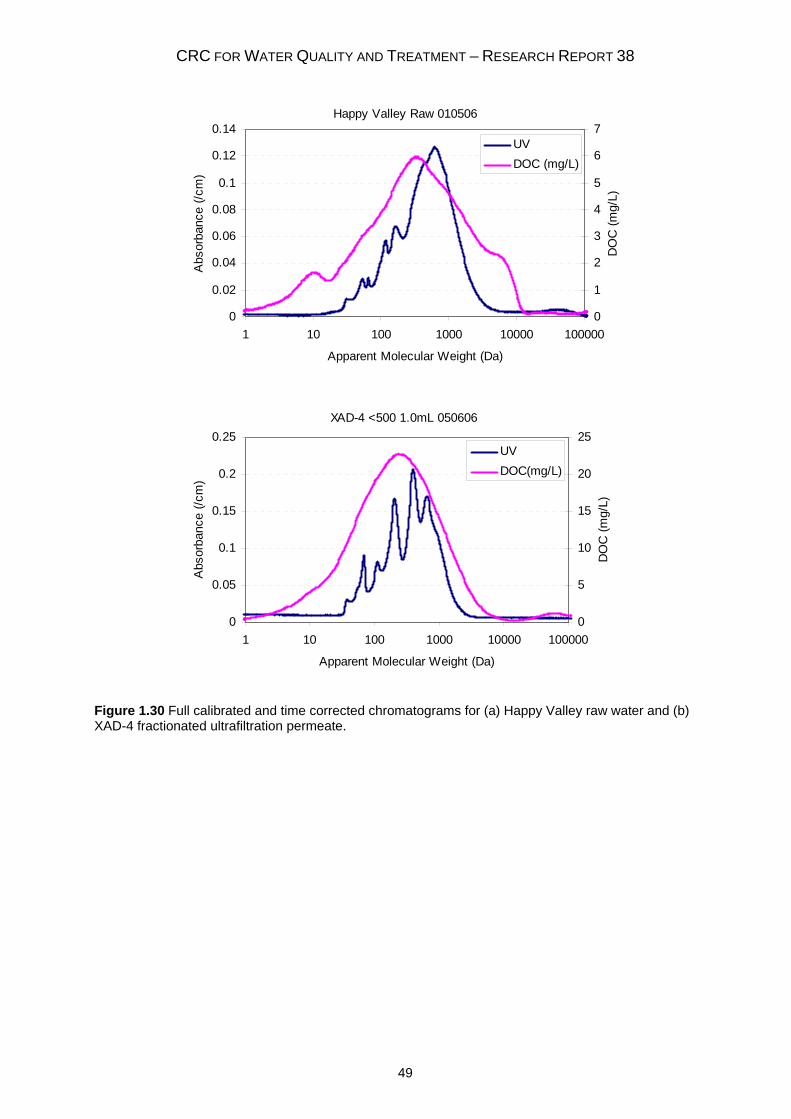
CRC FOR WATER QUALITY AND TREATMENT – RESEARCH REPORT 38
49
Happy Valley Raw 010506
0
0.02
0.04
0.06
0.08
0.1
0.12
0.14
1 10 100 1000 10000 100000
Apparent Molecular Weight (Da)
Abs
orba
nce
(/cm
)
0
1
2
3
4
5
6
7
DO
C (m
g/L)
UVDOC (mg/L)
XAD-4 <500 1.0mL 050606
0
0.05
0.1
0.15
0.2
0.25
1 10 100 1000 10000 100000
Apparent Molecular Weight (Da)
Abs
orba
nce
(/cm
)
0
5
10
15
20
25
DO
C (m
g/L)
UVDOC(mg/L)
Figure 1.30 Full calibrated and time corrected chromatograms for (a) Happy Valley raw water and (b) XAD-4 fractionated ultrafiltration permeate.
DEVELOPMENT OF COMBINED TREATMENT PROCESSES FOR THE REMOVAL OF RECALCITRANT ORGANIC MATTER
50
1.2.3.5 Conclusions
A HPSEC-UV-DOC system developed in a related CRC project (2.3.1.1) was calibrated in several system responses such as NDIR mV to mg/L DOC, retention time to apparent molecular weight and time delay between UV detection and DOC detection. In addition, the oxidation efficiency of the DOC detector was evaluated using pure organic carbon sources of varied ease of oxidation. Results indicated that the NDIR response was very stable and calibration with DOC standards showed linear response (R2=0.9934) with interpolation passing through the origin. Calibration of the time delay between the UV and DOC detector responses proved to be problematic with the applied instrument protocols producing variability in flow conditions even within the course of an experimental set. For the purposes of producing overlaid chromatograms for comparative evaluation, the time delay was calculated on a daily basis using a standard injection of a KHP total carbon solution. The aim of producing results for an environmental sample that was calibrated for responses in all axes was accomplished, although issues with the optimisation of the running conditions created problems of elevated DOC baseline and resolution that could not be resolved as part of this investigation. Evaluation of the oxidation efficiency of the DOC detector identified that significant variability in response for organic carbon sources undermined the use of DOC detection as a purely quantitative technique. It was shown that variations in oxidation efficiency were different, but just as selective as specific UV absorbance effects on UV detection.
Refinement of the system hardware necessitated re-optimisation of the system operating conditions and calibration of system responses. While this was accomplished, the limitations of the NDIR detector in terms of peak resolution limited the applicability of this technique for evaluation of water treatment processes in drinking water sources. Further work is required to develop this HPSEC-UV-DOC analyser into a powerful tool for simultaneous qualitative and quantitative analysis of NOM.
CRC FOR WATER QUALITY AND TREATMENT – RESEARCH REPORT 38
51
1.3 Bacterial Regrowth Potential
1.3.1 Introduction
The regrowth of bacterial populations in drinking water distribution systems has been recognised as a potential water quality problem. If pathogenic bacteria grow in biofilms, they show increased resistance to disinfectant residual than free bacteria in the bulk water (Hem et al., 2001) and may create potential health risks. Therefore, reduction of biofilm formation is desired. This can be achieved by two main processes, maintenance of disinfectant residual throughout the distribution system and also reduction of assimilable organic carbon (AOC) during treatment. AOC generally consists of a broad range of low molecular weight molecules including saccharides, amino acids and organic acids and supports the growth of biofilms. It represents only a small portion of the total organic carbon (0.1-9%) but is critical to controlling the growth of heterotrophic organisms (Hammes and Egli, 2005).
When examining treatment processes for their effect on AOC concentration, reduction of bulk DOC has been shown not to relate directly to AOC removal. Coagulation can be efficient for removal of DOC and biodegradable dissolved organic carbon (BDOC), however AOC is usually poorly removed by coagulation as it consists of small non-humic substances that are recalcitrant to coagulation. Coagulation, flocculation and sedimentation have been shown to give high reductions in AOC but only with enhanced coagulant doses in selected water sources (Noble et al., 1996, Volk and Le Chevallier, 2002). Pre-oxidation such as chlorination and ozonation will increase AOC through the breakdown of larger organic molecules into smaller more bio-assimilable compounds. Reduction of AOC through treatment is usually accomplished through either biological activity, such as within biologically active sand or GAC filters, or by adsorption into a porous media such as activated carbon. Van der Kooij (1982) has suggested that water is considered biologically stable if the AOC concentration is less than 10 μg/L in a non-chlorinated supply. LeChevallier et al. (1991) suggested that the regrowth of coliform bacteria in chlorinated water may be limited by AOC levels of less than 50 to 100 μg/L. Achievement of these targets may necessitate very high levels of treatment.
AOC measurements are typically based upon measurement of biomass growth using either traditional plate counting techniques or activity using adenosine triphosphate (ATP) determination. The method of van der Kooij (1982) uses two standard cultures, namely Pseudomonas fluorescens P17 and Spirillum NOX, known to assimilate a wide range of organic compounds. While this allows good correlation between samples tested on different occasions and varied locations, it is not necessarily representative of the actual biological activity within the distribution system. For this reason, it can be more informative to assess the AOC using the natural flora within the water source. From a water quality management perspective, this can give more accurate determinations of the biological stability of the plant product water. A variation on this concept is the bacterial regrowth potential (BRP) test which uses turbidity measurement to determine the amount of biogrowth in a water sample (Link et al., 1992). The German research (Hambsch et al., 1992) has classified water with a growth factor of less than 5 as biologically stable. The method adapted at the Australian Water Quality Centre combines the BRP technique with the application of natural biota obtained from the analysed water source and has been calibrated and refined extensively since commissioning. This work has equated biologically stable waters with growth factors less than 5 as an acetate carbon equivalent below 40 ug/L. During this time, several issues have emerged with interpretation of results and the effects that different processes have on the resulting BRP.
This work stemmed from the observed differences between plant treated BRP and replicated laboratory treatments and a desire to understand the phenomena at work. BRP is very sensitive to water quality changes and will therefore vary considerably with seasonal variation of a water source and any changes in treatment performance or strategy. The presented work will attempt to provide an indication of potential pitfalls in interpretation of BRP results and examples of tests highlighting the difficulty of using any measure of AOC as absolute results rather than indications of behavioural trends.
1.3.2 Methods
1.3.2.1 BRP analysis
The method involves the inoculation of a mixed biocenosis into a sterile filtered sample and the monitoring of the bacterial growth over an extended period of time. The addition of nutrients to each sample ensures that the only limiting factor for bacterial growth is carbon. The increase of biomass is
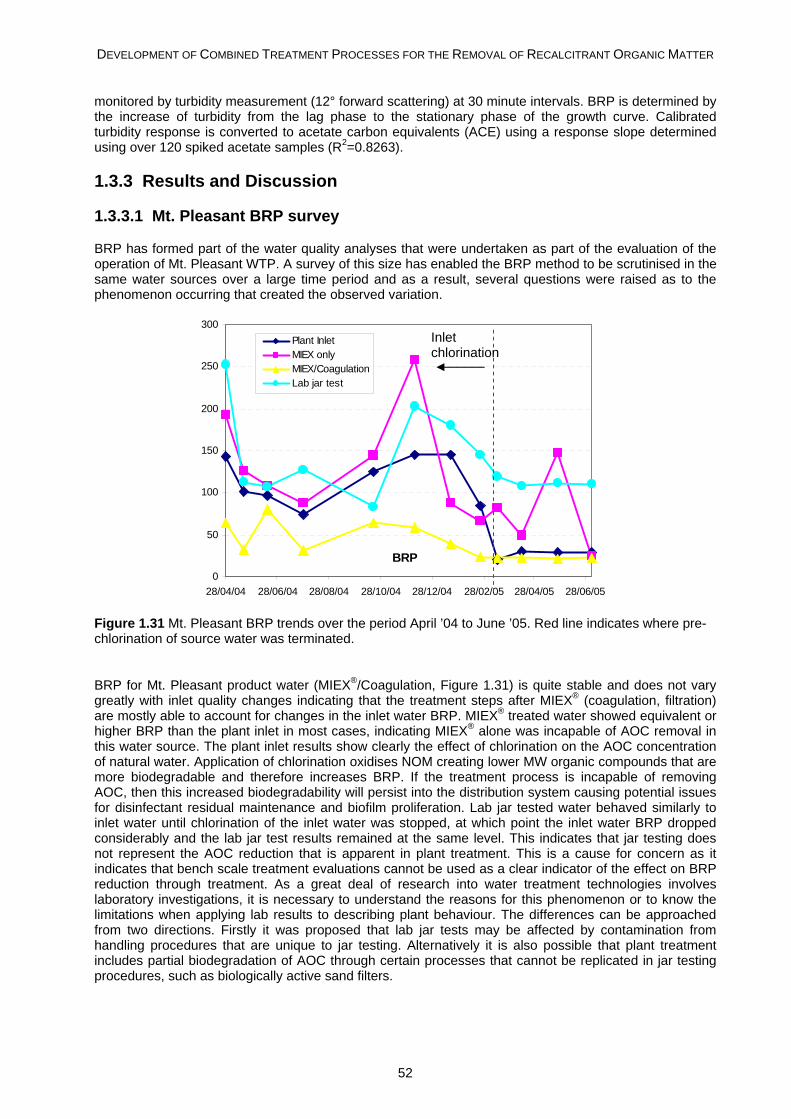
DEVELOPMENT OF COMBINED TREATMENT PROCESSES FOR THE REMOVAL OF RECALCITRANT ORGANIC MATTER
52
monitored by turbidity measurement (12° forward scattering) at 30 minute intervals. BRP is determined by the increase of turbidity from the lag phase to the stationary phase of the growth curve. Calibrated turbidity response is converted to acetate carbon equivalents (ACE) using a response slope determined using over 120 spiked acetate samples (R2=0.8263).
1.3.3 Results and Discussion
1.3.3.1 Mt. Pleasant BRP survey
BRP has formed part of the water quality analyses that were undertaken as part of the evaluation of the operation of Mt. Pleasant WTP. A survey of this size has enabled the BRP method to be scrutinised in the same water sources over a large time period and as a result, several questions were raised as to the phenomenon occurring that created the observed variation.
BRP0
50
100
150
200
250
300
28/04/04 28/06/04 28/08/04 28/10/04 28/12/04 28/02/05 28/04/05 28/06/05
Plant InletMIEX onlyMIEX/CoagulationLab jar test
Figure 1.31 Mt. Pleasant BRP trends over the period April ’04 to June ’05. Red line indicates where pre-chlorination of source water was terminated.
BRP for Mt. Pleasant product water (MIEX®/Coagulation, Figure 1.31) is quite stable and does not vary greatly with inlet quality changes indicating that the treatment steps after MIEX® (coagulation, filtration) are mostly able to account for changes in the inlet water BRP. MIEX® treated water showed equivalent or higher BRP than the plant inlet in most cases, indicating MIEX® alone was incapable of AOC removal in this water source. The plant inlet results show clearly the effect of chlorination on the AOC concentration of natural water. Application of chlorination oxidises NOM creating lower MW organic compounds that are more biodegradable and therefore increases BRP. If the treatment process is incapable of removing AOC, then this increased biodegradability will persist into the distribution system causing potential issues for disinfectant residual maintenance and biofilm proliferation. Lab jar tested water behaved similarly to inlet water until chlorination of the inlet water was stopped, at which point the inlet water BRP dropped considerably and the lab jar test results remained at the same level. This indicates that jar testing does not represent the AOC reduction that is apparent in plant treatment. This is a cause for concern as it indicates that bench scale treatment evaluations cannot be used as a clear indicator of the effect on BRP reduction through treatment. As a great deal of research into water treatment technologies involves laboratory investigations, it is necessary to understand the reasons for this phenomenon or to know the limitations when applying lab results to describing plant behaviour. The differences can be approached from two directions. Firstly it was proposed that lab jar tests may be affected by contamination from handling procedures that are unique to jar testing. Alternatively it is also possible that plant treatment includes partial biodegradation of AOC through certain processes that cannot be replicated in jar testing procedures, such as biologically active sand filters.
Inlet chlorination
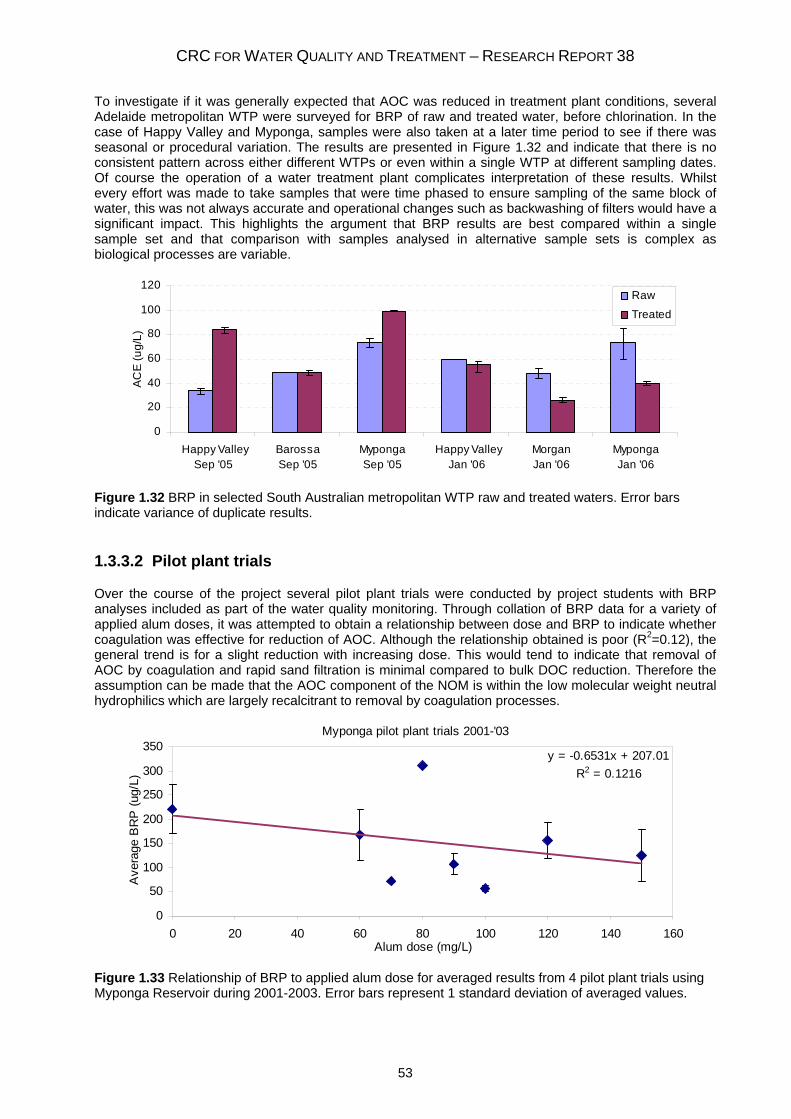
CRC FOR WATER QUALITY AND TREATMENT – RESEARCH REPORT 38
53
To investigate if it was generally expected that AOC was reduced in treatment plant conditions, several Adelaide metropolitan WTP were surveyed for BRP of raw and treated water, before chlorination. In the case of Happy Valley and Myponga, samples were also taken at a later time period to see if there was seasonal or procedural variation. The results are presented in Figure 1.32 and indicate that there is no consistent pattern across either different WTPs or even within a single WTP at different sampling dates. Of course the operation of a water treatment plant complicates interpretation of these results. Whilst every effort was made to take samples that were time phased to ensure sampling of the same block of water, this was not always accurate and operational changes such as backwashing of filters would have a significant impact. This highlights the argument that BRP results are best compared within a single sample set and that comparison with samples analysed in alternative sample sets is complex as biological processes are variable.
0
20
40
60
80
100
120
Happy Valley Sep '05
Barossa Sep '05
Myponga Sep '05
Happy Valley Jan '06
Morgan Jan '06
Myponga Jan '06
ACE
(ug/
L)
Raw
Treated
Figure 1.32 BRP in selected South Australian metropolitan WTP raw and treated waters. Error bars indicate variance of duplicate results.
1.3.3.2 Pilot plant trials
Over the course of the project several pilot plant trials were conducted by project students with BRP analyses included as part of the water quality monitoring. Through collation of BRP data for a variety of applied alum doses, it was attempted to obtain a relationship between dose and BRP to indicate whether coagulation was effective for reduction of AOC. Although the relationship obtained is poor (R2=0.12), the general trend is for a slight reduction with increasing dose. This would tend to indicate that removal of AOC by coagulation and rapid sand filtration is minimal compared to bulk DOC reduction. Therefore the assumption can be made that the AOC component of the NOM is within the low molecular weight neutral hydrophilics which are largely recalcitrant to removal by coagulation processes.
Myponga pilot plant trials 2001-'03
y = -0.6531x + 207.01R2 = 0.1216
0
50
100
150
200
250
300
350
0 20 40 60 80 100 120 140 160Alum dose (mg/L)
Ave
rage
BR
P (u
g/L)
Figure 1.33 Relationship of BRP to applied alum dose for averaged results from 4 pilot plant trials using Myponga Reservoir during 2001-2003. Error bars represent 1 standard deviation of averaged values.
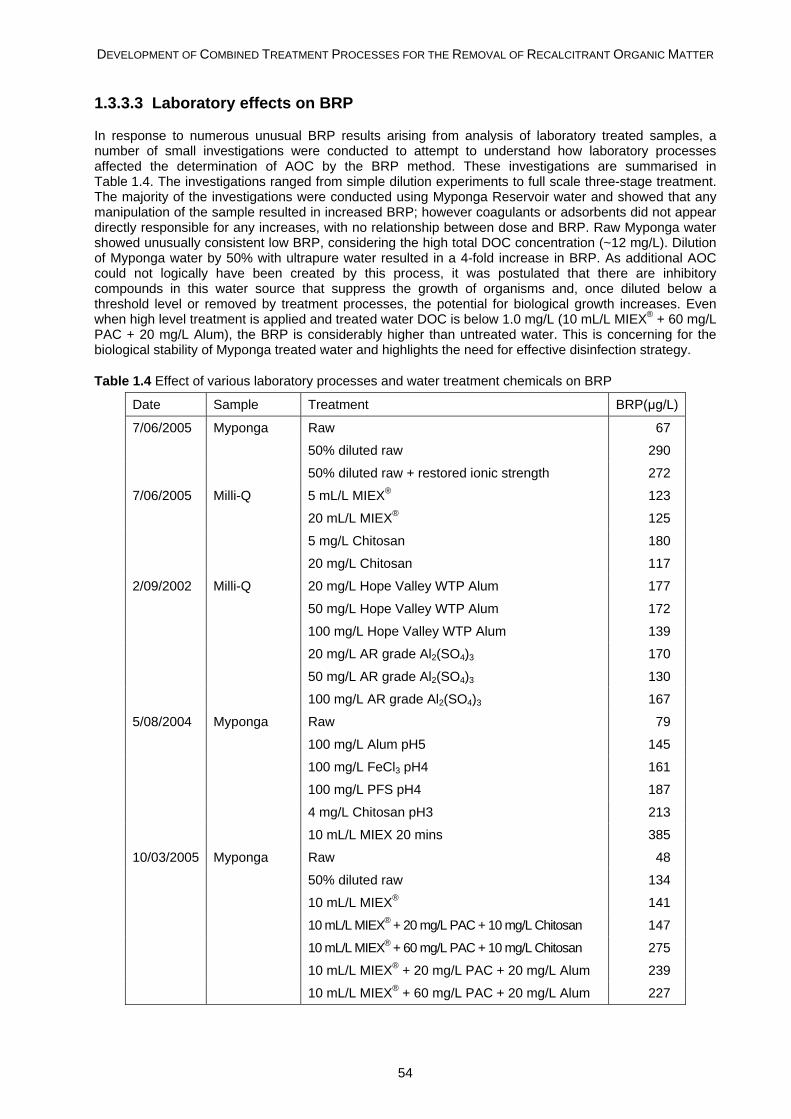
DEVELOPMENT OF COMBINED TREATMENT PROCESSES FOR THE REMOVAL OF RECALCITRANT ORGANIC MATTER
54
1.3.3.3 Laboratory effects on BRP
In response to numerous unusual BRP results arising from analysis of laboratory treated samples, a number of small investigations were conducted to attempt to understand how laboratory processes affected the determination of AOC by the BRP method. These investigations are summarised in Table 1.4. The investigations ranged from simple dilution experiments to full scale three-stage treatment. The majority of the investigations were conducted using Myponga Reservoir water and showed that any manipulation of the sample resulted in increased BRP; however coagulants or adsorbents did not appear directly responsible for any increases, with no relationship between dose and BRP. Raw Myponga water showed unusually consistent low BRP, considering the high total DOC concentration (~12 mg/L). Dilution of Myponga water by 50% with ultrapure water resulted in a 4-fold increase in BRP. As additional AOC could not logically have been created by this process, it was postulated that there are inhibitory compounds in this water source that suppress the growth of organisms and, once diluted below a threshold level or removed by treatment processes, the potential for biological growth increases. Even when high level treatment is applied and treated water DOC is below 1.0 mg/L (10 mL/L MIEX® + 60 mg/L PAC + 20 mg/L Alum), the BRP is considerably higher than untreated water. This is concerning for the biological stability of Myponga treated water and highlights the need for effective disinfection strategy.
Table 1.4 Effect of various laboratory processes and water treatment chemicals on BRP
Date Sample Treatment BRP(μg/L)
7/06/2005 Myponga Raw 67
50% diluted raw 290
50% diluted raw + restored ionic strength 272
7/06/2005 Milli-Q 5 mL/L MIEX® 123
20 mL/L MIEX® 125
5 mg/L Chitosan 180
20 mg/L Chitosan 117
2/09/2002 Milli-Q 20 mg/L Hope Valley WTP Alum 177
50 mg/L Hope Valley WTP Alum 172
100 mg/L Hope Valley WTP Alum 139
20 mg/L AR grade Al2(SO4)3 170
50 mg/L AR grade Al2(SO4)3 130
100 mg/L AR grade Al2(SO4)3 167
5/08/2004 Myponga Raw 79
100 mg/L Alum pH5 145
100 mg/L FeCl3 pH4 161
100 mg/L PFS pH4 187
4 mg/L Chitosan pH3 213
10 mL/L MIEX 20 mins 385
10/03/2005 Myponga Raw 48
50% diluted raw 134
10 mL/L MIEX® 141
10 mL/L MIEX® + 20 mg/L PAC + 10 mg/L Chitosan 147
10 mL/L MIEX® + 60 mg/L PAC + 10 mg/L Chitosan 275
10 mL/L MIEX® + 20 mg/L PAC + 20 mg/L Alum 239
10 mL/L MIEX® + 60 mg/L PAC + 20 mg/L Alum 227
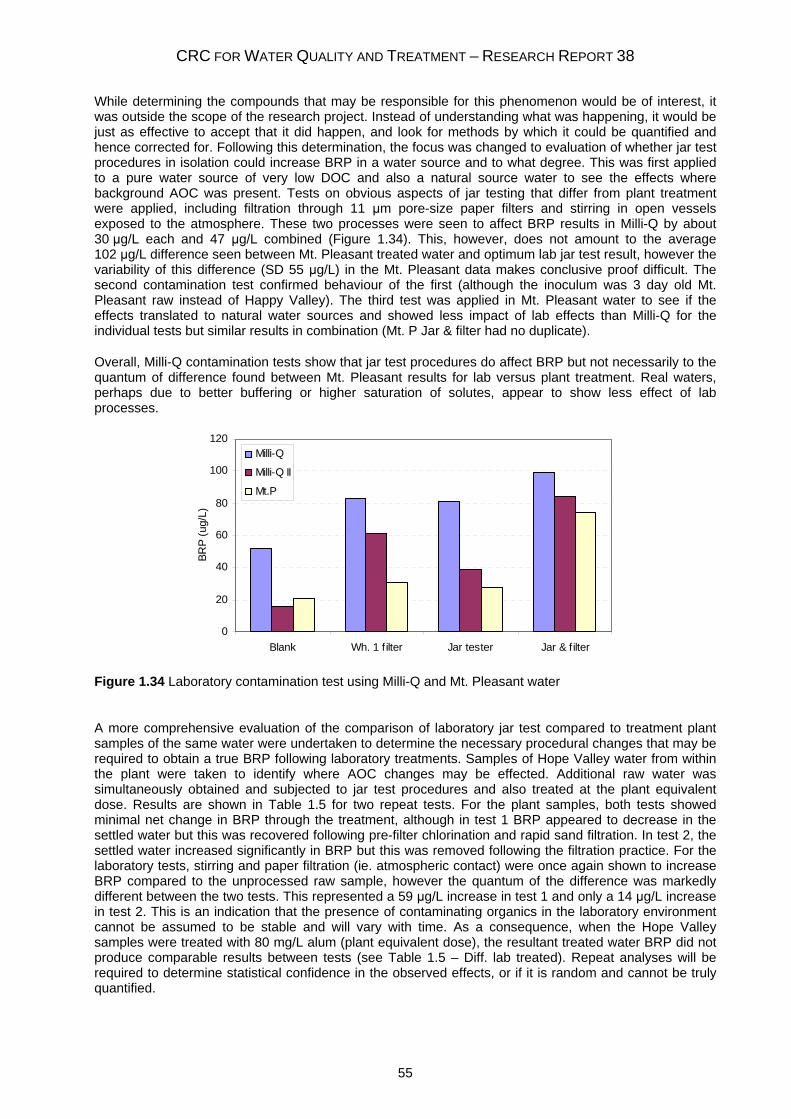
CRC FOR WATER QUALITY AND TREATMENT – RESEARCH REPORT 38
55
While determining the compounds that may be responsible for this phenomenon would be of interest, it was outside the scope of the research project. Instead of understanding what was happening, it would be just as effective to accept that it did happen, and look for methods by which it could be quantified and hence corrected for. Following this determination, the focus was changed to evaluation of whether jar test procedures in isolation could increase BRP in a water source and to what degree. This was first applied to a pure water source of very low DOC and also a natural source water to see the effects where background AOC was present. Tests on obvious aspects of jar testing that differ from plant treatment were applied, including filtration through 11 μm pore-size paper filters and stirring in open vessels exposed to the atmosphere. These two processes were seen to affect BRP results in Milli-Q by about 30 μg/L each and 47 μg/L combined (Figure 1.34). This, however, does not amount to the average 102 μg/L difference seen between Mt. Pleasant treated water and optimum lab jar test result, however the variability of this difference (SD 55 μg/L) in the Mt. Pleasant data makes conclusive proof difficult. The second contamination test confirmed behaviour of the first (although the inoculum was 3 day old Mt. Pleasant raw instead of Happy Valley). The third test was applied in Mt. Pleasant water to see if the effects translated to natural water sources and showed less impact of lab effects than Milli-Q for the individual tests but similar results in combination (Mt. P Jar & filter had no duplicate).
Overall, Milli-Q contamination tests show that jar test procedures do affect BRP but not necessarily to the quantum of difference found between Mt. Pleasant results for lab versus plant treatment. Real waters, perhaps due to better buffering or higher saturation of solutes, appear to show less effect of lab processes.
0
20
40
60
80
100
120
Blank Wh. 1 f ilter Jar tester Jar & f ilter
BRP
(ug/
L)
Milli-Q
Milli-Q II
Mt.P
Figure 1.34 Laboratory contamination test using Milli-Q and Mt. Pleasant water
A more comprehensive evaluation of the comparison of laboratory jar test compared to treatment plant samples of the same water were undertaken to determine the necessary procedural changes that may be required to obtain a true BRP following laboratory treatments. Samples of Hope Valley water from within the plant were taken to identify where AOC changes may be effected. Additional raw water was simultaneously obtained and subjected to jar test procedures and also treated at the plant equivalent dose. Results are shown in Table 1.5 for two repeat tests. For the plant samples, both tests showed minimal net change in BRP through the treatment, although in test 1 BRP appeared to decrease in the settled water but this was recovered following pre-filter chlorination and rapid sand filtration. In test 2, the settled water increased significantly in BRP but this was removed following the filtration practice. For the laboratory tests, stirring and paper filtration (ie. atmospheric contact) were once again shown to increase BRP compared to the unprocessed raw sample, however the quantum of the difference was markedly different between the two tests. This represented a 59 μg/L increase in test 1 and only a 14 μg/L increase in test 2. This is an indication that the presence of contaminating organics in the laboratory environment cannot be assumed to be stable and will vary with time. As a consequence, when the Hope Valley samples were treated with 80 mg/L alum (plant equivalent dose), the resultant treated water BRP did not produce comparable results between tests (see Table 1.5 – Diff. lab treated). Repeat analyses will be required to determine statistical confidence in the observed effects, or if it is random and cannot be truly quantified.
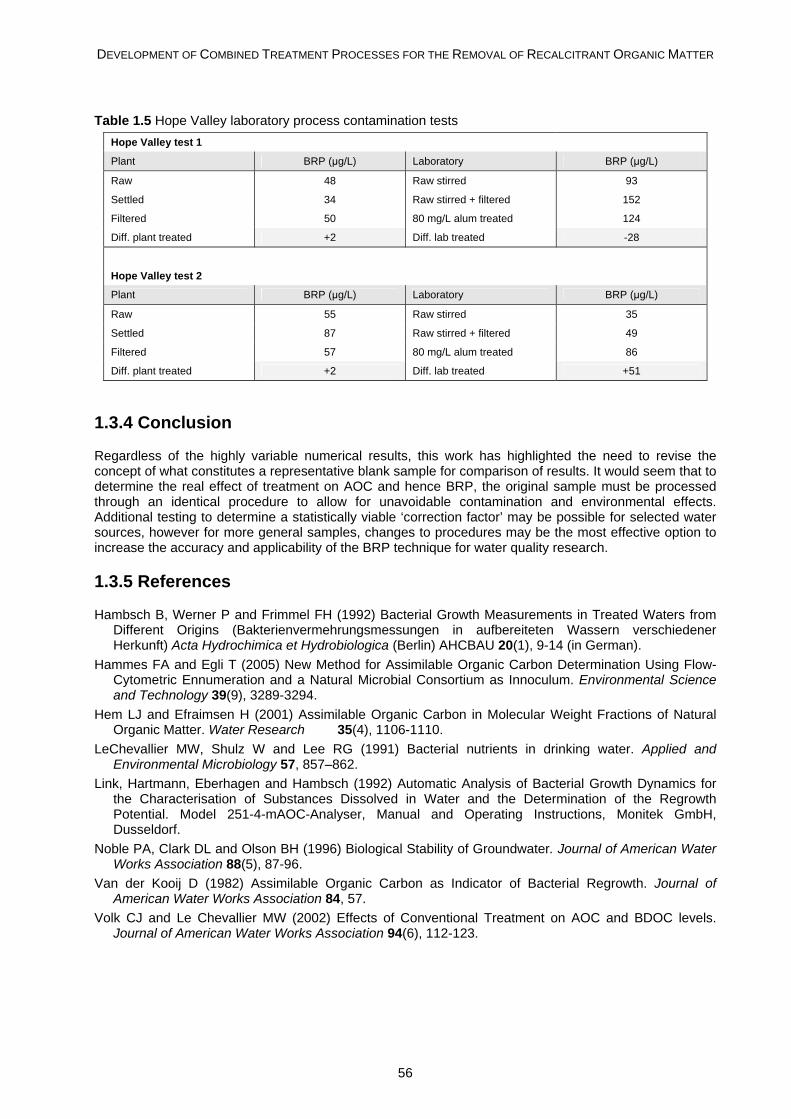
DEVELOPMENT OF COMBINED TREATMENT PROCESSES FOR THE REMOVAL OF RECALCITRANT ORGANIC MATTER
56
Table 1.5 Hope Valley laboratory process contamination tests
Hope Valley test 1
Plant BRP (μg/L) Laboratory BRP (μg/L)
Raw 48 Raw stirred 93
Settled 34 Raw stirred + filtered 152
Filtered 50 80 mg/L alum treated 124
Diff. plant treated +2 Diff. lab treated -28
Hope Valley test 2
Plant BRP (μg/L) Laboratory BRP (μg/L)
Raw 55 Raw stirred 35
Settled 87 Raw stirred + filtered 49
Filtered 57 80 mg/L alum treated 86
Diff. plant treated +2 Diff. lab treated +51
1.3.4 Conclusion
Regardless of the highly variable numerical results, this work has highlighted the need to revise the concept of what constitutes a representative blank sample for comparison of results. It would seem that to determine the real effect of treatment on AOC and hence BRP, the original sample must be processed through an identical procedure to allow for unavoidable contamination and environmental effects. Additional testing to determine a statistically viable ‘correction factor’ may be possible for selected water sources, however for more general samples, changes to procedures may be the most effective option to increase the accuracy and applicability of the BRP technique for water quality research.
1.3.5 References
Hambsch B, Werner P and Frimmel FH (1992) Bacterial Growth Measurements in Treated Waters from Different Origins (Bakterienvermehrungsmessungen in aufbereiteten Wassern verschiedener Herkunft) Acta Hydrochimica et Hydrobiologica (Berlin) AHCBAU 20(1), 9-14 (in German).
Hammes FA and Egli T (2005) New Method for Assimilable Organic Carbon Determination Using Flow-Cytometric Ennumeration and a Natural Microbial Consortium as Innoculum. Environmental Science and Technology 39(9), 3289-3294.
Hem LJ and Efraimsen H (2001) Assimilable Organic Carbon in Molecular Weight Fractions of Natural Organic Matter. Water Research 35(4), 1106-1110.
LeChevallier MW, Shulz W and Lee RG (1991) Bacterial nutrients in drinking water. Applied and Environmental Microbiology 57, 857–862.
Link, Hartmann, Eberhagen and Hambsch (1992) Automatic Analysis of Bacterial Growth Dynamics for the Characterisation of Substances Dissolved in Water and the Determination of the Regrowth Potential. Model 251-4-mAOC-Analyser, Manual and Operating Instructions, Monitek GmbH, Dusseldorf.
Noble PA, Clark DL and Olson BH (1996) Biological Stability of Groundwater. Journal of American Water Works Association 88(5), 87-96.
Van der Kooij D (1982) Assimilable Organic Carbon as Indicator of Bacterial Regrowth. Journal of American Water Works Association 84, 57.
Volk CJ and Le Chevallier MW (2002) Effects of Conventional Treatment on AOC and BDOC levels. Journal of American Water Works Association 94(6), 112-123.
CRC FOR WATER QUALITY AND TREATMENT – RESEARCH REPORT 38
57
1.4 Australian / Norwegian Water Quality Survey
1.4.1 Introduction
The significance of this work is in demonstration of the value of the various water quality and NOM characterisation techniques applied and developed through the project. No laboratory treatment was applied to the described waters that were evaluated. Analyses were performed on water treatment plant inlet and product waters with interpretations made to assess the effectiveness of the treatment process and the effect on the character of the organic material.
The efficiency of a water treatment process for drinking purposes is usually associated with physical water quality parameters such as colour and turbidity. However, it has become widely accepted that the treatability of water is primarily influenced by the natural organic matter (NOM) present in water and changes in its character. The relevance of NOM to water treatment operators is significant. Some components can cause colouration of the water; it can include compounds that cause unpleasant taste and odours and it can act as a substrate for microbial growth. NOM that is not removed by the treatment process can, upon subsequent disinfection, react to form by-products such as trihalomethanes (THMs). Disinfection by-products (DBPs) can be of health concern and their minimisation in water can be achieved by maximising the efficiency of the treatment process for removal of their precursors (Kavanaugh, 1978).
Traditionally, the treatment of water for potable use has been accomplished by the use of conventional coagulation/flocculation using inorganic coagulants. As a result of the great impact of NOM on water quality and supply, optimisation of water treatment processes for NOM removal (i.e. enhanced coagulation using elevated coagulant doses and strict pH control) has been more common. A shift away from chemical based treatments, on both environmental and health grounds, has been evident recently in both research and water treatment practices. The increasing usage of adsorbents such as ion-exchange resins and activated carbon as well as membrane filtration technologies is evident throughout the world as examples of this trend.
Norwegian water sources are popular as samples for NOM characterisation within the European research community due to the wide variation in dissolved organic carbon (DOC) and character, including several high DOC, high colour humic water sources. In recent times there have been significant publications focussed on high level characterisation of Norwegian water sources including the ‘NOM typing project’ published in 1999 which evaluated 9 water sources from Southern Norway (Abbt-Braun and Frimmel, 1999, Alberts and Takács, 1999, Gjessing et al., 1999, Lead et al., 1999, Ratnaweera et al., 1999, and Wagoner and Christman, 1999) in addition to several individual investigations (Vik et al., 1985, Gjessing et al., 1998, Eikebrokk, 1999, Hongve et al., 1999 and Eikebrokk et al., 2004). However, comparison of Norwegian drinking water sources with drinking water sources outside Europe or in the Southern hemisphere is not common.
The aim of this investigation was to compare Australian and Norwegian drinking water sources with regard to NOM character, treatability and DBP formation which may lead to better understanding of the impact of source water on water treatment.
1.4.2 Materials and Methods
1.4.2.1 Norwegian Source Waters
Skullerud water treatment plant (WTP) sources water from Lake Elvåga, a natural lake 10 km east of Oslo with a forested catchment. Stjørdal WTP is located in central Norway (32 km east of Trondheim), serving a population of around 14,000 and is supplied by Lake Lauvvatnet. Meråker WTP is a small treatment plant and serves around 1500 people. Water is sourced from Lake Litlatjønna, a natural lake approximately 73 km east of Trondheim in central Norway. Nord-Odal WTP is another small treatment plant sourcing water from Lake Skiren located 80km north-east of Oslo, serving 1100 people. Sør-Odal WTP sources water from Lake Gjøralsjøen, a natural 0.4 km2 lake within a forested catchment, 73 km north-east of Oslo. All Norwegian source waters are classified as low turbidity, humic waters.
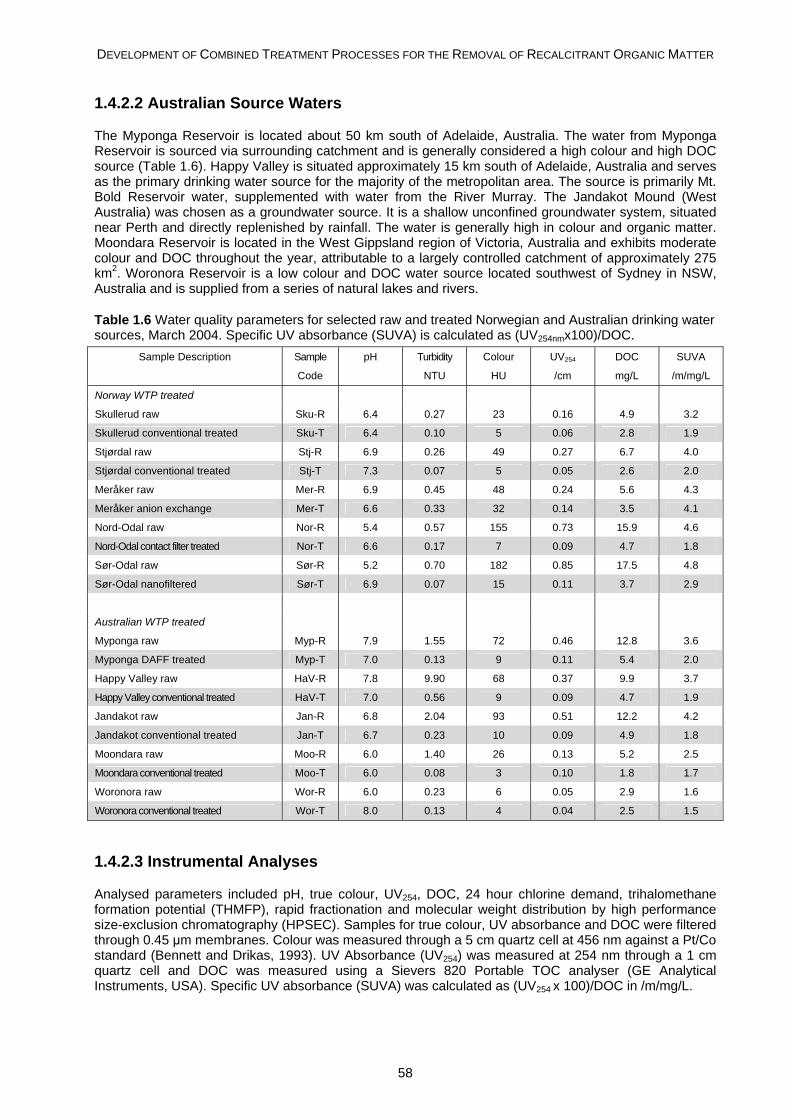
DEVELOPMENT OF COMBINED TREATMENT PROCESSES FOR THE REMOVAL OF RECALCITRANT ORGANIC MATTER
58
1.4.2.2 Australian Source Waters
The Myponga Reservoir is located about 50 km south of Adelaide, Australia. The water from Myponga Reservoir is sourced via surrounding catchment and is generally considered a high colour and high DOC source (Table 1.6). Happy Valley is situated approximately 15 km south of Adelaide, Australia and serves as the primary drinking water source for the majority of the metropolitan area. The source is primarily Mt. Bold Reservoir water, supplemented with water from the River Murray. The Jandakot Mound (West Australia) was chosen as a groundwater source. It is a shallow unconfined groundwater system, situated near Perth and directly replenished by rainfall. The water is generally high in colour and organic matter. Moondara Reservoir is located in the West Gippsland region of Victoria, Australia and exhibits moderate colour and DOC throughout the year, attributable to a largely controlled catchment of approximately 275 km2. Woronora Reservoir is a low colour and DOC water source located southwest of Sydney in NSW, Australia and is supplied from a series of natural lakes and rivers.
Table 1.6 Water quality parameters for selected raw and treated Norwegian and Australian drinking water sources, March 2004. Specific UV absorbance (SUVA) is calculated as (UV254nmx100)/DOC.
Sample Description Sample pH Turbidity Colour UV254 DOC SUVA
Code NTU HU /cm mg/L /m/mg/L
Norway WTP treated
Skullerud raw Sku-R 6.4 0.27 23 0.16 4.9 3.2
Skullerud conventional treated Sku-T 6.4 0.10 5 0.06 2.8 1.9
Stjørdal raw Stj-R 6.9 0.26 49 0.27 6.7 4.0
Stjørdal conventional treated Stj-T 7.3 0.07 5 0.05 2.6 2.0
Meråker raw Mer-R 6.9 0.45 48 0.24 5.6 4.3
Meråker anion exchange Mer-T 6.6 0.33 32 0.14 3.5 4.1
Nord-Odal raw Nor-R 5.4 0.57 155 0.73 15.9 4.6
Nord-Odal contact filter treated Nor-T 6.6 0.17 7 0.09 4.7 1.8
Sør-Odal raw Sør-R 5.2 0.70 182 0.85 17.5 4.8
Sør-Odal nanofiltered Sør-T 6.9 0.07 15 0.11 3.7 2.9
Australian WTP treated
Myponga raw Myp-R 7.9 1.55 72 0.46 12.8 3.6
Myponga DAFF treated Myp-T 7.0 0.13 9 0.11 5.4 2.0
Happy Valley raw HaV-R 7.8 9.90 68 0.37 9.9 3.7
Happy Valley conventional treated HaV-T 7.0 0.56 9 0.09 4.7 1.9
Jandakot raw Jan-R 6.8 2.04 93 0.51 12.2 4.2
Jandakot conventional treated Jan-T 6.7 0.23 10 0.09 4.9 1.8
Moondara raw Moo-R 6.0 1.40 26 0.13 5.2 2.5
Moondara conventional treated Moo-T 6.0 0.08 3 0.10 1.8 1.7
Woronora raw Wor-R 6.0 0.23 6 0.05 2.9 1.6
Woronora conventional treated Wor-T 8.0 0.13 4 0.04 2.5 1.5
1.4.2.3 Instrumental Analyses
Analysed parameters included pH, true colour, UV254, DOC, 24 hour chlorine demand, trihalomethane formation potential (THMFP), rapid fractionation and molecular weight distribution by high performance size-exclusion chromatography (HPSEC). Samples for true colour, UV absorbance and DOC were filtered through 0.45 μm membranes. Colour was measured through a 5 cm quartz cell at 456 nm against a Pt/Co standard (Bennett and Drikas, 1993). UV Absorbance (UV254) was measured at 254 nm through a 1 cm quartz cell and DOC was measured using a Sievers 820 Portable TOC analyser (GE Analytical Instruments, USA). Specific UV absorbance (SUVA) was calculated as (UV254 x 100)/DOC in /m/mg/L.
CRC FOR WATER QUALITY AND TREATMENT – RESEARCH REPORT 38
59
Chlorine demand was determined by addition of 20-30 mg/L Cl2 to 150 mL of sample and storage at room temperature (20°C) in the dark. Residual chlorine was titrated after 24 hours by the DPD ferrous titrimetric method (4500-Cl [F], Standard methods, 1998) and the demand calculated by the difference. THMFP was determined by addition of 20-30 mg/L Cl2 to 40 mL of pre-warmed (30°C) sample in a brown glass bottle with no headspace. Reaction was allowed for 4 hours at 30°C in a covered water bath before quenching the residual chlorine with excess ascorbic acid. THM concentrations were determined by purge and trap gas chromatography with electron capture detection.
Rapid fractionation technique separates DOC into four fractions based on character and molecular weight. Fractions produced are defined as very hydrophobic acids (VHA), slightly hydrophobic acids (SHA), charged hydrophilics (CHA) and neutral hydrophilics (NEU). VHA is predominantly composed of higher molecular weight humic acids, SHA represents fulvic acid components and the NEU fraction contains substances that do not adsorb to any of the applied resins. These are typically small molecular weight components such as polysaccharides and proteins and are often indicative of biologically derived material (Leenheer, 1981, van Leeuwen et al., 2004, Buchanan et al., 2005). Specifics of the technique and definitions have been described elsewhere (Chow et al., 2004).
HPSEC was used to derive weight and number average molecular weight (MW and MN, respectively) and hence polydispersity (ρ) a ratio of MW and MN, which is a measure of the homogeneity of the NOM in a sample. A value of 1 indicates the presence of a single homogenous compound, while greater values indicate a more dispersed, complex mixture of compounds. HPSEC was analysed using a Waters Alliance 2690 separations module and 996 photodiode array detector (PDA) at 260 nm (Waters Corporation, USA). Phosphate buffer (0.1 M) with 1.0 M NaCl was flowed through a Shodex KW802.5 packed silica column (Showa Denko, Japan) at 1.0 mL/min. Apparent molecular weight was derived by calibration with polystyrene sulphonate (PSS) molecular weight standards of 35, 18, 8 and 4.6 kDa.
1.4.3 Results and Discussion
1.4.3.1 Water Quality Observations
In this investigation, all water samples were evaluated as both the raw source waters and the product water following treatment at the respective drinking water plant. The waters chosen had undergone treatment by a variety of methods that included conventional coagulation/flocculation, macroporous anion resin adsorption (Meråker) and nanofiltration (Sør-Odal). Although the majority of treatments were coagulation based there were also several variations for floc partitioning including dissolved air flotation - filtration (DAFF) (Myponga, Stjørdal), direct filtration (Nord-Odal, Skullerud) and traditional rapid filtration (Happy Valley, Jandakot, Moondara and Woronora). Up-flow sand filters with continuous backwash were used at Nord-Odal, and down-flow 3-media filters (2 layers of different density plastic granules above sand) were used at Skullerud. The Australian plants using rapid filtration were traditional dual media filters using anthracite-sand down-flow filters with periodic backwashing with the exception of Happy Valley which utilises mono media sand filtration. These treatment methods must be taken into consideration when evaluating the treated waters using the applied analyses.
Generally it was observed that for both Norwegian and Australian water sources, treatment by conventional coagulation processes reduced DOC by 59% (±9%). An exception to this was Woronora WTP (13% reduction) which operates coagulation purely as a clarification process and is not focussed on DOC removal due to the low raw water DOC (2.9 mg/L). SUVA in the conventional WTPs reduced by an average of 1.8 (±0.6), except Woronora which clearly demonstrated lesser treatment with a reduction of SUVA of 0.1. At the time of the investigation, Skullerud WTP was underdosing due to on-going coagulation optimisation processes, which may affect the results somewhat. The alternative treatment technologies utilised by Meråker (anion exchange resin) and Sør-Odal (nanofiltration) showed varied effectiveness for removal of DOC and reduction of SUVA. The nanofiltration process at Sør-Odal WTP showed DOC removal of 78% and a SUVA reduction of 1.9, similar to the conventional WTPs. Meråker WTP achieved 38% reduction in DOC with a corresponding 0.2 unit reduction in SUVA. Although molecular weight distribution by HPSEC showed that the reduction in DOC was primarily low molecular weight organic materials, UV absorbance reduction was similar to DOC removal, hence the moderate SUVA reduction. Treatment performance at Meråker was affected by sub-optimal resin regeneration conditions and NOM exchange issues related to iron precipitation. Shortly following this study, a coagulation based process was installed at Meråker.
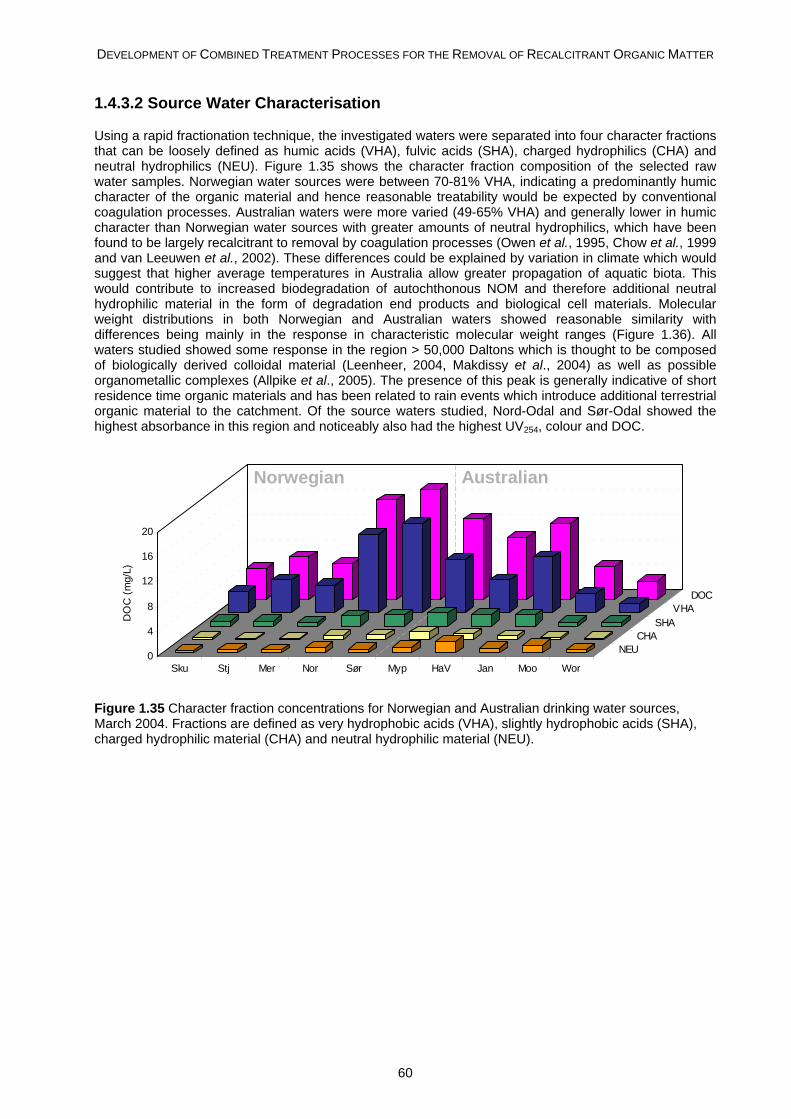
DEVELOPMENT OF COMBINED TREATMENT PROCESSES FOR THE REMOVAL OF RECALCITRANT ORGANIC MATTER
60
1.4.3.2 Source Water Characterisation
Using a rapid fractionation technique, the investigated waters were separated into four character fractions that can be loosely defined as humic acids (VHA), fulvic acids (SHA), charged hydrophilics (CHA) and neutral hydrophilics (NEU). Figure 1.35 shows the character fraction composition of the selected raw water samples. Norwegian water sources were between 70-81% VHA, indicating a predominantly humic character of the organic material and hence reasonable treatability would be expected by conventional coagulation processes. Australian waters were more varied (49-65% VHA) and generally lower in humic character than Norwegian water sources with greater amounts of neutral hydrophilics, which have been found to be largely recalcitrant to removal by coagulation processes (Owen et al., 1995, Chow et al., 1999 and van Leeuwen et al., 2002). These differences could be explained by variation in climate which would suggest that higher average temperatures in Australia allow greater propagation of aquatic biota. This would contribute to increased biodegradation of autochthonous NOM and therefore additional neutral hydrophilic material in the form of degradation end products and biological cell materials. Molecular weight distributions in both Norwegian and Australian waters showed reasonable similarity with differences being mainly in the response in characteristic molecular weight ranges (Figure 1.36). All waters studied showed some response in the region > 50,000 Daltons which is thought to be composed of biologically derived colloidal material (Leenheer, 2004, Makdissy et al., 2004) as well as possible organometallic complexes (Allpike et al., 2005). The presence of this peak is generally indicative of short residence time organic materials and has been related to rain events which introduce additional terrestrial organic material to the catchment. Of the source waters studied, Nord-Odal and Sør-Odal showed the highest absorbance in this region and noticeably also had the highest UV254, colour and DOC.
0
4
8
12
16
20
DO
C (m
g/L)
Sku Stj Mer Nor Sør Myp HaV Jan Moo Wor
NEUCHA
SHAVHA
DOC
Norwegian Australian
Figure 1.35 Character fraction concentrations for Norwegian and Australian drinking water sources, March 2004. Fractions are defined as very hydrophobic acids (VHA), slightly hydrophobic acids (SHA), charged hydrophilic material (CHA) and neutral hydrophilic material (NEU).
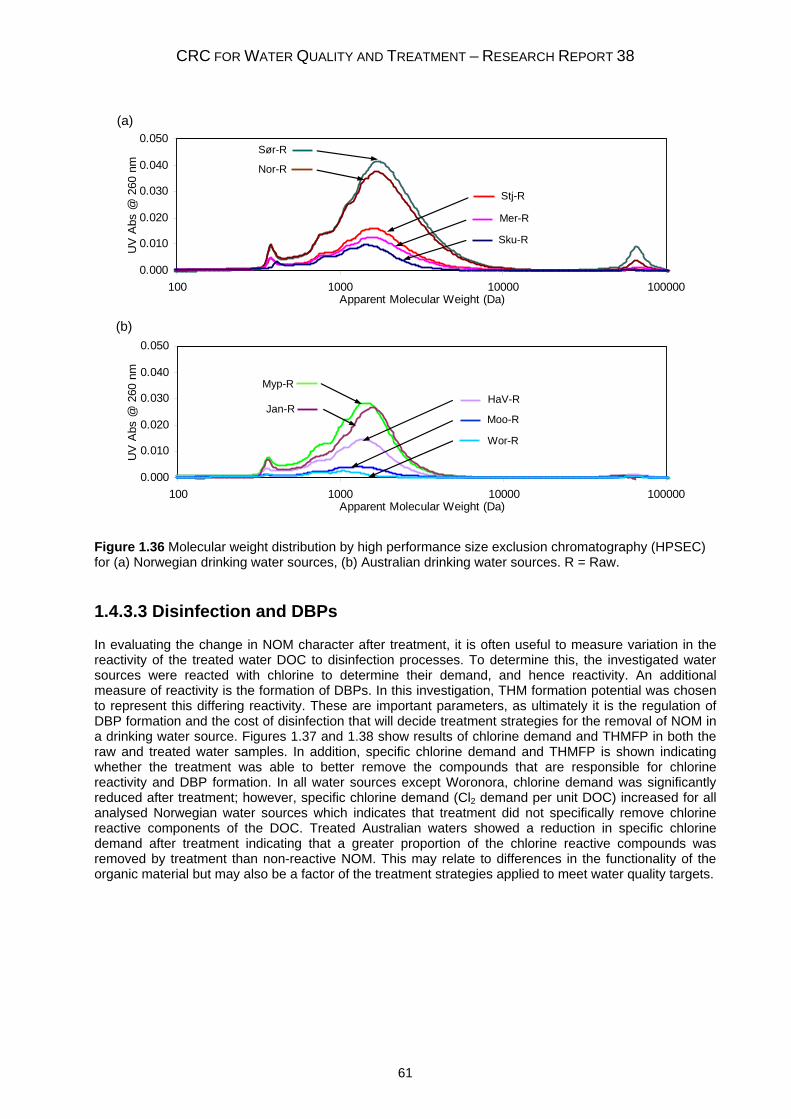
CRC FOR WATER QUALITY AND TREATMENT – RESEARCH REPORT 38
61
0.000
0.010
0.020
0.030
0.040
0.050
100 1000 10000 100000Apparent Molecular Weight (Da)
UV
Abs
@ 2
60 n
m Nor-R
Sør-R
Stj-R
Mer-R
Sku-R
0.000
0.010
0.020
0.030
0.040
0.050
100 1000 10000 100000Apparent Molecular Weight (Da)
UV
Abs
@ 2
60 n
m
HaV-R
Moo-R
Wor-R
Myp-R
Jan-R
Figure 1.36 Molecular weight distribution by high performance size exclusion chromatography (HPSEC) for (a) Norwegian drinking water sources, (b) Australian drinking water sources. R = Raw.
1.4.3.3 Disinfection and DBPs
In evaluating the change in NOM character after treatment, it is often useful to measure variation in the reactivity of the treated water DOC to disinfection processes. To determine this, the investigated water sources were reacted with chlorine to determine their demand, and hence reactivity. An additional measure of reactivity is the formation of DBPs. In this investigation, THM formation potential was chosen to represent this differing reactivity. These are important parameters, as ultimately it is the regulation of DBP formation and the cost of disinfection that will decide treatment strategies for the removal of NOM in a drinking water source. Figures 1.37 and 1.38 show results of chlorine demand and THMFP in both the raw and treated water samples. In addition, specific chlorine demand and THMFP is shown indicating whether the treatment was able to better remove the compounds that are responsible for chlorine reactivity and DBP formation. In all water sources except Woronora, chlorine demand was significantly reduced after treatment; however, specific chlorine demand (Cl2 demand per unit DOC) increased for all analysed Norwegian water sources which indicates that treatment did not specifically remove chlorine reactive components of the DOC. Treated Australian waters showed a reduction in specific chlorine demand after treatment indicating that a greater proportion of the chlorine reactive compounds was removed by treatment than non-reactive NOM. This may relate to differences in the functionality of the organic material but may also be a factor of the treatment strategies applied to meet water quality targets.
(a)
(b)
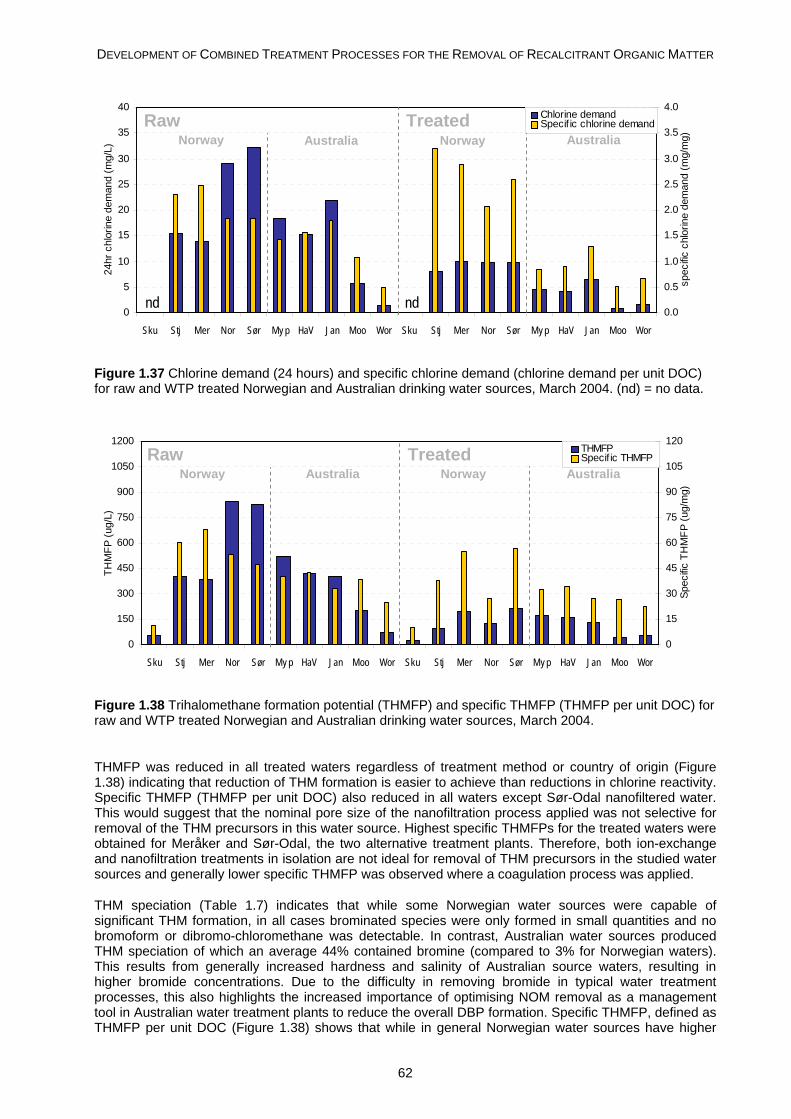
DEVELOPMENT OF COMBINED TREATMENT PROCESSES FOR THE REMOVAL OF RECALCITRANT ORGANIC MATTER
62
0
5
10
15
20
25
30
35
40
Sku Stj Mer Nor Sør My p HaV Jan Moo Wor Sku Stj Mer Nor Sør My p HaV Jan Moo Wor
24hr
chl
orin
e de
man
d (m
g/L)
0.0
0.5
1.0
1.5
2.0
2.5
3.0
3.5
4.0
spec
ific c
hlor
ine
dem
and
(mg/
mg)
Chlorine demandSpecif ic chlorine demandRaw Treated
nd nd
Norway NorwayAustralia Australia
Figure 1.37 Chlorine demand (24 hours) and specific chlorine demand (chlorine demand per unit DOC) for raw and WTP treated Norwegian and Australian drinking water sources, March 2004. (nd) = no data.
0
150
300
450
600
750
900
1050
1200
Sku Stj Mer Nor Sør My p HaV Jan Moo Wor Sku Stj Mer Nor Sør My p HaV Jan Moo Wor
THM
FP (u
g/L)
0
15
30
45
60
75
90
105
120
Spec
ific T
HM
FP (u
g/m
g)
THMFPSpecif ic THMFPRaw Treated
Norway NorwayAustralia Australia
Figure 1.38 Trihalomethane formation potential (THMFP) and specific THMFP (THMFP per unit DOC) for raw and WTP treated Norwegian and Australian drinking water sources, March 2004.
THMFP was reduced in all treated waters regardless of treatment method or country of origin (Figure 1.38) indicating that reduction of THM formation is easier to achieve than reductions in chlorine reactivity. Specific THMFP (THMFP per unit DOC) also reduced in all waters except Sør-Odal nanofiltered water. This would suggest that the nominal pore size of the nanofiltration process applied was not selective for removal of the THM precursors in this water source. Highest specific THMFPs for the treated waters were obtained for Meråker and Sør-Odal, the two alternative treatment plants. Therefore, both ion-exchange and nanofiltration treatments in isolation are not ideal for removal of THM precursors in the studied water sources and generally lower specific THMFP was observed where a coagulation process was applied.
THM speciation (Table 1.7) indicates that while some Norwegian water sources were capable of significant THM formation, in all cases brominated species were only formed in small quantities and no bromoform or dibromo-chloromethane was detectable. In contrast, Australian water sources produced THM speciation of which an average 44% contained bromine (compared to 3% for Norwegian waters). This results from generally increased hardness and salinity of Australian source waters, resulting in higher bromide concentrations. Due to the difficulty in removing bromide in typical water treatment processes, this also highlights the increased importance of optimising NOM removal as a management tool in Australian water treatment plants to reduce the overall DBP formation. Specific THMFP, defined as THMFP per unit DOC (Figure 1.38) shows that while in general Norwegian water sources have higher
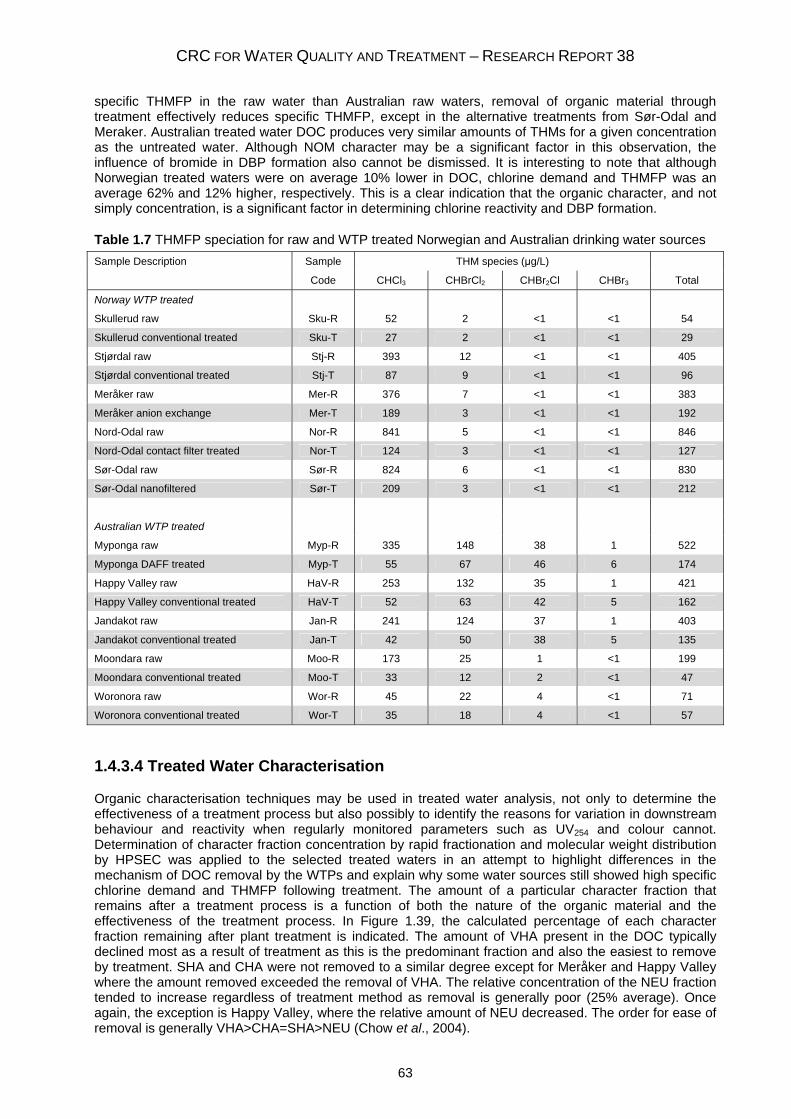
CRC FOR WATER QUALITY AND TREATMENT – RESEARCH REPORT 38
63
specific THMFP in the raw water than Australian raw waters, removal of organic material through treatment effectively reduces specific THMFP, except in the alternative treatments from Sør-Odal and Meraker. Australian treated water DOC produces very similar amounts of THMs for a given concentration as the untreated water. Although NOM character may be a significant factor in this observation, the influence of bromide in DBP formation also cannot be dismissed. It is interesting to note that although Norwegian treated waters were on average 10% lower in DOC, chlorine demand and THMFP was an average 62% and 12% higher, respectively. This is a clear indication that the organic character, and not simply concentration, is a significant factor in determining chlorine reactivity and DBP formation.
Table 1.7 THMFP speciation for raw and WTP treated Norwegian and Australian drinking water sources Sample Description Sample THM species (μg/L)
Code CHCl3 CHBrCl2 CHBr2Cl CHBr3 Total
Norway WTP treated
Skullerud raw Sku-R 52 2 <1 <1 54
Skullerud conventional treated Sku-T 27 2 <1 <1 29
Stjørdal raw Stj-R 393 12 <1 <1 405
Stjørdal conventional treated Stj-T 87 9 <1 <1 96
Meråker raw Mer-R 376 7 <1 <1 383
Meråker anion exchange Mer-T 189 3 <1 <1 192
Nord-Odal raw Nor-R 841 5 <1 <1 846
Nord-Odal contact filter treated Nor-T 124 3 <1 <1 127
Sør-Odal raw Sør-R 824 6 <1 <1 830
Sør-Odal nanofiltered Sør-T 209 3 <1 <1 212
Australian WTP treated
Myponga raw Myp-R 335 148 38 1 522
Myponga DAFF treated Myp-T 55 67 46 6 174
Happy Valley raw HaV-R 253 132 35 1 421
Happy Valley conventional treated HaV-T 52 63 42 5 162
Jandakot raw Jan-R 241 124 37 1 403
Jandakot conventional treated Jan-T 42 50 38 5 135
Moondara raw Moo-R 173 25 1 <1 199
Moondara conventional treated Moo-T 33 12 2 <1 47
Woronora raw Wor-R 45 22 4 <1 71
Woronora conventional treated Wor-T 35 18 4 <1 57
1.4.3.4 Treated Water Characterisation
Organic characterisation techniques may be used in treated water analysis, not only to determine the effectiveness of a treatment process but also possibly to identify the reasons for variation in downstream behaviour and reactivity when regularly monitored parameters such as UV254 and colour cannot. Determination of character fraction concentration by rapid fractionation and molecular weight distribution by HPSEC was applied to the selected treated waters in an attempt to highlight differences in the mechanism of DOC removal by the WTPs and explain why some water sources still showed high specific chlorine demand and THMFP following treatment. The amount of a particular character fraction that remains after a treatment process is a function of both the nature of the organic material and the effectiveness of the treatment process. In Figure 1.39, the calculated percentage of each character fraction remaining after plant treatment is indicated. The amount of VHA present in the DOC typically declined most as a result of treatment as this is the predominant fraction and also the easiest to remove by treatment. SHA and CHA were not removed to a similar degree except for Meråker and Happy Valley where the amount removed exceeded the removal of VHA. The relative concentration of the NEU fraction tended to increase regardless of treatment method as removal is generally poor (25% average). Once again, the exception is Happy Valley, where the relative amount of NEU decreased. The order for ease of removal is generally VHA>CHA=SHA>NEU (Chow et al., 2004).
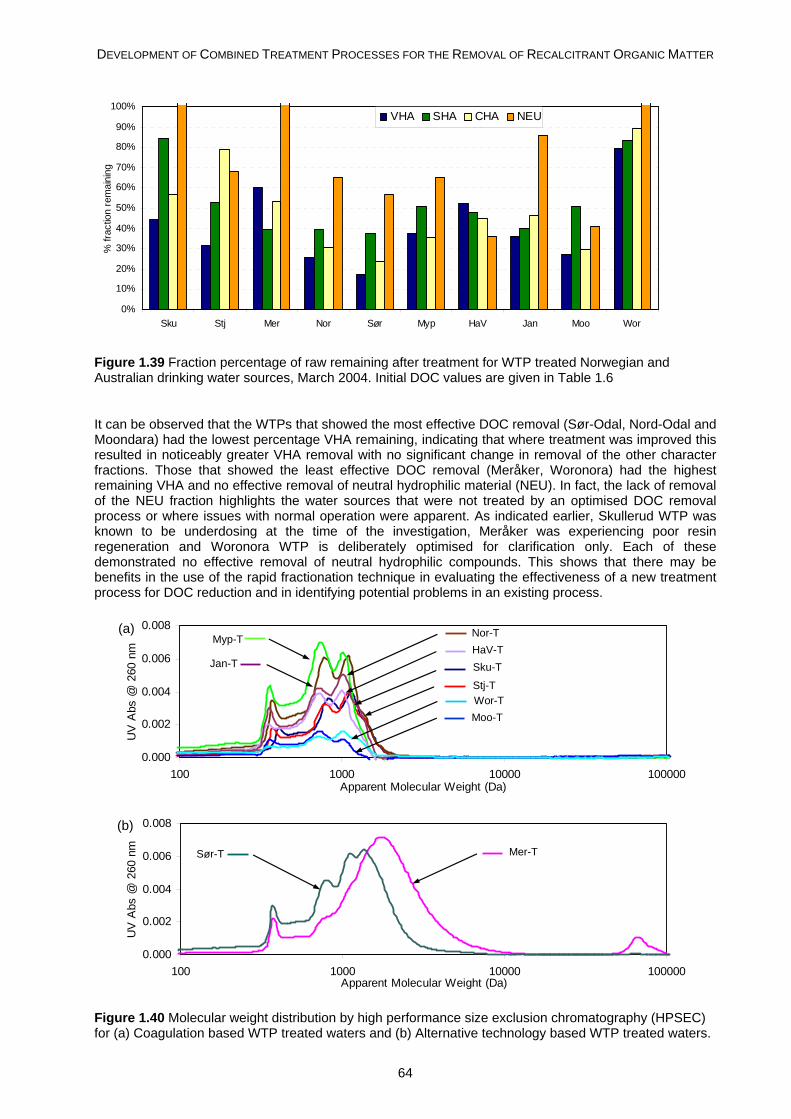
DEVELOPMENT OF COMBINED TREATMENT PROCESSES FOR THE REMOVAL OF RECALCITRANT ORGANIC MATTER
64
0%
10%
20%
30%
40%
50%
60%
70%
80%
90%
100%
Sku Stj Mer Nor Sør Myp HaV Jan Moo Wor
% fr
actio
n re
mai
ning
VHA SHA CHA NEU
Figure 1.39 Fraction percentage of raw remaining after treatment for WTP treated Norwegian and Australian drinking water sources, March 2004. Initial DOC values are given in Table 1.6
It can be observed that the WTPs that showed the most effective DOC removal (Sør-Odal, Nord-Odal and Moondara) had the lowest percentage VHA remaining, indicating that where treatment was improved this resulted in noticeably greater VHA removal with no significant change in removal of the other character fractions. Those that showed the least effective DOC removal (Meråker, Woronora) had the highest remaining VHA and no effective removal of neutral hydrophilic material (NEU). In fact, the lack of removal of the NEU fraction highlights the water sources that were not treated by an optimised DOC removal process or where issues with normal operation were apparent. As indicated earlier, Skullerud WTP was known to be underdosing at the time of the investigation, Meråker was experiencing poor resin regeneration and Woronora WTP is deliberately optimised for clarification only. Each of these demonstrated no effective removal of neutral hydrophilic compounds. This shows that there may be benefits in the use of the rapid fractionation technique in evaluating the effectiveness of a new treatment process for DOC reduction and in identifying potential problems in an existing process.
0.000
0.002
0.004
0.006
0.008
100 1000 10000 100000Apparent Molecular Weight (Da)
UV
Abs
@ 2
60 n
m HaV-T
Moo-T Wor-T
Myp-T
Jan-T
Nor-T
Sku-T
Stj-T
0.000
0.002
0.004
0.006
0.008
100 1000 10000 100000Apparent Molecular Weight (Da)
UV
Abs
@ 2
60 n
m Mer-T Sør-T
Figure 1.40 Molecular weight distribution by high performance size exclusion chromatography (HPSEC) for (a) Coagulation based WTP treated waters and (b) Alternative technology based WTP treated waters.
(a)
(b)
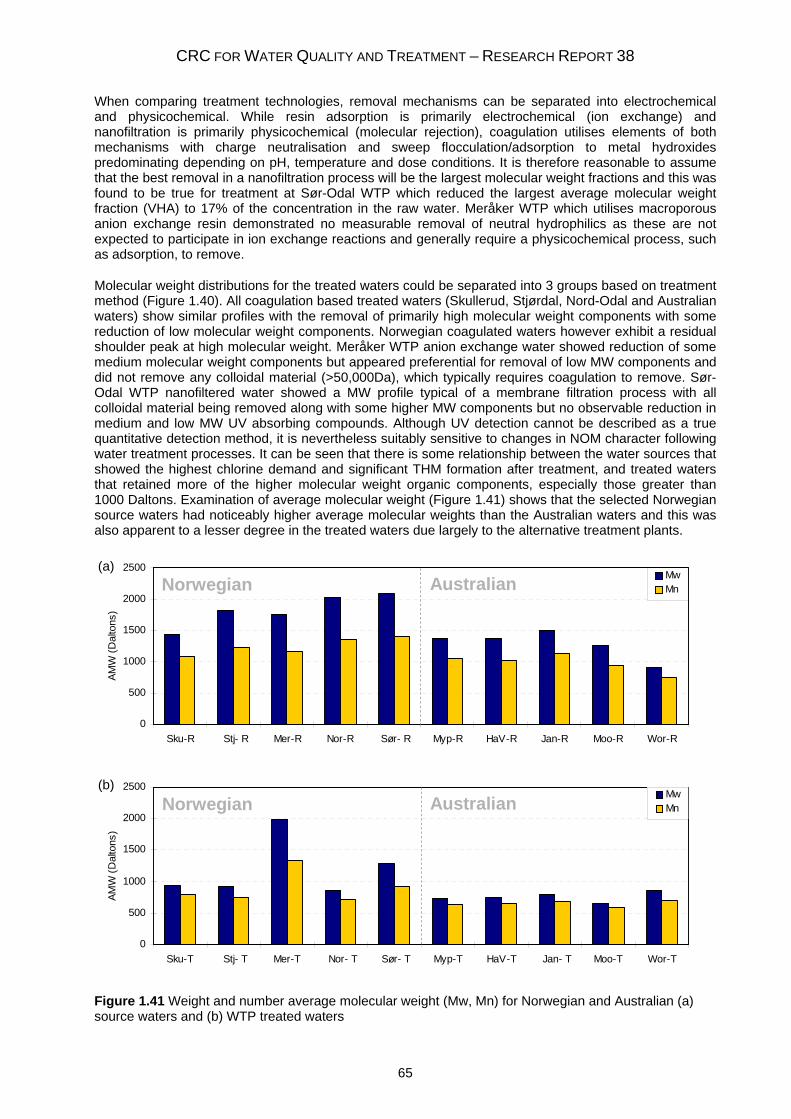
CRC FOR WATER QUALITY AND TREATMENT – RESEARCH REPORT 38
65
When comparing treatment technologies, removal mechanisms can be separated into electrochemical and physicochemical. While resin adsorption is primarily electrochemical (ion exchange) and nanofiltration is primarily physicochemical (molecular rejection), coagulation utilises elements of both mechanisms with charge neutralisation and sweep flocculation/adsorption to metal hydroxides predominating depending on pH, temperature and dose conditions. It is therefore reasonable to assume that the best removal in a nanofiltration process will be the largest molecular weight fractions and this was found to be true for treatment at Sør-Odal WTP which reduced the largest average molecular weight fraction (VHA) to 17% of the concentration in the raw water. Meråker WTP which utilises macroporous anion exchange resin demonstrated no measurable removal of neutral hydrophilics as these are not expected to participate in ion exchange reactions and generally require a physicochemical process, such as adsorption, to remove.
Molecular weight distributions for the treated waters could be separated into 3 groups based on treatment method (Figure 1.40). All coagulation based treated waters (Skullerud, Stjørdal, Nord-Odal and Australian waters) show similar profiles with the removal of primarily high molecular weight components with some reduction of low molecular weight components. Norwegian coagulated waters however exhibit a residual shoulder peak at high molecular weight. Meråker WTP anion exchange water showed reduction of some medium molecular weight components but appeared preferential for removal of low MW components and did not remove any colloidal material (>50,000Da), which typically requires coagulation to remove. Sør-Odal WTP nanofiltered water showed a MW profile typical of a membrane filtration process with all colloidal material being removed along with some higher MW components but no observable reduction in medium and low MW UV absorbing compounds. Although UV detection cannot be described as a true quantitative detection method, it is nevertheless suitably sensitive to changes in NOM character following water treatment processes. It can be seen that there is some relationship between the water sources that showed the highest chlorine demand and significant THM formation after treatment, and treated waters that retained more of the higher molecular weight organic components, especially those greater than 1000 Daltons. Examination of average molecular weight (Figure 1.41) shows that the selected Norwegian source waters had noticeably higher average molecular weights than the Australian waters and this was also apparent to a lesser degree in the treated waters due largely to the alternative treatment plants.
0
500
1000
1500
2000
2500
Sku-R Stj- R Mer-R Nor-R Sør- R Myp-R HaV-R Jan-R Moo-R Wor-R
AMW
(Dal
tons
)
MwMnNorwegian Australian
0
500
1000
1500
2000
2500
Sku-R Stj- R Mer-R Nor-R Sør- R Myp-R HaV-R Jan-R Moo-R Wor-R
AMW
(Dal
tons
)
MwMnNorwegian Australian
0
500
1000
1500
2000
2500
Sku-T Stj- T Mer-T Nor- T Sør- T Myp-T HaV-T Jan- T Moo-T Wor-T
AMW
(Dal
tons
)
MwMnNorwegian Australian
0
500
1000
1500
2000
2500
Sku-T Stj- T Mer-T Nor- T Sør- T Myp-T HaV-T Jan- T Moo-T Wor-T
AMW
(Dal
tons
)
MwMnNorwegian Australian
Figure 1.41 Weight and number average molecular weight (Mw, Mn) for Norwegian and Australian (a) source waters and (b) WTP treated waters
(a)
(b)
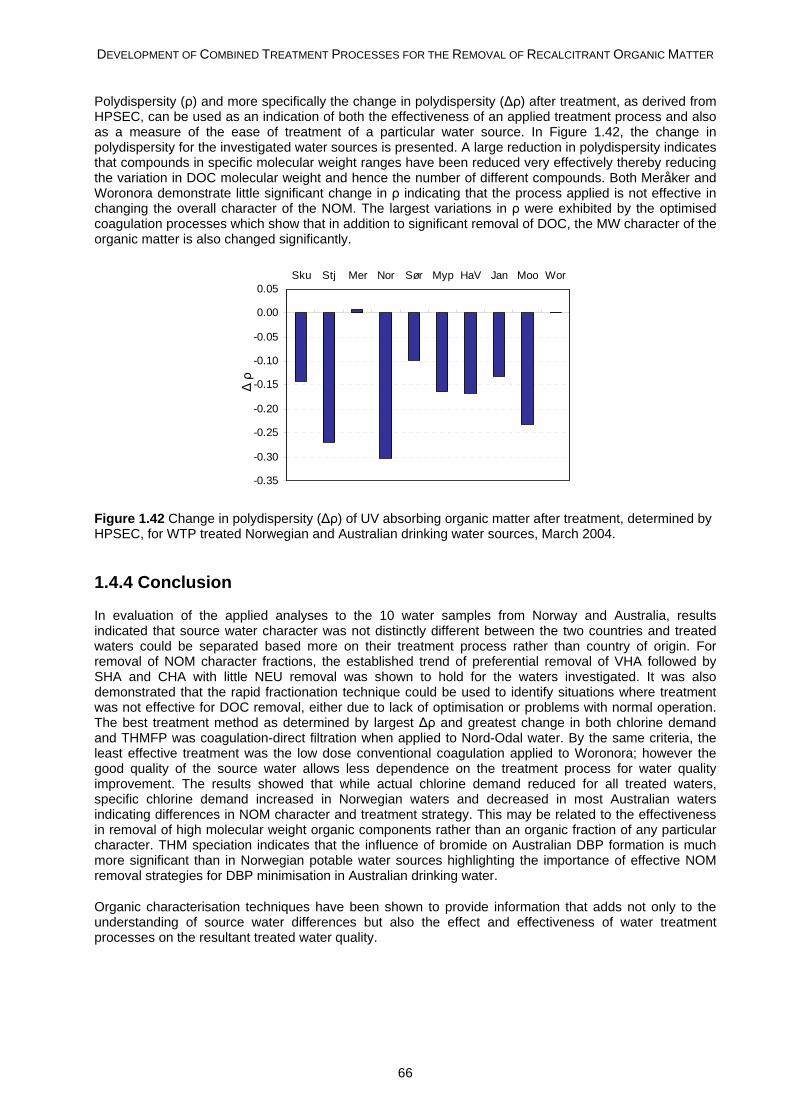
DEVELOPMENT OF COMBINED TREATMENT PROCESSES FOR THE REMOVAL OF RECALCITRANT ORGANIC MATTER
66
Polydispersity (ρ) and more specifically the change in polydispersity (Δρ) after treatment, as derived from HPSEC, can be used as an indication of both the effectiveness of an applied treatment process and also as a measure of the ease of treatment of a particular water source. In Figure 1.42, the change in polydispersity for the investigated water sources is presented. A large reduction in polydispersity indicates that compounds in specific molecular weight ranges have been reduced very effectively thereby reducing the variation in DOC molecular weight and hence the number of different compounds. Both Meråker and Woronora demonstrate little significant change in ρ indicating that the process applied is not effective in changing the overall character of the NOM. The largest variations in ρ were exhibited by the optimised coagulation processes which show that in addition to significant removal of DOC, the MW character of the organic matter is also changed significantly.
-0.35
-0.30
-0.25
-0.20
-0.15
-0.10
-0.05
0.00
0.05Sku Stj Mer Nor Sør Myp HaV Jan Moo Wor
Δ ρ
Figure 1.42 Change in polydispersity (Δρ) of UV absorbing organic matter after treatment, determined by HPSEC, for WTP treated Norwegian and Australian drinking water sources, March 2004. 1.4.4 Conclusion
In evaluation of the applied analyses to the 10 water samples from Norway and Australia, results indicated that source water character was not distinctly different between the two countries and treated waters could be separated based more on their treatment process rather than country of origin. For removal of NOM character fractions, the established trend of preferential removal of VHA followed by SHA and CHA with little NEU removal was shown to hold for the waters investigated. It was also demonstrated that the rapid fractionation technique could be used to identify situations where treatment was not effective for DOC removal, either due to lack of optimisation or problems with normal operation. The best treatment method as determined by largest Δρ and greatest change in both chlorine demand and THMFP was coagulation-direct filtration when applied to Nord-Odal water. By the same criteria, the least effective treatment was the low dose conventional coagulation applied to Woronora; however the good quality of the source water allows less dependence on the treatment process for water quality improvement. The results showed that while actual chlorine demand reduced for all treated waters, specific chlorine demand increased in Norwegian waters and decreased in most Australian waters indicating differences in NOM character and treatment strategy. This may be related to the effectiveness in removal of high molecular weight organic components rather than an organic fraction of any particular character. THM speciation indicates that the influence of bromide on Australian DBP formation is much more significant than in Norwegian potable water sources highlighting the importance of effective NOM removal strategies for DBP minimisation in Australian drinking water.
Organic characterisation techniques have been shown to provide information that adds not only to the understanding of source water differences but also the effect and effectiveness of water treatment processes on the resultant treated water quality.
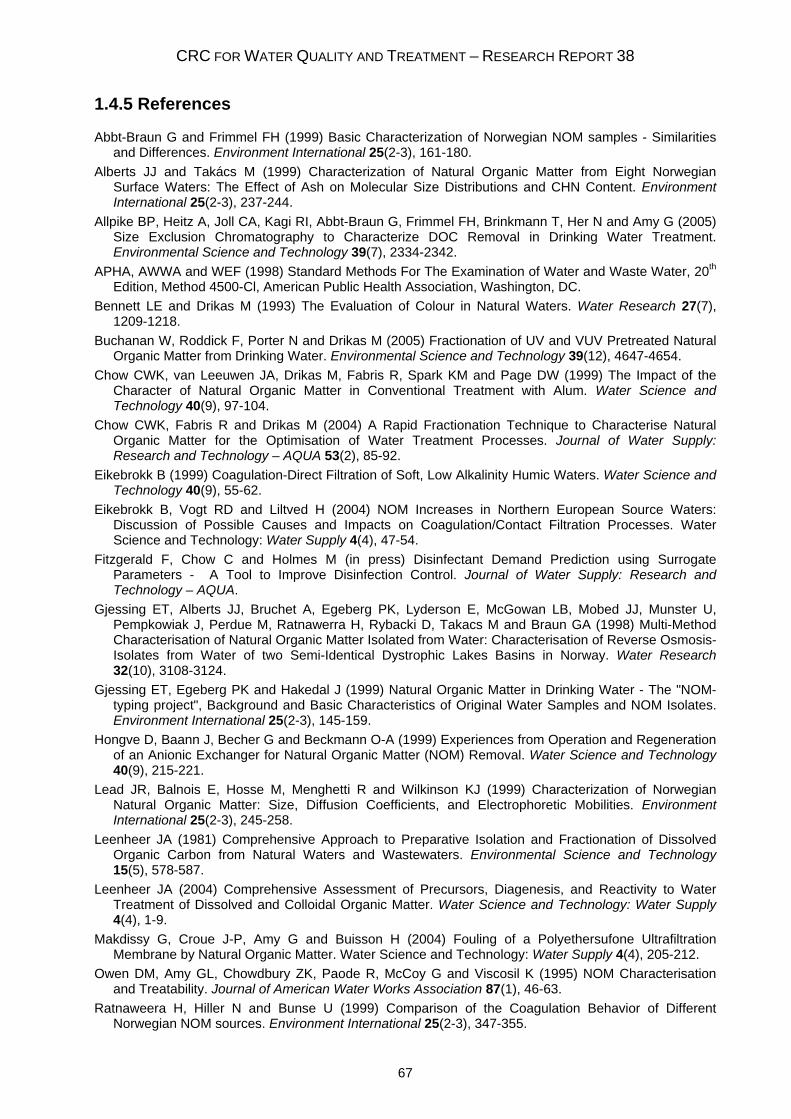
CRC FOR WATER QUALITY AND TREATMENT – RESEARCH REPORT 38
67
1.4.5 References
Abbt-Braun G and Frimmel FH (1999) Basic Characterization of Norwegian NOM samples - Similarities and Differences. Environment International 25(2-3), 161-180.
Alberts JJ and Takács M (1999) Characterization of Natural Organic Matter from Eight Norwegian Surface Waters: The Effect of Ash on Molecular Size Distributions and CHN Content. Environment International 25(2-3), 237-244.
Allpike BP, Heitz A, Joll CA, Kagi RI, Abbt-Braun G, Frimmel FH, Brinkmann T, Her N and Amy G (2005) Size Exclusion Chromatography to Characterize DOC Removal in Drinking Water Treatment. Environmental Science and Technology 39(7), 2334-2342.
APHA, AWWA and WEF (1998) Standard Methods For The Examination of Water and Waste Water, 20th Edition, Method 4500-Cl, American Public Health Association, Washington, DC.
Bennett LE and Drikas M (1993) The Evaluation of Colour in Natural Waters. Water Research 27(7), 1209-1218.
Buchanan W, Roddick F, Porter N and Drikas M (2005) Fractionation of UV and VUV Pretreated Natural Organic Matter from Drinking Water. Environmental Science and Technology 39(12), 4647-4654.
Chow CWK, van Leeuwen JA, Drikas M, Fabris R, Spark KM and Page DW (1999) The Impact of the Character of Natural Organic Matter in Conventional Treatment with Alum. Water Science and Technology 40(9), 97-104.
Chow CWK, Fabris R and Drikas M (2004) A Rapid Fractionation Technique to Characterise Natural Organic Matter for the Optimisation of Water Treatment Processes. Journal of Water Supply: Research and Technology – AQUA 53(2), 85-92.
Eikebrokk B (1999) Coagulation-Direct Filtration of Soft, Low Alkalinity Humic Waters. Water Science and Technology 40(9), 55-62.
Eikebrokk B, Vogt RD and Liltved H (2004) NOM Increases in Northern European Source Waters: Discussion of Possible Causes and Impacts on Coagulation/Contact Filtration Processes. Water Science and Technology: Water Supply 4(4), 47-54.
Fitzgerald F, Chow C and Holmes M (in press) Disinfectant Demand Prediction using Surrogate Parameters - A Tool to Improve Disinfection Control. Journal of Water Supply: Research and Technology – AQUA.
Gjessing ET, Alberts JJ, Bruchet A, Egeberg PK, Lyderson E, McGowan LB, Mobed JJ, Munster U, Pempkowiak J, Perdue M, Ratnawerra H, Rybacki D, Takacs M and Braun GA (1998) Multi-Method Characterisation of Natural Organic Matter Isolated from Water: Characterisation of Reverse Osmosis-Isolates from Water of two Semi-Identical Dystrophic Lakes Basins in Norway. Water Research 32(10), 3108-3124.
Gjessing ET, Egeberg PK and Hakedal J (1999) Natural Organic Matter in Drinking Water - The "NOM-typing project", Background and Basic Characteristics of Original Water Samples and NOM Isolates. Environment International 25(2-3), 145-159.
Hongve D, Baann J, Becher G and Beckmann O-A (1999) Experiences from Operation and Regeneration of an Anionic Exchanger for Natural Organic Matter (NOM) Removal. Water Science and Technology 40(9), 215-221.
Lead JR, Balnois E, Hosse M, Menghetti R and Wilkinson KJ (1999) Characterization of Norwegian Natural Organic Matter: Size, Diffusion Coefficients, and Electrophoretic Mobilities. Environment International 25(2-3), 245-258.
Leenheer JA (1981) Comprehensive Approach to Preparative Isolation and Fractionation of Dissolved Organic Carbon from Natural Waters and Wastewaters. Environmental Science and Technology 15(5), 578-587.
Leenheer JA (2004) Comprehensive Assessment of Precursors, Diagenesis, and Reactivity to Water Treatment of Dissolved and Colloidal Organic Matter. Water Science and Technology: Water Supply 4(4), 1-9.
Makdissy G, Croue J-P, Amy G and Buisson H (2004) Fouling of a Polyethersufone Ultrafiltration Membrane by Natural Organic Matter. Water Science and Technology: Water Supply 4(4), 205-212.
Owen DM, Amy GL, Chowdbury ZK, Paode R, McCoy G and Viscosil K (1995) NOM Characterisation and Treatability. Journal of American Water Works Association 87(1), 46-63.
Ratnaweera H, Hiller N and Bunse U (1999) Comparison of the Coagulation Behavior of Different Norwegian NOM sources. Environment International 25(2-3), 347-355.
DEVELOPMENT OF COMBINED TREATMENT PROCESSES FOR THE REMOVAL OF RECALCITRANT ORGANIC MATTER
68
van Leeuwen J, Chow C, Fabris R, Withers N, Page D and Drikas M (2002) Application of a Fractionation Technique for Better Understanding of the Removal of Natural Organic Matter by Alum Coagulation. Water Science and Technology: Water Supply 2(5-6), 427-433.
van Leeuwen J, Page D, Spark K, Fabris R and Sledz L (2004) Pyrolysis and Thermochemolysis Products from Organics Recalcitrant to Removal by Alum, in two Drinking Waters. In Proceedings of NOM Research: Innovations and Applications for Drinking Water Treatment; Victor Harbor, Australia, March 2-5;CD-ROM.
Vik EA, Carlson DA, Eikum AS and Gjessing ET (1985) Removing Aquatic Humus from Norwegian Lakes. Journal of American Water Works Association 87(3), 58-66.
Wagoner DB and Christman RF (1999) Molar Mass and Size of Norwegian Aquatic NOM by Light Scattering. Environment International 25(2-3), 275-284.
CRC FOR WATER QUALITY AND TREATMENT – RESEARCH REPORT 38
69
2 ESTABLISHED TREATMENTS
2.1 Alternative Coagulants2
2.1.1 Introduction
Inorganic metal coagulants have long been used in the treatment of water for drinking purposes for the removal of colour and turbidity. More recently though, the focus in drinking water treatment has shifted to include the removal of natural organic matter (NOM). Enhanced coagulation, whereby higher doses of coagulant, with or without pH control, are applied have demonstrated improved removal of NOM (Kavanaugh, 1978; Gregor et al., 1997; White et al., 1997; van Leeuwen et al., 1999). However, associated research has shown that in most cases there is a portion of the NOM that cannot be removed by coagulation, regardless of the treatment conditions applied (Randtke et al., 1988; Edwards, 1997; Chow et al., 1999; van Leeuwen et al., 2002). This portion of the organic matter can be referred to as being recalcitrant NOM. These compounds can result in poor or inconsistent disinfectant residual, disinfection byproducts (DBPs), bacterial regrowth and membrane fouling. From a future focussed water quality perpective, it is important to identify whether or not these recalcitrant materials make a significant contribution to the problems discussed above and whether there is a genuine need to apply improved techniques to aid in their removal. If their further removal is desired, amongst the easiest methods that may be implemented into existing conventional treatment plants is improvement in the applied coagulant. While processes may need to be optimised for a new coagulant, it will not likely require extensive changes to existing infrastructure and is therefore a viable economic option.
Advances in inorganic coagulants have progressed steadily in recent times with the majority of work based around pre-polymerised preparations of the traditional aluminium and iron salts. Through controlled production conditions, the formation of desired metal-hydroxy complexes of higher specific charge is increased, which may demonstrate improved coagulation performance. The advantages over monomeric inorganic coagulants can include a wider operating pH range, less temperature sensitivity and lower dose requirement (Jiang and Graham, 1998a). Amongst the advanced coagulants, poly-aluminium chloride (PACl) has been most extensively researched and is used in many countries around the world. While characterisation of dissolved species and its turbidity removal is well understood (Jiang and Graham, 1998a; Gregory and Rossi, 2001; Gregory and Dupont, 2001; Gao et al., 2002b), little has been reported concerning DOC removal. However, previous work by the authors (Fabris et al., 2003) and also Volk et al. (2000) has shown that under enhanced coagulation conditions (lower pH), ferric coagulants perform better for the removal of NOM than both alum and PACl. Poly-ferric sulphate (PFS) has been well characterised and reported (Jiang et al., 1996; Jiang and Graham, 1998b; Cheng, 2002; Cheng and Chi, 2002) and has shown improved treatment performance for humic acids (Cheng, 2002; Cheng and Chi, 2002) and DOC (Jiang et al., 1996).
Most recent developments in advanced coagulants have focussed on the stabilisation of the floc particle, usually through incorporation of silica into the hydroxy complex structures, such as poly-aluminium silica sulphate (McGregor, 2002), poly-aluminium silica chloride (Gao et al., 2002b) and poly-ferric silica chloride (Wang and Tang, 2001). These are focussed on better removal of turbidity and improved floc handling properties. However, these coagulants are not targeted towards DOC removal. Gao et al. (2002a) noted that aluminium silica polymer composites enhanced aggregating efficiency but weakened charge neutralisation effectiveness in coagulation processes.
Chitosan is a cellulose-like biopolymer produced through the deacetylation of chitin. Being a natural waste product, the source material is of low cost, readily available and non-toxic. It has shown suitability as a coagulant for the removal of metals (Jeon and Höll, 2003; Rae and Gibb, 2003) and particles (Pan et al., 1999; Huang et al., 2000; Divakaran and Pillai, 2001; Divakaran and Pillai, 2002). The use of chitosan for organic colour removal has been investigated most recently (Chiou and Li, 2003; Bratskaya et al., 2004) but little has been published concerning the effectiveness of chitosan for coagulation of NOM in drinking water treatment (Eikebrokk and Saltnes, 2002).
2 This chapter is based on the following paper: Fabris, R., Chow, C. and Drikas, M. (2005) Evaluation of alternative
coagulants for removal of problematic natural organic matter in drinking water treatment. Ozwater Watershed Convention and Exhibition, Brisbane, 8-12 May, 2005. Paper o5078.
DEVELOPMENT OF COMBINED TREATMENT PROCESSES FOR THE REMOVAL OF RECALCITRANT ORGANIC MATTER
70
This work aimed to address whether improvements in coagulation conditions or alternative coagulants will be sufficient to remove the components in the organic matter that cause concern.
2.1.2 Materials and Methods
2.1.2.1 Source Waters
Copi Hollow water originated from a constructed water storage, feeding a treatment plant in country New South Wales, Australia. The source water was chosen as an example of a seasonal extreme and does not necessarily represent typical water quality throughout the year. Due to its long residence time in open storage, the NOM in the water was considered to be highly biodegraded and concentrated through evaporation. This water exhibited a particularly high DOC (36.0 mg/L) and low specific UV absorbance (SUVA) of 1.25 at the time of the investigation. The Myponga Reservoir is located about 50 km south of Adelaide, Australia. The water from Myponga Reservoir is sourced via surrounding catchment and is generally considered a high colour and high DOC source (62 Hazen units and 11.7 mg/L, respectively).
2.1.2.2 Chemicals
Three inorganic coagulants, aluminium sulphate (Pivot, Australia), ferric chloride (Profloc-F, ICI Chemicals, Australia), poly-ferric sulphate (Aluminates (Morwell), Australia) and a natural biopolymer, Chitosan (85% deacetylated, Sigma, Australia) were selected to treat the two drinking water sources. Doses of the inorganic coagulants were applied as equimolar concentrations of the metal ion with respect to alum. Therefore working solution concentrations were; Alum (20,000 mg/L as Al2(SO4)3.18H2O), ferric chloride (9,739 mg/L as FeCl3) and poly-ferric sulphate (12,159 mg/L as Fe2(SO4)3). For simplicity of comparison, all doses are notated as alum equivalent concentrations. A 1% chitosan working solution was produced by dissolution of the material in 1% HCl (Pan et al., 1999).
2.1.2.3 Experimental conditions
Jar tests were performed on a six paddle gang stirrer (SEM Pty. Ltd., Australia) in 2 litre gator jars (B-KER2, Phipps & Bird, USA). Samples were flash mixed at 200 rpm for 1 minute followed by 14 minutes of slow mixing at 25 rpm and 15 minutes of settling before samples were gravity filtered through 11 μm pore size paper filters (Grade 1, Whatman International Ltd., UK) to simulate rapid sand filtration. Coagulation was evaluated in both dose range and pH range experiments. Dose ranges for the inorganic coagulants were 200 to 700 mg/L for Copi Hollow and 40 to 140 mg/L for Myponga, controlled at pH 6.2. In addition, coagulation was performed at 500 mg/L (Copi Hollow) and 100 mg/L (Myponga) with pH levels ranging from 3 to 8, achieved through the addition of 0.2 M solutions of HCl or NaOH (AR Grade). After evaluation of recent literature (Pan et al., 1999; Huang et al., 2000; Divakaran et al., 2001 & 2002; Eikebrokk et al., 2002 and Bratskaya et al., 2004), a chitosan dose range of 6-16 mg/L was chosen for Copi Hollow and 1-6 mg/L for Myponga, also at pH6.2. For the pH range experiments, 12 mg/L and 4 mg/L for Copi Hollow and Myponga, respectively, were chosen. Target pH was achieved by determination of acid or base requirement by prior titration of a 500 mL volume of the raw water containing the coagulant dose.
2.1.2.4 Instrumental Analyses
Analysed parameters included UV254, DOC, 72 hour chlorine demand, trihalomethane formation potential (THMFP), rapid fractionation, bacterial regrowth potential (BRP) and molecular weight distribution by HPSEC. Samples for UV absorbance and DOC were filtered through 0.45 μm membranes. Absorbance was measured through a 1 cm quartz cell and DOC was measured using a Sievers 820 Portable TOC analyser (Ionics, USA). Chlorine demand was determined by addition of 20-30 mg/L Cl2 to 150 mL of sample and storage at room temperature (20°C) in the dark. Residual chlorine was titrated after 72 hours by the DPD ferrous titrimetric method (4500-Cl F., Standard methods, 1998) and the demand calculated by the difference. THMFP was determined by addition of 20-30 mg/L Cl2 to 40 mL of pre-warmed (30°C) sample in a brown glass bottle with no headspace. Reaction was allowed for 4 hours at 30°C in a covered water bath before quenching the residual chlorine with excess ascorbic acid. THM concentrations were determined by purge and trap gas chromatography with electron capture detection.
Rapid fractionation technique separates DOC into four fractions based on character and molecular weight. Fractions produced are defined as very hydrophobic acids (VHA), slightly hydrophobic acids (SHA), charged hydrophilics (CHA) and neutral hydrophilics (NEU). Specifics of the technique and
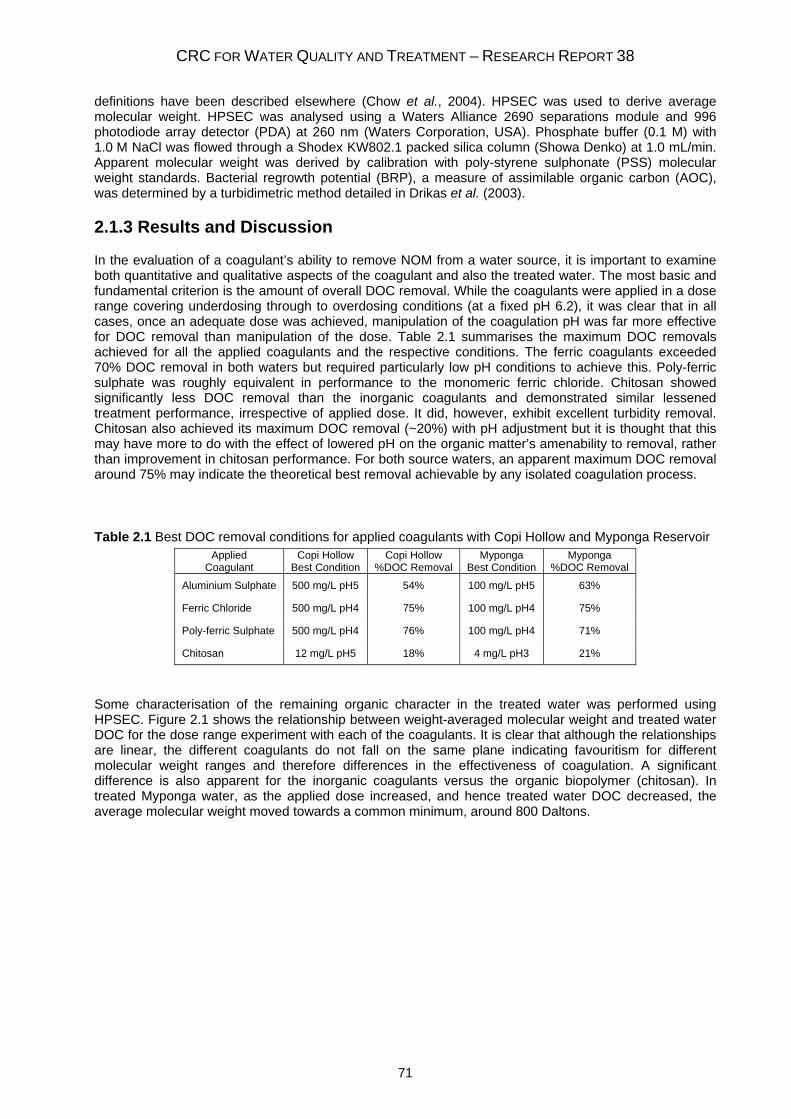
CRC FOR WATER QUALITY AND TREATMENT – RESEARCH REPORT 38
71
definitions have been described elsewhere (Chow et al., 2004). HPSEC was used to derive average molecular weight. HPSEC was analysed using a Waters Alliance 2690 separations module and 996 photodiode array detector (PDA) at 260 nm (Waters Corporation, USA). Phosphate buffer (0.1 M) with 1.0 M NaCl was flowed through a Shodex KW802.1 packed silica column (Showa Denko) at 1.0 mL/min. Apparent molecular weight was derived by calibration with poly-styrene sulphonate (PSS) molecular weight standards. Bacterial regrowth potential (BRP), a measure of assimilable organic carbon (AOC), was determined by a turbidimetric method detailed in Drikas et al. (2003).
2.1.3 Results and Discussion
In the evaluation of a coagulant’s ability to remove NOM from a water source, it is important to examine both quantitative and qualitative aspects of the coagulant and also the treated water. The most basic and fundamental criterion is the amount of overall DOC removal. While the coagulants were applied in a dose range covering underdosing through to overdosing conditions (at a fixed pH 6.2), it was clear that in all cases, once an adequate dose was achieved, manipulation of the coagulation pH was far more effective for DOC removal than manipulation of the dose. Table 2.1 summarises the maximum DOC removals achieved for all the applied coagulants and the respective conditions. The ferric coagulants exceeded 70% DOC removal in both waters but required particularly low pH conditions to achieve this. Poly-ferric sulphate was roughly equivalent in performance to the monomeric ferric chloride. Chitosan showed significantly less DOC removal than the inorganic coagulants and demonstrated similar lessened treatment performance, irrespective of applied dose. It did, however, exhibit excellent turbidity removal. Chitosan also achieved its maximum DOC removal (~20%) with pH adjustment but it is thought that this may have more to do with the effect of lowered pH on the organic matter’s amenability to removal, rather than improvement in chitosan performance. For both source waters, an apparent maximum DOC removal around 75% may indicate the theoretical best removal achievable by any isolated coagulation process.
Table 2.1 Best DOC removal conditions for applied coagulants with Copi Hollow and Myponga Reservoir Applied
Coagulant Copi Hollow
Best Condition Copi Hollow
%DOC Removal Myponga
Best Condition Myponga
%DOC Removal
Aluminium Sulphate 500 mg/L pH5 54% 100 mg/L pH5 63%
Ferric Chloride 500 mg/L pH4 75% 100 mg/L pH4 75%
Poly-ferric Sulphate 500 mg/L pH4 76% 100 mg/L pH4 71%
Chitosan 12 mg/L pH5 18% 4 mg/L pH3 21%
Some characterisation of the remaining organic character in the treated water was performed using HPSEC. Figure 2.1 shows the relationship between weight-averaged molecular weight and treated water DOC for the dose range experiment with each of the coagulants. It is clear that although the relationships are linear, the different coagulants do not fall on the same plane indicating favouritism for different molecular weight ranges and therefore differences in the effectiveness of coagulation. A significant difference is also apparent for the inorganic coagulants versus the organic biopolymer (chitosan). In treated Myponga water, as the applied dose increased, and hence treated water DOC decreased, the average molecular weight moved towards a common minimum, around 800 Daltons.
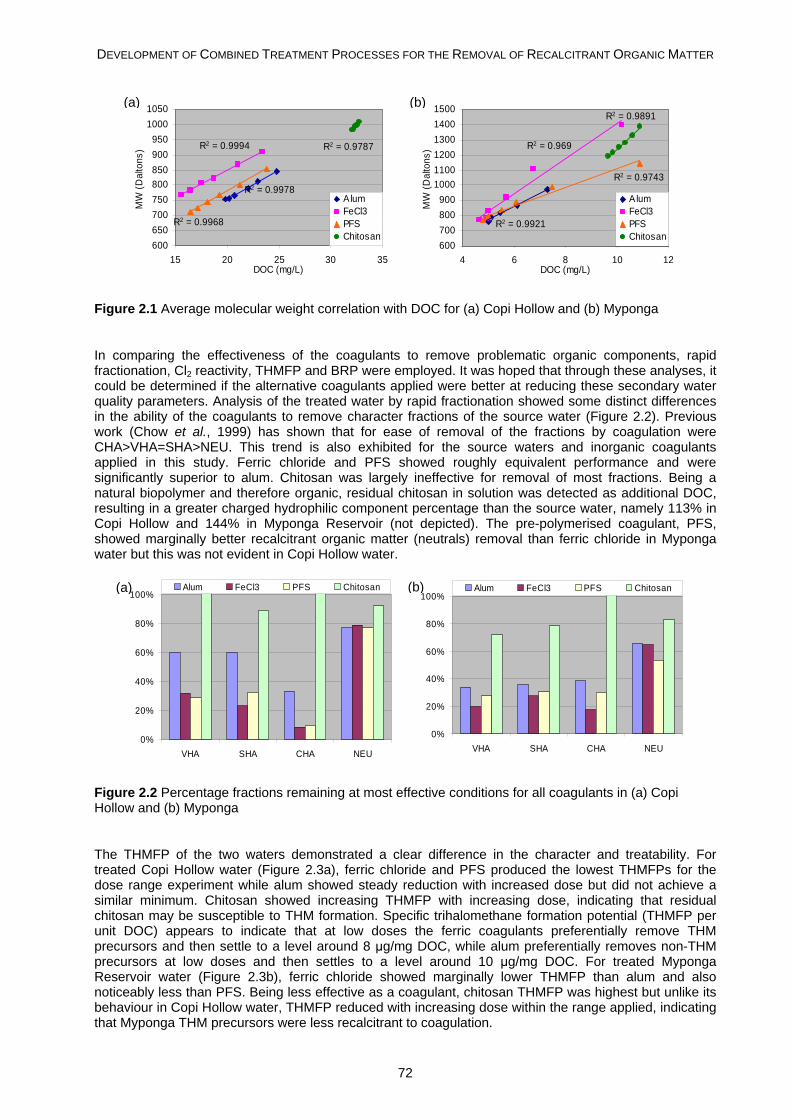
DEVELOPMENT OF COMBINED TREATMENT PROCESSES FOR THE REMOVAL OF RECALCITRANT ORGANIC MATTER
72
R2 = 0.9968
R2 = 0.9994
R2 = 0.9978
R2 = 0.9787
600650700750800850900950
10001050
15 20 25 30 35DOC (mg/L)
MW
(Dal
tons
)
A lumFeCl3PFSChitosan
R2 = 0.9921
R2 = 0.969
R2 = 0.9743
R2 = 0.9891
600700800900
100011001200130014001500
4 6 8 10 12DOC (mg/L)
MW
(Dal
tons
)
A lumFeCl3PFSChitosan
Figure 2.1 Average molecular weight correlation with DOC for (a) Copi Hollow and (b) Myponga
In comparing the effectiveness of the coagulants to remove problematic organic components, rapid fractionation, Cl2 reactivity, THMFP and BRP were employed. It was hoped that through these analyses, it could be determined if the alternative coagulants applied were better at reducing these secondary water quality parameters. Analysis of the treated water by rapid fractionation showed some distinct differences in the ability of the coagulants to remove character fractions of the source water (Figure 2.2). Previous work (Chow et al., 1999) has shown that for ease of removal of the fractions by coagulation were CHA>VHA=SHA>NEU. This trend is also exhibited for the source waters and inorganic coagulants applied in this study. Ferric chloride and PFS showed roughly equivalent performance and were significantly superior to alum. Chitosan was largely ineffective for removal of most fractions. Being a natural biopolymer and therefore organic, residual chitosan in solution was detected as additional DOC, resulting in a greater charged hydrophilic component percentage than the source water, namely 113% in Copi Hollow and 144% in Myponga Reservoir (not depicted). The pre-polymerised coagulant, PFS, showed marginally better recalcitrant organic matter (neutrals) removal than ferric chloride in Myponga water but this was not evident in Copi Hollow water.
0%
20%
40%
60%
80%
100%
VHA SHA CHA NEU
Alum FeCl3 PFS Chitosan
0%
20%
40%
60%
80%
100%
VHA SHA CHA NEU
Alum FeCl3 PFS Chitosan
Figure 2.2 Percentage fractions remaining at most effective conditions for all coagulants in (a) Copi Hollow and (b) Myponga
The THMFP of the two waters demonstrated a clear difference in the character and treatability. For treated Copi Hollow water (Figure 2.3a), ferric chloride and PFS produced the lowest THMFPs for the dose range experiment while alum showed steady reduction with increased dose but did not achieve a similar minimum. Chitosan showed increasing THMFP with increasing dose, indicating that residual chitosan may be susceptible to THM formation. Specific trihalomethane formation potential (THMFP per unit DOC) appears to indicate that at low doses the ferric coagulants preferentially remove THM precursors and then settle to a level around 8 μg/mg DOC, while alum preferentially removes non-THM precursors at low doses and then settles to a level around 10 μg/mg DOC. For treated Myponga Reservoir water (Figure 2.3b), ferric chloride showed marginally lower THMFP than alum and also noticeably less than PFS. Being less effective as a coagulant, chitosan THMFP was highest but unlike its behaviour in Copi Hollow water, THMFP reduced with increasing dose within the range applied, indicating that Myponga THM precursors were less recalcitrant to coagulation.
(a) (b)
(a) (b)
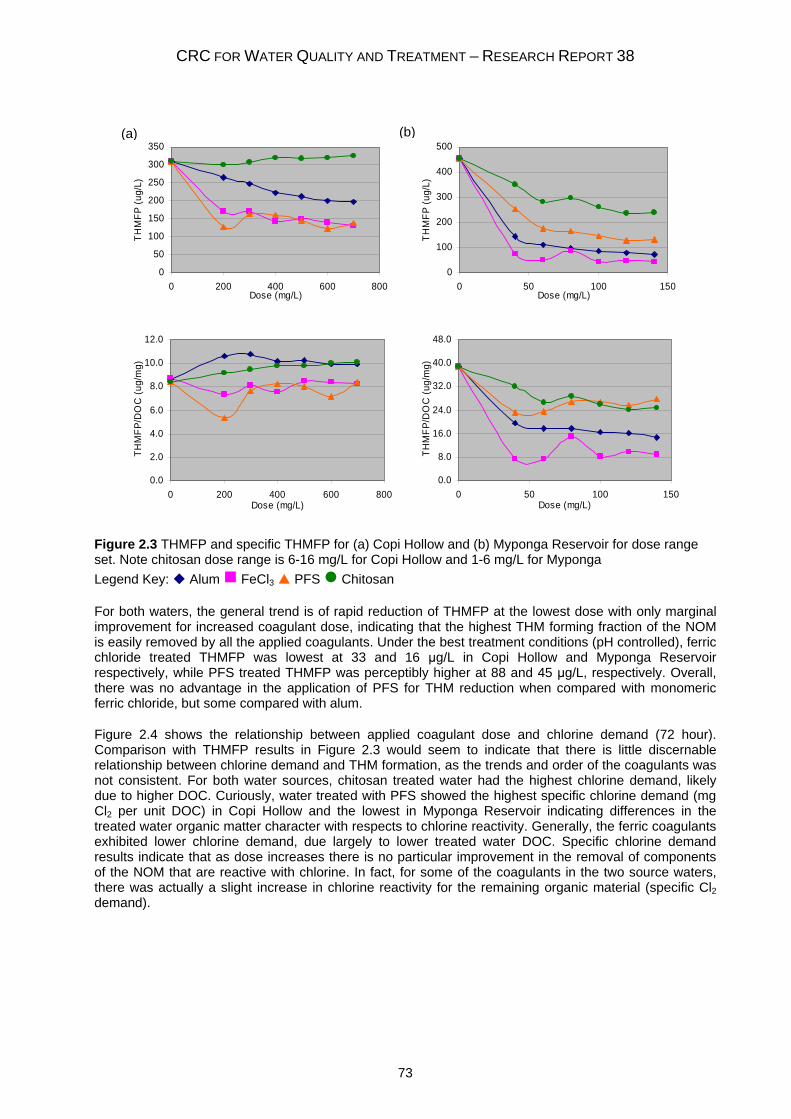
CRC FOR WATER QUALITY AND TREATMENT – RESEARCH REPORT 38
73
0
50
100
150
200
250
300
350
0 200 400 600 800Dose (mg/L)
THM
FP (u
g/L)
0
100
200
300
400
500
0 50 100 150Dose (mg/L)
THM
FP (u
g/L)
0.0
2.0
4.0
6.0
8.0
10.0
12.0
0 200 400 600 800Dose (mg/L)
THM
FP/D
OC
(ug/
mg)
0.0
8.0
16.0
24.0
32.0
40.0
48.0
0 50 100 150Dose (mg/L)
THM
FP/D
OC
(ug/
mg)
Figure 2.3 THMFP and specific THMFP for (a) Copi Hollow and (b) Myponga Reservoir for dose range set. Note chitosan dose range is 6-16 mg/L for Copi Hollow and 1-6 mg/L for Myponga Legend Key: Alum FeCl3 PFS Chitosan
For both waters, the general trend is of rapid reduction of THMFP at the lowest dose with only marginal improvement for increased coagulant dose, indicating that the highest THM forming fraction of the NOM is easily removed by all the applied coagulants. Under the best treatment conditions (pH controlled), ferric chloride treated THMFP was lowest at 33 and 16 μg/L in Copi Hollow and Myponga Reservoir respectively, while PFS treated THMFP was perceptibly higher at 88 and 45 μg/L, respectively. Overall, there was no advantage in the application of PFS for THM reduction when compared with monomeric ferric chloride, but some compared with alum.
Figure 2.4 shows the relationship between applied coagulant dose and chlorine demand (72 hour). Comparison with THMFP results in Figure 2.3 would seem to indicate that there is little discernable relationship between chlorine demand and THM formation, as the trends and order of the coagulants was not consistent. For both water sources, chitosan treated water had the highest chlorine demand, likely due to higher DOC. Curiously, water treated with PFS showed the highest specific chlorine demand (mg Cl2 per unit DOC) in Copi Hollow and the lowest in Myponga Reservoir indicating differences in the treated water organic matter character with respects to chlorine reactivity. Generally, the ferric coagulants exhibited lower chlorine demand, due largely to lower treated water DOC. Specific chlorine demand results indicate that as dose increases there is no particular improvement in the removal of components of the NOM that are reactive with chlorine. In fact, for some of the coagulants in the two source waters, there was actually a slight increase in chlorine reactivity for the remaining organic material (specific Cl2 demand).
(a) (b)
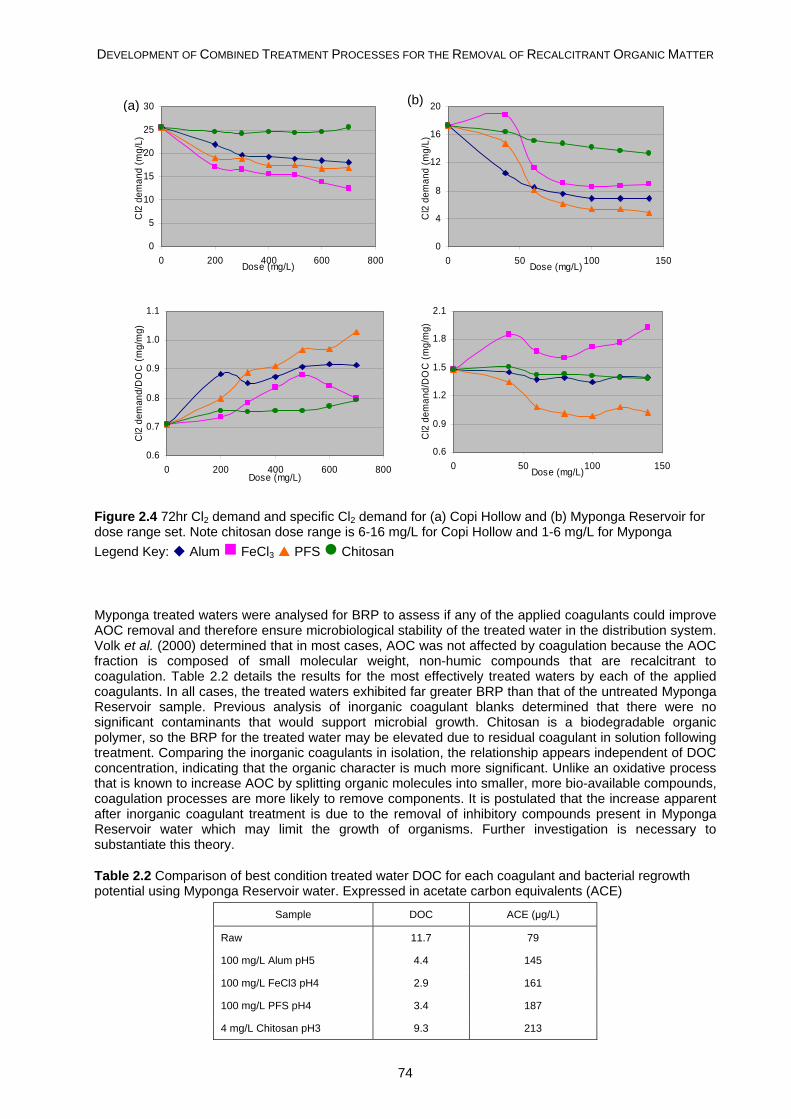
DEVELOPMENT OF COMBINED TREATMENT PROCESSES FOR THE REMOVAL OF RECALCITRANT ORGANIC MATTER
74
0
5
10
15
20
25
30
0 200 400 600 800Dose (mg/L)
Cl2
dem
and
(mg/
L)
0
4
8
12
16
20
0 50 100 150Dose (mg/L)
Cl2
dem
and
(mg/
L)
0.6
0.7
0.8
0.9
1.0
1.1
0 200 400 600 800Dose (mg/L)
Cl2
dem
and/
DO
C (m
g/m
g)
0.6
0.9
1.2
1.5
1.8
2.1
0 50 100 150Dose (mg/L)
Cl2
dem
and/
DO
C (m
g/m
g)
Figure 2.4 72hr Cl2 demand and specific Cl2 demand for (a) Copi Hollow and (b) Myponga Reservoir for dose range set. Note chitosan dose range is 6-16 mg/L for Copi Hollow and 1-6 mg/L for Myponga Legend Key: Alum FeCl3 PFS Chitosan
Myponga treated waters were analysed for BRP to assess if any of the applied coagulants could improve AOC removal and therefore ensure microbiological stability of the treated water in the distribution system. Volk et al. (2000) determined that in most cases, AOC was not affected by coagulation because the AOC fraction is composed of small molecular weight, non-humic compounds that are recalcitrant to coagulation. Table 2.2 details the results for the most effectively treated waters by each of the applied coagulants. In all cases, the treated waters exhibited far greater BRP than that of the untreated Myponga Reservoir sample. Previous analysis of inorganic coagulant blanks determined that there were no significant contaminants that would support microbial growth. Chitosan is a biodegradable organic polymer, so the BRP for the treated water may be elevated due to residual coagulant in solution following treatment. Comparing the inorganic coagulants in isolation, the relationship appears independent of DOC concentration, indicating that the organic character is much more significant. Unlike an oxidative process that is known to increase AOC by splitting organic molecules into smaller, more bio-available compounds, coagulation processes are more likely to remove components. It is postulated that the increase apparent after inorganic coagulant treatment is due to the removal of inhibitory compounds present in Myponga Reservoir water which may limit the growth of organisms. Further investigation is necessary to substantiate this theory.
Table 2.2 Comparison of best condition treated water DOC for each coagulant and bacterial regrowth potential using Myponga Reservoir water. Expressed in acetate carbon equivalents (ACE)
Sample DOC ACE (μg/L)
Raw 11.7 79
100 mg/L Alum pH5 4.4 145
100 mg/L FeCl3 pH4 2.9 161
100 mg/L PFS pH4 3.4 187
4 mg/L Chitosan pH3 9.3 213
(b) (a)
CRC FOR WATER QUALITY AND TREATMENT – RESEARCH REPORT 38
75
2.1.4 Conclusion
When compared at equimolar concentrations, advanced coagulants were found to perform equally for DOC removal as monomeric inorganic coagulants. However, they did not necessarily target or improve removal of components of concern, such as recalcitrant NOM, chlorine reactive organic matter and AOC. Chitosan was not as effective for DOC removal as inorganic coagulants but advantages such as natural, low cost source material and excellent turbidity removal may make it worthy of further consideration. It is clear that despite some advances, current coagulants cannot achieve the required improvements in secondary treated water quality parameters in isolation. Further reductions in removal of recalcitrant or problematic organic material will require alternative technologies such as adsorbents, oxidative techniques or membrane filtration. Many treatment plants already take advantage of multiple step treatments, often including coagulation, to reduce problematic components in the treated water. Focus on research into alternative technologies and multi-step treatments should hopefully yield further improvements in treated water quality.
2.1.5 References
Bratskaya S, Schwarz S and Chervonetsky D (2004) Comparative study of humic acids flocculation with chitosan hydrochloride and chitosan glutamate. Water Research 38(12), 2955-2961.
Cheng WP (2002) Comparison of hydrolysis/coagulation behavior of polymeric and monomeric iron coagulants in humic acid solution. Chemosphere 47, 963-969.
Cheng WP and Chi FH (2002) A study of coagulation mechanisms of polyferric sulphate reacting with humic acid using a flourescence-quenching method. Water Research 36, 4583-4591.
Chiou MS and Li HY (2003) Adsorption behaviour of reactive dye in aqueous solution on chemical cross-linked chitosan beads. Chemosphere 50(8), 1095-1105.
Chow CWK, Fabris R and Drikas M (2004) A new rapid fractionation technique to characterise natural organic matter for the optimisation of water treatment processes. Journal of Water Supply: Research and Technology – Aqua 53(2), 85-92.
Chow CWK, van Leeuwen JA, Drikas M, Fabris R, Spark KM and Page DW (1999) The impact of the character of natural organic matter in conventional treatment with alum. Water Science and Technology 40(9), 97-104.
Divakaran R and Pillai VNS (2001) Flocculation of kaolinite suspensions in water by chitosan. Water Research 35(16), 3904-3908.
Divakaran R and Pillai VNS (2002) Flocculation of river silt using chitosan. Water Research 36, 2414-2418.
Drikas M, Chow CWK and Cook D (2003) The impact of recalcitrant organic character on disinfection stability, trihalomethane formation and bacterial regrowth: An evaluation of magnetic ion exchange resin (MIEX) and alum coagulation. Journal of Water Supply: Research and Technology – Aqua 52(7), 475-487.
Edwards M (1997) Predicting DOC removal during enhanced coagulation. Journal of the American Water Works Association 89(5), 78-89.
Eikebrokk B and Saltnes T (2002) NOM removal from drinking water by chitosan coagulation and filtration through lightweight expanded clay aggregate filters. Journal of Water Supply: Research and Technology – Aqua 51(6), 323-332
Fabris R, Chow C and Drikas M (2003) The impact of coagulant type on NOM removal. 20th convention of the AWA. Proceedings. 6-10 April 2003, Perth, Australia.
Gao BY, Hahn HH and Hoffmann E (2002a) Evaluation of aluminum-silicate polymer composite as a coagulant for water treatment. Water Research 36 3573-3581.
Gao B, Yue Q and Miao J (2002b) Evaluation of polyaluminium ferric chloride (PAFC) as a composite coagulant for water and wastewater treatment. Water Science and Technology 47(1), 127-132.
Gregor JE, Nokes CJ and Fenton E (1997) Optimising natural organic matter removal from low turbidity waters by controlled pH adjustment of aluminium coagulation. Water Research 31(12), 2949-2958.
Gregory J and Dupont V (2001) Properties of flocs produced by water treatment coagulants. Water Science and Technology 44(10), 231-236.
Gregory J and Rossi L (2001) Dynamic testing of water treatment coagulants. Water Science and Technology: Water Supply 1(4), 65-72.
DEVELOPMENT OF COMBINED TREATMENT PROCESSES FOR THE REMOVAL OF RECALCITRANT ORGANIC MATTER
76
Huang C, Chen S and Pan JR (2000) Optimal condition for modification of chitosan: A biopolymer for coagulation of colloidal particles. Water Research 34(3), 1057-1062.
Jacangelo JG, DeMarco J, Owen DM and Randtke SJ (1995) Selected processes for removing NOM: an overview. Journal of the American Water Works Association 87(1), 64-77.
Jeon C and Höll WH (2003) Chemical modification of chitosan and equilibrium study for mercury ion removal. Water Research 37(19), 4770-4780.
Jiang J-Q, Graham NJD and Harward C (1996) Coagulation of upland coloured water with polyferric sulphate compared to conventional coagulants. Journal of Water Supply: Research and Technology – AQUA 45(3), 143-154.
Jiang J-Q and Graham NJD (1998a) Pre-polymerised inorganic coagulants and phosphorus removal by coagulation - A review. Water SA 24(3), 237-244.
Jiang J-Q and Graham NJD (1998b) Observations of the comparative hydrolysis/precipitation behavior of polyferric sulphate and ferric sulphate. Water Research 32(3), 930-935.
Kavanaugh MC (1978) Modified coagulation for improved removal of trihalomethane precursors. Journal of the American Water Works Association 70(11), 613-620.
McGregor S (2002) Pass for P.A.S.S. on OH&S and treatment. Water Works, Dec. 2002, 12-15. Pan JR, Huang C, Chen S and Chung Y-C (1999) Evaluation of a modified chitosan biopolymer for
coagulation of colloidal particles. Colloids and Surfaces A: Physicochemical and Engineering Aspects 147, 359-364.
Rae IB and Gibb SW (2003) Removal of metals from aquaous solutions using natural chitinous materials. Water Science and Technology 47(1), 189-196.
Randtke SJ (1988) Organic contaminant removal by coagulation and related process combinations Journal of the American Water Works Association 80(5), 40-56.
Standard Methods For The Examination of Water and Wastewater (1998) 20th Edition, Method 4500-Cl, American Public Health Association/ American Water Works Association/ Water Environment Federation, Washington, DC.
van Leeuwen JA, Chow C, Fabris R, Drikas M and Spark K (1999) Enhanced coagulation for dissolved organic carbon removal in conventional treatment with alum. 18th Federal Convention of the AWWA. Proceedings. 11-14th April, Adelaide, Australia.
van Leeuwen J, Chow C, Fabris R, Withers N, Page D and Drikas M (2002) Application of a fractionation technique for better understanding of the removal of natural organic matter by alum coagulation. Water Science & Technology: Water Supply 2(5), 427-433.
Volk C, Bell K, Ibrahim E, Verges D, Amy G and Lechevallier M (2000) Impact of enhanced and optimised coagulation on removal of organic matter and it's biodegradable fraction in drinking water. Water Research 34(12), 3247-3257.
Wang D and Tang H (2001) Modified inorganic polymer flocculant - PFSi: Its preparation, characterisation and coagulation behaviour. Water Research 35(14), 3418-3428.
White MC, Thompson JD, Harrington GW and Singer PC (1997) Evaluating criteria for enhanced coagulation compliance. Journal of the American Water Works Association 89(5), 64-77.
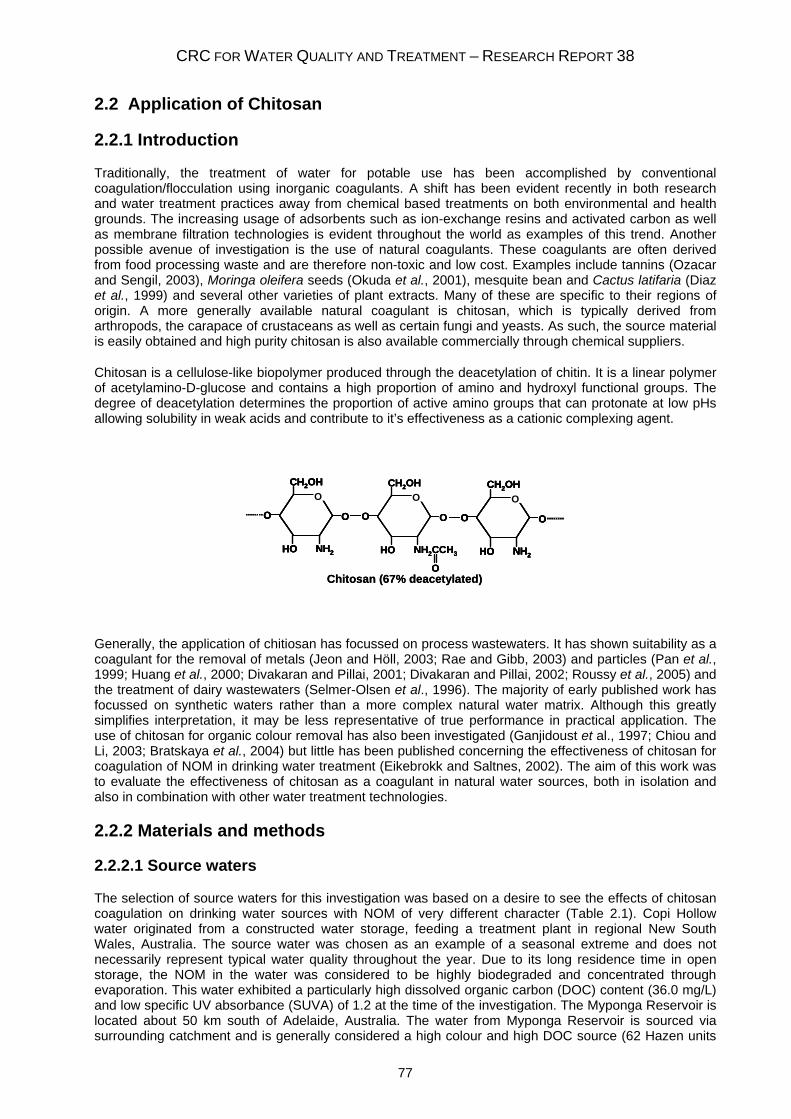
CRC FOR WATER QUALITY AND TREATMENT – RESEARCH REPORT 38
77
2.2 Application of Chitosan
2.2.1 Introduction
Traditionally, the treatment of water for potable use has been accomplished by conventional coagulation/flocculation using inorganic coagulants. A shift has been evident recently in both research and water treatment practices away from chemical based treatments on both environmental and health grounds. The increasing usage of adsorbents such as ion-exchange resins and activated carbon as well as membrane filtration technologies is evident throughout the world as examples of this trend. Another possible avenue of investigation is the use of natural coagulants. These coagulants are often derived from food processing waste and are therefore non-toxic and low cost. Examples include tannins (Ozacar and Sengil, 2003), Moringa oleifera seeds (Okuda et al., 2001), mesquite bean and Cactus latifaria (Diaz et al., 1999) and several other varieties of plant extracts. Many of these are specific to their regions of origin. A more generally available natural coagulant is chitosan, which is typically derived from arthropods, the carapace of crustaceans as well as certain fungi and yeasts. As such, the source material is easily obtained and high purity chitosan is also available commercially through chemical suppliers.
Chitosan is a cellulose-like biopolymer produced through the deacetylation of chitin. It is a linear polymer of acetylamino-D-glucose and contains a high proportion of amino and hydroxyl functional groups. The degree of deacetylation determines the proportion of active amino groups that can protonate at low pHs allowing solubility in weak acids and contribute to it’s effectiveness as a cationic complexing agent.
O O
HO
CH2OH
NH2
O
O O
HO
CH2OH
NH2CCH3
O
O O
HO
CH2OH
NH2
O
OChitosan (67% deacetylated)
O O
HO
CH2OH
NH2
O
O O
HO
CH2OH
NH2CCH3
O
O O
HO
CH2OH
NH2
O
O
O O
HO
CH2OH
NH2
O
O O
HO
CH2OH
NH2
O
O O
HO
CH2OH
NH2CCH3
O
O O
HO
CH2OH
NH2
O
O O
HO
CH2OH
NH2
O
OChitosan (67% deacetylated)
Generally, the application of chitiosan has focussed on process wastewaters. It has shown suitability as a coagulant for the removal of metals (Jeon and Höll, 2003; Rae and Gibb, 2003) and particles (Pan et al., 1999; Huang et al., 2000; Divakaran and Pillai, 2001; Divakaran and Pillai, 2002; Roussy et al., 2005) and the treatment of dairy wastewaters (Selmer-Olsen et al., 1996). The majority of early published work has focussed on synthetic waters rather than a more complex natural water matrix. Although this greatly simplifies interpretation, it may be less representative of true performance in practical application. The use of chitosan for organic colour removal has also been investigated (Ganjidoust et al., 1997; Chiou and Li, 2003; Bratskaya et al., 2004) but little has been published concerning the effectiveness of chitosan for coagulation of NOM in drinking water treatment (Eikebrokk and Saltnes, 2002). The aim of this work was to evaluate the effectiveness of chitosan as a coagulant in natural water sources, both in isolation and also in combination with other water treatment technologies.
2.2.2 Materials and methods
2.2.2.1 Source waters
The selection of source waters for this investigation was based on a desire to see the effects of chitosan coagulation on drinking water sources with NOM of very different character (Table 2.1). Copi Hollow water originated from a constructed water storage, feeding a treatment plant in regional New South Wales, Australia. The source water was chosen as an example of a seasonal extreme and does not necessarily represent typical water quality throughout the year. Due to its long residence time in open storage, the NOM in the water was considered to be highly biodegraded and concentrated through evaporation. This water exhibited a particularly high dissolved organic carbon (DOC) content (36.0 mg/L) and low specific UV absorbance (SUVA) of 1.2 at the time of the investigation. The Myponga Reservoir is located about 50 km south of Adelaide, Australia. The water from Myponga Reservoir is sourced via surrounding catchment and is generally considered a high colour and high DOC source (62 Hazen units
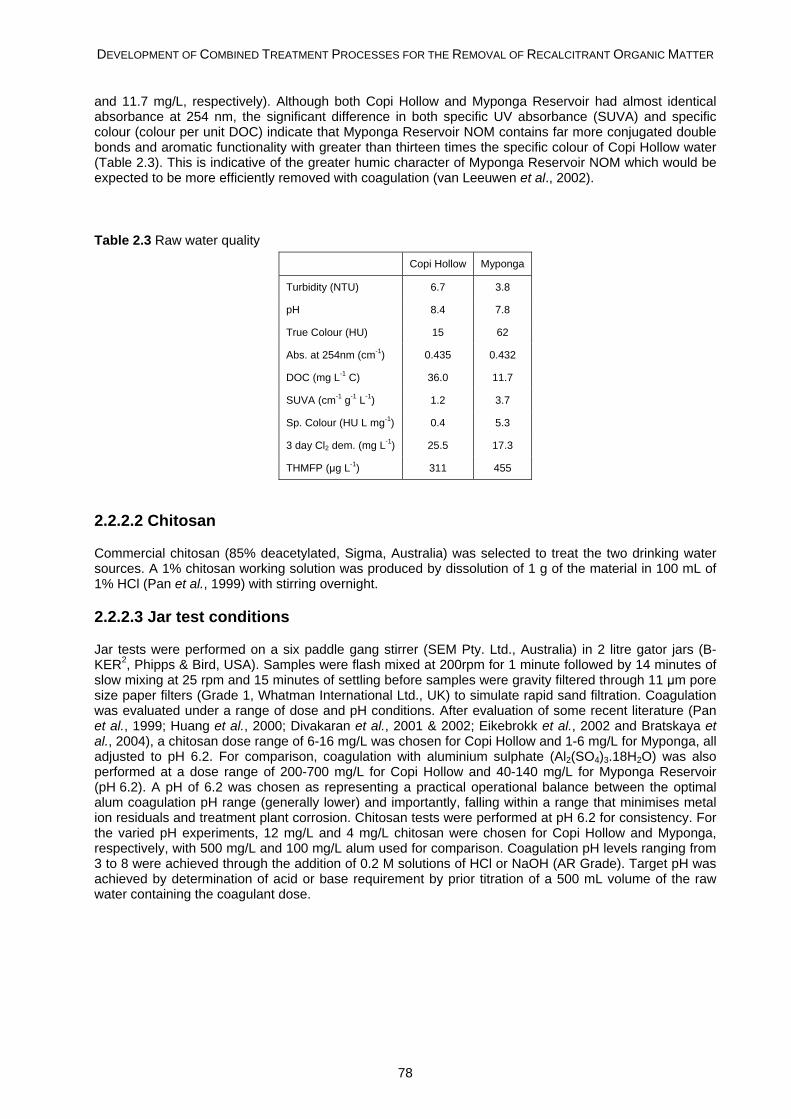
DEVELOPMENT OF COMBINED TREATMENT PROCESSES FOR THE REMOVAL OF RECALCITRANT ORGANIC MATTER
78
and 11.7 mg/L, respectively). Although both Copi Hollow and Myponga Reservoir had almost identical absorbance at 254 nm, the significant difference in both specific UV absorbance (SUVA) and specific colour (colour per unit DOC) indicate that Myponga Reservoir NOM contains far more conjugated double bonds and aromatic functionality with greater than thirteen times the specific colour of Copi Hollow water (Table 2.3). This is indicative of the greater humic character of Myponga Reservoir NOM which would be expected to be more efficiently removed with coagulation (van Leeuwen et al., 2002).
Table 2.3 Raw water quality
Copi Hollow Myponga
Turbidity (NTU) 6.7 3.8
pH 8.4 7.8
True Colour (HU) 15 62
Abs. at 254nm (cm-1) 0.435 0.432
DOC (mg L-1 C) 36.0 11.7
SUVA (cm-1 g-1 L-1) 1.2 3.7
Sp. Colour (HU L mg-1) 0.4 5.3
3 day Cl2 dem. (mg L-1) 25.5 17.3
THMFP (μg L-1) 311 455
2.2.2.2 Chitosan
Commercial chitosan (85% deacetylated, Sigma, Australia) was selected to treat the two drinking water sources. A 1% chitosan working solution was produced by dissolution of 1 g of the material in 100 mL of 1% HCl (Pan et al., 1999) with stirring overnight.
2.2.2.3 Jar test conditions
Jar tests were performed on a six paddle gang stirrer (SEM Pty. Ltd., Australia) in 2 litre gator jars (B-KER2, Phipps & Bird, USA). Samples were flash mixed at 200rpm for 1 minute followed by 14 minutes of slow mixing at 25 rpm and 15 minutes of settling before samples were gravity filtered through 11 μm pore size paper filters (Grade 1, Whatman International Ltd., UK) to simulate rapid sand filtration. Coagulation was evaluated under a range of dose and pH conditions. After evaluation of some recent literature (Pan et al., 1999; Huang et al., 2000; Divakaran et al., 2001 & 2002; Eikebrokk et al., 2002 and Bratskaya et al., 2004), a chitosan dose range of 6-16 mg/L was chosen for Copi Hollow and 1-6 mg/L for Myponga, all adjusted to pH 6.2. For comparison, coagulation with aluminium sulphate (Al2(SO4)3.18H2O) was also performed at a dose range of 200-700 mg/L for Copi Hollow and 40-140 mg/L for Myponga Reservoir (pH 6.2). A pH of 6.2 was chosen as representing a practical operational balance between the optimal alum coagulation pH range (generally lower) and importantly, falling within a range that minimises metal ion residuals and treatment plant corrosion. Chitosan tests were performed at pH 6.2 for consistency. For the varied pH experiments, 12 mg/L and 4 mg/L chitosan were chosen for Copi Hollow and Myponga, respectively, with 500 mg/L and 100 mg/L alum used for comparison. Coagulation pH levels ranging from 3 to 8 were achieved through the addition of 0.2 M solutions of HCl or NaOH (AR Grade). Target pH was achieved by determination of acid or base requirement by prior titration of a 500 mL volume of the raw water containing the coagulant dose.
CRC FOR WATER QUALITY AND TREATMENT – RESEARCH REPORT 38
79
2.2.2.4 Combined treatments
The combined treatments protocol was based on a three-step treatment utilising adsorbent technologies and minimal chemical addition. Myponga Reservoir water was treated firstly with 10 mL/L of a magnetic ion exchange resin (MIEX®) by stirring at 100 rpm for 20 minutes in a 2 litre gator jar. Settled water was decanted and contacted with 20 and 60 mg/L of a coal-based, steam-activated powdered activated carbon (PAC) (PICA, Australia) by stirring at 100 rpm for 30 minutes. A 1% chitosan solution was used to dose coagulant at 10 mg/L to flocculate the PAC and also the remaining natural water turbidity.
2.2.2.5 Instrumental analyses
Analysed parameters included turbidity, true colour, UV254, DOC, 72 hour chlorine demand, trihalomethane formation potential (THMFP), rapid fractionation and bacterial regrowth potential (BRP). Turbidity was determined using a Hach 2100AN turbidimeter (Hach, USA) and is expressed in nephelometric turbidity units (NTU). Samples for true colour, UV absorbance and DOC were filtered through 0.45 μm membranes. True colour was measured using a 5cm quartz cell at 456 nm and calibrated against a Platinum/Cobalt standard (Bennett and Drikas, 1993). Absorbance was measured through a 1 cm quartz cell and DOC was measured using a Sievers 820 Portable TOC analyser (Ionics, USA). Chlorine demand was determined by addition of 20-30 mg/L Cl2 to 150 mL of sample and storage at room temperature (20°C) in the dark. Residual chlorine was titrated after 72 hours by the DPD ferrous titrimetric method (4500-Cl [F], Standard methods, 1998) and the demand calculated by the difference. THMFP was determined by addition of 20-30 mg/L Cl2 to 40 mL of pre-warmed (30°C) sample in a brown glass bottle with no headspace. Reaction was allowed for 4 hours at 30°C in a covered water bath before quenching the residual chlorine with excess ascorbic acid. THM concentrations were determined by purge and trap gas chromatography with electron capture detection. Rapid fractionation technique separates DOC into four fractions based on character and molecular weight. Fractions produced are defined as very hydrophobic acids (VHA), slightly hydrophobic acids (SHA), charged hydrophilics (CHA) and neutral hydrophilics (NEU). Specifics of the technique and definitions have been described elsewhere (Chow et al., 2004). BRP was determined by a turbidimetric technique. The method involves the inoculation of a mixed biocenosis into a sterile filtered sample and the monitoring of the bacterial growth over an extended period of time. The increase of biomass is monitored by turbidity measurement (12° forward scattering) every 30 minutes. To relate the change in turbidity to an acetate carbon equivalent (ACE), it was divided by a previously determined calibration factor derived from over 120 spiked acetate standards.
2.2.3 Results and Discussion
2.2.3.1 Chitosan coagulation evaluation
Being a natural bio-polymer, chitosan differs somewhat in both material handling and ease of dosing, compared to traditional inorganic coagulants. The difficulty of dissolution in aqueous media, the viscosity of the working solutions and typical dose requirement is more similar in many ways to polymer flocculant aids. It is important to note that in all jar testing experiments it was observed that the kinetics for floc formation with chitosan were significantly slower than experienced with inorganic coagulants under the same temperature conditions (≅20°C). While inorganic coagulants generally show initiation of floc formation during the rapid mixing phase (<1 min.), chitosan suspensions did not reach a stable size and density until well into the slow mixing phase (>10 mins.). This behaviour is quite possibly a function of both the size of the chitosan macromolecules in solution, and hence their mobility during mixing, and also the relative solubility of the resulting chitosan-NOM complex. For this reason, care must be taken in application to allow sufficient time for coagulation to occur and precludes the application of chitosan to treatment processes with limited mixing time such as dissolved-air flotation/filtration (DAFF) or coagulation/direct filtration.
MIEX® IS A REGISTERED TRADEMARK OF ORICA AUSTRALIA PTY LTD
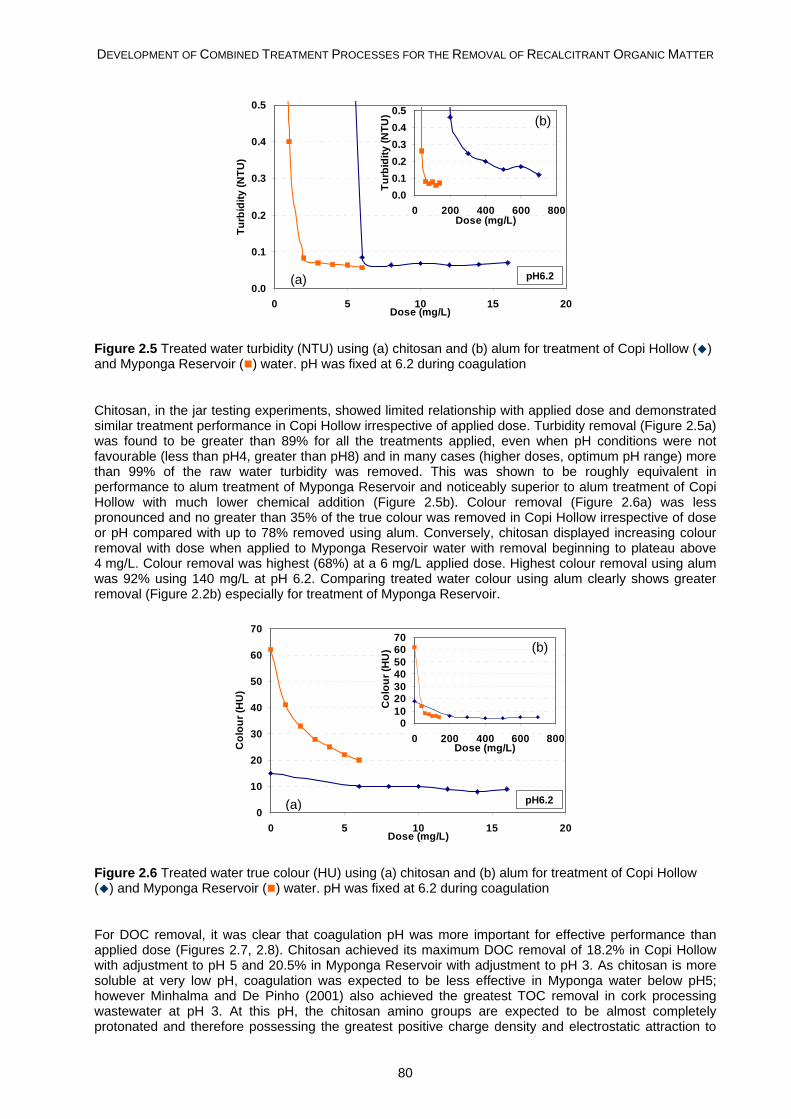
DEVELOPMENT OF COMBINED TREATMENT PROCESSES FOR THE REMOVAL OF RECALCITRANT ORGANIC MATTER
80
0.0
0.1
0.2
0.3
0.4
0.5
0 5 10 15 20Dose (mg/L)
Turb
idity
(NTU
)
0.00.10.20.30.40.5
0 200 400 600 800Dose (mg/L)
Turb
idity
(NTU
)
pH6.20.0
0.1
0.2
0.3
0.4
0.5
0 5 10 15 20Dose (mg/L)
Turb
idity
(NTU
)
0.00.10.20.30.40.5
0 200 400 600 800Dose (mg/L)
Turb
idity
(NTU
)
0.0
0.1
0.2
0.3
0.4
0.5
0 5 10 15 20Dose (mg/L)
Turb
idity
(NTU
)
0.00.10.20.30.40.5
0 200 400 600 800Dose (mg/L)
Turb
idity
(NTU
)
pH6.2
Figure 2.5 Treated water turbidity (NTU) using (a) chitosan and (b) alum for treatment of Copi Hollow ( ) and Myponga Reservoir ( ) water. pH was fixed at 6.2 during coagulation
Chitosan, in the jar testing experiments, showed limited relationship with applied dose and demonstrated similar treatment performance in Copi Hollow irrespective of applied dose. Turbidity removal (Figure 2.5a) was found to be greater than 89% for all the treatments applied, even when pH conditions were not favourable (less than pH4, greater than pH8) and in many cases (higher doses, optimum pH range) more than 99% of the raw water turbidity was removed. This was shown to be roughly equivalent in performance to alum treatment of Myponga Reservoir and noticeably superior to alum treatment of Copi Hollow with much lower chemical addition (Figure 2.5b). Colour removal (Figure 2.6a) was less pronounced and no greater than 35% of the true colour was removed in Copi Hollow irrespective of dose or pH compared with up to 78% removed using alum. Conversely, chitosan displayed increasing colour removal with dose when applied to Myponga Reservoir water with removal beginning to plateau above 4 mg/L. Colour removal was highest (68%) at a 6 mg/L applied dose. Highest colour removal using alum was 92% using 140 mg/L at pH 6.2. Comparing treated water colour using alum clearly shows greater removal (Figure 2.2b) especially for treatment of Myponga Reservoir.
0
10
20
30
40
50
60
70
0 5 10 15 20Dose (mg/L)
Col
our (
HU
)
010203040506070
0 200 400 600 800Dose (mg/L)
Col
our (
HU
)
pH6.20
10
20
30
40
50
60
70
0 5 10 15 20Dose (mg/L)
Col
our (
HU
)
010203040506070
0 200 400 600 800Dose (mg/L)
Col
our (
HU
)
0
10
20
30
40
50
60
70
0 5 10 15 20Dose (mg/L)
Col
our (
HU
)
010203040506070
0 200 400 600 800Dose (mg/L)
Col
our (
HU
)
pH6.2
Figure 2.6 Treated water true colour (HU) using (a) chitosan and (b) alum for treatment of Copi Hollow ( ) and Myponga Reservoir ( ) water. pH was fixed at 6.2 during coagulation
For DOC removal, it was clear that coagulation pH was more important for effective performance than applied dose (Figures 2.7, 2.8). Chitosan achieved its maximum DOC removal of 18.2% in Copi Hollow with adjustment to pH 5 and 20.5% in Myponga Reservoir with adjustment to pH 3. As chitosan is more soluble at very low pH, coagulation was expected to be less effective in Myponga water below pH5; however Minhalma and De Pinho (2001) also achieved the greatest TOC removal in cork processing wastewater at pH 3. At this pH, the chitosan amino groups are expected to be almost completely protonated and therefore possessing the greatest positive charge density and electrostatic attraction to
(a)
(b)
(a)
(b)
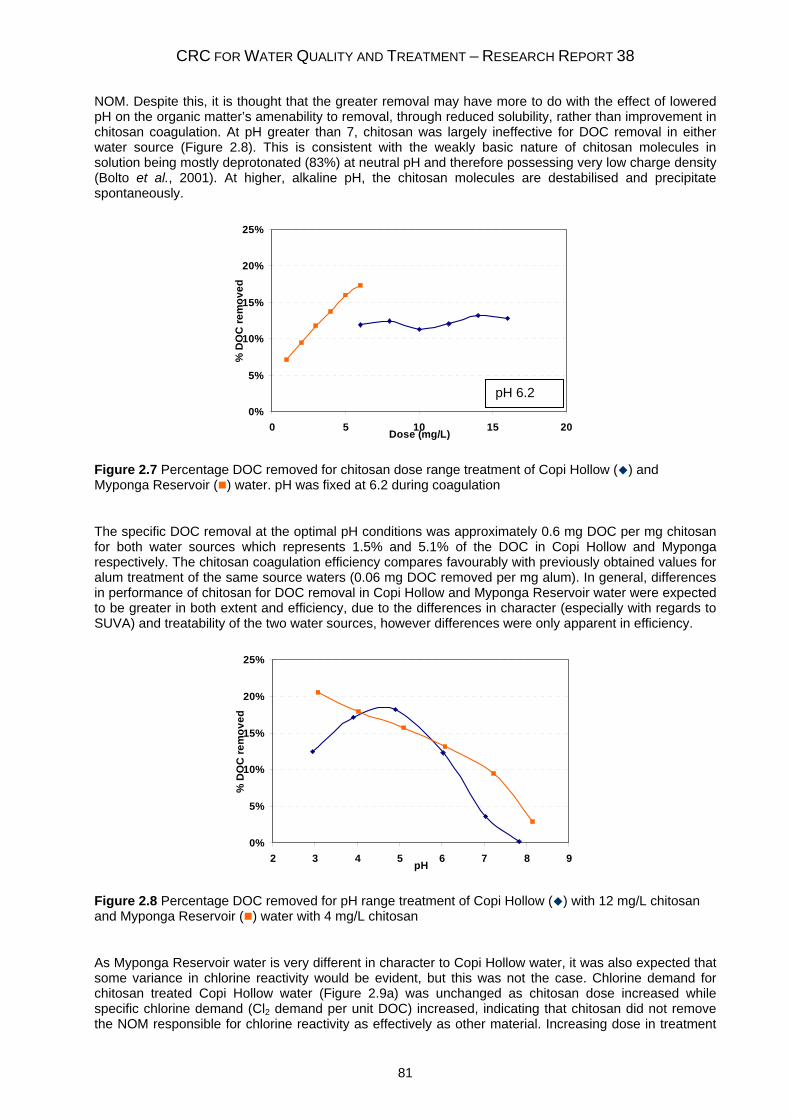
CRC FOR WATER QUALITY AND TREATMENT – RESEARCH REPORT 38
81
NOM. Despite this, it is thought that the greater removal may have more to do with the effect of lowered pH on the organic matter’s amenability to removal, through reduced solubility, rather than improvement in chitosan coagulation. At pH greater than 7, chitosan was largely ineffective for DOC removal in either water source (Figure 2.8). This is consistent with the weakly basic nature of chitosan molecules in solution being mostly deprotonated (83%) at neutral pH and therefore possessing very low charge density (Bolto et al., 2001). At higher, alkaline pH, the chitosan molecules are destabilised and precipitate spontaneously.
0%
5%
10%
15%
20%
25%
0 5 10 15 20Dose (mg/L)
% D
OC
rem
oved
Figure 2.7 Percentage DOC removed for chitosan dose range treatment of Copi Hollow ( ) and Myponga Reservoir ( ) water. pH was fixed at 6.2 during coagulation
The specific DOC removal at the optimal pH conditions was approximately 0.6 mg DOC per mg chitosan for both water sources which represents 1.5% and 5.1% of the DOC in Copi Hollow and Myponga respectively. The chitosan coagulation efficiency compares favourably with previously obtained values for alum treatment of the same source waters (0.06 mg DOC removed per mg alum). In general, differences in performance of chitosan for DOC removal in Copi Hollow and Myponga Reservoir water were expected to be greater in both extent and efficiency, due to the differences in character (especially with regards to SUVA) and treatability of the two water sources, however differences were only apparent in efficiency.
0%
5%
10%
15%
20%
25%
2 3 4 5 6 7 8 9pH
% D
OC
rem
oved
Figure 2.8 Percentage DOC removed for pH range treatment of Copi Hollow ( ) with 12 mg/L chitosan and Myponga Reservoir ( ) water with 4 mg/L chitosan
As Myponga Reservoir water is very different in character to Copi Hollow water, it was also expected that some variance in chlorine reactivity would be evident, but this was not the case. Chlorine demand for chitosan treated Copi Hollow water (Figure 2.9a) was unchanged as chitosan dose increased while specific chlorine demand (Cl2 demand per unit DOC) increased, indicating that chitosan did not remove the NOM responsible for chlorine reactivity as effectively as other material. Increasing dose in treatment
pH 6.2
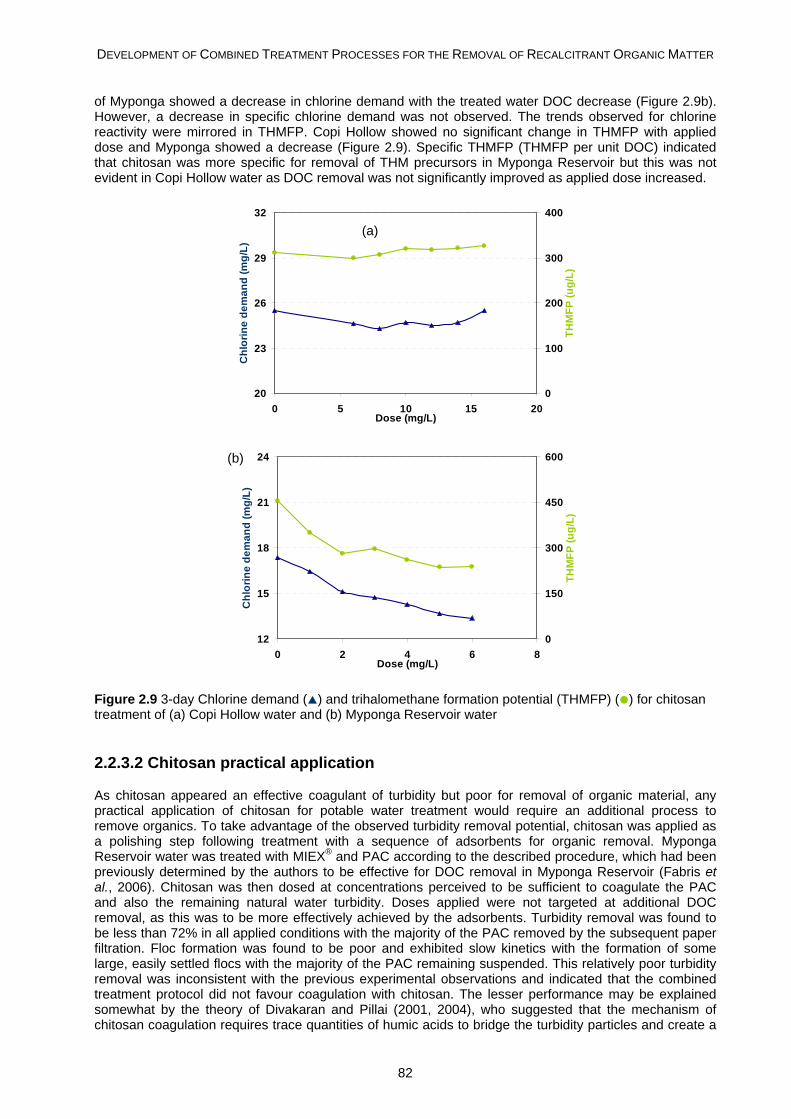
DEVELOPMENT OF COMBINED TREATMENT PROCESSES FOR THE REMOVAL OF RECALCITRANT ORGANIC MATTER
82
of Myponga showed a decrease in chlorine demand with the treated water DOC decrease (Figure 2.9b). However, a decrease in specific chlorine demand was not observed. The trends observed for chlorine reactivity were mirrored in THMFP. Copi Hollow showed no significant change in THMFP with applied dose and Myponga showed a decrease (Figure 2.9). Specific THMFP (THMFP per unit DOC) indicated that chitosan was more specific for removal of THM precursors in Myponga Reservoir but this was not evident in Copi Hollow water as DOC removal was not significantly improved as applied dose increased.
20
23
26
29
32
0 5 10 15 20Dose (mg/L)
Chl
orin
e de
man
d (m
g/L)
0
100
200
300
400
THM
FP (u
g/L)
12
15
18
21
24
0 2 4 6 8Dose (mg/L)
Chl
orin
e de
man
d (m
g/L)
0
150
300
450
600
THM
FP (u
g/L)
Figure 2.9 3-day Chlorine demand ( ) and trihalomethane formation potential (THMFP) ( ) for chitosan treatment of (a) Copi Hollow water and (b) Myponga Reservoir water
2.2.3.2 Chitosan practical application
As chitosan appeared an effective coagulant of turbidity but poor for removal of organic material, any practical application of chitosan for potable water treatment would require an additional process to remove organics. To take advantage of the observed turbidity removal potential, chitosan was applied as a polishing step following treatment with a sequence of adsorbents for organic removal. Myponga Reservoir water was treated with MIEX® and PAC according to the described procedure, which had been previously determined by the authors to be effective for DOC removal in Myponga Reservoir (Fabris et al., 2006). Chitosan was then dosed at concentrations perceived to be sufficient to coagulate the PAC and also the remaining natural water turbidity. Doses applied were not targeted at additional DOC removal, as this was to be more effectively achieved by the adsorbents. Turbidity removal was found to be less than 72% in all applied conditions with the majority of the PAC removed by the subsequent paper filtration. Floc formation was found to be poor and exhibited slow kinetics with the formation of some large, easily settled flocs with the majority of the PAC remaining suspended. This relatively poor turbidity removal was inconsistent with the previous experimental observations and indicated that the combined treatment protocol did not favour coagulation with chitosan. The lesser performance may be explained somewhat by the theory of Divakaran and Pillai (2001, 2004), who suggested that the mechanism of chitosan coagulation requires trace quantities of humic acids to bridge the turbidity particles and create a
(a)
(b)
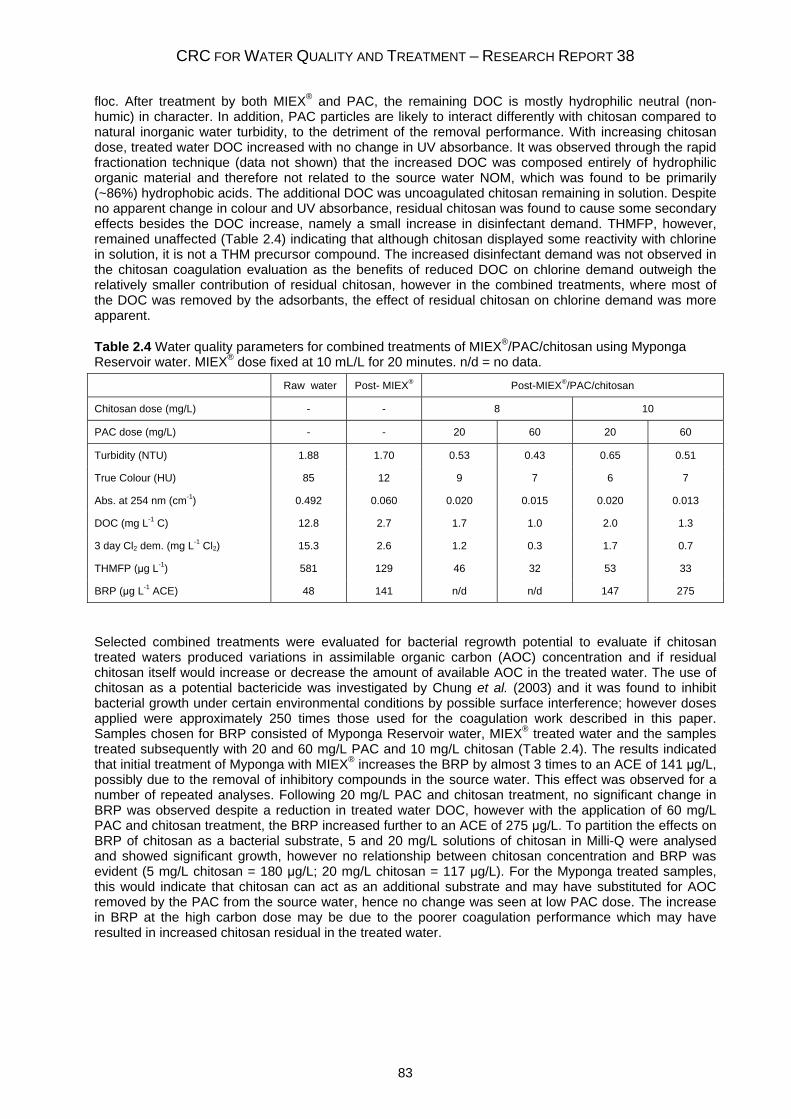
CRC FOR WATER QUALITY AND TREATMENT – RESEARCH REPORT 38
83
floc. After treatment by both MIEX® and PAC, the remaining DOC is mostly hydrophilic neutral (non-humic) in character. In addition, PAC particles are likely to interact differently with chitosan compared to natural inorganic water turbidity, to the detriment of the removal performance. With increasing chitosan dose, treated water DOC increased with no change in UV absorbance. It was observed through the rapid fractionation technique (data not shown) that the increased DOC was composed entirely of hydrophilic organic material and therefore not related to the source water NOM, which was found to be primarily (~86%) hydrophobic acids. The additional DOC was uncoagulated chitosan remaining in solution. Despite no apparent change in colour and UV absorbance, residual chitosan was found to cause some secondary effects besides the DOC increase, namely a small increase in disinfectant demand. THMFP, however, remained unaffected (Table 2.4) indicating that although chitosan displayed some reactivity with chlorine in solution, it is not a THM precursor compound. The increased disinfectant demand was not observed in the chitosan coagulation evaluation as the benefits of reduced DOC on chlorine demand outweigh the relatively smaller contribution of residual chitosan, however in the combined treatments, where most of the DOC was removed by the adsorbants, the effect of residual chitosan on chlorine demand was more apparent.
Table 2.4 Water quality parameters for combined treatments of MIEX®/PAC/chitosan using Myponga Reservoir water. MIEX® dose fixed at 10 mL/L for 20 minutes. n/d = no data.
Raw water Post- MIEX® Post-MIEX®/PAC/chitosan
Chitosan dose (mg/L) - - 8 10
PAC dose (mg/L) - - 20 60 20 60
Turbidity (NTU) 1.88 1.70 0.53 0.43 0.65 0.51
True Colour (HU) 85 12 9 7 6 7
Abs. at 254 nm (cm-1) 0.492 0.060 0.020 0.015 0.020 0.013
DOC (mg L-1 C) 12.8 2.7 1.7 1.0 2.0 1.3
3 day Cl2 dem. (mg L-1 Cl2) 15.3 2.6 1.2 0.3 1.7 0.7
THMFP (μg L-1) 581 129 46 32 53 33
BRP (μg L-1 ACE) 48 141 n/d n/d 147 275
Selected combined treatments were evaluated for bacterial regrowth potential to evaluate if chitosan treated waters produced variations in assimilable organic carbon (AOC) concentration and if residual chitosan itself would increase or decrease the amount of available AOC in the treated water. The use of chitosan as a potential bactericide was investigated by Chung et al. (2003) and it was found to inhibit bacterial growth under certain environmental conditions by possible surface interference; however doses applied were approximately 250 times those used for the coagulation work described in this paper. Samples chosen for BRP consisted of Myponga Reservoir water, MIEX® treated water and the samples treated subsequently with 20 and 60 mg/L PAC and 10 mg/L chitosan (Table 2.4). The results indicated that initial treatment of Myponga with MIEX® increases the BRP by almost 3 times to an ACE of 141 μg/L, possibly due to the removal of inhibitory compounds in the source water. This effect was observed for a number of repeated analyses. Following 20 mg/L PAC and chitosan treatment, no significant change in BRP was observed despite a reduction in treated water DOC, however with the application of 60 mg/L PAC and chitosan treatment, the BRP increased further to an ACE of 275 μg/L. To partition the effects on BRP of chitosan as a bacterial substrate, 5 and 20 mg/L solutions of chitosan in Milli-Q were analysed and showed significant growth, however no relationship between chitosan concentration and BRP was evident (5 mg/L chitosan = 180 μg/L; 20 mg/L chitosan = 117 μg/L). For the Myponga treated samples, this would indicate that chitosan can act as an additional substrate and may have substituted for AOC removed by the PAC from the source water, hence no change was seen at low PAC dose. The increase in BRP at the high carbon dose may be due to the poorer coagulation performance which may have resulted in increased chitosan residual in the treated water.
DEVELOPMENT OF COMBINED TREATMENT PROCESSES FOR THE REMOVAL OF RECALCITRANT ORGANIC MATTER
84
2.2.4 Conclusion
Chitosan has several advantages for application to water treatment such as natural, low cost source material and excellent turbidity removal at low applied doses when compared to inorganic coagulants. Observed slow flocculation/coagulation kinetics would however, appear to preclude the application of chitosan where treatment plant residence times are short or in rapid treatments such as DAFF or coagulation/direct filtration. Chitosan was not found to be particularly efficient for DOC removal in the water sources tested when applied as the sole treatment step, however excellent turbidity removal made it worthy of further consideration as part of a multi-step treatment process. In very well treated waters, as shown in the combined treatment protocol described above, the effective removal of most humic substances prior to coagulation may have hindered the ability of chitosan to form flocs in suspension. A combination of adsorbent treatment technologies, incorporating chitosan coagulation, resulted in slightly increased disinfectant demand and BRP, however this did not adversely affect treated water THM concentration.
Overall this work has established that while chitosan is very effective for particle removal at doses far below those required for equivalent performance by inorganic coagulants, there is significant work required to find appropriate strategies to incorporate the beneficial properties of chitosan to treatment processes for drinking water treatment. As such, it is suggested that chitosan treatment may be regarded primarily as a clarification treatment and any resulting DOC removal considered a beneficial side-effect.
2.2.5 References
APHA, AWWA and WEF (1998) Standard Methods For The Examination of Water and Waste Water, 20th Edition, Method 4500-Cl, American Public Health Association, Washington, DC.
Bennett L.E. and Drikas M. (1993) The evaluation of colour in natural waters. Water Research 27(7), 1209-1218.
Bolto B, Dixon D, Eldridge R and King S (2001) Cationic polymer and clay or metal oxide combinations for natural organic matter removal. Water Research 35(11), 2669-2676.
Bratskaya S, Schwarz S and Chervonetsky D (2004) Comparative study of humic acids flocculation with chitosan hydrochloride and chitosan glutamate. Water Research 38(12), 2955-2961.
Chiou MS and Li HY (2003) Adsorption behaviour of reactive dye in aqueous solution an chemical cross-linked chitosan beads. Chemosphere 50(8), 1095-1105.
Chow CWK, Fabris R and Drikas M (2004) A new rapid fractionation technique to characterise natural organic matter for the optimisation of water treatment processes. Journal of Water Supply: Research and Technology – AQUA 53(2), 85-92.
Chung YC, Wang HL, Chen YM and Li SL (2003) Effect of abiotic factors on the antibacterial activity of chitosan against waterbourne pathogens. Bioresource Technology 88(3), 179-184.
Diaz A, Rincon N, Escorihuela A, Fernandez N, Chachin E and Forster CF (1999) A preliminary evaluation of turbidity removal by natural coagulants indigenous to Venezuela. Process Biochemistry 35(3-4), 391-395.
Divakaran R and Pillai VNS (2001) Flocculation of kaolinite suspensions in water by chitosan. Water Research 35(16), 3904-3908.
Divakaran R and Pillai VNS (2002) Flocculation of river silt using chitosan. Water Research 36(9), 2414-2418.
Divakaran R and Pillai VNS (2004) Mechanism of kaolinite and titanium dioxide flocculation using chitosan – assistance by fulvic acids? Water Research 38(8), 2135-2143.
Eikebrokk B and Saltnes T (2002) NOM Removal from drinking water by chitosan coagulation and filtration through lightweight expanded clay aggregate filters. Journal of Water Supply: Research and Technology – AQUA 51(6), 323-332.
Fabris R, Chow CWK and Drikas M (2006) Combined treatments for enhanced natural organic matter (NOM) removal. Proceedings of Enviro 06 Conference, Melbourne, Australia, 9-11th May 2006, paper e6174, CD-ROM and www.enviroaust.net/e6/papers/e6174.pdf
Ganjidoust H, Tatsumi K, Yamagishi T and Gholian RN (1997) Effect of synthetic and natural coagulant on lignin removal from pulp and paper wastewater. Water Science and Technology 35(2-3), 291-296.
Huang C, Chen S and Pan JR (2000) Optimal condition for modification of chitosan: A biopolymer for coagulation of colloidal particles. Water Research 34(3), 1057-1062.
CRC FOR WATER QUALITY AND TREATMENT – RESEARCH REPORT 38
85
Jeon C and Höll WH (2003) Chemical modification of chitosan and equilibrium study for mercury ion removal. Water Research 37(19), 4770-4780.
Minhalma M and De Pinho MN (2001) Flocculation/flotation/ultrafiltration integrated process for the treatment of cork processing wastewaters. Environmental Science and Technology 35(24), 4916-4921.
Okuda T, Baes AU, Nishijima W, Okada M (2001) Isolation and characterization of coagulant extracted from Moringa oleifera seed by salt solution. Water Research 35(2), 405-410.
Ozacar M and Sengil IA (2003) Evaluation of tannin biopolymer as a coagulant aid for coagulation of colloidal particles. Colloids and Surfaces A: Physicochemical and Engineering Aspects 229(1-3), 85-96.
Pan JR, Huang C, Chen S and Chung YC (1999) Evaluation of a modified chitosan biopolymer for coagulation of colloidal particles. Colloids and Surfaces A: Physicochemical and Engineering Aspects 147(3), 359-364.
Rae IB and Gibb SW (2003) Removal of metals from aqueous solutions using natural chitinous materials. Water Science and Technology 47(10), 189-196.
Roussy J, Van Vooren M, Dempsey BA and Guibal E (2005) Influence of chitosan characteristics on the coagulation and the flocculation of bentonite suspensions. Water Research 39(14), 3247-3258
Selmer-Olsen E, Ratnaweera H.C and Pehrson R (1996) A novel treatment process for dairy wastewater with chitosan produced from shrimp-shell waste. Water Science and Technology 34(11), 33-40.
van Leeuwen J, Chow C, Fabris R, Withers N, Page D and Drikas M (2002) Application of a fractionation technique for better understanding of the removal of natural organic matter by alum coagulation. Water Science and Technology: Water Supply 2(5-6), 427-433.
DEVELOPMENT OF COMBINED TREATMENT PROCESSES FOR THE REMOVAL OF RECALCITRANT ORGANIC MATTER
86
2.3 Application of Activated Carbon3
2.3.1 Introduction
Inorganic metal coagulants have long been used in the treatment of water for drinking purposes for the removal of colour and turbidity. More recently though, the focus in drinking water treatment has moved to include the removal of natural organic matter (NOM). The benefits of improved NOM removal are many and include reduced disinfectant demand, reduced disinfection byproduct formation, and reduced bacterial regrowth in the distribution system. Enhanced coagulation, whereby higher doses of coagulant are applied both with or without pH control, has demonstrated improved removal of NOM (Kavanaugh, 1978, Gregor et al., 1997, White et al., 1997, van Leeuwen et al., 1999). Associated research has shown that in most cases there is a portion of the NOM that cannot be removed by coagulation, regardless of the treatment conditions applied (Randtke et al., 1988, Edwards, 1997, Chow et al., 1999, van Leeuwen et al., 2002). This portion of the organic matter can be referred to as being recalcitrant NOM. Alternative treatment technologies are therefore required for the removal of recalcitrant NOM. These can include adsorption resins, membrane filtration, oxidative processes and activated carbons.
Activated carbon in various forms has become established technology in the water industry for the removal of taste and odour compounds as well as the removal of algal toxins. Significant research has also shown the capacity of activated carbon to adsorb NOM and therefore reduce the treated water dissolved organic carbon (DOC) concentration (Jacangelo et al., 1995, Newcombe et al., 1997a, Cathalifaud et al., 1998, Othman et al., 2000, Maitilainen et al., 2002). This provides further benefits through decreases in required disinfectant and reduced health risk to the consumer due to less formation of disinfection byproducts (DBPs).
Significant challenges are placed on many water treatment plants (WTPs) around Australia that contend with high DOC source waters for potable water treatment which may include seasonal extremes. This is especially true for more remote areas that may have limited access to natural water courses. Traditional water treatment technology (coagulation, flocculation and filtration) is not always sufficient to adequately or effectively treat the water for potable use. While alternative treatment methods would likely be beneficial to treated water quality, in most cases they require modification or replacement of existing infrastructure and do not present realistic short term treatment solutions. The application of powdered activated carbon (PAC), while costly, does not require any change to the operation of the treatment plant and is therefore directly applicable. In this paper, three different powdered activated carbons were applied in combination with alum to treat a specific high DOC source water with a focus on improving NOM removal.
2.3.2 Materials and Methods
2.3.2.1 Water source
The source water originated from a constructed water storage, feeding a treatment plant in country New South Wales, Australia. The source water was chosen as an example of a seasonal extreme and does not necessarily represent typical water quality throughout the year, however due to its recalcitrance to conventional treatment it was considered ideal for a study of this nature. Due to its long residence time in open storage, the NOM in the water was considered to be highly biodegraded and concentrated through evaporation. This water exhibited a particularly high DOC (28.3 mg/L) and low specific UV absorbance (SUVA) of 1.50 at the time of the investigation.
2.3.2.2 Chemicals
Aluminium sulphate stock solution (20,000 mg/L as Al2(SO4)3.18H2O) was prepared by dilution of liquid alum solution (approximately 7.5% as Al2O3) with deionised water (Milli-Q® Gradient, Millipore Corporation, France). Preliminary jar testing indicated that a dose of 500 mg/L of aluminium sulphate (alum) was optimal for DOC removal. Therefore, for the combined process (alum and activated carbon) jar tests, doses of 500 mg/L and 300 mg/L were chosen to evaluate the effects of activated carbon
3 This chapter is based on the following paper: Fabris R., Chow C. and Drikas M. (2004) Practical application of a
combined treatment process for removal of recalcitrant NOM – Alum and PAC. Water Science & Technology: Water Supply 4(4), 89–94.
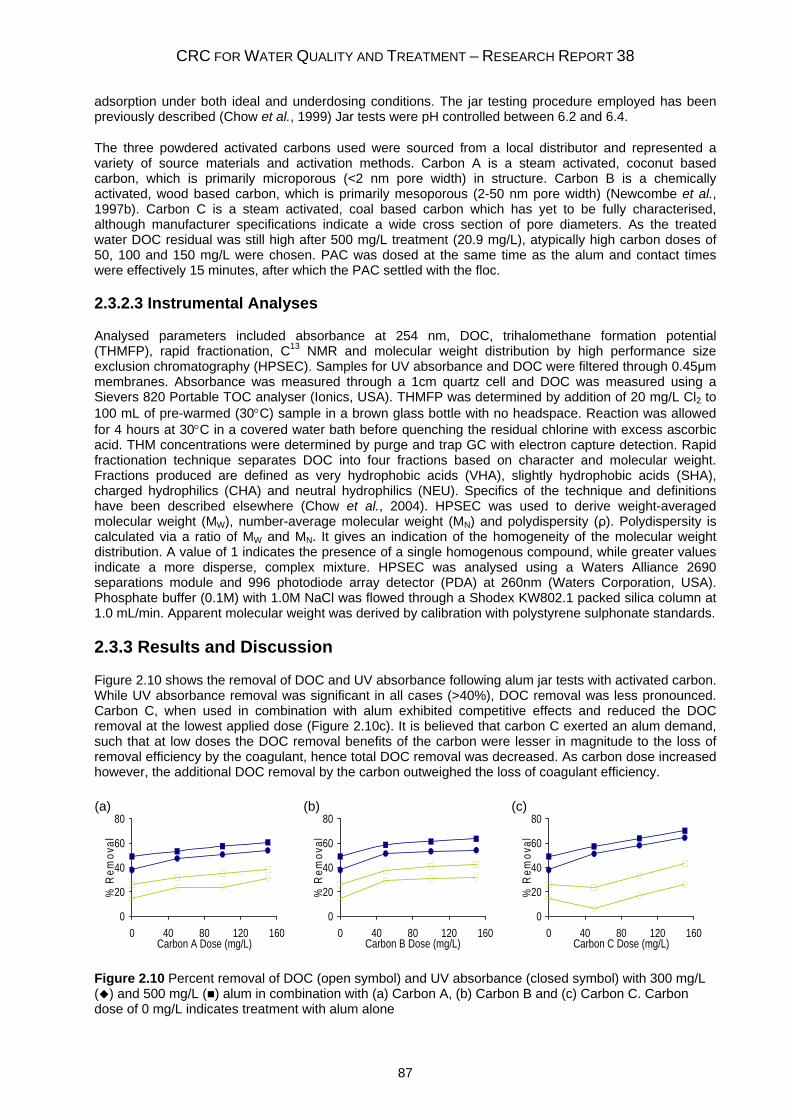
CRC FOR WATER QUALITY AND TREATMENT – RESEARCH REPORT 38
87
adsorption under both ideal and underdosing conditions. The jar testing procedure employed has been previously described (Chow et al., 1999) Jar tests were pH controlled between 6.2 and 6.4.
The three powdered activated carbons used were sourced from a local distributor and represented a variety of source materials and activation methods. Carbon A is a steam activated, coconut based carbon, which is primarily microporous (<2 nm pore width) in structure. Carbon B is a chemically activated, wood based carbon, which is primarily mesoporous (2-50 nm pore width) (Newcombe et al., 1997b). Carbon C is a steam activated, coal based carbon which has yet to be fully characterised, although manufacturer specifications indicate a wide cross section of pore diameters. As the treated water DOC residual was still high after 500 mg/L treatment (20.9 mg/L), atypically high carbon doses of 50, 100 and 150 mg/L were chosen. PAC was dosed at the same time as the alum and contact times were effectively 15 minutes, after which the PAC settled with the floc.
2.3.2.3 Instrumental Analyses
Analysed parameters included absorbance at 254 nm, DOC, trihalomethane formation potential (THMFP), rapid fractionation, C13 NMR and molecular weight distribution by high performance size exclusion chromatography (HPSEC). Samples for UV absorbance and DOC were filtered through 0.45μm membranes. Absorbance was measured through a 1cm quartz cell and DOC was measured using a Sievers 820 Portable TOC analyser (Ionics, USA). THMFP was determined by addition of 20 mg/L Cl2 to 100 mL of pre-warmed (30°C) sample in a brown glass bottle with no headspace. Reaction was allowed for 4 hours at 30°C in a covered water bath before quenching the residual chlorine with excess ascorbic acid. THM concentrations were determined by purge and trap GC with electron capture detection. Rapid fractionation technique separates DOC into four fractions based on character and molecular weight. Fractions produced are defined as very hydrophobic acids (VHA), slightly hydrophobic acids (SHA), charged hydrophilics (CHA) and neutral hydrophilics (NEU). Specifics of the technique and definitions have been described elsewhere (Chow et al., 2004). HPSEC was used to derive weight-averaged molecular weight (MW), number-average molecular weight (MN) and polydispersity (ρ). Polydispersity is calculated via a ratio of MW and MN. It gives an indication of the homogeneity of the molecular weight distribution. A value of 1 indicates the presence of a single homogenous compound, while greater values indicate a more disperse, complex mixture. HPSEC was analysed using a Waters Alliance 2690 separations module and 996 photodiode array detector (PDA) at 260nm (Waters Corporation, USA). Phosphate buffer (0.1M) with 1.0M NaCl was flowed through a Shodex KW802.1 packed silica column at 1.0 mL/min. Apparent molecular weight was derived by calibration with polystyrene sulphonate standards.
2.3.3 Results and Discussion
Figure 2.10 shows the removal of DOC and UV absorbance following alum jar tests with activated carbon. While UV absorbance removal was significant in all cases (>40%), DOC removal was less pronounced. Carbon C, when used in combination with alum exhibited competitive effects and reduced the DOC removal at the lowest applied dose (Figure 2.10c). It is believed that carbon C exerted an alum demand, such that at low doses the DOC removal benefits of the carbon were lesser in magnitude to the loss of removal efficiency by the coagulant, hence total DOC removal was decreased. As carbon dose increased however, the additional DOC removal by the carbon outweighed the loss of coagulant efficiency.
0
20
40
60
80
0 40 80 120 160Carbon A Dose (mg/L)
% R
emov
al
0
20
40
60
80
0 40 80 120 160Carbon B Dose (mg/L)
% R
emov
al
0
20
40
60
80
0 40 80 120 160Carbon C Dose (mg/L)
% R
emov
al
Figure 2.10 Percent removal of DOC (open symbol) and UV absorbance (closed symbol) with 300 mg/L ( ) and 500 mg/L ( ) alum in combination with (a) Carbon A, (b) Carbon B and (c) Carbon C. Carbon dose of 0 mg/L indicates treatment with alum alone
(a) (b) (c)
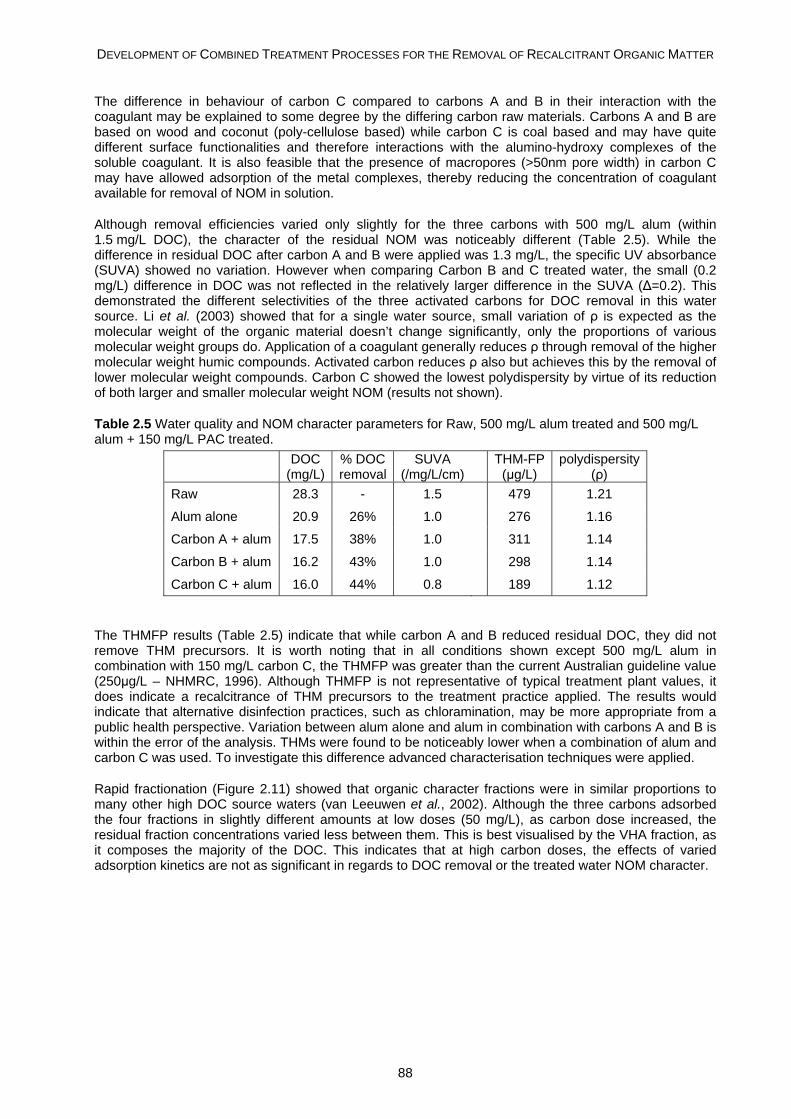
DEVELOPMENT OF COMBINED TREATMENT PROCESSES FOR THE REMOVAL OF RECALCITRANT ORGANIC MATTER
88
The difference in behaviour of carbon C compared to carbons A and B in their interaction with the coagulant may be explained to some degree by the differing carbon raw materials. Carbons A and B are based on wood and coconut (poly-cellulose based) while carbon C is coal based and may have quite different surface functionalities and therefore interactions with the alumino-hydroxy complexes of the soluble coagulant. It is also feasible that the presence of macropores (>50nm pore width) in carbon C may have allowed adsorption of the metal complexes, thereby reducing the concentration of coagulant available for removal of NOM in solution.
Although removal efficiencies varied only slightly for the three carbons with 500 mg/L alum (within 1.5 mg/L DOC), the character of the residual NOM was noticeably different (Table 2.5). While the difference in residual DOC after carbon A and B were applied was 1.3 mg/L, the specific UV absorbance (SUVA) showed no variation. However when comparing Carbon B and C treated water, the small (0.2 mg/L) difference in DOC was not reflected in the relatively larger difference in the SUVA (Δ=0.2). This demonstrated the different selectivities of the three activated carbons for DOC removal in this water source. Li et al. (2003) showed that for a single water source, small variation of ρ is expected as the molecular weight of the organic material doesn’t change significantly, only the proportions of various molecular weight groups do. Application of a coagulant generally reduces ρ through removal of the higher molecular weight humic compounds. Activated carbon reduces ρ also but achieves this by the removal of lower molecular weight compounds. Carbon C showed the lowest polydispersity by virtue of its reduction of both larger and smaller molecular weight NOM (results not shown).
Table 2.5 Water quality and NOM character parameters for Raw, 500 mg/L alum treated and 500 mg/L alum + 150 mg/L PAC treated.
DOC (mg/L)
% DOC removal
SUVA (/mg/L/cm) THM-FP
(μg/L) polydispersity
(ρ) Raw 28.3 - 1.5 479 1.21
Alum alone 20.9 26% 1.0 276 1.16
Carbon A + alum 17.5 38% 1.0 311 1.14
Carbon B + alum 16.2 43% 1.0 298 1.14
Carbon C + alum 16.0 44% 0.8 189 1.12
The THMFP results (Table 2.5) indicate that while carbon A and B reduced residual DOC, they did not remove THM precursors. It is worth noting that in all conditions shown except 500 mg/L alum in combination with 150 mg/L carbon C, the THMFP was greater than the current Australian guideline value (250μg/L – NHMRC, 1996). Although THMFP is not representative of typical treatment plant values, it does indicate a recalcitrance of THM precursors to the treatment practice applied. The results would indicate that alternative disinfection practices, such as chloramination, may be more appropriate from a public health perspective. Variation between alum alone and alum in combination with carbons A and B is within the error of the analysis. THMs were found to be noticeably lower when a combination of alum and carbon C was used. To investigate this difference advanced characterisation techniques were applied.
Rapid fractionation (Figure 2.11) showed that organic character fractions were in similar proportions to many other high DOC source waters (van Leeuwen et al., 2002). Although the three carbons adsorbed the four fractions in slightly different amounts at low doses (50 mg/L), as carbon dose increased, the residual fraction concentrations varied less between them. This is best visualised by the VHA fraction, as it composes the majority of the DOC. This indicates that at high carbon doses, the effects of varied adsorption kinetics are not as significant in regards to DOC removal or the treated water NOM character.
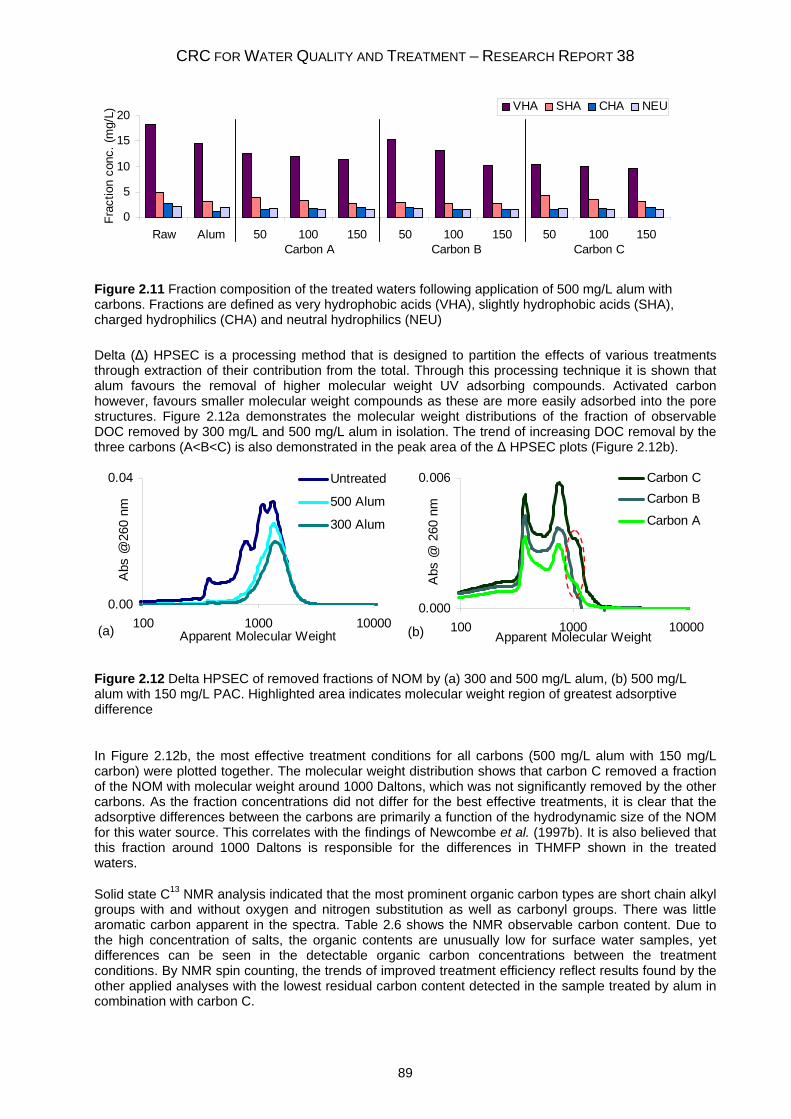
CRC FOR WATER QUALITY AND TREATMENT – RESEARCH REPORT 38
89
0
5
10
15
20
Raw Alum 50 100 150 50 100 150 50 100 150
Frac
tion
conc
. (m
g/L)
VHA SHA CHA NEU
Carbon A Carbon B Carbon C
Figure 2.11 Fraction composition of the treated waters following application of 500 mg/L alum with carbons. Fractions are defined as very hydrophobic acids (VHA), slightly hydrophobic acids (SHA), charged hydrophilics (CHA) and neutral hydrophilics (NEU)
Delta (Δ) HPSEC is a processing method that is designed to partition the effects of various treatments through extraction of their contribution from the total. Through this processing technique it is shown that alum favours the removal of higher molecular weight UV adsorbing compounds. Activated carbon however, favours smaller molecular weight compounds as these are more easily adsorbed into the pore structures. Figure 2.12a demonstrates the molecular weight distributions of the fraction of observable DOC removed by 300 mg/L and 500 mg/L alum in isolation. The trend of increasing DOC removal by the three carbons (A<B<C) is also demonstrated in the peak area of the Δ HPSEC plots (Figure 2.12b).
0.00
0.04
100 1000 10000Apparent Molecular Weight
Abs
@26
0 nm
Untreated
500 Alum
300 Alum
0.000
0.006
100 1000 10000Apparent Molecular Weight
Abs
@ 2
60 n
m
Carbon CCarbon B
Carbon A
Figure 2.12 Delta HPSEC of removed fractions of NOM by (a) 300 and 500 mg/L alum, (b) 500 mg/L alum with 150 mg/L PAC. Highlighted area indicates molecular weight region of greatest adsorptive difference
In Figure 2.12b, the most effective treatment conditions for all carbons (500 mg/L alum with 150 mg/L carbon) were plotted together. The molecular weight distribution shows that carbon C removed a fraction of the NOM with molecular weight around 1000 Daltons, which was not significantly removed by the other carbons. As the fraction concentrations did not differ for the best effective treatments, it is clear that the adsorptive differences between the carbons are primarily a function of the hydrodynamic size of the NOM for this water source. This correlates with the findings of Newcombe et al. (1997b). It is also believed that this fraction around 1000 Daltons is responsible for the differences in THMFP shown in the treated waters.
Solid state C13 NMR analysis indicated that the most prominent organic carbon types are short chain alkyl groups with and without oxygen and nitrogen substitution as well as carbonyl groups. There was little aromatic carbon apparent in the spectra. Table 2.6 shows the NMR observable carbon content. Due to the high concentration of salts, the organic contents are unusually low for surface water samples, yet differences can be seen in the detectable organic carbon concentrations between the treatment conditions. By NMR spin counting, the trends of improved treatment efficiency reflect results found by the other applied analyses with the lowest residual carbon content detected in the sample treated by alum in combination with carbon C.
(a) (b)
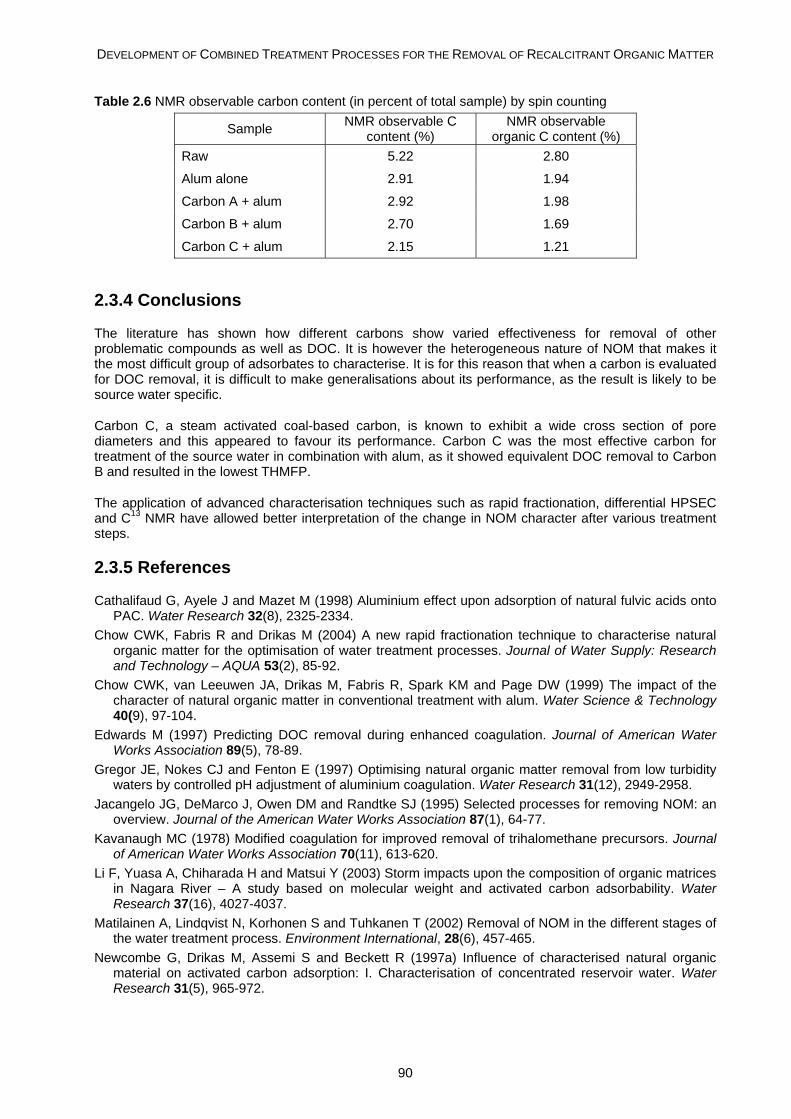
DEVELOPMENT OF COMBINED TREATMENT PROCESSES FOR THE REMOVAL OF RECALCITRANT ORGANIC MATTER
90
Table 2.6 NMR observable carbon content (in percent of total sample) by spin counting
Sample NMR observable C content (%)
NMR observable organic C content (%)
Raw 5.22 2.80
Alum alone 2.91 1.94
Carbon A + alum 2.92 1.98
Carbon B + alum 2.70 1.69
Carbon C + alum 2.15 1.21
2.3.4 Conclusions
The literature has shown how different carbons show varied effectiveness for removal of other problematic compounds as well as DOC. It is however the heterogeneous nature of NOM that makes it the most difficult group of adsorbates to characterise. It is for this reason that when a carbon is evaluated for DOC removal, it is difficult to make generalisations about its performance, as the result is likely to be source water specific.
Carbon C, a steam activated coal-based carbon, is known to exhibit a wide cross section of pore diameters and this appeared to favour its performance. Carbon C was the most effective carbon for treatment of the source water in combination with alum, as it showed equivalent DOC removal to Carbon B and resulted in the lowest THMFP.
The application of advanced characterisation techniques such as rapid fractionation, differential HPSEC and C13 NMR have allowed better interpretation of the change in NOM character after various treatment steps.
2.3.5 References
Cathalifaud G, Ayele J and Mazet M (1998) Aluminium effect upon adsorption of natural fulvic acids onto PAC. Water Research 32(8), 2325-2334.
Chow CWK, Fabris R and Drikas M (2004) A new rapid fractionation technique to characterise natural organic matter for the optimisation of water treatment processes. Journal of Water Supply: Research and Technology – AQUA 53(2), 85-92.
Chow CWK, van Leeuwen JA, Drikas M, Fabris R, Spark KM and Page DW (1999) The impact of the character of natural organic matter in conventional treatment with alum. Water Science & Technology 40(9), 97-104.
Edwards M (1997) Predicting DOC removal during enhanced coagulation. Journal of American Water Works Association 89(5), 78-89.
Gregor JE, Nokes CJ and Fenton E (1997) Optimising natural organic matter removal from low turbidity waters by controlled pH adjustment of aluminium coagulation. Water Research 31(12), 2949-2958.
Jacangelo JG, DeMarco J, Owen DM and Randtke SJ (1995) Selected processes for removing NOM: an overview. Journal of the American Water Works Association 87(1), 64-77.
Kavanaugh MC (1978) Modified coagulation for improved removal of trihalomethane precursors. Journal of American Water Works Association 70(11), 613-620.
Li F, Yuasa A, Chiharada H and Matsui Y (2003) Storm impacts upon the composition of organic matrices in Nagara River – A study based on molecular weight and activated carbon adsorbability. Water Research 37(16), 4027-4037.
Matilainen A, Lindqvist N, Korhonen S and Tuhkanen T (2002) Removal of NOM in the different stages of the water treatment process. Environment International, 28(6), 457-465.
Newcombe G, Drikas M, Assemi S and Beckett R (1997a) Influence of characterised natural organic material on activated carbon adsorption: I. Characterisation of concentrated reservoir water. Water Research 31(5), 965-972.
CRC FOR WATER QUALITY AND TREATMENT – RESEARCH REPORT 38
91
Newcombe G, Drikas M and Hayes R (1997b) Influence of characterised natural organic material on activated carbon adsorption: II. Effect of pore volume distribution and adsorption of 2-Methylisoborneol. Water Research 31(5), 1065-1073.
NHMRC (1996) Australian Drinking Water Guidelines, National Health & Medical Research Council, and Agriculture & Resource Management Councils of Australia and New Zealand, Canberra.
Othman MZ, Roddick FA and Hobday MD (2000) Evaluation of Victorian low rank coal-based adsorbants for the removal of organic compounds from aqueous systems. Water Research 34(18), 4351-4358.
Randtke SJ (1988) Organic contaminant removal by coagulation and related process combinations. Journal of American Water Works Association 80(5), 40-56.
van Leeuwen JA, Chow C, Fabris R, Drikas M and Spark K (1999) Enhanced coagulation for dissolved organic carbon removal in conventional treatment with alum. 18th Federal Convention of the AWWA. Proceedings. 11-14th April, Adelaide, Australia.
van Leeuwen J, Chow C, Fabris R, Withers N, Page D and Drikas M (2002) Application of a fractionation technique for better understanding of the removal of natural organic matter by alum coagulation. Water Science & Technology: Water Supply 2(5), 427-433.
White MC, Thompson JD, Harrington GW and Singer PC (1997) Evaluating criteria for enhanced coagulation compliance. Journal of American Water Works Association, 89(5), 64-77.
DEVELOPMENT OF COMBINED TREATMENT PROCESSES FOR THE REMOVAL OF RECALCITRANT ORGANIC MATTER
92
2.4 Combined Treatments4
2.4.1 Introduction
A number of published works have determined that there is a portion of the natural organic matter (NOM) that cannot be removed by coagulation processes (Randtke, 1988; Edwards, 1997; Chow et al., 1999; van Leeuwen et al., 2002). This material can be termed recalcitrant NOM and is primarily composed of low molecular weight hydrophilic neutral organics such as polysaccharides, proteins and amino sugars (Leenheer, 2004; Allpike et al., 2005). Previous investigations have also established that coagulants alone were incapable of producing required reductions in chlorine reactivity, disinfection by-products (DBP) and bacterial regrowth in some water sources (Fabris et al., 2003). Therefore, alternative treatment technologies must be considered if further improvements in drinking water quality are to be achieved.
Generally, alternative treatment technologies fall into three main categories: Oxidative processes such as UV irradiation and ozonation; adsorbent technologies such as ion-exchange resins; metal oxides and activated carbon; and membrane filtration, specifically nanofiltration and reverse osmosis. In this paper the incorporation of two adsorbent technologies, MIEX® resin and powdered activated carbon (PAC) were applied in combination with a coagulation process to improve NOM removal. Reductions in secondary water quality parameters such as trihalomethane formation potential (THMFP), used as a surrogate of general DBP formation, and bacterial regrowth were also targeted.
2.4.2 Materials and Methods
Two water sources were chosen to assess the combined treatment protocol, Myponga Reservoir and Murray River water from Mannum in regional South Australia. These drinking water sources were chosen as representative of both a high dissolved organic carbon (DOC), low turbidity water source (Myponga) and a low DOC, high turbidity water source (Mannum). Aluminium sulphate (alum) was chosen to remove both the natural water turbidity and to coagulate the PAC. The treatment train is shown in Figure 2.13. The order of treatment follows a logical sequence that could be practically applied in a treatment plant. MIEX® and PAC contact was conducted in 2 L gator jars (B-KER2, Phipps and Bird, USA) with stirring at 120 rpm and 200 rpm, respectively, using a gang paddle stirrer. Following 30 min PAC contact, alum was added and flash mixed for 1 minute at 200 rpm, then slow mixed for 14 minutes at 20 rpm. Stirring was then ceased and suspended particles (including PAC) were allowed to settle for 15 minutes prior to filtration through an 11 μm pore-size paper filter (Whatman International, UK). Appropriate dose ranges and conditions were predetermined by jar testing.
Treated water was analysed for filtered turbidity, true colour at 456 nm by the method of Bennett and Drikas (1993), absorbance at 254 nm (UV254), DOC, THMFP by headspace injection GC-MS and molecular weight distribution by high performance size exclusion chromatography (HPSEC). Selected samples were analysed for assimilable organic carbon (AOC) by the bacterial regrowth potential (BRP) method, adapted from Withers et al. (1996) and also described in Page et al. (2002).
4 This chapter is based on the following paper: Fabris, R., Chow, C. and Drikas, M. (2006) Combined treatments for
enhanced natural organic matter (NOM) removal. Enviro Conference and Exhibition, Melbourne, 9-11 May 2006. Paper e6174.
MIEX® IS A REGISTERED TRADEMARK OF ORICA AUSTRALIA PTY LTD
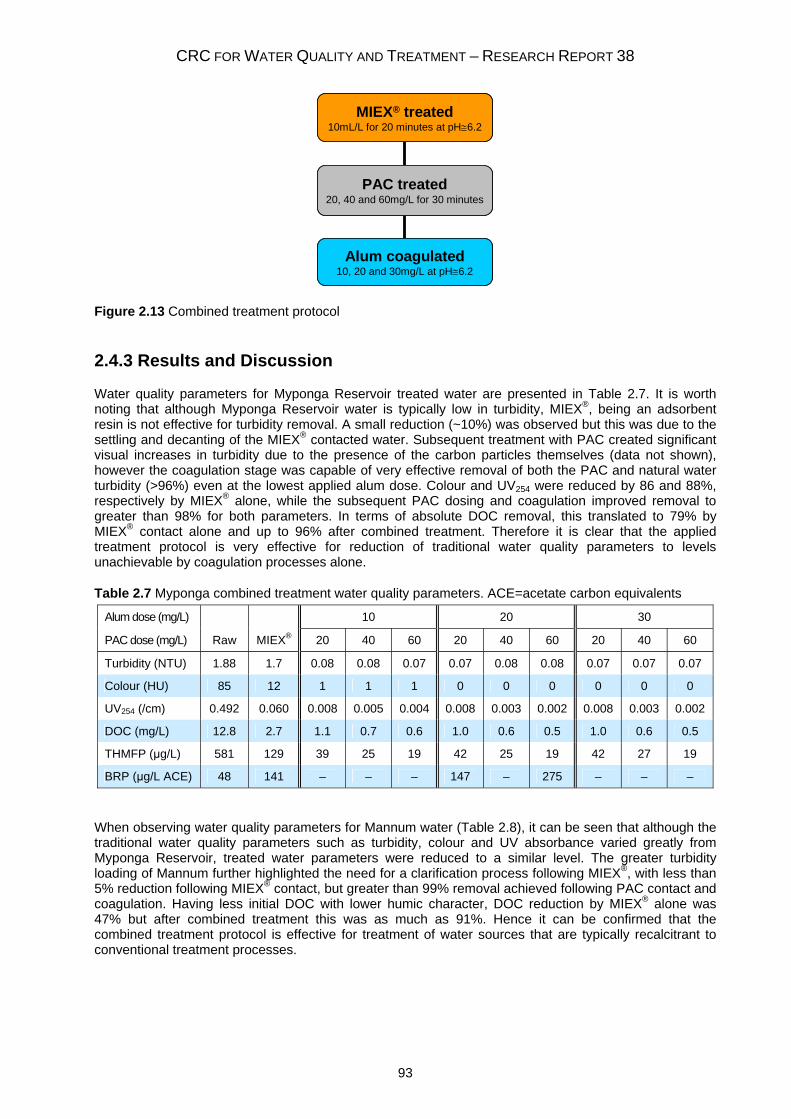
CRC FOR WATER QUALITY AND TREATMENT – RESEARCH REPORT 38
93
MIEX® treated10mL/L for 20 minutes at pH≅6.2
PAC treated20, 40 and 60mg/L for 30 minutes
Alum coagulated10, 20 and 30mg/L at pH≅6.2
MIEX® treated10mL/L for 20 minutes at pH≅6.2
PAC treated20, 40 and 60mg/L for 30 minutes
Alum coagulated10, 20 and 30mg/L at pH≅6.2
Figure 2.13 Combined treatment protocol
2.4.3 Results and Discussion
Water quality parameters for Myponga Reservoir treated water are presented in Table 2.7. It is worth noting that although Myponga Reservoir water is typically low in turbidity, MIEX®, being an adsorbent resin is not effective for turbidity removal. A small reduction (~10%) was observed but this was due to the settling and decanting of the MIEX® contacted water. Subsequent treatment with PAC created significant visual increases in turbidity due to the presence of the carbon particles themselves (data not shown), however the coagulation stage was capable of very effective removal of both the PAC and natural water turbidity (>96%) even at the lowest applied alum dose. Colour and UV254 were reduced by 86 and 88%, respectively by MIEX® alone, while the subsequent PAC dosing and coagulation improved removal to greater than 98% for both parameters. In terms of absolute DOC removal, this translated to 79% by MIEX® contact alone and up to 96% after combined treatment. Therefore it is clear that the applied treatment protocol is very effective for reduction of traditional water quality parameters to levels unachievable by coagulation processes alone.
Table 2.7 Myponga combined treatment water quality parameters. ACE=acetate carbon equivalents
Alum dose (mg/L) 10 20 30
PAC dose (mg/L) Raw MIEX® 20 40 60 20 40 60 20 40 60
Turbidity (NTU) 1.88 1.7 0.08 0.08 0.07 0.07 0.08 0.08 0.07 0.07 0.07
Colour (HU) 85 12 1 1 1 0 0 0 0 0 0
UV254 (/cm) 0.492 0.060 0.008 0.005 0.004 0.008 0.003 0.002 0.008 0.003 0.002
DOC (mg/L) 12.8 2.7 1.1 0.7 0.6 1.0 0.6 0.5 1.0 0.6 0.5
THMFP (μg/L) 581 129 39 25 19 42 25 19 42 27 19
BRP (μg/L ACE) 48 141 – – – 147 – 275 – – –
When observing water quality parameters for Mannum water (Table 2.8), it can be seen that although the traditional water quality parameters such as turbidity, colour and UV absorbance varied greatly from Myponga Reservoir, treated water parameters were reduced to a similar level. The greater turbidity loading of Mannum further highlighted the need for a clarification process following MIEX®, with less than 5% reduction following MIEX® contact, but greater than 99% removal achieved following PAC contact and coagulation. Having less initial DOC with lower humic character, DOC reduction by MIEX® alone was 47% but after combined treatment this was as much as 91%. Hence it can be confirmed that the combined treatment protocol is effective for treatment of water sources that are typically recalcitrant to conventional treatment processes.
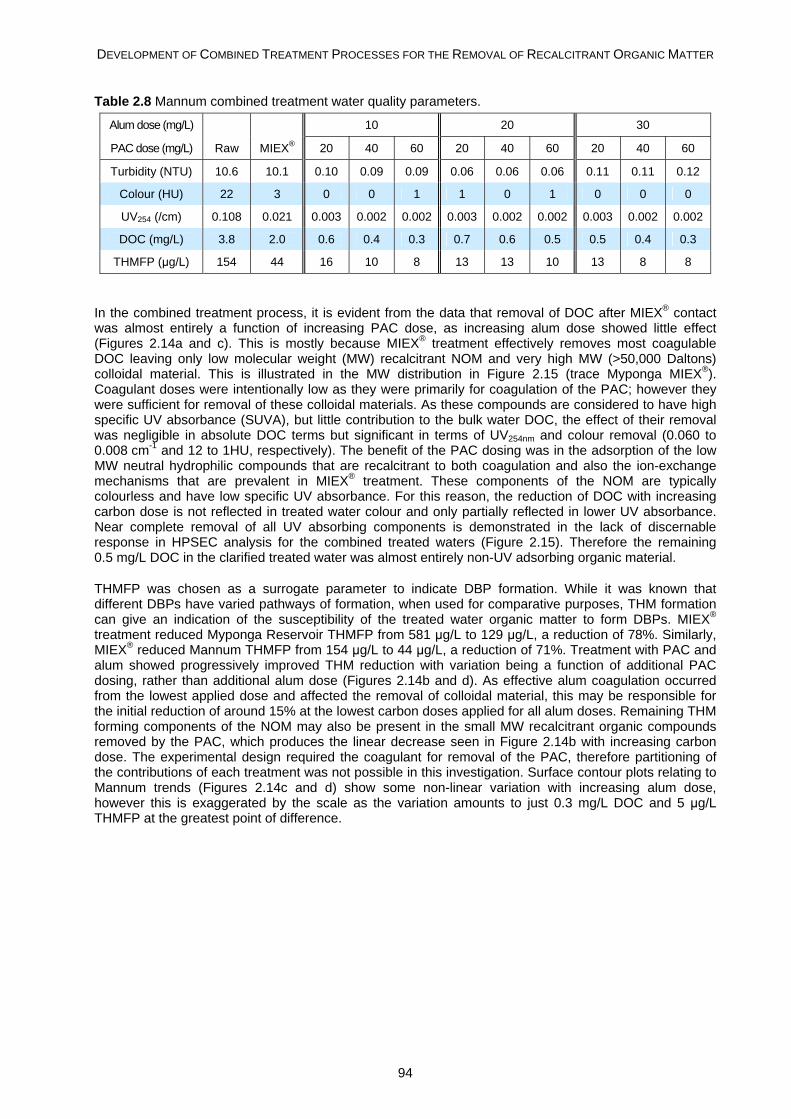
DEVELOPMENT OF COMBINED TREATMENT PROCESSES FOR THE REMOVAL OF RECALCITRANT ORGANIC MATTER
94
Table 2.8 Mannum combined treatment water quality parameters.
Alum dose (mg/L) 10 20 30
PAC dose (mg/L) Raw MIEX® 20 40 60 20 40 60 20 40 60
Turbidity (NTU) 10.6 10.1 0.10 0.09 0.09 0.06 0.06 0.06 0.11 0.11 0.12
Colour (HU) 22 3 0 0 1 1 0 1 0 0 0
UV254 (/cm) 0.108 0.021 0.003 0.002 0.002 0.003 0.002 0.002 0.003 0.002 0.002
DOC (mg/L) 3.8 2.0 0.6 0.4 0.3 0.7 0.6 0.5 0.5 0.4 0.3
THMFP (μg/L) 154 44 16 10 8 13 13 10 13 8 8
In the combined treatment process, it is evident from the data that removal of DOC after MIEX® contact was almost entirely a function of increasing PAC dose, as increasing alum dose showed little effect (Figures 2.14a and c). This is mostly because MIEX® treatment effectively removes most coagulable DOC leaving only low molecular weight (MW) recalcitrant NOM and very high MW (>50,000 Daltons) colloidal material. This is illustrated in the MW distribution in Figure 2.15 (trace Myponga MIEX®). Coagulant doses were intentionally low as they were primarily for coagulation of the PAC; however they were sufficient for removal of these colloidal materials. As these compounds are considered to have high specific UV absorbance (SUVA), but little contribution to the bulk water DOC, the effect of their removal was negligible in absolute DOC terms but significant in terms of UV254nm and colour removal (0.060 to 0.008 cm-1 and 12 to 1HU, respectively). The benefit of the PAC dosing was in the adsorption of the low MW neutral hydrophilic compounds that are recalcitrant to both coagulation and also the ion-exchange mechanisms that are prevalent in MIEX® treatment. These components of the NOM are typically colourless and have low specific UV absorbance. For this reason, the reduction of DOC with increasing carbon dose is not reflected in treated water colour and only partially reflected in lower UV absorbance. Near complete removal of all UV absorbing components is demonstrated in the lack of discernable response in HPSEC analysis for the combined treated waters (Figure 2.15). Therefore the remaining 0.5 mg/L DOC in the clarified treated water was almost entirely non-UV adsorbing organic material.
THMFP was chosen as a surrogate parameter to indicate DBP formation. While it was known that different DBPs have varied pathways of formation, when used for comparative purposes, THM formation can give an indication of the susceptibility of the treated water organic matter to form DBPs. MIEX® treatment reduced Myponga Reservoir THMFP from 581 μg/L to 129 μg/L, a reduction of 78%. Similarly, MIEX® reduced Mannum THMFP from 154 μg/L to 44 μg/L, a reduction of 71%. Treatment with PAC and alum showed progressively improved THM reduction with variation being a function of additional PAC dosing, rather than additional alum dose (Figures 2.14b and d). As effective alum coagulation occurred from the lowest applied dose and affected the removal of colloidal material, this may be responsible for the initial reduction of around 15% at the lowest carbon doses applied for all alum doses. Remaining THM forming components of the NOM may also be present in the small MW recalcitrant organic compounds removed by the PAC, which produces the linear decrease seen in Figure 2.14b with increasing carbon dose. The experimental design required the coagulant for removal of the PAC, therefore partitioning of the contributions of each treatment was not possible in this investigation. Surface contour plots relating to Mannum trends (Figures 2.14c and d) show some non-linear variation with increasing alum dose, however this is exaggerated by the scale as the variation amounts to just 0.3 mg/L DOC and 5 μg/L THMFP at the greatest point of difference.
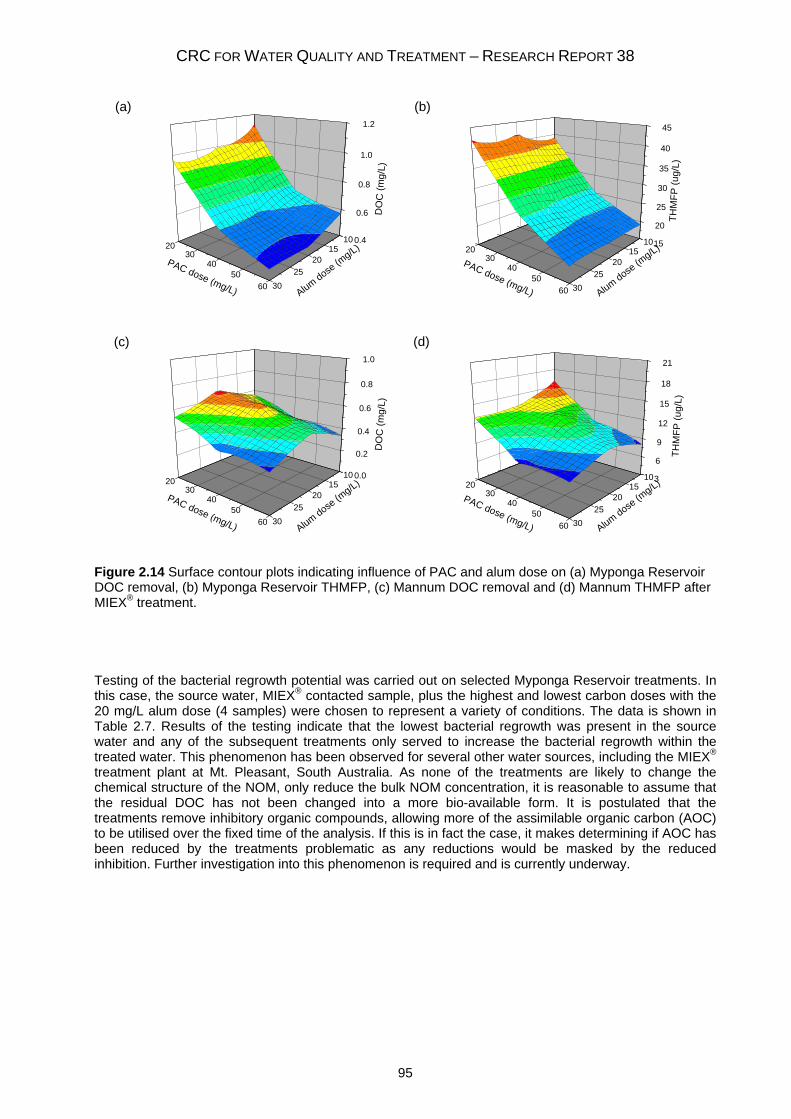
CRC FOR WATER QUALITY AND TREATMENT – RESEARCH REPORT 38
95
1015
2025
30
2030
4050
60
0.4
0.6
0.8
1.0
1.2
Alum dose (mg/L)
DO
C (m
g/L)
PAC dose (mg/L)
1015
2025
30
2030
4050
60
15
20
25
30
35
40
45
TH
MFP
(ug/
L)
Alum dose (mg/L)
PAC dose (mg/L)
1015
2025
30
2030
4050
60
0.0
0.2
0.4
0.6
0.8
1.0
Alum dose (mg/L)
DO
C (m
g/L)
PAC dose (mg/L)
1015
2025
30
2030
4050
60
3
6
9
12
15
18
21
TH
MFP
(ug/
L)
Alum dose (mg/L)
PAC dose (mg/L)
Figure 2.14 Surface contour plots indicating influence of PAC and alum dose on (a) Myponga Reservoir DOC removal, (b) Myponga Reservoir THMFP, (c) Mannum DOC removal and (d) Mannum THMFP after MIEX® treatment.
Testing of the bacterial regrowth potential was carried out on selected Myponga Reservoir treatments. In this case, the source water, MIEX® contacted sample, plus the highest and lowest carbon doses with the 20 mg/L alum dose (4 samples) were chosen to represent a variety of conditions. The data is shown in Table 2.7. Results of the testing indicate that the lowest bacterial regrowth was present in the source water and any of the subsequent treatments only served to increase the bacterial regrowth within the treated water. This phenomenon has been observed for several other water sources, including the MIEX® treatment plant at Mt. Pleasant, South Australia. As none of the treatments are likely to change the chemical structure of the NOM, only reduce the bulk NOM concentration, it is reasonable to assume that the residual DOC has not been changed into a more bio-available form. It is postulated that the treatments remove inhibitory organic compounds, allowing more of the assimilable organic carbon (AOC) to be utilised over the fixed time of the analysis. If this is in fact the case, it makes determining if AOC has been reduced by the treatments problematic as any reductions would be masked by the reduced inhibition. Further investigation into this phenomenon is required and is currently underway.
(a) (b)
(c) (d)
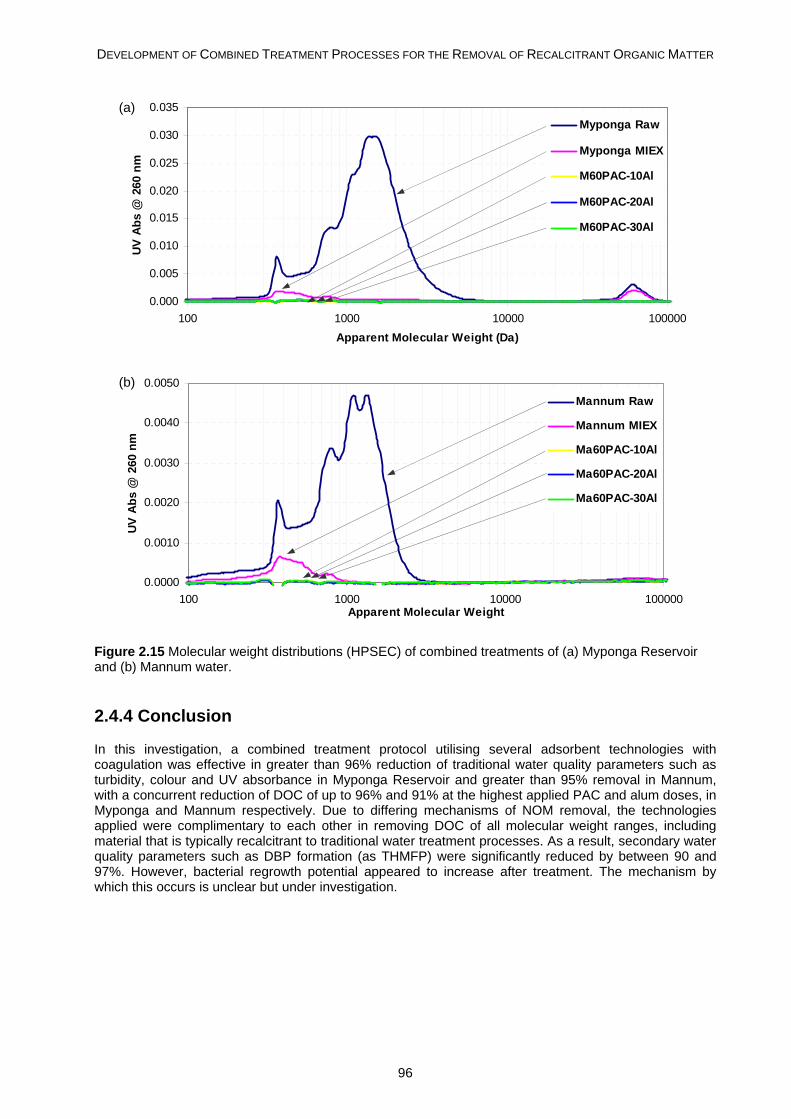
DEVELOPMENT OF COMBINED TREATMENT PROCESSES FOR THE REMOVAL OF RECALCITRANT ORGANIC MATTER
96
0.000
0.005
0.010
0.015
0.020
0.025
0.030
0.035
100 1000 10000 100000Apparent Molecular Weight (Da)
UV
Abs
@ 2
60 n
mMyponga Raw
Myponga MIEX
M60PAC-10Al
M60PAC-20Al
M60PAC-30Al
0.0000
0.0010
0.0020
0.0030
0.0040
0.0050
100 1000 10000 100000Apparent Molecular Weight
UV A
bs @
260
nm
Mannum Raw
Mannum MIEX
Ma60PAC-10Al
Ma60PAC-20Al
Ma60PAC-30Al
Figure 2.15 Molecular weight distributions (HPSEC) of combined treatments of (a) Myponga Reservoir and (b) Mannum water.
2.4.4 Conclusion
In this investigation, a combined treatment protocol utilising several adsorbent technologies with coagulation was effective in greater than 96% reduction of traditional water quality parameters such as turbidity, colour and UV absorbance in Myponga Reservoir and greater than 95% removal in Mannum, with a concurrent reduction of DOC of up to 96% and 91% at the highest applied PAC and alum doses, in Myponga and Mannum respectively. Due to differing mechanisms of NOM removal, the technologies applied were complimentary to each other in removing DOC of all molecular weight ranges, including material that is typically recalcitrant to traditional water treatment processes. As a result, secondary water quality parameters such as DBP formation (as THMFP) were significantly reduced by between 90 and 97%. However, bacterial regrowth potential appeared to increase after treatment. The mechanism by which this occurs is unclear but under investigation.
(a)
(b)
CRC FOR WATER QUALITY AND TREATMENT – RESEARCH REPORT 38
97
2.4.5 References
Allpike BP, Heitz A, Joll CA, Kagi RI, Abbt-Braun G, Frimmel FH, Brinkmann T, Her N and Amy G (2005) Size exclusion chromatography to characterize DOC removal in drinking water treatment. Environmental Science and Technology 39(7), 2334-2342.
Bennett LE and Drikas M (1993) The evaluation of colour in natural waters. Water Research 27(7), 1209-1218.
Chow CWK, van Leeuwen JA, Drikas M, Fabris R, Spark KM and Page DW (1999) The impact of the character of natural organic matter in conventional treatment with alum. Water Science and Technology 40(9), 97-104.
Edwards M (1997) Predicting DOC removal during enhanced coagulation. Journal of American Water Works Association, 89(5), 78-89.
Fabris R, Chow CWK and Drikas M (2003) The impact of coagulant type on NOM removal. Proceedings of Ozwater Convention & Exhibition, Perth, Western Australia, April 2003, CD-ROM.
Leenheer JA (2004) Comprehensive assessment of precursors, diagenesis, and reactivity to water treatment of dissolved and colloidal organic matter. Water Science and Technology: Water Supply 4(4), 1-9.
Page DW, van Leeuwen JA, Spark KM, Drikas M, Withers N and Mulcahy DE (2002) Effect of alum treatment on the trihalomethane formation potential and bacterial regrowth potential of natural and synthetic waters. Water Research 36(19), 4884-4892.
Randtke SJ (1988) Organic contaminant removal by coagulation and related process combinations. Journal of American Water Works Association 80(5), 40-56.
van Leeuwen JA, Chow C, Fabris R, Drikas M and Spark K (1999) Enhanced coagulation for dissolved organic carbon removal in conventional treatment with alum. 18th Federal Convention of the AWWA. Proceedings. 11-14th April, Adelaide, Australia.
Withers N, Drikas M and Hambsch B (1996) Comparison of bacterial regrowth potential in German and Australian waters. Proceedings of WaterTECH conference, Sydney, Australia. CD-ROM.
DEVELOPMENT OF COMBINED TREATMENT PROCESSES FOR THE REMOVAL OF RECALCITRANT ORGANIC MATTER
98
3 MEMBRANE PROCESSES
3.1 Characterising Organic Membrane Fouling5
3.1.1 Introduction
Microfiltration (MF) treatment produces water of consistently high quality, but the high reliability of water quality comes at the expense of membrane fouling. Unlike sand filters, for which backwashing removes all of the additional filtration resistance that has accumulated during filtration, the backwashing of membrane systems rarely removes all of the foulants. With time, the unremoved foulants build up to the point where they must be removed by chemical cleaning of the membranes. A large proportion of these foulants arise from the organic compounds contained in the feedwaters.
The extent of fouling arising from natural organic matter (NOM) of particular waters cannot currently be predicted from the usual water quality measurements such as colour, turbidity or dissolved organic carbon (DOC) concentration, so that pilot plant trials are used to predict operational performance of full scale plants.
In an ultrafiltration (UF) study of surface water from Lake Decatur, Illinois, the effect of membrane composition on fouling rate was evaluated (Laîné et al., 1989). This was shown to be a critical parameter in membrane selection. The types investigated were made from polysulphone, acrylic copolymer and regenerated cellulose, and had MW cut off levels ranging from 2-300 kDa. There were profound differences in performance, and although surface charge and roughness were accepted as important in fouling, the crucial characteristic needed to lower membrane fouling was hydrophilicity. This result has been shown many times since, and it is generally accepted to be true for all waters.
Much effort has gone in to understanding the effect of NOM composition on membrane fouling, but a universal understanding of this phenomenon is far from being achieved. Tables 3.1 and 3.2 summarise some of the work in this area for UF, nanofiltration (NF) and MF membranes.
Those studies that used NOM predominantly composed of hydrophobic NOM, such as from the Suwannee River in Florida, USA, showed that hydrophobic NOM was the main foulant. This was primarily ascribed to the humic acids adsorbing more tenaciously than fulvic acids (Jucker and Clark, 1994; Hong and Elimelech, 1997). The adsorption capacity for these compounds increased with decreasing negative zeta-potential on the membrane and with increasing hydrophobicity. It was also noted that upon adsorption of the humic material, the membranes became more hydrophilic.
The effect of calcium ions on the fouling of these waters has been much studied (Hong and Elimelech, 1997; Schäfer et al., 1998; Yoon et al., 1998). Higher fouling rates were observed for all membranes when the calcium concentration was increased. This was ascribed to the formation of calcium humate complexes, which enable greater adsorption of the humic acids on the negative membrane surface via calcium bridging. Bridging between humic acid molecules may also be promoted, leading to greater adsorption and therefore fouling on the membrane. Similar effects were observed for the addition of magnesium (Hong and Elimelech, 1997) and copper ions (Nyström et al., 1996).
In more recent years, there has been a greater concentration on the use of surface waters rather than model NOM compounds in membrane fouling studies. These papers have generally shown that the hydrophilic component of NOM is the major membrane foulant. This has been supported by infrared spectra, which has indicated the presence of polysaccharides in the desorbed matter from fouled membranes (Cho et al., 1998; Amy and Cho, 1999, Kimura et al., 2004). For UF membranes, pore obstruction by the high MW polymers was suggested as the main cause, and this is supported by the recent work of Lee et al (2004), where they showed that UF membranes were affected by cake or gel layer formation.
5 This chapter is based on the following papers: S. Gray, T. Tran, B. Bolto and W. Johnson, “Natural organic matter
and low pressure membranes – A review.” Ozwater 05, AWA, Brisbane, 2005, paper o5335, and Stephen Gray, Colin Ritchie, Thuy Tran, Brian Bolto, Paul Greenwood, Frank Bursetti and Brad Allpike “The effect of membrane character and solution chemistry on microfiltration performance” Water Research (in press).
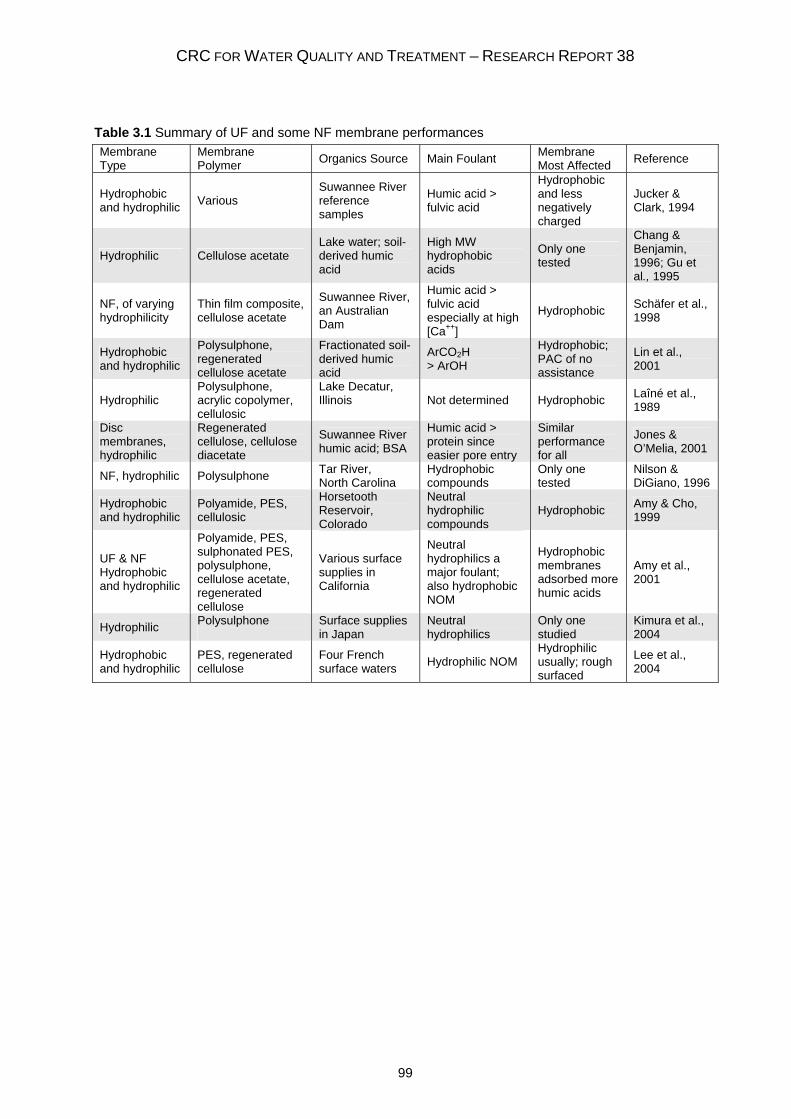
CRC FOR WATER QUALITY AND TREATMENT – RESEARCH REPORT 38
99
Table 3.1 Summary of UF and some NF membrane performances Membrane Type
Membrane Polymer Organics Source Main Foulant Membrane
Most Affected Reference
Hydrophobic and hydrophilic Various
Suwannee River reference samples
Humic acid > fulvic acid
Hydrophobic and less negatively charged
Jucker & Clark, 1994
Hydrophilic Cellulose acetate Lake water; soil-derived humic acid
High MW hydrophobic acids
Only one tested
Chang & Benjamin, 1996; Gu et al., 1995
NF, of varying hydrophilicity
Thin film composite, cellulose acetate
Suwannee River, an Australian Dam
Humic acid > fulvic acid especially at high [Ca++]
Hydrophobic Schäfer et al., 1998
Hydrophobic and hydrophilic
Polysulphone, regenerated cellulose acetate
Fractionated soil-derived humic acid
ArCO2H > ArOH
Hydrophobic; PAC of no assistance
Lin et al., 2001
Hydrophilic Polysulphone, acrylic copolymer, cellulosic
Lake Decatur, Illinois
Not determined Hydrophobic Laîné et al., 1989
Disc membranes, hydrophilic
Regenerated cellulose, cellulose diacetate
Suwannee River humic acid; BSA
Humic acid > protein since easier pore entry
Similar performance for all
Jones & O’Melia, 2001
NF, hydrophilic Polysulphone Tar River, North Carolina
Hydrophobic compounds
Only one tested
Nilson & DiGiano, 1996
Hydrophobic and hydrophilic
Polyamide, PES, cellulosic
Horsetooth Reservoir, Colorado
Neutral hydrophilic compounds
Hydrophobic Amy & Cho, 1999
UF & NF Hydrophobic and hydrophilic
Polyamide, PES, sulphonated PES, polysulphone, cellulose acetate, regenerated cellulose
Various surface supplies in California
Neutral hydrophilics a major foulant; also hydrophobic NOM
Hydrophobic membranes adsorbed more humic acids
Amy et al., 2001
Hydrophilic Polysulphone
Surface supplies in Japan
Neutral hydrophilics
Only one studied
Kimura et al., 2004
Hydrophobic and hydrophilic
PES, regenerated cellulose
Four French surface waters Hydrophilic NOM
Hydrophilic usually; rough surfaced
Lee et al., 2004
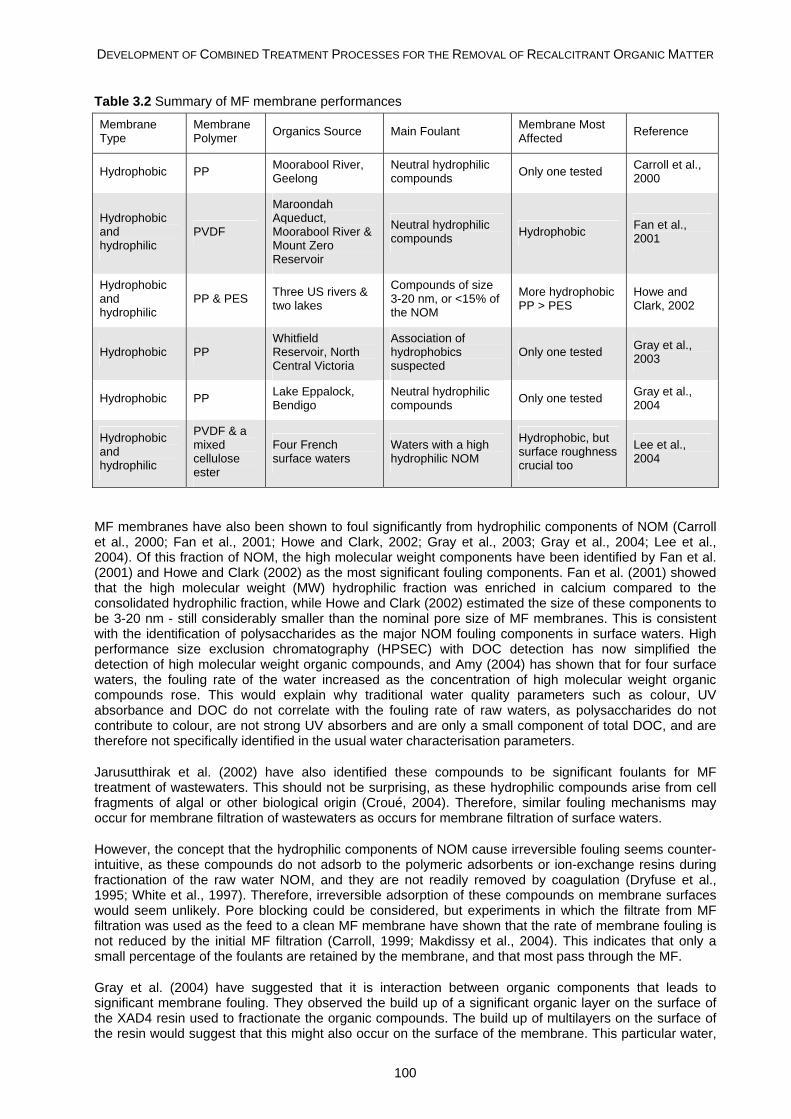
DEVELOPMENT OF COMBINED TREATMENT PROCESSES FOR THE REMOVAL OF RECALCITRANT ORGANIC MATTER
100
Table 3.2 Summary of MF membrane performances
Membrane Type
Membrane Polymer Organics Source Main Foulant Membrane Most
Affected Reference
Hydrophobic PP Moorabool River, Geelong
Neutral hydrophilic compounds Only one tested Carroll et al.,
2000
Hydrophobic and hydrophilic
PVDF
Maroondah Aqueduct, Moorabool River & Mount Zero Reservoir
Neutral hydrophilic compounds Hydrophobic Fan et al.,
2001
Hydrophobic and hydrophilic
PP & PES Three US rivers & two lakes
Compounds of size 3-20 nm, or <15% of the NOM
More hydrophobic PP > PES
Howe and Clark, 2002
Hydrophobic PP Whitfield Reservoir, North Central Victoria
Association of hydrophobics suspected
Only one tested Gray et al., 2003
Hydrophobic PP Lake Eppalock, Bendigo
Neutral hydrophilic compounds Only one tested Gray et al.,
2004
Hydrophobic and hydrophilic
PVDF & a mixed cellulose ester
Four French surface waters
Waters with a high hydrophilic NOM
Hydrophobic, but surface roughness crucial too
Lee et al., 2004
MF membranes have also been shown to foul significantly from hydrophilic components of NOM (Carroll et al., 2000; Fan et al., 2001; Howe and Clark, 2002; Gray et al., 2003; Gray et al., 2004; Lee et al., 2004). Of this fraction of NOM, the high molecular weight components have been identified by Fan et al. (2001) and Howe and Clark (2002) as the most significant fouling components. Fan et al. (2001) showed that the high molecular weight (MW) hydrophilic fraction was enriched in calcium compared to the consolidated hydrophilic fraction, while Howe and Clark (2002) estimated the size of these components to be 3-20 nm - still considerably smaller than the nominal pore size of MF membranes. This is consistent with the identification of polysaccharides as the major NOM fouling components in surface waters. High performance size exclusion chromatography (HPSEC) with DOC detection has now simplified the detection of high molecular weight organic compounds, and Amy (2004) has shown that for four surface waters, the fouling rate of the water increased as the concentration of high molecular weight organic compounds rose. This would explain why traditional water quality parameters such as colour, UV absorbance and DOC do not correlate with the fouling rate of raw waters, as polysaccharides do not contribute to colour, are not strong UV absorbers and are only a small component of total DOC, and are therefore not specifically identified in the usual water characterisation parameters.
Jarusutthirak et al. (2002) have also identified these compounds to be significant foulants for MF treatment of wastewaters. This should not be surprising, as these hydrophilic compounds arise from cell fragments of algal or other biological origin (Croué, 2004). Therefore, similar fouling mechanisms may occur for membrane filtration of wastewaters as occurs for membrane filtration of surface waters.
However, the concept that the hydrophilic components of NOM cause irreversible fouling seems counter-intuitive, as these compounds do not adsorb to the polymeric adsorbents or ion-exchange resins during fractionation of the raw water NOM, and they are not readily removed by coagulation (Dryfuse et al., 1995; White et al., 1997). Therefore, irreversible adsorption of these compounds on membrane surfaces would seem unlikely. Pore blocking could be considered, but experiments in which the filtrate from MF filtration was used as the feed to a clean MF membrane have shown that the rate of membrane fouling is not reduced by the initial MF filtration (Carroll, 1999; Makdissy et al., 2004). This indicates that only a small percentage of the foulants are retained by the membrane, and that most pass through the MF.
Gray et al. (2004) have suggested that it is interaction between organic components that leads to significant membrane fouling. They observed the build up of a significant organic layer on the surface of the XAD4 resin used to fractionate the organic compounds. The build up of multilayers on the surface of the resin would suggest that this might also occur on the surface of the membrane. This particular water,
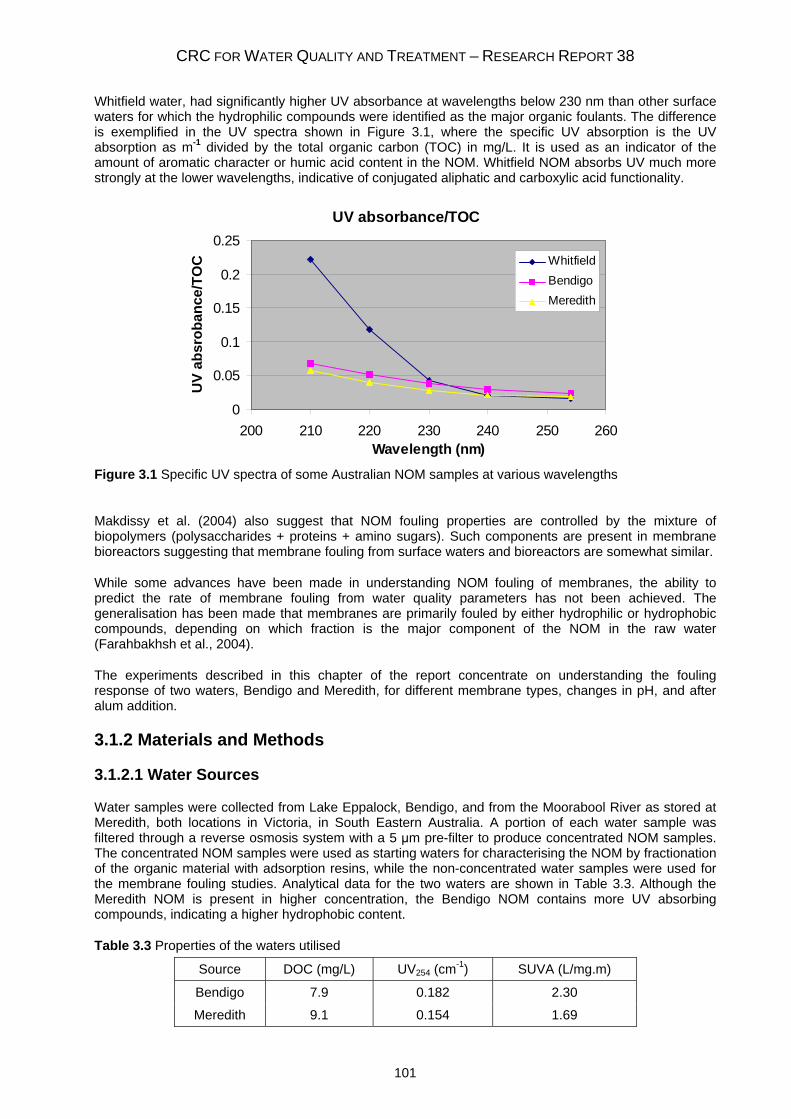
CRC FOR WATER QUALITY AND TREATMENT – RESEARCH REPORT 38
101
Whitfield water, had significantly higher UV absorbance at wavelengths below 230 nm than other surface waters for which the hydrophilic compounds were identified as the major organic foulants. The difference is exemplified in the UV spectra shown in Figure 3.1, where the specific UV absorption is the UV absorption as m-1 divided by the total organic carbon (TOC) in mg/L. It is used as an indicator of the amount of aromatic character or humic acid content in the NOM. Whitfield NOM absorbs UV much more strongly at the lower wavelengths, indicative of conjugated aliphatic and carboxylic acid functionality.
UV absorbance/TOC
0
0.05
0.1
0.15
0.2
0.25
200 210 220 230 240 250 260Wavelength (nm)
UV
absr
oban
ce/T
OC Whitfield
BendigoMeredith
Figure 3.1 Specific UV spectra of some Australian NOM samples at various wavelengths
Makdissy et al. (2004) also suggest that NOM fouling properties are controlled by the mixture of biopolymers (polysaccharides + proteins + amino sugars). Such components are present in membrane bioreactors suggesting that membrane fouling from surface waters and bioreactors are somewhat similar.
While some advances have been made in understanding NOM fouling of membranes, the ability to predict the rate of membrane fouling from water quality parameters has not been achieved. The generalisation has been made that membranes are primarily fouled by either hydrophilic or hydrophobic compounds, depending on which fraction is the major component of the NOM in the raw water (Farahbakhsh et al., 2004).
The experiments described in this chapter of the report concentrate on understanding the fouling response of two waters, Bendigo and Meredith, for different membrane types, changes in pH, and after alum addition.
3.1.2 Materials and Methods
3.1.2.1 Water Sources
Water samples were collected from Lake Eppalock, Bendigo, and from the Moorabool River as stored at Meredith, both locations in Victoria, in South Eastern Australia. A portion of each water sample was filtered through a reverse osmosis system with a 5 μm pre-filter to produce concentrated NOM samples. The concentrated NOM samples were used as starting waters for characterising the NOM by fractionation of the organic material with adsorption resins, while the non-concentrated water samples were used for the membrane fouling studies. Analytical data for the two waters are shown in Table 3.3. Although the Meredith NOM is present in higher concentration, the Bendigo NOM contains more UV absorbing compounds, indicating a higher hydrophobic content.
Table 3.3 Properties of the waters utilised
Source DOC (mg/L) UV254 (cm-1) SUVA (L/mg.m)
Bendigo 7.9 0.182 2.30
Meredith 9.1 0.154 1.69
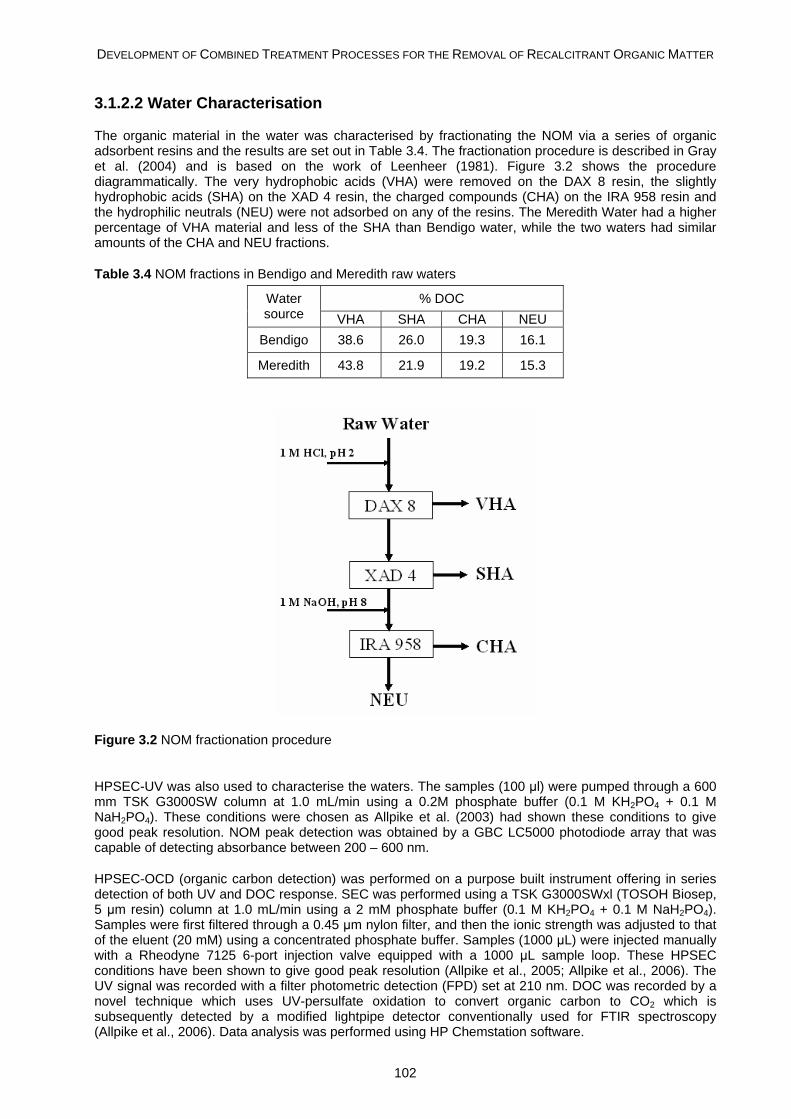
DEVELOPMENT OF COMBINED TREATMENT PROCESSES FOR THE REMOVAL OF RECALCITRANT ORGANIC MATTER
102
3.1.2.2 Water Characterisation
The organic material in the water was characterised by fractionating the NOM via a series of organic adsorbent resins and the results are set out in Table 3.4. The fractionation procedure is described in Gray et al. (2004) and is based on the work of Leenheer (1981). Figure 3.2 shows the procedure diagrammatically. The very hydrophobic acids (VHA) were removed on the DAX 8 resin, the slightly hydrophobic acids (SHA) on the XAD 4 resin, the charged compounds (CHA) on the IRA 958 resin and the hydrophilic neutrals (NEU) were not adsorbed on any of the resins. The Meredith Water had a higher percentage of VHA material and less of the SHA than Bendigo water, while the two waters had similar amounts of the CHA and NEU fractions.
Table 3.4 NOM fractions in Bendigo and Meredith raw waters
% DOC Water source VHA SHA CHA NEU
Bendigo 38.6 26.0 19.3 16.1
Meredith 43.8 21.9 19.2 15.3
Figure 3.2 NOM fractionation procedure
HPSEC-UV was also used to characterise the waters. The samples (100 μl) were pumped through a 600 mm TSK G3000SW column at 1.0 mL/min using a 0.2M phosphate buffer (0.1 M KH2PO4 + 0.1 M NaH2PO4). These conditions were chosen as Allpike et al. (2003) had shown these conditions to give good peak resolution. NOM peak detection was obtained by a GBC LC5000 photodiode array that was capable of detecting absorbance between 200 – 600 nm.
HPSEC-OCD (organic carbon detection) was performed on a purpose built instrument offering in series detection of both UV and DOC response. SEC was performed using a TSK G3000SWxl (TOSOH Biosep, 5 μm resin) column at 1.0 mL/min using a 2 mM phosphate buffer (0.1 M KH2PO4 + 0.1 M NaH2PO4). Samples were first filtered through a 0.45 μm nylon filter, and then the ionic strength was adjusted to that of the eluent (20 mM) using a concentrated phosphate buffer. Samples (1000 μL) were injected manually with a Rheodyne 7125 6-port injection valve equipped with a 1000 μL sample loop. These HPSEC conditions have been shown to give good peak resolution (Allpike et al., 2005; Allpike et al., 2006). The UV signal was recorded with a filter photometric detection (FPD) set at 210 nm. DOC was recorded by a novel technique which uses UV-persulfate oxidation to convert organic carbon to CO2 which is subsequently detected by a modified lightpipe detector conventionally used for FTIR spectroscopy (Allpike et al., 2006). Data analysis was performed using HP Chemstation software.
CRC FOR WATER QUALITY AND TREATMENT – RESEARCH REPORT 38
103
3.1.2.3 Alum Treatment
Aluminium sulphate [Al2(SO4)3.18H2O] was supplied by BDH Laboratory. To evaluate the coagulation efficiency, standard jar tests were carried out with the pH maintained at 6 by sodium hydroxide addition. The appropriate coagulant dose, as determined by the best removal of DOC, was then added and the solution flash mixed for 1 min at 130 rpm. The speed was then reduced to 50 rpm for 15 min, after which the treated water was left to settle for 1 hr. The general procedure throughout was as previously reported (Tran et al., 2005). All water was filtered through GF-C filter paper (nominal 1.3 μm) before use to remove suspended material that would otherwise settle out in the membrane apparatus.
3.1.2.4 Membranes
A single hollow fibre membrane filtration rig was used to examine the fouling characteristics of each water. The filtration experiments were performed at constant pressure and the water was pumped from the outside to the inside of the hollow fibres. The filtrate was weighed on a balance and liquid backwashing of the membrane was achieved via pressurised water and a series of valves. A data acquisition system was used to control the filtration pressure and backwash sequence as well as record the filtrate mass and ambient air temperature. The membranes used were three Memcor products, a hydrophobic polypropylene (PP) membrane with a nominal pore size of 0.2 μm, and hydrophobic (PVDF-1) and hydrophilic (PVDF-2) polyvinylidene fluoride membranes with nominal measured pore sizes of 0.1 μm. A poly(ether sulphone) membrane supplied via Thames Water (PES-2) having a nominal pore size of 0.01 μm was also tested. The membrane contact angles were determined with a Cahn Dynamic Contact Angle Analyser. The membrane fibres were 600 mm in length and the clean water fluxes were determined before each test to be in the ranges shown in Table 3.5, which lists the membrane characteristics.
Table 3.5 Membrane properties. OD= outer diameter, ID= inner diameter
Membrane Fibre Dimensions Nominal Pore Size
Clean Water Flux
Contact Angle (degrees)
OD (mm)
ID (mm)
(μm) (L/h/bar/m2)
PP 0.50 0.25 0.2 1200 ± 200 160 PVDF-1 0.65 0.39 0.1 1400 ± 400 115 PVDF-2 0.65 0.39 0.1 1600 ± 400 61 PES-2 1.70 1.00 0.01 1000 ± 200 59
3.1.2.5 Method
The membrane fibres were wet with ethanol and flushed with Milli-Q water before use. The transmembrane pressure (TMP) of all experiments was held at 0.5 bar and the backwashing regime was a 20 second liquid backwash every 30 minutes at 0.8 bar. All results are expressed as relative flux (membrane flux at 20°C/flux with Milli Q water at 20°C) versus filtrate mass. Experiments were carried out at pH 6 unless otherwise stated.
3.1.3 Results and Discussion
3.1.3.1 Membrane Type
For Bendigo water, the initial rate of flux decline was greatest for PES-2 and PVDF-1 membranes, followed by the PP and the PVDF-2 membrane (see Figure 3.3). While the PES-2 membrane showed rapid fouling, it reached a plateau flux after which the rate of flux decline was dramatically slower. This fouling behaviour was observed quite often, and we shall refer to the end of the initial fouling phase and the start of the flux plateau as the end of phase 1 fouling. The observed plateaus probably do not represent a flux at which no further fouling occurs, but rather the fouling rate has become too slow to be observed over the timeframe of these experiments. The fine pore size of this membrane (0.01 μm) suggests that a filter cake quickly establishes and becomes the main resistance to filtration. The hydrophilic nature of this membrane enabled flux recovery upon backwashing and stabilised the flux.
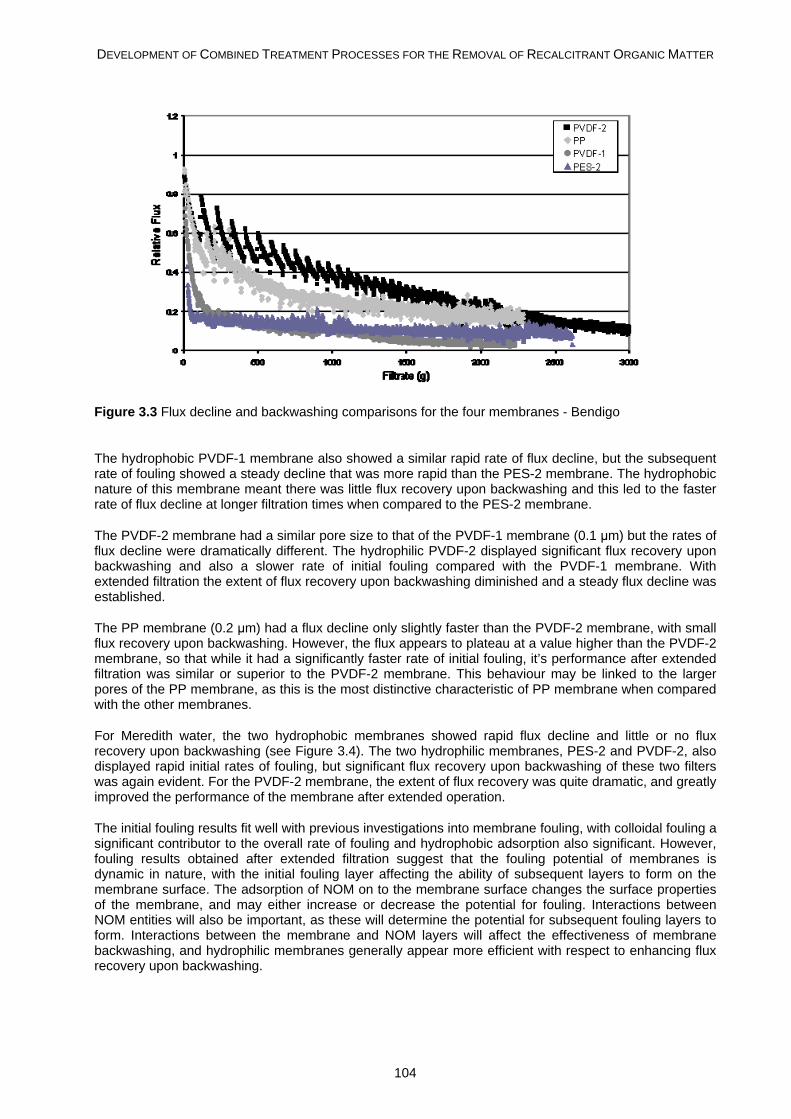
DEVELOPMENT OF COMBINED TREATMENT PROCESSES FOR THE REMOVAL OF RECALCITRANT ORGANIC MATTER
104
Figure 3.3 Flux decline and backwashing comparisons for the four membranes - Bendigo
The hydrophobic PVDF-1 membrane also showed a similar rapid rate of flux decline, but the subsequent rate of fouling showed a steady decline that was more rapid than the PES-2 membrane. The hydrophobic nature of this membrane meant there was little flux recovery upon backwashing and this led to the faster rate of flux decline at longer filtration times when compared to the PES-2 membrane.
The PVDF-2 membrane had a similar pore size to that of the PVDF-1 membrane (0.1 μm) but the rates of flux decline were dramatically different. The hydrophilic PVDF-2 displayed significant flux recovery upon backwashing and also a slower rate of initial fouling compared with the PVDF-1 membrane. With extended filtration the extent of flux recovery upon backwashing diminished and a steady flux decline was established.
The PP membrane (0.2 μm) had a flux decline only slightly faster than the PVDF-2 membrane, with small flux recovery upon backwashing. However, the flux appears to plateau at a value higher than the PVDF-2 membrane, so that while it had a significantly faster rate of initial fouling, it’s performance after extended filtration was similar or superior to the PVDF-2 membrane. This behaviour may be linked to the larger pores of the PP membrane, as this is the most distinctive characteristic of PP membrane when compared with the other membranes.
For Meredith water, the two hydrophobic membranes showed rapid flux decline and little or no flux recovery upon backwashing (see Figure 3.4). The two hydrophilic membranes, PES-2 and PVDF-2, also displayed rapid initial rates of fouling, but significant flux recovery upon backwashing of these two filters was again evident. For the PVDF-2 membrane, the extent of flux recovery was quite dramatic, and greatly improved the performance of the membrane after extended operation.
The initial fouling results fit well with previous investigations into membrane fouling, with colloidal fouling a significant contributor to the overall rate of fouling and hydrophobic adsorption also significant. However, fouling results obtained after extended filtration suggest that the fouling potential of membranes is dynamic in nature, with the initial fouling layer affecting the ability of subsequent layers to form on the membrane surface. The adsorption of NOM on to the membrane surface changes the surface properties of the membrane, and may either increase or decrease the potential for fouling. Interactions between NOM entities will also be important, as these will determine the potential for subsequent fouling layers to form. Interactions between the membrane and NOM layers will affect the effectiveness of membrane backwashing, and hydrophilic membranes generally appear more efficient with respect to enhancing flux recovery upon backwashing.
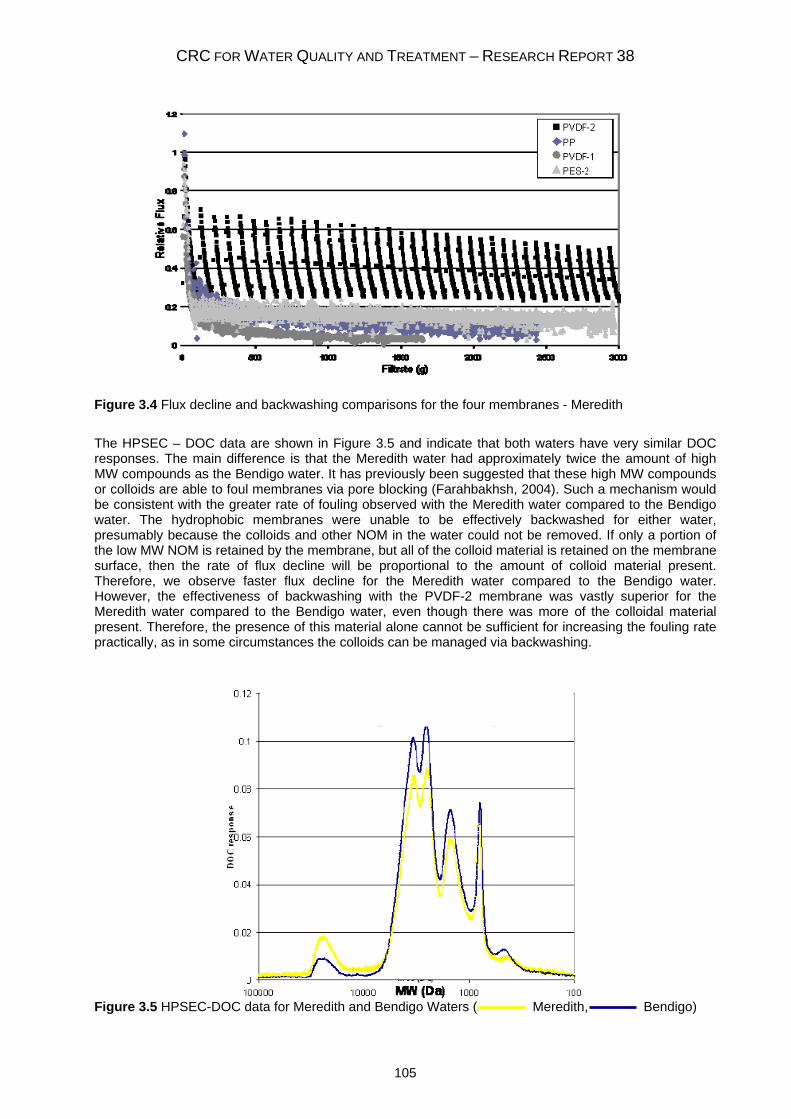
CRC FOR WATER QUALITY AND TREATMENT – RESEARCH REPORT 38
105
Figure 3.4 Flux decline and backwashing comparisons for the four membranes - Meredith
The HPSEC – DOC data are shown in Figure 3.5 and indicate that both waters have very similar DOC responses. The main difference is that the Meredith water had approximately twice the amount of high MW compounds as the Bendigo water. It has previously been suggested that these high MW compounds or colloids are able to foul membranes via pore blocking (Farahbakhsh, 2004). Such a mechanism would be consistent with the greater rate of fouling observed with the Meredith water compared to the Bendigo water. The hydrophobic membranes were unable to be effectively backwashed for either water, presumably because the colloids and other NOM in the water could not be removed. If only a portion of the low MW NOM is retained by the membrane, but all of the colloid material is retained on the membrane surface, then the rate of flux decline will be proportional to the amount of colloid material present. Therefore, we observe faster flux decline for the Meredith water compared to the Bendigo water. However, the effectiveness of backwashing with the PVDF-2 membrane was vastly superior for the Meredith water compared to the Bendigo water, even though there was more of the colloidal material present. Therefore, the presence of this material alone cannot be sufficient for increasing the fouling rate practically, as in some circumstances the colloids can be managed via backwashing.
Figure 3.5 HPSEC-DOC data for Meredith and Bendigo Waters ( Meredith, Bendigo)
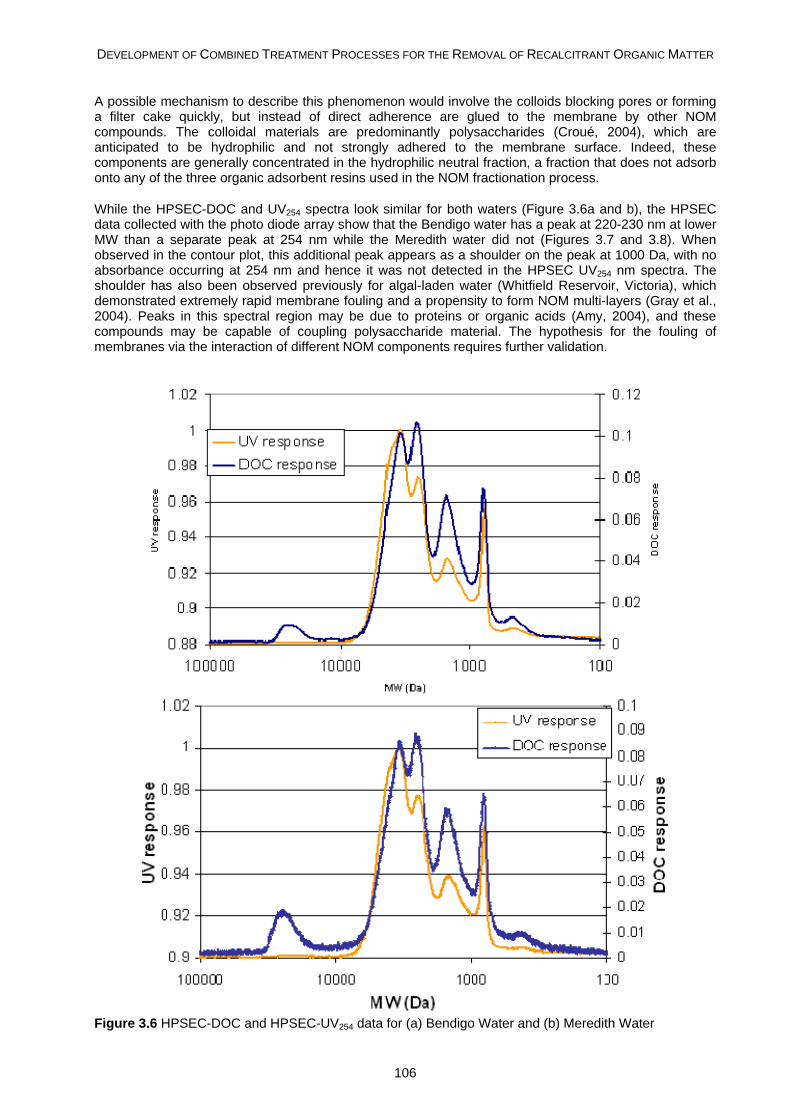
DEVELOPMENT OF COMBINED TREATMENT PROCESSES FOR THE REMOVAL OF RECALCITRANT ORGANIC MATTER
106
A possible mechanism to describe this phenomenon would involve the colloids blocking pores or forming a filter cake quickly, but instead of direct adherence are glued to the membrane by other NOM compounds. The colloidal materials are predominantly polysaccharides (Croué, 2004), which are anticipated to be hydrophilic and not strongly adhered to the membrane surface. Indeed, these components are generally concentrated in the hydrophilic neutral fraction, a fraction that does not adsorb onto any of the three organic adsorbent resins used in the NOM fractionation process.
While the HPSEC-DOC and UV254 spectra look similar for both waters (Figure 3.6a and b), the HPSEC data collected with the photo diode array show that the Bendigo water has a peak at 220-230 nm at lower MW than a separate peak at 254 nm while the Meredith water did not (Figures 3.7 and 3.8). When observed in the contour plot, this additional peak appears as a shoulder on the peak at 1000 Da, with no absorbance occurring at 254 nm and hence it was not detected in the HPSEC UV254 nm spectra. The shoulder has also been observed previously for algal-laden water (Whitfield Reservoir, Victoria), which demonstrated extremely rapid membrane fouling and a propensity to form NOM multi-layers (Gray et al., 2004). Peaks in this spectral region may be due to proteins or organic acids (Amy, 2004), and these compounds may be capable of coupling polysaccharide material. The hypothesis for the fouling of membranes via the interaction of different NOM components requires further validation.
Figure 3.6 HPSEC-DOC and HPSEC-UV254 data for (a) Bendigo Water and (b) Meredith Water
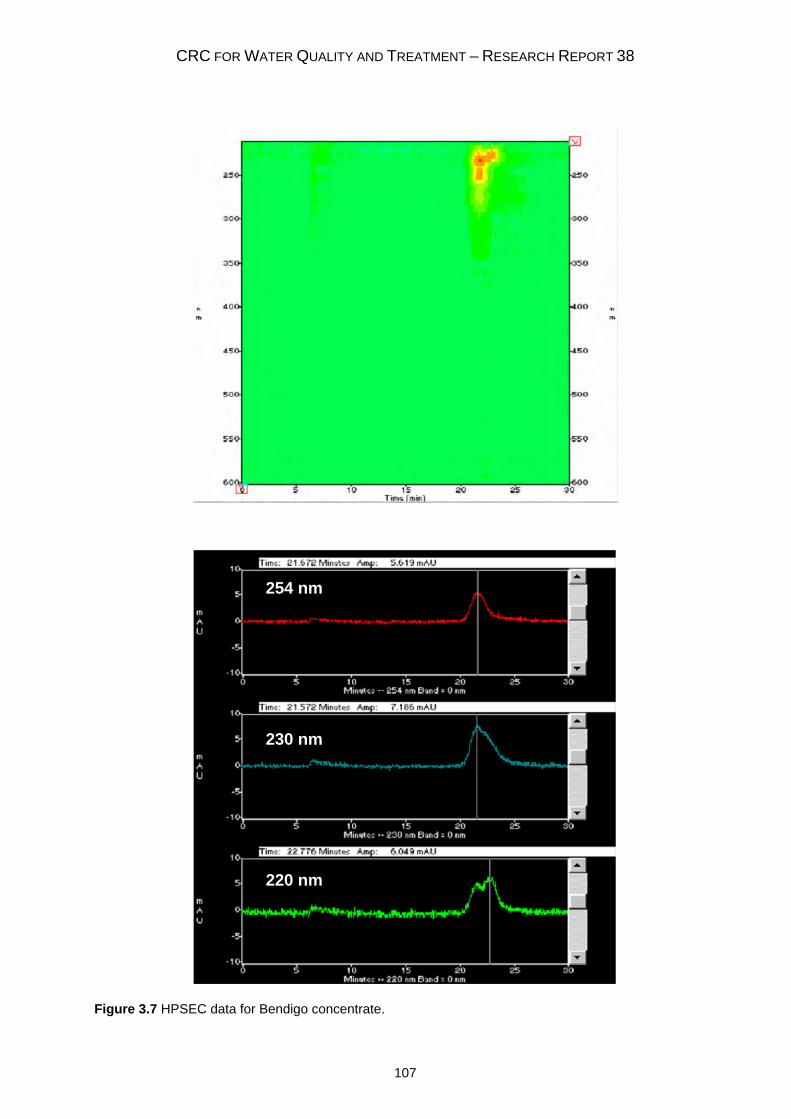
CRC FOR WATER QUALITY AND TREATMENT – RESEARCH REPORT 38
107
254 nm
230 nm
220 nm
254 nm
230 nm
220 nm
Figure 3.7 HPSEC data for Bendigo concentrate.
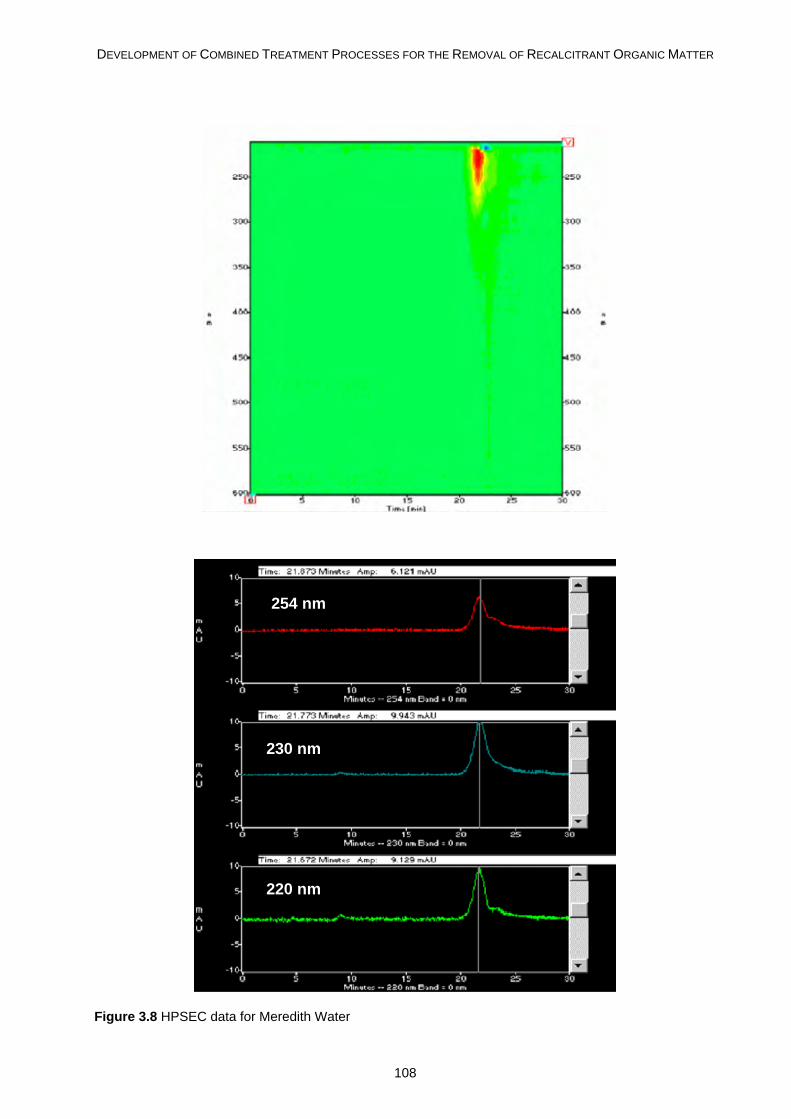
DEVELOPMENT OF COMBINED TREATMENT PROCESSES FOR THE REMOVAL OF RECALCITRANT ORGANIC MATTER
108
254 nm
230 nm
220 nm
254 nm
230 nm
220 nm
Figure 3.8 HPSEC data for Meredith Water
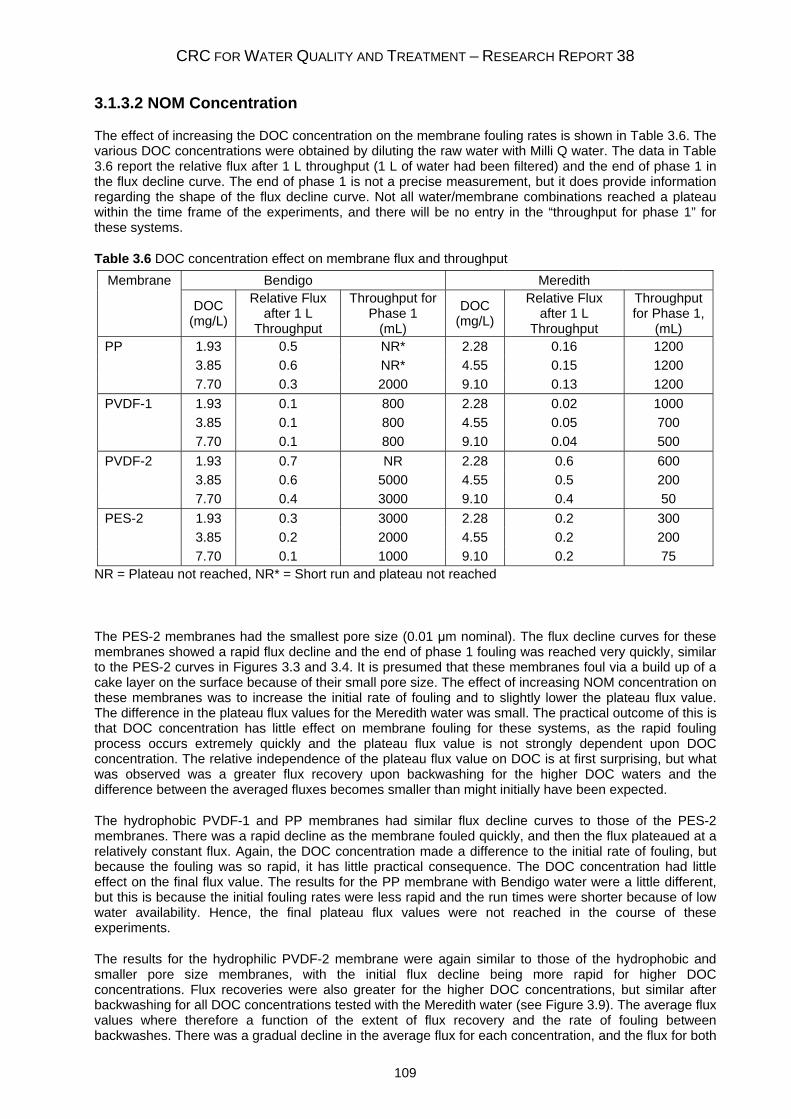
CRC FOR WATER QUALITY AND TREATMENT – RESEARCH REPORT 38
109
3.1.3.2 NOM Concentration
The effect of increasing the DOC concentration on the membrane fouling rates is shown in Table 3.6. The various DOC concentrations were obtained by diluting the raw water with Milli Q water. The data in Table 3.6 report the relative flux after 1 L throughput (1 L of water had been filtered) and the end of phase 1 in the flux decline curve. The end of phase 1 is not a precise measurement, but it does provide information regarding the shape of the flux decline curve. Not all water/membrane combinations reached a plateau within the time frame of the experiments, and there will be no entry in the “throughput for phase 1” for these systems.
Table 3.6 DOC concentration effect on membrane flux and throughput Membrane Bendigo Meredith
DOC (mg/L)
Relative Flux after 1 L
Throughput
Throughput for Phase 1
(mL)
DOC (mg/L)
Relative Flux after 1 L
Throughput
Throughput for Phase 1,
(mL) PP 1.93 0.5 NR* 2.28 0.16 1200 3.85 0.6 NR* 4.55 0.15 1200 7.70 0.3 2000 9.10 0.13 1200 PVDF-1 1.93 0.1 800 2.28 0.02 1000 3.85 0.1 800 4.55 0.05 700 7.70 0.1 800 9.10 0.04 500 PVDF-2 1.93 0.7 NR 2.28 0.6 600 3.85 0.6 5000 4.55 0.5 200 7.70 0.4 3000 9.10 0.4 50 PES-2 1.93 0.3 3000 2.28 0.2 300 3.85 0.2 2000 4.55 0.2 200 7.70 0.1 1000 9.10 0.2 75
NR = Plateau not reached, NR* = Short run and plateau not reached
The PES-2 membranes had the smallest pore size (0.01 μm nominal). The flux decline curves for these membranes showed a rapid flux decline and the end of phase 1 fouling was reached very quickly, similar to the PES-2 curves in Figures 3.3 and 3.4. It is presumed that these membranes foul via a build up of a cake layer on the surface because of their small pore size. The effect of increasing NOM concentration on these membranes was to increase the initial rate of fouling and to slightly lower the plateau flux value. The difference in the plateau flux values for the Meredith water was small. The practical outcome of this is that DOC concentration has little effect on membrane fouling for these systems, as the rapid fouling process occurs extremely quickly and the plateau flux value is not strongly dependent upon DOC concentration. The relative independence of the plateau flux value on DOC is at first surprising, but what was observed was a greater flux recovery upon backwashing for the higher DOC waters and the difference between the averaged fluxes becomes smaller than might initially have been expected.
The hydrophobic PVDF-1 and PP membranes had similar flux decline curves to those of the PES-2 membranes. There was a rapid decline as the membrane fouled quickly, and then the flux plateaued at a relatively constant flux. Again, the DOC concentration made a difference to the initial rate of fouling, but because the fouling was so rapid, it has little practical consequence. The DOC concentration had little effect on the final flux value. The results for the PP membrane with Bendigo water were a little different, but this is because the initial fouling rates were less rapid and the run times were shorter because of low water availability. Hence, the final plateau flux values were not reached in the course of these experiments.
The results for the hydrophilic PVDF-2 membrane were again similar to those of the hydrophobic and smaller pore size membranes, with the initial flux decline being more rapid for higher DOC concentrations. Flux recoveries were also greater for the higher DOC concentrations, but similar after backwashing for all DOC concentrations tested with the Meredith water (see Figure 3.9). The average flux values where therefore a function of the extent of flux recovery and the rate of fouling between backwashes. There was a gradual decline in the average flux for each concentration, and the flux for both
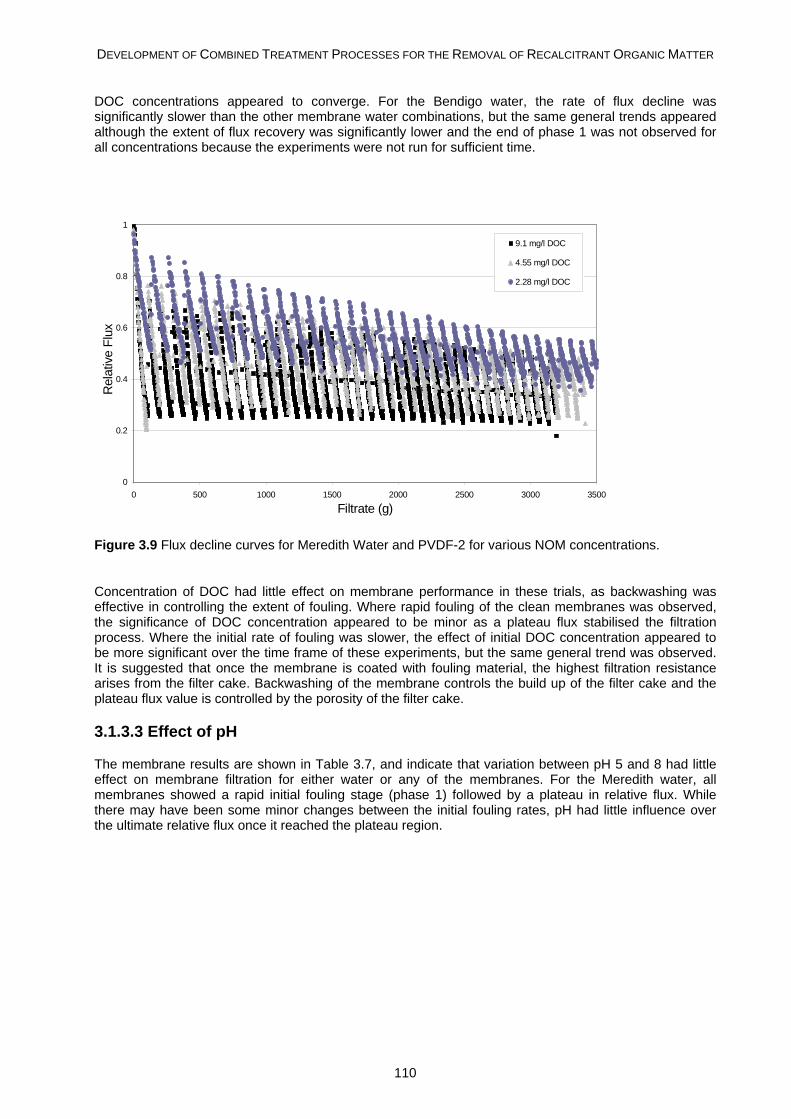
DEVELOPMENT OF COMBINED TREATMENT PROCESSES FOR THE REMOVAL OF RECALCITRANT ORGANIC MATTER
110
DOC concentrations appeared to converge. For the Bendigo water, the rate of flux decline was significantly slower than the other membrane water combinations, but the same general trends appeared although the extent of flux recovery was significantly lower and the end of phase 1 was not observed for all concentrations because the experiments were not run for sufficient time.
0
0.2
0.4
0.6
0.8
1
0 500 1000 1500 2000 2500 3000 3500
Filtrate (g)
Rel
ativ
e Fl
ux
9.1 mg/l DOC
4.55 mg/l DOC
2.28 mg/l DOC
Figure 3.9 Flux decline curves for Meredith Water and PVDF-2 for various NOM concentrations.
Concentration of DOC had little effect on membrane performance in these trials, as backwashing was effective in controlling the extent of fouling. Where rapid fouling of the clean membranes was observed, the significance of DOC concentration appeared to be minor as a plateau flux stabilised the filtration process. Where the initial rate of fouling was slower, the effect of initial DOC concentration appeared to be more significant over the time frame of these experiments, but the same general trend was observed. It is suggested that once the membrane is coated with fouling material, the highest filtration resistance arises from the filter cake. Backwashing of the membrane controls the build up of the filter cake and the plateau flux value is controlled by the porosity of the filter cake.
3.1.3.3 Effect of pH
The membrane results are shown in Table 3.7, and indicate that variation between pH 5 and 8 had little effect on membrane filtration for either water or any of the membranes. For the Meredith water, all membranes showed a rapid initial fouling stage (phase 1) followed by a plateau in relative flux. While there may have been some minor changes between the initial fouling rates, pH had little influence over the ultimate relative flux once it reached the plateau region.
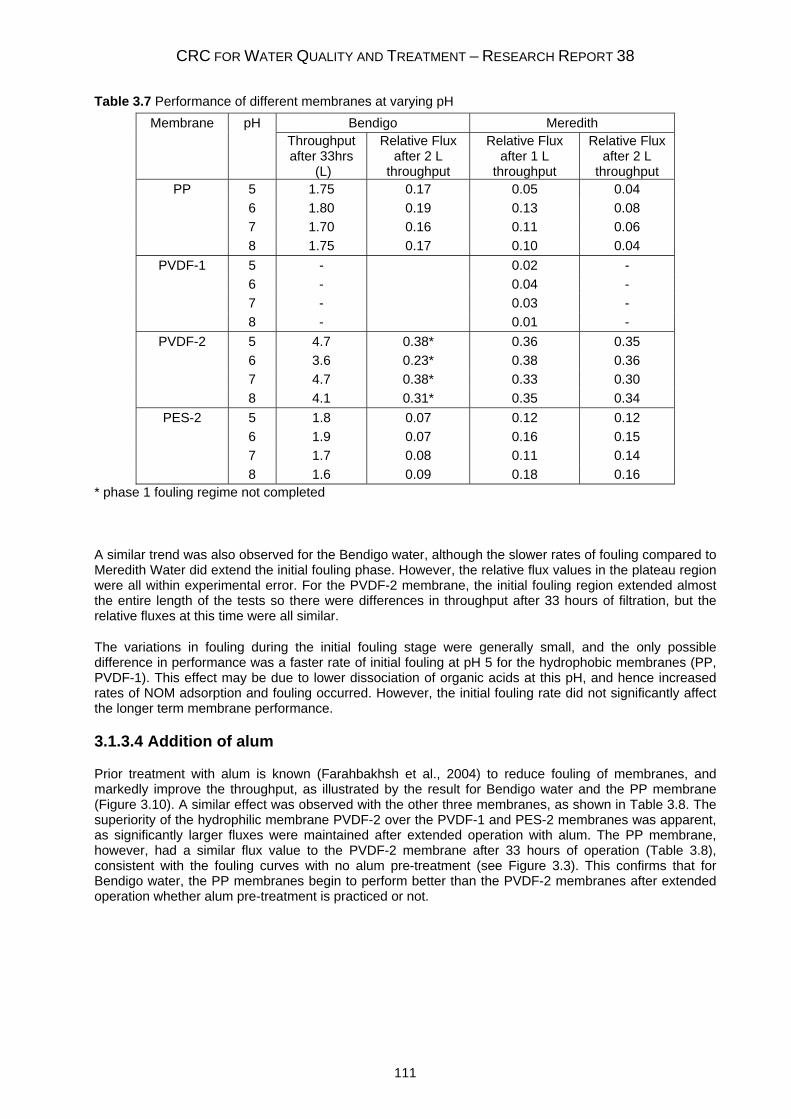
CRC FOR WATER QUALITY AND TREATMENT – RESEARCH REPORT 38
111
Table 3.7 Performance of different membranes at varying pH Membrane pH Bendigo Meredith
Throughput after 33hrs
(L)
Relative Flux after 2 L
throughput
Relative Flux after 1 L
throughput
Relative Flux after 2 L
throughput PP 5 1.75 0.17 0.05 0.04
6 1.80 0.19 0.13 0.08 7 1.70 0.16 0.11 0.06 8 1.75 0.17 0.10 0.04
PVDF-1 5 - 0.02 - 6 - 0.04 - 7 - 0.03 - 8 - 0.01 -
PVDF-2 5 4.7 0.38* 0.36 0.35 6 3.6 0.23* 0.38 0.36 7 4.7 0.38* 0.33 0.30 8 4.1 0.31* 0.35 0.34
PES-2 5 1.8 0.07 0.12 0.12 6 1.9 0.07 0.16 0.15 7 1.7 0.08 0.11 0.14 8 1.6 0.09 0.18 0.16
* phase 1 fouling regime not completed
A similar trend was also observed for the Bendigo water, although the slower rates of fouling compared to Meredith Water did extend the initial fouling phase. However, the relative flux values in the plateau region were all within experimental error. For the PVDF-2 membrane, the initial fouling region extended almost the entire length of the tests so there were differences in throughput after 33 hours of filtration, but the relative fluxes at this time were all similar.
The variations in fouling during the initial fouling stage were generally small, and the only possible difference in performance was a faster rate of initial fouling at pH 5 for the hydrophobic membranes (PP, PVDF-1). This effect may be due to lower dissociation of organic acids at this pH, and hence increased rates of NOM adsorption and fouling occurred. However, the initial fouling rate did not significantly affect the longer term membrane performance.
3.1.3.4 Addition of alum
Prior treatment with alum is known (Farahbakhsh et al., 2004) to reduce fouling of membranes, and markedly improve the throughput, as illustrated by the result for Bendigo water and the PP membrane (Figure 3.10). A similar effect was observed with the other three membranes, as shown in Table 3.8. The superiority of the hydrophilic membrane PVDF-2 over the PVDF-1 and PES-2 membranes was apparent, as significantly larger fluxes were maintained after extended operation with alum. The PP membrane, however, had a similar flux value to the PVDF-2 membrane after 33 hours of operation (Table 3.8), consistent with the fouling curves with no alum pre-treatment (see Figure 3.3). This confirms that for Bendigo water, the PP membranes begin to perform better than the PVDF-2 membranes after extended operation whether alum pre-treatment is practiced or not.
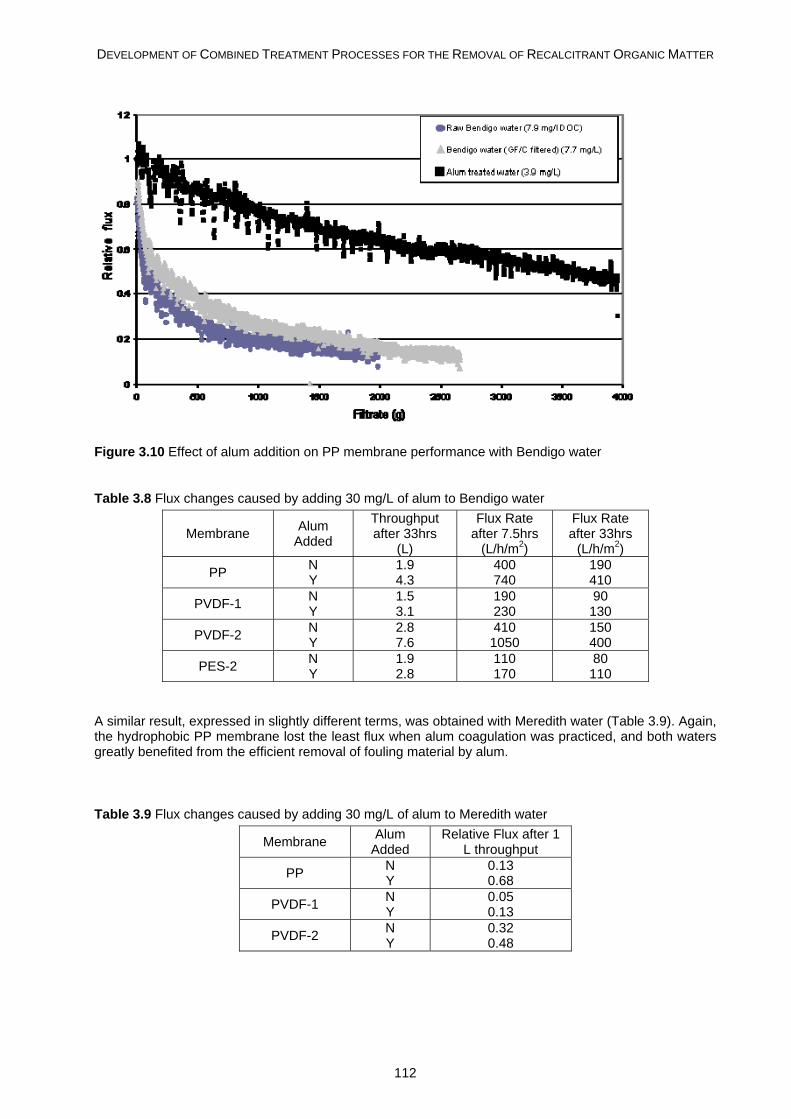
DEVELOPMENT OF COMBINED TREATMENT PROCESSES FOR THE REMOVAL OF RECALCITRANT ORGANIC MATTER
112
Figure 3.10 Effect of alum addition on PP membrane performance with Bendigo water
Table 3.8 Flux changes caused by adding 30 mg/L of alum to Bendigo water
Membrane Alum Added
Throughput after 33hrs
(L)
Flux Rate after 7.5hrs
(L/h/m2)
Flux Rate after 33hrs
(L/h/m2)
PP N Y
1.9 4.3
400 740
190 410
PVDF-1 N Y
1.5 3.1
190 230
90 130
PVDF-2 N Y
2.8 7.6
410 1050
150 400
PES-2 N Y
1.9 2.8
110 170
80 110
A similar result, expressed in slightly different terms, was obtained with Meredith water (Table 3.9). Again, the hydrophobic PP membrane lost the least flux when alum coagulation was practiced, and both waters greatly benefited from the efficient removal of fouling material by alum.
Table 3.9 Flux changes caused by adding 30 mg/L of alum to Meredith water
Membrane Alum Added
Relative Flux after 1 L throughput
PP N Y
0.13 0.68
PVDF-1 N Y
0.05 0.13
PVDF-2 N Y
0.32 0.48
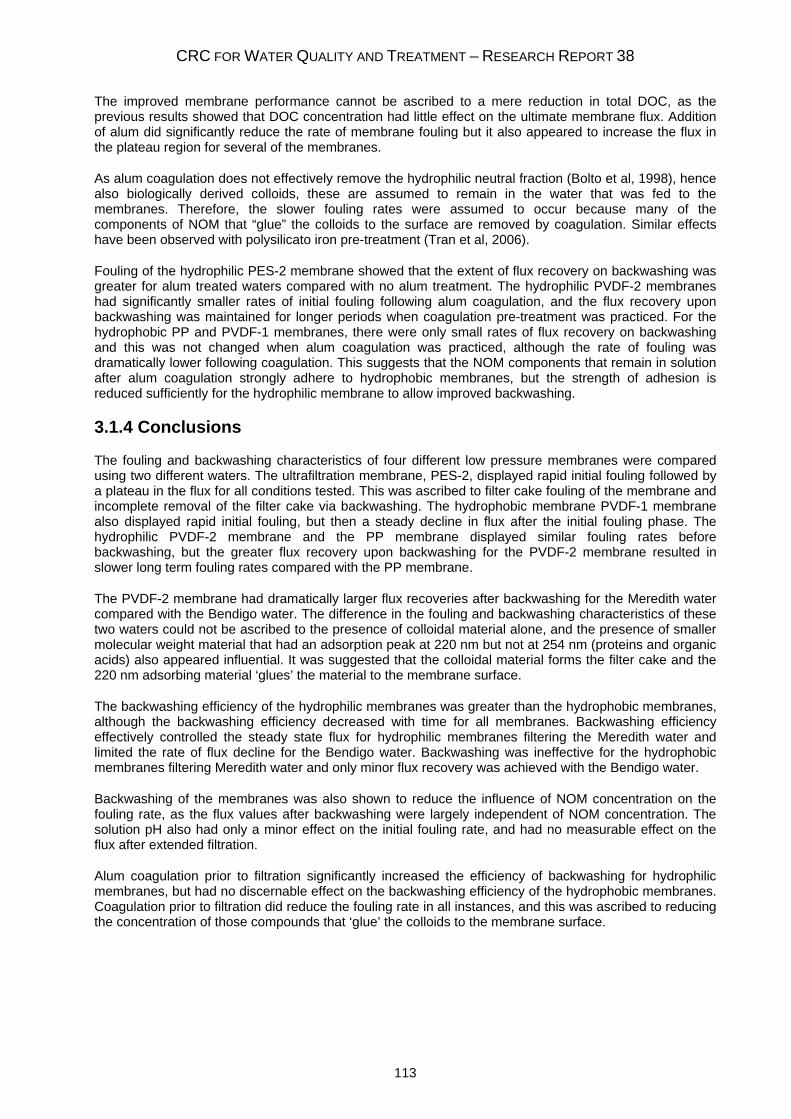
CRC FOR WATER QUALITY AND TREATMENT – RESEARCH REPORT 38
113
The improved membrane performance cannot be ascribed to a mere reduction in total DOC, as the previous results showed that DOC concentration had little effect on the ultimate membrane flux. Addition of alum did significantly reduce the rate of membrane fouling but it also appeared to increase the flux in the plateau region for several of the membranes.
As alum coagulation does not effectively remove the hydrophilic neutral fraction (Bolto et al, 1998), hence also biologically derived colloids, these are assumed to remain in the water that was fed to the membranes. Therefore, the slower fouling rates were assumed to occur because many of the components of NOM that “glue” the colloids to the surface are removed by coagulation. Similar effects have been observed with polysilicato iron pre-treatment (Tran et al, 2006).
Fouling of the hydrophilic PES-2 membrane showed that the extent of flux recovery on backwashing was greater for alum treated waters compared with no alum treatment. The hydrophilic PVDF-2 membranes had significantly smaller rates of initial fouling following alum coagulation, and the flux recovery upon backwashing was maintained for longer periods when coagulation pre-treatment was practiced. For the hydrophobic PP and PVDF-1 membranes, there were only small rates of flux recovery on backwashing and this was not changed when alum coagulation was practiced, although the rate of fouling was dramatically lower following coagulation. This suggests that the NOM components that remain in solution after alum coagulation strongly adhere to hydrophobic membranes, but the strength of adhesion is reduced sufficiently for the hydrophilic membrane to allow improved backwashing.
3.1.4 Conclusions
The fouling and backwashing characteristics of four different low pressure membranes were compared using two different waters. The ultrafiltration membrane, PES-2, displayed rapid initial fouling followed by a plateau in the flux for all conditions tested. This was ascribed to filter cake fouling of the membrane and incomplete removal of the filter cake via backwashing. The hydrophobic membrane PVDF-1 membrane also displayed rapid initial fouling, but then a steady decline in flux after the initial fouling phase. The hydrophilic PVDF-2 membrane and the PP membrane displayed similar fouling rates before backwashing, but the greater flux recovery upon backwashing for the PVDF-2 membrane resulted in slower long term fouling rates compared with the PP membrane.
The PVDF-2 membrane had dramatically larger flux recoveries after backwashing for the Meredith water compared with the Bendigo water. The difference in the fouling and backwashing characteristics of these two waters could not be ascribed to the presence of colloidal material alone, and the presence of smaller molecular weight material that had an adsorption peak at 220 nm but not at 254 nm (proteins and organic acids) also appeared influential. It was suggested that the colloidal material forms the filter cake and the 220 nm adsorbing material ‘glues’ the material to the membrane surface.
The backwashing efficiency of the hydrophilic membranes was greater than the hydrophobic membranes, although the backwashing efficiency decreased with time for all membranes. Backwashing efficiency effectively controlled the steady state flux for hydrophilic membranes filtering the Meredith water and limited the rate of flux decline for the Bendigo water. Backwashing was ineffective for the hydrophobic membranes filtering Meredith water and only minor flux recovery was achieved with the Bendigo water.
Backwashing of the membranes was also shown to reduce the influence of NOM concentration on the fouling rate, as the flux values after backwashing were largely independent of NOM concentration. The solution pH also had only a minor effect on the initial fouling rate, and had no measurable effect on the flux after extended filtration.
Alum coagulation prior to filtration significantly increased the efficiency of backwashing for hydrophilic membranes, but had no discernable effect on the backwashing efficiency of the hydrophobic membranes. Coagulation prior to filtration did reduce the fouling rate in all instances, and this was ascribed to reducing the concentration of those compounds that ‘glue’ the colloids to the membrane surface.
DEVELOPMENT OF COMBINED TREATMENT PROCESSES FOR THE REMOVAL OF RECALCITRANT ORGANIC MATTER
114
3.1.5 References
Allpike B, Joll C, Heitz A, Kagi R, Slunjski M, Smith P, Tattersall J (2003) Size exclusion chromatography as a tool for examination of drinking water treatment processes, OzWater Conference, AWA, Perth, Australia, oz140.
Allpike BP, Heitz A, Joll CA, Kagi RI, Abbt-Braun G, Frimmel FH, Brinkmann T, Her N, Amy G (2005) Size exclusion chromatography to characterise DOC removal in drinking water treatment, Environmental Science and Technology 39, 2334-2342
Allpike BP, Heitz A, Joll CA, Kagi RI (2006) Development of an organic carbon detector for size exclusion chromatography, Proceedings, Combined National Conference of the Australian Organic Geochemists and the NOM Interest Group, Rottnest Island, Perth, WA (2006) pp. 30-31.
Amy G and Cho J (1999) Interactions between natural organic matter (NOM) and membranes: Rejection and fouling. Water Science and Technology 40(9), 131-139.
Amy G, Cho J, Yoon Y, Wright S, Clark MM, Molis E, Combe C, Wang Y, Lucas P, Lee Y, Kumar M, Howe K, Kim K-S, Pelligrino J and Irvine S (2001) NOM rejection by, and fouling of, NF and UF membranes. AwwaRF Report, AWWA Research Foundation, Denver.
Amy G (2004). Size exclusion chromatography (SEC) with multiple detectors: A powerful tool in treatment process selection and performance monitoring. IWA Natural organic matter research: Innovations and applications for drinking water, Whalers Inn, victor Harbour, SA, March 2-5, (http://www.waterquality.crc.org.au/nom/NOM_conference/NOM_conference_website.htm)
Bolto B, Dixon D, Eldridge R, King S, Toifl M (1998) The use of cationic polymers as primary coagulants in water treatment, in Chemical Water and Wastewater Treatment V, eds. H.H. Hahn, E. Hoffman and H. Odegaard, Springer, Berlin, pp. 171-185.
Carroll (1999) Personal communication Carroll T, King S, Gray SR, Bolto B and Booker NA (2000) The fouling of microfiltration membranes by
NOM after coagulation treatment. Water Research 34, 2861-2868. Chang Y and Benjamin MM (1996) Iron oxide adsorption and UF to remove NOM and control fouling.
Journal of American Water Works Association 88(12), 74-88. Cho J, Amy G, Pelligrino J and Yoon Y (1998) Characterisation of clean and natural organic matter fouled
NF and UF membranes. Desalination 118, 101-108. Croué J-P (2004) Isolation of humic and non-humic NOM fractions: Structural characterisation.
Environmental Monitoring & Assessment 92, 193-207. Dryfuse MJ, Miltner RJ and Summers RS (1995) The removal of molecular size and humic/non-humic
fractions of DBP precursors by optimising coagulation. In Proceedings of the AWWA Annual conference, Anaheim, California, pp217-241
Fan L, Harris JL, Roddick FA and Booker NA (2001) Influence of the characteristics of natural organic matter on the fouling of microfiltration membranes. Water Research 35, 4455-4463.
Farahbakhsh K, Svrcek C, Guest RK and Smith DW (2004) A review of the impact of chemical pre-treatment on low-pressure water treatment membranes. Journal of Environmental and Engineering Science 3, 237-253.
Gray SR, Ritchie CB and Bolto BA (2003) Predicting NOM fouling of low pressure membranes. Proceedings of the International Membrane Science & Technology Conference, Sydney, Paper 203.
Gray SR, Ritchie CB, Bolto BA (2004) Effect of fractionated NOM on low pressure membrane flux declines, Water Science and Technology 4(4), 189-196.
Gu B, Schmitt J, Chen Z, Liang L and McCarthy JF (1995) Adsorption and desorption of different organic matter fractions on iron oxide. Geochimica et Cosmochimica Acta 59, 219-229.
Hong S and Elimelech M (1997) Chemical and physical aspects of natural organic matter (NOM) fouling of nanofiltration membranes. Journal of Membrane Science 132, 159-181.
Howe KJ and Clarke MM (2002) Fouling of microfiltration and ultrafiltration membranes by natural waters. Environmental Science and Technology 36, 3571-3576.
Jarusutthirak C, Amy G and Croué J-P (2002) Fouling characteristics of wastewater effluent organic matter (EfOM) isolates on NF and UF membranes. Desalination 145, 247-255
Jones KL and O’Melia CR (2001) Ultrafiltration of protein and humic substances: effect of solution chemistry on fouling and flux decline. Journal of Membrane Science 193, 163-173.
Jucker C and Clark MM (1994) Adsorption of humic substances on hydrophobic ultrafiltration membranes. Journal of Membrane Science 97, 37-52.
CRC FOR WATER QUALITY AND TREATMENT – RESEARCH REPORT 38
115
Kimura K, Hane Y, Watanabe Y, Amy G and Ohkuma N (2004) Irreversible membrane fouling during ultrafiltration of surface water. Water Research 38, 3431-3441.
Laîné J-M, Hagstrom JP, Clark, MM and Mallevialle J (1989) Effects of ultrafiltration membrane composition. Journal of American Water Works Association 81(11), 61-67.
Lee N-H, Amy G, Croué J-P and Buisson H (2004) Identification and understanding of fouling in low-pressure membrane (MF/UF) filtration by natural organic matter. Water Research 38, 4511-4523.
Leenheer JA (1981) Comprehensive approach to preparative isolation and fractionation of dissolved organic carbon from natural waters and wastewaters, Environmental Science and Technology 15 (5) 578-587.
Lin C-F, Liu S-H and Hao OJ (2001) Effect of functional groups of humic substances on UF performance. Water Research 35, 2395-2402.
Makdissy G, Croué J-P, Amy G and Buisson H (2004) Fouling of a polyethersulfone ultrafiltration membrane by natural organic matter. IWA Natural organic matter research: Innovations and applications for drinking water, Whalers Inn, victor Harbour, SA, March 2-5, (http://www.waterquality.crc.org.au/nom/NOM_conference/NOM_conference_website.htm)
Nilson JA and DiGiano FA (1996) Influence of NOM composition on nanofiltration. Journal of American Water Works Association 88(5), 53-66.
Nyström M, Ruohomäki K and Kaipia L (1996) Humic acid as a fouling agent in filtration. Desalination 106, 79-87.
Schäfer AI, Fane AG and Waite TD (1998) Nanofiltration of natural organic matter: Removal, fouling and the influence of multivalent ions. Desalination 118, 109-122.
Tran T, Gray SR, Naughton R, Bolto BA (2006) Polysilicato-iron for improved NOM removal and membrane performance, Journal of Membrane Science 280, 560-571.
White MC, Thompson JD, Harrington GW and Singer PC (1997) Evaluating criteria for enhanced coagulation compliance, Journal of American Water Works Association 89(5), 64-77
Yoon S-H, Lee C-H, Kim K-J and Fane AG (1998) Effect of calcium ion on the fouling of nanofilter by humic acid in drinking water production. Water Research 32, 2180-2186.
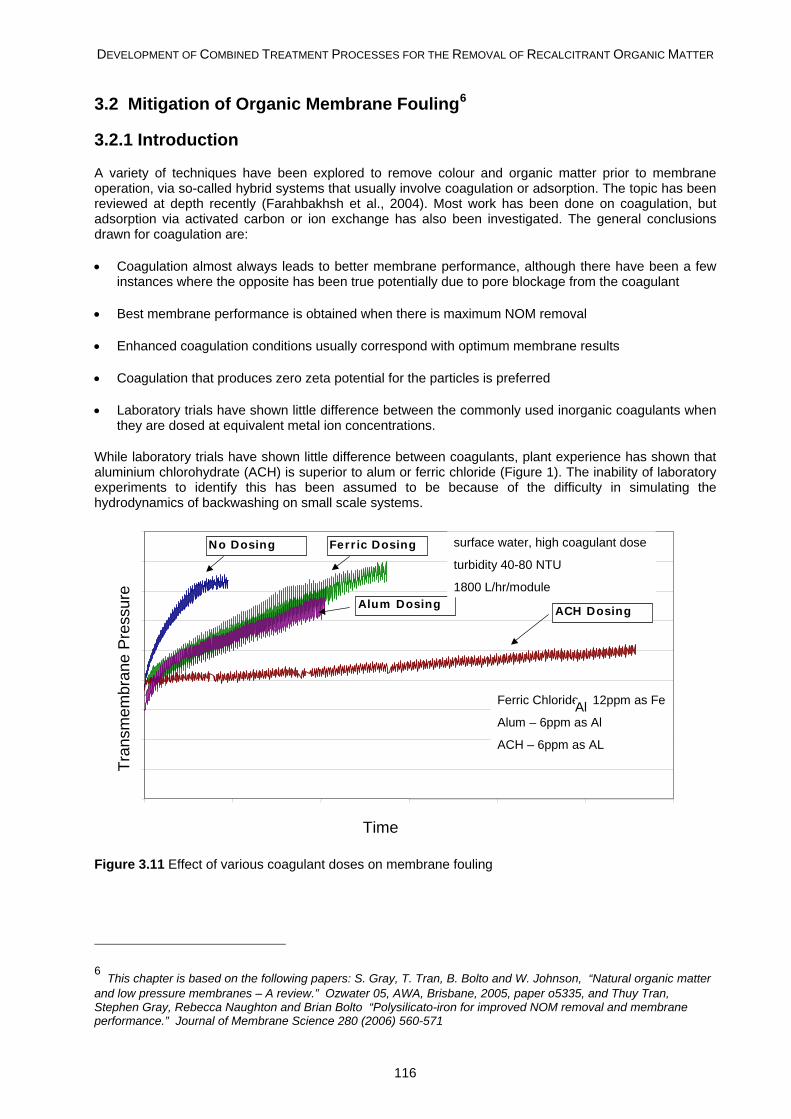
DEVELOPMENT OF COMBINED TREATMENT PROCESSES FOR THE REMOVAL OF RECALCITRANT ORGANIC MATTER
116
3.2 Mitigation of Organic Membrane Fouling6
3.2.1 Introduction
A variety of techniques have been explored to remove colour and organic matter prior to membrane operation, via so-called hybrid systems that usually involve coagulation or adsorption. The topic has been reviewed at depth recently (Farahbakhsh et al., 2004). Most work has been done on coagulation, but adsorption via activated carbon or ion exchange has also been investigated. The general conclusions drawn for coagulation are:
• Coagulation almost always leads to better membrane performance, although there have been a few instances where the opposite has been true potentially due to pore blockage from the coagulant
• Best membrane performance is obtained when there is maximum NOM removal
• Enhanced coagulation conditions usually correspond with optimum membrane results
• Coagulation that produces zero zeta potential for the particles is preferred
• Laboratory trials have shown little difference between the commonly used inorganic coagulants when they are dosed at equivalent metal ion concentrations.
While laboratory trials have shown little difference between coagulants, plant experience has shown that aluminium chlorohydrate (ACH) is superior to alum or ferric chloride (Figure 1). The inability of laboratory experiments to identify this has been assumed to be because of the difficulty in simulating the hydrodynamics of backwashing on small scale systems.
0
20
40
60
80
100
120
140
160
180
0 1 2 3 4 5 6Days
TMP
(kPa
)
ACH DosingAlum Dosing
Ferric DosingNo Dosing Memfarm, high coagulant dosingTurbidity 40 - 80NTU1800 l/hr/module, 81 lmh
Ferric Chloride – 12ppm as Fe
Alum – 6ppm as Al
ACH – 6ppm as AL
Tran
smem
bran
e P
ress
ure
Time
surface water, high coagulant dose
turbidity 40-80 NTU
1800 L/hr/module
Figure 3.11 Effect of various coagulant doses on membrane fouling
6 This chapter is based on the following papers: S. Gray, T. Tran, B. Bolto and W. Johnson, “Natural organic matter
and low pressure membranes – A review.” Ozwater 05, AWA, Brisbane, 2005, paper o5335, and Thuy Tran, Stephen Gray, Rebecca Naughton and Brian Bolto “Polysilicato-iron for improved NOM removal and membrane performance.” Journal of Membrane Science 280 (2006) 560-571
Al
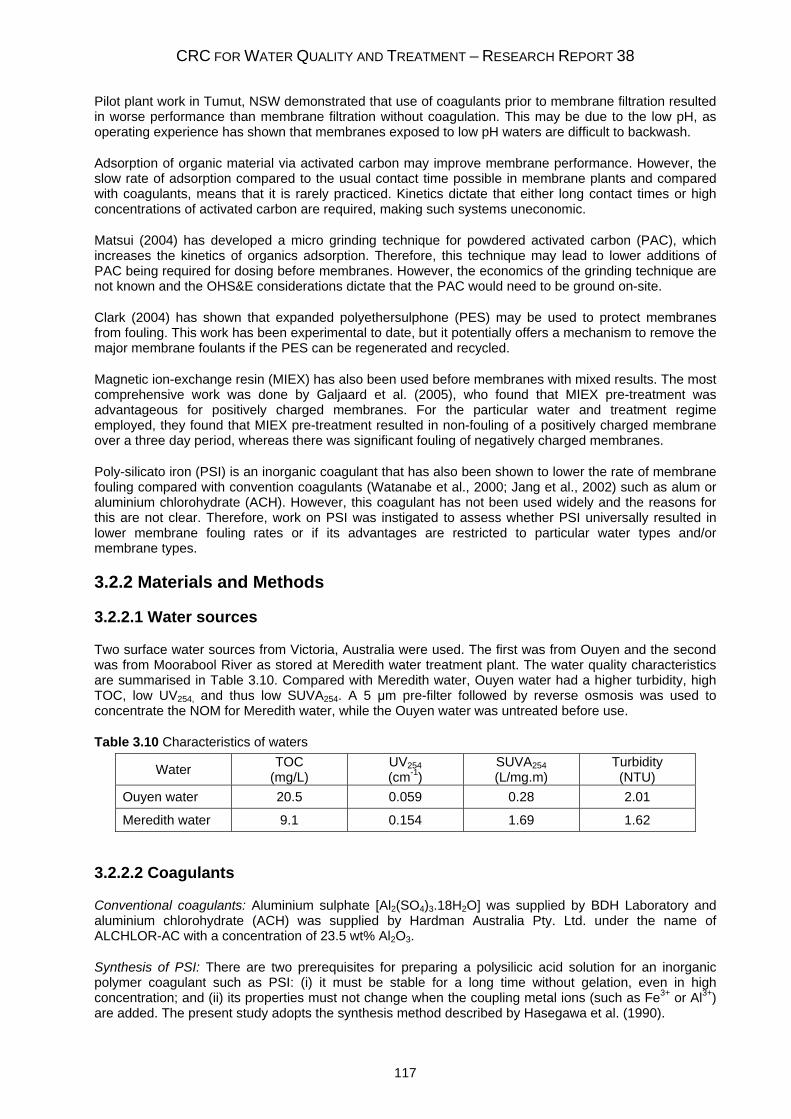
CRC FOR WATER QUALITY AND TREATMENT – RESEARCH REPORT 38
117
Pilot plant work in Tumut, NSW demonstrated that use of coagulants prior to membrane filtration resulted in worse performance than membrane filtration without coagulation. This may be due to the low pH, as operating experience has shown that membranes exposed to low pH waters are difficult to backwash.
Adsorption of organic material via activated carbon may improve membrane performance. However, the slow rate of adsorption compared to the usual contact time possible in membrane plants and compared with coagulants, means that it is rarely practiced. Kinetics dictate that either long contact times or high concentrations of activated carbon are required, making such systems uneconomic.
Matsui (2004) has developed a micro grinding technique for powdered activated carbon (PAC), which increases the kinetics of organics adsorption. Therefore, this technique may lead to lower additions of PAC being required for dosing before membranes. However, the economics of the grinding technique are not known and the OHS&E considerations dictate that the PAC would need to be ground on-site.
Clark (2004) has shown that expanded polyethersulphone (PES) may be used to protect membranes from fouling. This work has been experimental to date, but it potentially offers a mechanism to remove the major membrane foulants if the PES can be regenerated and recycled.
Magnetic ion-exchange resin (MIEX) has also been used before membranes with mixed results. The most comprehensive work was done by Galjaard et al. (2005), who found that MIEX pre-treatment was advantageous for positively charged membranes. For the particular water and treatment regime employed, they found that MIEX pre-treatment resulted in non-fouling of a positively charged membrane over a three day period, whereas there was significant fouling of negatively charged membranes.
Poly-silicato iron (PSI) is an inorganic coagulant that has also been shown to lower the rate of membrane fouling compared with convention coagulants (Watanabe et al., 2000; Jang et al., 2002) such as alum or aluminium chlorohydrate (ACH). However, this coagulant has not been used widely and the reasons for this are not clear. Therefore, work on PSI was instigated to assess whether PSI universally resulted in lower membrane fouling rates or if its advantages are restricted to particular water types and/or membrane types.
3.2.2 Materials and Methods
3.2.2.1 Water sources
Two surface water sources from Victoria, Australia were used. The first was from Ouyen and the second was from Moorabool River as stored at Meredith water treatment plant. The water quality characteristics are summarised in Table 3.10. Compared with Meredith water, Ouyen water had a higher turbidity, high TOC, low UV254, and thus low SUVA254. A 5 μm pre-filter followed by reverse osmosis was used to concentrate the NOM for Meredith water, while the Ouyen water was untreated before use.
Table 3.10 Characteristics of waters
Water TOC (mg/L)
UV254 (cm-1)
SUVA254 (L/mg.m)
Turbidity (NTU)
Ouyen water 20.5 0.059 0.28 2.01
Meredith water 9.1 0.154 1.69 1.62
3.2.2.2 Coagulants
Conventional coagulants: Aluminium sulphate [Al2(SO4)3.18H2O] was supplied by BDH Laboratory and aluminium chlorohydrate (ACH) was supplied by Hardman Australia Pty. Ltd. under the name of ALCHLOR-AC with a concentration of 23.5 wt% Al2O3.
Synthesis of PSI: There are two prerequisites for preparing a polysilicic acid solution for an inorganic polymer coagulant such as PSI: (i) it must be stable for a long time without gelation, even in high concentration; and (ii) its properties must not change when the coupling metal ions (such as Fe3+ or Al3+) are added. The present study adopts the synthesis method described by Hasegawa et al. (1990).
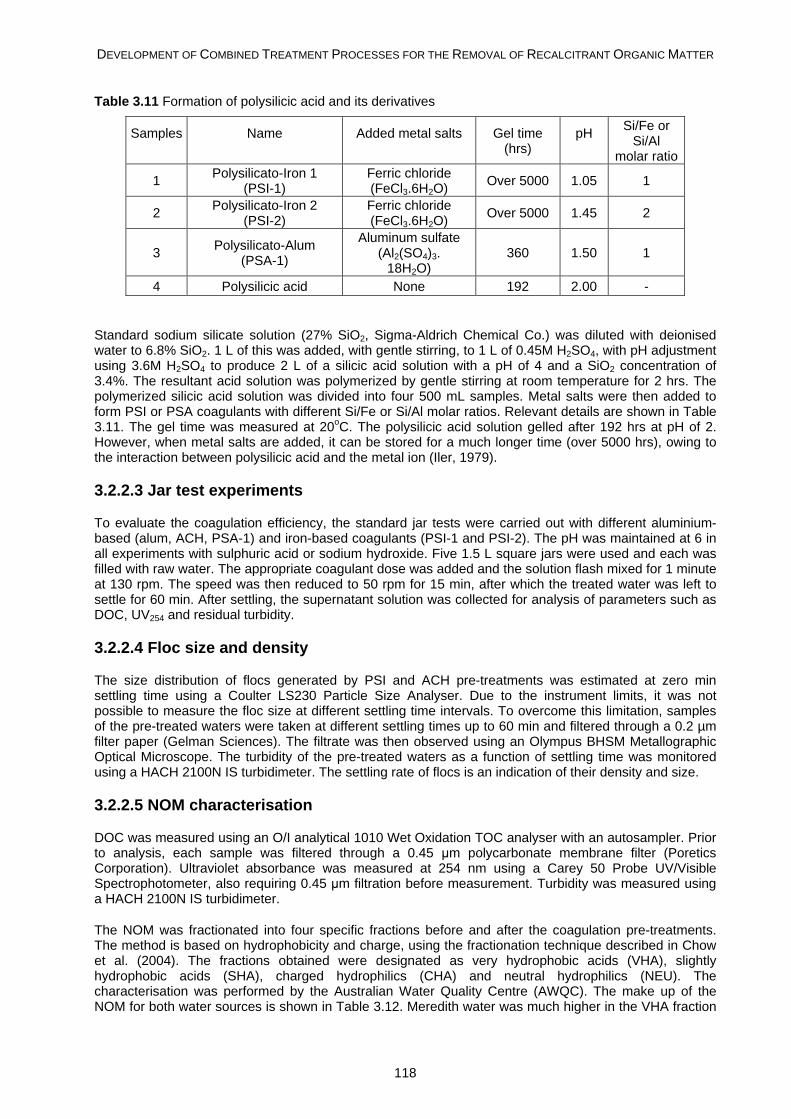
DEVELOPMENT OF COMBINED TREATMENT PROCESSES FOR THE REMOVAL OF RECALCITRANT ORGANIC MATTER
118
Table 3.11 Formation of polysilicic acid and its derivatives
Standard sodium silicate solution (27% SiO2, Sigma-Aldrich Chemical Co.) was diluted with deionised water to 6.8% SiO2. 1 L of this was added, with gentle stirring, to 1 L of 0.45M H2SO4, with pH adjustment using 3.6M H2SO4 to produce 2 L of a silicic acid solution with a pH of 4 and a SiO2 concentration of 3.4%. The resultant acid solution was polymerized by gentle stirring at room temperature for 2 hrs. The polymerized silicic acid solution was divided into four 500 mL samples. Metal salts were then added to form PSI or PSA coagulants with different Si/Fe or Si/Al molar ratios. Relevant details are shown in Table 3.11. The gel time was measured at 20oC. The polysilicic acid solution gelled after 192 hrs at pH of 2. However, when metal salts are added, it can be stored for a much longer time (over 5000 hrs), owing to the interaction between polysilicic acid and the metal ion (Iler, 1979).
3.2.2.3 Jar test experiments
To evaluate the coagulation efficiency, the standard jar tests were carried out with different aluminium-based (alum, ACH, PSA-1) and iron-based coagulants (PSI-1 and PSI-2). The pH was maintained at 6 in all experiments with sulphuric acid or sodium hydroxide. Five 1.5 L square jars were used and each was filled with raw water. The appropriate coagulant dose was added and the solution flash mixed for 1 minute at 130 rpm. The speed was then reduced to 50 rpm for 15 min, after which the treated water was left to settle for 60 min. After settling, the supernatant solution was collected for analysis of parameters such as DOC, UV254 and residual turbidity.
3.2.2.4 Floc size and density
The size distribution of flocs generated by PSI and ACH pre-treatments was estimated at zero min settling time using a Coulter LS230 Particle Size Analyser. Due to the instrument limits, it was not possible to measure the floc size at different settling time intervals. To overcome this limitation, samples of the pre-treated waters were taken at different settling times up to 60 min and filtered through a 0.2 µm filter paper (Gelman Sciences). The filtrate was then observed using an Olympus BHSM Metallographic Optical Microscope. The turbidity of the pre-treated waters as a function of settling time was monitored using a HACH 2100N IS turbidimeter. The settling rate of flocs is an indication of their density and size.
3.2.2.5 NOM characterisation
DOC was measured using an O/I analytical 1010 Wet Oxidation TOC analyser with an autosampler. Prior to analysis, each sample was filtered through a 0.45 μm polycarbonate membrane filter (Poretics Corporation). Ultraviolet absorbance was measured at 254 nm using a Carey 50 Probe UV/Visible Spectrophotometer, also requiring 0.45 μm filtration before measurement. Turbidity was measured using a HACH 2100N IS turbidimeter.
The NOM was fractionated into four specific fractions before and after the coagulation pre-treatments. The method is based on hydrophobicity and charge, using the fractionation technique described in Chow et al. (2004). The fractions obtained were designated as very hydrophobic acids (VHA), slightly hydrophobic acids (SHA), charged hydrophilics (CHA) and neutral hydrophilics (NEU). The characterisation was performed by the Australian Water Quality Centre (AWQC). The make up of the NOM for both water sources is shown in Table 3.12. Meredith water was much higher in the VHA fraction
Samples
Name
Added metal salts
Gel time (hrs)
pH
Si/Fe or Si/Al
molar ratio
1 Polysilicato-Iron 1 (PSI-1)
Ferric chloride (FeCl3.6H2O) Over 5000 1.05 1
2 Polysilicato-Iron 2 (PSI-2)
Ferric chloride (FeCl3.6H2O) Over 5000 1.45 2
3 Polysilicato-Alum (PSA-1)
Aluminum sulfate (Al2(SO4)3.
18H2O) 360 1.50 1
4 Polysilicic acid None 192 2.00 -
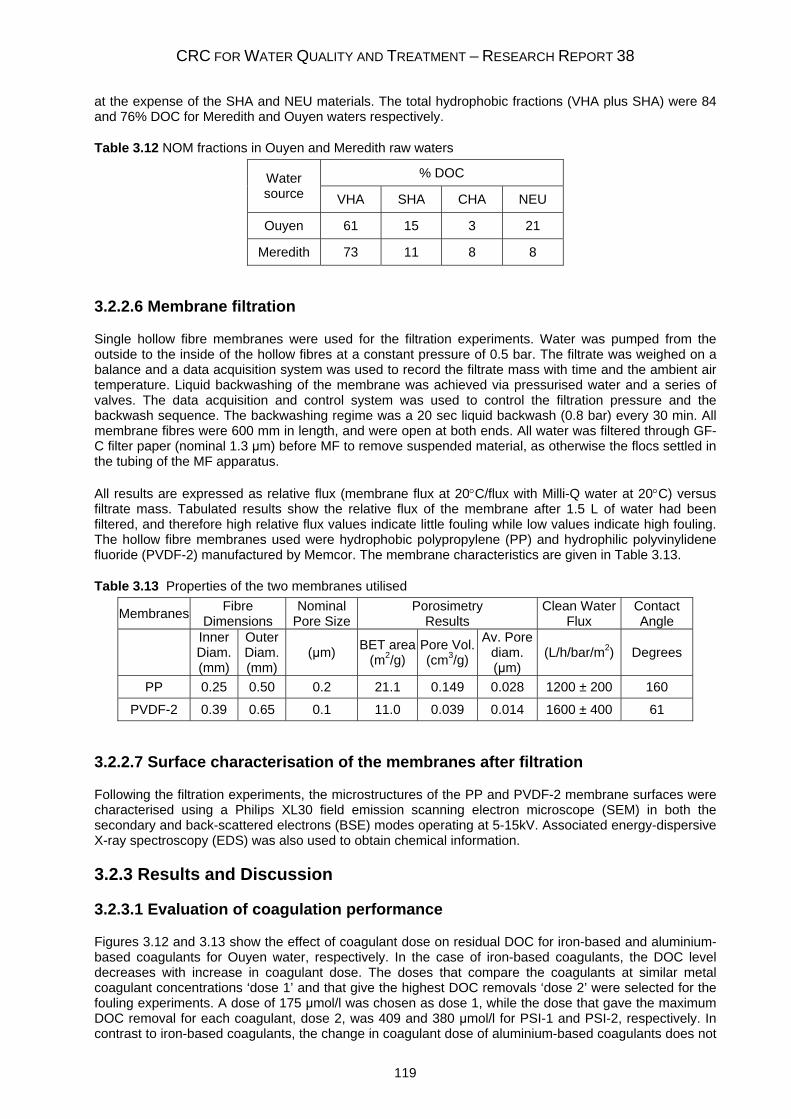
CRC FOR WATER QUALITY AND TREATMENT – RESEARCH REPORT 38
119
at the expense of the SHA and NEU materials. The total hydrophobic fractions (VHA plus SHA) were 84 and 76% DOC for Meredith and Ouyen waters respectively.
Table 3.12 NOM fractions in Ouyen and Meredith raw waters
% DOC Water source VHA SHA CHA NEU
Ouyen 61 15 3 21
Meredith 73 11 8 8
3.2.2.6 Membrane filtration
Single hollow fibre membranes were used for the filtration experiments. Water was pumped from the outside to the inside of the hollow fibres at a constant pressure of 0.5 bar. The filtrate was weighed on a balance and a data acquisition system was used to record the filtrate mass with time and the ambient air temperature. Liquid backwashing of the membrane was achieved via pressurised water and a series of valves. The data acquisition and control system was used to control the filtration pressure and the backwash sequence. The backwashing regime was a 20 sec liquid backwash (0.8 bar) every 30 min. All membrane fibres were 600 mm in length, and were open at both ends. All water was filtered through GF-C filter paper (nominal 1.3 μm) before MF to remove suspended material, as otherwise the flocs settled in the tubing of the MF apparatus.
All results are expressed as relative flux (membrane flux at 20°C/flux with Milli-Q water at 20°C) versus filtrate mass. Tabulated results show the relative flux of the membrane after 1.5 L of water had been filtered, and therefore high relative flux values indicate little fouling while low values indicate high fouling. The hollow fibre membranes used were hydrophobic polypropylene (PP) and hydrophilic polyvinylidene fluoride (PVDF-2) manufactured by Memcor. The membrane characteristics are given in Table 3.13.
Table 3.13 Properties of the two membranes utilised
Membranes Fibre Dimensions
Nominal Pore Size
Porosimetry Results
Clean Water Flux
Contact Angle
Inner Diam. (mm)
Outer Diam. (mm)
(μm) BET area(m2/g)
Pore Vol.(cm3/g)
Av. Pore diam. (μm)
(L/h/bar/m2) Degrees
PP 0.25 0.50 0.2 21.1 0.149 0.028 1200 ± 200 160
PVDF-2 0.39 0.65 0.1 11.0 0.039 0.014 1600 ± 400 61
3.2.2.7 Surface characterisation of the membranes after filtration
Following the filtration experiments, the microstructures of the PP and PVDF-2 membrane surfaces were characterised using a Philips XL30 field emission scanning electron microscope (SEM) in both the secondary and back-scattered electrons (BSE) modes operating at 5-15kV. Associated energy-dispersive X-ray spectroscopy (EDS) was also used to obtain chemical information.
3.2.3 Results and Discussion
3.2.3.1 Evaluation of coagulation performance
Figures 3.12 and 3.13 show the effect of coagulant dose on residual DOC for iron-based and aluminium-based coagulants for Ouyen water, respectively. In the case of iron-based coagulants, the DOC level decreases with increase in coagulant dose. The doses that compare the coagulants at similar metal coagulant concentrations ‘dose 1’ and that give the highest DOC removals ‘dose 2’ were selected for the fouling experiments. A dose of 175 μmol/l was chosen as dose 1, while the dose that gave the maximum DOC removal for each coagulant, dose 2, was 409 and 380 μmol/l for PSI-1 and PSI-2, respectively. In contrast to iron-based coagulants, the change in coagulant dose of aluminium-based coagulants does not
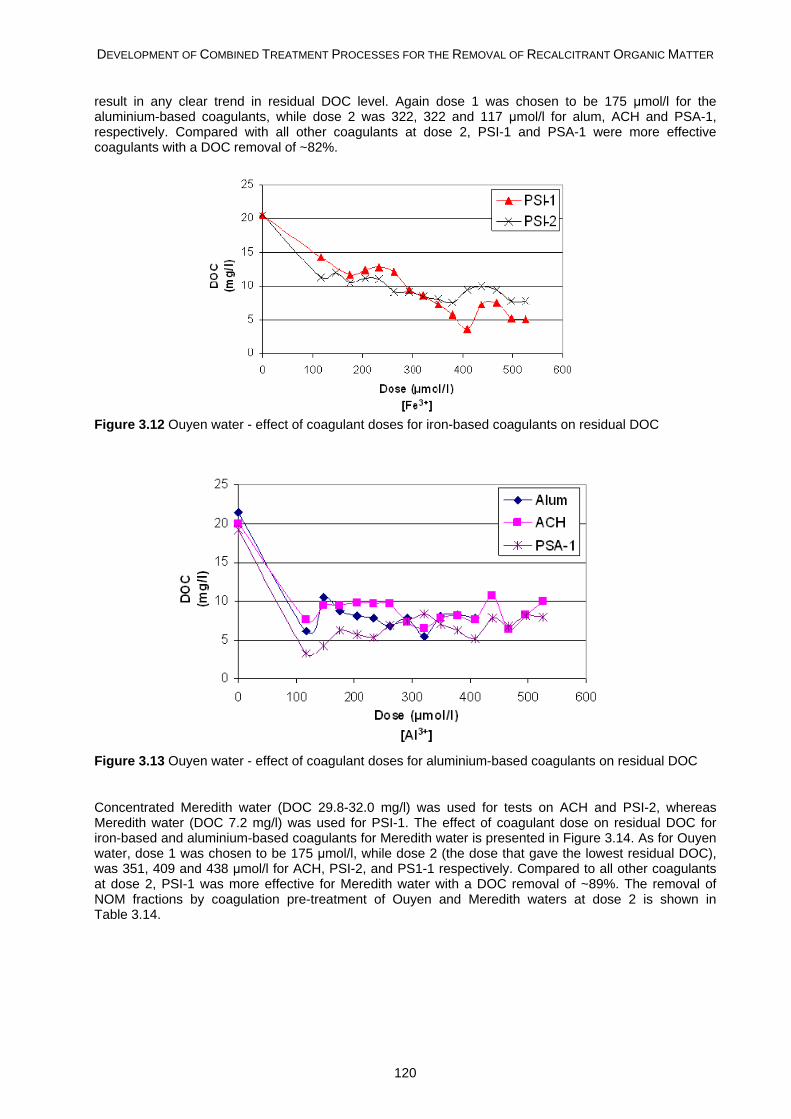
DEVELOPMENT OF COMBINED TREATMENT PROCESSES FOR THE REMOVAL OF RECALCITRANT ORGANIC MATTER
120
result in any clear trend in residual DOC level. Again dose 1 was chosen to be 175 μmol/l for the aluminium-based coagulants, while dose 2 was 322, 322 and 117 μmol/l for alum, ACH and PSA-1, respectively. Compared with all other coagulants at dose 2, PSI-1 and PSA-1 were more effective coagulants with a DOC removal of ~82%.
Figure 3.12 Ouyen water - effect of coagulant doses for iron-based coagulants on residual DOC
Figure 3.13 Ouyen water - effect of coagulant doses for aluminium-based coagulants on residual DOC
Concentrated Meredith water (DOC 29.8-32.0 mg/l) was used for tests on ACH and PSI-2, whereas Meredith water (DOC 7.2 mg/l) was used for PSI-1. The effect of coagulant dose on residual DOC for iron-based and aluminium-based coagulants for Meredith water is presented in Figure 3.14. As for Ouyen water, dose 1 was chosen to be 175 μmol/l, while dose 2 (the dose that gave the lowest residual DOC), was 351, 409 and 438 μmol/l for ACH, PSI-2, and PS1-1 respectively. Compared to all other coagulants at dose 2, PSI-1 was more effective for Meredith water with a DOC removal of ~89%. The removal of NOM fractions by coagulation pre-treatment of Ouyen and Meredith waters at dose 2 is shown in Table 3.14.

CRC FOR WATER QUALITY AND TREATMENT – RESEARCH REPORT 38
121
Figure 3.14 Meredith water - effect of coagulant doses for aluminium and iron-based coagulants on residual DOC. ACH and PSI-2 using concentrated Meredith water; PSI-1 using raw Meredith water It can be seen that PSI-1 is much more effective in removing the VHA fraction than other coagulants. For both Ouyen and Meredith waters, PSI-1 removes up to twice the amount of VHA extracted by ACH and alum. PSI-1 is also more effective than, or at least as good as, ACH and alum in removing SHA. Whilst showing better efficiency in removing the hydrophobic fractions, PSI-1 does not exhibit advantage over ACH or alum in removing the hydrophilic fractions. In contrast, all coagulants completely remove the CHA fraction in both Ouyen and Meredith waters. However, the removal of the NEU fraction is quite limited, particularly in the case of Ouyen water.
Table 3.14 Fractions removed by various coagulants % DOC removal Water
ources CoagulantVHA SHA CHA NEU
PSI-1 63 57 100 9 ACH 47 57 100 0 Ouyen Alum 36 36 100 9 PSI-1 90 88 100 33
Meredith ACH 44 75 100 50
3.2.3.2 UV and turbidity removals
Ouyen water: The coagulation efficiency is also reflected in the reduction of UV254 absorbance. As can be seen in Figure 3.15, the UV254 is reduced dramatically at low doses but plateaus at high coagulant doses. At dose 2, PSI-1 seems to exhibit lower UV254 absorbance (0.0149, i.e., 75% UV254 removal) compared to other coagulants. Effectively, there is little variation of consequence in the effect of different coagulants on the efficiency of turbidity removal (87-93%).
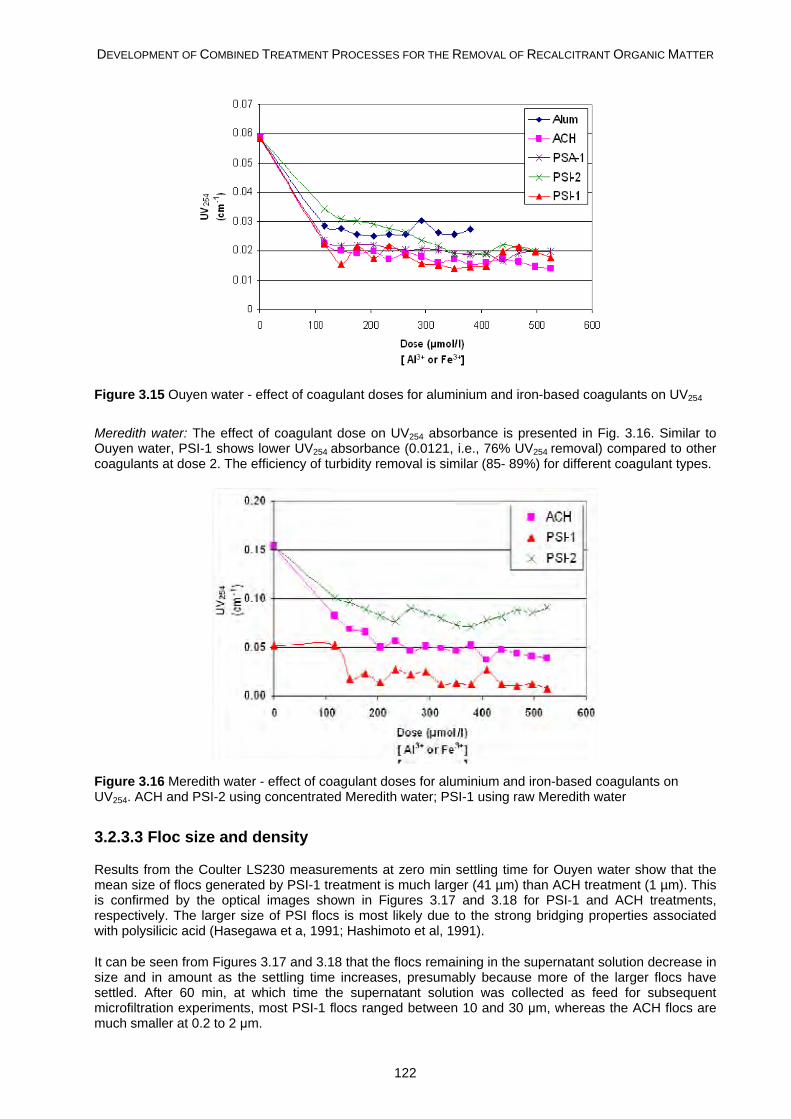
DEVELOPMENT OF COMBINED TREATMENT PROCESSES FOR THE REMOVAL OF RECALCITRANT ORGANIC MATTER
122
Figure 3.15 Ouyen water - effect of coagulant doses for aluminium and iron-based coagulants on UV254
Meredith water: The effect of coagulant dose on UV254 absorbance is presented in Fig. 3.16. Similar to Ouyen water, PSI-1 shows lower UV254 absorbance (0.0121, i.e., 76% UV254 removal) compared to other coagulants at dose 2. The efficiency of turbidity removal is similar (85- 89%) for different coagulant types.
Figure 3.16 Meredith water - effect of coagulant doses for aluminium and iron-based coagulants on UV254. ACH and PSI-2 using concentrated Meredith water; PSI-1 using raw Meredith water
3.2.3.3 Floc size and density
Results from the Coulter LS230 measurements at zero min settling time for Ouyen water show that the mean size of flocs generated by PSI-1 treatment is much larger (41 µm) than ACH treatment (1 µm). This is confirmed by the optical images shown in Figures 3.17 and 3.18 for PSI-1 and ACH treatments, respectively. The larger size of PSI flocs is most likely due to the strong bridging properties associated with polysilicic acid (Hasegawa et a, 1991; Hashimoto et al, 1991).
It can be seen from Figures 3.17 and 3.18 that the flocs remaining in the supernatant solution decrease in size and in amount as the settling time increases, presumably because more of the larger flocs have settled. After 60 min, at which time the supernatant solution was collected as feed for subsequent microfiltration experiments, most PSI-1 flocs ranged between 10 and 30 μm, whereas the ACH flocs are much smaller at 0.2 to 2 μm.
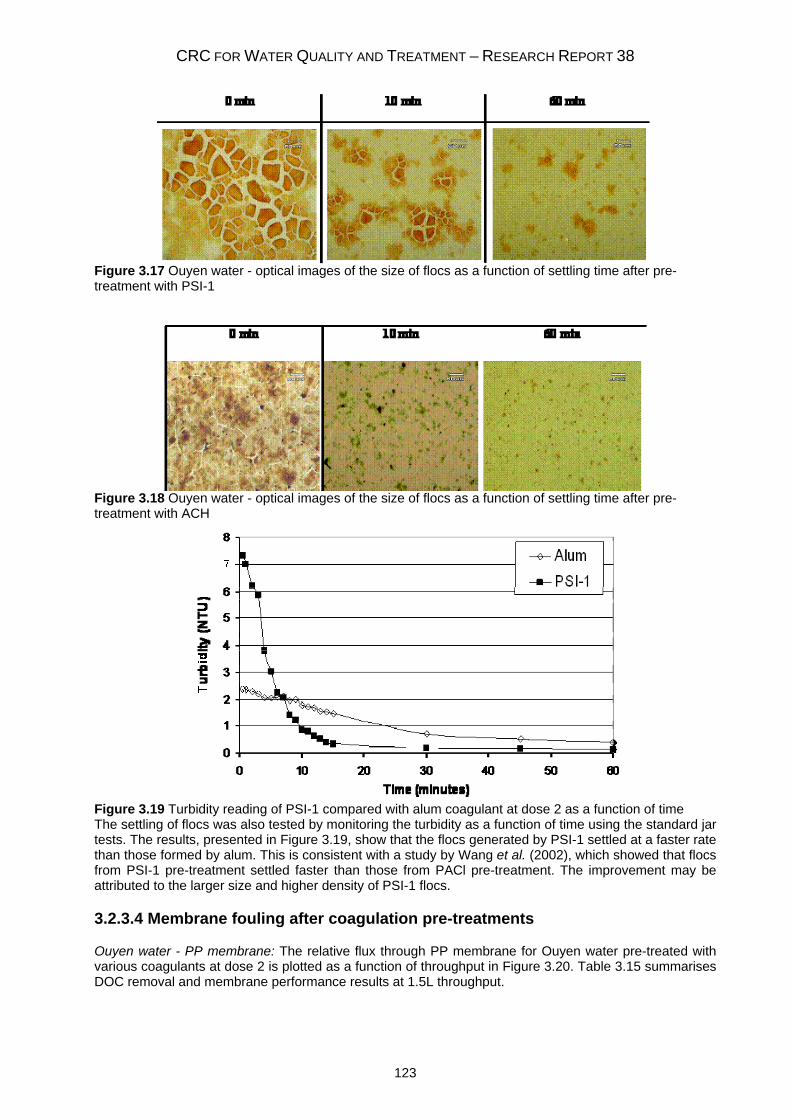
CRC FOR WATER QUALITY AND TREATMENT – RESEARCH REPORT 38
123
Figure 3.17 Ouyen water - optical images of the size of flocs as a function of settling time after pre-treatment with PSI-1
Figure 3.18 Ouyen water - optical images of the size of flocs as a function of settling time after pre-treatment with ACH
Figure 3.19 Turbidity reading of PSI-1 compared with alum coagulant at dose 2 as a function of time The settling of flocs was also tested by monitoring the turbidity as a function of time using the standard jar tests. The results, presented in Figure 3.19, show that the flocs generated by PSI-1 settled at a faster rate than those formed by alum. This is consistent with a study by Wang et al. (2002), which showed that flocs from PSI-1 pre-treatment settled faster than those from PACl pre-treatment. The improvement may be attributed to the larger size and higher density of PSI-1 flocs.
3.2.3.4 Membrane fouling after coagulation pre-treatments
Ouyen water - PP membrane: The relative flux through PP membrane for Ouyen water pre-treated with various coagulants at dose 2 is plotted as a function of throughput in Figure 3.20. Table 3.15 summarises DOC removal and membrane performance results at 1.5L throughput.
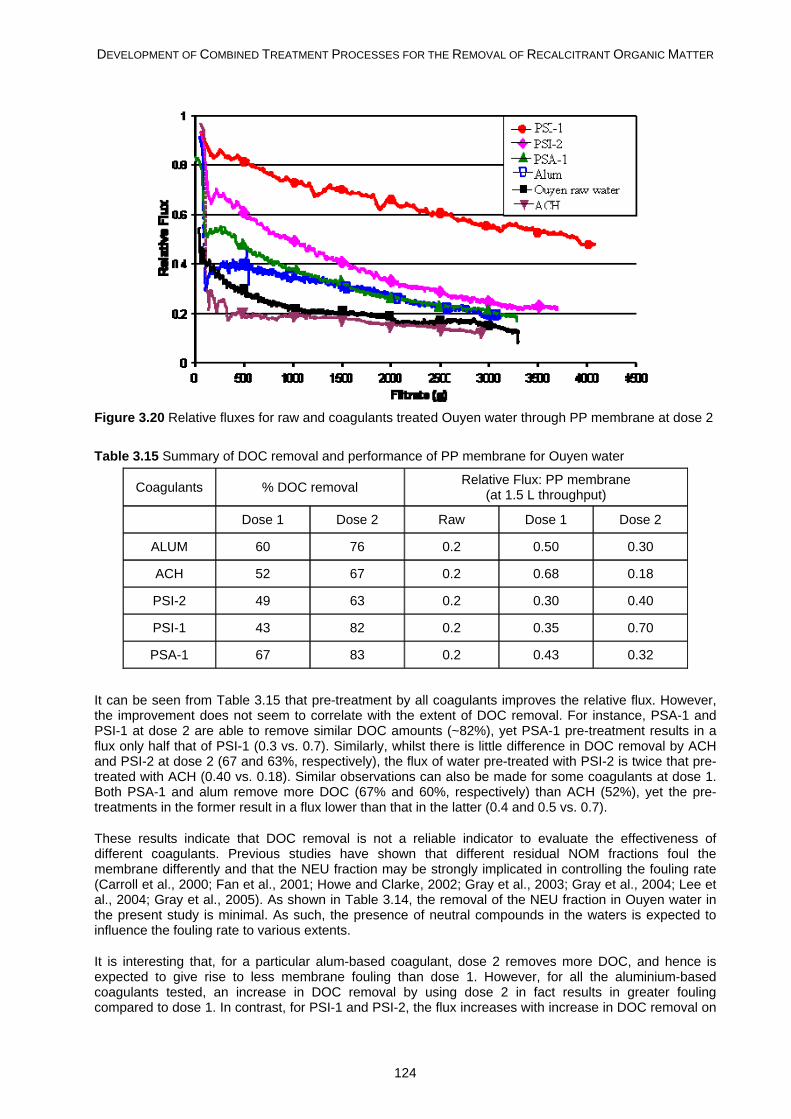
DEVELOPMENT OF COMBINED TREATMENT PROCESSES FOR THE REMOVAL OF RECALCITRANT ORGANIC MATTER
124
Figure 3.20 Relative fluxes for raw and coagulants treated Ouyen water through PP membrane at dose 2
Table 3.15 Summary of DOC removal and performance of PP membrane for Ouyen water
Coagulants % DOC removal Relative Flux: PP membrane (at 1.5 L throughput)
Dose 1 Dose 2 Raw Dose 1 Dose 2
ALUM 60 76 0.2 0.50 0.30
ACH 52 67 0.2 0.68 0.18
PSI-2 49 63 0.2 0.30 0.40
PSI-1 43 82 0.2 0.35 0.70
PSA-1 67 83 0.2 0.43 0.32
It can be seen from Table 3.15 that pre-treatment by all coagulants improves the relative flux. However, the improvement does not seem to correlate with the extent of DOC removal. For instance, PSA-1 and PSI-1 at dose 2 are able to remove similar DOC amounts (~82%), yet PSA-1 pre-treatment results in a flux only half that of PSI-1 (0.3 vs. 0.7). Similarly, whilst there is little difference in DOC removal by ACH and PSI-2 at dose 2 (67 and 63%, respectively), the flux of water pre-treated with PSI-2 is twice that pre-treated with ACH (0.40 vs. 0.18). Similar observations can also be made for some coagulants at dose 1. Both PSA-1 and alum remove more DOC (67% and 60%, respectively) than ACH (52%), yet the pre-treatments in the former result in a flux lower than that in the latter (0.4 and 0.5 vs. 0.7).
These results indicate that DOC removal is not a reliable indicator to evaluate the effectiveness of different coagulants. Previous studies have shown that different residual NOM fractions foul the membrane differently and that the NEU fraction may be strongly implicated in controlling the fouling rate (Carroll et al., 2000; Fan et al., 2001; Howe and Clarke, 2002; Gray et al., 2003; Gray et al., 2004; Lee et al., 2004; Gray et al., 2005). As shown in Table 3.14, the removal of the NEU fraction in Ouyen water in the present study is minimal. As such, the presence of neutral compounds in the waters is expected to influence the fouling rate to various extents.
It is interesting that, for a particular alum-based coagulant, dose 2 removes more DOC, and hence is expected to give rise to less membrane fouling than dose 1. However, for all the aluminium-based coagulants tested, an increase in DOC removal by using dose 2 in fact results in greater fouling compared to dose 1. In contrast, for PSI-1 and PSI-2, the flux increases with increase in DOC removal on
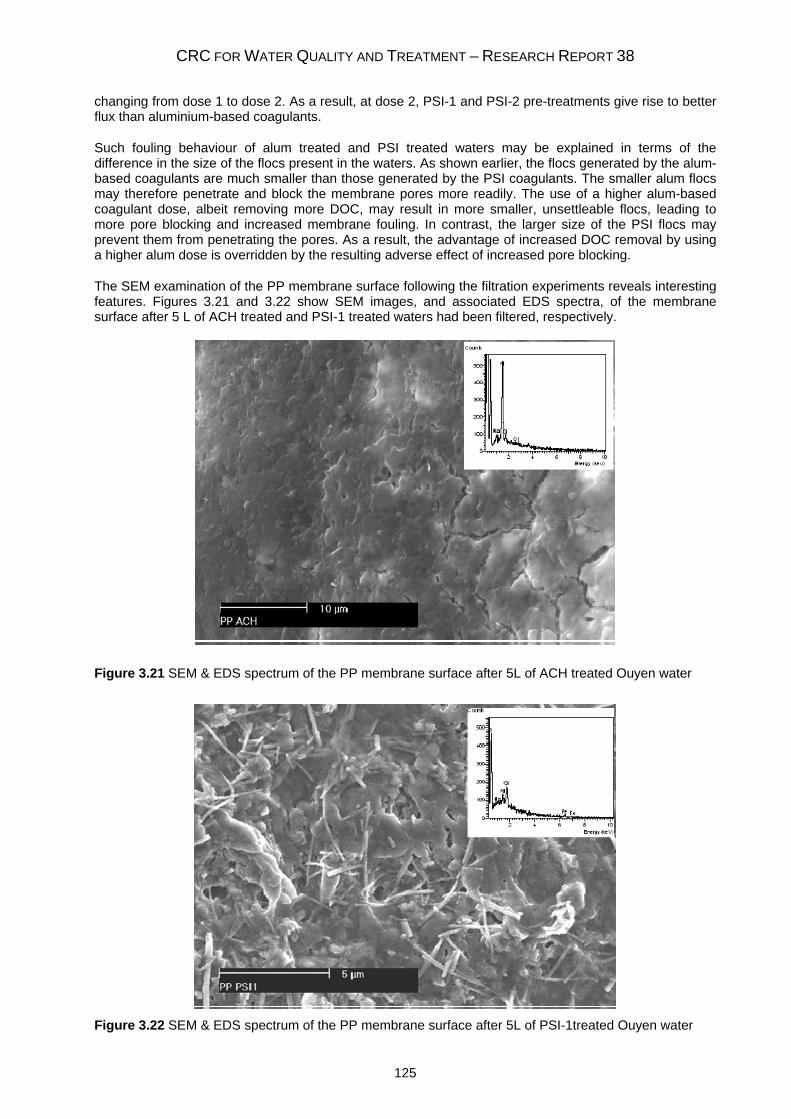
CRC FOR WATER QUALITY AND TREATMENT – RESEARCH REPORT 38
125
changing from dose 1 to dose 2. As a result, at dose 2, PSI-1 and PSI-2 pre-treatments give rise to better flux than aluminium-based coagulants.
Such fouling behaviour of alum treated and PSI treated waters may be explained in terms of the difference in the size of the flocs present in the waters. As shown earlier, the flocs generated by the alum-based coagulants are much smaller than those generated by the PSI coagulants. The smaller alum flocs may therefore penetrate and block the membrane pores more readily. The use of a higher alum-based coagulant dose, albeit removing more DOC, may result in more smaller, unsettleable flocs, leading to more pore blocking and increased membrane fouling. In contrast, the larger size of the PSI flocs may prevent them from penetrating the pores. As a result, the advantage of increased DOC removal by using a higher alum dose is overridden by the resulting adverse effect of increased pore blocking.
The SEM examination of the PP membrane surface following the filtration experiments reveals interesting features. Figures 3.21 and 3.22 show SEM images, and associated EDS spectra, of the membrane surface after 5 L of ACH treated and PSI-1 treated waters had been filtered, respectively.
Figure 3.21 SEM & EDS spectrum of the PP membrane surface after 5L of ACH treated Ouyen water
Figure 3.22 SEM & EDS spectrum of the PP membrane surface after 5L of PSI-1treated Ouyen water
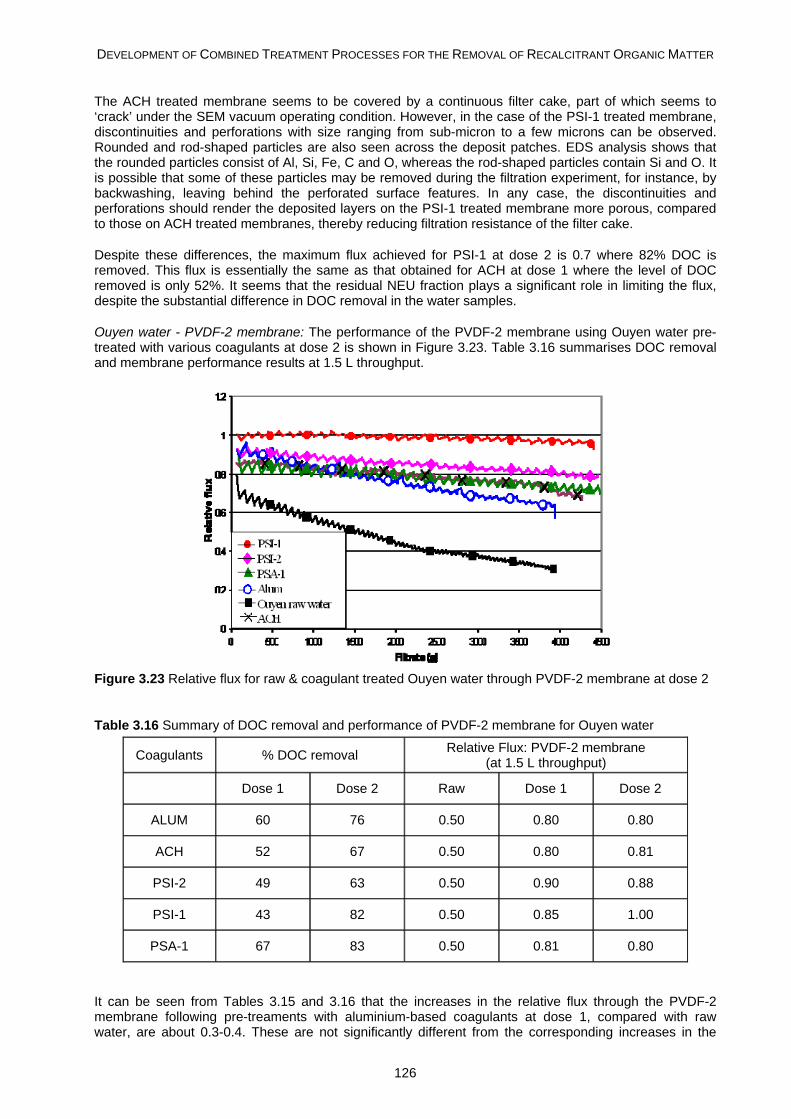
DEVELOPMENT OF COMBINED TREATMENT PROCESSES FOR THE REMOVAL OF RECALCITRANT ORGANIC MATTER
126
The ACH treated membrane seems to be covered by a continuous filter cake, part of which seems to ‘crack’ under the SEM vacuum operating condition. However, in the case of the PSI-1 treated membrane, discontinuities and perforations with size ranging from sub-micron to a few microns can be observed. Rounded and rod-shaped particles are also seen across the deposit patches. EDS analysis shows that the rounded particles consist of Al, Si, Fe, C and O, whereas the rod-shaped particles contain Si and O. It is possible that some of these particles may be removed during the filtration experiment, for instance, by backwashing, leaving behind the perforated surface features. In any case, the discontinuities and perforations should render the deposited layers on the PSI-1 treated membrane more porous, compared to those on ACH treated membranes, thereby reducing filtration resistance of the filter cake.
Despite these differences, the maximum flux achieved for PSI-1 at dose 2 is 0.7 where 82% DOC is removed. This flux is essentially the same as that obtained for ACH at dose 1 where the level of DOC removed is only 52%. It seems that the residual NEU fraction plays a significant role in limiting the flux, despite the substantial difference in DOC removal in the water samples.
Ouyen water - PVDF-2 membrane: The performance of the PVDF-2 membrane using Ouyen water pre-treated with various coagulants at dose 2 is shown in Figure 3.23. Table 3.16 summarises DOC removal and membrane performance results at 1.5 L throughput.
Figure 3.23 Relative flux for raw & coagulant treated Ouyen water through PVDF-2 membrane at dose 2
Table 3.16 Summary of DOC removal and performance of PVDF-2 membrane for Ouyen water
Coagulants % DOC removal Relative Flux: PVDF-2 membrane (at 1.5 L throughput)
Dose 1 Dose 2 Raw Dose 1 Dose 2
ALUM 60 76 0.50 0.80 0.80
ACH 52 67 0.50 0.80 0.81
PSI-2 49 63 0.50 0.90 0.88
PSI-1 43 82 0.50 0.85 1.00
PSA-1 67 83 0.50 0.81 0.80
It can be seen from Tables 3.15 and 3.16 that the increases in the relative flux through the PVDF-2 membrane following pre-treaments with aluminium-based coagulants at dose 1, compared with raw water, are about 0.3-0.4. These are not significantly different from the corresponding increases in the
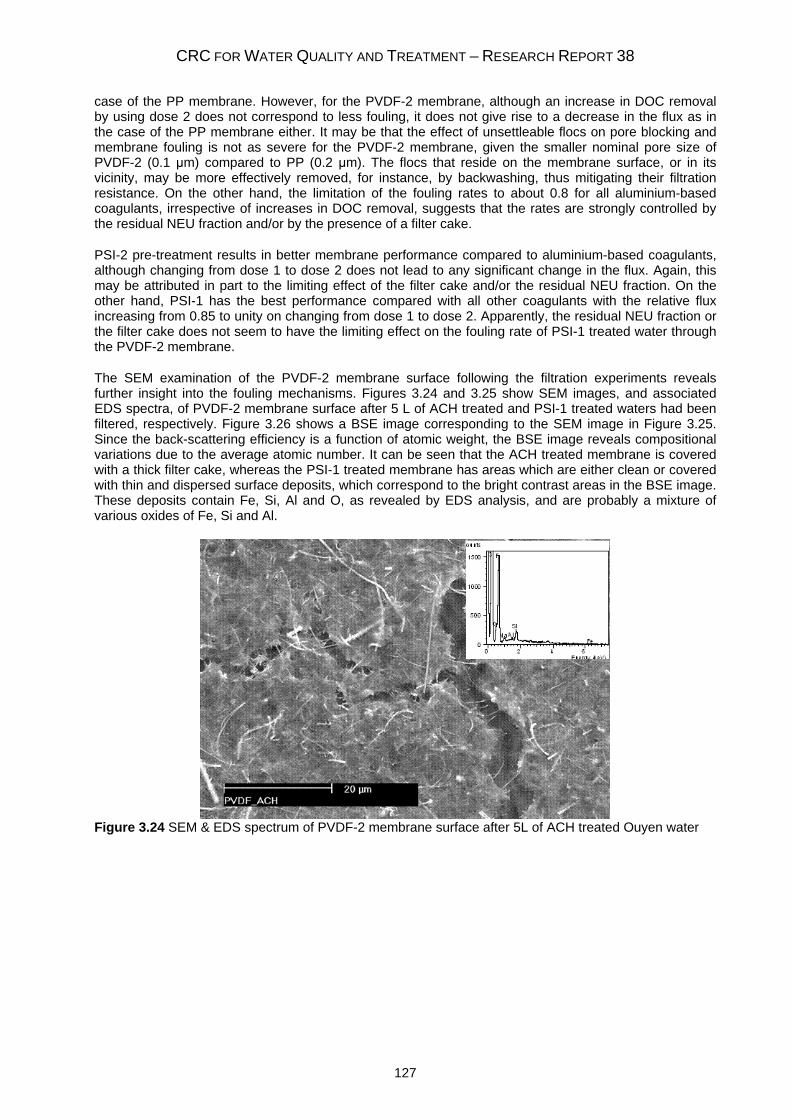
CRC FOR WATER QUALITY AND TREATMENT – RESEARCH REPORT 38
127
case of the PP membrane. However, for the PVDF-2 membrane, although an increase in DOC removal by using dose 2 does not correspond to less fouling, it does not give rise to a decrease in the flux as in the case of the PP membrane either. It may be that the effect of unsettleable flocs on pore blocking and membrane fouling is not as severe for the PVDF-2 membrane, given the smaller nominal pore size of PVDF-2 (0.1 μm) compared to PP (0.2 μm). The flocs that reside on the membrane surface, or in its vicinity, may be more effectively removed, for instance, by backwashing, thus mitigating their filtration resistance. On the other hand, the limitation of the fouling rates to about 0.8 for all aluminium-based coagulants, irrespective of increases in DOC removal, suggests that the rates are strongly controlled by the residual NEU fraction and/or by the presence of a filter cake.
PSI-2 pre-treatment results in better membrane performance compared to aluminium-based coagulants, although changing from dose 1 to dose 2 does not lead to any significant change in the flux. Again, this may be attributed in part to the limiting effect of the filter cake and/or the residual NEU fraction. On the other hand, PSI-1 has the best performance compared with all other coagulants with the relative flux increasing from 0.85 to unity on changing from dose 1 to dose 2. Apparently, the residual NEU fraction or the filter cake does not seem to have the limiting effect on the fouling rate of PSI-1 treated water through the PVDF-2 membrane.
The SEM examination of the PVDF-2 membrane surface following the filtration experiments reveals further insight into the fouling mechanisms. Figures 3.24 and 3.25 show SEM images, and associated EDS spectra, of PVDF-2 membrane surface after 5 L of ACH treated and PSI-1 treated waters had been filtered, respectively. Figure 3.26 shows a BSE image corresponding to the SEM image in Figure 3.25. Since the back-scattering efficiency is a function of atomic weight, the BSE image reveals compositional variations due to the average atomic number. It can be seen that the ACH treated membrane is covered with a thick filter cake, whereas the PSI-1 treated membrane has areas which are either clean or covered with thin and dispersed surface deposits, which correspond to the bright contrast areas in the BSE image. These deposits contain Fe, Si, Al and O, as revealed by EDS analysis, and are probably a mixture of various oxides of Fe, Si and Al.
Figure 3.24 SEM & EDS spectrum of PVDF-2 membrane surface after 5L of ACH treated Ouyen water
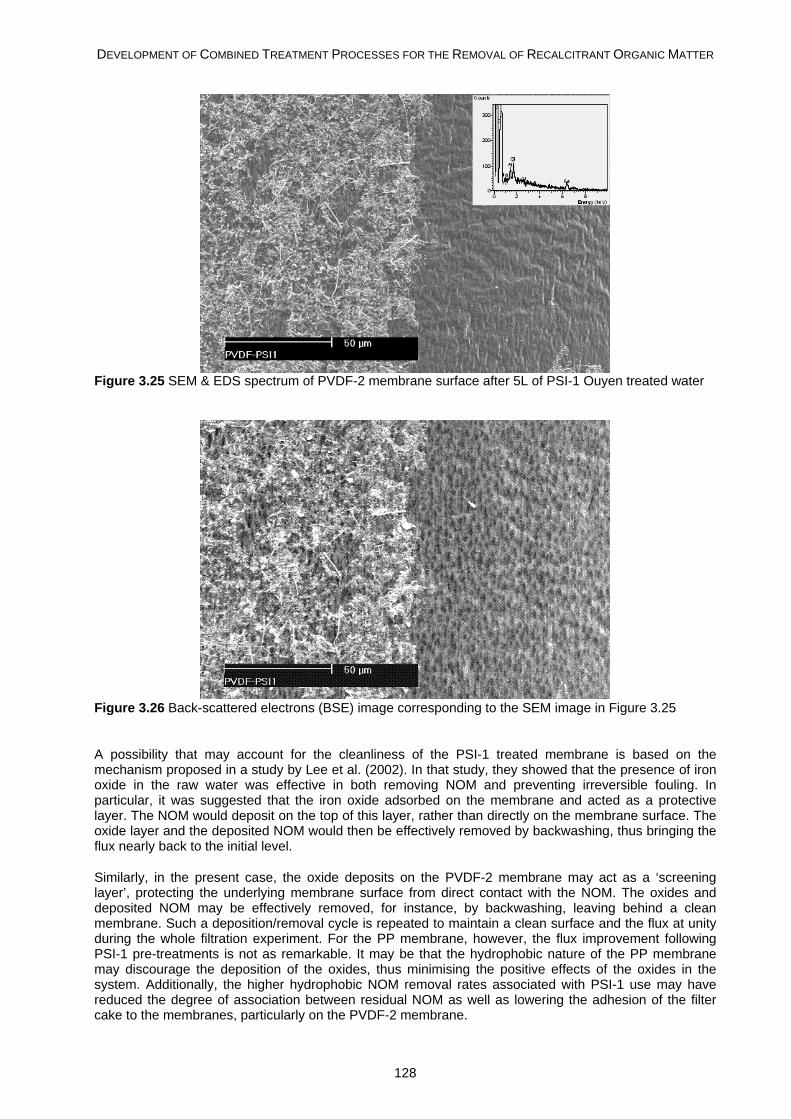
DEVELOPMENT OF COMBINED TREATMENT PROCESSES FOR THE REMOVAL OF RECALCITRANT ORGANIC MATTER
128
Figure 3.25 SEM & EDS spectrum of PVDF-2 membrane surface after 5L of PSI-1 Ouyen treated water
Figure 3.26 Back-scattered electrons (BSE) image corresponding to the SEM image in Figure 3.25
A possibility that may account for the cleanliness of the PSI-1 treated membrane is based on the mechanism proposed in a study by Lee et al. (2002). In that study, they showed that the presence of iron oxide in the raw water was effective in both removing NOM and preventing irreversible fouling. In particular, it was suggested that the iron oxide adsorbed on the membrane and acted as a protective layer. The NOM would deposit on the top of this layer, rather than directly on the membrane surface. The oxide layer and the deposited NOM would then be effectively removed by backwashing, thus bringing the flux nearly back to the initial level.
Similarly, in the present case, the oxide deposits on the PVDF-2 membrane may act as a ‘screening layer’, protecting the underlying membrane surface from direct contact with the NOM. The oxides and deposited NOM may be effectively removed, for instance, by backwashing, leaving behind a clean membrane. Such a deposition/removal cycle is repeated to maintain a clean surface and the flux at unity during the whole filtration experiment. For the PP membrane, however, the flux improvement following PSI-1 pre-treatments is not as remarkable. It may be that the hydrophobic nature of the PP membrane may discourage the deposition of the oxides, thus minimising the positive effects of the oxides in the system. Additionally, the higher hydrophobic NOM removal rates associated with PSI-1 use may have reduced the degree of association between residual NOM as well as lowering the adhesion of the filter cake to the membranes, particularly on the PVDF-2 membrane.
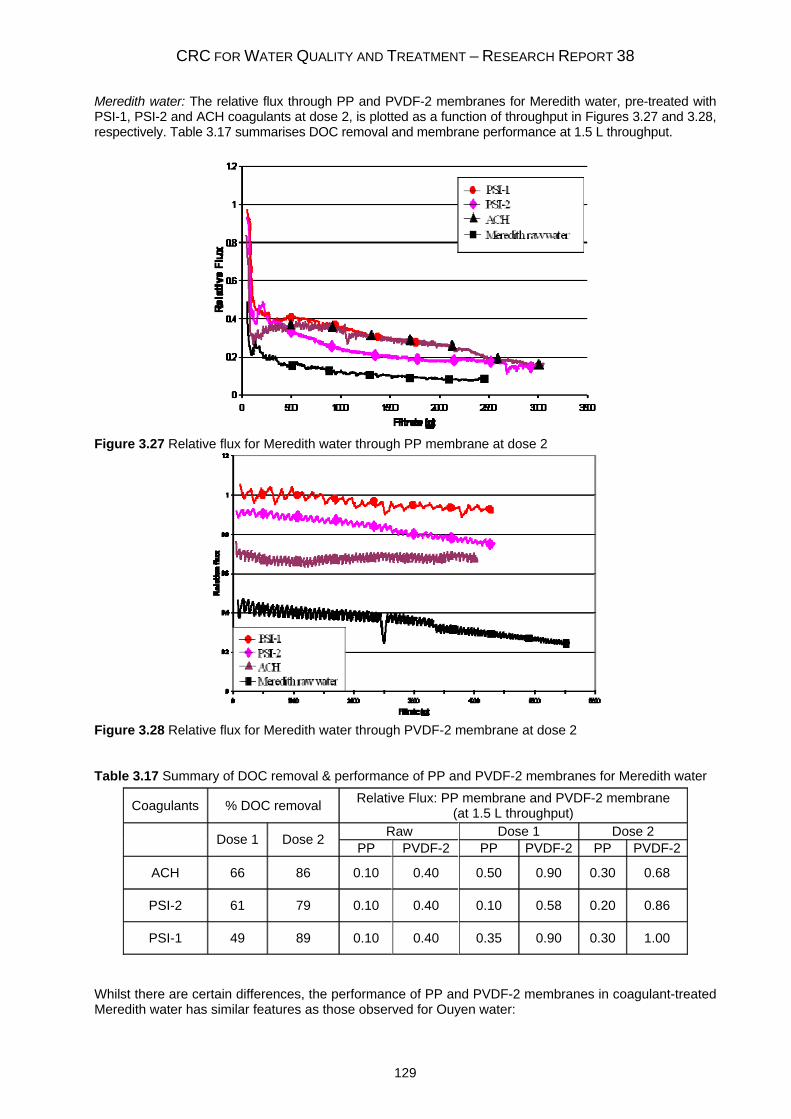
CRC FOR WATER QUALITY AND TREATMENT – RESEARCH REPORT 38
129
Meredith water: The relative flux through PP and PVDF-2 membranes for Meredith water, pre-treated with PSI-1, PSI-2 and ACH coagulants at dose 2, is plotted as a function of throughput in Figures 3.27 and 3.28, respectively. Table 3.17 summarises DOC removal and membrane performance at 1.5 L throughput.
Figure 3.27 Relative flux for Meredith water through PP membrane at dose 2
Figure 3.28 Relative flux for Meredith water through PVDF-2 membrane at dose 2 Table 3.17 Summary of DOC removal & performance of PP and PVDF-2 membranes for Meredith water
Coagulants % DOC removal Relative Flux: PP membrane and PVDF-2 membrane (at 1.5 L throughput)
Raw Dose 1 Dose 2 Dose 1 Dose 2 PP PVDF-2 PP PVDF-2 PP PVDF-2
ACH 66 86 0.10 0.40 0.50 0.90 0.30 0.68
PSI-2 61 79 0.10 0.40 0.10 0.58 0.20 0.86
PSI-1 49 89 0.10 0.40 0.35 0.90 0.30 1.00
Whilst there are certain differences, the performance of PP and PVDF-2 membranes in coagulant-treated Meredith water has similar features as those observed for Ouyen water:
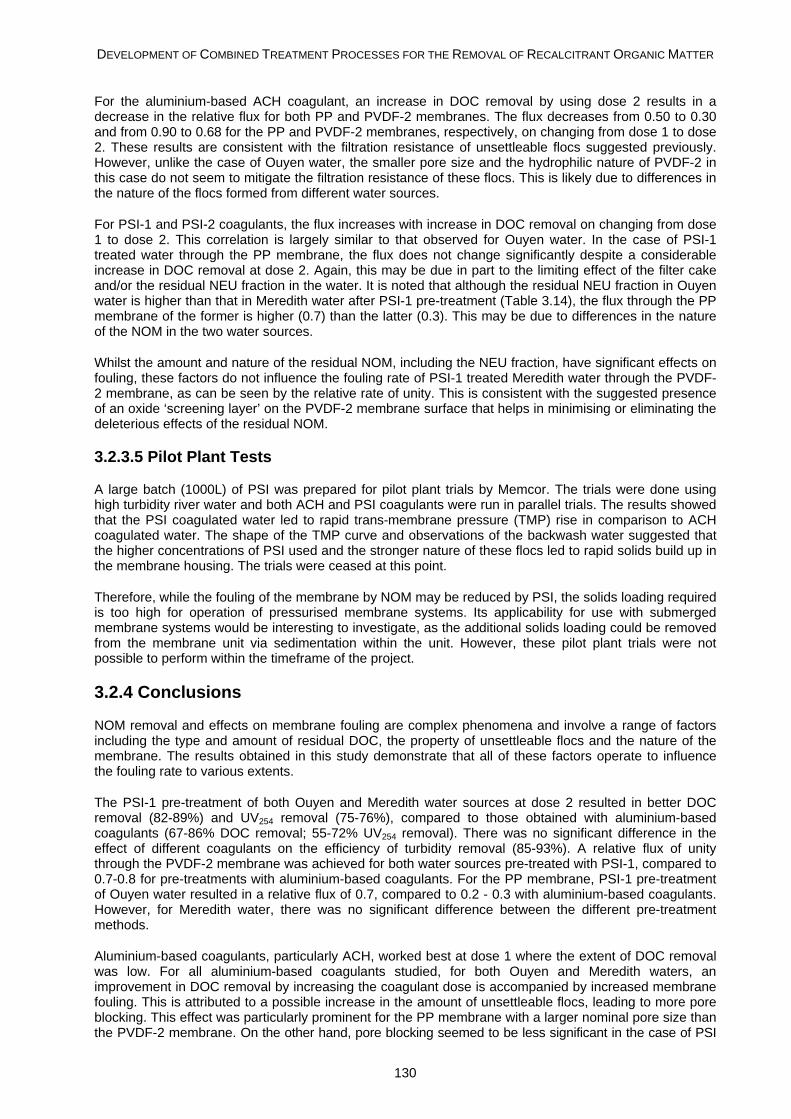
DEVELOPMENT OF COMBINED TREATMENT PROCESSES FOR THE REMOVAL OF RECALCITRANT ORGANIC MATTER
130
For the aluminium-based ACH coagulant, an increase in DOC removal by using dose 2 results in a decrease in the relative flux for both PP and PVDF-2 membranes. The flux decreases from 0.50 to 0.30 and from 0.90 to 0.68 for the PP and PVDF-2 membranes, respectively, on changing from dose 1 to dose 2. These results are consistent with the filtration resistance of unsettleable flocs suggested previously. However, unlike the case of Ouyen water, the smaller pore size and the hydrophilic nature of PVDF-2 in this case do not seem to mitigate the filtration resistance of these flocs. This is likely due to differences in the nature of the flocs formed from different water sources.
For PSI-1 and PSI-2 coagulants, the flux increases with increase in DOC removal on changing from dose 1 to dose 2. This correlation is largely similar to that observed for Ouyen water. In the case of PSI-1 treated water through the PP membrane, the flux does not change significantly despite a considerable increase in DOC removal at dose 2. Again, this may be due in part to the limiting effect of the filter cake and/or the residual NEU fraction in the water. It is noted that although the residual NEU fraction in Ouyen water is higher than that in Meredith water after PSI-1 pre-treatment (Table 3.14), the flux through the PP membrane of the former is higher (0.7) than the latter (0.3). This may be due to differences in the nature of the NOM in the two water sources.
Whilst the amount and nature of the residual NOM, including the NEU fraction, have significant effects on fouling, these factors do not influence the fouling rate of PSI-1 treated Meredith water through the PVDF-2 membrane, as can be seen by the relative rate of unity. This is consistent with the suggested presence of an oxide ‘screening layer’ on the PVDF-2 membrane surface that helps in minimising or eliminating the deleterious effects of the residual NOM.
3.2.3.5 Pilot Plant Tests
A large batch (1000L) of PSI was prepared for pilot plant trials by Memcor. The trials were done using high turbidity river water and both ACH and PSI coagulants were run in parallel trials. The results showed that the PSI coagulated water led to rapid trans-membrane pressure (TMP) rise in comparison to ACH coagulated water. The shape of the TMP curve and observations of the backwash water suggested that the higher concentrations of PSI used and the stronger nature of these flocs led to rapid solids build up in the membrane housing. The trials were ceased at this point.
Therefore, while the fouling of the membrane by NOM may be reduced by PSI, the solids loading required is too high for operation of pressurised membrane systems. Its applicability for use with submerged membrane systems would be interesting to investigate, as the additional solids loading could be removed from the membrane unit via sedimentation within the unit. However, these pilot plant trials were not possible to perform within the timeframe of the project.
3.2.4 Conclusions
NOM removal and effects on membrane fouling are complex phenomena and involve a range of factors including the type and amount of residual DOC, the property of unsettleable flocs and the nature of the membrane. The results obtained in this study demonstrate that all of these factors operate to influence the fouling rate to various extents.
The PSI-1 pre-treatment of both Ouyen and Meredith water sources at dose 2 resulted in better DOC removal (82-89%) and UV254 removal (75-76%), compared to those obtained with aluminium-based coagulants (67-86% DOC removal; 55-72% UV254 removal). There was no significant difference in the effect of different coagulants on the efficiency of turbidity removal (85-93%). A relative flux of unity through the PVDF-2 membrane was achieved for both water sources pre-treated with PSI-1, compared to 0.7-0.8 for pre-treatments with aluminium-based coagulants. For the PP membrane, PSI-1 pre-treatment of Ouyen water resulted in a relative flux of 0.7, compared to 0.2 - 0.3 with aluminium-based coagulants. However, for Meredith water, there was no significant difference between the different pre-treatment methods.
Aluminium-based coagulants, particularly ACH, worked best at dose 1 where the extent of DOC removal was low. For all aluminium-based coagulants studied, for both Ouyen and Meredith waters, an improvement in DOC removal by increasing the coagulant dose is accompanied by increased membrane fouling. This is attributed to a possible increase in the amount of unsettleable flocs, leading to more pore blocking. This effect was particularly prominent for the PP membrane with a larger nominal pore size than the PVDF-2 membrane. On the other hand, pore blocking seemed to be less significant in the case of PSI
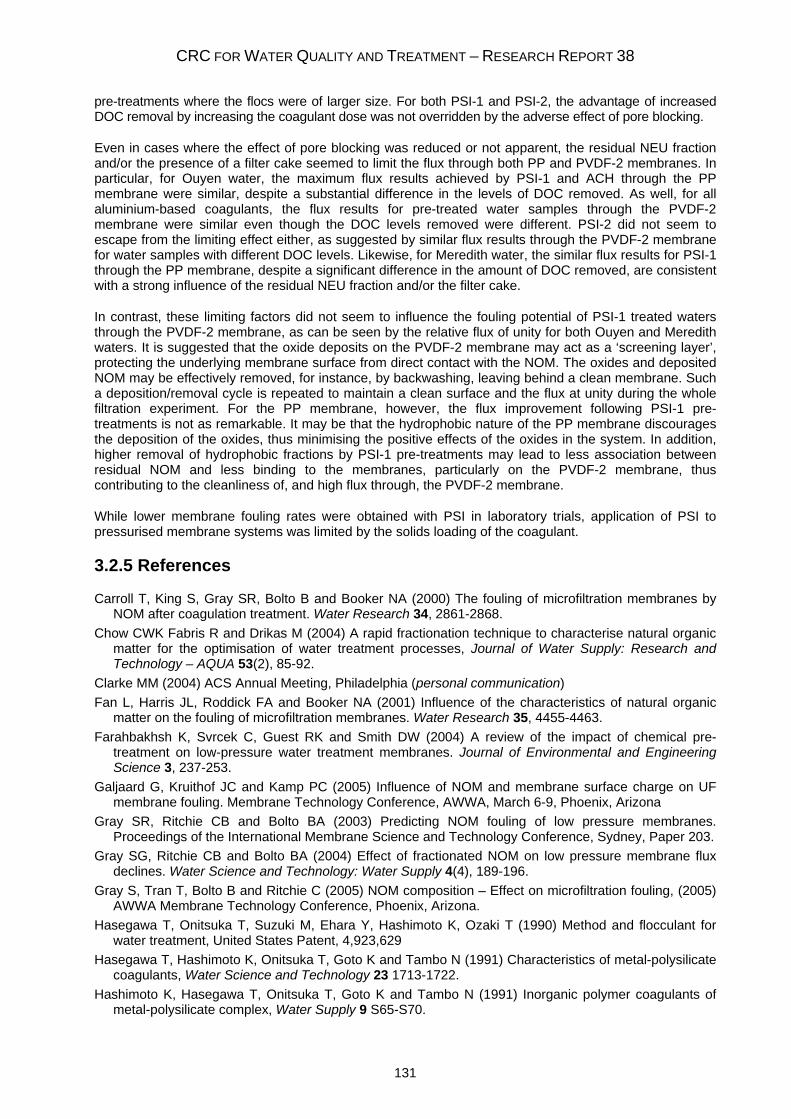
CRC FOR WATER QUALITY AND TREATMENT – RESEARCH REPORT 38
131
pre-treatments where the flocs were of larger size. For both PSI-1 and PSI-2, the advantage of increased DOC removal by increasing the coagulant dose was not overridden by the adverse effect of pore blocking.
Even in cases where the effect of pore blocking was reduced or not apparent, the residual NEU fraction and/or the presence of a filter cake seemed to limit the flux through both PP and PVDF-2 membranes. In particular, for Ouyen water, the maximum flux results achieved by PSI-1 and ACH through the PP membrane were similar, despite a substantial difference in the levels of DOC removed. As well, for all aluminium-based coagulants, the flux results for pre-treated water samples through the PVDF-2 membrane were similar even though the DOC levels removed were different. PSI-2 did not seem to escape from the limiting effect either, as suggested by similar flux results through the PVDF-2 membrane for water samples with different DOC levels. Likewise, for Meredith water, the similar flux results for PSI-1 through the PP membrane, despite a significant difference in the amount of DOC removed, are consistent with a strong influence of the residual NEU fraction and/or the filter cake.
In contrast, these limiting factors did not seem to influence the fouling potential of PSI-1 treated waters through the PVDF-2 membrane, as can be seen by the relative flux of unity for both Ouyen and Meredith waters. It is suggested that the oxide deposits on the PVDF-2 membrane may act as a ‘screening layer’, protecting the underlying membrane surface from direct contact with the NOM. The oxides and deposited NOM may be effectively removed, for instance, by backwashing, leaving behind a clean membrane. Such a deposition/removal cycle is repeated to maintain a clean surface and the flux at unity during the whole filtration experiment. For the PP membrane, however, the flux improvement following PSI-1 pre-treatments is not as remarkable. It may be that the hydrophobic nature of the PP membrane discourages the deposition of the oxides, thus minimising the positive effects of the oxides in the system. In addition, higher removal of hydrophobic fractions by PSI-1 pre-treatments may lead to less association between residual NOM and less binding to the membranes, particularly on the PVDF-2 membrane, thus contributing to the cleanliness of, and high flux through, the PVDF-2 membrane.
While lower membrane fouling rates were obtained with PSI in laboratory trials, application of PSI to pressurised membrane systems was limited by the solids loading of the coagulant.
3.2.5 References
Carroll T, King S, Gray SR, Bolto B and Booker NA (2000) The fouling of microfiltration membranes by NOM after coagulation treatment. Water Research 34, 2861-2868.
Chow CWK Fabris R and Drikas M (2004) A rapid fractionation technique to characterise natural organic matter for the optimisation of water treatment processes, Journal of Water Supply: Research and Technology – AQUA 53(2), 85-92.
Clarke MM (2004) ACS Annual Meeting, Philadelphia (personal communication) Fan L, Harris JL, Roddick FA and Booker NA (2001) Influence of the characteristics of natural organic
matter on the fouling of microfiltration membranes. Water Research 35, 4455-4463. Farahbakhsh K, Svrcek C, Guest RK and Smith DW (2004) A review of the impact of chemical pre-
treatment on low-pressure water treatment membranes. Journal of Environmental and Engineering Science 3, 237-253.
Galjaard G, Kruithof JC and Kamp PC (2005) Influence of NOM and membrane surface charge on UF membrane fouling. Membrane Technology Conference, AWWA, March 6-9, Phoenix, Arizona
Gray SR, Ritchie CB and Bolto BA (2003) Predicting NOM fouling of low pressure membranes. Proceedings of the International Membrane Science and Technology Conference, Sydney, Paper 203.
Gray SG, Ritchie CB and Bolto BA (2004) Effect of fractionated NOM on low pressure membrane flux declines. Water Science and Technology: Water Supply 4(4), 189-196.
Gray S, Tran T, Bolto B and Ritchie C (2005) NOM composition – Effect on microfiltration fouling, (2005) AWWA Membrane Technology Conference, Phoenix, Arizona.
Hasegawa T, Onitsuka T, Suzuki M, Ehara Y, Hashimoto K, Ozaki T (1990) Method and flocculant for water treatment, United States Patent, 4,923,629
Hasegawa T, Hashimoto K, Onitsuka T, Goto K and Tambo N (1991) Characteristics of metal-polysilicate coagulants, Water Science and Technology 23 1713-1722.
Hashimoto K, Hasegawa T, Onitsuka T, Goto K and Tambo N (1991) Inorganic polymer coagulants of metal-polysilicate complex, Water Supply 9 S65-S70.
DEVELOPMENT OF COMBINED TREATMENT PROCESSES FOR THE REMOVAL OF RECALCITRANT ORGANIC MATTER
132
Howe KJ and Clarke MM (2002) Fouling of microfiltration and ultrafiltration membranes by natural waters. Environmental Science and Technology 36, 3571-3576.
Iler RK (1979) The Chemistry of Silica, Wiley, New York, 1979. Jang NY, Watanabe Y, Ozawa G and Hosoya M (2002) Effect of pre-coagulation/sedimentation on the
ultrafiltration process, in H.H. Hahn, E. Hoffmann and H. Ødegaard (Ed.), Chemical Water and Wastewater Treatment VII, IWA Publishing, London, 51-58.
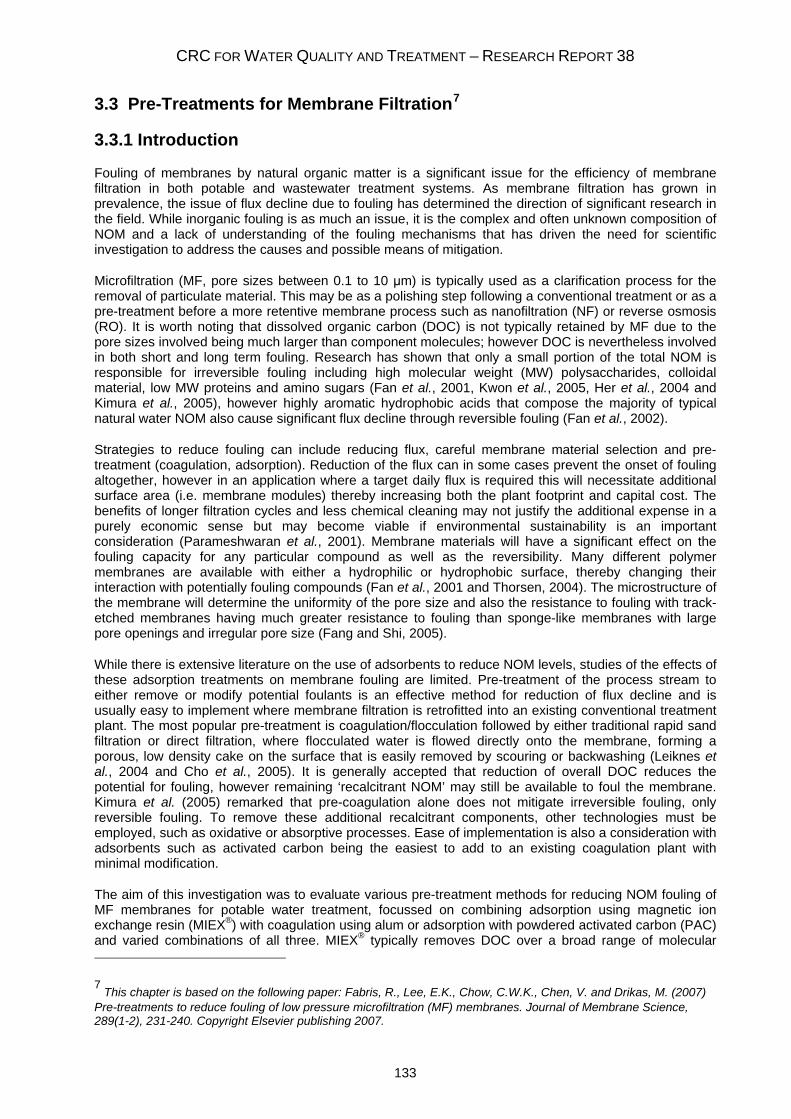
CRC FOR WATER QUALITY AND TREATMENT – RESEARCH REPORT 38
133
3.3 Pre-Treatments for Membrane Filtration7
3.3.1 Introduction
Fouling of membranes by natural organic matter is a significant issue for the efficiency of membrane filtration in both potable and wastewater treatment systems. As membrane filtration has grown in prevalence, the issue of flux decline due to fouling has determined the direction of significant research in the field. While inorganic fouling is as much an issue, it is the complex and often unknown composition of NOM and a lack of understanding of the fouling mechanisms that has driven the need for scientific investigation to address the causes and possible means of mitigation.
Microfiltration (MF, pore sizes between 0.1 to 10 μm) is typically used as a clarification process for the removal of particulate material. This may be as a polishing step following a conventional treatment or as a pre-treatment before a more retentive membrane process such as nanofiltration (NF) or reverse osmosis (RO). It is worth noting that dissolved organic carbon (DOC) is not typically retained by MF due to the pore sizes involved being much larger than component molecules; however DOC is nevertheless involved in both short and long term fouling. Research has shown that only a small portion of the total NOM is responsible for irreversible fouling including high molecular weight (MW) polysaccharides, colloidal material, low MW proteins and amino sugars (Fan et al., 2001, Kwon et al., 2005, Her et al., 2004 and Kimura et al., 2005), however highly aromatic hydrophobic acids that compose the majority of typical natural water NOM also cause significant flux decline through reversible fouling (Fan et al., 2002).
Strategies to reduce fouling can include reducing flux, careful membrane material selection and pre-treatment (coagulation, adsorption). Reduction of the flux can in some cases prevent the onset of fouling altogether, however in an application where a target daily flux is required this will necessitate additional surface area (i.e. membrane modules) thereby increasing both the plant footprint and capital cost. The benefits of longer filtration cycles and less chemical cleaning may not justify the additional expense in a purely economic sense but may become viable if environmental sustainability is an important consideration (Parameshwaran et al., 2001). Membrane materials will have a significant effect on the fouling capacity for any particular compound as well as the reversibility. Many different polymer membranes are available with either a hydrophilic or hydrophobic surface, thereby changing their interaction with potentially fouling compounds (Fan et al., 2001 and Thorsen, 2004). The microstructure of the membrane will determine the uniformity of the pore size and also the resistance to fouling with track-etched membranes having much greater resistance to fouling than sponge-like membranes with large pore openings and irregular pore size (Fang and Shi, 2005).
While there is extensive literature on the use of adsorbents to reduce NOM levels, studies of the effects of these adsorption treatments on membrane fouling are limited. Pre-treatment of the process stream to either remove or modify potential foulants is an effective method for reduction of flux decline and is usually easy to implement where membrane filtration is retrofitted into an existing conventional treatment plant. The most popular pre-treatment is coagulation/flocculation followed by either traditional rapid sand filtration or direct filtration, where flocculated water is flowed directly onto the membrane, forming a porous, low density cake on the surface that is easily removed by scouring or backwashing (Leiknes et al., 2004 and Cho et al., 2005). It is generally accepted that reduction of overall DOC reduces the potential for fouling, however remaining ‘recalcitrant NOM’ may still be available to foul the membrane. Kimura et al. (2005) remarked that pre-coagulation alone does not mitigate irreversible fouling, only reversible fouling. To remove these additional recalcitrant components, other technologies must be employed, such as oxidative or absorptive processes. Ease of implementation is also a consideration with adsorbents such as activated carbon being the easiest to add to an existing coagulation plant with minimal modification.
The aim of this investigation was to evaluate various pre-treatment methods for reducing NOM fouling of MF membranes for potable water treatment, focussed on combining adsorption using magnetic ion exchange resin (MIEX®) with coagulation using alum or adsorption with powdered activated carbon (PAC) and varied combinations of all three. MIEX® typically removes DOC over a broad range of molecular
7 This chapter is based on the following paper: Fabris, R., Lee, E.K., Chow, C.W.K., Chen, V. and Drikas, M. (2007)
Pre-treatments to reduce fouling of low pressure microfiltration (MF) membranes. Journal of Membrane Science, 289(1-2), 231-240. Copyright Elsevier publishing 2007.
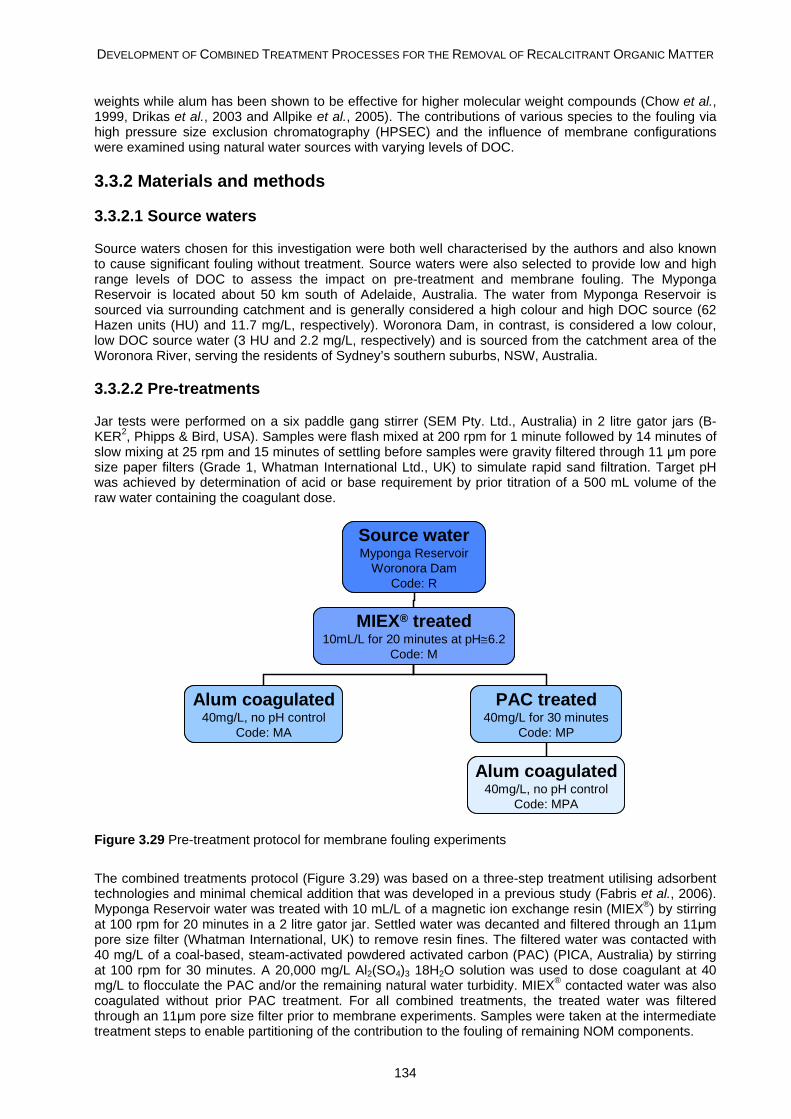
DEVELOPMENT OF COMBINED TREATMENT PROCESSES FOR THE REMOVAL OF RECALCITRANT ORGANIC MATTER
134
weights while alum has been shown to be effective for higher molecular weight compounds (Chow et al., 1999, Drikas et al., 2003 and Allpike et al., 2005). The contributions of various species to the fouling via high pressure size exclusion chromatography (HPSEC) and the influence of membrane configurations were examined using natural water sources with varying levels of DOC.
3.3.2 Materials and methods
3.3.2.1 Source waters
Source waters chosen for this investigation were both well characterised by the authors and also known to cause significant fouling without treatment. Source waters were also selected to provide low and high range levels of DOC to assess the impact on pre-treatment and membrane fouling. The Myponga Reservoir is located about 50 km south of Adelaide, Australia. The water from Myponga Reservoir is sourced via surrounding catchment and is generally considered a high colour and high DOC source (62 Hazen units (HU) and 11.7 mg/L, respectively). Woronora Dam, in contrast, is considered a low colour, low DOC source water (3 HU and 2.2 mg/L, respectively) and is sourced from the catchment area of the Woronora River, serving the residents of Sydney’s southern suburbs, NSW, Australia.
3.3.2.2 Pre-treatments
Jar tests were performed on a six paddle gang stirrer (SEM Pty. Ltd., Australia) in 2 litre gator jars (B-KER2, Phipps & Bird, USA). Samples were flash mixed at 200 rpm for 1 minute followed by 14 minutes of slow mixing at 25 rpm and 15 minutes of settling before samples were gravity filtered through 11 μm pore size paper filters (Grade 1, Whatman International Ltd., UK) to simulate rapid sand filtration. Target pH was achieved by determination of acid or base requirement by prior titration of a 500 mL volume of the raw water containing the coagulant dose.
Source waterMyponga Reservoir
Woronora DamCode: R
MIEX® treated10mL/L for 20 minutes at pH≅6.2
Code: M
Alum coagulated40mg/L, no pH control
Code: MA
PAC treated40mg/L for 30 minutes
Code: MP
Alum coagulated40mg/L, no pH control
Code: MPA
Source waterMyponga Reservoir
Woronora DamCode: R
MIEX® treated10mL/L for 20 minutes at pH≅6.2
Code: M
Alum coagulated40mg/L, no pH control
Code: MA
PAC treated40mg/L for 30 minutes
Code: MP
Alum coagulated40mg/L, no pH control
Code: MPA
Figure 3.29 Pre-treatment protocol for membrane fouling experiments
The combined treatments protocol (Figure 3.29) was based on a three-step treatment utilising adsorbent technologies and minimal chemical addition that was developed in a previous study (Fabris et al., 2006). Myponga Reservoir water was treated with 10 mL/L of a magnetic ion exchange resin (MIEX®) by stirring at 100 rpm for 20 minutes in a 2 litre gator jar. Settled water was decanted and filtered through an 11μm pore size filter (Whatman International, UK) to remove resin fines. The filtered water was contacted with 40 mg/L of a coal-based, steam-activated powdered activated carbon (PAC) (PICA, Australia) by stirring at 100 rpm for 30 minutes. A 20,000 mg/L Al2(SO4)3 18H2O solution was used to dose coagulant at 40 mg/L to flocculate the PAC and/or the remaining natural water turbidity. MIEX® contacted water was also coagulated without prior PAC treatment. For all combined treatments, the treated water was filtered through an 11μm pore size filter prior to membrane experiments. Samples were taken at the intermediate treatment steps to enable partitioning of the contribution to the fouling of remaining NOM components.
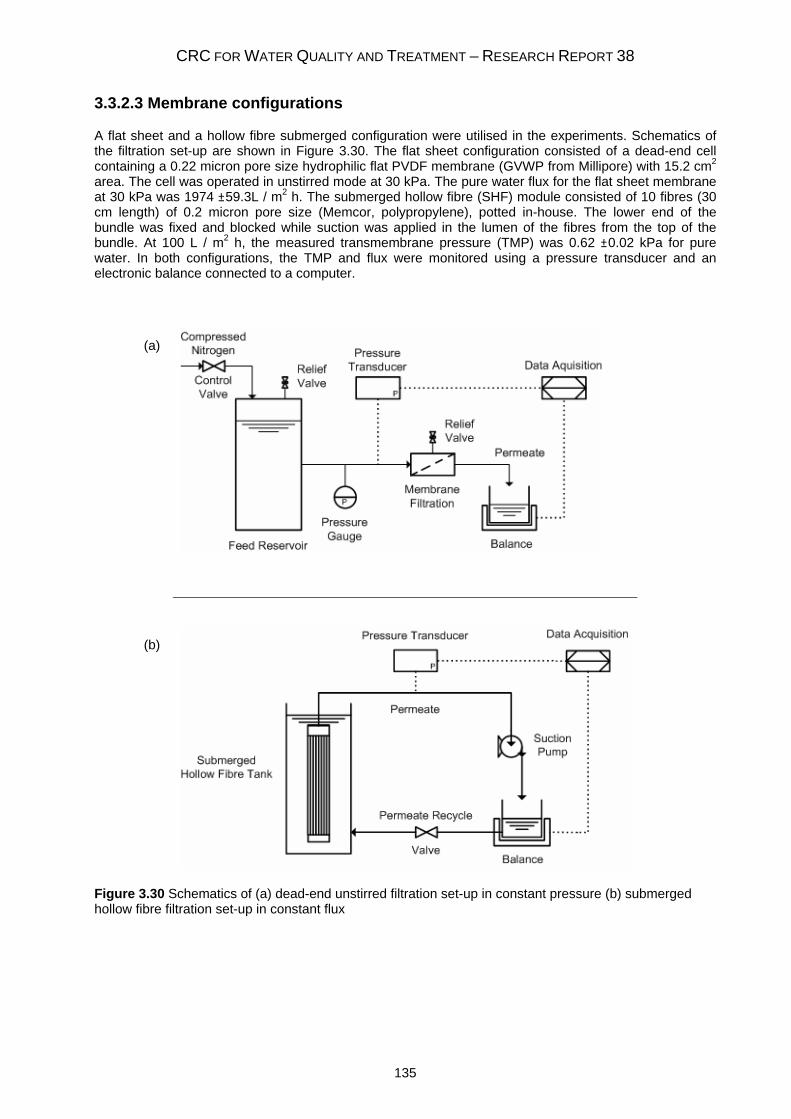
CRC FOR WATER QUALITY AND TREATMENT – RESEARCH REPORT 38
135
3.3.2.3 Membrane configurations
A flat sheet and a hollow fibre submerged configuration were utilised in the experiments. Schematics of the filtration set-up are shown in Figure 3.30. The flat sheet configuration consisted of a dead-end cell containing a 0.22 micron pore size hydrophilic flat PVDF membrane (GVWP from Millipore) with 15.2 cm2 area. The cell was operated in unstirred mode at 30 kPa. The pure water flux for the flat sheet membrane at 30 kPa was 1974 ±59.3L / m2 h. The submerged hollow fibre (SHF) module consisted of 10 fibres (30 cm length) of 0.2 micron pore size (Memcor, polypropylene), potted in-house. The lower end of the bundle was fixed and blocked while suction was applied in the lumen of the fibres from the top of the bundle. At 100 L / m2 h, the measured transmembrane pressure (TMP) was 0.62 ±0.02 kPa for pure water. In both configurations, the TMP and flux were monitored using a pressure transducer and an electronic balance connected to a computer.
Figure 3.30 Schematics of (a) dead-end unstirred filtration set-up in constant pressure (b) submerged hollow fibre filtration set-up in constant flux
(a)
(b)
DEVELOPMENT OF COMBINED TREATMENT PROCESSES FOR THE REMOVAL OF RECALCITRANT ORGANIC MATTER
136
3.3.2.4 Instrumental analyses
Analysed parameters included turbidity, true colour, ultra-violet absorbance at 254nm (UV254), DOC, molecular weight distribution by high performance size exclusion chromatography (HPSEC) and scanning electron microscopy (SEM). Turbidity was determined using a Hach 2100AN turbidimeter (Hach, USA) and is expressed in nephelometric turbidity units (NTU). Samples for true colour, UV254 and DOC were filtered through 0.45 μm membranes. True colour was measured using a 5cm quartz cell at 456 nm and calibrated against a Platinum/Cobalt standard (Bennet and Drikas, 1993). UV254 was measured through a 1cm quartz cell and DOC was measured using a Sievers 820 Portable TOC analyser (Ionics, USA). HPSEC was analysed using a Waters Alliance 2690 separations module and 996 photodiode array detector (PDA) at 260 nm (Waters Corporation, USA). Phosphate buffer (0.1 M) with 1.0 M NaCl was flowed through a Shodex KW802.5 packed silica column (Showa Denko, Japan) at 1.0 mL/min. This column provides an effective separation range from approximately 100 Daltons (Da) to an exclusion limit of 50,000 Da. Apparent molecular weight was derived by calibration with poly-styrene sulphonate (PSS) molecular weight standards of 35, 18, 8 and 4.6 kDa. Electron microscopy was performed using a Hitachi S900 field emission scanning electron microscope (Hitachi Science Systems, Japan).
3.3.2.5 Membrane fouling
The fouling behaviour of membrane filtration can be described by the resistance-in-series model, which is based on Darcy’s law. For constant pressure filtration, the resistance-in-series model is expressed as:
)R(RP
fm +Δ
=μ
J Equation 1
where J is the filtrate flux, ΔP is the transmembrane pressure, μ is the permeate viscocity, Rm is the membrane resistance, and Rf is the total foulant resistance. Rf consists of hydraulically reversible and irreversible fouling resistances.
The resistance of a clean membrane was determined by filtering pure water until steady state was attained. The feed was then changed to pre-treated water and the filtrate flow rate was monitored in order to determine Rf. At the end of filtration, the filtration cell was emptied and the membrane was gently rinsed with pure water to remove material contributing to reversible fouling. The pure water flux of the membrane was then re-evaluated for the determination of irreversible foulant resistance.
3.3.3 Results and Discussion
3.3.3.1 Pre-treated water quality
When comparing water quality data for the various pre-treatments (Table 3.18), it is clear that MIEX® was very effective as a primary treatment for colour, UV absorbance and DOC removal. Although initial water turbidity was not high for either water source, treatments that reduced turbidity to around 0.1NTU in both source waters included alum coagulation, as the absorbents are largely incapable of turbidity removal and can increase the visually apparent treated water turbidity prior to filtration. Reported reductions (Table 3.1) in turbidity for the adsorbent treatments are predominantly due to the subsequent filtration step, as partitioning of the adsorbents and natural water turbidity was not practically feasible. Full combined treatment produced treated water with less than 1.0 mg/L DOC for both Myponga and Woronora source water (>80% DOC removed). It is worth noting that despite large differences in both DOC and traditional water quality parameters, both Myponga Reservoir and Woronora Dam water had been shown to produce significant short term fouling of MF membranes. Both waters also contained detectable quantities of very high MW ‘colloidal’ NOM. This multi-component peak, seen at the exclusion limit of the column (50,000 Daltons), is believed to be composed of some NOM-metal complexes (Allpike et al., 2005) and complex amino sugars from bacterial cell walls and other biological sources (Leenheer, 2004 and Makdissy et al., 2004). The organo-metallic complexes are usually indicative of low residence time in the catchment which prevents significant natural photo-oxidation or biodegradation, and are not generally detected following conventional treatment or extended storage. The amino sugar component however, has generally proved to be more difficult to remove.
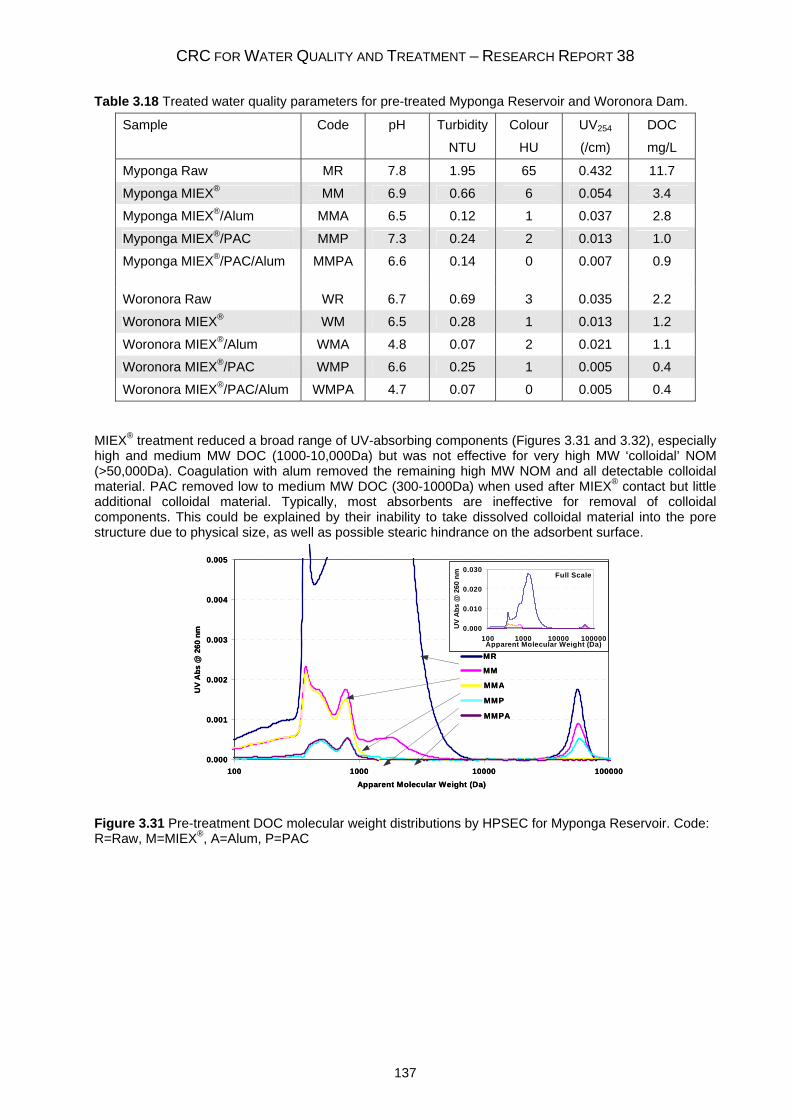
CRC FOR WATER QUALITY AND TREATMENT – RESEARCH REPORT 38
137
Table 3.18 Treated water quality parameters for pre-treated Myponga Reservoir and Woronora Dam.
Sample Code pH Turbidity Colour UV254 DOC
NTU HU (/cm) mg/L
Myponga Raw MR 7.8 1.95 65 0.432 11.7
Myponga MIEX® MM 6.9 0.66 6 0.054 3.4
Myponga MIEX®/Alum MMA 6.5 0.12 1 0.037 2.8
Myponga MIEX®/PAC MMP 7.3 0.24 2 0.013 1.0
Myponga MIEX®/PAC/Alum MMPA 6.6 0.14 0 0.007 0.9 Woronora Raw WR 6.7 0.69 3 0.035 2.2
Woronora MIEX® WM 6.5 0.28 1 0.013 1.2
Woronora MIEX®/Alum WMA 4.8 0.07 2 0.021 1.1
Woronora MIEX®/PAC WMP 6.6 0.25 1 0.005 0.4
Woronora MIEX®/PAC/Alum WMPA 4.7 0.07 0 0.005 0.4
MIEX® treatment reduced a broad range of UV-absorbing components (Figures 3.31 and 3.32), especially high and medium MW DOC (1000-10,000Da) but was not effective for very high MW ‘colloidal’ NOM (>50,000Da). Coagulation with alum removed the remaining high MW NOM and all detectable colloidal material. PAC removed low to medium MW DOC (300-1000Da) when used after MIEX® contact but little additional colloidal material. Typically, most absorbents are ineffective for removal of colloidal components. This could be explained by their inability to take dissolved colloidal material into the pore structure due to physical size, as well as possible stearic hindrance on the adsorbent surface.
0.000
0.001
0.002
0.003
0.004
0.005
100 1000 10000 100000Apparent Molecular Weight (Da)
UV
Abs
@ 2
60 n
m 0.000
0.010
0.020
0.030
100 1000 10000 100000Apparent Molecular Weight (Da)
UV
Abs
@ 2
60 n
m
MM
MMA
MMP
MMPA
MR
Full Scale
0.000
0.001
0.002
0.003
0.004
0.005
100 1000 10000 100000Apparent Molecular Weight (Da)
UV
Abs
@ 2
60 n
m 0.000
0.010
0.020
0.030
100 1000 10000 100000Apparent Molecular Weight (Da)
UV
Abs
@ 2
60 n
m
MM
MMA
MMP
MMPA
MR
Full Scale
Figure 3.31 Pre-treatment DOC molecular weight distributions by HPSEC for Myponga Reservoir. Code: R=Raw, M=MIEX®, A=Alum, P=PAC
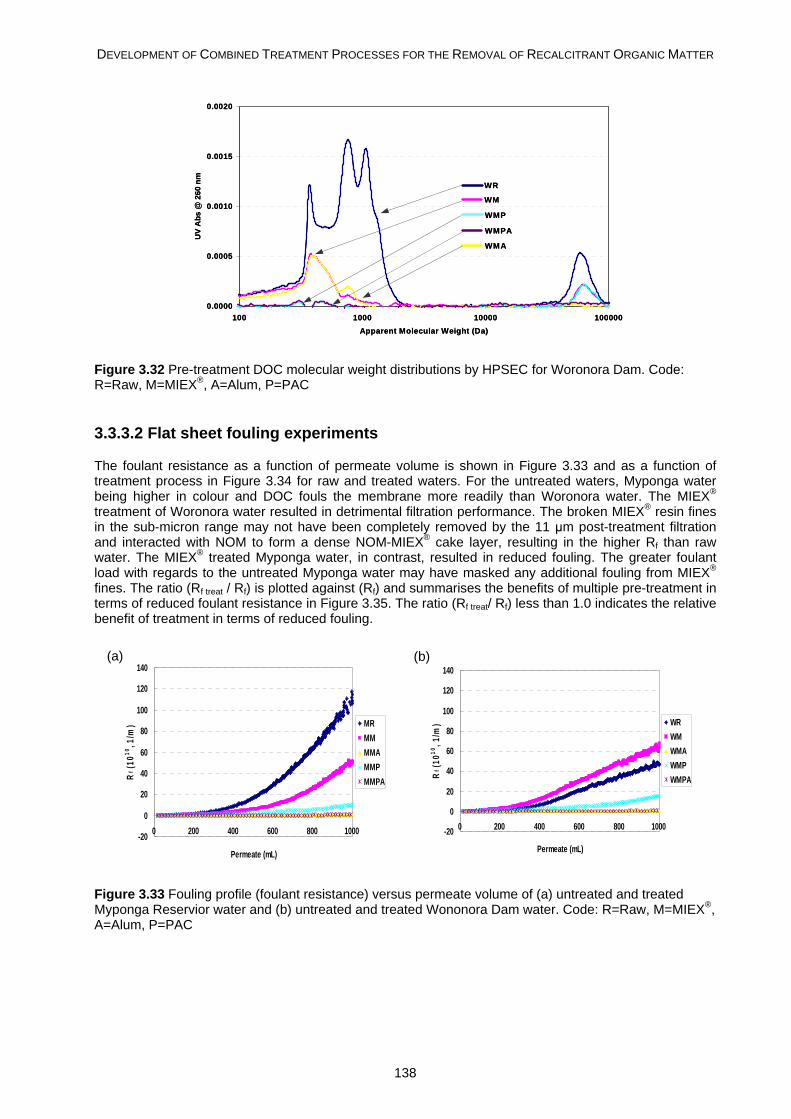
DEVELOPMENT OF COMBINED TREATMENT PROCESSES FOR THE REMOVAL OF RECALCITRANT ORGANIC MATTER
138
0.0000
0.0005
0.0010
0.0015
0.0020
100 1000 10000 100000Apparent Molecular Weight (Da)
UV
Abs
@ 2
60 n
mWM
WMA
WMP
WMPA
WR
0.0000
0.0005
0.0010
0.0015
0.0020
100 1000 10000 100000Apparent Molecular Weight (Da)
UV
Abs
@ 2
60 n
mWM
WMA
WMP
WMPA
WR
Figure 3.32 Pre-treatment DOC molecular weight distributions by HPSEC for Woronora Dam. Code: R=Raw, M=MIEX®, A=Alum, P=PAC
3.3.3.2 Flat sheet fouling experiments
The foulant resistance as a function of permeate volume is shown in Figure 3.33 and as a function of treatment process in Figure 3.34 for raw and treated waters. For the untreated waters, Myponga water being higher in colour and DOC fouls the membrane more readily than Woronora water. The MIEX® treatment of Woronora water resulted in detrimental filtration performance. The broken MIEX® resin fines in the sub-micron range may not have been completely removed by the 11 μm post-treatment filtration and interacted with NOM to form a dense NOM-MIEX® cake layer, resulting in the higher Rf than raw water. The MIEX® treated Myponga water, in contrast, resulted in reduced fouling. The greater foulant load with regards to the untreated Myponga water may have masked any additional fouling from MIEX® fines. The ratio (Rf treat / Rf) is plotted against (Rf) and summarises the benefits of multiple pre-treatment in terms of reduced foulant resistance in Figure 3.35. The ratio (Rf treat/ Rf) less than 1.0 indicates the relative benefit of treatment in terms of reduced fouling.
-20
0
20
40
60
80
100
120
140
0 200 400 600 800 1000
Permeate (mL)
Rf (
1010
, 1/m
) MRMMMMAMMPMMPA
-20
0
20
40
60
80
100
120
140
0 200 400 600 800 1000
Permeate (mL)
Rf (
1010
, 1/m
) WRWMWMAWMPWMPA
Figure 3.33 Fouling profile (foulant resistance) versus permeate volume of (a) untreated and treated Myponga Reservior water and (b) untreated and treated Wononora Dam water. Code: R=Raw, M=MIEX®, A=Alum, P=PAC
(a) (b)
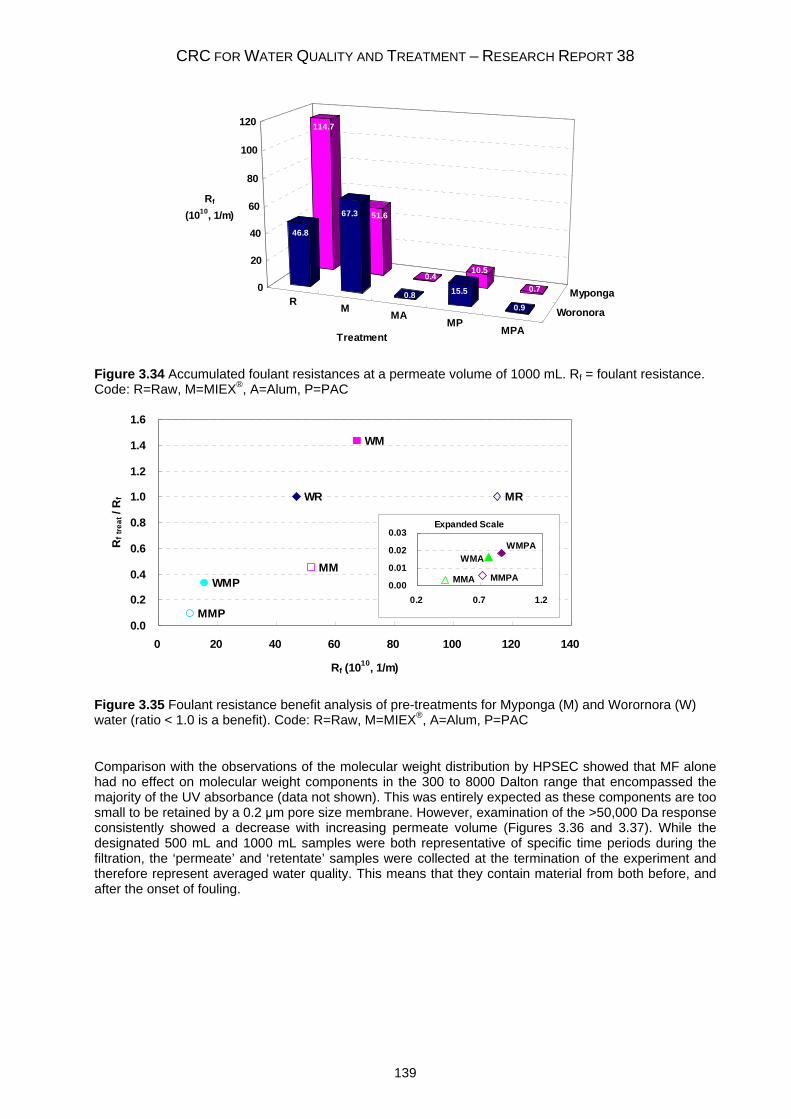
CRC FOR WATER QUALITY AND TREATMENT – RESEARCH REPORT 38
139
R M MAMP
MPA
Woronora
Myponga
114.7
51.6
0.410.5
0.7
46.8
67.3
0.8 15.5
0.9
0
20
40
60
80
100
120
Rf
(1010, 1/m)
Treatment
Figure 3.34 Accumulated foulant resistances at a permeate volume of 1000 mL. Rf = foulant resistance. Code: R=Raw, M=MIEX®, A=Alum, P=PAC
WR
WM
WMP
MR
MMP
MM
0.0
0.2
0.4
0.6
0.8
1.0
1.2
1.4
1.6
0 20 40 60 80 100 120 140
Rf (1010, 1/m)
Rf tr
eat /
Rf
Expanded Scale
MMA
WMAWMPA
MMPA0.00
0.01
0.02
0.03
0.2 0.7 1.2
Figure 3.35 Foulant resistance benefit analysis of pre-treatments for Myponga (M) and Worornora (W) water (ratio < 1.0 is a benefit). Code: R=Raw, M=MIEX®, A=Alum, P=PAC
Comparison with the observations of the molecular weight distribution by HPSEC showed that MF alone had no effect on molecular weight components in the 300 to 8000 Dalton range that encompassed the majority of the UV absorbance (data not shown). This was entirely expected as these components are too small to be retained by a 0.2 μm pore size membrane. However, examination of the >50,000 Da response consistently showed a decrease with increasing permeate volume (Figures 3.36 and 3.37). While the designated 500 mL and 1000 mL samples were both representative of specific time periods during the filtration, the ‘permeate’ and ‘retentate’ samples were collected at the termination of the experiment and therefore represent averaged water quality. This means that they contain material from both before, and after the onset of fouling.
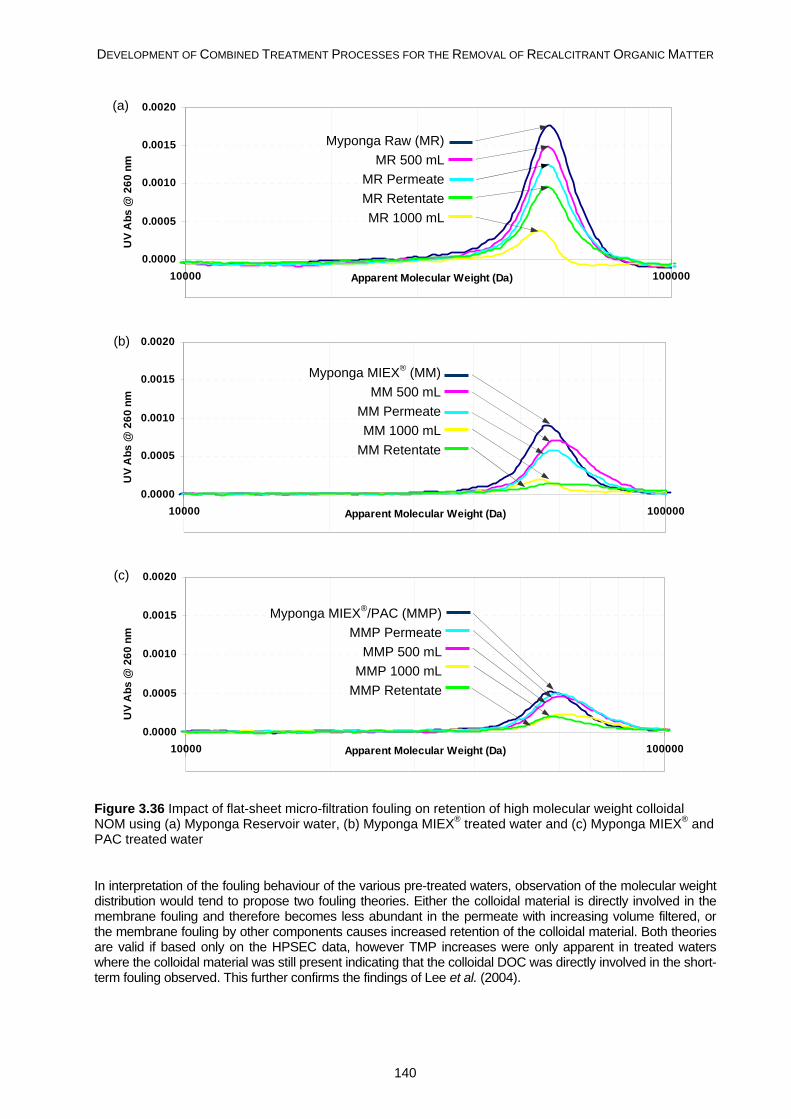
DEVELOPMENT OF COMBINED TREATMENT PROCESSES FOR THE REMOVAL OF RECALCITRANT ORGANIC MATTER
140
-0.0005
0.0000
0.0005
0.0010
0.0015
0.0020
10000 100000Apparent Molecular Weight (Da)
UV
Abs
@ 2
60 n
m
-0.0005
0.0000
0.0005
0.0010
0.0015
0.0020
10000 100000Apparent Molecular Weight (Da)
UV
Abs
@ 2
60 n
m
-0.0005
0.0000
0.0005
0.0010
0.0015
0.0020
10000 100000Apparent Molecular Weight (Da)
UV
Abs
@ 2
60 n
m
Figure 3.36 Impact of flat-sheet micro-filtration fouling on retention of high molecular weight colloidal NOM using (a) Myponga Reservoir water, (b) Myponga MIEX® treated water and (c) Myponga MIEX® and PAC treated water
In interpretation of the fouling behaviour of the various pre-treated waters, observation of the molecular weight distribution would tend to propose two fouling theories. Either the colloidal material is directly involved in the membrane fouling and therefore becomes less abundant in the permeate with increasing volume filtered, or the membrane fouling by other components causes increased retention of the colloidal material. Both theories are valid if based only on the HPSEC data, however TMP increases were only apparent in treated waters where the colloidal material was still present indicating that the colloidal DOC was directly involved in the short-term fouling observed. This further confirms the findings of Lee et al. (2004).
(a)
(b)
(c)
Myponga Raw (MR)MR 500 mL
MR PermeateMR RetentateMR 1000 mL
Myponga MIEX® (MM)MM 500 mL
MM PermeateMM 1000 mL
MM Retentate
Myponga MIEX®/PAC (MMP)MMP Permeate
MMP 500 mLMMP 1000 mL
MMP Retentate
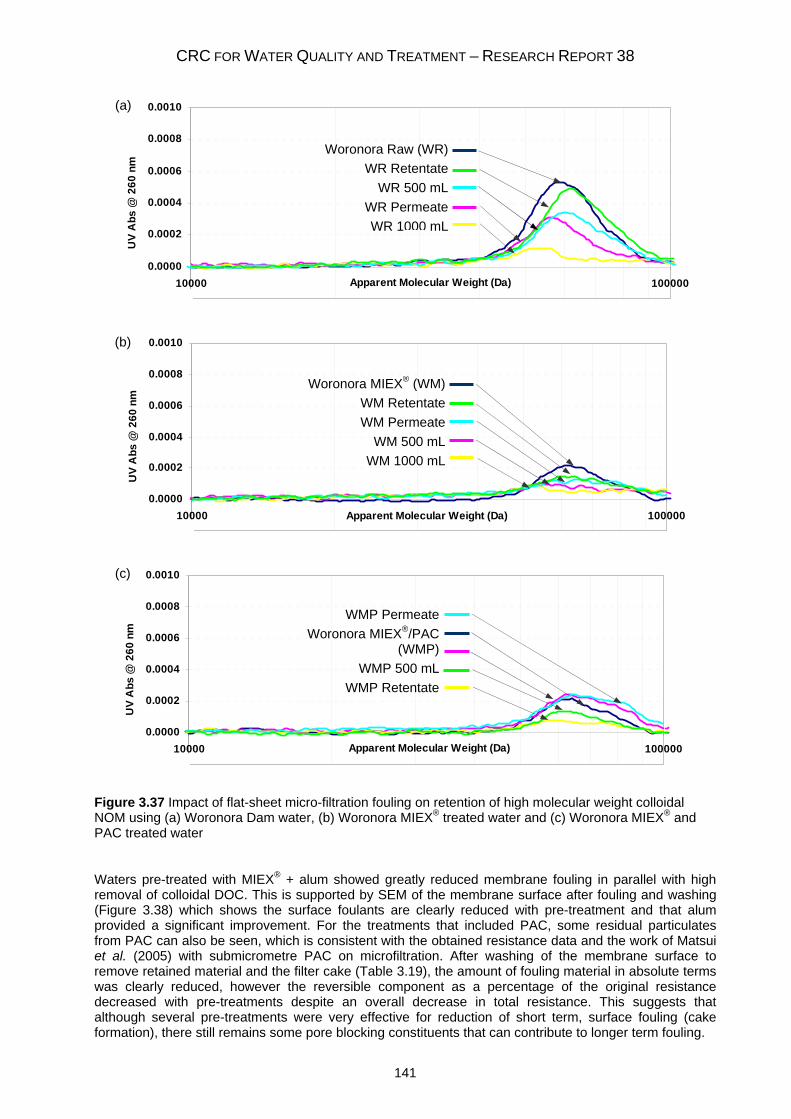
CRC FOR WATER QUALITY AND TREATMENT – RESEARCH REPORT 38
141
-0.0002
0.0000
0.0002
0.0004
0.0006
0.0008
0.0010
10000 100000Apparent Molecular Weight (Da)
UV
Abs
@ 2
60 n
m
-0.0002
0.0000
0.0002
0.0004
0.0006
0.0008
0.0010
10000 100000Apparent Molecular Weight (Da)
UV
Abs
@ 2
60 n
m
-0.0002
0.0000
0.0002
0.0004
0.0006
0.0008
0.0010
10000 100000Apparent Molecular Weight (Da)
UV
Abs
@ 2
60 n
m
Figure 3.37 Impact of flat-sheet micro-filtration fouling on retention of high molecular weight colloidal NOM using (a) Woronora Dam water, (b) Woronora MIEX® treated water and (c) Woronora MIEX® and PAC treated water
Waters pre-treated with MIEX® + alum showed greatly reduced membrane fouling in parallel with high removal of colloidal DOC. This is supported by SEM of the membrane surface after fouling and washing (Figure 3.38) which shows the surface foulants are clearly reduced with pre-treatment and that alum provided a significant improvement. For the treatments that included PAC, some residual particulates from PAC can also be seen, which is consistent with the obtained resistance data and the work of Matsui et al. (2005) with submicrometre PAC on microfiltration. After washing of the membrane surface to remove retained material and the filter cake (Table 3.19), the amount of fouling material in absolute terms was clearly reduced, however the reversible component as a percentage of the original resistance decreased with pre-treatments despite an overall decrease in total resistance. This suggests that although several pre-treatments were very effective for reduction of short term, surface fouling (cake formation), there still remains some pore blocking constituents that can contribute to longer term fouling.
(a)
(b)
(c)
Woronora MIEX® (WM)WM RetentateWM Permeate
WM 500 mLWM 1000 mL
WMP PermeateWoronora MIEX®/PAC
(WMP)WMP 500 mL
WMP Retentate
Woronora Raw (WR)WR Retentate
WR 500 mLWR PermeateWR 1000 mL
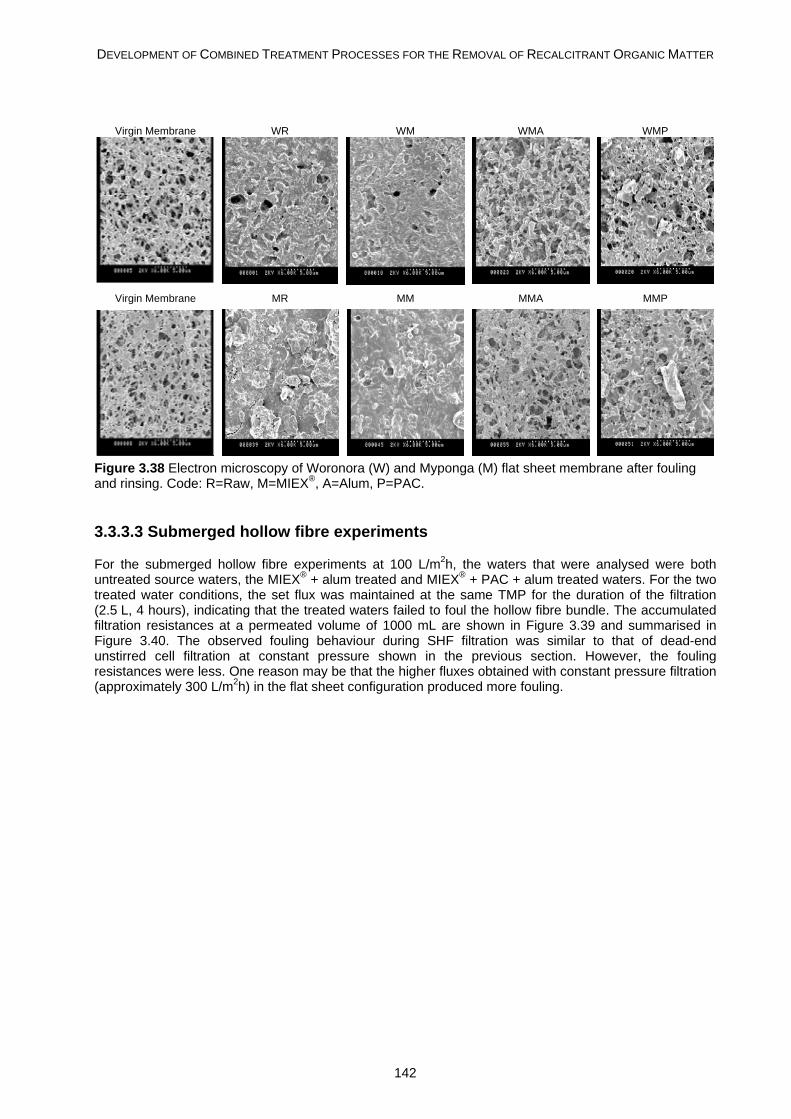
DEVELOPMENT OF COMBINED TREATMENT PROCESSES FOR THE REMOVAL OF RECALCITRANT ORGANIC MATTER
142
Virgin Membrane WR WM WMA WMP
Virgin Membrane MR MM MMA MMP
Figure 3.38 Electron microscopy of Woronora (W) and Myponga (M) flat sheet membrane after fouling and rinsing. Code: R=Raw, M=MIEX®, A=Alum, P=PAC.
3.3.3.3 Submerged hollow fibre experiments
For the submerged hollow fibre experiments at 100 L/m2h, the waters that were analysed were both untreated source waters, the MIEX® + alum treated and MIEX® + PAC + alum treated waters. For the two treated water conditions, the set flux was maintained at the same TMP for the duration of the filtration (2.5 L, 4 hours), indicating that the treated waters failed to foul the hollow fibre bundle. The accumulated filtration resistances at a permeated volume of 1000 mL are shown in Figure 3.39 and summarised in Figure 3.40. The observed fouling behaviour during SHF filtration was similar to that of dead-end unstirred cell filtration at constant pressure shown in the previous section. However, the fouling resistances were less. One reason may be that the higher fluxes obtained with constant pressure filtration (approximately 300 L/m2h) in the flat sheet configuration produced more fouling.
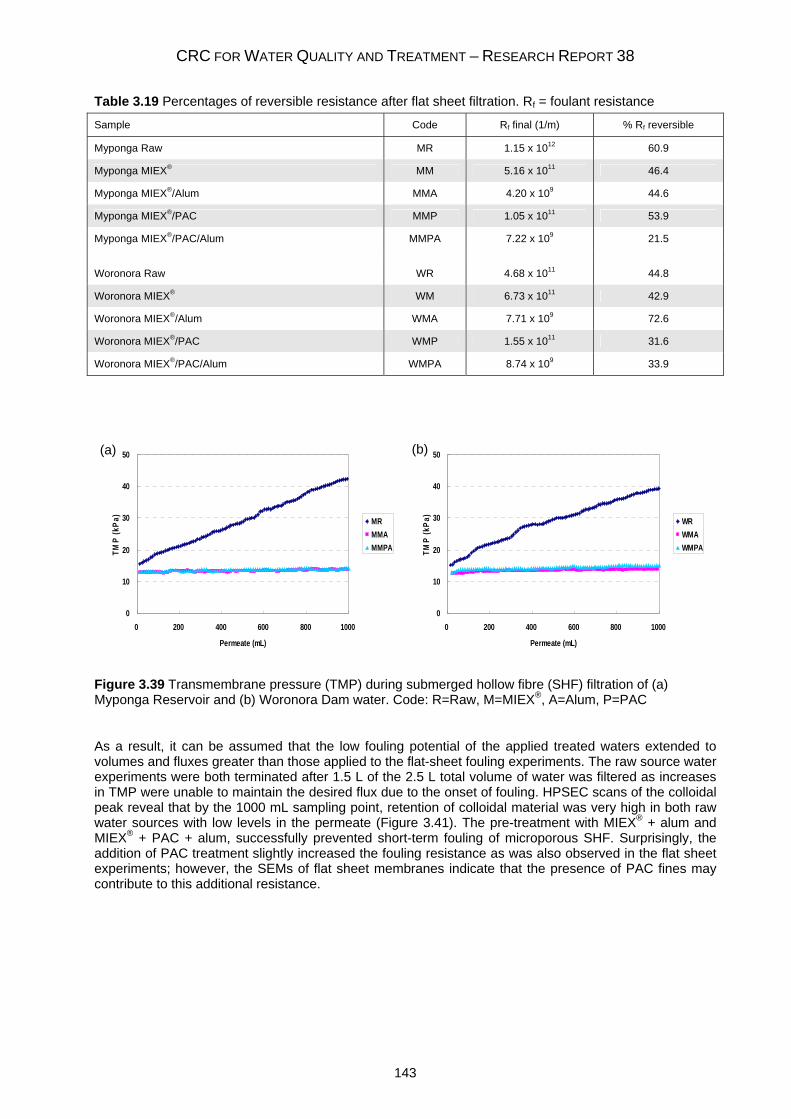
CRC FOR WATER QUALITY AND TREATMENT – RESEARCH REPORT 38
143
Table 3.19 Percentages of reversible resistance after flat sheet filtration. Rf = foulant resistance
Sample Code Rf final (1/m) % Rf reversible
Myponga Raw MR 1.15 x 10¹² 60.9
Myponga MIEX® MM 5.16 x 10¹¹ 46.4
Myponga MIEX®/Alum MMA 4.20 x 10⁹ 44.6
Myponga MIEX®/PAC MMP 1.05 x 10¹¹ 53.9
Myponga MIEX®/PAC/Alum MMPA 7.22 x 10⁹ 21.5 Woronora Raw WR 4.68 x 10¹¹ 44.8
Woronora MIEX® WM 6.73 x 10¹¹ 42.9
Woronora MIEX®/Alum WMA 7.71 x 10⁹ 72.6
Woronora MIEX®/PAC WMP 1.55 x 10¹¹ 31.6
Woronora MIEX®/PAC/Alum WMPA 8.74 x 10⁹ 33.9
0
10
20
30
40
50
0 200 400 600 800 1000
Permeate (mL)
TMP
(kPa
)
MRMMAMMPA
0
10
20
30
40
50
0 200 400 600 800 1000
Permeate (mL)
TMP
(kPa
)
WRWMAWMPA
Figure 3.39 Transmembrane pressure (TMP) during submerged hollow fibre (SHF) filtration of (a) Myponga Reservoir and (b) Woronora Dam water. Code: R=Raw, M=MIEX®, A=Alum, P=PAC
As a result, it can be assumed that the low fouling potential of the applied treated waters extended to volumes and fluxes greater than those applied to the flat-sheet fouling experiments. The raw source water experiments were both terminated after 1.5 L of the 2.5 L total volume of water was filtered as increases in TMP were unable to maintain the desired flux due to the onset of fouling. HPSEC scans of the colloidal peak reveal that by the 1000 mL sampling point, retention of colloidal material was very high in both raw water sources with low levels in the permeate (Figure 3.41). The pre-treatment with MIEX® + alum and MIEX® + PAC + alum, successfully prevented short-term fouling of microporous SHF. Surprisingly, the addition of PAC treatment slightly increased the fouling resistance as was also observed in the flat sheet experiments; however, the SEMs of flat sheet membranes indicate that the presence of PAC fines may contribute to this additional resistance.
(b) (a)
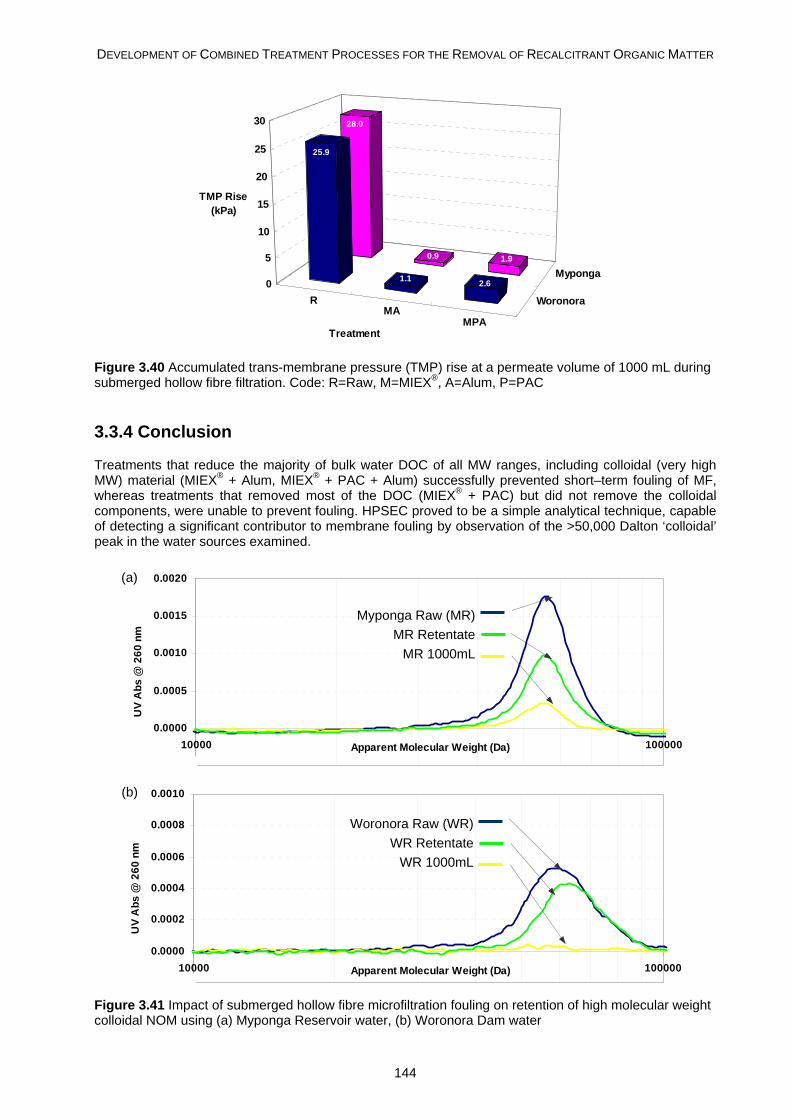
DEVELOPMENT OF COMBINED TREATMENT PROCESSES FOR THE REMOVAL OF RECALCITRANT ORGANIC MATTER
144
RMA
MPA
Woronora
Myponga
28.0
0.9 1.9
25.9
1.1 2.60
5
10
15
20
25
30
TMP Rise(kPa)
Treatment
Figure 3.40 Accumulated trans-membrane pressure (TMP) rise at a permeate volume of 1000 mL during submerged hollow fibre filtration. Code: R=Raw, M=MIEX®, A=Alum, P=PAC
3.3.4 Conclusion
Treatments that reduce the majority of bulk water DOC of all MW ranges, including colloidal (very high MW) material (MIEX® + Alum, MIEX® + PAC + Alum) successfully prevented short–term fouling of MF, whereas treatments that removed most of the DOC (MIEX® + PAC) but did not remove the colloidal components, were unable to prevent fouling. HPSEC proved to be a simple analytical technique, capable of detecting a significant contributor to membrane fouling by observation of the >50,000 Dalton ‘colloidal’ peak in the water sources examined.
-0.0005
0.0000
0.0005
0.0010
0.0015
0.0020
10000 100000Apparent Molecular Weight (Da)
UV
Abs
@ 2
60 n
m
-0.0002
0.0000
0.0002
0.0004
0.0006
0.0008
0.0010
10000 100000Apparent Molecular Weight (Da)
UV
Abs
@ 2
60 n
m
Figure 3.41 Impact of submerged hollow fibre microfiltration fouling on retention of high molecular weight colloidal NOM using (a) Myponga Reservoir water, (b) Woronora Dam water
(a)
(b)
Myponga Raw (MR)MR Retentate
MR 1000mL
Woronora Raw (WR)WR Retentate
WR 1000mL
CRC FOR WATER QUALITY AND TREATMENT – RESEARCH REPORT 38
145
3.3.5 References
Allpike BP, Heitz A, Joll CA, Kagi RI, Abbt-Braun G, Frimmel FH, Brinkmann T, Her N and Amy G (2005) Size exclusion chromatography to characterize DOC removal in drinking water treatment. Environmental Science and Technology 39(7), 2334-2342.
Bennett LE and Drikas M (1993) The evaluation of colour in natural waters. Water Research 27(7), 1209-1218.
Cho M-H, Lee C-H and Lee S (2005) Influence of floc structure on membrane permeability in the coagulation-MF process. Water Science and Technology 51(6-7), 143-150.
Chow CWK, van Leeuwen JA, Drikas M, Fabris R, Spark KM and Page DW (1999) The impact of the character of natural organic matter in conventional treatment with alum. Water Science and Technology 40(9), 97-104.
Drikas M, Chow CWK and Cook D (2003) The impact of recalcitrant organic character on disinfection stability, trihalomethane formation and bacterial regrowth: An evaluation of magnetic ion exchange resin (MIEX®) and alum coagulation, Journal of Water Supply: Research and Technology 52(7), 475 – 487.
Fabris R, Chow CWK and Drikas M (2006) Combined treatments for enhanced natural organic matter (NOM) removal. Proceedings of Enviro 06 Conference, Melbourne, Australia, 9-11th May 2006, paper e6174, CD-ROM and www.enviroaust.net/e6/papers/e6174.pdf
Fan L, Harris J, Roddick F and Booker N (2002) Fouling of microfiltration membranes by the fractional components of natural organic matter in surface water. Water Science and Technology: Water Supply 2(5-6), 313-320.
Fan L, Harris JL, Roddick FA and Booker NA (2001) Influence of the characteristics of natural organic matter on the fouling of microfiltration membranes. Water Research 35(18), 4455-4463.
Fang HHP and Shi X (2005) Pore fouling of microfiltration membranes by activated sludge. Journal of Membrane Science 264(1-2), 161-166.
Her N, Amy G, Park HR and Song M (2004) Characterizing algogenic organic matter (AOM) and evaluating associated NF membrane fouling. Water Research 38(6), 1427-1438.
Kimura K, Hane Y and Watanabe Y (2005) Effect of pre-coagulation on mitigating irreversible fouling during ultrafiltration of a surface water. Water Science and Technology 51(6-7), 93-100.
Kwon B, Lee S, Cho J, Ahn H, Lee D and Shin HS (2005) Biodegradability, DBP formation and membrane fouling potential of natural organic matter: Characterisation and controllability. Environmental Science and Technology 39(3), 732-739.
Lee N, Amy G, Croue J-P and Buisson H (2004) Identification and understanding of fouling in low-pressure membrane (MF/UF) by natural organic matter (NOM). Water Research 38(20), 4511-4523.
Leenheer JA(2004) Comprehensive assessment of precursors, diagenesis, and reactivity to water treatment of dissolved and colloidal organic matter. Water Science and Technology: Water Supply 4(4), 1-9.
Leiknes T, Odegaard H and Myklebust H (2004) Removal of natural organic matter (NOM) in drinking water treatment by coagulation-microfiltration using metal membranes. Journal of Membrane Science 242(1-2), 47-55.
Makdissy G, Croue J-P, Amy G and Buisson H (2004) Fouling of a polyethersufone ultrafiltration membrane by natural organic matter. Water Science and Technology: Water Supply 4(4), 205-212.
Matsui Y, Murase R, Sanogawa T, Aoki N, Mima S, Inoue T and Matsushita T (2005) Rapid adsorption pre-treatment with submicrometre powdered activated carbon particles before microfiltration. Water Science and Technology 51(6-7), 249-256.
Parameshwaran K, Fane AG, Cho BD and Kim KJ (2001) Analysis of microfiltration performance with constant flux processing of secondary effluent, Water Research 35(18), 4349 – 4358.
Thorsen T (2004) Concentration polarisation by natural organic matter (NOM) in NF and UF. Journal of Membrane Science 233(1-2), 79-91.
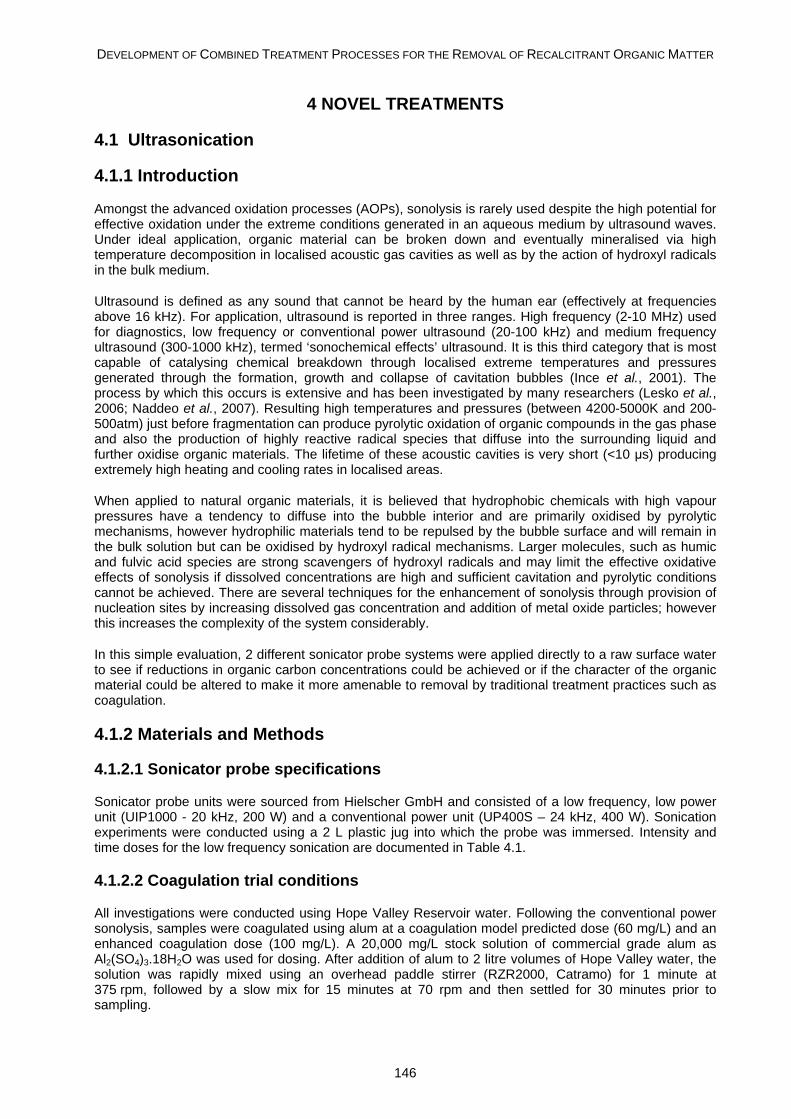
DEVELOPMENT OF COMBINED TREATMENT PROCESSES FOR THE REMOVAL OF RECALCITRANT ORGANIC MATTER
146
4 NOVEL TREATMENTS
4.1 Ultrasonication
4.1.1 Introduction
Amongst the advanced oxidation processes (AOPs), sonolysis is rarely used despite the high potential for effective oxidation under the extreme conditions generated in an aqueous medium by ultrasound waves. Under ideal application, organic material can be broken down and eventually mineralised via high temperature decomposition in localised acoustic gas cavities as well as by the action of hydroxyl radicals in the bulk medium.
Ultrasound is defined as any sound that cannot be heard by the human ear (effectively at frequencies above 16 kHz). For application, ultrasound is reported in three ranges. High frequency (2-10 MHz) used for diagnostics, low frequency or conventional power ultrasound (20-100 kHz) and medium frequency ultrasound (300-1000 kHz), termed ‘sonochemical effects’ ultrasound. It is this third category that is most capable of catalysing chemical breakdown through localised extreme temperatures and pressures generated through the formation, growth and collapse of cavitation bubbles (Ince et al., 2001). The process by which this occurs is extensive and has been investigated by many researchers (Lesko et al., 2006; Naddeo et al., 2007). Resulting high temperatures and pressures (between 4200-5000K and 200-500atm) just before fragmentation can produce pyrolytic oxidation of organic compounds in the gas phase and also the production of highly reactive radical species that diffuse into the surrounding liquid and further oxidise organic materials. The lifetime of these acoustic cavities is very short (<10 μs) producing extremely high heating and cooling rates in localised areas.
When applied to natural organic materials, it is believed that hydrophobic chemicals with high vapour pressures have a tendency to diffuse into the bubble interior and are primarily oxidised by pyrolytic mechanisms, however hydrophilic materials tend to be repulsed by the bubble surface and will remain in the bulk solution but can be oxidised by hydroxyl radical mechanisms. Larger molecules, such as humic and fulvic acid species are strong scavengers of hydroxyl radicals and may limit the effective oxidative effects of sonolysis if dissolved concentrations are high and sufficient cavitation and pyrolytic conditions cannot be achieved. There are several techniques for the enhancement of sonolysis through provision of nucleation sites by increasing dissolved gas concentration and addition of metal oxide particles; however this increases the complexity of the system considerably.
In this simple evaluation, 2 different sonicator probe systems were applied directly to a raw surface water to see if reductions in organic carbon concentrations could be achieved or if the character of the organic material could be altered to make it more amenable to removal by traditional treatment practices such as coagulation.
4.1.2 Materials and Methods
4.1.2.1 Sonicator probe specifications
Sonicator probe units were sourced from Hielscher GmbH and consisted of a low frequency, low power unit (UIP1000 - 20 kHz, 200 W) and a conventional power unit (UP400S – 24 kHz, 400 W). Sonication experiments were conducted using a 2 L plastic jug into which the probe was immersed. Intensity and time doses for the low frequency sonication are documented in Table 4.1.
4.1.2.2 Coagulation trial conditions
All investigations were conducted using Hope Valley Reservoir water. Following the conventional power sonolysis, samples were coagulated using alum at a coagulation model predicted dose (60 mg/L) and an enhanced coagulation dose (100 mg/L). A 20,000 mg/L stock solution of commercial grade alum as Al2(SO4)3.18H2O was used for dosing. After addition of alum to 2 litre volumes of Hope Valley water, the solution was rapidly mixed using an overhead paddle stirrer (RZR2000, Catramo) for 1 minute at 375 rpm, followed by a slow mix for 15 minutes at 70 rpm and then settled for 30 minutes prior to sampling.
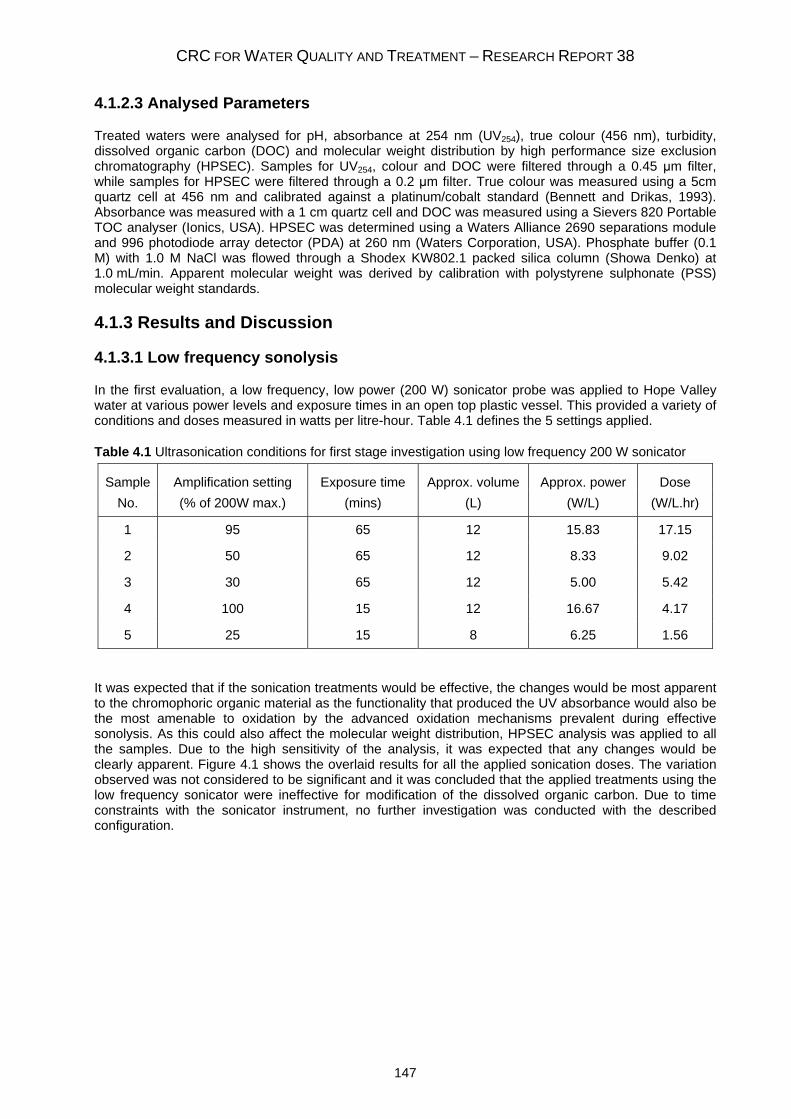
CRC FOR WATER QUALITY AND TREATMENT – RESEARCH REPORT 38
147
4.1.2.3 Analysed Parameters
Treated waters were analysed for pH, absorbance at 254 nm (UV254), true colour (456 nm), turbidity, dissolved organic carbon (DOC) and molecular weight distribution by high performance size exclusion chromatography (HPSEC). Samples for UV254, colour and DOC were filtered through a 0.45 μm filter, while samples for HPSEC were filtered through a 0.2 μm filter. True colour was measured using a 5cm quartz cell at 456 nm and calibrated against a platinum/cobalt standard (Bennett and Drikas, 1993). Absorbance was measured with a 1 cm quartz cell and DOC was measured using a Sievers 820 Portable TOC analyser (Ionics, USA). HPSEC was determined using a Waters Alliance 2690 separations module and 996 photodiode array detector (PDA) at 260 nm (Waters Corporation, USA). Phosphate buffer (0.1 M) with 1.0 M NaCl was flowed through a Shodex KW802.1 packed silica column (Showa Denko) at 1.0 mL/min. Apparent molecular weight was derived by calibration with polystyrene sulphonate (PSS) molecular weight standards.
4.1.3 Results and Discussion
4.1.3.1 Low frequency sonolysis
In the first evaluation, a low frequency, low power (200 W) sonicator probe was applied to Hope Valley water at various power levels and exposure times in an open top plastic vessel. This provided a variety of conditions and doses measured in watts per litre-hour. Table 4.1 defines the 5 settings applied.
Table 4.1 Ultrasonication conditions for first stage investigation using low frequency 200 W sonicator
Sample Amplification setting Exposure time Approx. volume Approx. power Dose No. (% of 200W max.) (mins) (L) (W/L) (W/L.hr)
1 95 65 12 15.83 17.15
2 50 65 12 8.33 9.02
3 30 65 12 5.00 5.42
4 100 15 12 16.67 4.17
5 25 15 8 6.25 1.56
It was expected that if the sonication treatments would be effective, the changes would be most apparent to the chromophoric organic material as the functionality that produced the UV absorbance would also be the most amenable to oxidation by the advanced oxidation mechanisms prevalent during effective sonolysis. As this could also affect the molecular weight distribution, HPSEC analysis was applied to all the samples. Due to the high sensitivity of the analysis, it was expected that any changes would be clearly apparent. Figure 4.1 shows the overlaid results for all the applied sonication doses. The variation observed was not considered to be significant and it was concluded that the applied treatments using the low frequency sonicator were ineffective for modification of the dissolved organic carbon. Due to time constraints with the sonicator instrument, no further investigation was conducted with the described configuration.
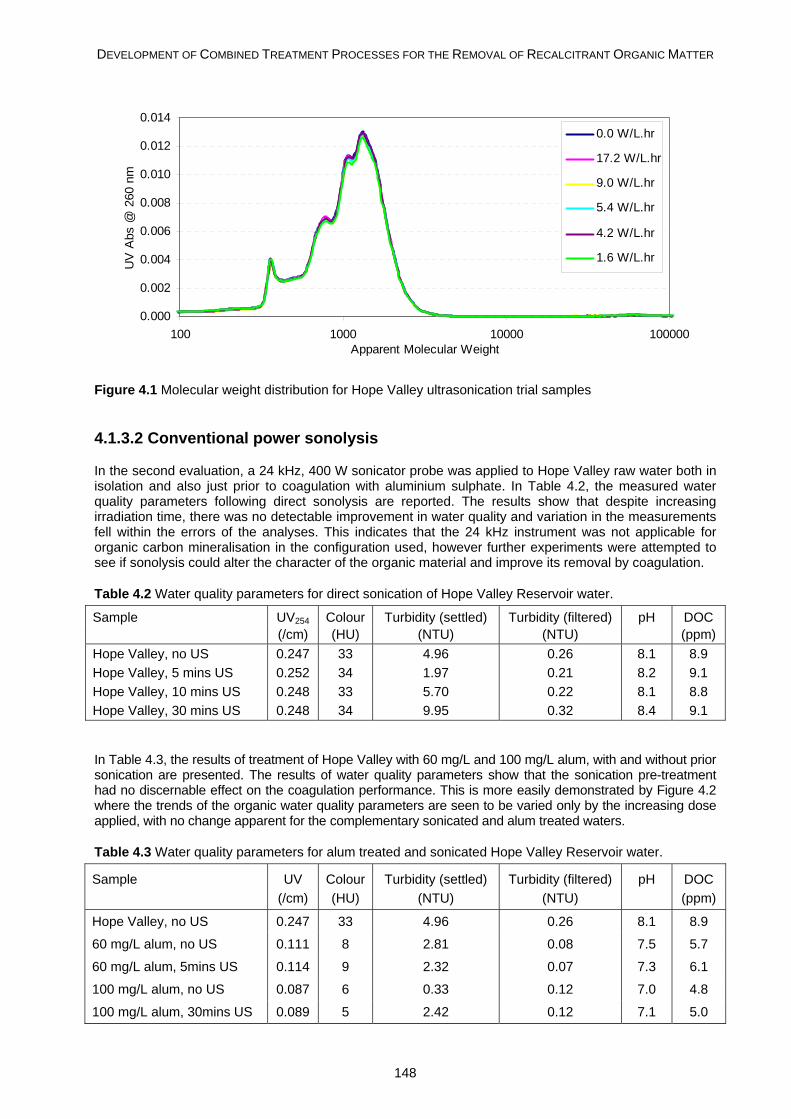
DEVELOPMENT OF COMBINED TREATMENT PROCESSES FOR THE REMOVAL OF RECALCITRANT ORGANIC MATTER
148
0.000
0.002
0.004
0.006
0.008
0.010
0.012
0.014
100 1000 10000 100000Apparent Molecular Weight
UV
Abs
@ 2
60 n
m0.0 W/L.hr
17.2 W/L.hr
9.0 W/L.hr
5.4 W/L.hr
4.2 W/L.hr
1.6 W/L.hr
Figure 4.1 Molecular weight distribution for Hope Valley ultrasonication trial samples
4.1.3.2 Conventional power sonolysis
In the second evaluation, a 24 kHz, 400 W sonicator probe was applied to Hope Valley raw water both in isolation and also just prior to coagulation with aluminium sulphate. In Table 4.2, the measured water quality parameters following direct sonolysis are reported. The results show that despite increasing irradiation time, there was no detectable improvement in water quality and variation in the measurements fell within the errors of the analyses. This indicates that the 24 kHz instrument was not applicable for organic carbon mineralisation in the configuration used, however further experiments were attempted to see if sonolysis could alter the character of the organic material and improve its removal by coagulation.
Table 4.2 Water quality parameters for direct sonication of Hope Valley Reservoir water.
Sample UV254 Colour Turbidity (settled) Turbidity (filtered) pH DOC (/cm) (HU) (NTU) (NTU) (ppm) Hope Valley, no US 0.247 33 4.96 0.26 8.1 8.9 Hope Valley, 5 mins US 0.252 34 1.97 0.21 8.2 9.1 Hope Valley, 10 mins US 0.248 33 5.70 0.22 8.1 8.8 Hope Valley, 30 mins US 0.248 34 9.95 0.32 8.4 9.1
In Table 4.3, the results of treatment of Hope Valley with 60 mg/L and 100 mg/L alum, with and without prior sonication are presented. The results of water quality parameters show that the sonication pre-treatment had no discernable effect on the coagulation performance. This is more easily demonstrated by Figure 4.2 where the trends of the organic water quality parameters are seen to be varied only by the increasing dose applied, with no change apparent for the complementary sonicated and alum treated waters.
Table 4.3 Water quality parameters for alum treated and sonicated Hope Valley Reservoir water.
Sample UV Colour Turbidity (settled) Turbidity (filtered) pH DOC (/cm) (HU) (NTU) (NTU) (ppm)
Hope Valley, no US 0.247 33 4.96 0.26 8.1 8.9
60 mg/L alum, no US 0.111 8 2.81 0.08 7.5 5.7
60 mg/L alum, 5mins US 0.114 9 2.32 0.07 7.3 6.1
100 mg/L alum, no US 0.087 6 0.33 0.12 7.0 4.8
100 mg/L alum, 30mins US 0.089 5 2.42 0.12 7.1 5.0
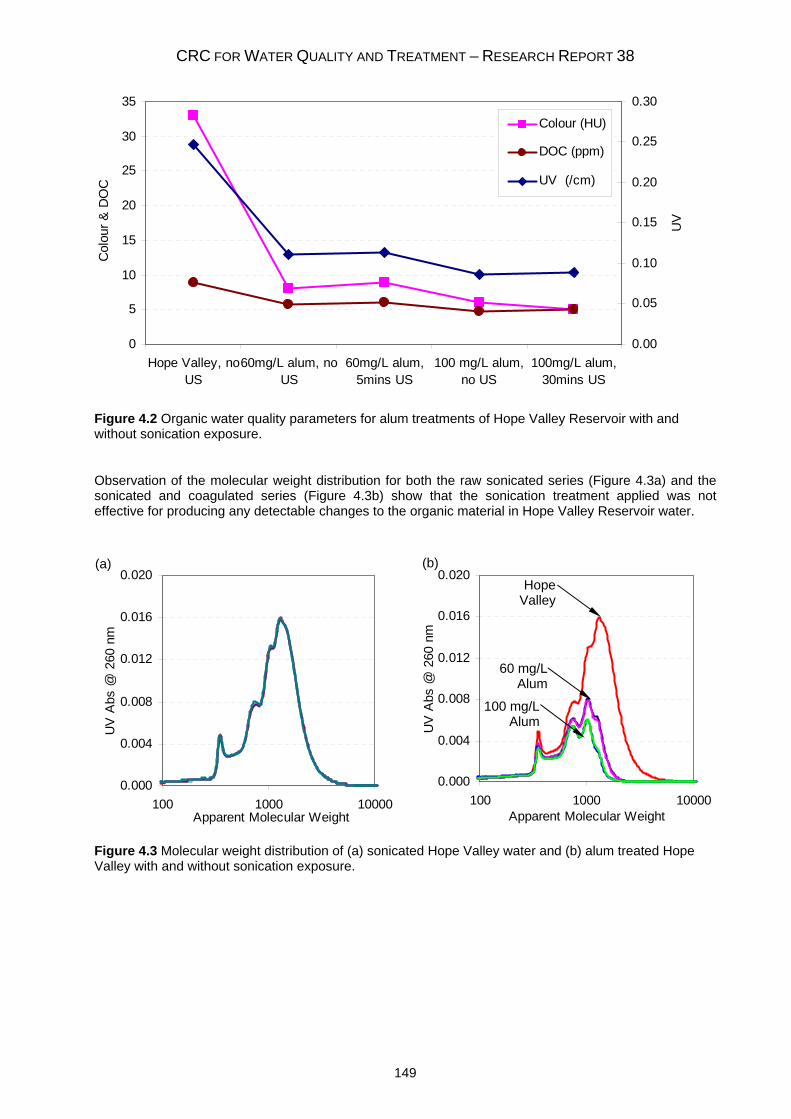
CRC FOR WATER QUALITY AND TREATMENT – RESEARCH REPORT 38
149
0
5
10
15
20
25
30
35
Hope Valley, noUS
60mg/L alum, noUS
60mg/L alum,5mins US
100 mg/L alum,no US
100mg/L alum,30mins US
Col
our &
DO
C
0.00
0.05
0.10
0.15
0.20
0.25
0.30
UV
Colour (HU)
DOC (ppm)
UV (/cm)
Figure 4.2 Organic water quality parameters for alum treatments of Hope Valley Reservoir with and without sonication exposure.
Observation of the molecular weight distribution for both the raw sonicated series (Figure 4.3a) and the sonicated and coagulated series (Figure 4.3b) show that the sonication treatment applied was not effective for producing any detectable changes to the organic material in Hope Valley Reservoir water.
0.000
0.004
0.008
0.012
0.016
0.020
100 1000 10000Apparent Molecular Weight
UV
Abs
@ 2
60 n
m
0.000
0.004
0.008
0.012
0.016
0.020
100 1000 10000Apparent Molecular Weight
UV
Abs
@ 2
60 n
m
Figure 4.3 Molecular weight distribution of (a) sonicated Hope Valley water and (b) alum treated Hope Valley with and without sonication exposure.
100 mg/L Alum
60 mg/L Alum
Hope Valley
(a) (b)
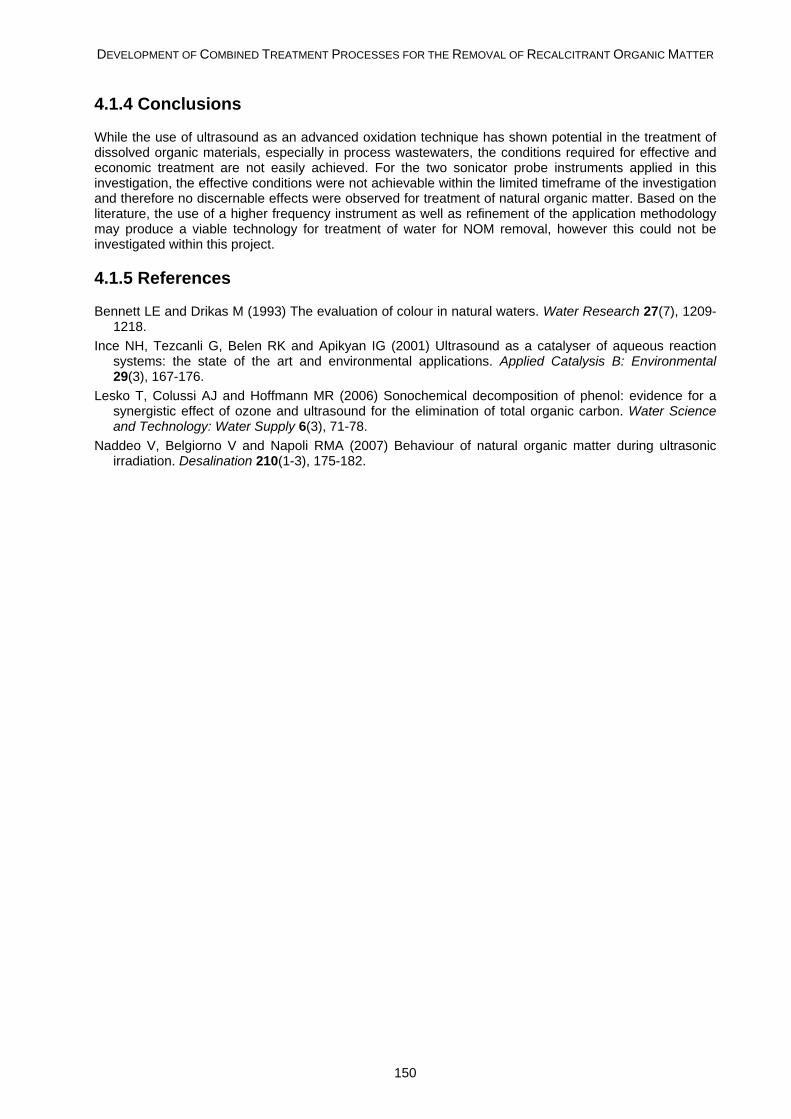
DEVELOPMENT OF COMBINED TREATMENT PROCESSES FOR THE REMOVAL OF RECALCITRANT ORGANIC MATTER
150
4.1.4 Conclusions
While the use of ultrasound as an advanced oxidation technique has shown potential in the treatment of dissolved organic materials, especially in process wastewaters, the conditions required for effective and economic treatment are not easily achieved. For the two sonicator probe instruments applied in this investigation, the effective conditions were not achievable within the limited timeframe of the investigation and therefore no discernable effects were observed for treatment of natural organic matter. Based on the literature, the use of a higher frequency instrument as well as refinement of the application methodology may produce a viable technology for treatment of water for NOM removal, however this could not be investigated within this project.
4.1.5 References
Bennett LE and Drikas M (1993) The evaluation of colour in natural waters. Water Research 27(7), 1209-1218.
Ince NH, Tezcanli G, Belen RK and Apikyan IG (2001) Ultrasound as a catalyser of aqueous reaction systems: the state of the art and environmental applications. Applied Catalysis B: Environmental 29(3), 167-176.
Lesko T, Colussi AJ and Hoffmann MR (2006) Sonochemical decomposition of phenol: evidence for a synergistic effect of ozone and ultrasound for the elimination of total organic carbon. Water Science and Technology: Water Supply 6(3), 71-78.
Naddeo V, Belgiorno V and Napoli RMA (2007) Behaviour of natural organic matter during ultrasonic irradiation. Desalination 210(1-3), 175-182.
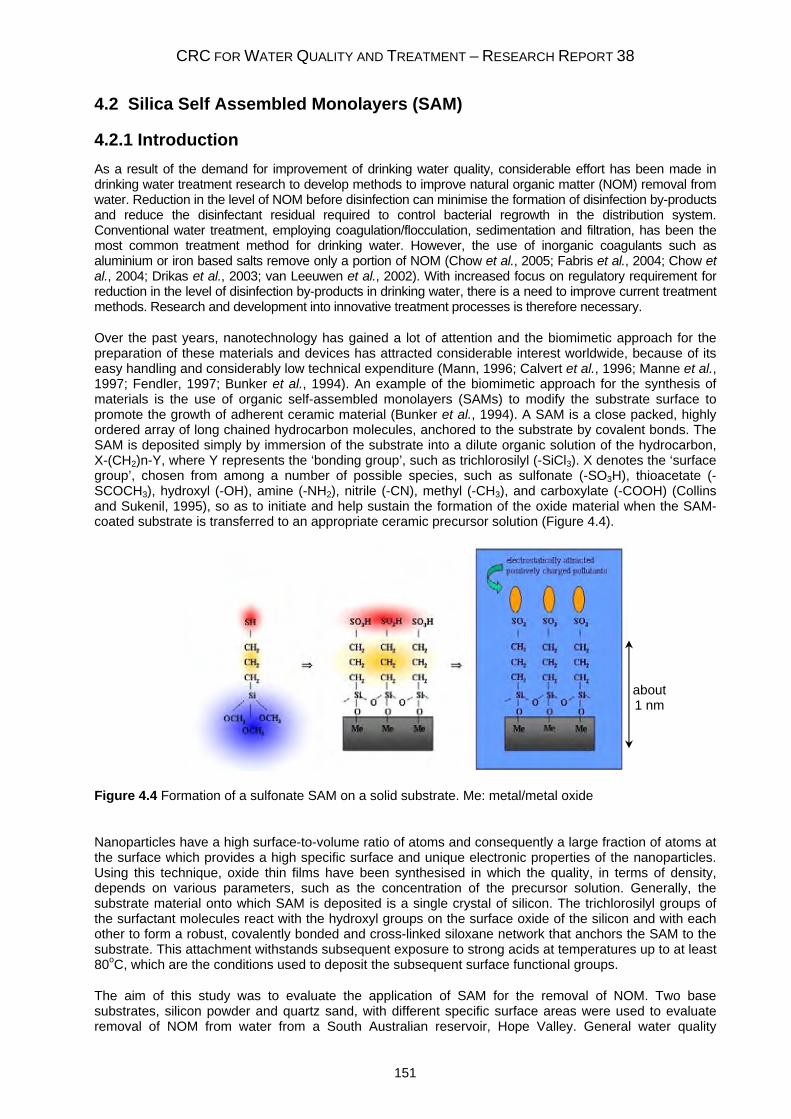
CRC FOR WATER QUALITY AND TREATMENT – RESEARCH REPORT 38
151
4.2 Silica Self Assembled Monolayers (SAM)
4.2.1 Introduction As a result of the demand for improvement of drinking water quality, considerable effort has been made in drinking water treatment research to develop methods to improve natural organic matter (NOM) removal from water. Reduction in the level of NOM before disinfection can minimise the formation of disinfection by-products and reduce the disinfectant residual required to control bacterial regrowth in the distribution system. Conventional water treatment, employing coagulation/flocculation, sedimentation and filtration, has been the most common treatment method for drinking water. However, the use of inorganic coagulants such as aluminium or iron based salts remove only a portion of NOM (Chow et al., 2005; Fabris et al., 2004; Chow et al., 2004; Drikas et al., 2003; van Leeuwen et al., 2002). With increased focus on regulatory requirement for reduction in the level of disinfection by-products in drinking water, there is a need to improve current treatment methods. Research and development into innovative treatment processes is therefore necessary.
Over the past years, nanotechnology has gained a lot of attention and the biomimetic approach for the preparation of these materials and devices has attracted considerable interest worldwide, because of its easy handling and considerably low technical expenditure (Mann, 1996; Calvert et al., 1996; Manne et al., 1997; Fendler, 1997; Bunker et al., 1994). An example of the biomimetic approach for the synthesis of materials is the use of organic self-assembled monolayers (SAMs) to modify the substrate surface to promote the growth of adherent ceramic material (Bunker et al., 1994). A SAM is a close packed, highly ordered array of long chained hydrocarbon molecules, anchored to the substrate by covalent bonds. The SAM is deposited simply by immersion of the substrate into a dilute organic solution of the hydrocarbon, X-(CH2)n-Y, where Y represents the ‘bonding group’, such as trichlorosilyl (-SiCl3). X denotes the ‘surface group’, chosen from among a number of possible species, such as sulfonate (-SO3H), thioacetate (-SCOCH3), hydroxyl (-OH), amine (-NH2), nitrile (-CN), methyl (-CH3), and carboxylate (-COOH) (Collins and Sukenil, 1995), so as to initiate and help sustain the formation of the oxide material when the SAM-coated substrate is transferred to an appropriate ceramic precursor solution (Figure 4.4).
Figure 4.4 Formation of a sulfonate SAM on a solid substrate. Me: metal/metal oxide
Nanoparticles have a high surface-to-volume ratio of atoms and consequently a large fraction of atoms at the surface which provides a high specific surface and unique electronic properties of the nanoparticles. Using this technique, oxide thin films have been synthesised in which the quality, in terms of density, depends on various parameters, such as the concentration of the precursor solution. Generally, the substrate material onto which SAM is deposited is a single crystal of silicon. The trichlorosilyl groups of the surfactant molecules react with the hydroxyl groups on the surface oxide of the silicon and with each other to form a robust, covalently bonded and cross-linked siloxane network that anchors the SAM to the substrate. This attachment withstands subsequent exposure to strong acids at temperatures up to at least 80oC, which are the conditions used to deposit the subsequent surface functional groups.
The aim of this study was to evaluate the application of SAM for the removal of NOM. Two base substrates, silicon powder and quartz sand, with different specific surface areas were used to evaluate removal of NOM from water from a South Australian reservoir, Hope Valley. General water quality
about1 nm
DEVELOPMENT OF COMBINED TREATMENT PROCESSES FOR THE REMOVAL OF RECALCITRANT ORGANIC MATTER
152
parameters, colour, UV254 and dissolved organic carbon (DOC) as well as a more advanced organic characterisation method, high performance size exclusion chromatography (HPSEC), were applied to study the organic matter before and after treatment for the identification of the removable and non-removable (recalcitrant) components of the NOM.
4.2.2 Materials and Methods
4.2.2.1 Preparation and characterisation of SAM coated silica powder and quartz sand
The preparation of 20 g of silica powder (Amorphous silicon dioxide, SiO2, analytical reagent, Malinckrodt Chemical Works, grain size range: 3 – 90 μm with d10 = 7.6 μm, d50 = 24.3 μm, d90 = 49.1 μm, surface ratio = 0.23 m2/g) mixed with 200 mL piranha solution (70% H2SO4, 30% H2O2 aq. (30 Vol. % in H2O)). The piranha solution oxidises contaminants and produces free –OH groups on the surface of the powder. After 5 minutes contact, the suspension was washed with Milli-Q water. Then the powder was filtered with a glass frit filter (pore size 4). Washing was stopped when the pH of the wash water reached the same pH as the applied Milli-Q water. The powder was then dried at 65°C and suspended in 196 mL of anhydrous toluene and 4 mL of surfactant (3-aminopropyltrimethoxysilane) under nitrogen at room temperature. Then the powder was further washed with ethanol (EP grade) for 5 minutes to remove toluene then followed by Milli-Q water wash to remove the ethanol and dried at 65°C. The SAM coated silica powder is called NH2-SAM powder hereafter. The same preparation procedure was used to produce SAM coated quartz sand (crystalline SiO2, grain size range: 100 – 450 μm with d10 = 121.9 μm, d50 = 239.3 μm, d90 = 330.5 μm, surface ratio = 0.02 m2/g). The SAM coated quartz sand is called NH2-SAM sand hereafter. Physical characterisation of the grain size (both NH2-SAM powder and NH2-SAM sand) was determined using a particle sizer (Mastersizer, Malvern, UK). 4.2.2.2 Source Water for Water Treatment Experiment
The water used for this experiment was collected from the Hope Valley Reservoir (approximately 10 km north-east of Adelaide, South Australia) which supplies water to the Hope Valley Treatment plant. The water is received from the Torrens River system via the Millbrook and Kangaroo Creek Reservoirs which is primarily supplied by the River Murray. The water in this reservoir generally has low colour, medium DOC concentration and high turbidity. The plant employs conventional treatment processes (coagulation/flocculation, sedimentation and filtration processes) and uses alum (Al2(SO4)3·18H2O) and a cationic polymer for coagulation.
4.2.2.3 Analytical Methods
General Water Quality Parameters
DOC concentrations of filtered (0.45 µm) samples were determined using a total organic carbon analyser (Model 820, Sievers Instruments Inc., USA,). UV254 absorbance was measured at 254 nm using a UV/VIS spectrophotometer (Model 918, GBC, Australia) with a 1 cm quartz cell. Colour was determined as described by Bennett and Drikas (1993) and measured using a UV/VIS spectrophotometer (Model 918, GBC, Australia) with a 5 cm cell.
Apparent Molecular Weight Determination - High Performance Size Exclusion Chromatography
The samples were first filtered through a 0.2 µm membrane filter. HPSEC was performed using a Waters Alliance 2690 separations module and 996 photodiode array detector (PDA) at 260 nm (Waters Corporation, USA). Phosphate buffer (0.1 M) with 1.0 M NaCl was pumped through a Shodex KW802.5 packed silica column (Showa Denko, Japan) at 1.0 mL/min. Apparent molecular weight was derived by calibration with polystyrene sulphonate (PSS) molecular weight standards of 35, 18, 8 and 4.6 kDa (Polysciences, USA).
4.2.2.4 Treatment Experiment
The produced NH2-SAM powder and NH2-SAM sand were first washed with Milli-Q water and pH was measured to confirm that a good NH2-SAM surface was formed without leaching of contaminants (no pH change) prior to use in the treatment experiment.
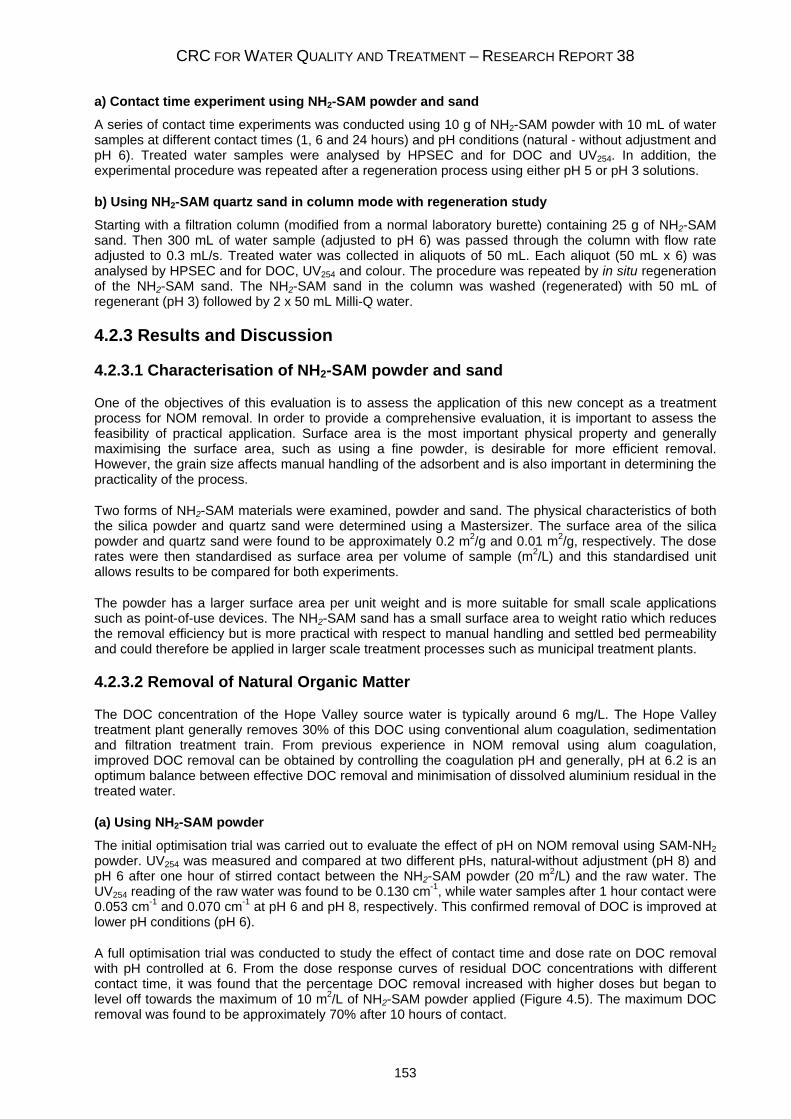
CRC FOR WATER QUALITY AND TREATMENT – RESEARCH REPORT 38
153
a) Contact time experiment using NH2-SAM powder and sand
A series of contact time experiments was conducted using 10 g of NH2-SAM powder with 10 mL of water samples at different contact times (1, 6 and 24 hours) and pH conditions (natural - without adjustment and pH 6). Treated water samples were analysed by HPSEC and for DOC and UV254. In addition, the experimental procedure was repeated after a regeneration process using either pH 5 or pH 3 solutions.
b) Using NH2-SAM quartz sand in column mode with regeneration study
Starting with a filtration column (modified from a normal laboratory burette) containing 25 g of NH2-SAM sand. Then 300 mL of water sample (adjusted to pH 6) was passed through the column with flow rate adjusted to 0.3 mL/s. Treated water was collected in aliquots of 50 mL. Each aliquot (50 mL x 6) was analysed by HPSEC and for DOC, UV254 and colour. The procedure was repeated by in situ regeneration of the NH2-SAM sand. The NH2-SAM sand in the column was washed (regenerated) with 50 mL of regenerant (pH 3) followed by 2 x 50 mL Milli-Q water.
4.2.3 Results and Discussion
4.2.3.1 Characterisation of NH2-SAM powder and sand
One of the objectives of this evaluation is to assess the application of this new concept as a treatment process for NOM removal. In order to provide a comprehensive evaluation, it is important to assess the feasibility of practical application. Surface area is the most important physical property and generally maximising the surface area, such as using a fine powder, is desirable for more efficient removal. However, the grain size affects manual handling of the adsorbent and is also important in determining the practicality of the process.
Two forms of NH2-SAM materials were examined, powder and sand. The physical characteristics of both the silica powder and quartz sand were determined using a Mastersizer. The surface area of the silica powder and quartz sand were found to be approximately 0.2 m2/g and 0.01 m2/g, respectively. The dose rates were then standardised as surface area per volume of sample (m2/L) and this standardised unit allows results to be compared for both experiments.
The powder has a larger surface area per unit weight and is more suitable for small scale applications such as point-of-use devices. The NH2-SAM sand has a small surface area to weight ratio which reduces the removal efficiency but is more practical with respect to manual handling and settled bed permeability and could therefore be applied in larger scale treatment processes such as municipal treatment plants.
4.2.3.2 Removal of Natural Organic Matter
The DOC concentration of the Hope Valley source water is typically around 6 mg/L. The Hope Valley treatment plant generally removes 30% of this DOC using conventional alum coagulation, sedimentation and filtration treatment train. From previous experience in NOM removal using alum coagulation, improved DOC removal can be obtained by controlling the coagulation pH and generally, pH at 6.2 is an optimum balance between effective DOC removal and minimisation of dissolved aluminium residual in the treated water.
(a) Using NH2-SAM powder
The initial optimisation trial was carried out to evaluate the effect of pH on NOM removal using SAM-NH2 powder. UV254 was measured and compared at two different pHs, natural-without adjustment (pH 8) and pH 6 after one hour of stirred contact between the NH2-SAM powder (20 m2/L) and the raw water. The UV254 reading of the raw water was found to be 0.130 cm-1, while water samples after 1 hour contact were 0.053 cm-1 and 0.070 cm-1 at pH 6 and pH 8, respectively. This confirmed removal of DOC is improved at lower pH conditions (pH 6).
A full optimisation trial was conducted to study the effect of contact time and dose rate on DOC removal with pH controlled at 6. From the dose response curves of residual DOC concentrations with different contact time, it was found that the percentage DOC removal increased with higher doses but began to level off towards the maximum of 10 m2/L of NH2-SAM powder applied (Figure 4.5). The maximum DOC removal was found to be approximately 70% after 10 hours of contact.
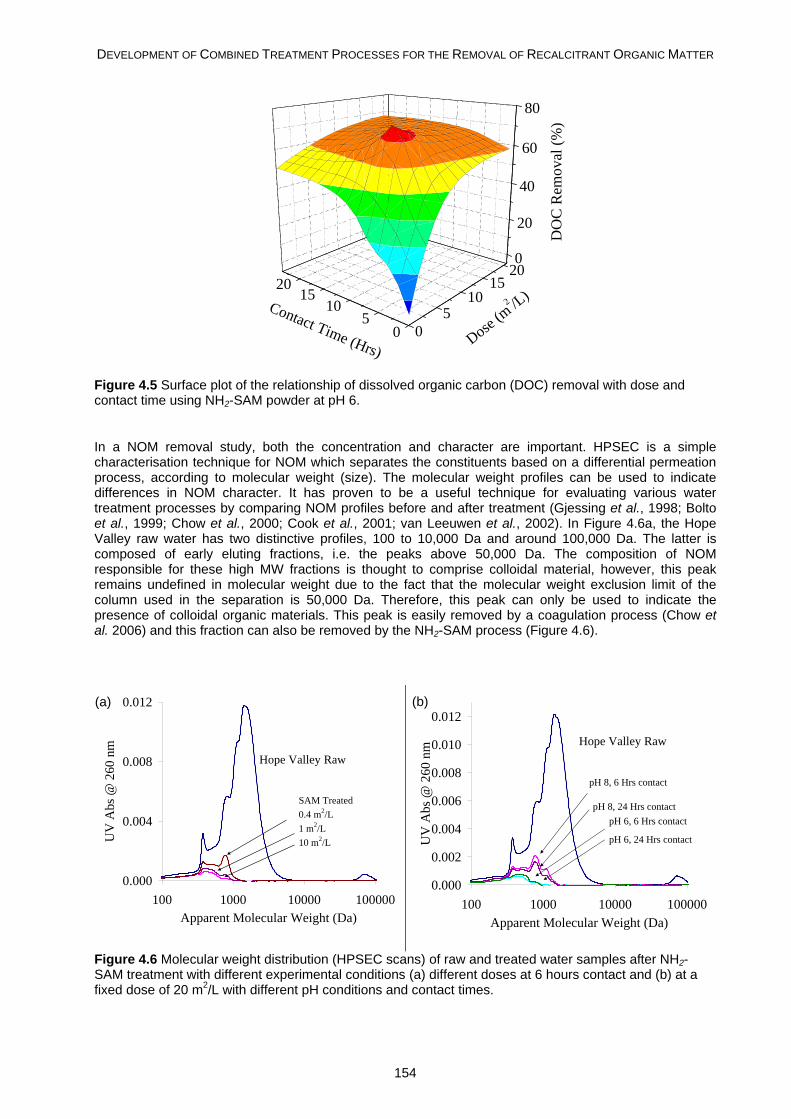
DEVELOPMENT OF COMBINED TREATMENT PROCESSES FOR THE REMOVAL OF RECALCITRANT ORGANIC MATTER
154
05
1015
20
05
1015
20
0
20
40
60
80
Contact Time (Hrs)
DO
C R
emov
al (%
)
Dose (m
2 /L)
Figure 4.5 Surface plot of the relationship of dissolved organic carbon (DOC) removal with dose and contact time using NH2-SAM powder at pH 6.
In a NOM removal study, both the concentration and character are important. HPSEC is a simple characterisation technique for NOM which separates the constituents based on a differential permeation process, according to molecular weight (size). The molecular weight profiles can be used to indicate differences in NOM character. It has proven to be a useful technique for evaluating various water treatment processes by comparing NOM profiles before and after treatment (Gjessing et al., 1998; Bolto et al., 1999; Chow et al., 2000; Cook et al., 2001; van Leeuwen et al., 2002). In Figure 4.6a, the Hope Valley raw water has two distinctive profiles, 100 to 10,000 Da and around 100,000 Da. The latter is composed of early eluting fractions, i.e. the peaks above 50,000 Da. The composition of NOM responsible for these high MW fractions is thought to comprise colloidal material, however, this peak remains undefined in molecular weight due to the fact that the molecular weight exclusion limit of the column used in the separation is 50,000 Da. Therefore, this peak can only be used to indicate the presence of colloidal organic materials. This peak is easily removed by a coagulation process (Chow et al. 2006) and this fraction can also be removed by the NH2-SAM process (Figure 4.6).
0.000
0.004
0.008
0.012
100 1000 10000 100000Apparent Molecular Weight (Da)
UV
Abs
@ 2
60 n
m
Hope Valley Raw
SAM Treated0.4 m2/L1 m2/L10 m2/L
0.000
0.002
0.004
0.006
0.008
0.010
0.012
100 1000 10000 100000Apparent Molecular Weight (Da)
UV
Abs
@ 2
60 n
m Hope Valley Raw
pH 8, 6 Hrs contact
pH 8, 24 Hrs contactpH 6, 6 Hrs contact
pH 6, 24 Hrs contact
Figure 4.6 Molecular weight distribution (HPSEC scans) of raw and treated water samples after NH2-SAM treatment with different experimental conditions (a) different doses at 6 hours contact and (b) at a fixed dose of 20 m2/L with different pH conditions and contact times.
(a) (b)
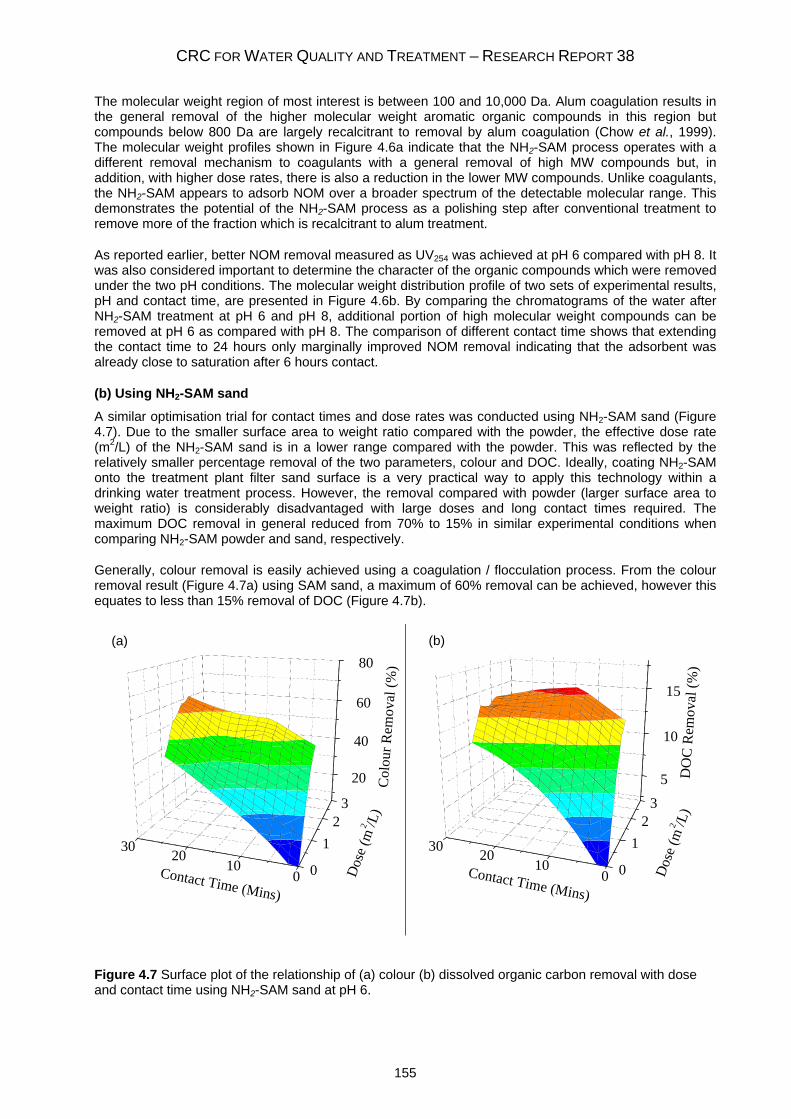
CRC FOR WATER QUALITY AND TREATMENT – RESEARCH REPORT 38
155
The molecular weight region of most interest is between 100 and 10,000 Da. Alum coagulation results in the general removal of the higher molecular weight aromatic organic compounds in this region but compounds below 800 Da are largely recalcitrant to removal by alum coagulation (Chow et al., 1999). The molecular weight profiles shown in Figure 4.6a indicate that the NH2-SAM process operates with a different removal mechanism to coagulants with a general removal of high MW compounds but, in addition, with higher dose rates, there is also a reduction in the lower MW compounds. Unlike coagulants, the NH2-SAM appears to adsorb NOM over a broader spectrum of the detectable molecular range. This demonstrates the potential of the NH2-SAM process as a polishing step after conventional treatment to remove more of the fraction which is recalcitrant to alum treatment.
As reported earlier, better NOM removal measured as UV254 was achieved at pH 6 compared with pH 8. It was also considered important to determine the character of the organic compounds which were removed under the two pH conditions. The molecular weight distribution profile of two sets of experimental results, pH and contact time, are presented in Figure 4.6b. By comparing the chromatograms of the water after NH2-SAM treatment at pH 6 and pH 8, additional portion of high molecular weight compounds can be removed at pH 6 as compared with pH 8. The comparison of different contact time shows that extending the contact time to 24 hours only marginally improved NOM removal indicating that the adsorbent was already close to saturation after 6 hours contact.
(b) Using NH2-SAM sand
A similar optimisation trial for contact times and dose rates was conducted using NH2-SAM sand (Figure 4.7). Due to the smaller surface area to weight ratio compared with the powder, the effective dose rate (m2/L) of the NH2-SAM sand is in a lower range compared with the powder. This was reflected by the relatively smaller percentage removal of the two parameters, colour and DOC. Ideally, coating NH2-SAM onto the treatment plant filter sand surface is a very practical way to apply this technology within a drinking water treatment process. However, the removal compared with powder (larger surface area to weight ratio) is considerably disadvantaged with large doses and long contact times required. The maximum DOC removal in general reduced from 70% to 15% in similar experimental conditions when comparing NH2-SAM powder and sand, respectively.
Generally, colour removal is easily achieved using a coagulation / flocculation process. From the colour removal result (Figure 4.7a) using SAM sand, a maximum of 60% removal can be achieved, however this equates to less than 15% removal of DOC (Figure 4.7b).
0
12
3
010
2030
20
40
60
80
Contact Time (Mins)
Col
our R
emov
al (%
)
Dos
e (m
2 /L)
0
12
3
010
2030
5
10
15
Contact Time (Mins)
DO
C R
emov
al (%
)
Dos
e (m
2 /L)
Figure 4.7 Surface plot of the relationship of (a) colour (b) dissolved organic carbon removal with dose and contact time using NH2-SAM sand at pH 6.
(a) (b)
DEVELOPMENT OF COMBINED TREATMENT PROCESSES FOR THE REMOVAL OF RECALCITRANT ORGANIC MATTER
156
(c) Regeneration of NH2-SAM powder
One of the critical considerations of any new potential treatment process is the cost of implementation and operation. While the production cost of the NH2-SAM materials can be greatly reduced by mass production, it is still more desirable and practical to regenerate the NH2-SAM materials. In this trial, a regeneration process was performed using acidic solutions at pH 5 and pH 3. These were used to regenerate NH2-SAM powder that was used in the previous experiment. To evaluate the effectiveness of the regeneration, the powder was subjected to three sequential adsorption and regeneration cycles and the removal ability of UV254, colour and DOC was compared. A summary of the treated water quality and percentage removal of UV254, colour and DOC for Hope Valley raw water is presented in Table 4.4.
Table 4.4 Treated water quality and percentage removal of UV254, colour and DOC for Hope Valley raw water after NH2-SAM powder treatment (1 hour contact time and pH 6) and regeneration in 3 cycles UV254 (/cm) % removal Colour (HU) % removal DOC (mg/L) % removalHope Valley raw 0.141 - 17 - 7.1 - pH5 regeneration 1st run 0.105 26 10 41 7.2 0 2nd run 0.126 11 13 24 7.0 2 3rd run 0.134 5 15 12 7.1 1 pH3 regeneration 1st run 0.061 57 2 88 6.5 8 2nd run 0.070 50 3 82 5.7 19 3rd run 0.091 36 7 59 5.8 19
The results shown in Table 4.4 demonstrated that NH2-SAM does recover some adsorption capacity using the acidic conditions described above. By comparing all three water quality parameters, the regeneration conditions are clearly more effective at pH 3. From the percentage removal of each parameter, there is evidence of the degradation of the removal capacity after each regeneration indicating that the adsorption is not entirely reversible using the applied regeneration method. The removal of colour was found to be the best out of the three water quality parameters, whilst the regeneration was clearly less effective for recovery of DOC removal capacity.
4.2.3.3 Treatment experiment using NH2-SAM sand in column mode
Several application aspects, including physical characteristics, removal performance and regeneration, have been discussed in the previous sections. This section will concentrate on the applicability of using NH2-SAM coated sand as a water treatment application. The experiment conducted in column mode with in-situ regeneration is based on the conditions obtained and reported previously. 300 mL of Hope Valley raw water was passed through the column at a set flow rate and treated water samples were collected at the outlet of the column in 50 mL aliquots to evaluate the removal capacity and saturation point.
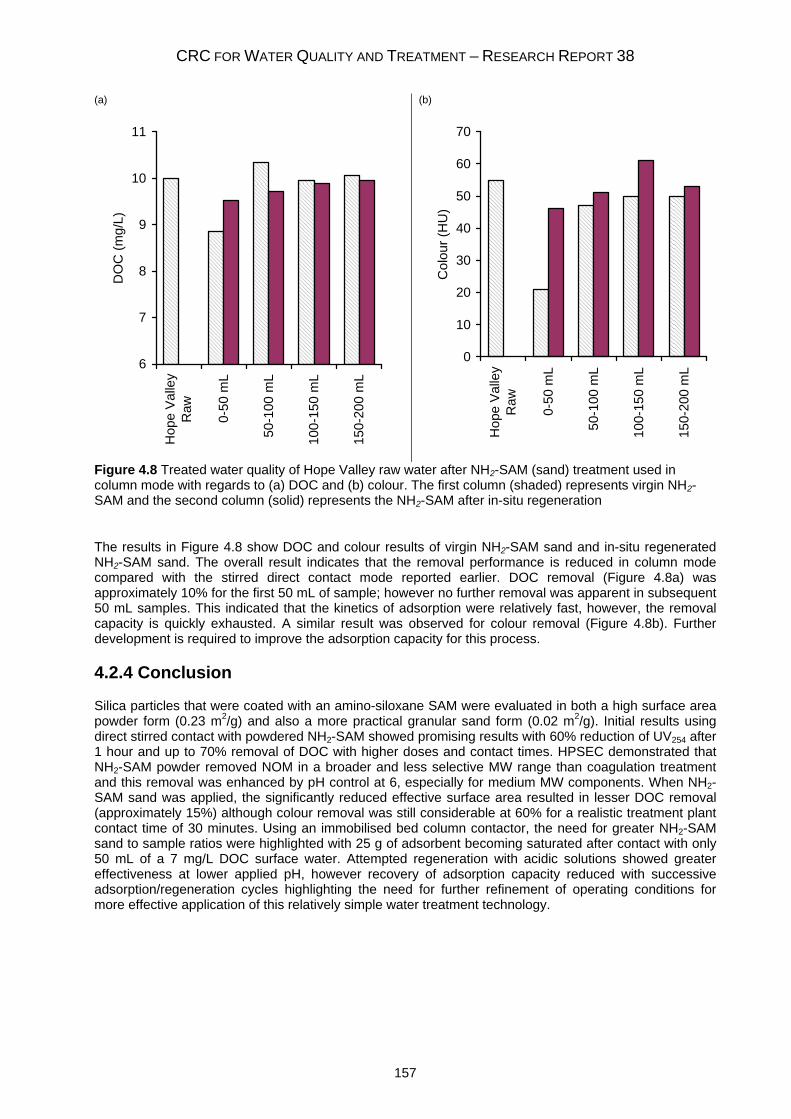
CRC FOR WATER QUALITY AND TREATMENT – RESEARCH REPORT 38
157
(a)
6
7
8
9
10
11
Hop
e Va
lley
Raw
0-50
mL
50-1
00 m
L
100-
150
mL
150-
200
mL
DO
C (m
g/L)
(b)
0
10
20
30
40
50
60
70
Hop
e Va
lley
Raw
0-50
mL
50-1
00 m
L
100-
150
mL
150-
200
mL
Col
our (
HU
)
Figure 4.8 Treated water quality of Hope Valley raw water after NH2-SAM (sand) treatment used in column mode with regards to (a) DOC and (b) colour. The first column (shaded) represents virgin NH2-SAM and the second column (solid) represents the NH2-SAM after in-situ regeneration
The results in Figure 4.8 show DOC and colour results of virgin NH2-SAM sand and in-situ regenerated NH2-SAM sand. The overall result indicates that the removal performance is reduced in column mode compared with the stirred direct contact mode reported earlier. DOC removal (Figure 4.8a) was approximately 10% for the first 50 mL of sample; however no further removal was apparent in subsequent 50 mL samples. This indicated that the kinetics of adsorption were relatively fast, however, the removal capacity is quickly exhausted. A similar result was observed for colour removal (Figure 4.8b). Further development is required to improve the adsorption capacity for this process.
4.2.4 Conclusion
Silica particles that were coated with an amino-siloxane SAM were evaluated in both a high surface area powder form (0.23 m2/g) and also a more practical granular sand form (0.02 m2/g). Initial results using direct stirred contact with powdered NH2-SAM showed promising results with 60% reduction of UV254 after 1 hour and up to 70% removal of DOC with higher doses and contact times. HPSEC demonstrated that NH2-SAM powder removed NOM in a broader and less selective MW range than coagulation treatment and this removal was enhanced by pH control at 6, especially for medium MW components. When NH2-SAM sand was applied, the significantly reduced effective surface area resulted in lesser DOC removal (approximately 15%) although colour removal was still considerable at 60% for a realistic treatment plant contact time of 30 minutes. Using an immobilised bed column contactor, the need for greater NH2-SAM sand to sample ratios were highlighted with 25 g of adsorbent becoming saturated after contact with only 50 mL of a 7 mg/L DOC surface water. Attempted regeneration with acidic solutions showed greater effectiveness at lower applied pH, however recovery of adsorption capacity reduced with successive adsorption/regeneration cycles highlighting the need for further refinement of operating conditions for more effective application of this relatively simple water treatment technology.
DEVELOPMENT OF COMBINED TREATMENT PROCESSES FOR THE REMOVAL OF RECALCITRANT ORGANIC MATTER
158
4.2.5 References
Bennett LE and Drikas M (1993) The evaluation of colour in natural waters. Water Research 27(7), 1209-1218.
Bratskaya S, Schwarz S and Chervonetsky D (2004) Comparative study of humic acids flocculation with chitosan hydrochloride and chitosan glutamate. Water Research 38(12), 2955-2961.
Bunker BC, Rieke PC, Tarasevich BJ, Campbell AA, Fryxell GE, Graff GL, Song L, Liu J, Virden JW and McVay GL (1994) Ceramic thin-film formation on functionalized interfaces through biomimetic processing. Science 264(5155), 48-55.
Calvert P and Rieke P (1996) Biomimetic mineralization in and on polymers. Chemistry of Materials 8(8), 1715-1727.
Chow C, Fabris R, Wilkinson K, Fitzgerald F and Drikas M (2006) Characterising NOM to assess treatability. AWA Water Journal 33(2) 74-85.
Chow CWK, Fabris R and Drikas M (2004) A new rapid fractionation technique to characterise natural organic matter for the optimisation of water treatment processes. Journal of Water Supply: Research and Technology – AQUA 53(2), 85-92.
Chow CWK, Fabris R, Drikas M and Holmes M (2005) A case study of treatment performance and organic character. Journal of Water Supply: Research and Technology – AQUA 54(6), 385-395.
Collins RJ and Sukenik CN (1995) Sulfonate-functionalized, siloxane-anchored, self-assembled monolayers. Langmuir 11, 2322-2324.
Drikas M, Chow CWK and Cook D (2003) The impact of recalcitrant organic character on disinfection stability, trihalomethane formation and bacterial regrowth - an evaluation of magnetic ion exchange resin (MIEX®) and alum coagulation. Journal of Water Supply: Research and Technology – AQUA 52(7), 475-487.
Fabris R, Chow C and Drikas M (2004) Practical application of a combined treatment process for removal of recalcitrant NOM – Alum and PAC. Water Science & Technology: Water Supply 4(4), 89–94.
Fendler JH (1997) Biomineralization inspired preparation of nanoparticles and nanoparticulate films. Current Opinion in Solid State & Materials Science 2(3), 365-369.
Mann S (1996) (Ed.), Biomimetic Materials Chemistry, VCH Publishers, New York. Manne S and Aksay IA (1997) Thin films and nanolaminates incorporating organic/inorganic interfaces.
Current Opinion in Solid State & Materials Science 2, 358-364. van Leeuwen J, Chow C, Fabris R, Withers N, Page D and Drikas M (2002) Application of a fractionation
technique for the better understanding of the removal of NOM by alum coagulation. Water Science & Technology: Water Supply 2(5-6), 427–433.
CRC FOR WATER QUALITY AND TREATMENT – RESEARCH REPORT 38
159
4.3 Electrocoagulation
4.3.1 Introduction
Natural organic matter (NOM) is referred to as a complex matrix of organic material which is present in all natural waters (Owen et al., 1995). Problems associated with NOM have been acknowledged for many years. Before the 1970s, researchers only focused on the nature of NOM and its removal for the desire to remove colour from drinking water (Jacangelo et al., 1995). Since then, many researches have shown that NOM has influences on many aspects of water treatment, including performance of unit processes (e.g. coagulation), application of disinfectants, and biological stability. This has led to several problems associated with water quality being identified, such as disinfection by-product formation, biological regrowth in distribution systems, colour, tastes and odours (Owen et al., 1995).
The conventional water treatment process has been most commonly used for drinking water treatment, which has been successful in removing colour and turbidity (Chow et al., 2001). However, with the requirement for higher quality water, the desire for better treatment techniques, with improved NOM removal, is increasing. There have been investigations on several alternatives to the conventional treatment process, such as enhanced coagulation, magnetic ion exchange resin (MIEX®), UV treatment and bacterial degradation, which have shown some improvement in NOM removal (Chow et al., 2001). Research to find better treatment methods is a continuing process (Chow et al., 2001).
This study was designed to evaluate the performance of yet another technique - electrocoagulation. The concept of electrocoagulation (EC) was thought to have been first proposed in 1889 in England. At that time, this method only received little attention due to expectations of high initial costs compared to chemical dosing, although its applications in drinking water treatment had shown some promising results. Recently, there has been renewed interest in the use of electrocoagulation for treatment of wastewater and drinking water owing to issues of water contamination and restrictions on disposal of effluent wastewater (Matteson et al., 1995; Mollah et al., 2001). Electrocoagulation, using aluminium and iron electrodes, has been successfully applied to treat urban wastewater, industrial wastewater and drinking water (Matteson et al., 1995; Chen et al., 2002). In fact, more success has been achieved in wastewater treatment using electrocoagulation compared with drinking water. A large number of studies and reviews on the application of electrocoagulation in wastewater treatment have been completed (Matteson et al., 1995; Ciorba et al., 2000; Xiong et al., 2001; Bejankiwar, 2002; Chen et al., 2002; Xiong et al. 2003), whereas only a limited number of studies, all still at the laboratory stage, focused on using electrocoagulation to treat potable water (Mameri et al., 1998; Mills, 2000; Jang et al., 2002). One of the reasons for the lack of electrocoagulation application in drinking water is that the chemical and physical processes involved are very complex and have not yet been fully understood, which therefore limits its application and design (Mollah et al. 2001). Research on these issues is still continuing.
In this study, a simple laboratory system of electrocoagulation was developed utilising aluminium foil and steel plates as electrodes, to treat water from Myponga Reservoir. The performance was compared with conventional coagulation (dissolved air flotation filtration (DAFF) jar testing) using alum and ferric chloride coagulants. Both sets of treatments were carried out over a wide range of dosages. The Faraday’s Law of Electrolysis was used to calculate dosages in electrocoagulation experiments in order to match these with the DAFF treatments. The pH was adjusted to 6 for enhanced coagulation. The primary parameter of the treated water being considered for the comparison was DOC removal. Other parameters including UV absorbance at 254 nm, true colour and apparent molecular weight distribution of UV absorbing compounds were also taken into account.
In addition there was some focus on the study of the electrocoagulation technique to evaluate the impact of the presence of coagulants at low concentration (before flocculation) on NOM character as well as the impact of electric current on NOM. A custom-made electrochemical system was created and several electrode materials, titanium, aluminium, copper and iron were tested. The aluminium, copper and iron electrodes are soluble electrodes, which produce metal ions to induce coagulation. The titanium electrode does not release metal ions; it is therefore considered as an electrolysis process. Moreover, this electrode was also used in conjunction with alum to study the effect of an electro assisted method (coagulation - electroflotation).
DEVELOPMENT OF COMBINED TREATMENT PROCESSES FOR THE REMOVAL OF RECALCITRANT ORGANIC MATTER
160
4.3.2 Theory
In a conventional water treatment process, there are five main stages: coagulation, flocculation, sedimentation or flotation, filtration and disinfection. The coagulation/flocculation stage is one of the most important steps in particle removal, which together with sedimentation (or flotation) and filtration, improves post-filtration disinfection efficacy (Jacangelo et al., 1995).
During the conventional treatment process, coagulants (e.g. alum, ferric chloride) are added to the water, which destabilises particles and induces flocculation so that they can be easily removed by filtration (Dennett et al., 1996). Various mechanisms for particle destabilisation have been identified and investigated in numerous studies and reviews (Dentel and Gossett, 1988; Hundt and O’Melia, 1988; Randtke, 1988; Jacangelo et al. 1995, Huang and Shiu, 1996; Gregor et al. 1997). These mechanisms include double-layer compression, adsorption-charge neutralisation, sweep coagulation and interparticle bridging, among which adsorption-charge neutralisation (or charge neutralisation for short) and sweep coagulation are the two predominant mechanisms in conventional coagulation. For alum and ferric chloride, the mechanism is controlled by hydrolysis speciation (Dennett et al., 1996).
Charge neutralisation involves the interaction between positively charged coagulant ions and negatively charged particles in the water. It was reported that under charge neutralisation, stoichiometry exists between the coagulant and the contaminant and the coagulant dosage used is dependent upon the concentration of the contaminant (Dennett et al., 1996). In sweep coagulation, dissolved particles are removed by adsorption to the surface of the solid precipitate, and particles are enmeshed or entrapped within a mass of the solid precipitate (Dennett et al., 1996).
In electrocoagulation, coagulants (metal ions) were generated in situ as a result of electrolytic oxidation of appropriate anode material (Mollah et al., 2001). The processes by which aluminium and iron electrodes produce the metal-hydroxy coagulating species have been proposed as follows:
For aluminium: Al(s) Al3+(aq) + 3e-
Al3+(aq) + 3H2O Al(OH)3 + 3H+
(aq)
For iron: 4Fe(s) 4Fe2+
(aq) + 8e-
4Fe2+(aq) + 10H2O + O2(g) 4Fe(OH)3(s) + 8H+
(aq)
The metal species can exist in various forms depending on pH (Mollah et al., 2001).
Faraday’s Law of Electrolysis (Appendix A) states that the amount of substance produced or consumed at one electrode is directly proportional to the amount of electricity passing through the electrolytic cell. This allows the electrocoagulation process to be controlled by monitoring the current passing through the electrodes and the time for which the current is applied.
CRC FOR WATER QUALITY AND TREATMENT – RESEARCH REPORT 38
161
4.3.3 Materials and Methods
4.3.3.1 Water sample
A raw water sample was collected on a single occasion from Myponga Reservoir and refrigerated. The characteristics of Myponga Reservoir water are summarised in Table 4.5. Myponga Reservoir is a primary catchment and its water is typically high in colour and dissolved organic carbon (DOC) but low in turbidity.
Table 4.5 NOM characteristics of raw Myponga Reservoir water
pH Turbidity (NTU) UV abs @ 254 nm (cm-1) Colour (HU) DOC (mg/L)
7.8 1.87 0.463 72 12.4
4.3.3.2 Chemicals, electrodes and electronic equipment
The coagulants used for the chemical dosing included alum (aluminium sulphate Al2(SO4)3.18H2O, 20,000 mg/L) and ferric chloride (FeCl3, 9,379 mg/L). These solutions were calculated to give equivalent moles of Al3+ and Fe3+ ions in each millilitre of solution. In electrocoagulation, the coagulants were generated in situ by electrolytic oxidation of appropriate anode materials.
Aluminium foil (Capral Aluminium Ltd., Australia) and polished steel plates (obtained from a scrap metal store) were used as aluminium and iron electrodes. A GW dual tracking power supply (Good Will Electronic Co., Ltd., Taiwan) was used as the power source for all electrocoagulation experiments, and a multimeter (Dick Smith Electronics Pty. Ltd., Australia) was used to monitor the current.
4.3.3.3 Analyses
All samples were filtered through a 0.45 μm membrane filter for all analyses (except turbidity and pH). Samples were analysed for turbidity using a Hach turbidimeter (Model 2100AN). Turbidity was measured in Nephelometric Turbidity Units (NTU). A Hach Sension3 pH meter was used to measure pH of all samples. UV absorbance @ 254 nm was determined using a Shimadzu UV/VIS Spectrophotometer (Model UV-1201, Shimadzu Corp., Japan) with a 1 cm quartz cell. Colour was determined using the same instrument as UV but at 456 nm and with a 5 cm quartz cell. Colour was measured in Hazen Units (HU) and determined through calibration with a 50 HU Platinum/Cobalt standard. Dissolved organic carbon (DOC) was determined using a Sievers Portable Total Organic Carbon Analyser (Model 820, Sievers Instruments, Inc., USA). Apparent molecular weight of UV absorbing compounds was determined using high-performance size exclusion chromatography (HPSEC), which was carried out with a Waters Alliance™ 2690 Separations Module and Waters 996 Photodiode Array Detector. Separation was achieved with a Shodex KW802.1 packed silica column (Showa Denko Pty. Ltd., Japan). The eluent was phosphate buffer (0.1 M) at a 1.0 mL/min flow rate. Apparent molecular weight was determined by calibration with polystyrene sulphonate (PSS) standards. All waters were filtered through a 0.2 μm membrane filter. The bacterial regrowth potential (BRP) method has been developed by Werner (1985). It is an analytical method, which provides information regarding the bacterial growth potential of a given water sample. BRP experiments were conducted on a Monitek® mAOC analyser model 251-4 (Monitek GmBH, Germany, now known as Metrisa® GmBH)
4.3.3.4 Procedures
In all treatments the coagulation pH was controlled at 6.0 by adding a predetermined amount of 0.2 M HCl or 0.2 M NaOH prior to chemical dosing in DAFF jar tests, or by adjusting pH to 6.0 prior to each electrocoagulation treatment. Each DAFF jar test and electrocoagulation experiment of the same coagulant were performed one after the other using water from the same sample container in order to minimise variations. Chemical dosages ranged from 20 mg/L to 160 mg/L of equivalent alum (the alum dose at the Myponga treatment plant was 90 mg/L at the time of the experiments).
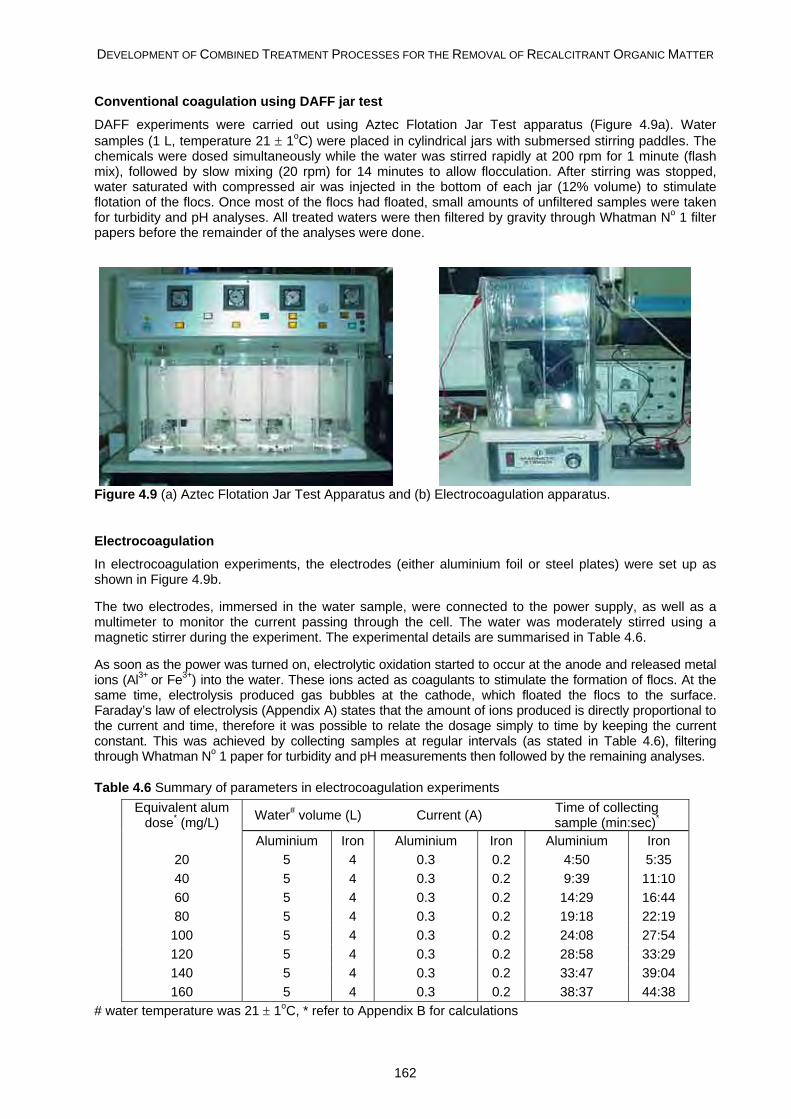
DEVELOPMENT OF COMBINED TREATMENT PROCESSES FOR THE REMOVAL OF RECALCITRANT ORGANIC MATTER
162
Conventional coagulation using DAFF jar test
DAFF experiments were carried out using Aztec Flotation Jar Test apparatus (Figure 4.9a). Water samples (1 L, temperature 21 ± 1oC) were placed in cylindrical jars with submersed stirring paddles. The chemicals were dosed simultaneously while the water was stirred rapidly at 200 rpm for 1 minute (flash mix), followed by slow mixing (20 rpm) for 14 minutes to allow flocculation. After stirring was stopped, water saturated with compressed air was injected in the bottom of each jar (12% volume) to stimulate flotation of the flocs. Once most of the flocs had floated, small amounts of unfiltered samples were taken for turbidity and pH analyses. All treated waters were then filtered by gravity through Whatman No 1 filter papers before the remainder of the analyses were done.
Figure 4.9 (a) Aztec Flotation Jar Test Apparatus and (b) Electrocoagulation apparatus.
Electrocoagulation
In electrocoagulation experiments, the electrodes (either aluminium foil or steel plates) were set up as shown in Figure 4.9b.
The two electrodes, immersed in the water sample, were connected to the power supply, as well as a multimeter to monitor the current passing through the cell. The water was moderately stirred using a magnetic stirrer during the experiment. The experimental details are summarised in Table 4.6.
As soon as the power was turned on, electrolytic oxidation started to occur at the anode and released metal ions (Al3+ or Fe3+) into the water. These ions acted as coagulants to stimulate the formation of flocs. At the same time, electrolysis produced gas bubbles at the cathode, which floated the flocs to the surface. Faraday’s law of electrolysis (Appendix A) states that the amount of ions produced is directly proportional to the current and time, therefore it was possible to relate the dosage simply to time by keeping the current constant. This was achieved by collecting samples at regular intervals (as stated in Table 4.6), filtering through Whatman No 1 paper for turbidity and pH measurements then followed by the remaining analyses.
Table 4.6 Summary of parameters in electrocoagulation experiments
Water# volume (L) Current (A) Time of collecting sample (min:sec)*
Equivalent alum dose* (mg/L)
Aluminium Iron Aluminium Iron Aluminium Iron 20 5 4 0.3 0.2 4:50 5:35 40 5 4 0.3 0.2 9:39 11:10 60 5 4 0.3 0.2 14:29 16:44 80 5 4 0.3 0.2 19:18 22:19 100 5 4 0.3 0.2 24:08 27:54 120 5 4 0.3 0.2 28:58 33:29 140 5 4 0.3 0.2 33:47 39:04 160 5 4 0.3 0.2 38:37 44:38
# water temperature was 21 ± 1oC, * refer to Appendix B for calculations
CRC FOR WATER QUALITY AND TREATMENT – RESEARCH REPORT 38
163
In iron electrocoagulation, flocculation kinetics were too slow to occur before sample collection and continued after water samples were collected, thus they were left on the bench for 2 - 3 hours before being filtered. This was to allow more complete formation of flocs. In addition, the gas produced during the electrolysis was not sufficient to cause all the flocs to float as in aluminium electrocoagulation, therefore sedimentation had also occurred during this period of time. As a result, there was sludge both on the surface and at the bottom of the jar.
Electrolysis of NOM fractions
These sets of experiment were conducted on Myponga very hydrophobic acids (VHA) and charged (CHA) fractions. Both experiments were carried out using 9 litres of sample. The VHA and CHA fractions were diluted to yield 9 litres of water at 20 mg/L of DOC. A dual tracking power supply (Good Will, Taiwan) was set at 10 V and 0.1 A into inert titanium electrodes, allowing direct application of current without the formation of dissolved metal species. The jar was equipped with a magnetic stirrer (fast rotation). The duration of the experiment was 6 days. Samples (50 mL) were taken once a day.
Electrocoagulation / Electroflotation
The various conditions of these experiments and the controls are summarised in Table 4.7. The experiments were divided into three distinct sets:
1. Titanium electrodes + alum dose: This set was conducted to evaluate the coagulation - electroflotation process.
2. Aluminium electrodes: This set of experiments was set-up to evaluate aluminium electrocoagulation / electroflotation at various electric currents.
3. Electrolysed water + alum dose: This set was conducted to evaluate the impact of electrolysis using inert titanium electrodes prior to dosing on the inherent treatability of water.
Table 4.7 Plan of electrocoagulation/electrolysis experiments
Set Water Electrode Electric current Alum dose (mg/L) 1 Myponga raw Titanium 27V, 0.5A 100 Myponga raw - - 100 Myponga raw Titanium 10V, 0.15A 100 Myponga raw - - 100 2 Myponga raw Aluminium 8V, 0.1A - Myponga raw Aluminium 10V, 0.15A - Myponga raw Aluminium 27V, 0.5A - Myponga raw - - 100 3 Myponga raw - - 80 Electrolysed Myponga - - 80 Myponga raw - - 100 Electrolysed Myponga - - 100 Myponga raw - - 130 Electrolysed Myponga - - 130
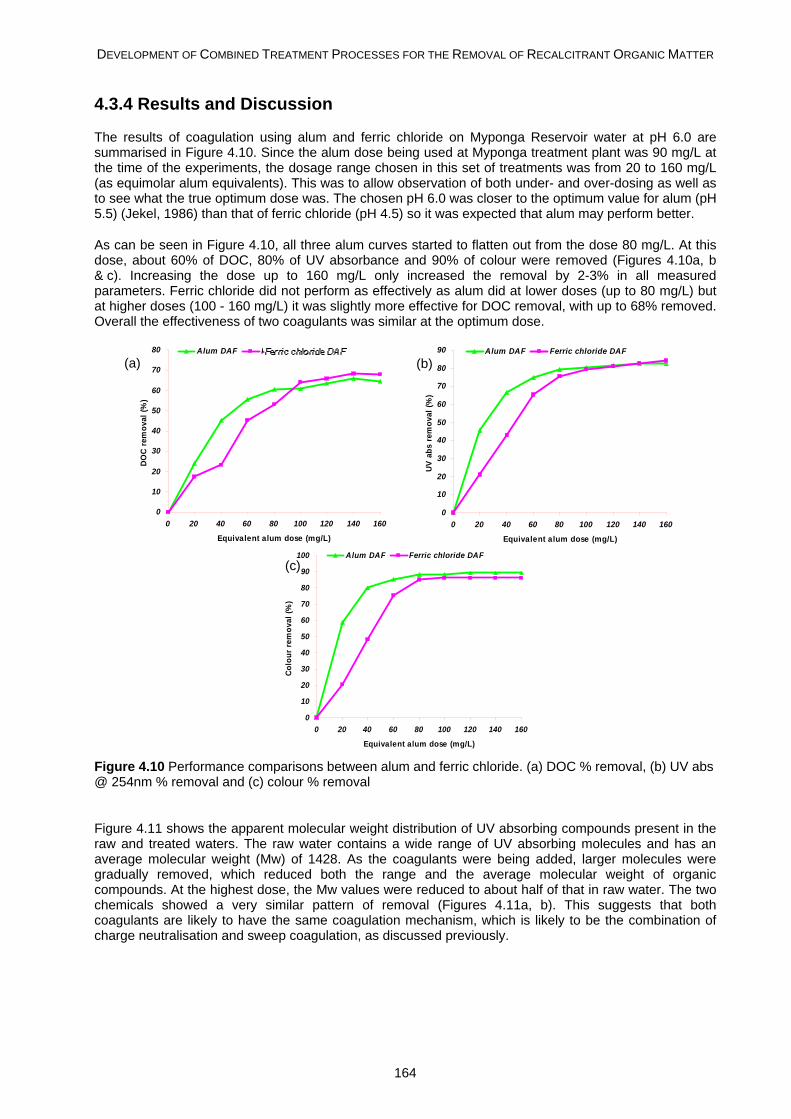
DEVELOPMENT OF COMBINED TREATMENT PROCESSES FOR THE REMOVAL OF RECALCITRANT ORGANIC MATTER
164
4.3.4 Results and Discussion
The results of coagulation using alum and ferric chloride on Myponga Reservoir water at pH 6.0 are summarised in Figure 4.10. Since the alum dose being used at Myponga treatment plant was 90 mg/L at the time of the experiments, the dosage range chosen in this set of treatments was from 20 to 160 mg/L (as equimolar alum equivalents). This was to allow observation of both under- and over-dosing as well as to see what the true optimum dose was. The chosen pH 6.0 was closer to the optimum value for alum (pH 5.5) (Jekel, 1986) than that of ferric chloride (pH 4.5) so it was expected that alum may perform better.
As can be seen in Figure 4.10, all three alum curves started to flatten out from the dose 80 mg/L. At this dose, about 60% of DOC, 80% of UV absorbance and 90% of colour were removed (Figures 4.10a, b & c). Increasing the dose up to 160 mg/L only increased the removal by 2-3% in all measured parameters. Ferric chloride did not perform as effectively as alum did at lower doses (up to 80 mg/L) but at higher doses (100 - 160 mg/L) it was slightly more effective for DOC removal, with up to 68% removed. Overall the effectiveness of two coagulants was similar at the optimum dose.
0
10
20
30
40
50
60
70
80
0 20 40 60 80 100 120 140 160
Equivalent alum dose (mg/L)
DO
C re
mov
al (%
)
Alum DAF Ferric chlorid DAF
0
10
20
30
40
50
60
70
80
90
0 20 40 60 80 100 120 140 160
Equivalent alum dose (mg/L)
UV a
bs re
mov
al (%
)
Alum DAF Ferric chloride DAF
0
10
20
30
40
50
60
70
80
90
100
0 20 40 60 80 100 120 140 160
Equivalent alum dose (mg/L)
Colo
ur r
emov
al (%
)
Alum DAF Ferric chloride DAF
Figure 4.10 Performance comparisons between alum and ferric chloride. (a) DOC % removal, (b) UV abs @ 254nm % removal and (c) colour % removal
Figure 4.11 shows the apparent molecular weight distribution of UV absorbing compounds present in the raw and treated waters. The raw water contains a wide range of UV absorbing molecules and has an average molecular weight (Mw) of 1428. As the coagulants were being added, larger molecules were gradually removed, which reduced both the range and the average molecular weight of organic compounds. At the highest dose, the Mw values were reduced to about half of that in raw water. The two chemicals showed a very similar pattern of removal (Figures 4.11a, b). This suggests that both coagulants are likely to have the same coagulation mechanism, which is likely to be the combination of charge neutralisation and sweep coagulation, as discussed previously.
(a) (b)
(c)
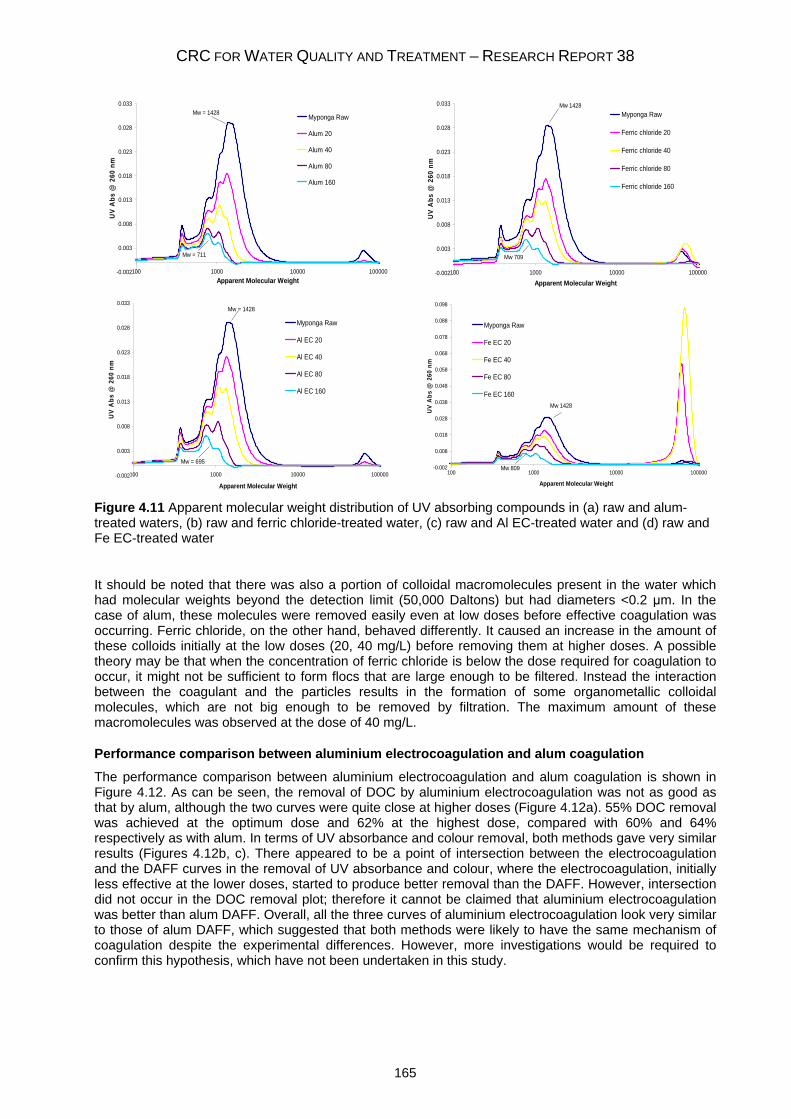
CRC FOR WATER QUALITY AND TREATMENT – RESEARCH REPORT 38
165
-0.002
0.003
0.008
0.013
0.018
0.023
0.028
0.033
100 1000 10000 100000Apparent Molecular Weight
UV
Abs
@ 2
60 n
mMyponga Raw
Alum 20
Alum 40
Alum 80
Alum 160
Mw = 1428
Mw = 711
-0.002
0.003
0.008
0.013
0.018
0.023
0.028
0.033
100 1000 10000 100000
Apparent Molecular Weight
UV
Abs
@ 2
60 n
m
Myponga Raw
Ferric chloride 20
Ferric chloride 40
Ferric chloride 80
Ferric chloride 160
Mw 1428
Mw 709
-0.002
0.003
0.008
0.013
0.018
0.023
0.028
0.033
100 1000 10000 100000
Apparent Molecular Weight
UV
Abs
@ 2
60 n
m
Myponga Raw
Al EC 20
Al EC 40
Al EC 80
Al EC 160
Mw = 1428
Mw = 695
-0.002
0.008
0.018
0.028
0.038
0.048
0.058
0.068
0.078
0.088
0.098
100 1000 10000 100000
Apparent Molecular Weight
UV
Abs
@ 2
60 n
m
Myponga Raw
Fe EC 20
Fe EC 40
Fe EC 80
Fe EC 160Mw 1428
Mw 809
Figure 4.11 Apparent molecular weight distribution of UV absorbing compounds in (a) raw and alum-treated waters, (b) raw and ferric chloride-treated water, (c) raw and Al EC-treated water and (d) raw and Fe EC-treated water
It should be noted that there was also a portion of colloidal macromolecules present in the water which had molecular weights beyond the detection limit (50,000 Daltons) but had diameters <0.2 μm. In the case of alum, these molecules were removed easily even at low doses before effective coagulation was occurring. Ferric chloride, on the other hand, behaved differently. It caused an increase in the amount of these colloids initially at the low doses (20, 40 mg/L) before removing them at higher doses. A possible theory may be that when the concentration of ferric chloride is below the dose required for coagulation to occur, it might not be sufficient to form flocs that are large enough to be filtered. Instead the interaction between the coagulant and the particles results in the formation of some organometallic colloidal molecules, which are not big enough to be removed by filtration. The maximum amount of these macromolecules was observed at the dose of 40 mg/L.
Performance comparison between aluminium electrocoagulation and alum coagulation
The performance comparison between aluminium electrocoagulation and alum coagulation is shown in Figure 4.12. As can be seen, the removal of DOC by aluminium electrocoagulation was not as good as that by alum, although the two curves were quite close at higher doses (Figure 4.12a). 55% DOC removal was achieved at the optimum dose and 62% at the highest dose, compared with 60% and 64% respectively as with alum. In terms of UV absorbance and colour removal, both methods gave very similar results (Figures 4.12b, c). There appeared to be a point of intersection between the electrocoagulation and the DAFF curves in the removal of UV absorbance and colour, where the electrocoagulation, initially less effective at the lower doses, started to produce better removal than the DAFF. However, intersection did not occur in the DOC removal plot; therefore it cannot be claimed that aluminium electrocoagulation was better than alum DAFF. Overall, all the three curves of aluminium electrocoagulation look very similar to those of alum DAFF, which suggested that both methods were likely to have the same mechanism of coagulation despite the experimental differences. However, more investigations would be required to confirm this hypothesis, which have not been undertaken in this study.
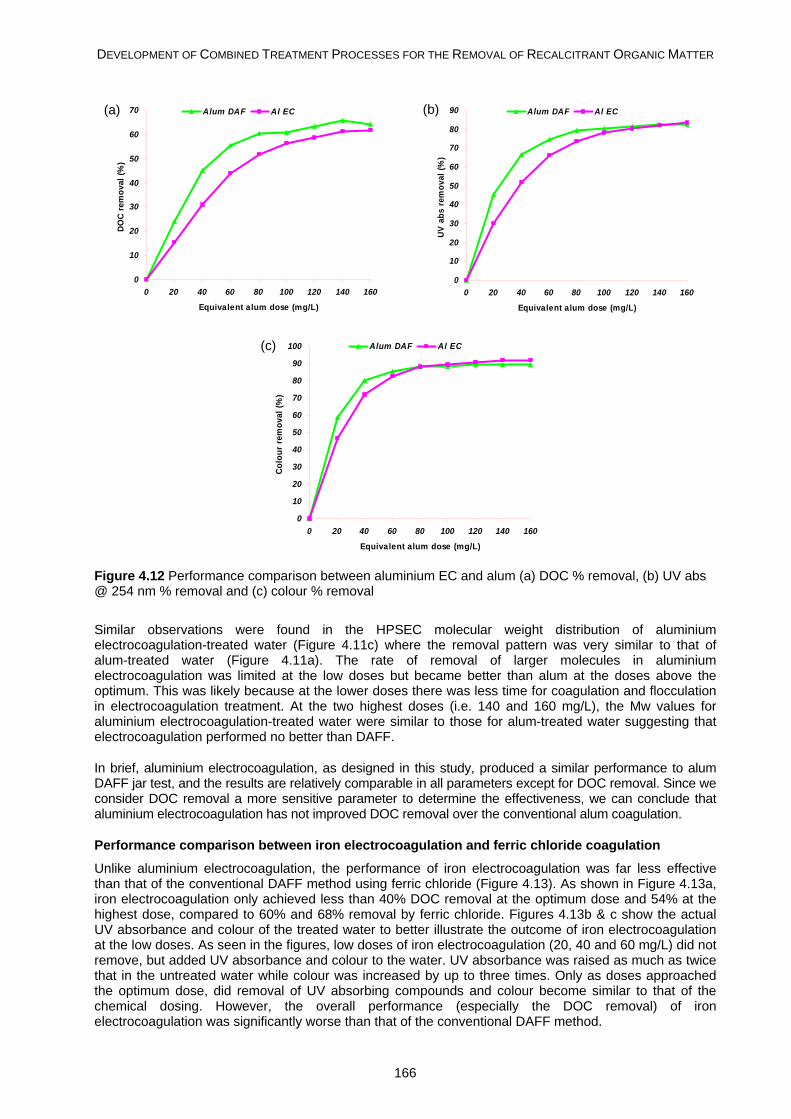
DEVELOPMENT OF COMBINED TREATMENT PROCESSES FOR THE REMOVAL OF RECALCITRANT ORGANIC MATTER
166
0
10
20
30
40
50
60
70
0 20 40 60 80 100 120 140 160
Equivalent alum dose (mg/L)
DOC
rem
oval
(%)
Alum DAF Al EC
0
10
20
30
40
50
60
70
80
90
0 20 40 60 80 100 120 140 160
Equivalent alum dose (mg/L)
UV
abs
rem
oval
(%)
Alum DAF Al EC
0
10
20
30
40
50
60
70
80
90
100
0 20 40 60 80 100 120 140 160
Equivalent alum dose (mg/L)
Col
our
rem
oval
(%)
Alum DAF Al EC
Figure 4.12 Performance comparison between aluminium EC and alum (a) DOC % removal, (b) UV abs @ 254 nm % removal and (c) colour % removal
Similar observations were found in the HPSEC molecular weight distribution of aluminium electrocoagulation-treated water (Figure 4.11c) where the removal pattern was very similar to that of alum-treated water (Figure 4.11a). The rate of removal of larger molecules in aluminium electrocoagulation was limited at the low doses but became better than alum at the doses above the optimum. This was likely because at the lower doses there was less time for coagulation and flocculation in electrocoagulation treatment. At the two highest doses (i.e. 140 and 160 mg/L), the Mw values for aluminium electrocoagulation-treated water were similar to those for alum-treated water suggesting that electrocoagulation performed no better than DAFF.
In brief, aluminium electrocoagulation, as designed in this study, produced a similar performance to alum DAFF jar test, and the results are relatively comparable in all parameters except for DOC removal. Since we consider DOC removal a more sensitive parameter to determine the effectiveness, we can conclude that aluminium electrocoagulation has not improved DOC removal over the conventional alum coagulation.
Performance comparison between iron electrocoagulation and ferric chloride coagulation
Unlike aluminium electrocoagulation, the performance of iron electrocoagulation was far less effective than that of the conventional DAFF method using ferric chloride (Figure 4.13). As shown in Figure 4.13a, iron electrocoagulation only achieved less than 40% DOC removal at the optimum dose and 54% at the highest dose, compared to 60% and 68% removal by ferric chloride. Figures 4.13b & c show the actual UV absorbance and colour of the treated water to better illustrate the outcome of iron electrocoagulation at the low doses. As seen in the figures, low doses of iron electrocoagulation (20, 40 and 60 mg/L) did not remove, but added UV absorbance and colour to the water. UV absorbance was raised as much as twice that in the untreated water while colour was increased by up to three times. Only as doses approached the optimum dose, did removal of UV absorbing compounds and colour become similar to that of the chemical dosing. However, the overall performance (especially the DOC removal) of iron electrocoagulation was significantly worse than that of the conventional DAFF method.
(a) (b)
(c)
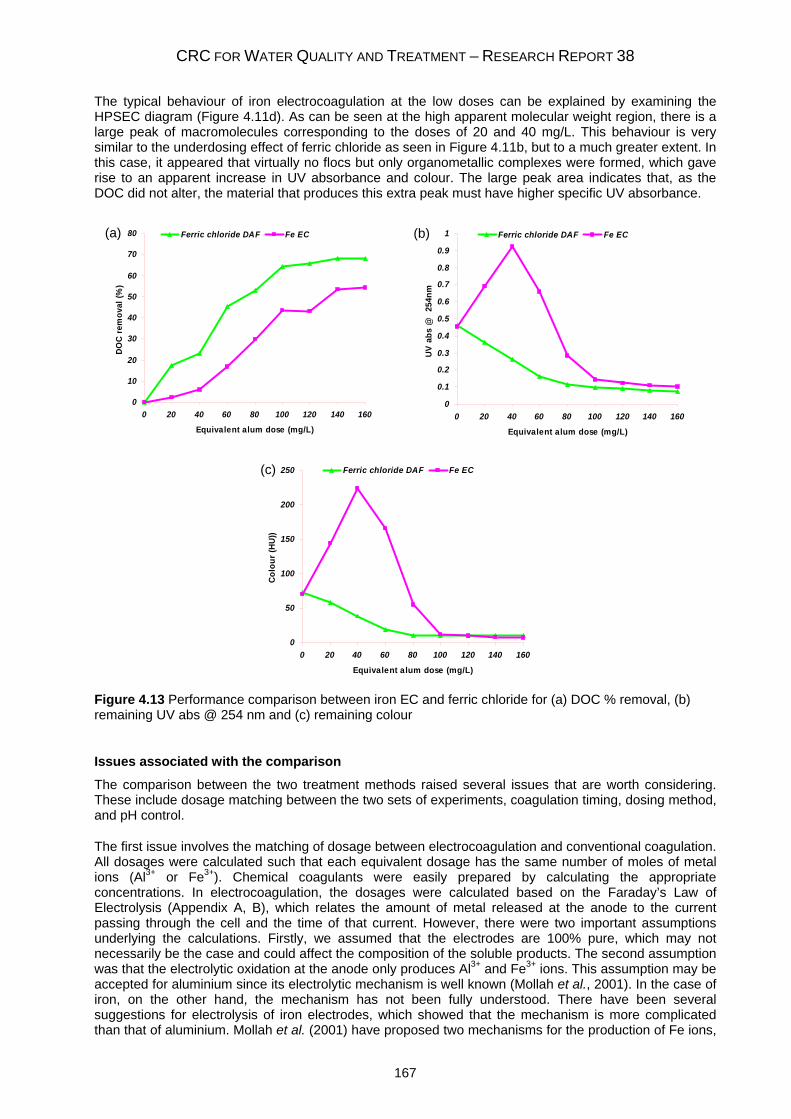
CRC FOR WATER QUALITY AND TREATMENT – RESEARCH REPORT 38
167
The typical behaviour of iron electrocoagulation at the low doses can be explained by examining the HPSEC diagram (Figure 4.11d). As can be seen at the high apparent molecular weight region, there is a large peak of macromolecules corresponding to the doses of 20 and 40 mg/L. This behaviour is very similar to the underdosing effect of ferric chloride as seen in Figure 4.11b, but to a much greater extent. In this case, it appeared that virtually no flocs but only organometallic complexes were formed, which gave rise to an apparent increase in UV absorbance and colour. The large peak area indicates that, as the DOC did not alter, the material that produces this extra peak must have higher specific UV absorbance.
0
10
20
30
40
50
60
70
80
0 20 40 60 80 100 120 140 160
Equivalent alum dose (mg/L)
DO
C re
mov
al (%
)
Ferric chloride DAF Fe EC
0
0.1
0.2
0.3
0.4
0.5
0.6
0.7
0.8
0.9
1
0 20 40 60 80 100 120 140 160
Equivalent alum dose (mg/L)U
V ab
s @
254
nm
Ferric chloride DAF Fe EC
0
50
100
150
200
250
0 20 40 60 80 100 120 140 160
Equivalent alum dose (mg/L)
Colo
ur (H
U))
Ferric chloride DAF Fe EC
Figure 4.13 Performance comparison between iron EC and ferric chloride for (a) DOC % removal, (b) remaining UV abs @ 254 nm and (c) remaining colour
Issues associated with the comparison
The comparison between the two treatment methods raised several issues that are worth considering. These include dosage matching between the two sets of experiments, coagulation timing, dosing method, and pH control.
The first issue involves the matching of dosage between electrocoagulation and conventional coagulation. All dosages were calculated such that each equivalent dosage has the same number of moles of metal ions (Al3+ or Fe3+). Chemical coagulants were easily prepared by calculating the appropriate concentrations. In electrocoagulation, the dosages were calculated based on the Faraday’s Law of Electrolysis (Appendix A, B), which relates the amount of metal released at the anode to the current passing through the cell and the time of that current. However, there were two important assumptions underlying the calculations. Firstly, we assumed that the electrodes are 100% pure, which may not necessarily be the case and could affect the composition of the soluble products. The second assumption was that the electrolytic oxidation at the anode only produces Al3+ and Fe3+ ions. This assumption may be accepted for aluminium since its electrolytic mechanism is well known (Mollah et al., 2001). In the case of iron, on the other hand, the mechanism has not been fully understood. There have been several suggestions for electrolysis of iron electrodes, which showed that the mechanism is more complicated than that of aluminium. Mollah et al. (2001) have proposed two mechanisms for the production of Fe ions,
(a) (b)
(c)
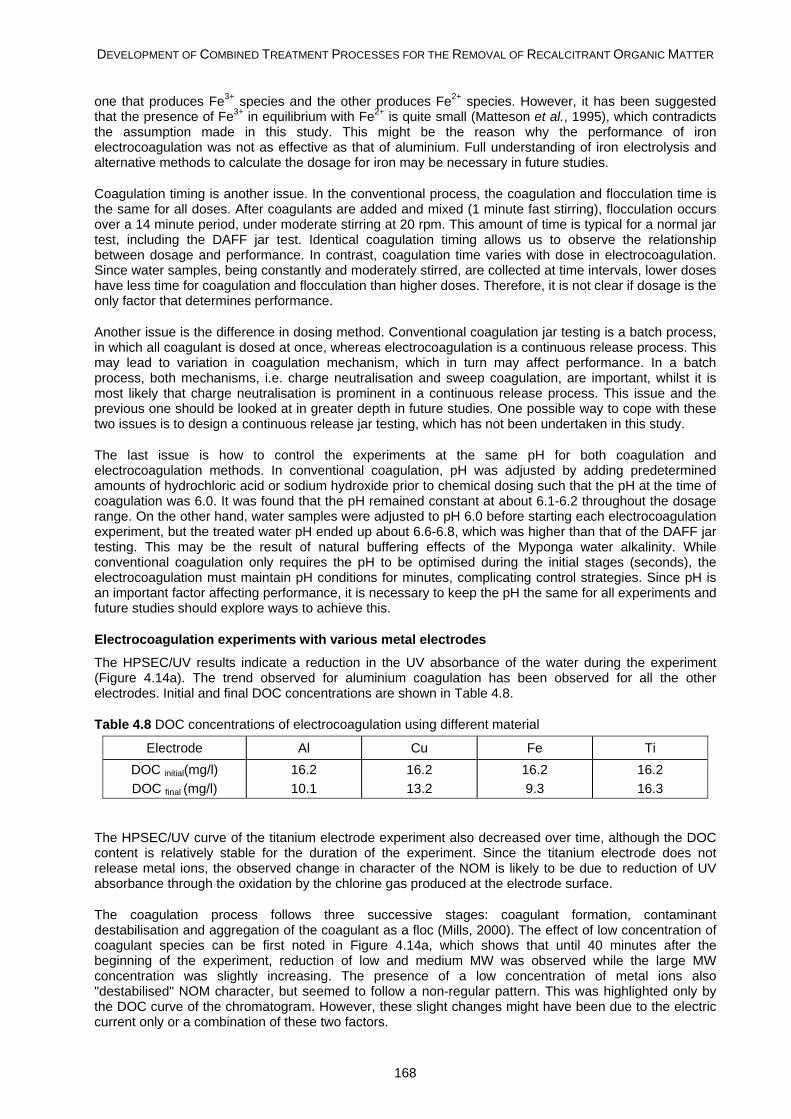
DEVELOPMENT OF COMBINED TREATMENT PROCESSES FOR THE REMOVAL OF RECALCITRANT ORGANIC MATTER
168
one that produces Fe3+ species and the other produces Fe2+ species. However, it has been suggested that the presence of Fe3+ in equilibrium with Fe2+ is quite small (Matteson et al., 1995), which contradicts the assumption made in this study. This might be the reason why the performance of iron electrocoagulation was not as effective as that of aluminium. Full understanding of iron electrolysis and alternative methods to calculate the dosage for iron may be necessary in future studies.
Coagulation timing is another issue. In the conventional process, the coagulation and flocculation time is the same for all doses. After coagulants are added and mixed (1 minute fast stirring), flocculation occurs over a 14 minute period, under moderate stirring at 20 rpm. This amount of time is typical for a normal jar test, including the DAFF jar test. Identical coagulation timing allows us to observe the relationship between dosage and performance. In contrast, coagulation time varies with dose in electrocoagulation. Since water samples, being constantly and moderately stirred, are collected at time intervals, lower doses have less time for coagulation and flocculation than higher doses. Therefore, it is not clear if dosage is the only factor that determines performance.
Another issue is the difference in dosing method. Conventional coagulation jar testing is a batch process, in which all coagulant is dosed at once, whereas electrocoagulation is a continuous release process. This may lead to variation in coagulation mechanism, which in turn may affect performance. In a batch process, both mechanisms, i.e. charge neutralisation and sweep coagulation, are important, whilst it is most likely that charge neutralisation is prominent in a continuous release process. This issue and the previous one should be looked at in greater depth in future studies. One possible way to cope with these two issues is to design a continuous release jar testing, which has not been undertaken in this study.
The last issue is how to control the experiments at the same pH for both coagulation and electrocoagulation methods. In conventional coagulation, pH was adjusted by adding predetermined amounts of hydrochloric acid or sodium hydroxide prior to chemical dosing such that the pH at the time of coagulation was 6.0. It was found that the pH remained constant at about 6.1-6.2 throughout the dosage range. On the other hand, water samples were adjusted to pH 6.0 before starting each electrocoagulation experiment, but the treated water pH ended up about 6.6-6.8, which was higher than that of the DAFF jar testing. This may be the result of natural buffering effects of the Myponga water alkalinity. While conventional coagulation only requires the pH to be optimised during the initial stages (seconds), the electrocoagulation must maintain pH conditions for minutes, complicating control strategies. Since pH is an important factor affecting performance, it is necessary to keep the pH the same for all experiments and future studies should explore ways to achieve this.
Electrocoagulation experiments with various metal electrodes
The HPSEC/UV results indicate a reduction in the UV absorbance of the water during the experiment (Figure 4.14a). The trend observed for aluminium coagulation has been observed for all the other electrodes. Initial and final DOC concentrations are shown in Table 4.8.
Table 4.8 DOC concentrations of electrocoagulation using different material
Electrode Al Cu Fe Ti DOC initial(mg/l) 16.2 16.2 16.2 16.2 DOC final (mg/l) 10.1 13.2 9.3 16.3
The HPSEC/UV curve of the titanium electrode experiment also decreased over time, although the DOC content is relatively stable for the duration of the experiment. Since the titanium electrode does not release metal ions, the observed change in character of the NOM is likely to be due to reduction of UV absorbance through the oxidation by the chlorine gas produced at the electrode surface.
The coagulation process follows three successive stages: coagulant formation, contaminant destabilisation and aggregation of the coagulant as a floc (Mills, 2000). The effect of low concentration of coagulant species can be first noted in Figure 4.14a, which shows that until 40 minutes after the beginning of the experiment, reduction of low and medium MW was observed while the large MW concentration was slightly increasing. The presence of a low concentration of metal ions also "destabilised" NOM character, but seemed to follow a non-regular pattern. This was highlighted only by the DOC curve of the chromatogram. However, these slight changes might have been due to the electric current only or a combination of these two factors.
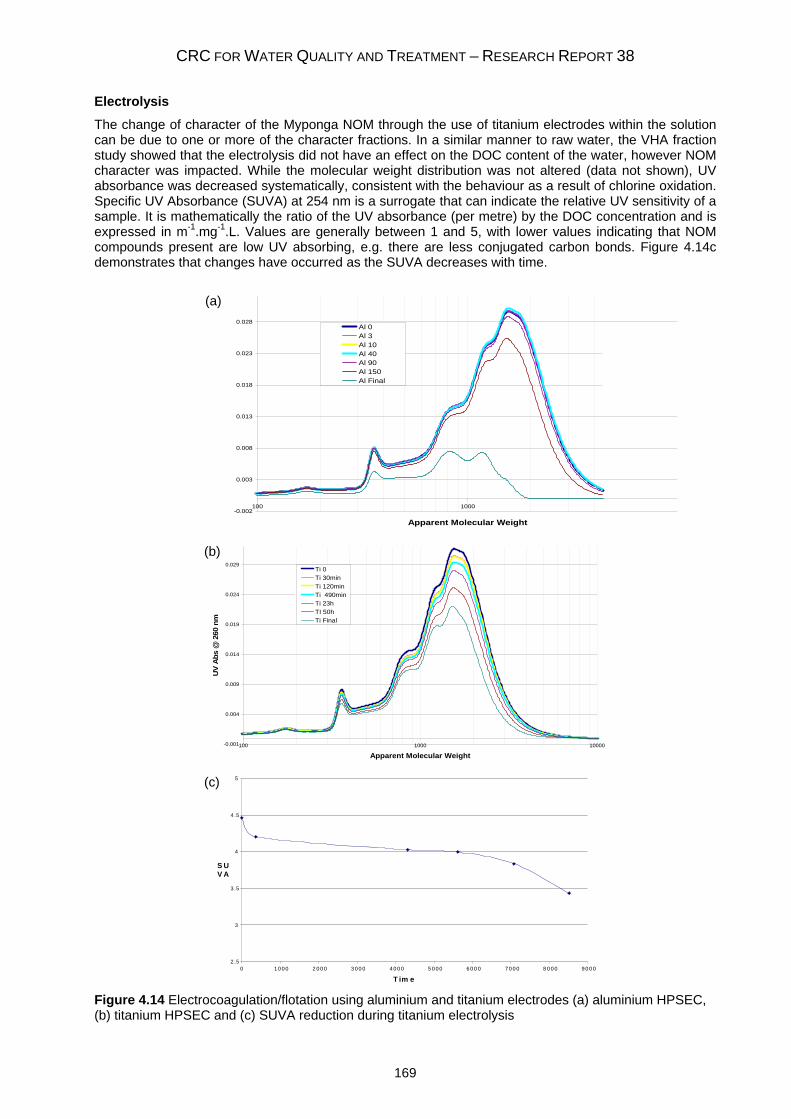
CRC FOR WATER QUALITY AND TREATMENT – RESEARCH REPORT 38
169
Electrolysis
The change of character of the Myponga NOM through the use of titanium electrodes within the solution can be due to one or more of the character fractions. In a similar manner to raw water, the VHA fraction study showed that the electrolysis did not have an effect on the DOC content of the water, however NOM character was impacted. While the molecular weight distribution was not altered (data not shown), UV absorbance was decreased systematically, consistent with the behaviour as a result of chlorine oxidation. Specific UV Absorbance (SUVA) at 254 nm is a surrogate that can indicate the relative UV sensitivity of a sample. It is mathematically the ratio of the UV absorbance (per metre) by the DOC concentration and is expressed in m-1.mg-1.L. Values are generally between 1 and 5, with lower values indicating that NOM compounds present are low UV absorbing, e.g. there are less conjugated carbon bonds. Figure 4.14c demonstrates that changes have occurred as the SUVA decreases with time.
-0.002
0.003
0.008
0.013
0.018
0.023
0.028
100 1000
Apparent Molecular Weight
Al 0Al 3Al 10Al 40Al 90Al 150Al Final
-0.001
0.004
0.009
0.014
0.019
0.024
0.029
100 1000 10000
Apparent Molecular Weight
UV
Abs
@ 2
60 n
m
Ti 0Ti 30minTi 120minTi 490minTi 23hTI 50hTi Final
2 .5
3
3 .5
4
4 .5
5
0 1 0 0 0 2 0 0 0 3 0 0 0 4 0 0 0 5 0 0 0 6 0 0 0 7 0 0 0 8 0 0 0 9 0 0 0
T im e( i )
S UV A
Figure 4.14 Electrocoagulation/flotation using aluminium and titanium electrodes (a) aluminium HPSEC, (b) titanium HPSEC and (c) SUVA reduction during titanium electrolysis
(a)
(b)
(c)
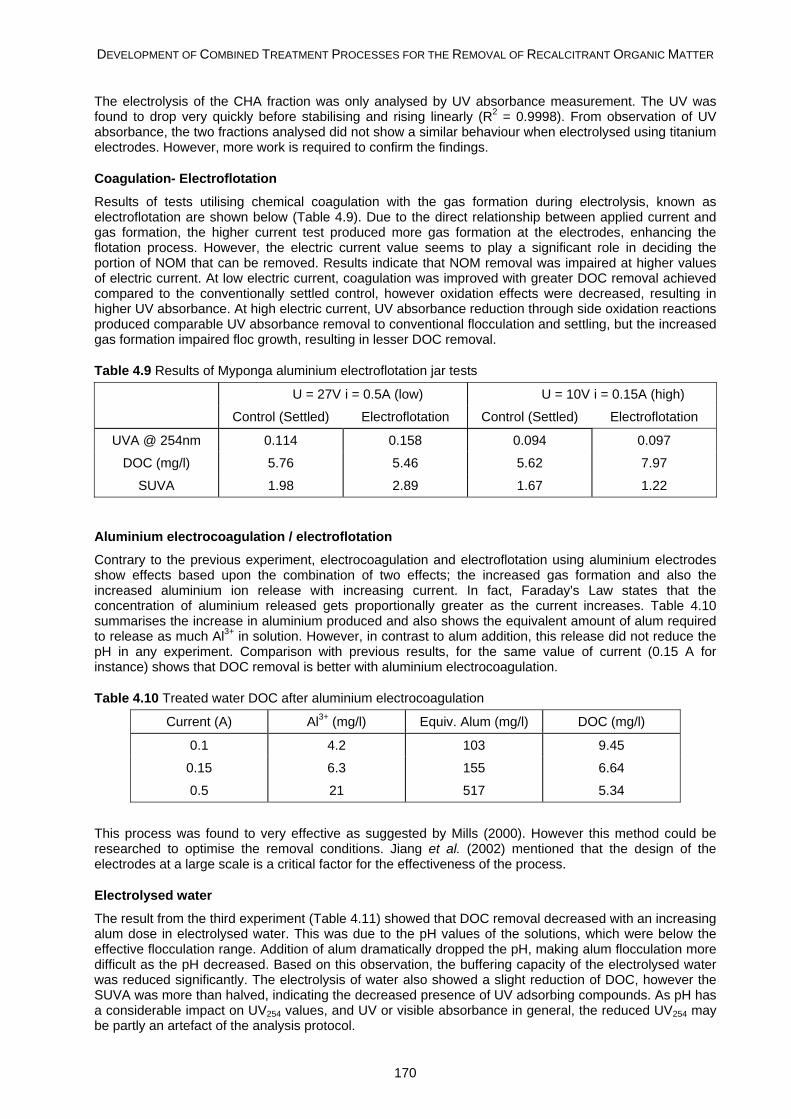
DEVELOPMENT OF COMBINED TREATMENT PROCESSES FOR THE REMOVAL OF RECALCITRANT ORGANIC MATTER
170
The electrolysis of the CHA fraction was only analysed by UV absorbance measurement. The UV was found to drop very quickly before stabilising and rising linearly (R2 = 0.9998). From observation of UV absorbance, the two fractions analysed did not show a similar behaviour when electrolysed using titanium electrodes. However, more work is required to confirm the findings.
Coagulation- Electroflotation
Results of tests utilising chemical coagulation with the gas formation during electrolysis, known as electroflotation are shown below (Table 4.9). Due to the direct relationship between applied current and gas formation, the higher current test produced more gas formation at the electrodes, enhancing the flotation process. However, the electric current value seems to play a significant role in deciding the portion of NOM that can be removed. Results indicate that NOM removal was impaired at higher values of electric current. At low electric current, coagulation was improved with greater DOC removal achieved compared to the conventionally settled control, however oxidation effects were decreased, resulting in higher UV absorbance. At high electric current, UV absorbance reduction through side oxidation reactions produced comparable UV absorbance removal to conventional flocculation and settling, but the increased gas formation impaired floc growth, resulting in lesser DOC removal.
Table 4.9 Results of Myponga aluminium electroflotation jar tests
U = 27V i = 0.5A (low) U = 10V i = 0.15A (high)
Control (Settled) Electroflotation Control (Settled) Electroflotation
UVA @ 254nm 0.114 0.158 0.094 0.097
DOC (mg/l) 5.76 5.46 5.62 7.97
SUVA 1.98 2.89 1.67 1.22
Aluminium electrocoagulation / electroflotation
Contrary to the previous experiment, electrocoagulation and electroflotation using aluminium electrodes show effects based upon the combination of two effects; the increased gas formation and also the increased aluminium ion release with increasing current. In fact, Faraday's Law states that the concentration of aluminium released gets proportionally greater as the current increases. Table 4.10 summarises the increase in aluminium produced and also shows the equivalent amount of alum required to release as much Al3+ in solution. However, in contrast to alum addition, this release did not reduce the pH in any experiment. Comparison with previous results, for the same value of current (0.15 A for instance) shows that DOC removal is better with aluminium electrocoagulation.
Table 4.10 Treated water DOC after aluminium electrocoagulation
Current (A) Al3+ (mg/l) Equiv. Alum (mg/l) DOC (mg/l)
0.1 4.2 103 9.45
0.15 6.3 155 6.64
0.5 21 517 5.34
This process was found to very effective as suggested by Mills (2000). However this method could be researched to optimise the removal conditions. Jiang et al. (2002) mentioned that the design of the electrodes at a large scale is a critical factor for the effectiveness of the process.
Electrolysed water
The result from the third experiment (Table 4.11) showed that DOC removal decreased with an increasing alum dose in electrolysed water. This was due to the pH values of the solutions, which were below the effective flocculation range. Addition of alum dramatically dropped the pH, making alum flocculation more difficult as the pH decreased. Based on this observation, the buffering capacity of the electrolysed water was reduced significantly. The electrolysis of water also showed a slight reduction of DOC, however the SUVA was more than halved, indicating the decreased presence of UV adsorbing compounds. As pH has a considerable impact on UV254 values, and UV or visible absorbance in general, the reduced UV254 may be partly an artefact of the analysis protocol.
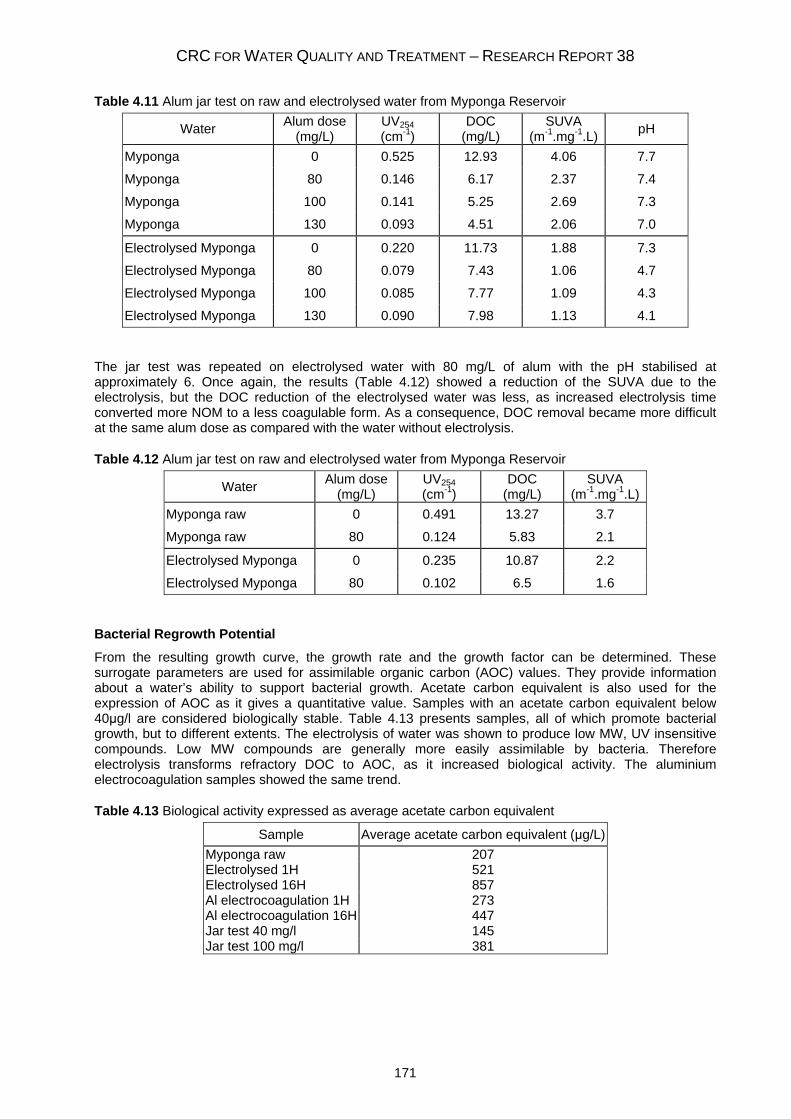
CRC FOR WATER QUALITY AND TREATMENT – RESEARCH REPORT 38
171
Table 4.11 Alum jar test on raw and electrolysed water from Myponga Reservoir
Water Alum dose (mg/L)
UV254 (cm-1)
DOC (mg/L)
SUVA (m-1.mg-1.L) pH
Myponga 0 0.525 12.93 4.06 7.7
Myponga 80 0.146 6.17 2.37 7.4
Myponga 100 0.141 5.25 2.69 7.3
Myponga 130 0.093 4.51 2.06 7.0
Electrolysed Myponga 0 0.220 11.73 1.88 7.3
Electrolysed Myponga 80 0.079 7.43 1.06 4.7
Electrolysed Myponga 100 0.085 7.77 1.09 4.3
Electrolysed Myponga 130 0.090 7.98 1.13 4.1
The jar test was repeated on electrolysed water with 80 mg/L of alum with the pH stabilised at approximately 6. Once again, the results (Table 4.12) showed a reduction of the SUVA due to the electrolysis, but the DOC reduction of the electrolysed water was less, as increased electrolysis time converted more NOM to a less coagulable form. As a consequence, DOC removal became more difficult at the same alum dose as compared with the water without electrolysis.
Table 4.12 Alum jar test on raw and electrolysed water from Myponga Reservoir
Water Alum dose (mg/L)
UV254 (cm-1)
DOC (mg/L)
SUVA (m-1.mg-1.L)
Myponga raw 0 0.491 13.27 3.7
Myponga raw 80 0.124 5.83 2.1
Electrolysed Myponga 0 0.235 10.87 2.2
Electrolysed Myponga 80 0.102 6.5 1.6
Bacterial Regrowth Potential
From the resulting growth curve, the growth rate and the growth factor can be determined. These surrogate parameters are used for assimilable organic carbon (AOC) values. They provide information about a water’s ability to support bacterial growth. Acetate carbon equivalent is also used for the expression of AOC as it gives a quantitative value. Samples with an acetate carbon equivalent below 40μg/l are considered biologically stable. Table 4.13 presents samples, all of which promote bacterial growth, but to different extents. The electrolysis of water was shown to produce low MW, UV insensitive compounds. Low MW compounds are generally more easily assimilable by bacteria. Therefore electrolysis transforms refractory DOC to AOC, as it increased biological activity. The aluminium electrocoagulation samples showed the same trend.
Table 4.13 Biological activity expressed as average acetate carbon equivalent
Sample Average acetate carbon equivalent (μg/L) Myponga raw 207 Electrolysed 1H 521 Electrolysed 16H 857 Al electrocoagulation 1H 273 Al electrocoagulation 16H 447 Jar test 40 mg/l 145 Jar test 100 mg/l 381
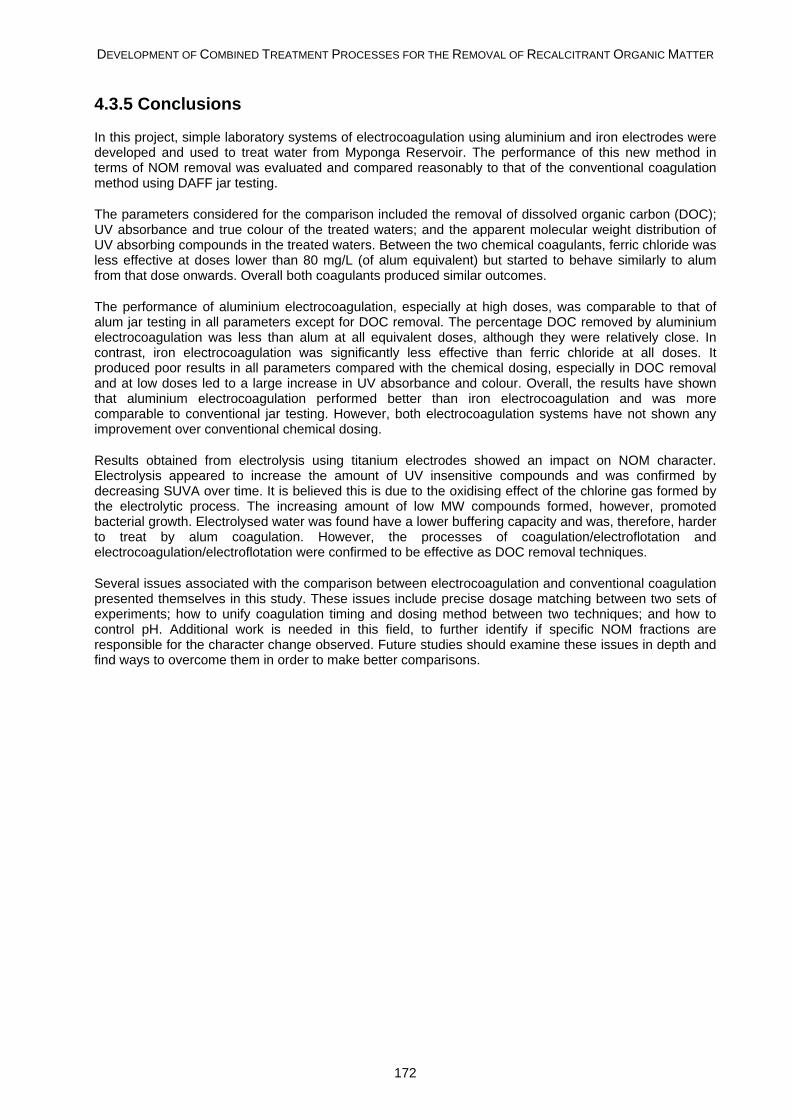
DEVELOPMENT OF COMBINED TREATMENT PROCESSES FOR THE REMOVAL OF RECALCITRANT ORGANIC MATTER
172
4.3.5 Conclusions
In this project, simple laboratory systems of electrocoagulation using aluminium and iron electrodes were developed and used to treat water from Myponga Reservoir. The performance of this new method in terms of NOM removal was evaluated and compared reasonably to that of the conventional coagulation method using DAFF jar testing.
The parameters considered for the comparison included the removal of dissolved organic carbon (DOC); UV absorbance and true colour of the treated waters; and the apparent molecular weight distribution of UV absorbing compounds in the treated waters. Between the two chemical coagulants, ferric chloride was less effective at doses lower than 80 mg/L (of alum equivalent) but started to behave similarly to alum from that dose onwards. Overall both coagulants produced similar outcomes.
The performance of aluminium electrocoagulation, especially at high doses, was comparable to that of alum jar testing in all parameters except for DOC removal. The percentage DOC removed by aluminium electrocoagulation was less than alum at all equivalent doses, although they were relatively close. In contrast, iron electrocoagulation was significantly less effective than ferric chloride at all doses. It produced poor results in all parameters compared with the chemical dosing, especially in DOC removal and at low doses led to a large increase in UV absorbance and colour. Overall, the results have shown that aluminium electrocoagulation performed better than iron electrocoagulation and was more comparable to conventional jar testing. However, both electrocoagulation systems have not shown any improvement over conventional chemical dosing.
Results obtained from electrolysis using titanium electrodes showed an impact on NOM character. Electrolysis appeared to increase the amount of UV insensitive compounds and was confirmed by decreasing SUVA over time. It is believed this is due to the oxidising effect of the chlorine gas formed by the electrolytic process. The increasing amount of low MW compounds formed, however, promoted bacterial growth. Electrolysed water was found have a lower buffering capacity and was, therefore, harder to treat by alum coagulation. However, the processes of coagulation/electroflotation and electrocoagulation/electroflotation were confirmed to be effective as DOC removal techniques.
Several issues associated with the comparison between electrocoagulation and conventional coagulation presented themselves in this study. These issues include precise dosage matching between two sets of experiments; how to unify coagulation timing and dosing method between two techniques; and how to control pH. Additional work is needed in this field, to further identify if specific NOM fractions are responsible for the character change observed. Future studies should examine these issues in depth and find ways to overcome them in order to make better comparisons.
CRC FOR WATER QUALITY AND TREATMENT – RESEARCH REPORT 38
173
4.3.6 References
Bejankiwar RS (2002) Electrochemical treatment of cigarette industry wastewater: feasibility study. Water Research 36(17), 4386-4390.
Chen X, Chen G and Yue PL (2002) Investigation on the electrolysis voltage of electrocoagulation. Chemical Engineering Science 57(13), 2449-2455.
Chow C, Cook D and Drikas M (2001) Laboratory study of conventional alum treatment versus MIEX® treatment for removal of natural organic matter. CRC for Water Quality and Treatment; Proceedings of 19th Federal AWA Convention, April 1-4, 2001, Canberra, Australia.
Ciorba GA, Radovan C, Vlaicu I and Pitulice L (2000) Correlation between organic component and electrode material: consequences on removal of surfactants from wastewater. Electrochimica Acta 46(2-3), 297-303.
Dennett KE, Amirtharajah A, Moran TF and Gould JP (1996) Coagulation: Its effect on organic matter. Journal of American Water Works Association 88(4), 129-142.
Dentel SK and Gossett JM (1988) Mechanisms of coagulation with aluminium salts. Journal of American Water Works Association 80(4), 187-198.
Gregor JE, Nokes CJ and Fenton E (1997) Optimising natural organic matter removal from low turbidity waters by controlled pH adjustment of aluminium coagulation. Water Research 31(12), 2949-2958.
Huang C and Shiu H (1996) Interactions between alum and organics in coagulation. Colloids and Surfaces. A: Physicochemical and Engineering Aspects 113(1-2), 155-163.
Hundt T and O’Melia CR (1988) Aluminium-fulvic acid interactions: mechanisms and applications. Journal of American Water Works Association 80(4), 176-186.
Jacangelo JG, DeMarco J, Owen DM and Randtke SJ (1995) Selected processes for removing NOM: an overview. Journal of American Water Works Association 87(1), 64-77.
Jekel MR (1986) Interactions of humic acids and aluminium salts in the flocculation process. Water Research 20(12), 1535-1542.
Jiang JQ, Graham N, Andre C, Kelsall GH and Brandon N (2002) Laboratory study of electro-coagulation-flotation for water treatment. Water Research 36(16), 4064-4078.
Mameri N, Yeddou AR, Lounici H, Belhocine D, Grib H, Bariou B (1998) Defluoridation of septentrional Sahara water of North Africa by electrocoagulation process using bipolar aluminium electrodes. Water Research 32(5), 1604-1612.
Matteson MJ, Dobson RL, Glenn RW, Kukunoor NS, Waits III WH and Clayfield EJ (1995) Electrocoagulation and separation of aqueous suspensions of ultrafine particles. Colloids and Surfaces. A. Physicochemical and Engineering Aspects 104(1), 101-109.
Mills D (2000) A new process for electrocoagulation. Journal of American Water Works Association 92(6), 34-43.
Mollah MYA, Schennach R, Parga JR and Cocke DL (2001) Electrocoagulation (EC) – science and applications. Journal of Hazardous Materials 84(1), 29-41.
Owen DM, Amy GL, Chowdhury ZK and Viscosil K (1995) NOM characterization and treatability. Journal of American Water Works Association 87(1), 46-63.
Randtke SJ (1988) Organic contaminant removal by coagulation and related process combinations. Journal of American Water Works Association 80(5), 40-56.
Xiong Y, He C, Karlsson HT and Zhu X (2003) Performance of three-phase three-dimensional electrode reactor for the reduction of COD in simulated wastewater-containing phenol. Chemosphere 50(1), 131-136.
Xiong Y, Strunk PK, Xia H, Zhu X and Karlsson HT (2001) Treatment of dye wastewater containing acid orange II using a cell with three-phase three-dimensional electrode. Water Research 35(17), 4226-4230.
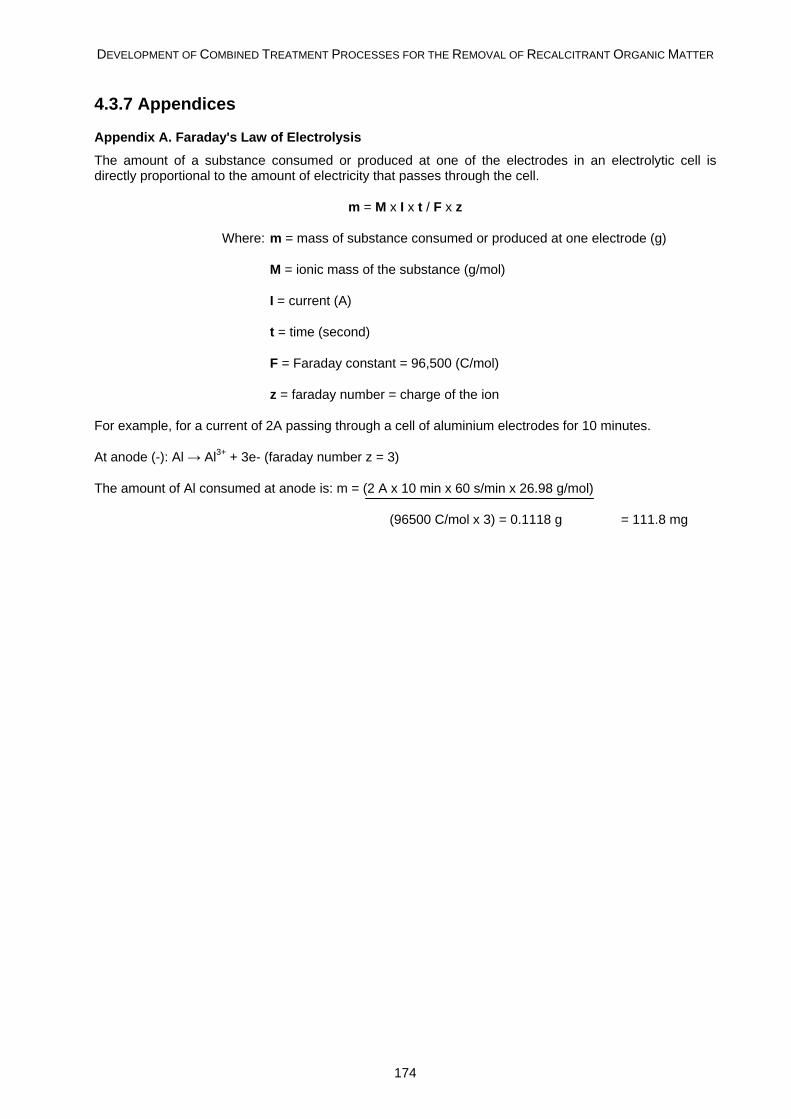
DEVELOPMENT OF COMBINED TREATMENT PROCESSES FOR THE REMOVAL OF RECALCITRANT ORGANIC MATTER
174
4.3.7 Appendices
Appendix A. Faraday's Law of Electrolysis
The amount of a substance consumed or produced at one of the electrodes in an electrolytic cell is directly proportional to the amount of electricity that passes through the cell.
m = M x I x t / F x z
Where: m = mass of substance consumed or produced at one electrode (g)
M = ionic mass of the substance (g/mol)
I = current (A)
t = time (second)
F = Faraday constant = 96,500 (C/mol)
z = faraday number = charge of the ion
For example, for a current of 2A passing through a cell of aluminium electrodes for 10 minutes.
At anode (-): Al → Al3+ + 3e- (faraday number z = 3)
The amount of Al consumed at anode is: m = (2 A x 10 min x 60 s/min x 26.98 g/mol)
(96500 C/mol x 3) = 0.1118 g = 111.8 mg
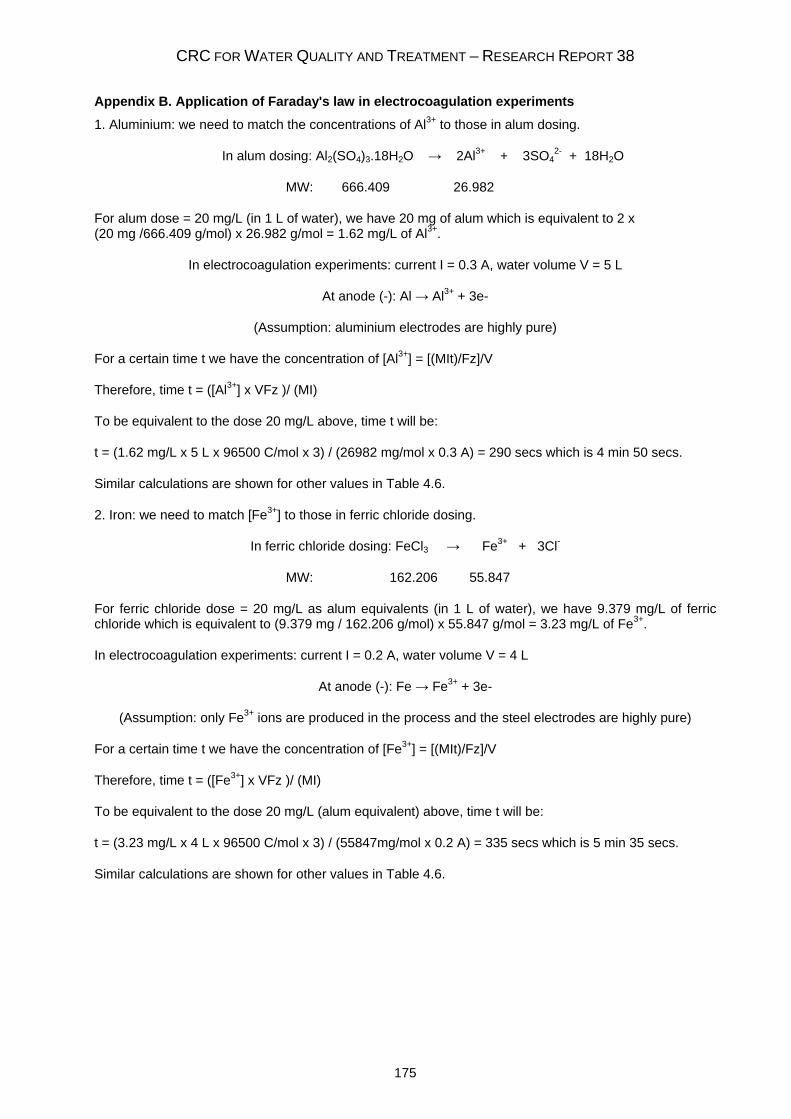
CRC FOR WATER QUALITY AND TREATMENT – RESEARCH REPORT 38
175
Appendix B. Application of Faraday's law in electrocoagulation experiments
1. Aluminium: we need to match the concentrations of Al3+ to those in alum dosing.
In alum dosing: Al2(SO4)3.18H2O → 2Al3+ + 3SO42- + 18H2O
MW: 666.409 26.982
For alum dose = 20 mg/L (in 1 L of water), we have 20 mg of alum which is equivalent to 2 x (20 mg /666.409 g/mol) x 26.982 g/mol = 1.62 mg/L of Al3+.
In electrocoagulation experiments: current I = 0.3 A, water volume V = 5 L
At anode (-): Al → Al3+ + 3e-
(Assumption: aluminium electrodes are highly pure)
For a certain time t we have the concentration of [Al3+] = [(MIt)/Fz]/V
Therefore, time t = ([Al3+] x VFz )/ (MI)
To be equivalent to the dose 20 mg/L above, time t will be:
t = (1.62 mg/L x 5 L x 96500 C/mol x 3) / (26982 mg/mol x 0.3 A) = 290 secs which is 4 min 50 secs.
Similar calculations are shown for other values in Table 4.6.
2. Iron: we need to match [Fe3+] to those in ferric chloride dosing.
In ferric chloride dosing: FeCl3 → Fe3+ + 3Cl-
MW: 162.206 55.847
For ferric chloride dose = 20 mg/L as alum equivalents (in 1 L of water), we have 9.379 mg/L of ferric chloride which is equivalent to (9.379 mg / 162.206 g/mol) x 55.847 g/mol = 3.23 mg/L of Fe3+.
In electrocoagulation experiments: current I = 0.2 A, water volume V = 4 L
At anode (-): Fe → Fe3+ + 3e-
(Assumption: only Fe3+ ions are produced in the process and the steel electrodes are highly pure)
For a certain time t we have the concentration of [Fe3+] = [(MIt)/Fz]/V
Therefore, time t = ([Fe3+] x VFz )/ (MI)
To be equivalent to the dose 20 mg/L (alum equivalent) above, time t will be:
t = (3.23 mg/L x 4 L x 96500 C/mol x 3) / (55847mg/mol x 0.2 A) = 335 secs which is 5 min 35 secs.
Similar calculations are shown for other values in Table 4.6.
DEVELOPMENT OF COMBINED TREATMENT PROCESSES FOR THE REMOVAL OF RECALCITRANT ORGANIC MATTER
176
CONCLUSIONS AND KEY FINDINGS
Project conclusions
This project focussed on the development of rapid analytical tools to characterise the recalcitrant organics, the development of treatment methods to remove those compounds and methods to limit their impact on membrane processes. The project work could be separated into 4 interrelated sections; characterisation techniques and applications, advancement in established treatment processes, characterisation of organic membrane fouling and techniques to reduce the impact of fouling, and investigation of novel treatments for improved recalcitrant NOM removal.
Over the course of the project, several advanced NOM characterisation techniques were developed or refined to aid in understanding the changes produced by the various treatment methods investigated as part of the project milestones.
It was found that in water sources investigated, seasonal increases in organic carbon were mainly due to an increase of the very hydrophobic acids (VHA) fraction. This fraction typically has the characteristic of being easily removed by alum treatment. For the treatment plant results, VHA concentration correlated well with specific alum demand, a parameter used to assess DOC removal per alum dose applied, and the applied alum dose. The use of the rapid fractionation technique to study the impact of organic character on disinfection was also very successful. The chorine demand was shown to correlate better with the VHA fraction concentration than with more traditional water quality parameters such as DOC and UV.
Several liquid chromatographic techniques were investigated over the course of the project in an attempt to advance the use of rapid NOM characterisation methods using existing equipment and adaptations of published methods. Reverse phase HPLC was investigated for the ability to determine hydrophobic/hydrophilic ratios for dissolved organic matter in a rapid and reproducible manner. Method developments identified that the obtained results were highly dependent on the order of application of the phase eluents and the pH of the aqueous phase. Investigations of experimental data using reverse phase HPLC were ceased early in the project lifetime due to unresolved issues with interpretation concerning the identity of the peaks and reproducibility. At this time, the newly developed rapid fractionation technique proved capable of providing related data of greater significance to water treatment processes, did not suffer the problems with selectivity of UV absorbance for NOM and was more reproducible. Delta high performance size exclusion chromatography (ΔHPSEC) is not an analysis method but simply a processing method that allows partitioning of chromatograms to highlight the effects of a process. Delta HPSEC has been applied throughout the project on a variety of experimental data. The power of ΔHPSEC lies in the ability to provide clear visualisation of process changes. As this processing technique may be used with any HPSEC chromatograms, including archived data, new applications will continue to be discovered to aid in interpretation of results in future projects. A HPSEC-UV-DOC system developed in a related CRC project (2.3.1.1) was calibrated in several system responses such as non dispersive infra red (NDIR) mV to mg/L DOC, retention time to apparent molecular weight and time delay between UV detection and DOC detection. In addition, the oxidation efficiency of the DOC detector was evaluated using pure organic carbon sources of varied ease of oxidation. Results indicated that the NDIR response was very stable and calibration with DOC standards showed linear response (R2=0.9934) with interpolation passing through the origin. The aim of producing results for an environmental sample that was calibrated for all responses was accomplished, although issues with the optimisation of the running conditions created problems of elevated DOC baseline and resolution that could not be resolved as part of this investigation. Evaluation of the oxidation efficiency of the DOC detector identified that significant variability in response for organic carbon sources undermined the use of DOC detection as a purely quantitative technique. It was shown that variations in oxidation efficiency produced results that were different, but just as selective as the effect of specific UV absorbance on UV detection. Further work is yet required to develop the HPSEC-UV-DOC analyser into a powerful tool for simultaneous qualitative and quantitative analysis of NOM.
Regardless of the highly variable numerical results, the bacterial regrowth potential (BRP) investigations have highlighted the need to revise the concept of what constitutes a representative blank sample for comparison of results. It would seem that to determine the real effect of treatment on AOC and hence BRP, the original sample must be processed through an identical procedure to allow for unavoidable contamination and environmental effects. Additional testing to determine a statistically viable ‘correction factor’ may be possible for selected water sources, however for more general samples, changes to
CRC FOR WATER QUALITY AND TREATMENT – RESEARCH REPORT 38
177
procedures may be the most effective option to increase the accuracy and applicability of the BRP technique for water quality research.
Norwegian water sources have typically been popular for NOM characterisation in Europe due to their wide variation of character including several strongly humic waters with high DOC concentrations. However comparison with source waters outside Europe is limited. As a component of this project, 10 water sources from both Norway and Australia were evaluated for NOM character, treatability and disinfection by-product (DBP) formation. Results indicated that source water organic character was not greatly varied between the two countries and could be partitioned based more on their treatment process rather than country of origin. The rapid fractionation technique demonstrated the ability to differentiate the treatment processes which were not necessarily optimised for DOC removal. The reactivity with chlorine as well as trihalomethane formation potential (THMFP) of the treated waters showed differences in behaviour between Norwegian and Australian waters including significant impact due to the presence of bromide, highlighting the importance of NOM reduction strategies in reducing DBPs. The change in polydispersity (Δρ), a parameter derived from molecular weight distribution determination by size exclusion chromatography, successfully partitioned the treatments that were effective for DOC removal. Overall, organic characterisation techniques showed usefulness in comparison of source waters and water treatment processes.
Some of the most easily implemented improvements to traditional water treatment practices would include adaptations of existing technologies. An important component of this project was the investigation of improvements in coagulants and application of activated carbon that would not require extensive modification of treatment plant infrastructure but may offer improvements in DOC removal.
Several advanced inorganic coagulants have emerged in recent times, largely based on pre-polymerised solutions of simple inorganic coagulants. In this work, a commercial poly-ferric sulphate (PFS) was compared with the most commonly used inorganic coagulants, aluminium sulphate and ferric chloride. A natural biopolymer, chitosan, formed through the deacetylation of chitin from crab shells, was also evaluated. In evaluating DOC removal, it was clear that once reasonable removal was achieved, manipulation of coagulation pH was more effective than further coagulant addition. When compared at equimolar concentrations, alternative coagulants were found to perform equally for DOC removal as monomeric inorganic coagulants but did not necessarily target, or improve removal of components of concern. Chitosan was not as effective for DOC removal as inorganic coagulants but other advantages made it worthy of further consideration. Despite some advances, current coagulants did not achieve the required improvements to secondary treated water quality parameters in isolation. Further reductions in removal of recalcitrant or problematic organic material were shown to require alternative technologies.
The excellent turbidity removal of chitosan made it worthy of further consideration as part of a multi-step treatment process, however, chitosan was found not to be particularly efficient for DOC removal when applied as the sole treatment step in the water sources tested. In very well treated waters, the ability of chitosan to form flocs in suspension was limited. A combination of treatment technologies, incorporating chitosan coagulation, resulted in slightly increased disinfectant demand and bacterial regrowth potential but did not adversely affect treated water THM concentration. While chitosan is very effective for particle removal at doses far below those required for equivalent performance by inorganic coagulants, there is significant work required to find appropriate strategies to incorporate chitosan in treatment processes for drinking water treatment.
In addition to coagulants, several adsorbent technologies were investigated for their ability to improve DOC removal and more importantly remove the organic matter which remained recalcitrant to conventional treatment processes. Three different powdered activated carbons (PAC) were applied in combination with aluminium sulphate to treat a high DOC source water with a focus on improving NOM removal. Carbon B and C offered equivalent DOC removal but carbon C was considered superior as treated water THMFP was reduced. It is postulated that an organic fraction around 1000 Daltons is responsible for differences in THMFP shown in the treated waters.
In accordance with the lessons learnt throughout the project, the concept of combining complimentary treatments to further diminish water quality problems such as DBPs and bacterial regrowth were pursued. A combined treatment protocol utilising several adsorbent technologies with coagulation was effective for greater than 95 percent reduction of traditional water quality parameters such as turbidity, colour and UV absorbance, with a concurrent reduction of DOC of up to 96 percent at the highest applied PAC and alum doses for two distinctly different Australian drinking water sources. Due to differing mechanisms of NOM
DEVELOPMENT OF COMBINED TREATMENT PROCESSES FOR THE REMOVAL OF RECALCITRANT ORGANIC MATTER
178
removal, the technologies applied were complimentary to each other in removing DOC of all molecular weight ranges, including material that is typically recalcitrant to traditional coagulation processes. As a result, secondary water quality parameters such as DBP formation, represented by THMFP, greatly reduced (up to 97 percent), however BRP appeared to increase after treatment.
As a potentially powerful technology for water treatment, there was considerable focus within the project in investigating membrane filtration and specifically the significant impact that NOM in the water source has on the filtration properties.
NOM is ubiquitous in the aquatic environment and its presence is known to lead to fouling of low-pressure microfiltration and ultrafiltration, and high-pressure nanofiltration and reverse osmosis membranes alike. The extent of membrane fouling based on water quality measurements is difficult to estimate, and much research has taken place to understand the phenomenon that adds considerably to the operating costs and reduces the productivity of membrane systems. The use of pre-treatments such as coagulation using a novel coagulant to reduce membrane fouling were also investigated.
The NOM removal efficiency of polysilicato-iron (PSI) coagulants and the fouling potential of PSI pre-treated waters were studied using two microfiltration (MF) membrane types: polyvinylidene fluoride (PVDF-2) and polypropylene (PP). The results showed that PSI coagulant with a Si/Fe ratio of 1 (PSI-1) was the most effective, compared with conventional coagulants, in removing DOC and in improving the fouling potential. A relative flux of unity through PVDF-2 membrane was achieved for both water sources pretreated with PSI-1.
Aluminium-based coagulants, particularly aluminium chlorohydrate (ACH), worked best at lower coagulant dose. Increasing the coagulant dose to improve DOC removal led to increased membrane fouling, possibly due to increased level of unsettleable flocs and pore blocking. For PSI pre-treatments which produced larger flocs, the advantage of increased DOC removal was not overridden by the adverse effect of pore blocking. In addition, the residual neutral fraction in the waters and/or the presence of a filter cake on the membrane surfaces seemed to have a limiting effect on the flux rates through both PP and PVDF-2 membranes to the extent that similar rates were obtained, despite substantial differences in DOC removal.
In contrast, these limiting factors did not influence the fouling potential of PSI-1 treated waters through the PVDF-2 membrane, as suggested by the relative flux of unity for both water sources. It is suggested that the oxide deposits on the PVDF-2 membrane may act as a ‘screening layer’, limiting direct contact of the membrane with the NOM. This layer may be effectively removed by backwashing, together with deposited NOM, throughout the experiment to maintain the flux at unity. The hydrophobic nature of the PP membrane may discourage the deposition of the oxides, thus minimising the positive effects of the oxides in the system. The high removal of hydrophobic fractions by PSI-1 may also lead to less association between residual NOM and less binding to the membranes, particularly on the PVDF-2 membrane.
An investigation was conducted to evaluate various combined pre-treatment methods for reducing NOM fouling of laboratory scale MF membranes, including treatment with adsorbents such as MIEX® and PAC as well as coagulation with alum. HPSEC was applied to determine molecular weight (MW) distribution and proved to be a simple analytical technique, capable of detecting the onset of fouling by observation of the >50,000 Dalton ‘colloidal’ peak in the water sources examined. Results obtained showed that treatments that reduce the majority of bulk water DOC of all MW ranges, including ‘colloidal’ (very high MW) material successfully prevented short–term fouling of MF, where treatments that removed most of the DOC but did not remove the colloidal components, were unable to prevent fouling.
Over the course of the project, several novel treatment techniques were also investigated. This was conducted primarily in collaboration with other research groups and also through student projects. The techniques were not well represented in the literature with regards to drinking water treatment, identifying a necessity to conduct some preliminary evaluation of their effectiveness for NOM removal.
While the use of ultrasound as an advanced oxidation technique has shown potential in the treatment of dissolved organic materials, especially in process wastewaters, the conditions required for effective and economic treatment are not easily achieved. For the two sonicator probe instruments applied in this investigation, the effective conditions were not achievable within the limited timeframe of the investigation and therefore no discernable effects were observed for treatment of natural organic matter. Based on the literature, the use of a higher frequency instrument as well as refinement of the application methodology
CRC FOR WATER QUALITY AND TREATMENT – RESEARCH REPORT 38
179
may produce a viable technology for treatment of water for NOM removal, however this could not be investigated within this project.
The use of nanotechnologies in water treatment for the removal of NOM is a relatively new application concept. Using simple self-assembled monolayer (SAM) techniques, a silica substrate was modified as an adsorbent and tested for its potential for use in reduction of water quality parameters such as UV absorbance, colour and DOC. Silica particles that were coated with an amino-siloxane SAM (NH2-SAM) were evaluated in both a high surface area powder form and also a more practical granular sand form. Initial results using direct stirred contact with powdered NH2-SAM showed promising results with 60% reduction of UV254 after 1 hour and up to 70% removal of DOC with higher doses and contact times. NH2-SAM powder removed NOM in a broader and less selective MW range than coagulation treatment and this removal was enhanced by pH control at 6, especially for medium MW components. When NH2-SAM sand was applied, the significantly reduced effective surface area resulted in lesser DOC removal but colour removal was still considerable for realistic treatment plant contact times. Attempted regeneration with acidic solutions showed greater effectiveness at lower applied pH; however recovery of adsorption capacity reduced with successive adsorption/regeneration cycles highlighting the need for further refinement of operating conditions for more effective application of this relatively simple water treatment technology.
Using a simple laboratory scale method developed for this study, electrocoagulation has not shown any improvement over the conventional method in removing NOM. In fact, both aluminium and iron electrocoagulation were less effective than chemical dosing in DOC removal at all equivalent doses. Of the two electrode materials (aluminium and iron), the performance of aluminium electrocoagulation was better because faster dissolved aluminium complex formation kinetics allowed flocculation within the jar test time limits, and the increased gas formation at the electrodes produced an efficient flotation effect for floc partitioning. There were more issues associated with iron electrocoagulation, including complicated electrolytic mechanism and longer coagulation/flocculation time. There were also several issues that would be worth considering in future studies for better comparison, including precise matching of dosage, coagulation timing, dosing method and pH control.
This project increased our understanding of the impact of treatment processes on recalcitrant organics and clarified the impact of these organics on the health aspects of drinking water quality. Rapid organic characterisation tools were developed to analyse raw and treated waters to increase our understanding of the treatment process, and to guide plant operators to optimise treatment processes. Developments of better treatments to remove recalcitrant NOM, in the form of add-on process to the existing treatment processes were investigated. Better understanding of which NOM components are major MF foulants was achieved and several possible membrane conditioning process were developed to reduce the rate of MF fouling. While this research project has presented several questions that require future work to investigate, it is believed that the goals of the project were successfully achieved and a better concept of what is required in the future research has been identified.
Key Findings
• A link was identified between very hydrophobic acid (VHA) concentration, determined by rapid fractionation techniques, and treatment performance. Generally, as VHA concentration increases, at the expense of other fractions, the dose required to maintain a set water quality decreases due to the ease of removal by coagulation.
• Better correlation was found between chlorine demand and VHA concentration than with other applied water quality parameters, such as UV254 and DOC concentration.
• A HPSEC with simultaneous UV and DOC detection was applied and calibrated for all instrument responses. Ultimately, issues with DOC analyser hardware may limit the application of this analysis for complex environmental samples.
• Evaluation of the oxidation efficiency of the DOC detector using various organic compounds showed significant variability in response, indicating that care must be taken when assuming that calibration with simple organic compounds will translate to accurate calibration for real samples with complex matrices.
• BRP investigations have highlighted the need to revise the concept of what constitutes a representative blank sample for comparison of results. Changes to procedures may be the most effective option to increase the accuracy and applicability of the BRP technique for water quality research.
• In a comparison of Australian and Norwegian drinking water sources, it was shown that source water character was not distinctly different between selected Norwegian and Australian source waters.
DEVELOPMENT OF COMBINED TREATMENT PROCESSES FOR THE REMOVAL OF RECALCITRANT ORGANIC MATTER
180
• Using the rapid fractionation technique, it was shown to be possible to identify treatment processes that were not optimised by comparing character fraction concentrations before and after treatment.
• A relationship was identified between higher molecular weight material in the treated water and higher specific chlorine demand.
• Advanced polymeric coagulants performed equivalently to monomeric coagulants for DOC removal and hence secondary water quality parameters such as chlorine demand, THM formation and BRP were reduced.
• Chitosan showed limited application for DOC removal when compared to inorganic coagulants but showed excellent turbidity removal at low applied doses.
• When combined with effective DOC removal technologies such as MIEX® and activated carbon, chitosan was no longer effective for turbidity removal due to a lack of humic acids that aid in the mechanism of floc binding.
• An activated carbon with a wide range of pore diameters was shown to be most effective for NOM removal which resulted in lower THMFP.
• A combined treatment protocol utilising MIEX®, activated carbon and alum reduced turbidity, colour, UV254 and DOC by up to 96% in 2 different drinking water sources and reduced THMFP by between 90 and 97%.
• PES and hydrophobic PVDF ultrafiltration membranes showed rapid short term fouling and resistance to backwashing. Hydrophilic PVDF and PP membranes showed slower rates of fouling; however PP recovered less flux after backwashing.
• Using hydrophilic PVDF, flux recoveries following backwashing were dramatically different for Meredith and Bendigo waters. It was suggested that 2 different characters of the fouling material were responsible, with the colloidal material forming a cake and small molecular weight organic acids and proteins acting to ‘glue’ the cake together, causing resistance to backwashing.
• Backwashing of the membranes was shown to reduce the influence of NOM concentration on the fouling rate, as the flux values after backwashing were largely independent of NOM concentration.
• Alum coagulation prior to filtration significantly increased the efficiency of backwashing for hydrophilic membranes, but had no discernable effect on the backwashing efficiency of the hydrophobic membranes.
• The PSI-1 pre-treatment of both Ouyen and Meredith water sources resulted in better DOC removal and UV254 removal, compared to those obtained with aluminium-based coagulants.
• For both PVDF and PP membranes, PSI-1 treated waters resulted in higher relative fluxes compared to aluminium coagulated waters due to larger flocs which reduced the impact of pore blocking mechanisms.
• Residual neutral hydrophilic material has a large influence on membrane fouling regardless of how much bulk DOC is removed by pre-treatment.
• Treatments that reduce significant DOC, including the high molecular weight colloidal material, successfully prevented short term fouling of hydrophobic PVDF microfiltration membranes. Treatments that reduce significant DOC but cannot remove the colloidal material do not prevent fouling.
• HPSEC is a simple, non-destructive technique to observe the onset of colloidal organic fouling and aided in the identification of colloidal materials in fouling of microfiltration membranes.
• Conventional power sonolysis was not found to be effective for reduction of NOM in drinking water treatment or for the improving the amenity of NOM for removal by other treatment processes.
• NH2-SAM powder removed NOM in a broader and less selective MW range than coagulation treatment and this removal was enhanced by pH control at 6, especially for medium MW components.
• Due to significantly reduced surface area, NH2-SAM sand was less effective than powder and was easily saturated and demonstrated reduced adsorption capacity after regeneration cycles.
• Electrocoagulation using aluminium electrodes showed equivalent performance to alum dosing except for DOC removal due to a lack of sweep flocculation mechanisms. Iron electrocoagulation was less effective than ferric chloride dosing for all water quality parameters as at sub-critical doses, ferric coagulants significantly increase UV254 and colour and slower flocculation kinetics necessitated longer settling times.
• Electrolysis of raw waters with inert electrodes showed a decrease in treated water SUVA due to the oxidising action of chlorine generated within the process. As a result, buffering capacity decreased and the proportion of recalcitrant DOC increased making subsequent treatments less effective.
CRC FOR WATER QUALITY AND TREATMENT – RESEARCH REPORT 38
181
REFERENCES
Abbt-Braun G and Frimmel FH (1999) Basic characterization of Norwegian NOM samples - Similarities and differences. Environment International 25(2-3), 161-180.
Afcharian A, Levi Y, Kiene L and Scribe P (1997) Fractionation of dissolved organic matter from surface waters using macroporous resins. Water. Research 31(12), 2989-2996.
Alberts JJ and Takács M (1999) Characterization of natural organic matter from eight Norwegian surface waters: The effect of ash on molecular size distributions and CHN content. Environment International 25(2-3), 237-244.
Allpike B, Joll C, Heitz A, Kagi R, Slunjski M, Smith P and Tattersall J (2003) Size exclusion chromatography as a tool for examination of drinking water treatment processes, OzWater Conference, AWA, Perth, Australia, oz140.
Allpike BP, Heitz A, Joll CA and Kagi RI (2006) Development of an organic carbon detector for size exclusion chromatography, Proceedings, Combined National Conference of the Australian Organic Geochemists and the NOM Interest Group, Rottnest Island, Perth, WA (2006) pp. 30-31.
Allpike BP, Heitz A, Joll CA, Kagi RI, Abbt-Braun G, Frimmel FH, Brinkmann T, Her N and Amy G (2005) Size Exclusion Chromatography to Characterize DOC Removal in Drinking Water Treatment. Environmental Science & Technology 39(7), 2334-2342.
Amy G (2004). Size exclusion chromatography (SEC) with multiple detectors: A powerful tool in treatment process selection and performance monitoring. IWA Natural organic matter research: Innovations and applications for drinking water, Whalers Inn, victor Harbour, SA, March 2-5, (http://www.waterquality.crc.org.au/nom/NOM_conference/NOM_conference_website.htm)
Amy G and Cho J (1999). Interactions between natural organic matter (NOM) and membranes: Rejection and fouling. Water Science & Technology 40(9), 131-139.
Amy G, Cho J, Yoon Y, Wright S, Clark MM, Molis E, Combe C, Wang Y, Lucas P, Lee Y, Kumar M, Howe K, Kim K-S, Pelligrino J and Irvine S (2001). NOM rejection by, and fouling of, NF and UF membranes. AwwaRF Report, AWWA Research Foundation, Denver.
APHA, AWWA and WEF 1998 Standard Methods For The Examination of Water and Waste Water, 20th Edition, American Public Health Association, Washington, DC.
Bejankiwar RS (2002) Electrochemical treatment of cigarette industry wastewater: feasibility study. Water Research 37(17), 4386-4390.
Bennett LE and Drikas M (1993) The evaluation of colour in natural waters. Water Research 27(7), 1209-1218.
Bolto B, Dixon D, Eldridge R, King S, Toifl M (1998) The use of cationic polymers as primary coagulants in water treatment, in Chemical Water and Wastewater Treatment V, eds. H.H. Hahn, E. Hoffman and H. Odegaard, Springer, Berlin, pp. 171-185.
Bolto B, Abbt-Braum G, Dixon D, Eldridge R, Frimmel F, Hesse S, King S and Toifl M 1999 Experimental evaluation of cationic polyelectrolytes for removing natural organic matter from water. Water Science and Technology 40(9), 71-79.
Bolto B, Dixon D, Eldridge R and King S (2001) Cationic polymer and clay or metal oxide combinations for natural organic matter removal. Water Research 35(11), 2669-2676.
Bratskaya S, Schwarz S and Chervonetsky D (2004) Comparative study of humic acids flocculation with chitosan hydrochloride and chitosan glutamate. Water Research 38(12), 2955-2961.
Buchanan W, Roddick F, Porter N and Drikas M (2005) Fractionation of UV and VUV pretreated natural organic matter from drinking water. Environmental Science & Technology 39(12), 4647-4654.
Bunker BC, Rieke PC, Tarasevich BJ, Campbell AA, Fryxell GE, Graff GL, Song L, Liu J, Virden JW and McVay GL (1994) Ceramic Thin-Film Formation on Functionalized Interfaces Through Biomimetic Processing. Science 264(5155), 48-55.
Calvert P and Rieke P (1996) Biomimetic Mineralization in and on Polymers. Chemistry of Materials 8(8), 1715-1727.
Carroll (1999), Personal communication Carroll T, King S, Gray SR, Bolto BA and Booker NA, (2000) The fouling of microfiltration membranes by
NOM after coagulation treatment. Water Research 34(11), 2861-2868. Cathalifaud G, Ayele J and Mazet M (1998) Aluminium Effect upon Adsorption of Natural Fulvic Acids
onto PAC. Water Research 32(8), 2325-2334.
DEVELOPMENT OF COMBINED TREATMENT PROCESSES FOR THE REMOVAL OF RECALCITRANT ORGANIC MATTER
182
Chang Y and Benjamin M M (1996) Iron oxide adsorption and UF to remove NOM and control fouling. Journal of American Water Works Association 88(12), 74-88.
Chemat F, Teunissen PGM, Chemat S and Bartels PV (2001) Sono-oxidation treatment of humic substances in drinking water. Ultrasonics Sonochemistry 8(3), 247-250.
Chen X, Chen G, Yue PL (2002) Investigation on the electrolysis voltage of electrocoagulation. Chemical Engineering Science 57, 2449-2455.
Cheng WP (2002) Comparison of Hydrolysis/Coagulation behavior of polymeric and monomeric iron coagulants in humic acid solution. Chemosphere 47, 963-969.
Cheng WP and Chi FH (2002) A study of Coagulation Mechanisms of Polyferric sulphate reacting with Humic acid using a Flourescence-quenching method. Water Research 36, 4583-4591.
Chin YP, Aiken G and O'Loughlin E 1994 Molecular weight, polydispersity and spectroscopic properties of aquatic humic substances. Environmental Science & Technology 28(11), 1853-1858.
Chiou MS and Li HY (2003) Adsorption behaviour of reactive dye in aqueous solution on chemical cross-linked chitosan beads. Chemosphere, 50(8), 1095-1105.
Cho J, Amy G and Pellegrino J (2000) Membrane filtration of natural organic matter: factors and mechanisms affecting rejection and flux decline with charged ultrafiltration (UF) membrane. Journal of Membrane Science 164(1), 89-110.
Cho J, Amy G, Pelligrino J and Yoon Y (1998) Characterisation of clean and natural organic matter fouled NF and UF membranes. Desalination 118, 101-108.
Cho M-H, Lee C-H and Lee S (2005) Influence of floc structure on membrane permeability in the coagulation-MF process. Water Science & Technology 51(6-7), 143-150.
Chow C, Fabris R, Wilkinson K, Fitzgerald F and Drikas M (2006) Characterising NOM to assess treatability. AWA Water Journal 33(2) 74-85.
Chow CWK, Fabris R, Drikas M and Holmes M (2005) A case study of treatment performance and organic character. Journal of Water Supply: Research and Technology – AQUA 54(6), 385-395.
Chow C (2001) Enhanced Coagulation for Removal of NOM. CRCWQT NOM Technology Transfer Workshop, March 22, 2001, Adelaide.
Chow C, Cook D and Drikas M (2001b) Evaluation of Magnetic Ion Exchange Resin (MIEX®) and Alum Treatment for Formation of Disinfection By-Products and Bacterial Regrowth, IWA 2nd World Water Congress, 15-19 October 2001, Berlin, Germany.
Chow C, Cook D and Drikas M (2001) Laboratory Study of Conventional Alum Treatment versus MIEX® Treatment for Removal of Natural Organic Matter. CRC for Water Quality and Treatment; Proceedings of 19th Federal AWA Convention, April 1-4, 2001, Canberra, Australia. (CD-ROM)
Chow CWK, Fabris R and Drikas M (2004) A Rapid Fractionation Technique to Characterise Natural Organic Matter for the Optimisation of Water Treatment Processes. Journal of Water Supply: Research and Technology – AQUA 53(2), 85-92.
Chow CWK, van Leeuwen JA, Drikas M, Fabris R, Spark KM and Page DW (1999) The Impact of the Character of Natural Organic Matter in Conventional Treatment with Alum. Water Science & Technology 40(9), 97-104.
Chow CWK, van Leeuwen JA, Fabris R, King S, Withers N, Spark KM and Drikas M (2000) Enhanced coagulation for removal of dissolved organic carbon with alum - A fractionation approach. Proceedings of the 3rd AWWA WaterTECH Conference, Sydney, NSW.
Chung YC, Wang HL, Chen YM and Li SL (2003) Effect of abiotic factors on the antibacterial activity of chitosan against waterbourne pathogens. Bioresource Technology 88(3), 179-184.
Ciorba GA, Radovan C, Vlaicu I, Pitulice L (2000) Correlation between organic component and electrode material: consequences on removal of surfactants from wastewater. Electrochimica Acta 46, 297-303.
Clarke MM (2004) ACS Annual Meeting, Philadelphia Collins RJ and Sukenik C N (1995) Sulfonate-Functionalized, Siloxane-Anchored, Self-Assembled
Monolayers. Langmuir 11, 2322-2324. Cook D, Chow C and Drikas M (2001) A Laboratory Study of Conventional Alum Treatment versus MIEX®
Treatment for the Removal of Natural Organic Matter, 19th Federal Convention, April 1 - 4, 2001, Australian Water Association, Canberra.
Croue J-P, Martin B, Deguin A and Legube B (1994) Isolation and characterisation of dissolved hydrophobic and hydrophilic organic substances of a reservoir water, natural organic matter in drinking water. American Water Works Association, Denver, p. 73.
CRC FOR WATER QUALITY AND TREATMENT – RESEARCH REPORT 38
183
Croue J-P, Lefebvre E, Martin B and Legube B (1993) Removal of dissolved hydrophobic and hydrophilic organic substances during coagulation/flocculation of surface waters. Water Science & Technology 27(11), 143-152.
Croué J-P (2004) Isolation of humic and non-humic NOM fractions: Structural characterisation. Environmental Monitoring & Assessment 92, 193-207.
Crozes G, White P and Marshall M (1995) Enhanced Coagulation: Its Effect on NOM Removal and Chemical Costs. Journal of the American Water Works Association 87(1), 78-89.
Dennett KE, Amirtharajah A, Moran TF, Gould JP (1996) Coagulation: Its Effect on Organic Matter. Journal of the American Water Works Association 88(4), 129-142.
Dentel SK and Gossett JM (1988) Mechanisms of Coagulation with Aluminium Salts. Journal of the American Water Works Association 80(4), 187-198.
Diaz A, Rincon N, Escorihuela A, Fernandez N, Chachin E and Forster CF (1999) A preliminary evaluation of turbidity removal by natural coagulants indigenous to Venezuela. Process Biochemistry 35(3-4), 391-395.
Divakaran R and Pillai VNS (2001) Flocculation of Kaolinite Suspensions in Water by Chitosan. Water Research, 35(16), 3904-3908.
Divakaran R and Pillai VNS (2002) Flocculation of River silt using Chitosan. Water Research, 36, 2414-2418.
Divakaran R and Pillai VNS (2004) Mechanism of kaolinite and titanium dioxide flocculation using chitosan – assistance by fulvic acids? Water Research 38(8), 2135-2143.
Donald Mills (2000) A New Process for Electrocoagulation. Journal of the American Water Works Association 92(6), 34-43.
Drikas M, Chow CWK and Cook D (2003) The impact of recalcitrant organic character on disinfection stability, trihalomethane formation and bacterial regrowth: An evaluation of magnetic ion exchange resin (MIEX®) and alum coagulation. Journal of Water Supply: Research and Technology – Aqua, 52(7), 475-487.
Dryfuse MJ, Miltner RJ and Summers RS (1995) The removal of molecular size and humic/non-humic fractions of DBP precursors by optimising coagulation. In Proceedings of the AWWA Annual conference, Anaheim, California, pp217-241
Edwards M (1997) Predicting DOC removal during enhanced coagulation. Journal of the American Water Works Association, 89(5), 78-89.
Edzwald JK (1993) Coagulation in drinking water treatment: Particles, organics and coagulants. Water Science & Technology 27(11), 21-35.
Edzwald JK, Becker WC and Wattier KL (1985) Surrogate parameters for monitoring organic matter and THM precursors. Journal of the American Water Works Association 77(4), 122-132.
Egeberg PK, Christy AA and Eikenes M (2002) The molecular size of natural organic matter (NOM) by diffusimetry and seven other methods. Water Research 36, 925-932.
Egeberg PK, Eikenes M and Gjessing ET (1999) Organic nitrogen distribution in NOM size classes. Environment International 25(2-3), 225-236.
Eikebrokk B (1999) Coagulation-direct filtration of soft, low alkalinity humic waters. Water Science & Technology 40(9), 55-62.
Eikebrokk B and Saltnes T (2002) NOM Removal from Drinking water by Chitosan coagulation and Filtration through lightweight expanded clay aggregate filters. Journal of Water Supply: Research and Technology – Aqua, 51(6), 323-332
Eikebrokk B, Vogt RD and Liltved H (2004) NOM increases in Northern European source waters: Discussion of possible causes and impacts on coagulation/contact filtration processes. Water Science & Technology: Water Supply 4(4), 47-54.
Fabris R, Chow C and Drikas M (2004) Practical application of a combined treatment process for removal of recalcitrant NOM – Alum and PAC. Water Science & Technology: Water Supply 4(4), 89–94.
Fabris R, Chow C and Drikas M (2003) The Impact of Coagulant Type on NOM Removal. 20th convention of the AWA. Proceedings. 6-10 April 2003, Perth, Australia.
Fabris R, Chow CWK and Drikas M (2006) Combined treatments for enhanced natural organic matter (NOM) removal. Proceedings of Enviro 06 Conference, Melbourne, Australia, 9-11th May 2006, paper e6174, CD-ROM and www.enviroaust.net/e6/papers/e6174.pdf.
DEVELOPMENT OF COMBINED TREATMENT PROCESSES FOR THE REMOVAL OF RECALCITRANT ORGANIC MATTER
184
Fan L Harris JL, Roddick FA and Booker NA (2000) Fouling performance during microfiltration of an aquatic dissolved organic matter. Chemeca 2000, RACI, IEAust, IchemE, Perth, Western Australia, 9-12 July, 2000.
Fan L, Harris JL, Roddick FA and Booker NA (2001b) Identification of the components in surface water NOM causing fouling of microfiltration membranes. 6th World Congress of Chemical Engineering, Melbourne.
Fan L, Harris J, Roddick F and Booker N (2002) Fouling of microfiltration membranes by the fractional components of natural organic matter in surface water. Water Science & Technology: Water Supply 2(5-6), 313-320.
Fan L, Harris JL, Roddick FA and Booker NA (2001a) Influence of the Characteristics of Natural Organic Matter on the Fouling of Microfiltration Membranes. Water Research 35(18), 4455-4463.
Fang HHP and Shi X (2005) Pore fouling of microfiltration membranes by activated sludge. Journal of Membrane Science 264(1-2), 161-166.
Farahbakhsh K, Svrcek C, Guest R K and Smith DW (2004). A review of the impact of chemical pre-treatment on low-pressure water treatment membranes. Journal of Environmental Engineering and Science 3, 237-253.
Fendler JH (1997) Biomineralization inspired preparation of nanoparticles and nanoparticulate films. Current Opinion in Solid State & Materials Science 2(3), 365-369.
Fitzgerald F, Chow C and Holmes M (2006) Disinfectant Demand Prediction using Surrogate Parameters - A Tool to Improve Disinfection Control. Journal of Water Supply: Research and Technology – AQUA 55(6), 391-400.
Frimmel FH (1998) Impact of light on the properties of aquatic natural organic matter. Environment International 24(5-6), 559-571.
Galjaard G, Kruithof JC, and Kamp PC (2005) Influence of NOM and membrane surface charge on UF membrane fouling. Membrane Technology Conference, AWWA, March 6-9, Phoenix, Arizona
Ganjidoust H, Tatsumi K, Yamagishi T and Gholian RN (1997) Effect of synthetic and natural coagulant on lignin removal from pulp and paper wastewater. Water Science & Technology 35(2-3), 291-296.
Gao B, Yue Q and Miao J (2002b) Evaluation of polyaluminium ferric chloride (PAFC) as a composite coagulant for water and wastewater treatment. Water Science & Technology 47(1), 127-132.
Gao BY, Hahn HH and Hoffmann E (2002a) Evaluation of Aluminum-silicate Polymer Composite as a Coagulant for Water Treatment. Water Research 36, 3573-3581.
Gjessing ET, Alberts JJ, Bruchet A, Egeberg PK, Lyderson E, McGowan LB, Mobed JJ, Munster U, Pempkowiak J, Perdue M, Ratnawerra H, Rybacki D, Takacs M and Braun GA (1998) Multi-method characterisation of natural organic matter isolated from water: Characterisation of reverse osmosis-isolates from water of two semi-identical dystrophic lakes basins in Norway. Water Research 32(10), 3108-3124.
Gjessing ET, Egeberg PK and Hakedal J (1999) Natural organic matter in drinking water - The "NOM-typing project", background and basic characteristics of original water samples and NOM isolates. Environment International 25(2-3), 145-159.
Goel S, Hozalski RM and Bouwer EJ (1995) Biodegradation of NOM: Effect of NOM source and ozone dose Journal of the American Water Works Association 87(1), 90-105.
Goslan EH, Fearing DA, Banks J, Wilson D, Hills P, Campbell AT and Parsons SA (2002) Seasonal variations in the disinfection by-product precursor profile of a reservoir water. Journal of Water Supply: Research and Technology – AQUA 51(8), 475-482.
Gray SG, Ritchie CB and Bolto BA (2004) Effect of fractionated NOM on low pressure membrane flux declines. Water Sci. Technol.: Water Supply 4(4), 189-196.
Gray SR, Ritchie CB and Bolto BA (2003) Predicting NOM fouling of low pressure membranes. Proc. Internat. Membrane Sci. & Technol. Conf., Sydney, Paper 203.
Gray S, Tran T, Bolto B and Ritchie C (2005) NOM composition – Effect on microfiltration fouling, AWWA Membrane Technology Conference, Phoenix, Arizona.
Gregor JE, Nokes CJ and Fenton E (1997) Optimising Natural Organic Matter Removal from Low Turbidity Waters by Controlled pH Adjustment of Aluminium Coagulation. Water Research 31(12), 2949-2958.
Gregory J and Dupont V (2001) Properties of flocs produced by water treatment coagulants. Water Science & Technology 44(10), 231-236.
CRC FOR WATER QUALITY AND TREATMENT – RESEARCH REPORT 38
185
Gregory J and Rossi L (2001) Dynamic testing of water treatment coagulants. Water Science & Technology: Water Supply 1(4), 65-72.
Grimm J, Bessarabov D and Sanderson R (1998) Review of electro-assisted methods for water purification. Desalination 115(3), 285-294.
Gu B, Schmitt J, Chen Z, Liang L and McCarthy JF (1995). Adsorption and desorption of different organic matter fractions on iron oxide. Geochimica Et Cosmochimica Acta 59, 219-229.
Hambsch B, Werner P and Frimmel FH (1992) Bacterial Growth Measurements in Treated Waters from Different Origins (Bakterienvermehrungsmessungen in aufbereiteten Wassern verschiedener Herkunft) Acta Hydrochimica et Hydrobiologica (Berlin) AHCBAU 20(1), 9-14 (in German).
Hammes FA and Egli T (2005) New Method for Assimilable Organic Carbon Determination Using Flow-Cytometric Ennumeration and a Natural Microbial Consortium as Innoculum. Environmental Science and Technology 39(9), 3289-3294.
Hasegawa T, Hashimoto K, Onitsuka T, Goto K and Tambo N (1991) Characteristics of metal-polysilicate coagulants, Water Science & Technology 23, 1713-1722.
Hasegawa T, Onitsuka T, Suzuki M, Ehara Y, Hashimoto K, Ozaki T (1990) Method and flocculant for water treatment, United States Patent, 4,923,629
Hashimoto K, Hasegawa T, Onitsuka T, Goto K and Tambo N (1991) Inorganic polymer coagulants of metal-polysilicate complex, Water Supply 9, S65-S70.
Hem LJ and Efraimsen H (2001) Assimilable Organic Carbon in Molecular Weight Fractions of Natural Organic Matter. Water Research 35(4), 1106-1110.
Her N, Amy G, Park HR and Song M (2004) Characterizing algogenic organic matter (AOM) and evaluating associated NF membrane fouling. Water Research 38(6), 1427-1438.
Holmes M and Oemcke D (2002) Optimisation of conventional water treatment processes in Adelaide, South Australia. Proceedings of the IWA 3rd World Water Congress, April 7-12, Paper no. e20132a, Melbourne, Australia.
Hong S and Elimelech M (1997). Chemical and physical aspects of natural organic matter (NOM) fouling of nanofiltration membranes. Journal of Membrane Science 132, 159-181.
Hongve D, Baann J, Becher G and Beckmann O-A (1999) Experiences from operation and regeneration of an anionic exchanger for natural organic matter (NOM) removal. Water Science & Technology 40(9), 215-221.
Howe KJ and Clarke MM (2002) Fouling of microfiltration and ultrafiltration membranes by natural waters. Environmental Science and Technology 36, 3571-3576.
Huang C, Chen S and Pan JR (2000) Optimal Condition for Modification of Chitosan: A Biopolymer for Coagulation of Colloidal Particles. Water Research 34(3), 1057-1062.
Huang C and Shiu H (1996) Interactions between alum and organics in coagulation. Colloids and Surfaces. A: Physicochemical and Engineering Aspects 113, 155-163.
Huang WJ and Yeh HH (1993) Organic Fractionation for Water Treatment Processes Evaluation. Proceedings AWWA Water Technology Conference, New Orleans, November, 1993.
Hundt T and O’Melia CR (1988) Aluminium-Fulvic Acid Interactions: Mechanisms and Applications. Journal of the American Water Works Association 80 (4), 176-186.
Iler RK (1979) The Chemistry of Silica, Wiley, New York. Ince NH, Tezcanli G, Belen RK and Apikyan IG (2001) Ultrasound as a catalyser of aqueous reaction
systems: the state of the art and environmental applications. Applied Catalysis B: Environmental 29(3), 167-176.
Jacangelo JG, DeMarco J, Owen DM and Randtke SJ (1995) Selected Processes for removing NOM: an Overview. Journal of the American Water Works Association 87(1), 64-77.
Jang NY, Watanabe Y, Ozawa G and Hosoya M (2002) Effect of pre-coagulation/sedimentation on the ultrafiltration process, in H.H. Hahn, E. Hoffmann and H. Ødegaard (Ed.), Chemical Water and Wastewater Treatment VII, IWA Publishing, London, 51-58.
Jarusutthirak C, Amy G and Croué J-P (2002) Fouling characteristics of wastewater effluent organic matter (EfOM) isolates on NF and UF membranes. Desalination 145, 247-255
Jekel MR (1986) Interactions of humic acids and aluminium salts in the flocculation process. Water Research 20 (12), 1535-1542.
Jeon C and Höll WH (2003) Chemical modification of chitosan and equilibrium study for mercury ion removal. Water Research 37(19), 4770-4780.
DEVELOPMENT OF COMBINED TREATMENT PROCESSES FOR THE REMOVAL OF RECALCITRANT ORGANIC MATTER
186
Jiang JQ, Graham N, Andre C, Kelsall GH, Brandon N (2002) Laboratory study of electro-coagulation-flotation for water treatment. Water Research 36, 4064-4078.
Jiang J-Q and Graham NJD (1998a) Pre-polymerised inorganic coagulants and Phosphorus Removal by Coagulation - A Review. Water SA, 24(3), 237-244.
Jiang J-Q and Graham NJD (1998b) Observations of the Comparative Hydrolysis/Precipitation behavior of Polyferric sulphate and Ferric sulphate. Water Research, 32(3), 930-935.
Jiang J-Q, Graham NJD and Harward C (1996) Coagulation of Upland Coloured Water with Polyferric Sulphate compared to Conventional Coagulants. Journal of Water Supply: Research and Technology – AQUA 45(3), 143-154.
Jones KL and O’Melia CR (2001) Ultrafiltration of protein and humic substances: effect of solution chemistry on fouling and flux decline. Journal of Membrane Science 193, 163-173.
Jucker C and Clark MM (1994) Adsorption of humic substances on hydrophobic ultrafiltration membranes. Journal of Membrane Science 97, 37-52.
Kavanaugh MC (1978) Modified Coagulation for Improved Removal of Trihalomethane Precursors. Journal of the American Water Works Association 70(11), 613-620.
Kimura K, Hane Y and Watanabe Y (2005) Effect of pre-coagulation on mitigating irreversible fouling during ultrafiltration of a surface water. Water Science & Technology 51(6-7), 93-100.
Kimura K, Hane Y, Watanabe Y, Amy G and Ohkuma N (2004) Irreversible membrane fouling during ultrafiltration of surface water. Water Research 38, 3431-3441.
Korshin GV, Benjamin MM and Sletten RS (1997) Adsorption of natural organic matter (NOM) on iron oxide: Effects on NOM composition and formation of organo-halide compounds during chlorination. Water Research 31(7), 1643-1650.
Korshin GV, Li CW and Benjamin MM (1997) Monitoring the properties of natural organic matter through UV spectroscopy: A consistent theory. Water Research 31(7), 1787-1795.
Krasner SW and Amy G (1995) Jar-test evaluations of enhanced coagulation. Journal of the American Water Works Association 87(10), 93-107.
Kwon B, Lee S, Cho J, Ahn H, Lee D and Shin HS (2005) Biodegradability, DBP formation and membrane fouling potential of natural organic matter: Characterisation and controllability. Environmental Science and Technology 39(3), 732-739.
Laîné JM, Hagstrom JP, Clark MM and Mallevialle J (1989) Effects of Ultrafiltration Membrane Composition. Journal of the American Water Works Association 11(11), 61-57.
Lange R, Tattersall J, Botica C, Smith P (2001) Design and Construction of the world's first large scale MIEX® water treatment plant, 19th Federal Convention, April 1 - 4, 2001, Australian Water Association, Canberra.
Lead JR, Balnois E, Hosse M, Menghetti R and Wilkinson KJ (1999) Characterization of Norwegian natural organic matter: Size, diffusion coefficients, and electrophoretic mobilities. Environment International 25(2-3), 245-258.
LeChevallier MW, Shulz W and Lee RG (1991) Bacterial nutrients in drinking water. Applied and Environmental Microbiology 57, 857–862.
Lee K-W, Choo K-H, Choi S-J and Yamamoto K (2002) Development of an integrated iron oxide adsorption/membrane separation system for water treatment, Water Science & Technology: Water Supply 2(5-6), 293-300.
Lee N, Amy G, Croue J-P and Buisson H (2004) Identification and understanding of fouling in low-pressure membrane (MF/UF) by natural organic matter (NOM). Water Research 38(20), 4511-4523.
Leenheer JA (1981) Comprehensive approach to preparative isolation and fractionation of dissolved organic carbon from natural waters and wastewaters. Environmental Science & Technology 15(5), 578-587.
Leenheer JA (2004) Comprehensive assessment of precursors, diagenesis, and reactivity to water treatment of dissolved and colloidal organic matter. Water Science & Technology: Water Supply 4(4), 1-9.
Leiknes T, Odegaard H and Myklebust H (2004) Removal of natural organic matter (NOM) in drinking water treatment by coagulation-microfiltration using metal membranes. Journal of Membrane Science 242(1-2), 47-55.
Lesko T, Colussi AJ and Hoffmann MR (2006) Sonochemical decomposition of phenol: evidence for a synergistic effect of ozone and ultrasound for the elimination of total organic carbon. Water Science & Technology: Water Supply, 6(3), 71-78.
CRC FOR WATER QUALITY AND TREATMENT – RESEARCH REPORT 38
187
Li CW, Korshin GV and Benjamin MM (1998) Monitoring DBP Formation With Differential UV Spectroscopy. Journal of the American Water Works Association 90(8), 88-100.
Li F, Yuasa A, Chiharada H and Matsui Y (2003) Storm Impacts upon the Composition of Organic Matrices in Nagara River – A study based on Molecular Weight and Activated Carbon Adsorbability. Water Research 37(16), 4027-4037.
Lin CF, Huang YJ and Hao O (1999) Ultrafiltration processes for removing humic substances: effect of molecular weight fractions and PAC treatment. Water Research 33(5), 1252-1264.
Lin CF, Lin TY and Hao O (2000) Effects of humic substance characteristics on UF performance. Water Research 34(4), 1079-1106.
Lin C-F, Liu S-H and Hao OJ (2001) Effect of functional groups of humic substances on UF performance. Water Research 35, 2395-2402.
Link, Hartmann, Eberhagen and Hambsch (1992) Automatic Analysis of Bacterial Growth Dynamics for the Characterisation of Substances Dissolved in Water and the Determination of the Regrowth Potential. Model 251-4-mAOC-Analyser, Manual and Operating Instructions, Monitek GmbH, Dusseldorf.
Lough WJ and Wainer IW (1996) High performance liquid chromatography fundamental principles and practice. Blackie Academic & Professional, New York.
Makdissy G, Croue J-P, Amy G and Buisson H (2004) Fouling of a polyethersufone ultrafiltration membrane by natural organic matter. Water Science & Technology: Water Supply 4(4), 205-212.
Mameri N, Yeddou AR, Lounici H, Belhocine D, Grib H and Bariou B (1998) Defluoridation of septentrional Sahara water of North Africa by electrocoagulation process using bipolar aluminium electrodes. Water Research 32(5), 1604-1612.
Mann S (1996) (Ed.), Biomimetic Materials Chemistry, VCH Publishers, New York. Manne S and Aksay IA (1997) Thin films and nanolaminates incorporating organic/inorganic interfaces.
Current Opinion in Solid State & Materials Science 2, 358-364. Matilainen A, Lindqvist N, Korhonen S and Tuhkanen T (2002) Removal of NOM in the different stages of
the water treatment process. Environment International 28(6), 457-465. Matsui Y, Murase R, Sanogawa T, Aoki N, Mima S, Inoue T and Matsushita T (2005) Rapid adsorption
pre-treatment with submicrometre powdered activated carbon particles before microfiltration. Water Science & Technology 51(6-7), 249-256.
Matteson MJ, Dobson RL, Glenn RW, Kukunoor NS, Waits III WH and Clayfield EJ (1995) Electrocoagulation and separation of aqueous suspensions of ultrafine particles. Colloids and Surfaces. A. Physicochemical and Engineering Aspects 104, 101-109.
McGregor S (2002) Pass for P.A.S.S. on OH&S and Treatment. Water Works, Dec. 2002, 12-15. Mills D (2000) A new process for electrocoagulation. Journal of the American Water Works Association
92(6), 34-43. Minhalma M and De Pinho MN (2001) Flocculation/Flotation/Ultrafiltration integrated process for the
treatment of cork processing wastewaters. Environmental Science & Technology 35(24), 4916-4921. Mollah MYA, Schennach R, Parga JR, Cocke DL (2001) Electrocoagulation (EC) – science and
applications. Journal of Hazardous Materials B84, 29-41. Morran J, Drikas M, Hepplewhite C and Pelekani C (2001) MIEX®, and Microfiltration - a winning alliance,
19th Federal Convention, April 1 - 4, 2001, Australian Water Association, Canberra. Morran JY, Bursill DB, Drikas M and Nguyen H (1996) A New Technique for the Removal of Natural
Organic Matter. Proceedings of the WaterTECH Convention, 27-28 May, AWWA, Sydney. Naddeo V, Belgiorno V and Napoli RMA (2007) Behaviour of natural organic matter during ultrasonic
irradiation. Desalination, 210(1-3), 175-182. Newcombe G, Donati C, Drikas M and Hayes R (1996) Adsorption onto activated carbon: electrostatic
and non-electrostatic interactions. Water Supply 14(2),129-144. Newcombe G, Drikas M and Hayes R (1997b) Influence of Characterised Natural Organic Material on
Activated Carbon Adsorption: II. Effect of pore volume distribution and adsorption of 2-Methylisoborneol. Water Research 31(5), 1065-1073.
Newcombe G, Drikas M, Assemi S and Beckett R (1997a) Influence of Characterised Natural Organic Material on Activated Carbon Adsorption: I. Characterisation of Concentrated Reservoir Water. Water Research 31(5), 965-972.
DEVELOPMENT OF COMBINED TREATMENT PROCESSES FOR THE REMOVAL OF RECALCITRANT ORGANIC MATTER
188
NHMRC/AWRC (1996) Australian Drinking Water Guidelines, National Health & Medical Research Council, and Agriculture & Resource Management Councils of Australia and New Zealand, Canberra.
Nilson JA and DiGiano FA (1996) Influence of NOM composition on nanofiltration. Journal of American Water Works Association 88(5), 53-66.
Noble PA, Clark DL and Olson BH (1996) Biological Stability of Groundwater. Journal of American Water Works Association 88(5), 87-96.
Nyström M, Ruohomäki K and Kaipia L (1996) Humic acid as a fouling agent in filtration. Desalination 106, 79-87.
O’Loughlin E and Chin YP (2001) Effect of detector wavelength on the determination of the molecular weight of humic substances by high-pressure size exclusion chromatography. Water Research 35(1), 333-338.
Okuda T, Baes AU, Nishijima W and Okada M (2001) Isolation and Characterization of coagulant extracted from Moringa oleifera seed by salt solution. Water Research 35(2), 405-410.
Othman MZ, Roddick FA and Hobday MD (2000) Evaluation of Victorian Low Rank Coal-based Adsorbants for the Removal of Organic Compounds from Aqueous Systems. Water Research 34(18), 4351-4358.
Owen DM, Amy GL, Chowdbury ZK, Paode R, McCoy G and Viscosil K (1995) NOM characterisation and treatability. Journal of American Water Works Association 87(1), 46-63.
Ozacar M and Sengil IA (2003) Evaluation of tannin biopolymer as a coagulant aid for coagulation of colloidal particles. Colloids and Surfaces A: Physicochemical and Engineering Aspects 229(1-3), 85-96.
Page DW, van Leeuwen JA, Spark KM, Drikas M, Withers N and Mulcahy DE (2002) Effect of alum treatment on the trihalomethane formation potential and bacterial regrowth potential of natural and synthetic waters. Water Research 36(19), 4884-4892.
Pan JR, Huang C, Chen S and Chung Y-C (1999) Evaluation of a Modified Chitosan Biopolymer for Coagulation of Colloidal Particles. Colloids and Surfaces A: Physicochemical and Engineering Aspects 147, 359-364.
Parameshwaran K, Fane AG, Cho BD, and Kim KJ (2001) Analysis of microfiltration performance with constant flux processing of secondary effluent. Water Research 35(18), 4349 – 4358.
Parkinson A, Roddick FA and Hobday MD (1999) Photooxidation of NOM by UVA, UVB and UVC radiation, 18th Federal Convention, April 11-14, 1999, Australian Water and Wastewater Association, Adelaide.
Powell JC, Hallam NB, West JR, Foster CF and Simms J (2000) Factors which control bulk chlorine decay rates. Water Research 34(1), 117-126.
Rae IB and Gibb SW (2003) Removal of Metals from Aquaous Solutions using Natural Chitinous Materials. Water Science & Technology 47(1), 189-196.
Randtke SJ (1988) Organic Contaminant Removal by Coagulation and Related Process Combinations Journal of the American Water Works Association 80(5), 40-56.
Ratnaweera H, Hiller N and Bunse U (1999) Comparison of the Coagulation behavior of Different Norwegian NOM sources. Environment International 25(2-3), 347-355.
Roussy J, Van Vooren M, Dempsey BA and Guibal E (2005) Influence of chitosan characteristics on the coagulation and the flocculation of bentonite suspensions. Water Research 39(14), 3247-3258
Schäfer AI, Fane AG and Waite TD (1998) Nanofiltration of natural organic matter: Removal, fouling and the influence of multivalent ions. Desalination 118, 109-122.
Selmer-Olsen E, Ratnaweera HC and Pehrson R (1996) A novel treatment process for dairy wastewater with chitosan produced from shrimp-shell waste. Water Science & Technology 34(11), 33-40.
Semmens MJ and Staples AB (1986) The Nature of Organics Removed During Treatment of Mississippi River Water. Journal of the American Water Works Association 78(2), 76-81.
Slunjski M, Bourke M, Nguyen H, Ballard M, Morran J and Bursill D (1999) MIEX® DOC Process – A New Ion Exchange Process, Proceedings of the 18th Federal Convention, 11-14 April, AWWA, Adelaide.
Standard Methods For The Examination of Water and Wastewater (1998) 20th Edition, Method 4500-Cl, American Public Health Association/ American Water Works Association/ Water Environment Federation, Washington, DC.
Thapa K (2002), Development of a Hybrid Membrane Process for the Removal of NOM from Drinking Water CRCWQT Student Summer Scholarship Reporting Seminar, 14th February, 2002, RMIT, Melbourne
CRC FOR WATER QUALITY AND TREATMENT – RESEARCH REPORT 38
189
Thorsen T (2004) Concentration polarisation by natural organic matter (NOM) in NF and UF. Journal of Membrane Science 233(1-2), 79-91.
Tran T, Gray SR, Naughton R, Bolto BA (2006) Polysilicato-iron for improved NOM removal and membrane performance. Journal of Membrane Science 280, 560-571.
Van der Kooij D (1982) Assimilable Organic Carbon as Indicator of Bacterial Regrowth. Journal of American Water Works Association 84, 57.
van Leeuwen JA, Fabris R, Sledz L and van Leeuwen JK (2001) Modelling enhanced alum treatment of southern Australian raw waters for drinking purposes. International Congress on Modelling and Simulation. MODSIM 2001. 10-13th December 2001. ANU, Canberra, Australia. Vol. 4, 1907-1912.
van Leeuwen J, Chow C, Fabris R, Withers N, Page D and Drikas M (2002) Application of a fractionation technique for better understanding of the removal of natural organic matter by alum coagulation. Water Science & Technology: Water Supply 2(5-6), 427-433.
van Leeuwen J, Chow C, Fabris R, Drikas M and Spark K (1999) Enhanced Coagulation for Dissolved Organic Carbon Removal in Conventional Treatment with Alum, 18th Federal Convention, April 11-14, 1999, Australian Water and Wastewater Association, Adelaide.
van Leeuwen J, Page D, Spark K, Fabris R and Sledz L (2004) Pyrolysis and thermochemolysis products from organics recalcitrant to removal by alum, in two drinking waters. In Proceedings of NOM Research: Innovations and Applications for Drinking Water Treatment; Victor Harbor, Australia, March 2-5;CD-ROM.
Vik EA, Carlson DA, Eikum AS and Gjessing ET (1985) Removing Aquatic Humus form Norwegian Lakes. Journal of American Water Works Association 87(3), 58-66.
Volk C, Bell K, Ibrahim E, Verges D, Amy G and Lechevallier M (2000) Impact of Enhanced and Optimised Coagulation on Removal of Organic Matter and it's Biodegradable Fraction in Drinking Water. Water Research 34(12), 3247-3257.
Volk CJ and Le Chevallier MW (2002) Effects of Conventional Treatment on AOC and BDOC levels. Journal of American Water Works Association 94(6), 112-123.
Vrijenhoek EM, Childress AE, Elimelech M, Tanaka TS and Beuhler MD (1998) Removing Particles and THM Precursors by Enhanced Coagulation. Journal of the American Water Works Association 90(4), 139-150.
Vuoria E, Vahala R, Rintala J and Laukkanen R (1998) The evaluation of drinking water treatment performed with HPSEC. Environment International 24(5-6), 617-623.
Wagoner DB and Christman RF (1999) Molar mass and size of Norwegian aquatic NOM by light scattering. Environment International 25(2-3), 275-284.
Wang D and Tang H (2001) Modified Inorganic Polymer Flocculant - PFSi: Its Preparation, Characterisation and Coagulation behaviour. Water Research 35(14), 3418-3428.
Wang GS, Heieh ST and Hong CS (2000) Destruction of humic acid in water by UV light - Catalyzed oxidation with hydrogen peroxide. Water Research 34(15), 3882-3887.
Wang J, Deevanhxay P, Hasegawa T, Ehara Y, Kurokawa M, Hashimoto K, Nishigawa W and Okada M, (2002) A pilot plant study of polysilicato-iron coagulant, Water Science and Technology: Water Supply 2, 107-113.
Watanabe Y, Tadano T, Hasegawa T, Ødegaar H, and Shimanuki Y (2000) Phosphorus recycling from pre-coagulated wastewater sludge, in H.H. Hahn, E. Hoffmann and H. Ødegaard (Ed.), Chemical Water and Wastewater Treatment VI, Springer, Berlin, 359-371.
White MC, Thompson JD, Harrington GW and Singer PC (1997) Evaluating criteria for enhanced coagulation compliance. Journal of the American Water Works Association 89(5), 64-77.
Withers N, Drikas M and Hambsch B (1996) Comparison of bacterial regrowth potential in German and Australian waters. Proceedings of WaterTECH conference, Sydney, Australia. CD-ROM.
Wong S, Hanna JV, King S, Carroll TJ, Eldridge RJ, Dixon DR, Bolto BA, Hess S, Abbt-Braun G and Frimmel FH (2002) Fractionation of natural organic matter in drinking water and characterisation by 13C cross polarization magic angle spinning NMR spectroscopy and size exclusion chromatography. Environmental Science & Technology 36(16), 3497-3503.
Xiong Y, He C, Karlsson HT, Zhu X (2003) Performance of three-phase three-dimensional electrode reactor for the reduction of COD in simulated wastewater-containing phenol. Chemosphere 50, 131-136.
DEVELOPMENT OF COMBINED TREATMENT PROCESSES FOR THE REMOVAL OF RECALCITRANT ORGANIC MATTER
190
Xiong Y, Strunk PK, Xia H, Zhu X, Karlsson HT (2001) Treatment of dye wastewater containing acid orange II using a cell with three-phase three-dimensional electrode. Water Research 35(17), 4226-4230.
Yoon S-H, Lee, C-H, Kim K-J and Fane, AG (1998) Effect of calcium ion on the fouling of nanofilter by humic acid in drinking water production. Water Research 32, 2180-2186.
CRC FOR WATER QUALITY AND TREATMENT – RESEARCH REPORT 38
191
PROJECT RELATED PUBLICATIONS
1. Busetti F, Greenwood P, Gray S and Tran T (2006) Chemical characterisation of NOM fractions prone to membrane fouling. The origin and fate of naturally occurring organic matter (Abstract & Poster). Combined national conference of the Australian Organic Geochemists and the Natural Organic Matter Interest Group. 12-15 February, Rottnest Island, Perth, WA
2. Chow C, Fabris R and Drikas M (2003)Application Of Rapid Organic Characterisation To Optimise Water Treatment Processes, Proceedings of the American Water Works Association Water Quality Technology Conference, Philadelphia, November 2003 (Platform).
3. Chow CWK, Fabris RB, Drikas M (2007) Optimisation of Natural Organic Matter Removal Using Rapid Organic Characterisation Techniques, 4th IWA Leading-Edge Conference, IWA, Singapore, 3 – 6 June, 2007.
4. Chow C, Fabris R and Drikas M (2003) A Rapid Organic Characterisation Tool To Optimise Water Treatment Processes, 20th Convention, April 6 - 10, 2003, Australian Water Association, Perth (Platform).
5. Chow C, Fabris R, Drikas M and Holmes M (2003) A Case Study to Link Organic Character and Treatability for Conventional Water Treatment Processes, The Australian Water Association South Australian Branch Regional Conference, Australian Water Association, Adelaide, 6th August, 2003 (Platform).
6. Chow C, Fabris R, Wilkinson K, Fitzgerald F and Drikas M (2006) Characterising NOM To Assess Treatability. AWA Water Journal 33(2), 74-85. Refereed Paper - Guy Parker Award 2005/2006 best paper of the year.
7. Chow CWK, Fabris R and Drikas M (2004) A Rapid Fractionation Technique To Characterise Natural Organic Matter For The Optimisation Of Water Treatment Processes. Journal of Water Supply: Research and Technology – AQUA 53(2), 85-92.
8. Chow CWK, Fabris R, Drikas M and Holmes M (2005) A Case Study of Treatment Performance and Organic Character. Journal of Water Supply: Research and Technology – AQUA 54(6), 385-395.
9. Chow CWK, Fabris R, Drikas M and Holmes M, The Impact of Organic Character on Water Treatment Plant Performance, NOM research: Innovations and Applications for Drinking Water Treatment, March 2-5, 2004, Victor Harbour, South Australia (Platform).
10. Chow CWK, Favier M and Drikas M (2004) Evaluation of Dissolved Organic Carbon Detector For High Performance Size Exclusion Chromatography As A Tool to Study Water Treatment Processes, NOM research: Innovations and Applications for Drinking Water Treatment, March 2-5, 2004, Victor Harbour, South Australia (Poster).
11. Eikebrokk B, Fabris R, Drikas M and Chow C (2007) NOM Characteristics and Treatability by Coagulation: Comparison of Norwegian and Australian Waters, 12th Gothenberg Symposium, Ljubljana, Slovenia, 20-23 May, 2007.
12. Fabris R, Chow C and Drikas M (2004) Practical Application of a Combined Treatment Process for Removal of Recalcitrant NOM – Alum and PAC, Water Science and Technology: Water Supply 4(4), 89–94.
13. Fabris R, Chow C and Drikas M (2005) Evaluation of Alternative Coagulants for Removal of Problematic Natural Organic Matter in Drinking Water, Ozwater Convention, AWA, May 8-12, 2005, Brisbane (platform).
14. Fabris R, Chow C and Drikas M (2004) Practical Application of a Combined Treatment Process for Removal of Recalcitrant NOM – Alum and PAC, NOM research: Innovations and Applications for Drinking Water Treatment, March 2-5, 2004, Victor Harbour, South Australia (Poster).
15. Fabris R, Chow C and Drikas M (2006) Strategies for Optimum NOM Removal, 2nd Annual South Australian Operator’s Conference, AWA, 4th April, 2006, Adelaide (platform).
16. Fabris R, Chow C and Drikas M (2003) The Impact of Coagulant Type on NOM Removal, 20th Convention, Australian Water Association, Perth, April 6 - 10, 2003 (Platform).
17. Fabris R, Chow C and Drikas M (2004) The Link of Organic Character and Coagulation Performance – A Practical Experience, Enviro 04, AWA, Sydney, March 29-31, 2004 (platform).
18. Fabris R, Chow CWK and Drikas M (2006) Combined Treatments for Enhanced Natural Organic Matter (NOM) Removal, Proceedings of Enviro 06 Conference, Melbourne, Australia, 9-11th May 2006, paper e6174 (platform).
19. Fabris RB, Chow CWK, Drikas M (2007) Combined Treatments for Enhanced Natural Organic Matter Removal, 4th IWA Leading-Edge Conference, IWA, Singapore, 3 – 6 June, 2007.
DEVELOPMENT OF COMBINED TREATMENT PROCESSES FOR THE REMOVAL OF RECALCITRANT ORGANIC MATTER
192
20. Fabris R, Chow C and Drikas M (2007) Combined Treatments or Enhanced Reduction of Trihalomethane Precursors, 233rd National Meeting, American Chemical Society, Chicago, 25-29 March, 2007.
21. Fabris R, Lee EK, Chow CWK, Chen V and Drikas M (2007) Pre-treatments to Reduce Fouling of Low Pressure Micro-filtration (MF) Membranes. Journal of Membrane Science, 289(1-2), 231-240.
22. Fabris R, Lee EK, Chow CWK, Chen V and Drikas M (2006) Size Exclusion Chromatography As A Tool To Detect Fouling Of Low Pressure Micro-Filtration (MF) Membranes. AWWA, Water Quality Technology Conference, , Denver, Colorado, November 5-9, 2006
23. Gray S, Tran T, Bolto B and Johnson W (2005) Natural organic matter and low pressure membranes – A review. Ozwater 05, AWA, Brisbane, 2005, paper o5335
24. Gray SR, Ritchie CB, Tran T, Bolto BA, Greenwood P, Busetti F and Allpike B (2007) Effect of membrane character and solution chemistry on microfiltration performance. Water Research, in press.
25. Gray SR and Bolto BA (2003) Predicting NOM fouling rates of low pressure membranes. 5th International Membrane Science and Technology Conference, IMSTEC’03, November 10-14, 2003, Sydney, paper IMSTEC203
26. Gray SR, Ritchie CB and Bolto BA (2004) Effect of fractionated NOM on low-pressure membrane flux declines.” NOM Research: Innovations and applications for drinking water treatment. IWA, CRC Water Quality and Treatment, Victor Harbour, Australia, March 2-5, 2004, Water Science and Technology: Water Supply 4(4), 189-196
27. Gray SR, Ritchie CB, Tran T and Bolto BA (2007) Effect of NOM characteristics and membrane type on microfiltration performance. Water Research 41(17), 3833-3841.
28. Gray SR, Tran T, Bolto B and Ritchie C (2005) NOM composition – effect on microfiltration fouling. AWWA Membrane Technology Conference, Phoenix, USA, March 6-9, 2005
29. Tran T, Gray S, Farmer TD, Collings TF and Bolto B (2006) Ultrasound enhancement of microfiltration performance for NOM removal (Abstract & Poster). The origin and fate of naturally occurring organic matter. Combined national conference of the Australian Organic Geochemists and the Natural Organic Matter Interest Group. 12-15 February, Rottnest Island, Perth, WA
30. Tran T, Gray S, Naughton R and Bolto B (2005) Improved NOM removal and membrane performance via coagulation with polysilicato iron. International conference on novel technology and management for drinking water safety, editors: Jun Ma, Wenjie He and Ron Linsky, Tianjin, China, September 6-8, 2005
31. Tran T, Gray S, Naughton R and Bolto B (2005) Improved NOM removal and membrane performance via coagulation with polysilicato iron. Journal of Harbin Institute of Technology 12, 56-61
32. Tran T, Gray S, Naughton R and Bolto B (2006) Polysilicato-iron for improved NOM removal and membrane performance. Journal of Membrane Science 280, 560-571
33. Tran T, Gray S, Naughton R, Bolto B and Johnson W (2006) Improved organics removal and membrane performance via coagulation with polysilicato iron. American Membrane Technology Association conference, Los Angles, CA, July
34. Tran T, Gray S, Bolto B, Farmer TD and Collings TF (2007) Ultrasound enhancement of microfiltration performance for natural organic matter removal. Organic Geochemistry 38(7), 1091-1096.
35. van Leeuwen J, Chow C, Fabris R, Withers N, Page D and Drikas M (2002) Application of a Fractionation Technique for the Better Understanding of the Removal of NOM by Alum Coagulation. Water Science and Technology: Water Supply 2(5-6), 427–433.
36. van Leeuwen J, Chow C, Fabris R, Withers N, Page D and Drikas M (2002) Application of a Fractionation Technique for the Better Understanding of the Removal of NOM by Alum Coagulation, 3rd IWA World Water Congress, Melbourne, 7-11 April 2002 (Platform).
37. Wilkinson K, Chow C, Fabris R and Drikas M (2005) Organic Characterisation Tools for Drinking Water Treatment: A Summary of Applicability, Ozwater Convention, AWA, Brisbane, May 8-12, 2005 (poster).
CRC FOR WATER QUALITY AND TREATMENT – RESEARCH REPORT 38
193
PAPERS IN PROGRESS
1. Chow CWK, van Leeuwen JA, Fabris R and Drikas M. Optimised Coagulation Using Aluminium Sulfate for the Removal of Dissolved Organic Carbon. Submitted to Desalination
2. Fabris R, Chow CWK, Drikas M and Eikebrokk B. Comparison of selected Australian and Norwegian drinking waters. Submitted to Water Research
3. Fabris R, Chow CWK and Drikas M. Practical Application of Chitosan in Drinking Water Treatment. Submitted to Water Environment Research (WER)
4. Fabris R, Chow CWK, Drikas M. (2007) Combined Treatments for Enhanced Reduction of Trihalomethane Precursors, Chapter 17 from Occurrence, Formation, Health Effects and Control of Disinfection By-products in Drinking Water, Editors: T. Karanfil, S.W. Krasner, P. Westerhoff, Y. Xie, American Chemical Society Publications.
Research Report
CRC for Water Quality and Treatment
Private Mail Bag 3Salisbury SOUTH AUSTRALIA 5108
Tel: (08) 8259 0351Fax: (08) 8259 0228
E-mail: [email protected]: www.waterquality.crc.org.au
The Cooperative Research Centre (CRC) for Water Quality and Treatment is Australia’s national drinking water research centre. An unincorporated joint venture between 29 different organisations from the Australian water industry, major universities, CSIRO, and local and state governments, the CRC combines expertise in water quality and public health.
The CRC for Water Quality and Treatment is established and supported under the Federal Government’s Cooperative Research Centres Program.
• ACTEWCorporation
• AustralianWaterQualityCentre
• AustralianWaterServicesPtyLtd
• BrisbaneCityCouncil
• CentreforAppropriate
Technology Inc
• CityWestWaterLimited
• CSIRO
• CurtinUniversityofTechnology
• DepartmentofHumanServices
Victoria
• GriffithUniversity
• MelbourneWaterCorporation
• MonashUniversity
• OricaAustraliaPtyLtd
• PowerandWaterCorporation
• QueenslandHealthPathology&
Scientific Services
• RMITUniversity
• SouthAustralian
Water Corporation
• SouthEastWaterLtd
• SydneyCatchmentAuthority
• SydneyWaterCorporation
• TheUniversityofAdelaide
• TheUniversityof
New South Wales
• TheUniversityofQueensland
• UnitedWaterInternationalPtyLtd
• UniversityofSouthAustralia
• UniversityofTechnology,Sydney
• WaterCorporation
• WaterServicesAssociation
of Australia
• YarraValleyWaterLtd
The Cooperative Research Centre for Water Quality and Treatment is an unincorporated joint venture between:
42
Water Quality and Health Risks from Urban Rainwater Tanks
Research Report 42