research report - citeseerx
TRANSCRIPT
Virginia Transportation Research Council, 530 Edgemont Road,Charlottesville, VA 22903-2454, www.vtrc.net, (434) 293 -1900
http://www.virginiadot.org/vtrc/main/online_reports/pdf/08-r20.pdf
Final Report VTRC 08-R20
research report
EDWARD J. HOPPE, Ph.D., P.E.Senior Research Scientist
Performance of a SkewedSemi-Integral Bridge: Volume I:
Field Monitoring
Virginia Transportation Research Council
TIMOTHY M. BAGNALLResearch Assistant
Standard Title Page - Report on Federally Funded Project 1. Report No. 2. Government Accession No. 3. Recipient’s Catalog No. FHWA/VTRC 08-R20
4. Title and Subtitle 5. Report Date Performance of a Skewed Semi-Integral Bridge: Volume I: Field Monitoring June 2008 6. Performing Organization Code 7. Author(s) Edward J. Hoppe, Ph.D., P.E., and Timothy M. Bagnall
8. Performing Organization Report No. VTRC 08-R20
9. Performing Organization and Address 10. Work Unit No. (TRAIS) Virginia Transportation Research Council
530 Edgemont Road 11. Contract or Grant No. Charlottesville, VA 22903
82085
12. Sponsoring Agencies' Name and Address 13. Type of Report and Period Covered Virginia Department of Transportation
Federal Highway Administration
Final: July 2007–May 2008.
1401 E. Broad Street 400 North 8th Street, Room 750 14. Sponsoring Agency Code Richmond, VA 23219 Richmond, VA 23219-4825 15. Supplementary Notes 16. Abstract
This project was developed to enhance the Virginia Department of Transportation’s (VDOT) in-house expertise in the design of integral bridges and to provide a resource for consultants performing design work for VDOT. It involved extensive field monitoring of a highly skewed semi-integral (integral backwall) structure. The main purpose was to provide feedback regarding some of the assumptions behind the recently adopted set of integral bridge design guidelines, ultimately leading to reduced construction and maintenance expenses for VDOT.
The project was focused on the long-term monitoring of a skewed semi-integral bridge located on Route 18 over Blue
Springs Run in Alleghany County, Virginia. This report presents the results and analysis of field data acquired from various sensors between October 19, 2006 (shortly after the bridge was completed), and March 24, 2008. The results to date indicate satisfactory field performance, with a need for further monitoring.
The main reason for constructing jointless bridges is to eliminate recurring maintenance costs associated with deteriorated
bearings and spalled beam ends, commonly encountered with conventional structures. It is estimated that these maintenance expenses amount to approximately $366,000 per year in Virginia. In the past 7 years, integral bridges constituted between 10% and 30% of the total bridges constructed by VDOT, with 24% reached in 2007. VDOT is committed to the design of jointless bridges where practicable, within a clearly defined set of constraints based on the current state of the practice. It may be possible to consider a greater percentage of bridges for integral design through a better understanding of the field behavior.
17 Key Words 18. Distribution Statement Semi-integral, integral backwall, integral bridge, elastic inclusion, EPS
No restrictions. This document is available to the public through NTIS, Springfield, VA 22161.
19. Security Classif. (of this report) 20. Security Classif. (of this page) 21. No. of Pages 22. Price Unclassified Unclassified 41
Form DOT F 1700.7 (8-72) Reproduction of completed page authorized
FINAL REPORT
PERFORMANCE OF A SKEWED SEMI-INTEGRAL BRIDGE: VOLUME I: FIELD MONITORING
Edward J. Hoppe, Ph.D., P.E. Senior Research Scientist
Timothy M. Bagnall Research Assistant
Virginia Transportation Research Council (A partnership of the Virginia Department of Transportation and
the University of Virginia since 1948)
In Cooperation with the U.S. Department of Transportation Federal Highway Administration
Charlottesville, Virginia
June 2008
VTRC 08-R20

ii
DISCLAIMER
The contents of this report reflect the views of the authors, who are responsible for the facts and the accuracy of the data presented herein. The contents do not necessarily reflect the official views or policies of the Virginia Department of Transportation, the Commonwealth Transportation Board, or the Federal Highway Administration. This report does not constitute a standard, specification, or regulation.
Copyright 2008 by the Commonwealth of Virginia. All rights reserved.

iii
ABSTRACT
This project was developed to enhance the Virginia Department of Transportation’s (VDOT) in-house expertise in the design of integral bridges and to provide a resource for consultants performing design work for VDOT. It involved extensive field monitoring of a highly skewed semi-integral (integral backwall) structure. The main purpose was to provide feedback regarding some of the assumptions behind the recently adopted set of integral bridge design guidelines, ultimately leading to reduced construction and maintenance expenses for VDOT.
The project was focused on the long-term monitoring of a skewed semi-integral bridge
located on Route 18 over Blue Springs Run in Alleghany County, Virginia. This report presents the results and analysis of field data acquired from various sensors between October 19, 2006 (shortly after the bridge was completed), and March 24, 2008. The results to date indicate satisfactory field performance, with a need for further monitoring.
The main reason for constructing jointless bridges is to eliminate recurring maintenance
costs associated with deteriorated bearings and spalled beam ends, commonly encountered with conventional structures. It is estimated that these maintenance expenses amount to approximately $366,000 per year in Virginia. In the past 7 years, integral bridges constituted between 10% and 30% of the total bridges constructed by VDOT, with 24% reached in 2007. VDOT is committed to the design of jointless bridges where practicable, within a clearly defined set of constraints based on the current state of the practice. It may be possible to consider a greater percentage of bridges for integral design through a better understanding of the field behavior.

FINAL REPORT
PERFORMANCE OF A SKEWED SEMI-INTEGRAL BRIDGE: VOLUME I: FIELD MONITORING
Edward J. Hoppe, Ph.D., P.E.
Senior Research Scientist
Timothy M. Bagnall Research Assistant
INTRODUCTION
Jointless bridges provide a very attractive alternative to traditional bridge designs as an effective means of reducing life cycle costs. The Virginia Department of Transportation (VDOT) in cooperation with the Virginia Transportation Research Council (VTRC) recently developed a new set of design guidelines for fully integral (integral abutment) and semi-integral (integral backwall) bridges (VDOT, 2007). Efforts aimed at optimizing the design parameters of integral bridges include field monitoring in order to evaluate the performance of the structure during its service life and verify design assumptions. Over the past decade, VTRC conducted long-term monitoring of semi-integral bridges on Route 257 over I-81 (Hoppe and Gomez, 1996) and on Route 60 over the Jackson River (Hoppe, 2005). Field data collected over a period of several years were used to provide feedback to the design process.
As the complexity of integral designs undertaken by VDOT increased over the years, so
did the need for more sophisticated field monitoring. This was especially true for cases involving skewed integral bridges, where the actual distribution of stresses acting on a structure in service is not very well documented. Although the literature contains anecdotal evidence that integral bridges are generally performing well, there was a need for close monitoring of the actual field performance, because these structures are subjected to forces and stresses typically not encountered in traditional designs. Of particular importance is the measurement of structural behavior resulting from thermally induced forces.
PURPOSE AND SCOPE
The purpose of this study was to enhance VDOT’s expertise in the design of integral bridges, particularly as it applies to highly skewed structures. This was achieved through extensive field monitoring of a semi-integral bridge with a 45-degree skew. Long-term, continuous monitoring included data acquisition regarding strains developed in the foundation piles, earth pressures exerted on the backwall by the adjacent approach embankment, and concrete buttress reactions acting on the superstructure. These measurements were designed to

2
capture thermally induced effects only. Overall, 120 strain gages, 16 earth pressure cells, and 2 high-capacity load cells, interfaced with electronic dataloggers, were employed in the study.
This report provides the results and analysis of data collected between October 19, 2006 (shortly after the bridge was completed), and March 24, 2008. The monitoring period included the influence of one cycle of summer and two cycles of winter temperatures. The data presented relate to thermally induced displacements of the superstructure and thermally induced forces. Future reports will provide the analysis of results of the foundation pile strain gage measurements and additional field data. Ultimately, the purpose of this project is to advance the state of the practice in the design of integral bridges.
METHODOLOGY
Overview
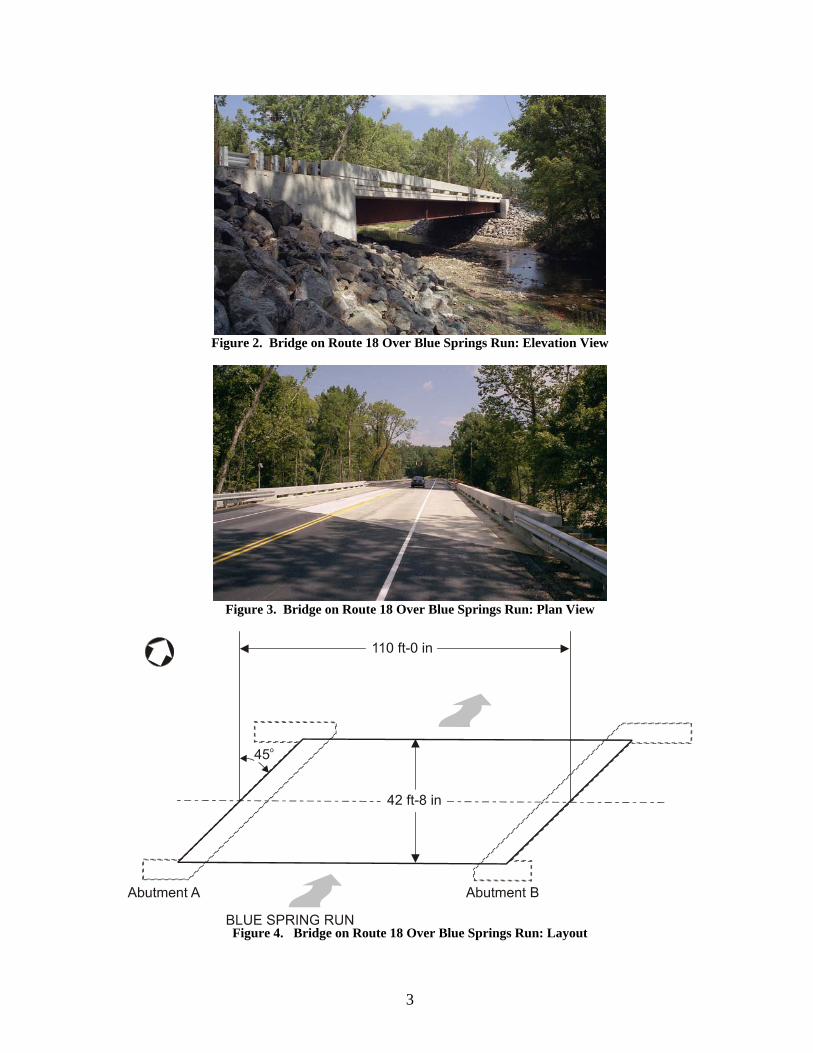
The project involved a field study of the new bridge on Route 18 over the Blue Spring Run in Alleghany County, Virginia, as shown in Figures 1 through 4. Significant deterioration of the old bridge, as evidenced by corrosion, concrete delamination, and increased scour susceptibility, was the reason for its replacement.
.
Figure 1. Site Location
3
Figure 2. Bridge on Route 18 Over Blue Springs Run: Elevation View
Figure 3. Bridge on Route 18 Over Blue Springs Run: Plan View
Figure 4. Bridge on Route 18 Over Blue Springs Run: Layout

4
Specifically, the study involved the following tasks:
1. instrumentation of the bridge 2. data acquisition and monitoring.
Bridge Description
The new semi-integral bridge is one span, 110 ft (33.5 m) long, 42.7 ft (13 m) wide, built at a 45-degree skew. The design is a steel beam and concrete deck composite. No approach slabs were cast at the bridge. The average daily traffic is 1,706 vehicles with 2% trucks (VDOT 2004 traffic data). The structure was built in two stages to maintain uninterrupted traffic on Route 18.
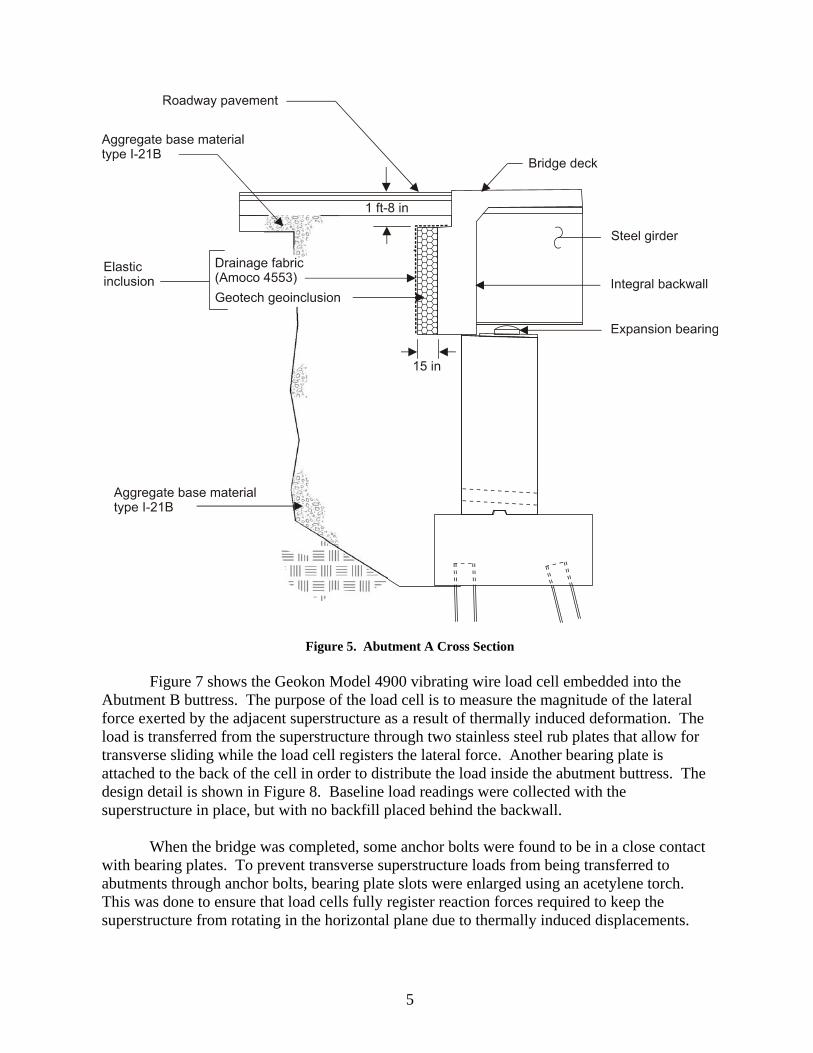
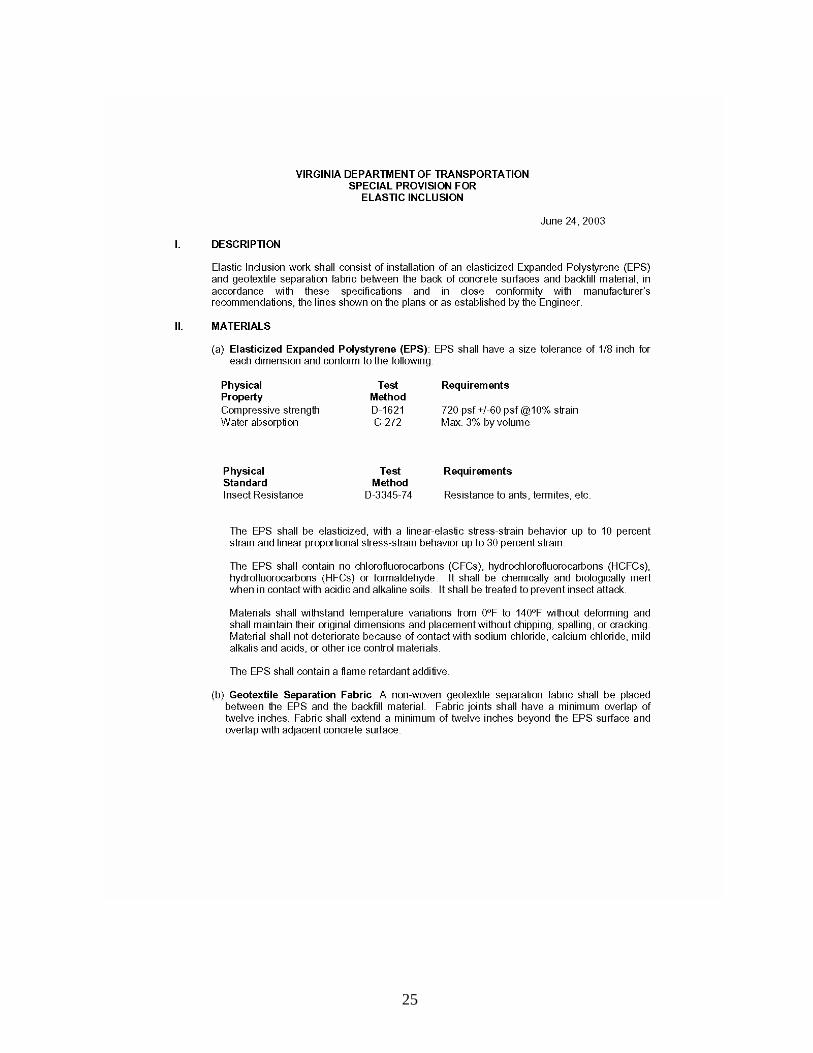
This was the first integral bridge with a 45-degree skew constructed in Virginia. The design incorporates a 15-in (38-cm) layer of elasticized expanded polystyrene (EPS) faced with a separation geotextile, installed at the integral backwall of Abutment A. The EPS serves as an elastic inclusion, accommodating thermally induced displacements of the superstructure while reducing the lateral earth pressures and minimizing the approach embankment settlement. It also serves to dissipate lateral pressure exerted by the adjoining structural backfill. Figure 5 shows the cross-section detail of Abutment A, with the elastic inclusion placed against the integral backwall. VDOT’s Special Provision for Elastic Inclusion is included in Appendix A.
There is no elastic inclusion installed at Abutment B. A structural backfill material is
placed directly against the backwall. This type of design assumes a preferred mode of expansion in the direction of a lower stiffness embankment, toward the elastic inclusion. With a single span and all expansion bearings, the concern was that the superstructure might “walk off” the abutment if allowed to expand/contract uncontrollably in both directions.
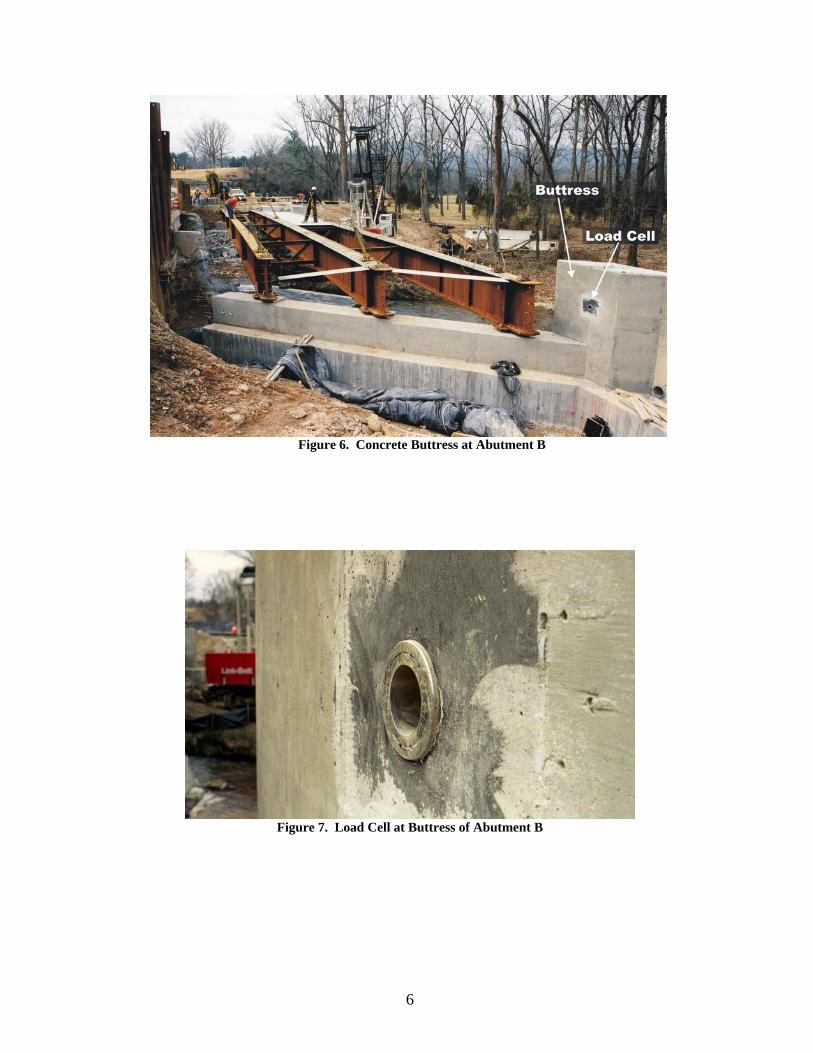
The superstructure is restrained from rotating in the horizontal plane by two concrete
buttresses constructed at the southwest (Abutment A) and northeast (Abutment B) corners. Figure 6 shows the buttress with the embedded load cell used to measure the restraining reaction force.
The bridge was designed in accordance with the recently adopted integral bridge design
guidelines, originally developed by the VDOT Jointless Bridge Committee (VDOT, 2007). A design exception allowing for a greater skew and no approach slabs on this bridge was granted by VDOT’s Structure & Bridge Division.
Bridge Instrumentation The instrumentation installed at the bridge consisted of vibrating wire strain gages; earth
pressure cells; high-capacity vibrating-wire load cells; a displacement transducer (LVDT) for measuring the EPS thickness; and environmental sensors, interfaced with electronic dataloggers.
5
Figure 5. Abutment A Cross Section
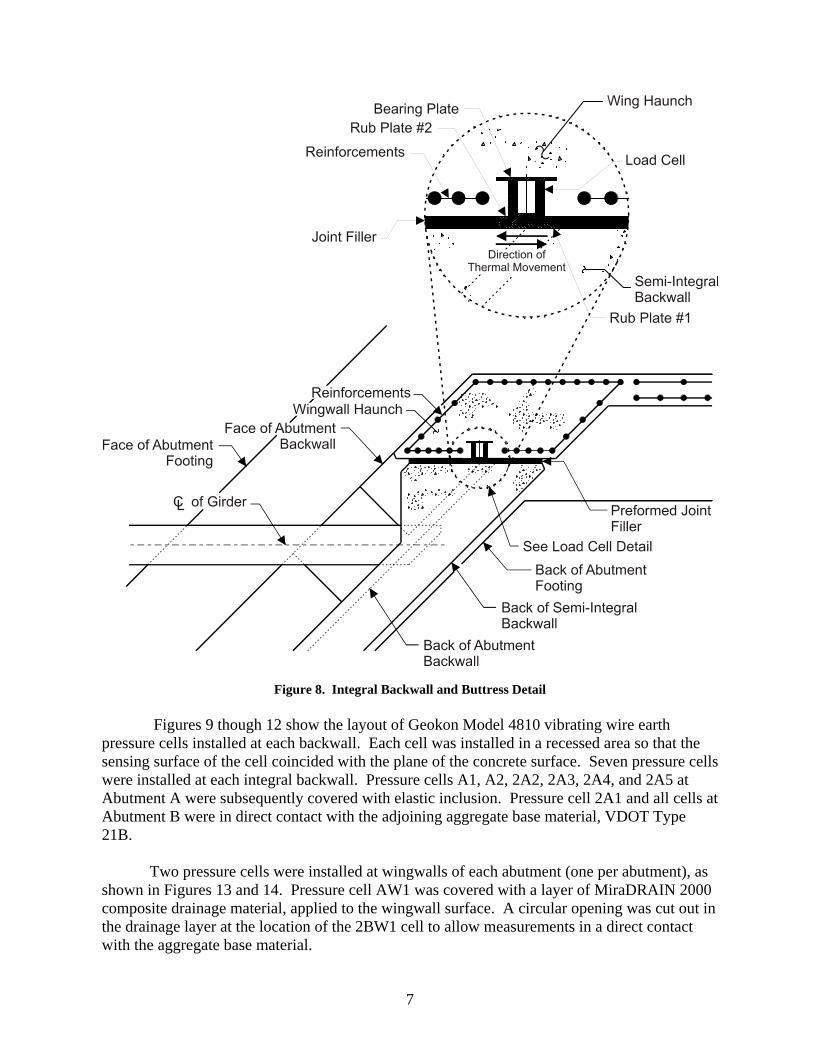
Figure 7 shows the Geokon Model 4900 vibrating wire load cell embedded into the Abutment B buttress. The purpose of the load cell is to measure the magnitude of the lateral force exerted by the adjacent superstructure as a result of thermally induced deformation. The load is transferred from the superstructure through two stainless steel rub plates that allow for transverse sliding while the load cell registers the lateral force. Another bearing plate is attached to the back of the cell in order to distribute the load inside the abutment buttress. The design detail is shown in Figure 8. Baseline load readings were collected with the superstructure in place, but with no backfill placed behind the backwall.
When the bridge was completed, some anchor bolts were found to be in a close contact
with bearing plates. To prevent transverse superstructure loads from being transferred to abutments through anchor bolts, bearing plate slots were enlarged using an acetylene torch. This was done to ensure that load cells fully register reaction forces required to keep the superstructure from rotating in the horizontal plane due to thermally induced displacements.
6
Figure 6. Concrete Buttress at Abutment B
Figure 7. Load Cell at Buttress of Abutment B
7
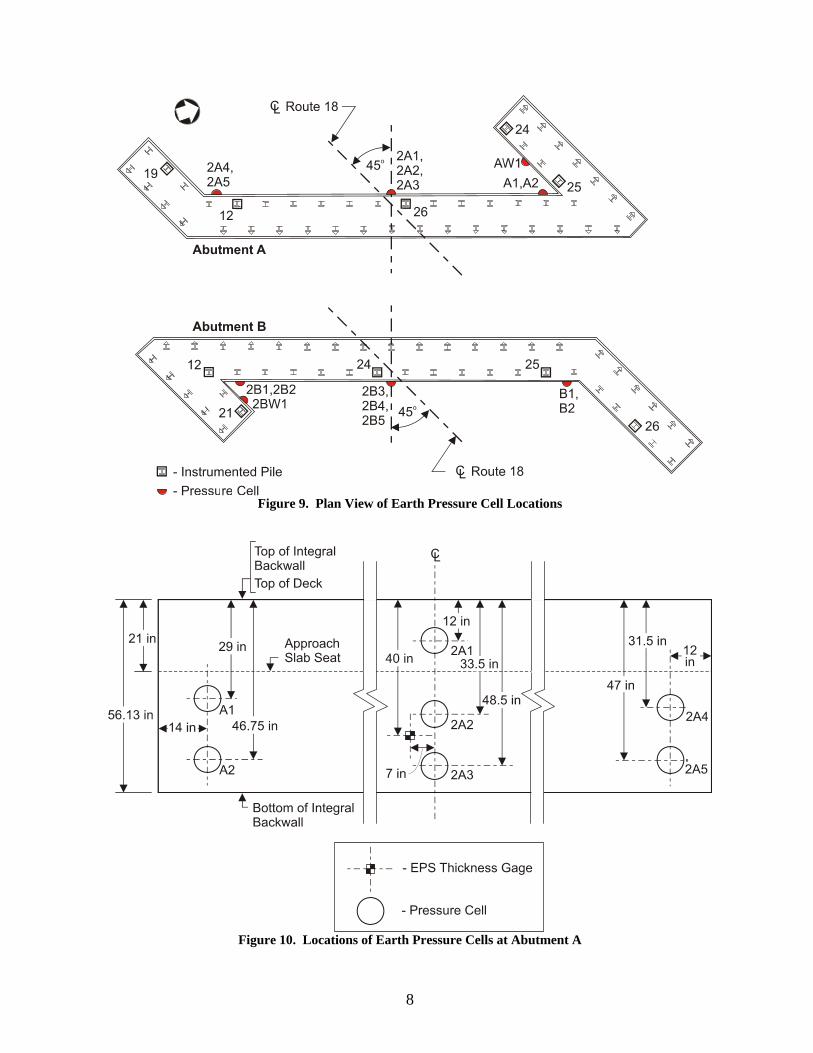
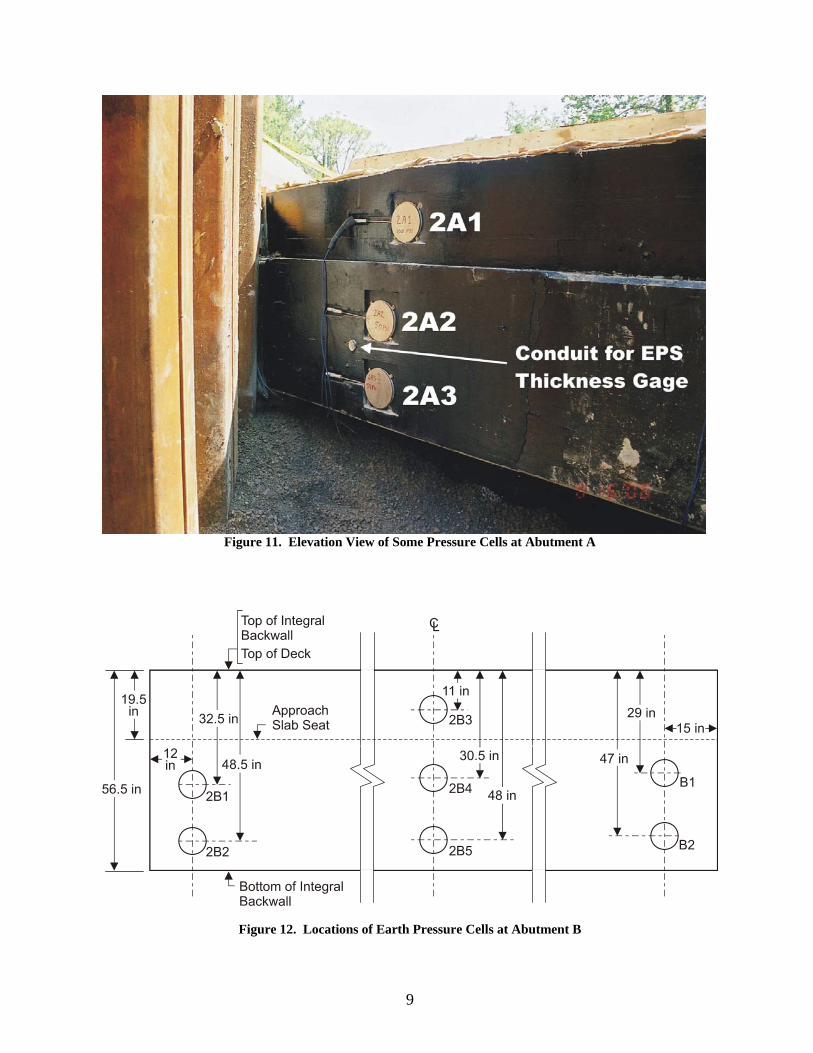
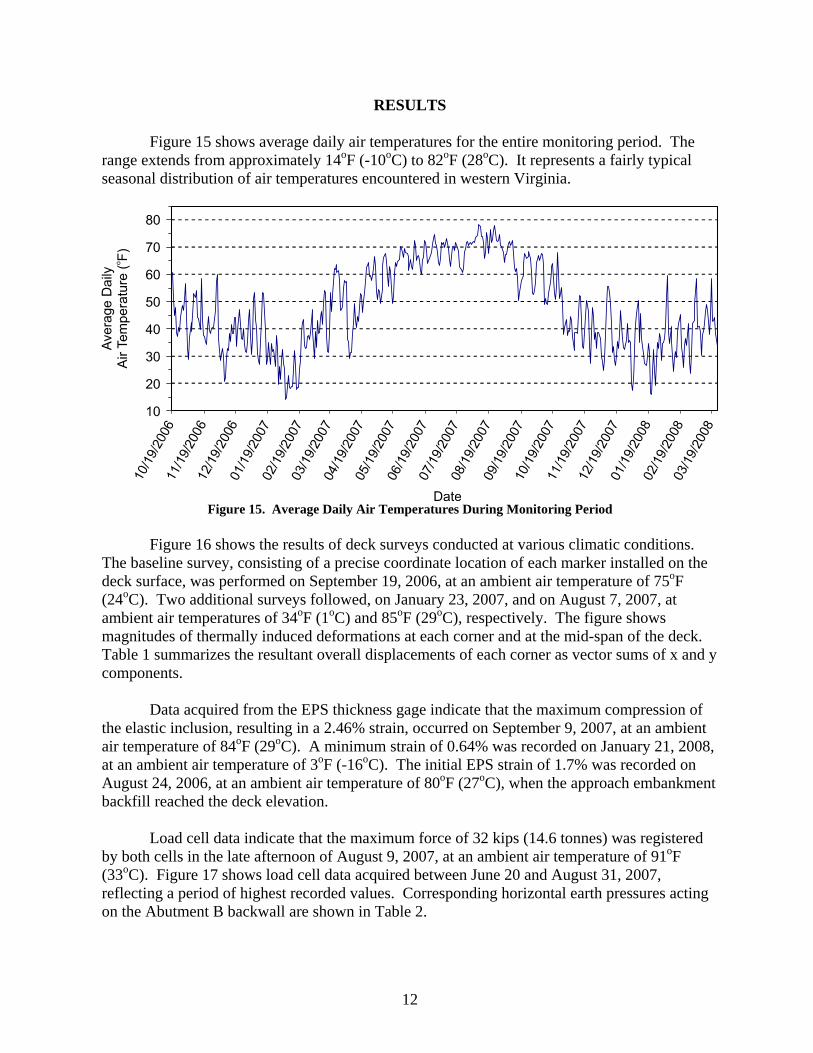
Figure 8. Integral Backwall and Buttress Detail Figures 9 though 12 show the layout of Geokon Model 4810 vibrating wire earth pressure cells installed at each backwall. Each cell was installed in a recessed area so that the sensing surface of the cell coincided with the plane of the concrete surface. Seven pressure cells were installed at each integral backwall. Pressure cells A1, A2, 2A2, 2A3, 2A4, and 2A5 at Abutment A were subsequently covered with elastic inclusion. Pressure cell 2A1 and all cells at Abutment B were in direct contact with the adjoining aggregate base material, VDOT Type 21B. Two pressure cells were installed at wingwalls of each abutment (one per abutment), as shown in Figures 13 and 14. Pressure cell AW1 was covered with a layer of MiraDRAIN 2000 composite drainage material, applied to the wingwall surface. A circular opening was cut out in the drainage layer at the location of the 2BW1 cell to allow measurements in a direct contact with the aggregate base material.
8
Figure 9. Plan View of Earth Pressure Cell Locations
Figure 10. Locations of Earth Pressure Cells at Abutment A
9
Figure 11. Elevation View of Some Pressure Cells at Abutment A
Figure 12. Locations of Earth Pressure Cells at Abutment B

10
Figure 13. Location of Earth Pressure Cells at Wingwall A
Figure 14. Location of Earth Pressure Cell at Wingwall B

11
Figures 10 and 11 also show the location of the EPS thickness gage. The measurement was made using a stainless steel rod passing through the backwall in a polyvinyl chloride (PVC) tube, secured to the aluminum plate affixed to the outer surface of the elastic inclusion and connected with the LVDT sensor attached to the front of integral backwall. Changes in the EPS thickness caused the telltale rod to displace the LVDT sensor. Environmental sensors included those for air temperature, relative humidity, rainfall, and solar radiation. These sensors were installed adjacent to the bridge. Solar panels connected to rechargeable batteries were also mounted to provide power for electronic components. All gages were connected to Campbell Scientific CR10X electronic dataloggers (one at each abutment).
Data Acquisition Field data were acquired and stored at hourly intervals. VTRC personnel visited the site periodically to collect data and conduct field observations. The data were collected between October 19, 2006, and March 24, 2008. During this 17-month period, approximately 3 million measurements were recorded. In addition, precise surveys of the deck surface were carried out by the survey crew of VDOT’s Staunton District.
The following data acquisition tasks were implemented:
1. monitoring strains in foundation piles 2. monitoring the load (reaction) required to restrain the superstructure from horizontal
rotation due to non-collinear resultant forces acting on the backwalls 3. monitoring lateral earth pressures exerted on backwalls and wingwalls by the
adjoining approach embankments 4. monitoring the EPS layer thickness at various ambient air temperatures 5. monitoring the shape of the concrete deck surface at extreme ambient air
temperatures. (precise field surveying) 6. monitoring approach embankment settlements (precise field surveying) 7. monitoring environmental conditions (air temperature, solar radiation, humidity,
rainfall).
12
RESULTS
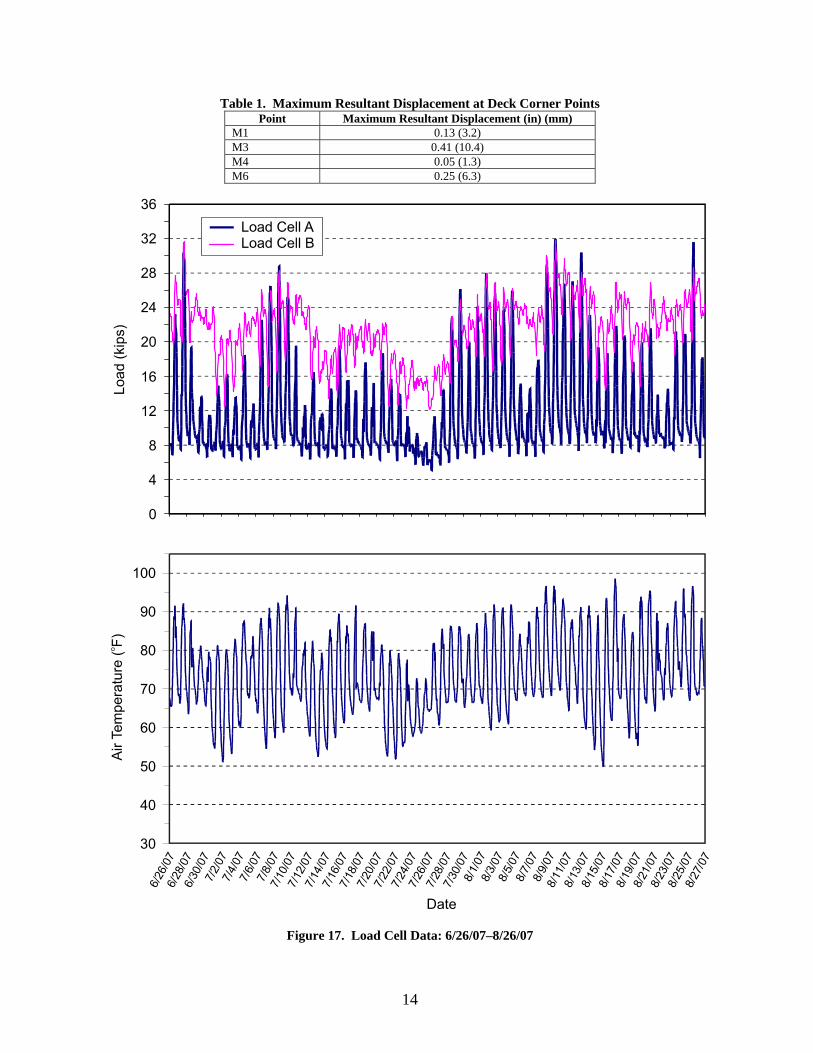
Figure 15 shows average daily air temperatures for the entire monitoring period. The range extends from approximately 14oF (-10oC) to 82oF (28oC). It represents a fairly typical seasonal distribution of air temperatures encountered in western Virginia.
Figure 15. Average Daily Air Temperatures During Monitoring Period
Figure 16 shows the results of deck surveys conducted at various climatic conditions.
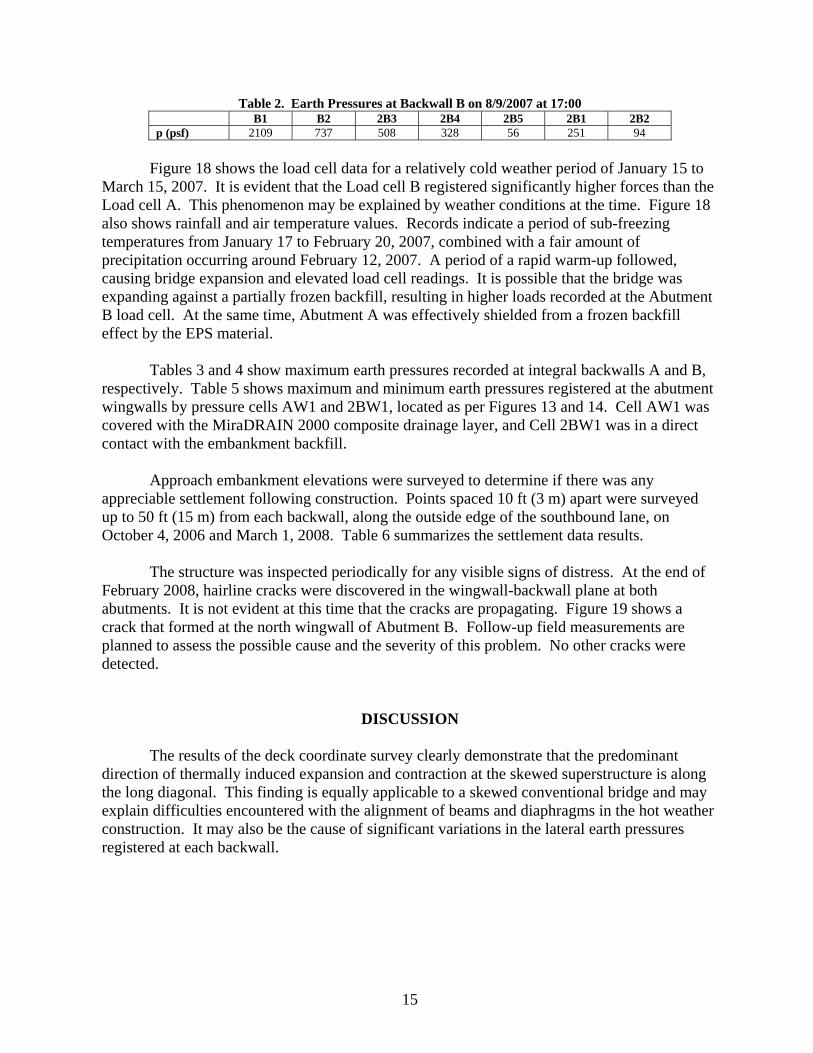
The baseline survey, consisting of a precise coordinate location of each marker installed on the deck surface, was performed on September 19, 2006, at an ambient air temperature of 75oF (24oC). Two additional surveys followed, on January 23, 2007, and on August 7, 2007, at ambient air temperatures of 34oF (1oC) and 85oF (29oC), respectively. The figure shows magnitudes of thermally induced deformations at each corner and at the mid-span of the deck. Table 1 summarizes the resultant overall displacements of each corner as vector sums of x and y components.
Data acquired from the EPS thickness gage indicate that the maximum compression of the elastic inclusion, resulting in a 2.46% strain, occurred on September 9, 2007, at an ambient air temperature of 84oF (29oC). A minimum strain of 0.64% was recorded on January 21, 2008, at an ambient air temperature of 3oF (-16oC). The initial EPS strain of 1.7% was recorded on August 24, 2006, at an ambient air temperature of 80oF (27oC), when the approach embankment backfill reached the deck elevation.
Load cell data indicate that the maximum force of 32 kips (14.6 tonnes) was registered by both cells in the late afternoon of August 9, 2007, at an ambient air temperature of 91oF (33oC). Figure 17 shows load cell data acquired between June 20 and August 31, 2007, reflecting a period of highest recorded values. Corresponding horizontal earth pressures acting on the Abutment B backwall are shown in Table 2.

13
Figure 16. Results of Bridge Coordinate Surveys
14
Table 1. Maximum Resultant Displacement at Deck Corner Points Point Maximum Resultant Displacement (in) (mm)
M1 0.13 (3.2) M3 0.41 (10.4) M4 0.05 (1.3) M6 0.25 (6.3)
Figure 17. Load Cell Data: 6/26/07–8/26/07
15
Table 2. Earth Pressures at Backwall B on 8/9/2007 at 17:00 B1 B2 2B3 2B4 2B5 2B1 2B2 p (psf) 2109 737 508 328 56 251 94
Figure 18 shows the load cell data for a relatively cold weather period of January 15 to
March 15, 2007. It is evident that the Load cell B registered significantly higher forces than the Load cell A. This phenomenon may be explained by weather conditions at the time. Figure 18 also shows rainfall and air temperature values. Records indicate a period of sub-freezing temperatures from January 17 to February 20, 2007, combined with a fair amount of precipitation occurring around February 12, 2007. A period of a rapid warm-up followed, causing bridge expansion and elevated load cell readings. It is possible that the bridge was expanding against a partially frozen backfill, resulting in higher loads recorded at the Abutment B load cell. At the same time, Abutment A was effectively shielded from a frozen backfill effect by the EPS material.
Tables 3 and 4 show maximum earth pressures recorded at integral backwalls A and B,
respectively. Table 5 shows maximum and minimum earth pressures registered at the abutment wingwalls by pressure cells AW1 and 2BW1, located as per Figures 13 and 14. Cell AW1 was covered with the MiraDRAIN 2000 composite drainage layer, and Cell 2BW1 was in a direct contact with the embankment backfill.
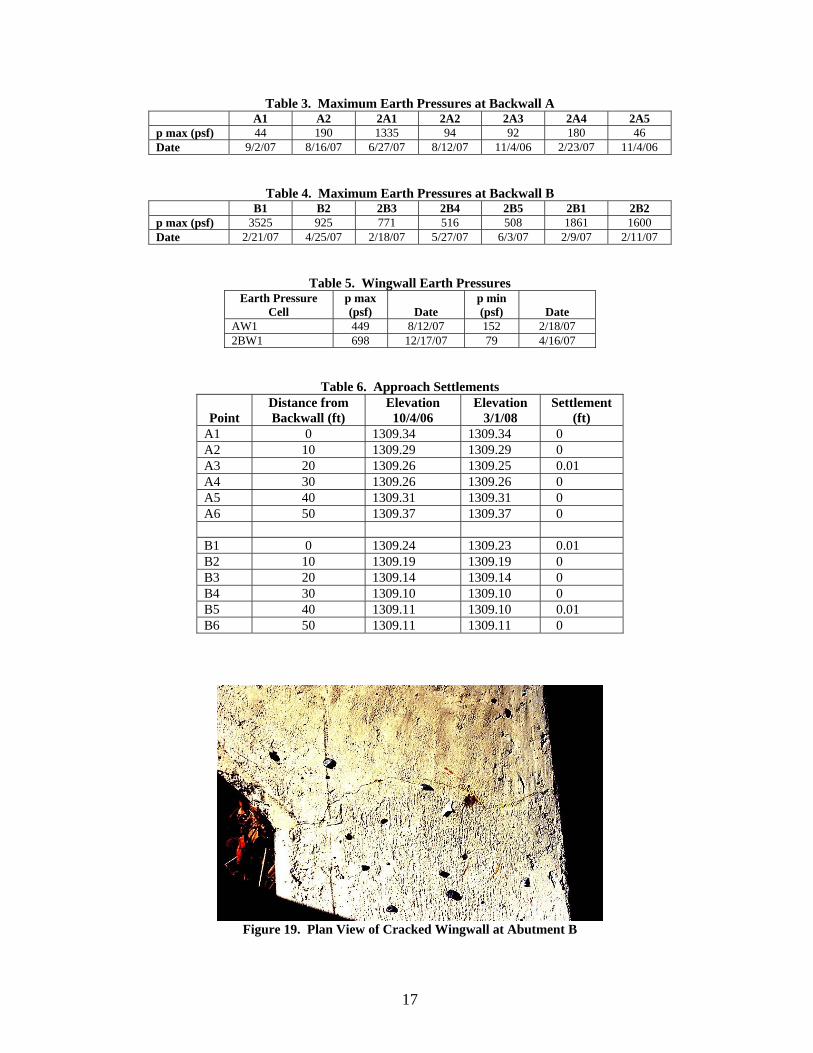
Approach embankment elevations were surveyed to determine if there was any appreciable settlement following construction. Points spaced 10 ft (3 m) apart were surveyed up to 50 ft (15 m) from each backwall, along the outside edge of the southbound lane, on October 4, 2006 and March 1, 2008. Table 6 summarizes the settlement data results. The structure was inspected periodically for any visible signs of distress. At the end of February 2008, hairline cracks were discovered in the wingwall-backwall plane at both abutments. It is not evident at this time that the cracks are propagating. Figure 19 shows a crack that formed at the north wingwall of Abutment B. Follow-up field measurements are planned to assess the possible cause and the severity of this problem. No other cracks were detected.
DISCUSSION The results of the deck coordinate survey clearly demonstrate that the predominant direction of thermally induced expansion and contraction at the skewed superstructure is along the long diagonal. This finding is equally applicable to a skewed conventional bridge and may explain difficulties encountered with the alignment of beams and diaphragms in the hot weather construction. It may also be the cause of significant variations in the lateral earth pressures registered at each backwall.

16
Figure 18. Load Cell Data: 1/15/07–3/15/07
17
Table 3. Maximum Earth Pressures at Backwall A A1 A2 2A1 2A2 2A3 2A4 2A5 p max (psf) 44 190 1335 94 92 180 46 Date 9/2/07 8/16/07 6/27/07 8/12/07 11/4/06 2/23/07 11/4/06
Table 4. Maximum Earth Pressures at Backwall B B1 B2 2B3 2B4 2B5 2B1 2B2 p max (psf) 3525 925 771 516 508 1861 1600 Date 2/21/07 4/25/07 2/18/07 5/27/07 6/3/07 2/9/07 2/11/07
Table 5. Wingwall Earth Pressures Earth Pressure
Cell p max (psf)
Date
p min (psf)
Date
AW1 449 8/12/07 152 2/18/07 2BW1 698 12/17/07 79 4/16/07
Table 6. Approach Settlements
Point Distance from Backwall (ft)
Elevation 10/4/06
Elevation 3/1/08
Settlement (ft)
A1 0 1309.34 1309.34 0 A2 10 1309.29 1309.29 0 A3 20 1309.26 1309.25 0.01 A4 30 1309.26 1309.26 0 A5 40 1309.31 1309.31 0 A6 50 1309.37 1309.37 0 B1 0 1309.24 1309.23 0.01 B2 10 1309.19 1309.19 0 B3 20 1309.14 1309.14 0 B4 30 1309.10 1309.10 0 B5 40 1309.11 1309.10 0.01 B6 50 1309.11 1309.11 0
Figure 19. Plan View of Cracked Wingwall at Abutment B

18
It is important to note the transverse component of the superstructure thermal displacement at Points M6 and M3. This movement must have caused both concrete buttresses and, as a consequence, the entirety of both abutments, including wingwalls, to shift laterally. It is not evident at this stage if the resulting displacement caused the hairline cracking observed at the wingwalls. A relatively large movement measured at Point M3 may also require a reassessment of the design assumption that all thermally induced displacements are fully absorbed within the elastic inclusion.
Earth pressure variations detected at the wingwall cells (AW1 and 2BW1) are a cause for concern, because they may be indicative of some unintended lateral movement (otherwise, these pressures would have remained essentially constant). If the movement was sufficiently large, it could have mobilized an unbalanced passive pressure on the wingwall, possibly causing the observed cracks. Additional field studies are needed to determine the probable cause of the wingwall distress and to update design guidelines if warranted.
The EPS thickness data indicate a range of movements consistent with displacements recorded by the deck coordinate survey. The results to date show that the elastic inclusion is performing as designed, expanding and contracting with seasonal climatic changes. The maximum observed strain value of 2.46% is well below the EPS elastic working range of 10%. The minimum observed strain of 0.64% indicates that the EPS material has remained elastic. The resulting thermal displacement range of 0.27 in (6.9 mm) is approximately one fourth of the AASHTO criteria design range of 1 in (25 mm) (AASHTO, 2007), based on the 120-degree temperature span. Obviously more data need to be collected to validate the long-term behavior of the elastic inclusion, but the results to date appear promising. The apparent satisfactory performance of the elastic inclusion layer may explain the approach embankment settlement data. The results clearly demonstrate negligible settlements after 17 months following bridge construction, validating the notion that approach slabs are not essential on low-traffic roads. It appears that the elastic inclusion combined with a structural backfill behind bridge abutments creates an effective means of reducing the “bump at the end of the bridge.” This is in stark contrast with the commonly reported problem with integral bridges and one that was detected in the previous VDOT design (Hoppe and Gomez, 1996).
The concept of the elastic inclusion combined with structural backfill may potentially be extended to conventional bridges, in order to reduce embankment settlements and the resulting maintenance expenses. In many cases, excessive approach settlements are correlated with inadequate compaction of the fill material adjoining the backwall (Hoppe, 1999). Typically, light, hand-operated compaction equipment is specified because of the concern about generating excessive lateral pressures on the structure. It is possible that the elastic inclusion material secured against the backwall and wingwall may allow for the use of heavier equipment by dissipating compaction-induced lateral stresses. Load cell data show virtually identical maximum forces recorded at both cells at the same time. The maximum registered force of 32 kips (14.6 tonnes) was observed on August 9, 2007. It culminated after an approximately 2-week period of steadily increasing ambient air
19
temperatures. The ensuing thermally induced superstructure expansion was opposed by the adjoining roadway embankments. It is informative to relate the 32-kip force to the corresponding actual magnitude of the lateral earth pressure acting against the integral backwall. Since the bridge is highly skewed, the resultant earth pressures acting on the back of each backwall are non-collinear. This force couple is balanced by concrete buttresses installed at the opposing corners of the superstructure. Each buttress effectively provides a restraining lateral reaction, while allowing the bridge to expand longitudinally. The buttress is designed to prevent the superstructure horizontal rotation with respect to the abutment, possibly causing bearings to lock up and imparting excessive load on the acute corner wing.
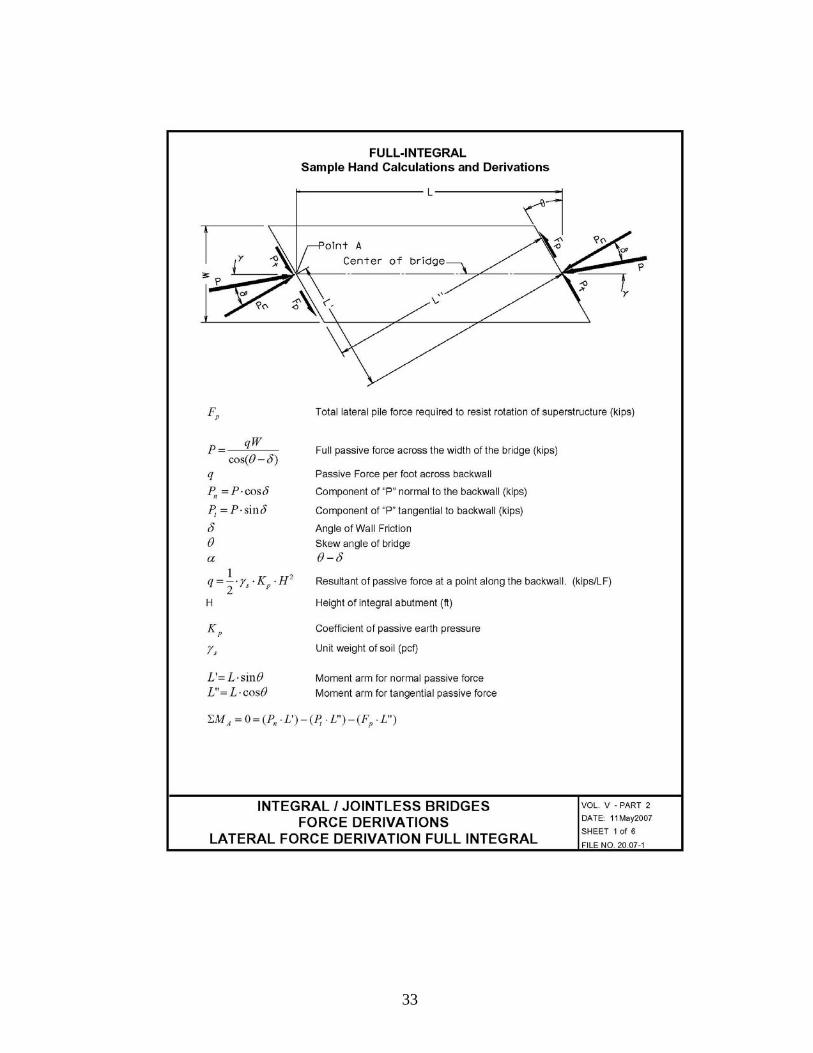
Assuming that the bridge bearing friction is negligible, the buttress reaction force can be translated into the coefficient of passive earth pressure Kp (assuming that the full passive pressure was actually attained in August 2007). Lateral force derivations for semi-integral bridges, developed by the VDOT Jointless Bridge Committee, are presented in Appendix B. It is possible to back-calculate Kp knowing that Rp equals to 32 kips and assuming a typical unit weight of 145 pcf (22.8 kN/m3) for the embankment backfill material. The resulting Kp is approximately 1.2 assuming that the angle of wall friction is 20 degrees and that Pt and Pn forces are mobilized. With a simplified formula, assuming no wall friction, the resulting Kp is approximately 0.6. Table 2 presents horizontal earth pressures acting at the Abutment B backwall at the time when the 32 kip force was recorded at the load cells. Assuming an average pressure of 595 psf (28.5 kPa) at a depth of 3.25 ft (1 m), the resulting estimated ratio of horizontal to vertical stresses, indicative of the Kp value, is approximately 1.2. This is significant, because current VDOT integral bridge guidelines stipulate a relatively conservative minimum design Kp of 4. If a lower value can be validated through additional field observations, a more economical superstructure design can be implemented. The earth pressure data show a substantial variability in the lateral direction, perhaps caused in part by the superstructure preferential expansion along the long diagonal. The results may also be due to the commonly reported field problems with the earth pressure cell compliance. Essentially, a pressure cell may under- or over-register depending on the stiffness of the surrounding material in contact with the sensing surface. It is unlikely that the degree of backfill stiffness is constant along the entire backwall surface. For these reasons, it may be futile to determine the actual earth pressure distribution and the resultant force acting on the backwall of this structure based strictly on data obtained from a few pressure cells. Fortunately, the load cell data can provide a fairly accurate assessment of the resultant force. Although not very informative in terms of absolute resultant values, the earth pressure data are significant when comparing measurements taken behind the EPS material to those registered in a direct contact with the backfill material. It is evident that the presence of elastic inclusion creates an effective “cushioning” effect, resulting in lower thermally induced stresses imparted to the superstructure.

20
CONCLUSIONS • The elastic inclusion at the Route 18 bridge performed satisfactorily during the 17-month
monitoring period. • Significant cost savings can be realized through more economical designs of future integral
bridges if the concept of elastic inclusion is validated through field observations. • The actual coefficient of the passive earth pressure for integral bridges with elastic
inclusion may be significantly lower than the current design value used by VDOT. • Approach embankment settlements at the Route 18 bridge have been negligible. • Abutment wingwalls at the Route 18 bridge show signs of distress. • The predominant direction of thermal expansion and contraction at a skewed superstructure
is along the long diagonal.
RECOMMENDATIONS 1. VTRC should examine possible causes of the abutment wingwall distress at the Route 18
bridge through additional field monitoring and a review of current design guidelines. 2. VTRC should continue monitoring of the long-term behavior of the elastic inclusion at the
Route 18 bridge. The focus should be on the measurement of the long-term elastic properties and the estimation of the design Kp value.
3. VTRC and VDOT’s Structure & Bridge Division should use the field data to validate the
existing design assumptions and make revisions where warranted.
COST AND BENEFITS ASSESSMENT
The most compelling reason for constructing jointless bridges is to eliminate the recurring maintenance costs associated with deteriorated bearings and spalled beam ends, commonly encountered with conventional structures. Based on the current VDOT contracts, these maintenance expenses are estimated to be approximately $366,000 per year in Virginia (K.P. Weakley, personal communication, 2008). The resulting aggregate future value of periodic maintenance expenses is approximately $213 million, considering a typical 75-year bridge design life and the annual cost of money at 4.5%. In the past 7 years, integral bridges constituted between 10% and 30% of the total bridges constructed by VDOT, with 24% reached in 2007. VDOT is committed to the design of jointless bridges where practicable, within a clearly defined set of constraints based on the current state of the practice. It may be possible to

21
consider a greater percentage of bridges for integral design through a better understanding of their field behavior.
In addition, the use of elasticized EPS in conjunction with structural backfill and heavier
compaction equipment can result in reduced maintenance expenses associated with repairs to settling approach embankments. The actual maintenance cost savings on settling approaches are more difficult to assess, since they depend on a multitude of local factors, such as the presence of approach slabs, the nature of subsurface conditions, and the severity of the settlement problem.
The use of elastic inclusion at integral bridges can also result in reduced quantities of
concrete and reinforcing steel required to construct the backwall. For example, a bridge that is 250 ft (76.2 m) long and 46.33 ft (14.1 m) wide with a 10.5 ft (3.2 m) beam spacing, a 30-degree skew, and a backwall 6.33 ft (1.9 m) high would cost approximately $25,000 less if designed for a Kp of 4, instead of a Kp of 12 (the currently assumed value for a granular backfill material). Cost savings would be even more significant if the design Kp value could be reduced to around 1.
ACKNOWLEDGMENTS
This study was supported by the Federal Highway Administration. The authors express their appreciation to Keith Weakley and Eulogio Javier of VDOT’s Staunton District Bridge Office for their helpful guidance and support. Thanks are also extended to the Staunton District bridge and survey crews for their assistance on this project.
Arthur Wagner of VTRC was instrumental with sensor installation and field data
collection. Linda DeGrasse of VTRC helped with data processing and graphing. The authors also acknowledge Randy Combs, Ed Deasy, and Linda Evans of VTRC for their assistance with the graphics and the editorial process.
REFERENCES
American Association of State Highway and Transportation Officials. AASHTO LRFD Bridge Design Specifications, Customary U.S. Units, 4th Ed. Washington, DC, 2007.
Hoppe, E.J. Guidelines for the Use, Design, and Construction of Bridge Approach Slabs.
VTRC 00-R4. Virginia Transportation Research Council, Charlottesville, 1999. Hoppe, E.J. Field Study of Integral Backwall with Elastic Inclusion. VTRC 05-R28. Virginia
Transportation Research Council, Charlottesville, 2005. Hoppe, E.J., and Gomez, J.P. Field Study of an Integral Backwall Bridge. VTRC 97-R7.
Virginia Transportation Research Council, Charlottesville, 1996.

22
Virginia Department of Transportation, Structure and Bridge Division. Manual of the Structure and Bridge Division: Volume V, Part 2, Chapter 20: Integral / Jointless Bridges. Richmond, 2007. http://www.virginiadot.org/business/bridge-v5p2.asp. Accessed June 10, 2008.

23
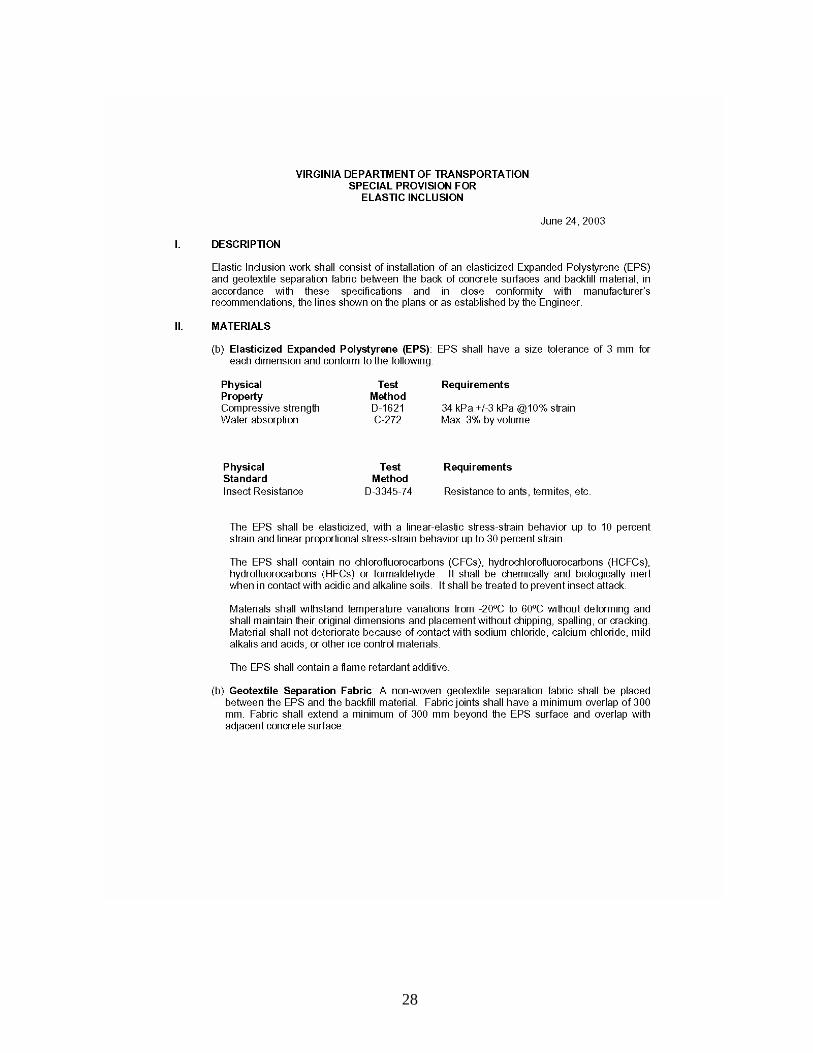
APPENDIX A
VIRGINIA DEPARTMENT OF TRANSPORTATION SPECIAL PROVISION FOR ELASTIC INCLUSION
(ENGLISH AND METRIC VERSIONS)

24
25
26
27
28

29

30

31
APPENDIX B
VIRGINIA DEPARTMENT OF TRANSPORTATION INTEGRAL / JOINTLESS BRIDGES FORCE DERIVATIONS

32
33

34

35

36

37

38