report on wage practices 2015
TRANSCRIPT
Report on Wage Practices
2015
Manpower Research and Statistics Department
Singapore
June 2016
COPYRIGHT NOTICE REPORT ON WAGE PRACTICES 2015 © Manpower Research and Statistics Department Ministry of Manpower Republic of Singapore All rights reserved. Further reproduction of this material is prohibited without the written permission of the copyright holder. Application to reproduce any part of this publication should be addressed to: Director Manpower Research and Statistics Department Ministry of Manpower 18 Havelock Road #05-01 Singapore 059764 Republic of Singapore Email: [email protected] In citation, please credit the source when you extract and use the information/data from the publication.
MISSION
To provide timely and reliable
national statistical information on the labour market
to facilitate informed decision-making within the government and community-at-large
Statistical activities conducted by the Manpower Research and Statistics Department are governed by the
provisions of the Statistics Act (Chapter 317). The Act guarantees the confidentiality of information collected
from individuals and companies. It spells out the legislative authority and responsibility of the Director,
Manpower Research and Statistics Department. The Statistics Act is available in the Singapore Department
of Statistics website at www.singstat.gov.sg.
CONTENTS
Page
Notations and Abbreviations ................................................................................................. i
Highlights ............................................................................................................................ ii
1 Overview .................................................................................................................... 1
2 Background ................................................................................................................ 1
Part 1 Annual Wage Changes
3 General Wage Trends ................................................................................................ 5
4 Wage Changes and Profitability .................................................................................. 8
5 Wage Changes by Type of Employees ..................................................................... 10
6 Wage Increases for Employees Earning Up To $1,100 ............................................. 12
Part 2 Wage Flexibility
7 Adoption of Wage Restructuring Recommendations ................................................. 19
Annex: Statistical Charts and Tables
Survey Coverage and Methodology
MANPOWER RESEARCH AND STATISTICS DEPARTMENT, MINISTRY OF MANPOWER i
Notations - : nil or negligible
s : suppressed
Abbreviations AVC : Annual Variable Component
AWS : Annual Wage Supplement
CPF : Central Provident Fund
CPI : Consumer Price Index
CPI (OOA) : Consumer Price Index excluding imputed rentals on owner-occupied accommodation
DOS : Department of Statistics
GDP : Gross Domestic Product
incl. : Including
KPI : Key Performance Indicator
MOM : Ministry of Manpower
MTI : Ministry of Trade and Industry
MVC : Monthly Variable Component
NRAF : Non Rank-and-File
NWC : National Wages Council
p.a. : Per Annum
PWM : Progressive Wage Model
RAF : Rank-and-File
Cat A : Establishment was profitable and did much better than in the previous year
Cat B : Establishment was profitable and did as well as in the previous year
Cat C : Establishment was profitable but did not do as well as in the previous year
Cat D : Establishment incurred a loss
MANPOWER RESEARCH AND STATISTICS DEPARTMENT, MINISTRY OF MANPOWER ii
HIGHLIGHTS Overview
Total wage growth (including bonuses) in the private sector eased amid softer economic
conditions. However, real wages increased at a faster pace in 2015 than the previous year,
due to negative inflation. Fewer firms were profitable in 2015 compared to 2014, as the
proportion of firms that were more profitable than a year ago declined, and those which were
less profitable or incurred losses increased. As most firms had put in place some form of
flexible and performance-based wage system that gave flexibility to adjust wages according to
the prevailing business climate, the proportion of employers that gave wage increases to their
employees fell in 2015.
Main Findings
Amid softer economic conditions, total wages in the private sector rose by 4.0% in 2015,
down from the 4.9% increase in 2014. Including employer CPF contributions, the growth in
total wages remained stable at 4.9% in 2015, with the increase in employer CPF contribution
rate in 2015. However, as overall inflation was negative, real total wages (including employer
CPF contributions) rose at a faster pace of 5.4% in 2015, compared with 3.9% a year ago.
79% of private establishments reported that they were profitable in 2015, down from the 82%
in 2014. Specifically, the proportion of establishments which were more profitable1 (2015:
12%, 2014: 16%), or as profitable (2015: 29%, 2014: 34%) declined. On the other hand,
establishments which were profitable but did not do as well as the previous year (2015: 38%,
2014: 32%), or incurred losses (2015: 21%, 2014: 18%) rose.
Most employers put in place some form of flexible and performance-based wage system.
Specifically, 90% of private sector employees were under some form of flexible wage system
in 2015, the highest since 2004. Having a narrower maximum-minimum salary ratio remained
the most common wage recommendation adopted, covering two in three (66%) private sector
employees in December 2015. This was followed by linking variable bonus to Key
Performance Indicators (KPI) (52%) and having the Monthly Variable Component (MVC)
(32%) in the wage structure.
A smaller proportion of establishments raised wages in 2015 than a year ago. 64% of private
establishments raised the total wages of their employees in 2015, down from 72% in 2014.
There was an increase in the proportion of firms which kept wages unchanged from the
previous year (2015: 25%, 2014: 20%), and to a smaller extent, cut wages (2015: 11%, 2014:
7.7%).
Among the private establishments with employees earning a monthly basic salary of up to
$1,100 in 2015, 46% granted wage increases to those employees. This was lower than the
59% in 2014 for employees earning up to $1,000. Specifically, 18% gave increments equal to
or more than the NWC’s recommended built-in wage increase of $60 in 2015, compared to
1 Compared to the previous year’s profits
MANPOWER RESEARCH AND STATISTICS DEPARTMENT, MINISTRY OF MANPOWER iii
31% a year ago.2 Among firms that did not grant wage increases, half indicated that they were
already paying the workers the market rate, while others cited poor business and high
business costs as reasons.
2 Over the year, the proportion of full-time resident employees earning a basic monthly salary of up to $1,100 is estimated to have
decreased from 8.2% in 2014 to 6.9% in 2015. Source: Comprehensive Labour Force Survey and Occupational Wage Survey, Manpower Research and Statistics Department, MOM
MANPOWER RESEARCH AND STATISTICS DEPARTMENT, MINISTRY OF MANPOWER 1
Report on Wage Practices 2015
1 Overview
1.1 Wages continued to grow in 2015. While the pace moderated from a year ago amid
softer economic conditions, real wages grew faster due to negative inflation. Fewer firms were
profitable in 2015 compared to 2014, as the proportion of firms that were more profitable than a
year ago declined, and those which were less profitable or incurred losses increased. As most
firms had put in place some form of flexible and performance-based wage system that gave
flexibility to adjust wages according to the prevailing business climate, the proportion of employers
that gave wage increases to their employees fell in 2015.
1.2 The findings are based on data from the Survey on Annual Wage Changes3 which
effectively covered 5,100 private establishments each with at least 10 employees. The survey
yielded a survey response rate of 92%. The survey coverage and methodology are in Annex 2.
2 Background
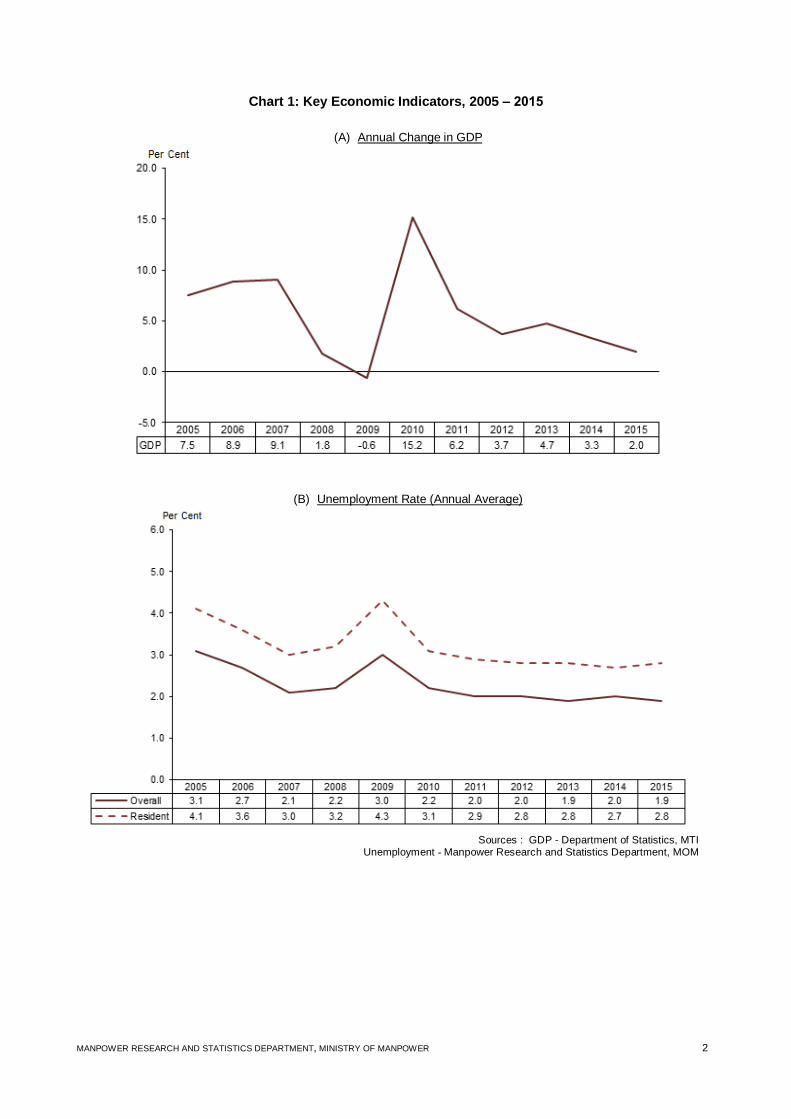
2.1 The Singapore economy grew at a more moderate pace in 2015 compared with a year
ago (Chart 1). Inflation eased from 1.0% in 2014 to -0.5% in 2015.4 Unemployment remained low
and broadly unchanged since 2011, even though total employment growth has slowed to 32,300
or 0.9%, from the 3 to 4% growth between 2010 and 2014.5
3 Data on annual wage change from the survey refer to the change in wages paid to full-time resident employees in continuous
employment of at least one year. This is the only source that provides breakdown of total wage changes into changes in basic wages and bonuses for three categories of employees, namely the rank-and-file, junior management and senior management.
4 Measured using Consumer Price Index (CPI) for all items. Similarly, CPI excluding imputed rentals on owner-occupied
accommodation (OOA), which relate more to the actual spending of households, eased from a 1.2% growth to 0.1% in 2015. 5 Local employment growth was flat (700 or 0.0%) in 2015, after growing strongly in 2014 (96,000 or 4.4%) and 2013 (82,900 or 4.0%)
while foreign employment gains continued to moderate since 2011 (2015: 31,600 or 2.3%; 2014: 2.6%; 2013: 4.2%; 2012: 5.9%; 2011: 7.6%).
MANPOWER RESEARCH AND STATISTICS DEPARTMENT, MINISTRY OF MANPOWER 2
Chart 1: Key Economic Indicators, 2005 ‒ 2015
(A) Annual Change in GDP
(B) Unemployment Rate (Annual Average)
Sources : GDP - Department of Statistics, MTI Unemployment - Manpower Research and Statistics Department, MOM
MANPOWER RESEARCH AND STATISTICS DEPARTMENT, MINISTRY OF MANPOWER 3
Proportion of profitable establishments declined amid softer economic conditions
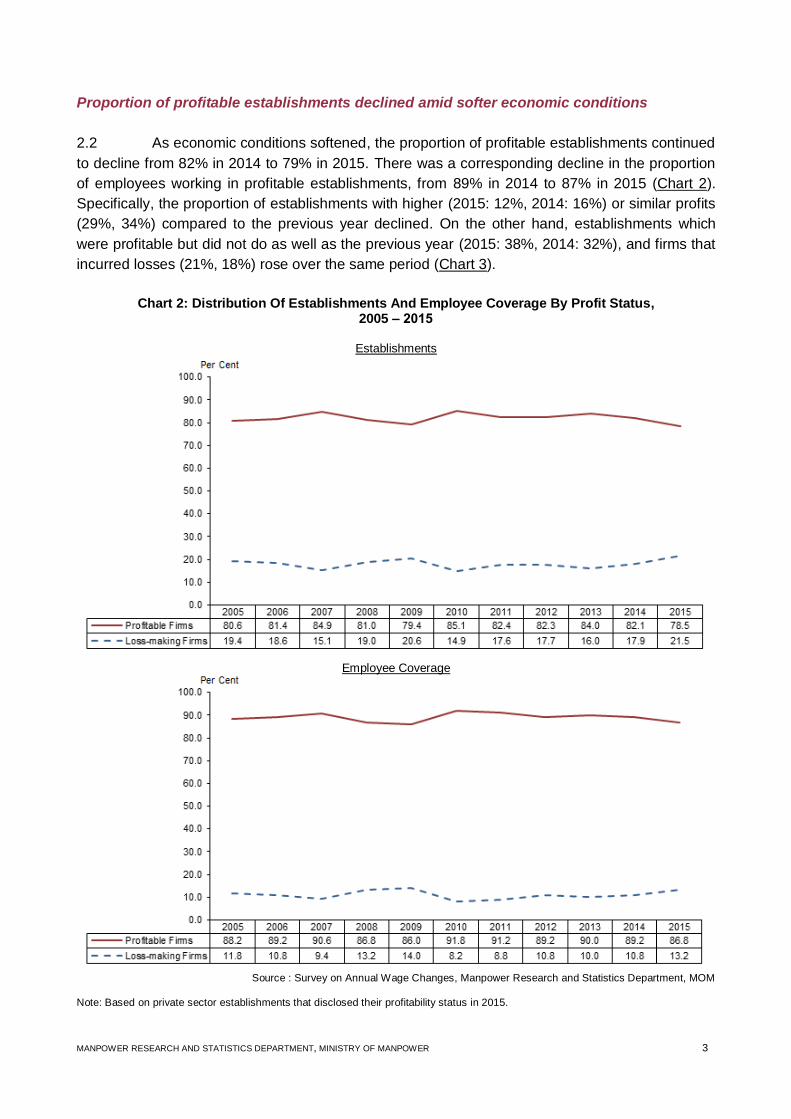
2.2 As economic conditions softened, the proportion of profitable establishments continued
to decline from 82% in 2014 to 79% in 2015. There was a corresponding decline in the proportion
of employees working in profitable establishments, from 89% in 2014 to 87% in 2015 (Chart 2).
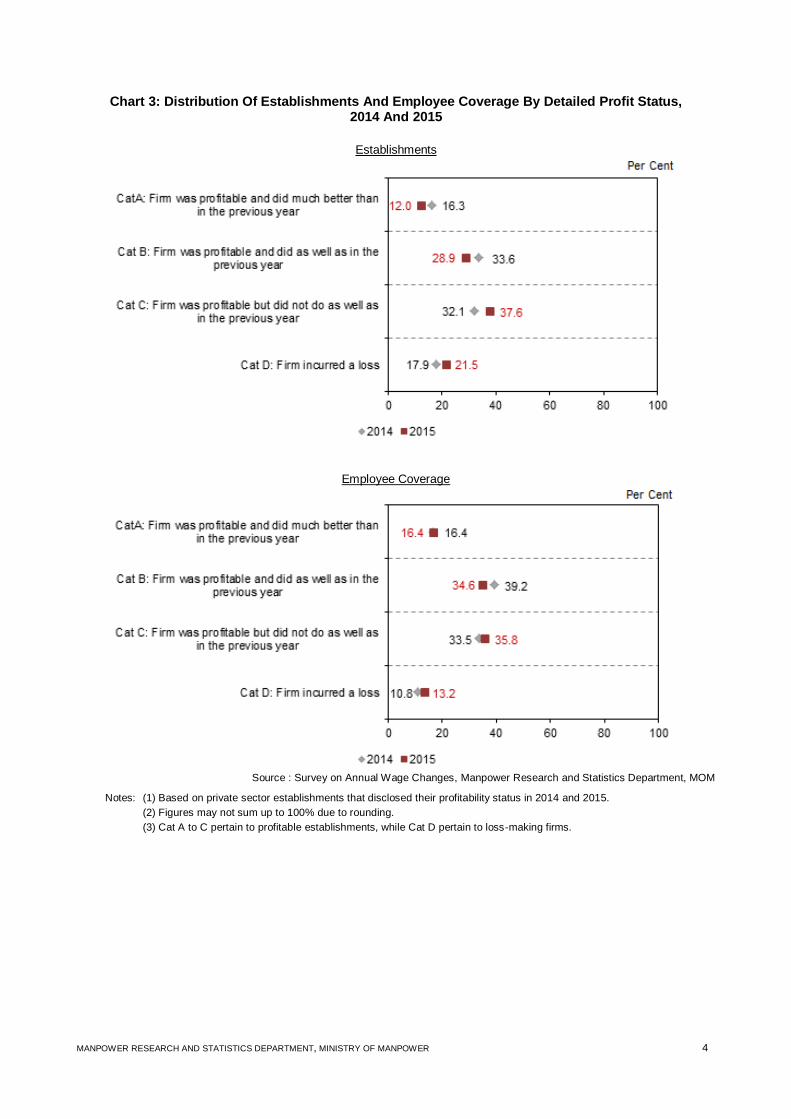
Specifically, the proportion of establishments with higher (2015: 12%, 2014: 16%) or similar profits
(29%, 34%) compared to the previous year declined. On the other hand, establishments which
were profitable but did not do as well as the previous year (2015: 38%, 2014: 32%), and firms that
incurred losses (21%, 18%) rose over the same period (Chart 3).
Chart 2: Distribution Of Establishments And Employee Coverage By Profit Status, 2005 ‒ 2015
Establishments
Employee Coverage
Source : Survey on Annual Wage Changes, Manpower Research and Statistics Department, MOM
Note: Based on private sector establishments that disclosed their profitability status in 2015.
MANPOWER RESEARCH AND STATISTICS DEPARTMENT, MINISTRY OF MANPOWER 4
Chart 3: Distribution Of Establishments And Employee Coverage By Detailed Profit Status, 2014 And 2015
Establishments
Employee Coverage
Source : Survey on Annual Wage Changes, Manpower Research and Statistics Department, MOM
Notes: (1) Based on private sector establishments that disclosed their profitability status in 2014 and 2015.
(2) Figures may not sum up to 100% due to rounding.
(3) Cat A to C pertain to profitable establishments, while Cat D pertain to loss-making firms.
MANPOWER RESEARCH AND STATISTICS DEPARTMENT, MINISTRY OF MANPOWER 5
Part I Annual Wage Changes
3 General Wage Trends
Wage increases moderated in 2015, but real wage growth picked up pace due to negative
inflation
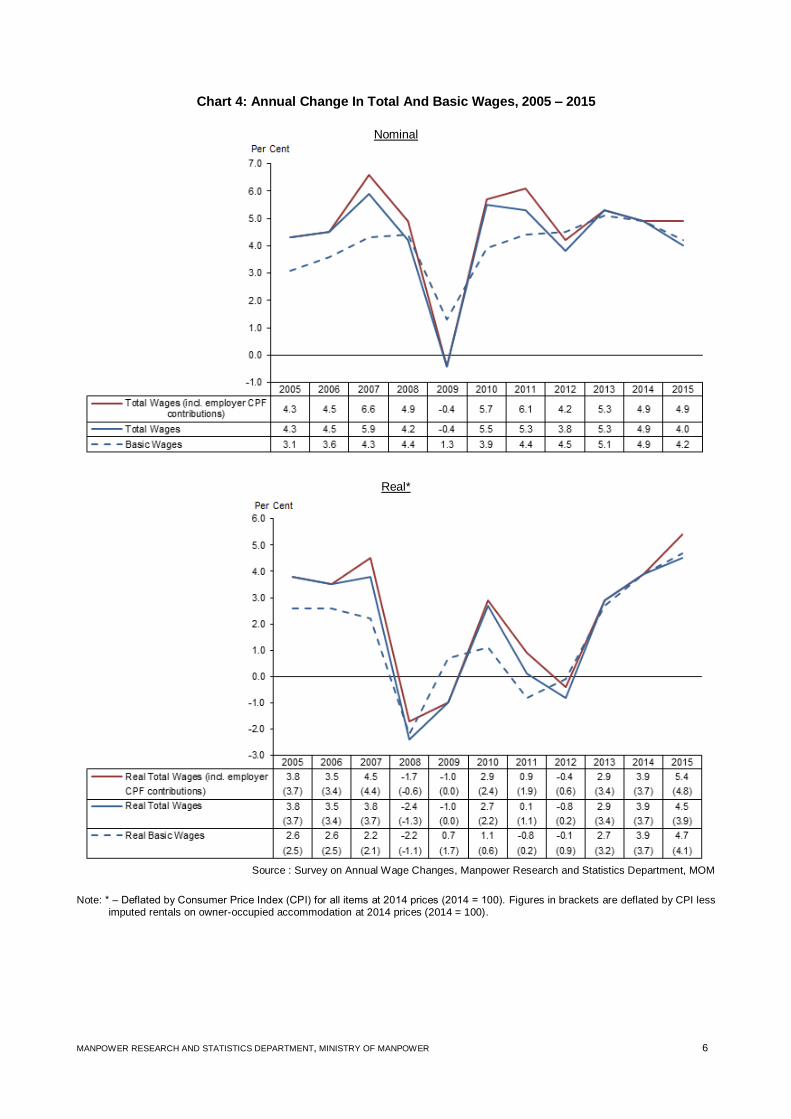
3.1 Amid softer economic conditions, total wage growth (comprising of basic wages and
bonuses) declined from 4.9% in 2014 to 4.0% in 2015. This was due to a moderation in basic
wage growth from 4.9% in 2014 to 4.2% in 2015, and lower bonus payment, from 2.21 months of
basic wages to 2.17 months. When employer CPF contributions were included, total wage growth
remained stable in 2015 at 4.9%, due to an increase in employer CPF contributions in 2015.6
3.2 Due to negative inflation, real total wages, both including and excluding CPF, grew at a
faster pace (Chart 4).
6 The main employer CPF contribution rate rose from 16.0% in 2014 to 17.0% in 2015.
MANPOWER RESEARCH AND STATISTICS DEPARTMENT, MINISTRY OF MANPOWER 6
Chart 4: Annual Change In Total And Basic Wages, 2005 – 2015
Nominal
Real*
Source : Survey on Annual Wage Changes, Manpower Research and Statistics Department, MOM
Note: * ‒ Deflated by Consumer Price Index (CPI) for all items at 2014 prices (2014 = 100). Figures in brackets are deflated by CPI less imputed rentals on owner-occupied accommodation at 2014 prices (2014 = 100).
MANPOWER RESEARCH AND STATISTICS DEPARTMENT, MINISTRY OF MANPOWER 7
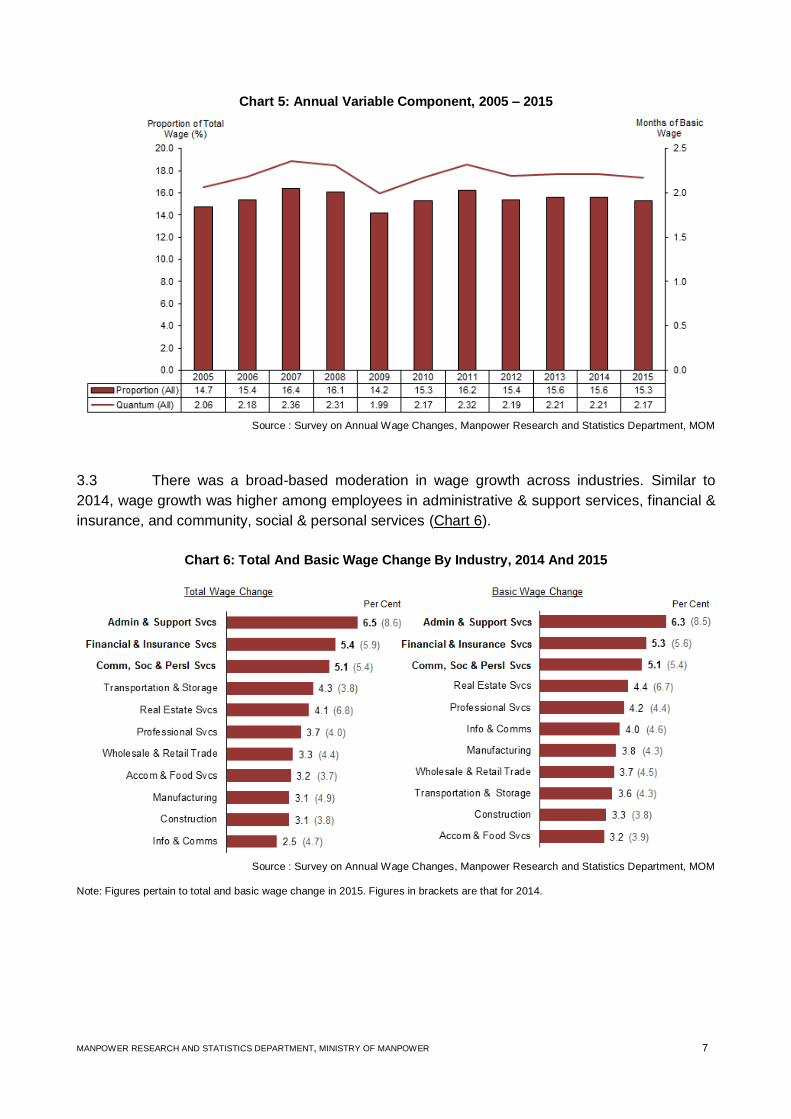
Chart 5: Annual Variable Component, 2005 – 2015
Source : Survey on Annual Wage Changes, Manpower Research and Statistics Department, MOM
3.3 There was a broad-based moderation in wage growth across industries. Similar to
2014, wage growth was higher among employees in administrative & support services, financial &
insurance, and community, social & personal services (Chart 6).
Chart 6: Total And Basic Wage Change By Industry, 2014 And 2015
Source : Survey on Annual Wage Changes, Manpower Research and Statistics Department, MOM
Note: Figures pertain to total and basic wage change in 2015. Figures in brackets are that for 2014.
MANPOWER RESEARCH AND STATISTICS DEPARTMENT, MINISTRY OF MANPOWER 8
4 Wage Changes and Profitability
Fewer establishments raised total wages in 2015 than a year ago; those that did so gave a
smaller quantum of increase
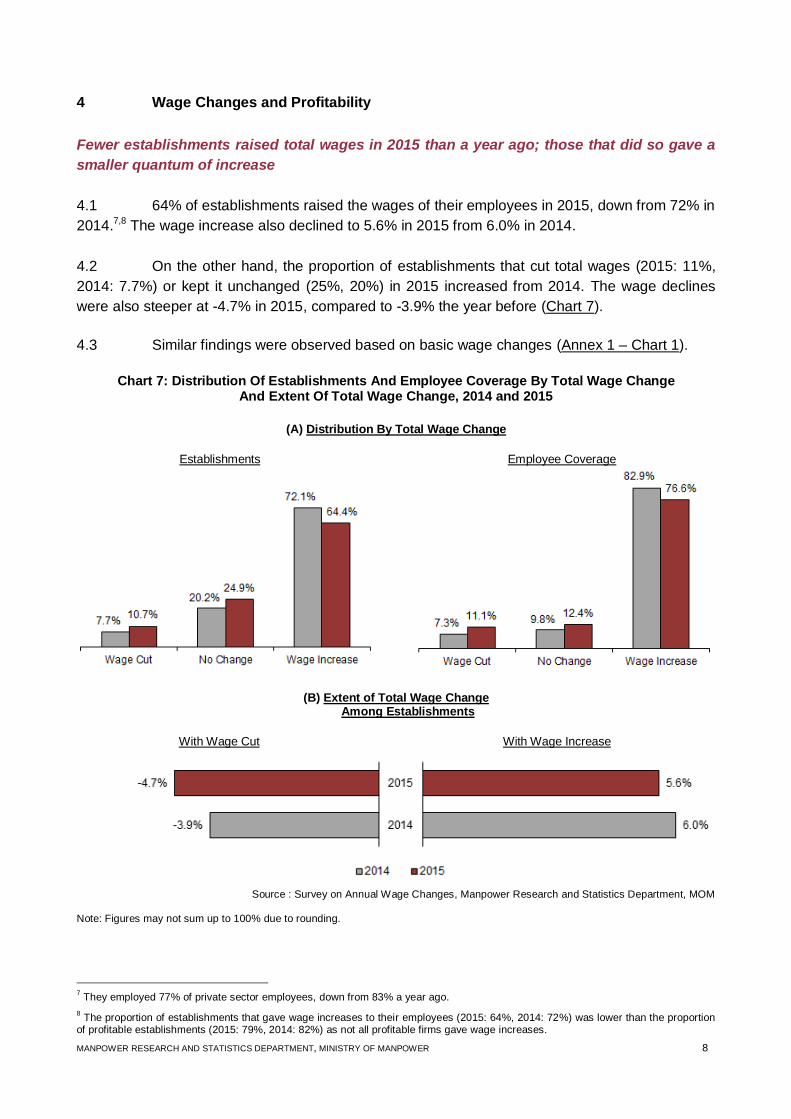
4.1 64% of establishments raised the wages of their employees in 2015, down from 72% in
2014.7,8 The wage increase also declined to 5.6% in 2015 from 6.0% in 2014.
4.2 On the other hand, the proportion of establishments that cut total wages (2015: 11%,
2014: 7.7%) or kept it unchanged (25%, 20%) in 2015 increased from 2014. The wage declines
were also steeper at -4.7% in 2015, compared to -3.9% the year before (Chart 7).
4.3 Similar findings were observed based on basic wage changes (Annex 1 ‒ Chart 1).
Chart 7: Distribution Of Establishments And Employee Coverage By Total Wage Change
And Extent Of Total Wage Change, 2014 and 2015
(A) Distribution By Total Wage Change
Establishments Employee Coverage
(B) Extent of Total Wage Change Among Establishments
With Wage Cut With Wage Increase
Source : Survey on Annual Wage Changes, Manpower Research and Statistics Department, MOM Note: Figures may not sum up to 100% due to rounding.
7 They employed 77% of private sector employees, down from 83% a year ago.
8 The proportion of establishments that gave wage increases to their employees (2015: 64%, 2014: 72%) was lower than the proportion
of profitable establishments (2015: 79%, 2014: 82%) as not all profitable firms gave wage increases.
MANPOWER RESEARCH AND STATISTICS DEPARTMENT, MINISTRY OF MANPOWER 9
Wage increases and bonuses remained closely related to profitability
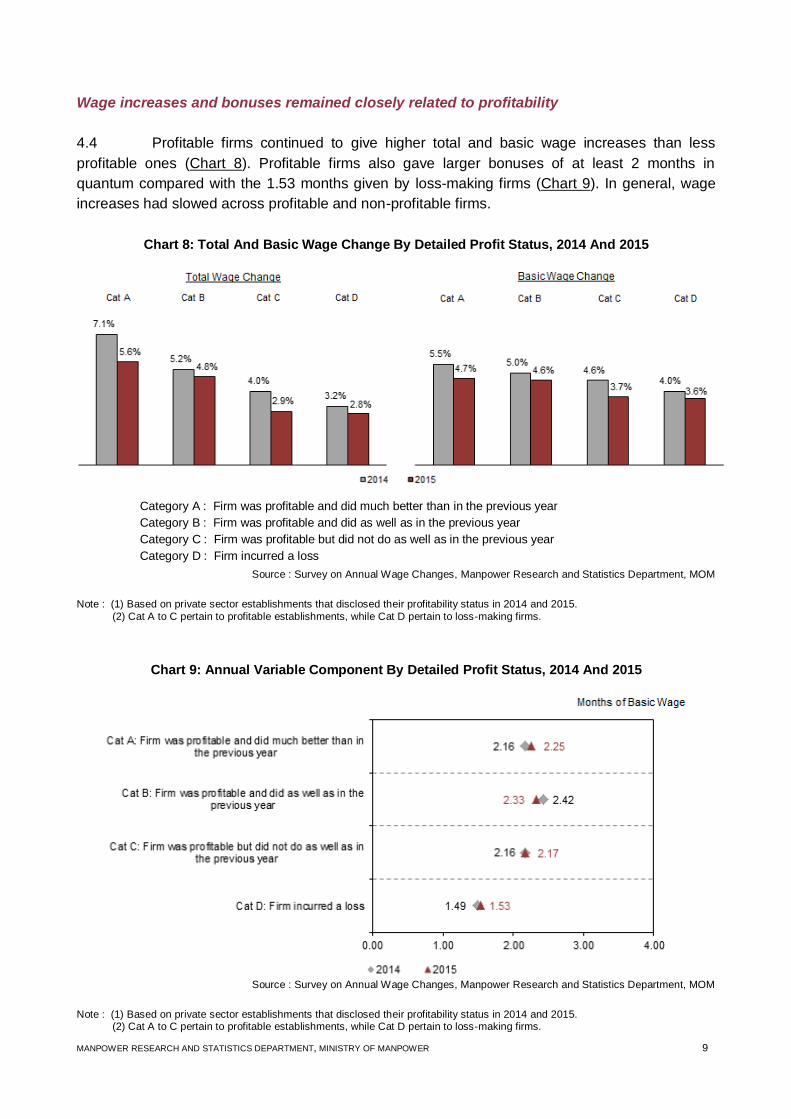
4.4 Profitable firms continued to give higher total and basic wage increases than less
profitable ones (Chart 8). Profitable firms also gave larger bonuses of at least 2 months in
quantum compared with the 1.53 months given by loss-making firms (Chart 9). In general, wage
increases had slowed across profitable and non-profitable firms.
Chart 8: Total And Basic Wage Change By Detailed Profit Status, 2014 And 2015
Source : Survey on Annual Wage Changes, Manpower Research and Statistics Department, MOM
Note : (1) Based on private sector establishments that disclosed their profitability status in 2014 and 2015.
(2) Cat A to C pertain to profitable establishments, while Cat D pertain to loss-making firms.
Chart 9: Annual Variable Component By Detailed Profit Status, 2014 And 2015
Source : Survey on Annual Wage Changes, Manpower Research and Statistics Department, MOM
Note : (1) Based on private sector establishments that disclosed their profitability status in 2014 and 2015. (2) Cat A to C pertain to profitable establishments, while Cat D pertain to loss-making firms.
Category A : Firm was profitable and did much better than in the previous year
Category B : Firm was profitable and did as well as in the previous year
Category C : Firm was profitable but did not do as well as in the previous year
Category D : Firm incurred a loss
MANPOWER RESEARCH AND STATISTICS DEPARTMENT, MINISTRY OF MANPOWER 10
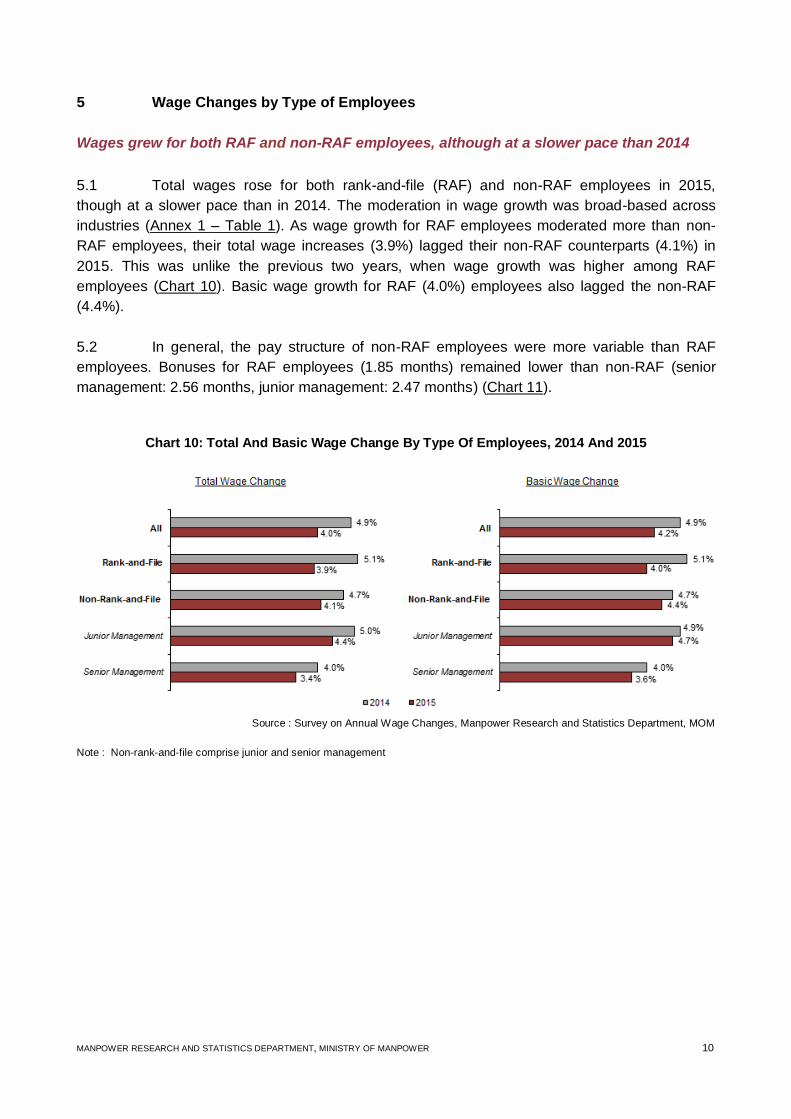
5 Wage Changes by Type of Employees
Wages grew for both RAF and non-RAF employees, although at a slower pace than 2014
5.1 Total wages rose for both rank-and-file (RAF) and non-RAF employees in 2015,
though at a slower pace than in 2014. The moderation in wage growth was broad-based across
industries (Annex 1 – Table 1). As wage growth for RAF employees moderated more than non-
RAF employees, their total wage increases (3.9%) lagged their non-RAF counterparts (4.1%) in
2015. This was unlike the previous two years, when wage growth was higher among RAF
employees (Chart 10). Basic wage growth for RAF (4.0%) employees also lagged the non-RAF
(4.4%).
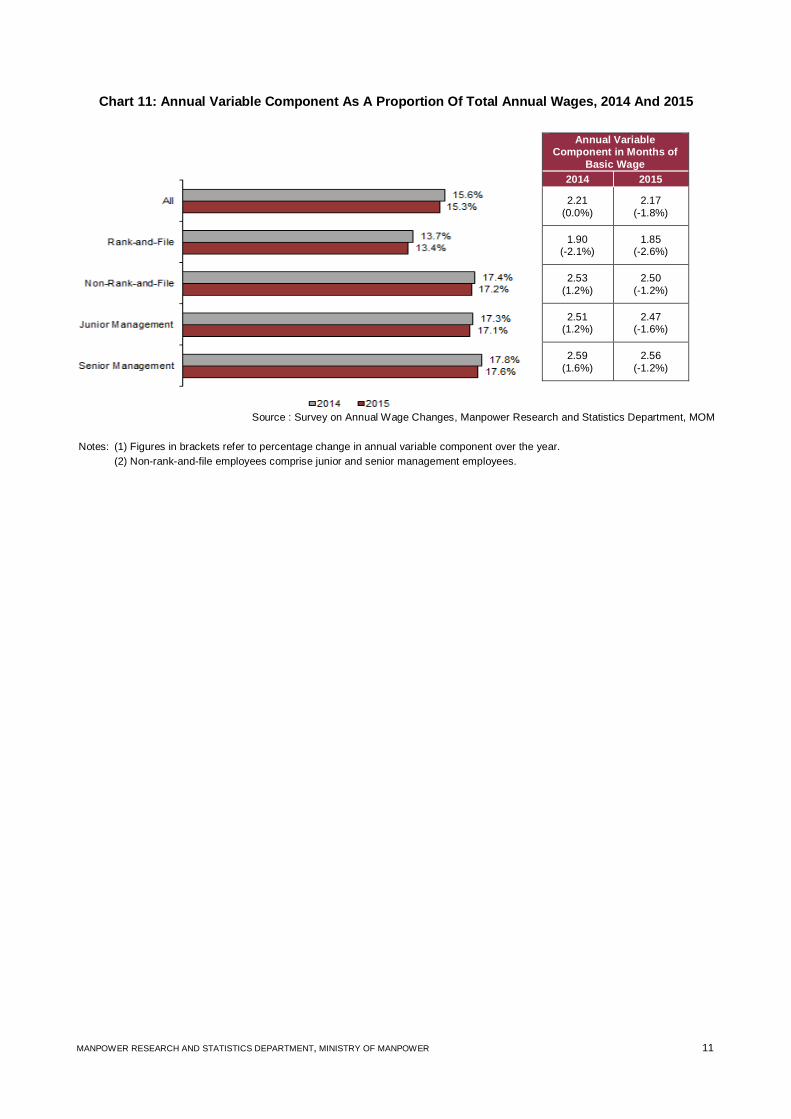
5.2 In general, the pay structure of non-RAF employees were more variable than RAF
employees. Bonuses for RAF employees (1.85 months) remained lower than non-RAF (senior
management: 2.56 months, junior management: 2.47 months) (Chart 11).
Chart 10: Total And Basic Wage Change By Type Of Employees, 2014 And 2015
Source : Survey on Annual Wage Changes, Manpower Research and Statistics Department, MOM
Note : Non-rank-and-file comprise junior and senior management
MANPOWER RESEARCH AND STATISTICS DEPARTMENT, MINISTRY OF MANPOWER 11
Chart 11: Annual Variable Component As A Proportion Of Total Annual Wages, 2014 And 2015
Annual Variable Component in Months of
Basic Wage
2014 2015
2.21
(0.0%)
2.17
(-1.8%)
1.90 (-2.1%)
1.85 (-2.6%)
2.53
(1.2%)
2.50
(-1.2%)
2.51 (1.2%)
2.47 (-1.6%)
2.59
(1.6%)
2.56
(-1.2%)
Source : Survey on Annual Wage Changes, Manpower Research and Statistics Department, MOM
Notes: (1) Figures in brackets refer to percentage change in annual variable component over the year.
(2) Non-rank-and-file employees comprise junior and senior management employees.
MANPOWER RESEARCH AND STATISTICS DEPARTMENT, MINISTRY OF MANPOWER 12
6 Wage Increases for Employees Earning Up To $1,100
6.1 Starting from its 2012/2013 guidelines, the National Wages Council (NWC) gave focus
to low-wage workers with three rounds of quantitative wage recommendations for those earning a
basic monthly salary of up to $1,000. The recommended minimum built-in wage increase was $50
in 2012, and $60 in 2013 and 2014. To provide continued focus to those at the lower end, the
NWC recommended that employers grant a built-in wage increase of at least $60 to workers
earning a basic monthly salary of up to $1,100 in its 2015/2016 guidelines, raising the minimum
threshold from previous years.
Proportion of establishments that gave/intended to give wage increases to employees
earning up to $1,100/$1,000 declined, including those that gave NWC’s recommended built-
in wage increase of at least $60
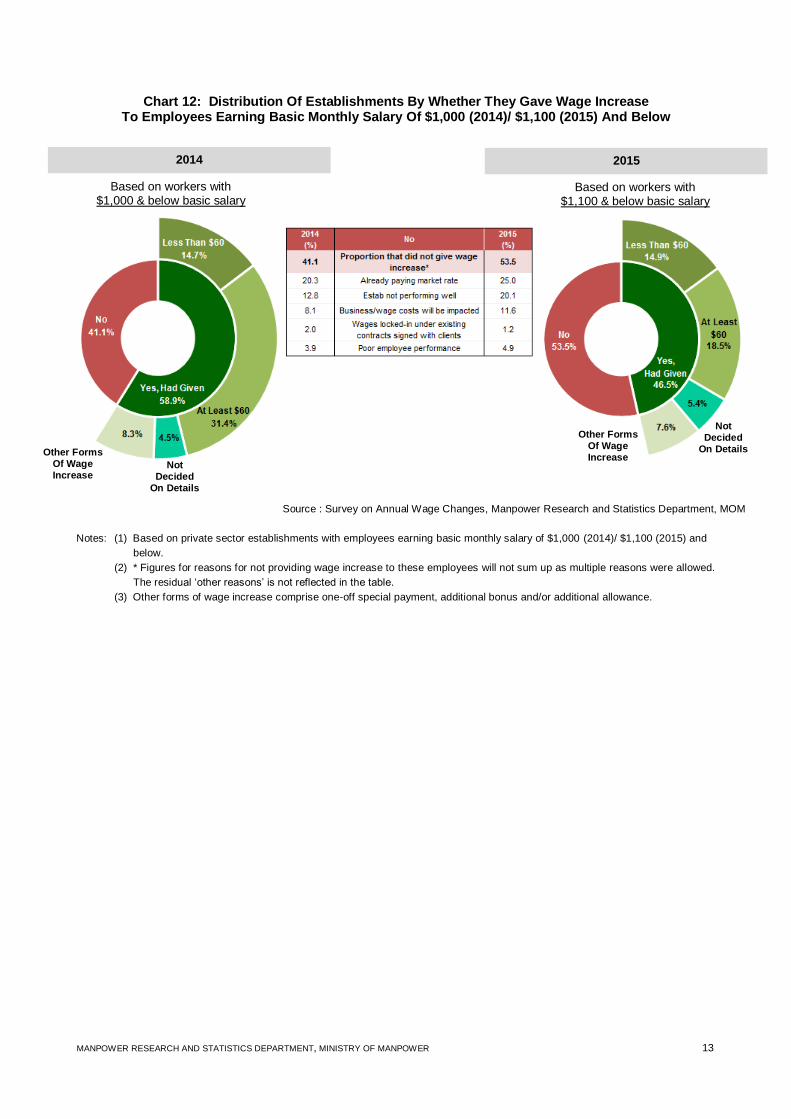
6.2 46% of private establishments with employees earning up to $1,100 monthly in basic
salary gave/intended to give wage increases to these employees in 2015. This was lower than the
59% that gave/intended to give employees earning up to $1,000 in 2014. The decline was due to a
drop in proportion of establishments which gave NWC’s recommended built-in wage increase of at
least $60 from 31% in 2014 to 18% in 2015.9 The proportion of establishments that gave an
increase of less than $60 (2015: 15%, 2014: 15%), provided other forms of wage increases10
(7.6%, 8.3%) or had not decided on the details (5.4%, 4.5%) was broadly comparable to a year
ago (Chart 12).
6.3 Among the 54% of private establishments that did not grant wage increases, almost
half (25%) indicated that they were already paying market rate. Other reasons include not
performing well (20%) or business/wage cost would be impacted (12%). A minority cited poor
employee performance (4.9%) or wages were locked in under existing contracts with clients
(1.2%).
9 Over the year, the proportion of full-time resident employees earning a basic monthly salary of up to $1,100 is estimated to have
decreased from 8.2% in 2014 to 6.9% in 2015. Source: Comprehensive Labour Force Survey and Occupational Wage Survey,
Manpower Research and Statistics Department, MOM
10 Other forms of wage increase comprise one-off special payment, additional bonus and/or additional allowance.
MANPOWER RESEARCH AND STATISTICS DEPARTMENT, MINISTRY OF MANPOWER 13
Chart 12: Distribution Of Establishments By Whether They Gave Wage Increase To Employees Earning Basic Monthly Salary Of $1,000 (2014)/ $1,100 (2015) And Below
Source : Survey on Annual Wage Changes, Manpower Research and Statistics Department, MOM
Notes: (1) Based on private sector establishments with employees earning basic monthly salary of $1,000 (2014)/ $1,100 (2015) and
below.
(2) * Figures for reasons for not providing wage increase to these employees will not sum up as multiple reasons were allowed.
The residual ‘other reasons’ is not reflected in the table.
(3) Other forms of wage increase comprise one-off special payment, additional bonus and/or additional allowance.
2014
Based on workers with $1,000 & below basic salary
Other Forms Of Wage Increase
Not Decided
On Details Other Forms Of Wage Increase
Not Decided
On Details
2015
Based on workers with $1,100 & below basic salary
MANPOWER RESEARCH AND STATISTICS DEPARTMENT, MINISTRY OF MANPOWER 14
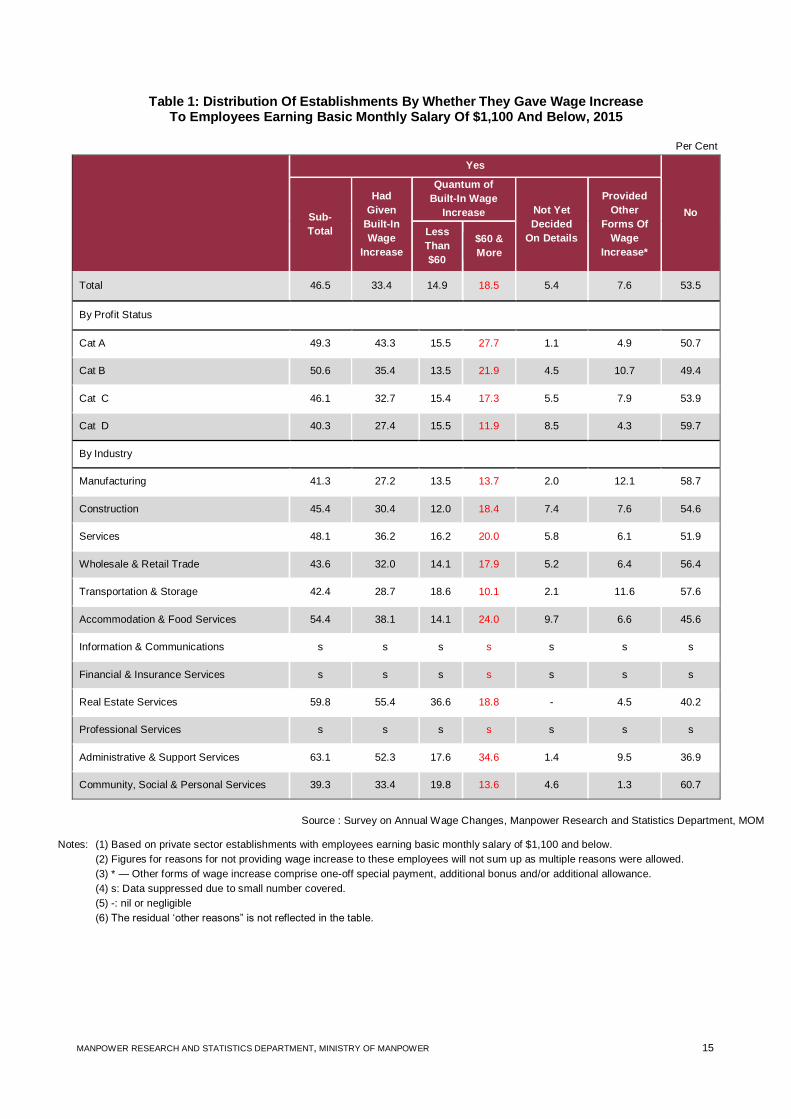
Profitable firms remained more likely to give built-in wage increase
6.4 Expectedly, the proportion of profitable (in Category A to C) establishments which gave
wage increases to employees earning up to $1,100 was higher than non-profitable (Category D)
ones. Profitable establishments were also more likely to give at least $60 built-in wage increase
(Table 1).
Administrative & support services continued to lead in giving at least $60 built-in wage
increase recommended by NWC
6.5 More than one in three (35%) of establishments in administrative & support services
gave at least $60 built-in wage increase to their employees earning up to $1,100 in 2015,
significantly higher than in other industries (10% to 24%). This was driven by the security sector,
where more establishments raised the basic wages of their low-wage employees to meet the
requirements of the Progressive Wage Model (PWM), that will be made mandatory from
September 201611 (Table 1).
11
The Progressive Wage Model (PWM) for the Security sector was introduced in October 2014, following recommendations by the Security Tripartite Cluster (STC). Under the PWM, the basic monthly salary for a full-time security officer would be $1,100. To ensure
that there is uniform adoption of the PWM, compliance with the wage and training requirements will be one of the licensing conditions for security agencies. The Police Licensing and Regulatory Department (PLRD) will be incorporating the PWM in its existing licensing framework for security agencies. Based on the feedback from industry players, the Government has provided a lead time of two years
for the industry to comply with the PWM training and wages requirements. From 1 September 2016, security agencies must ensure their security officers receive the required training and are paid wages that are in line or higher than the progressive wage levels specified in the PWM. More information are available at:
https://www.ntuc.org.sg/wps/portal/up2/home/searchresultsdetails/news?WCM_GLOBAL_CONTEXT=/Content_Library/ntuc/home/about%20ntuc/newsroom/media%20releases/3bd06f1b-acf4-464f-b38d-add73243e377
MANPOWER RESEARCH AND STATISTICS DEPARTMENT, MINISTRY OF MANPOWER 15
Table 1: Distribution Of Establishments By Whether They Gave Wage Increase To Employees Earning Basic Monthly Salary Of $1,100 And Below, 2015
Per Cent
Yes
No Sub-
Total
Had
Given
Built-In
Wage
Increase
Quantum of
Built-In Wage
Increase Not Yet
Decided
On Details
Provided
Other
Forms Of
Wage
Increase*
Less
Than
$60
$60 &
More
Total 46.5 33.4 14.9 18.5 5.4 7.6 53.5
By Profit Status
Cat A 49.3 43.3 15.5 27.7 1.1 4.9 50.7
Cat B 50.6 35.4 13.5 21.9 4.5 10.7 49.4
Cat C 46.1 32.7 15.4 17.3 5.5 7.9 53.9
Cat D 40.3 27.4 15.5 11.9 8.5 4.3 59.7
By Industry
Manufacturing 41.3 27.2 13.5 13.7 2.0 12.1 58.7
Construction 45.4 30.4 12.0 18.4 7.4 7.6 54.6
Services 48.1 36.2 16.2 20.0 5.8 6.1 51.9
Wholesale & Retail Trade 43.6 32.0 14.1 17.9 5.2 6.4 56.4
Transportation & Storage 42.4 28.7 18.6 10.1 2.1 11.6 57.6
Accommodation & Food Services 54.4 38.1 14.1 24.0 9.7 6.6 45.6
Information & Communications s s s s s s s
Financial & Insurance Services s s s s s s s
Real Estate Services 59.8 55.4 36.6 18.8 - 4.5 40.2
Professional Services s s s s s s s
Administrative & Support Services 63.1 52.3 17.6 34.6 1.4 9.5 36.9
Community, Social & Personal Services 39.3 33.4 19.8 13.6 4.6 1.3 60.7
Source : Survey on Annual Wage Changes, Manpower Research and Statistics Department, MOM
Notes: (1) Based on private sector establishments with employees earning basic monthly salary of $1,100 and below.
(2) Figures for reasons for not providing wage increase to these employees will not sum up as multiple reasons were allowed.
(3) * — Other forms of wage increase comprise one-off special payment, additional bonus and/or additional allowance.
(4) s: Data suppressed due to small number covered.
(5) -: nil or negligible
(6) The residual ‘other reasons” is not reflected in the table.
MANPOWER RESEARCH AND STATISTICS DEPARTMENT, MINISTRY OF MANPOWER 16
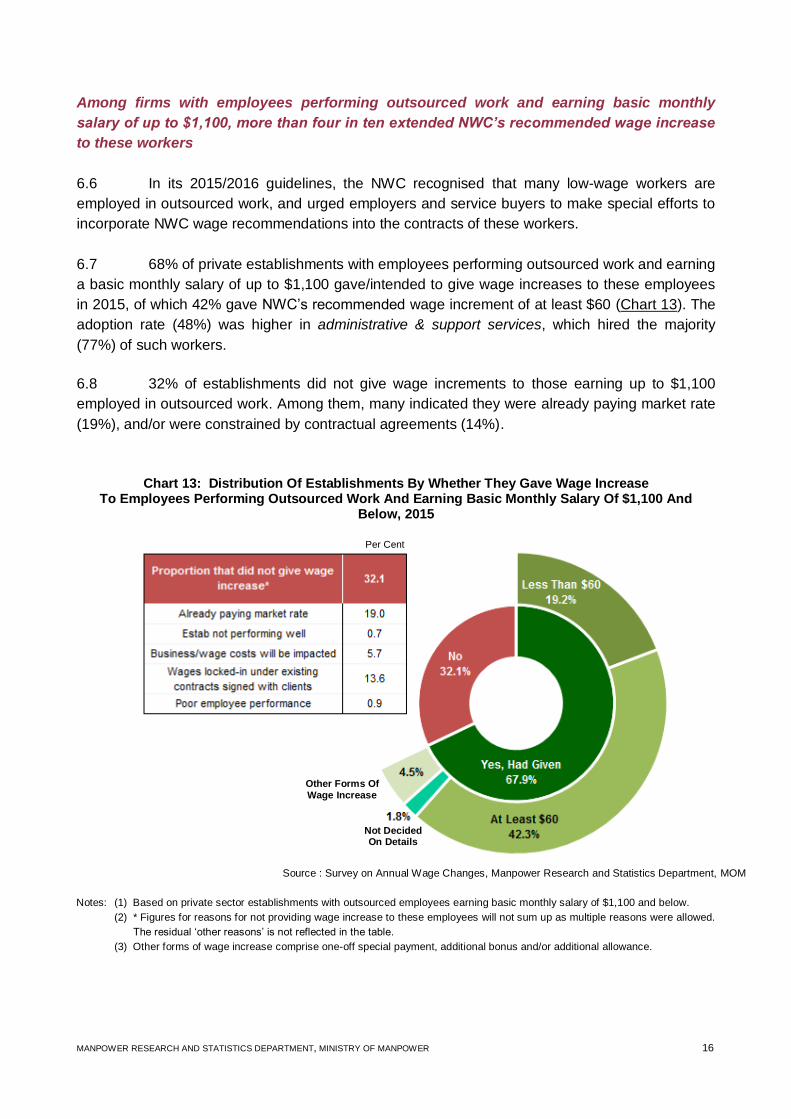
Among firms with employees performing outsourced work and earning basic monthly
salary of up to $1,100, more than four in ten extended NWC’s recommended wage increase
to these workers
6.6 In its 2015/2016 guidelines, the NWC recognised that many low-wage workers are
employed in outsourced work, and urged employers and service buyers to make special efforts to
incorporate NWC wage recommendations into the contracts of these workers.
6.7 68% of private establishments with employees performing outsourced work and earning
a basic monthly salary of up to $1,100 gave/intended to give wage increases to these employees
in 2015, of which 42% gave NWC’s recommended wage increment of at least $60 (Chart 13). The
adoption rate (48%) was higher in administrative & support services, which hired the majority
(77%) of such workers.
6.8 32% of establishments did not give wage increments to those earning up to $1,100
employed in outsourced work. Among them, many indicated they were already paying market rate
(19%), and/or were constrained by contractual agreements (14%).
Chart 13: Distribution Of Establishments By Whether They Gave Wage Increase To Employees Performing Outsourced Work And Earning Basic Monthly Salary Of $1,100 And
Below, 2015
Source : Survey on Annual Wage Changes, Manpower Research and Statistics Department, MOM
Notes: (1) Based on private sector establishments with outsourced employees earning basic monthly salary of $1,100 and below.
(2) * Figures for reasons for not providing wage increase to these employees will not sum up as multiple reasons were allowed.
The residual ‘other reasons’ is not reflected in the table.
(3) Other forms of wage increase comprise one-off special payment, additional bonus and/or additional allowance.
Other Forms Of Wage Increase
Not Decided On Details
Per Cent
MANPOWER RESEARCH AND STATISTICS DEPARTMENT, MINISTRY OF MANPOWER 17
With PWM, outsourced workers enjoyed higher wage increases than regular employees
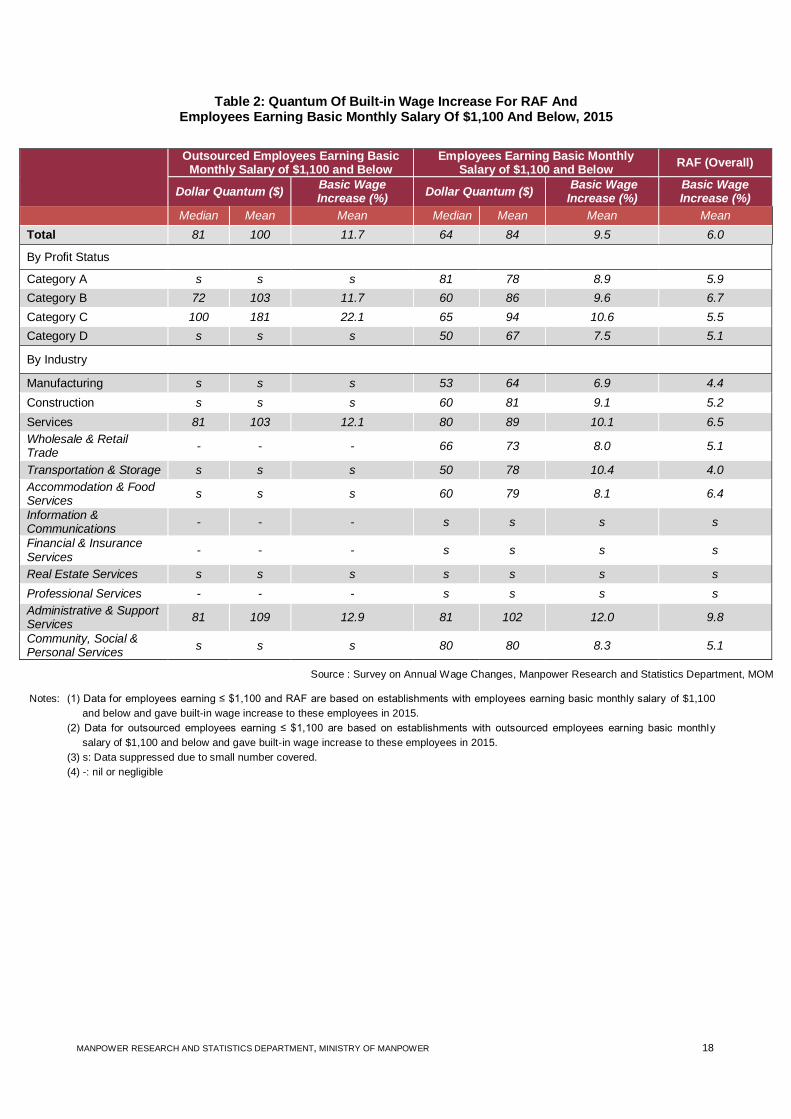
6.9 Among employees earning a basic monthly salary of up to $1,100, those under
outsourced service contracts received higher payouts (median: $81, mean: $100) than all
employees as a whole (median: $64, mean: $84). This was because workers on outsourced
service contracts typically worked in the cleaning and security sectors with progressive wage
models. Employees earning up to $1,100 under outsourced service contracts also received higher
basic wage gains of 11.7%, compared with all employees earning up to $1,100 (9.5%) and all RAF
in these establishments (6.0%) (Table 2).
MANPOWER RESEARCH AND STATISTICS DEPARTMENT, MINISTRY OF MANPOWER 18
Table 2: Quantum Of Built-in Wage Increase For RAF And Employees Earning Basic Monthly Salary Of $1,100 And Below, 2015
Source : Survey on Annual Wage Changes, Manpower Research and Statistics Department, MOM
Notes: (1) Data for employees earning ≤ $1,100 and RAF are based on establishments with employees earning basic monthly salary of $1,100
and below and gave built-in wage increase to these employees in 2015.
(2) Data for outsourced employees earning ≤ $1,100 are based on establishments with outsourced employees earning basic monthly
salary of $1,100 and below and gave built-in wage increase to these employees in 2015.
(3) s: Data suppressed due to small number covered.
(4) -: nil or negligible
Outsourced Employees Earning Basic Monthly Salary of $1,100 and Below
Employees Earning Basic Monthly Salary of $1,100 and Below
RAF (Overall)
Dollar Quantum ($) Basic Wage Increase (%)
Dollar Quantum ($) Basic Wage Increase (%)
Basic Wage Increase (%)
Median Mean Mean Median Mean Mean Mean
Total 81 100 11.7 64 84 9.5 6.0
By Profit Status
Category A s s s 81 78 8.9 5.9
Category B 72 103 11.7 60 86 9.6 6.7
Category C 100 181 22.1 65 94 10.6 5.5
Category D s s s 50 67 7.5 5.1
By Industry
Manufacturing s s s 53 64 6.9 4.4
Construction s s s 60 81 9.1 5.2
Services 81 103 12.1 80 89 10.1 6.5
Wholesale & Retail Trade
- - - 66 73 8.0 5.1
Transportation & Storage s s s 50 78 10.4 4.0
Accommodation & Food Services
s s s 60 79 8.1 6.4
Information & Communications
- - - s s s s
Financial & Insurance Services
- - - s s s s
Real Estate Services s s s s s s s
Professional Services - - - s s s s
Administrative & Support Services
81 109 12.9 81 102 12.0 9.8
Community, Social & Personal Services
s s s 80 80 8.3 5.1
MANPOWER RESEARCH AND STATISTICS DEPARTMENT, MINISTRY OF MANPOWER 19
Part II Wage Flexibility12
7 Adoption of Wage Restructuring Recommendations
7.1 This section of the report updates the progress of employers in restructuring their wage
system to be more flexible and performance-based, as guided by the wage restructuring
recommendations released in January 2004.13 Specifically, employers are encouraged to
implement the following key wage recommendations:
(1) implement variable bonus linked to Key Performance Indicators (KPI)14;
(2) introduce the Monthly Variable Component (MVC) in wage structure;
(3) narrow the maximum-minimum salary ratio for the majority of their employees to
average of 1.5 or less.15
Nine in ten employees under some form of wage flexibility in 2015
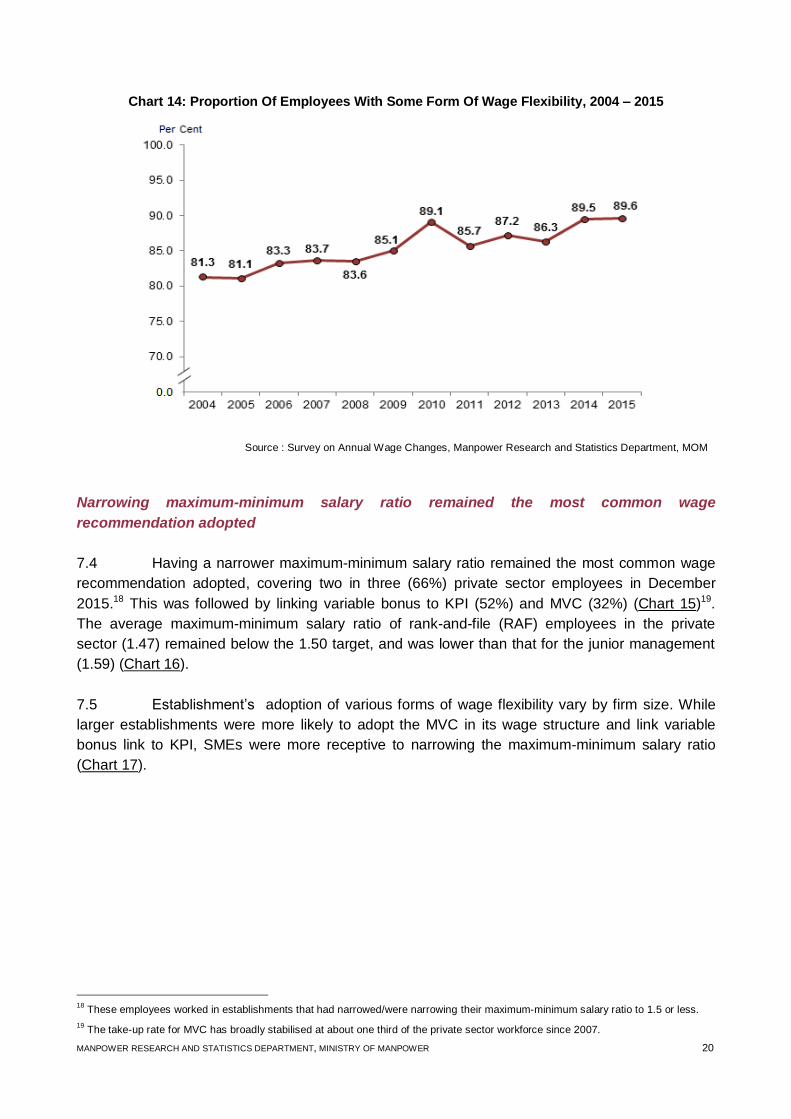
7.2 In line with tripartite recommendations to restructure wages and boost
competitiveness, a large majority of firms have adopted flexi wage recommendations.16 As of
December 2015, 90%17 of private sector employees were working in establishments which had at
least one of the recommended flexible wage components (Chart 14).
7.3 83% of employees working in small and medium establishments employing 25 to 199
employees were covered by at least one flexible wage component, up from 72% in 2004.
However, it remained lower than the 94% for large establishments, though the gap had narrowed.
Details are in Annex 1 ‒ Chart 2.
12
Data pertain to private sector establishments each employing at least 25 workers.
13 The recommendations were made by the Tripartite Taskforce on Wage Restructuring representing employers, workers and the
government. Recognising that establishments may require different forms of wage flexibility to meet their specific circumstances, employers may choose to implement only the recommendations that are relevant to them.
14 In the survey, establishments are considered to have implemented variable bonus linked to KPI, if they have formulated and
communicated to their employees, the KPI for the payment of the variable bonus. 15
In the survey, establishments are considered to have implemented this recommendation if they have narrowed the salary ratio t o 1.5
or less, decided to/in the process of narrowing the salary ratio or all along have a maximum-minimum ratio of 1.5 or less. 16
Establishments are considered to have some form of flexible wage system when they have adopted at least one key wage recommendation.
17 One in ten (10%) private sector employees were not covered by any of the key wage recommendations. 8.7% were working in
establishments that were satisfied with their wage flexibility. See Annex 1 – Table 4.
MANPOWER RESEARCH AND STATISTICS DEPARTMENT, MINISTRY OF MANPOWER 20
Chart 14: Proportion Of Employees With Some Form Of Wage Flexibility, 2004 – 2015
Source : Survey on Annual Wage Changes, Manpower Research and Statistics Department, MOM
Narrowing maximum-minimum salary ratio remained the most common wage
recommendation adopted
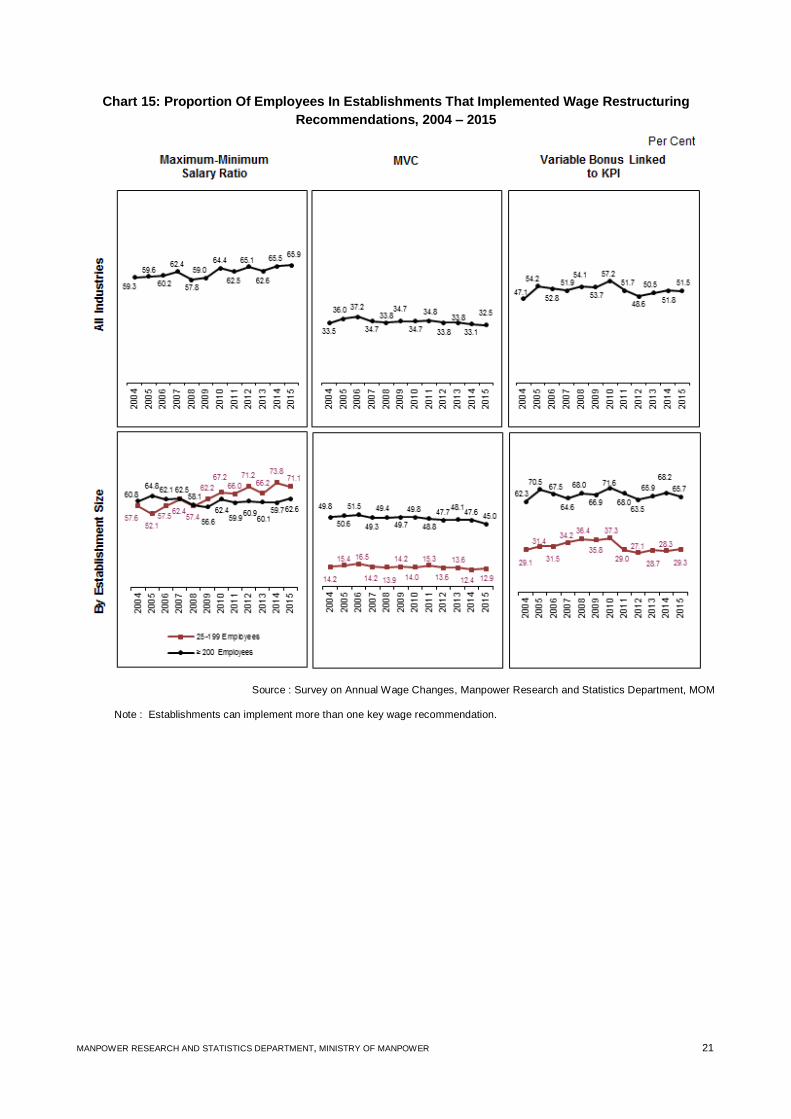
7.4 Having a narrower maximum-minimum salary ratio remained the most common wage
recommendation adopted, covering two in three (66%) private sector employees in December
2015.18 This was followed by linking variable bonus to KPI (52%) and MVC (32%) (Chart 15)19.
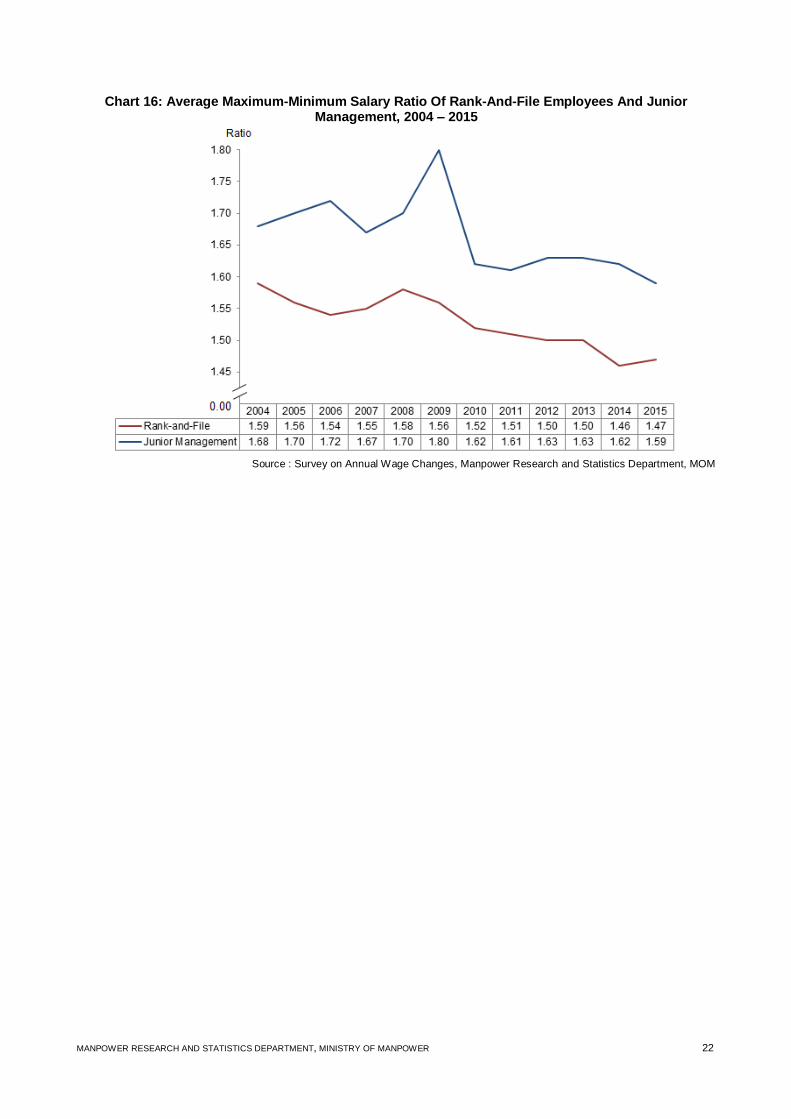
The average maximum-minimum salary ratio of rank-and-file (RAF) employees in the private
sector (1.47) remained below the 1.50 target, and was lower than that for the junior management
(1.59) (Chart 16).
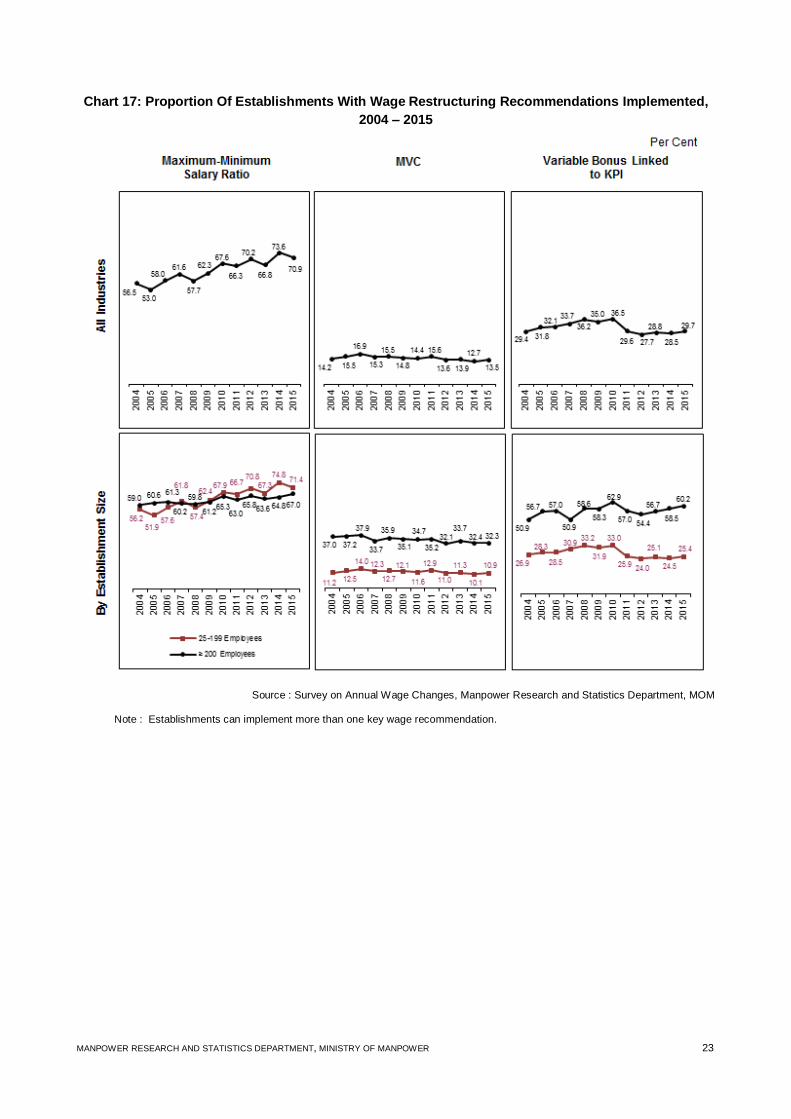
7.5 Establishment’s adoption of various forms of wage flexibility vary by firm size. While
larger establishments were more likely to adopt the MVC in its wage structure and link variable
bonus link to KPI, SMEs were more receptive to narrowing the maximum-minimum salary ratio
(Chart 17).
18
These employees worked in establishments that had narrowed/were narrowing their maximum-minimum salary ratio to 1.5 or less.
19 The take-up rate for MVC has broadly stabilised at about one third of the private sector workforce since 2007.
MANPOWER RESEARCH AND STATISTICS DEPARTMENT, MINISTRY OF MANPOWER 21
Chart 15: Proportion Of Employees In Establishments That Implemented Wage Restructuring
Recommendations, 2004 – 2015
Source : Survey on Annual Wage Changes, Manpower Research and Statistics Department, MOM
Note : Establishments can implement more than one key wage recommendation.
MANPOWER RESEARCH AND STATISTICS DEPARTMENT, MINISTRY OF MANPOWER 22
Chart 16: Average Maximum-Minimum Salary Ratio Of Rank-And-File Employees And Junior Management, 2004 – 2015
Source : Survey on Annual Wage Changes, Manpower Research and Statistics Department, MOM
MANPOWER RESEARCH AND STATISTICS DEPARTMENT, MINISTRY OF MANPOWER 23
Chart 17: Proportion Of Establishments With Wage Restructuring Recommendations Implemented,
2004 – 2015
Source : Survey on Annual Wage Changes, Manpower Research and Statistics Department, MOM Note : Establishments can implement more than one key wage recommendation.
MANPOWER RESEARCH AND STATISTICS DEPARTMENT, MINISTRY OF MANPOWER A1
Annex 1
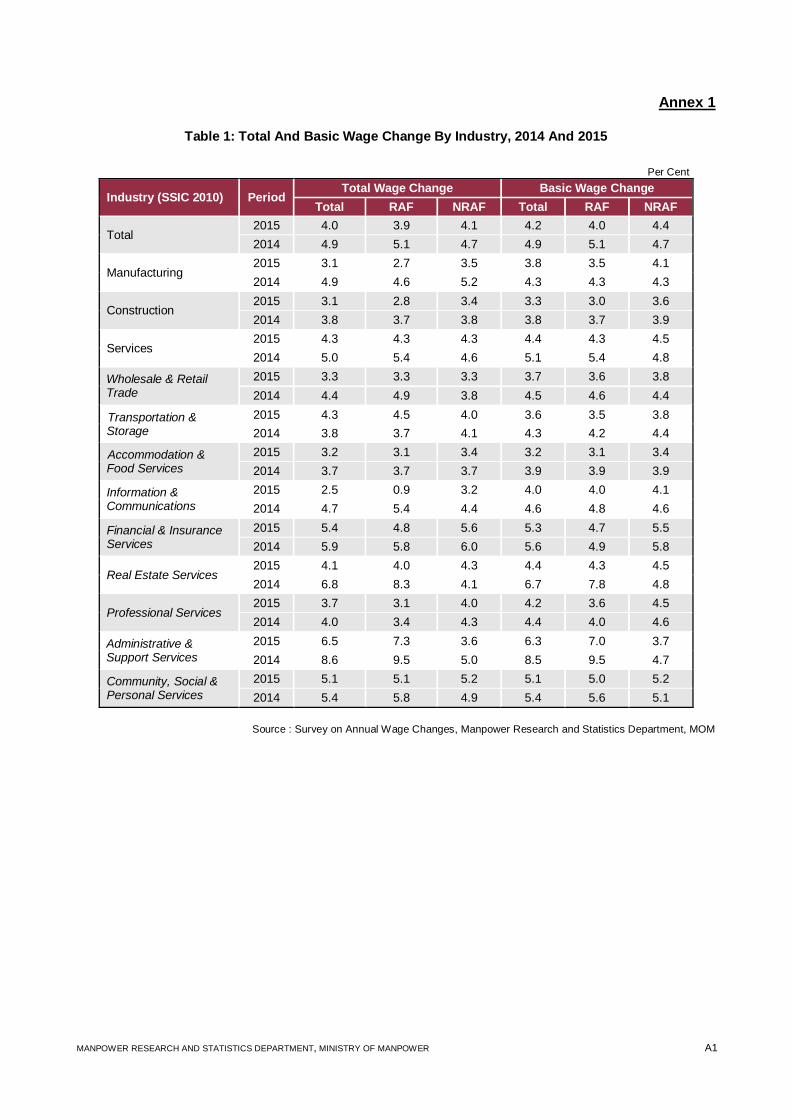
Table 1: Total And Basic Wage Change By Industry, 2014 And 2015
Per Cent
Industry (SSIC 2010) Period Total Wage Change Basic Wage Change
Total RAF NRAF Total RAF NRAF
Total 2015 4.0 3.9 4.1 4.2 4.0 4.4
2014 4.9 5.1 4.7 4.9 5.1 4.7
Manufacturing 2015 3.1 2.7 3.5 3.8 3.5 4.1
2014 4.9 4.6 5.2 4.3 4.3 4.3
Construction 2015 3.1 2.8 3.4 3.3 3.0 3.6
2014 3.8 3.7 3.8 3.8 3.7 3.9
Services 2015 4.3 4.3 4.3 4.4 4.3 4.5
2014 5.0 5.4 4.6 5.1 5.4 4.8
Wholesale & Retail Trade
2015 3.3 3.3 3.3 3.7 3.6 3.8
2014 4.4 4.9 3.8 4.5 4.6 4.4
Transportation & Storage
2015 4.3 4.5 4.0 3.6 3.5 3.8
2014 3.8 3.7 4.1 4.3 4.2 4.4
Accommodation & Food Services
2015 3.2 3.1 3.4 3.2 3.1 3.4
2014 3.7 3.7 3.7 3.9 3.9 3.9
Information & Communications
2015 2.5 0.9 3.2 4.0 4.0 4.1
2014 4.7 5.4 4.4 4.6 4.8 4.6
Financial & Insurance Services
2015 5.4 4.8 5.6 5.3 4.7 5.5
2014 5.9 5.8 6.0 5.6 4.9 5.8
Real Estate Services 2015 4.1 4.0 4.3 4.4 4.3 4.5
2014 6.8 8.3 4.1 6.7 7.8 4.8
Professional Services 2015 3.7 3.1 4.0 4.2 3.6 4.5
2014 4.0 3.4 4.3 4.4 4.0 4.6
Administrative & Support Services
2015 6.5 7.3 3.6 6.3 7.0 3.7
2014 8.6 9.5 5.0 8.5 9.5 4.7
Community, Social & Personal Services
2015 5.1 5.1 5.2 5.1 5.0 5.2
2014 5.4 5.8 4.9 5.4 5.6 5.1
Source : Survey on Annual Wage Changes, Manpower Research and Statistics Department, MOM
MANPOWER RESEARCH AND STATISTICS DEPARTMENT, MINISTRY OF MANPOWER A2
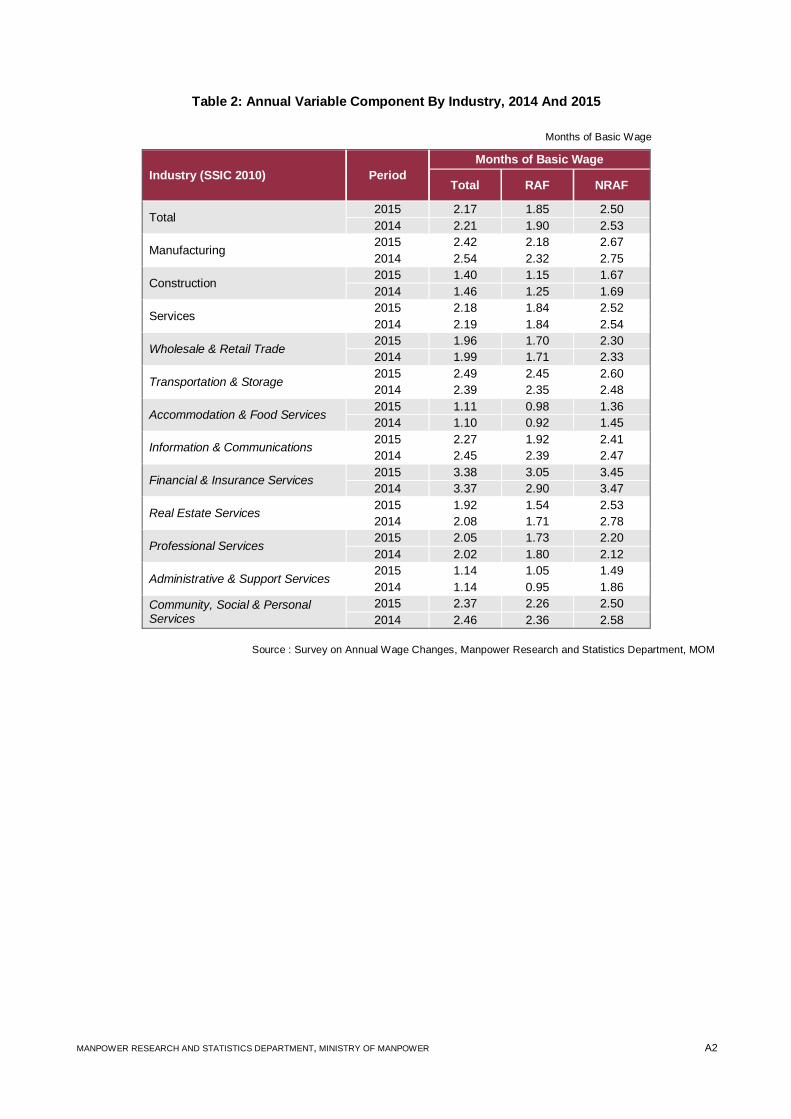
Table 2: Annual Variable Component By Industry, 2014 And 2015
Months of Basic Wage
Industry (SSIC 2010) Period
Months of Basic Wage
Total RAF NRAF
Total 2015 2.17 1.85 2.50
2014 2.21 1.90 2.53
Manufacturing 2015 2.42 2.18 2.67
2014 2.54 2.32 2.75
Construction 2015 1.40 1.15 1.67
2014 1.46 1.25 1.69
Services 2015 2.18 1.84 2.52
2014 2.19 1.84 2.54
Wholesale & Retail Trade 2015 1.96 1.70 2.30
2014 1.99 1.71 2.33
Transportation & Storage 2015 2.49 2.45 2.60
2014 2.39 2.35 2.48
Accommodation & Food Services 2015 1.11 0.98 1.36
2014 1.10 0.92 1.45
Information & Communications 2015 2.27 1.92 2.41
2014 2.45 2.39 2.47
Financial & Insurance Services 2015 3.38 3.05 3.45
2014 3.37 2.90 3.47
Real Estate Services 2015 1.92 1.54 2.53
2014 2.08 1.71 2.78
Professional Services 2015 2.05 1.73 2.20
2014 2.02 1.80 2.12
Administrative & Support Services 2015 1.14 1.05 1.49
2014 1.14 0.95 1.86
Community, Social & Personal Services
2015 2.37 2.26 2.50
2014 2.46 2.36 2.58
Source : Survey on Annual Wage Changes, Manpower Research and Statistics Department, MOM
MANPOWER RESEARCH AND STATISTICS DEPARTMENT, MINISTRY OF MANPOWER A3
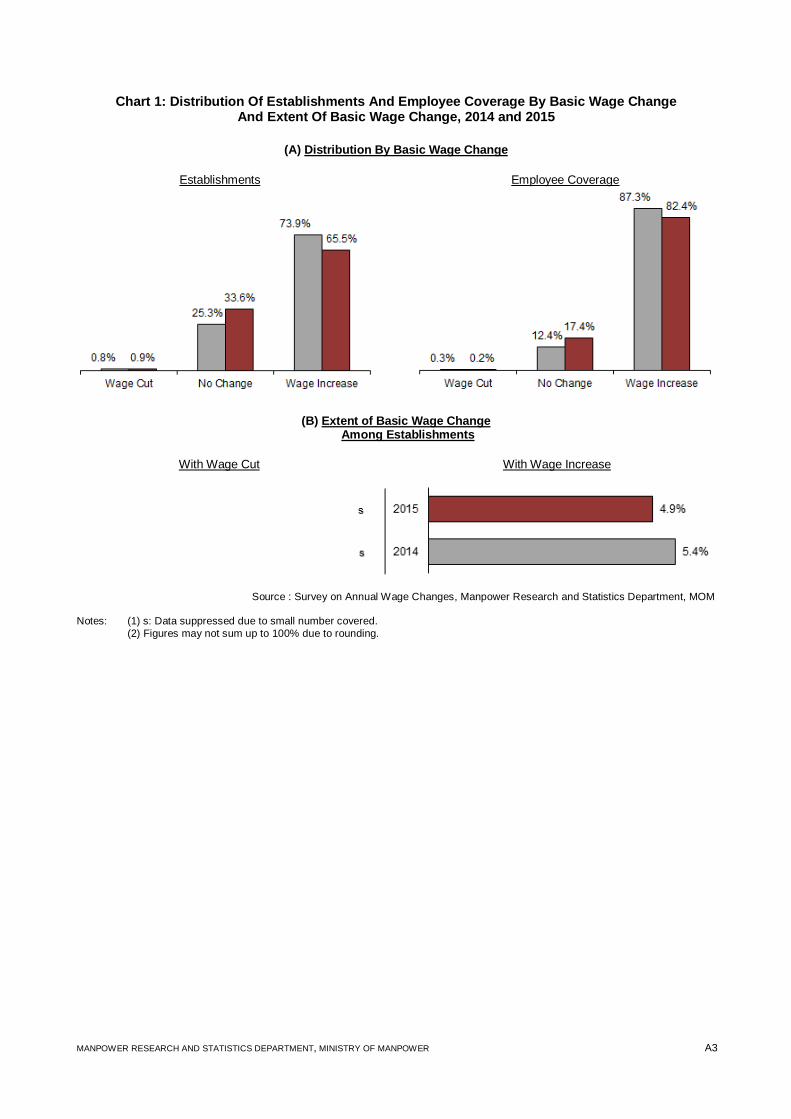
Chart 1: Distribution Of Establishments And Employee Coverage By Basic Wage Change And Extent Of Basic Wage Change, 2014 and 2015
(A) Distribution By Basic Wage Change
Establishments Employee Coverage
(B) Extent of Basic Wage Change Among Establishments
With Wage Cut With Wage Increase
Source : Survey on Annual Wage Changes, Manpower Research and Statistics Department, MOM Notes: (1) s: Data suppressed due to small number covered.
(2) Figures may not sum up to 100% due to rounding.
MANPOWER RESEARCH AND STATISTICS DEPARTMENT, MINISTRY OF MANPOWER A4
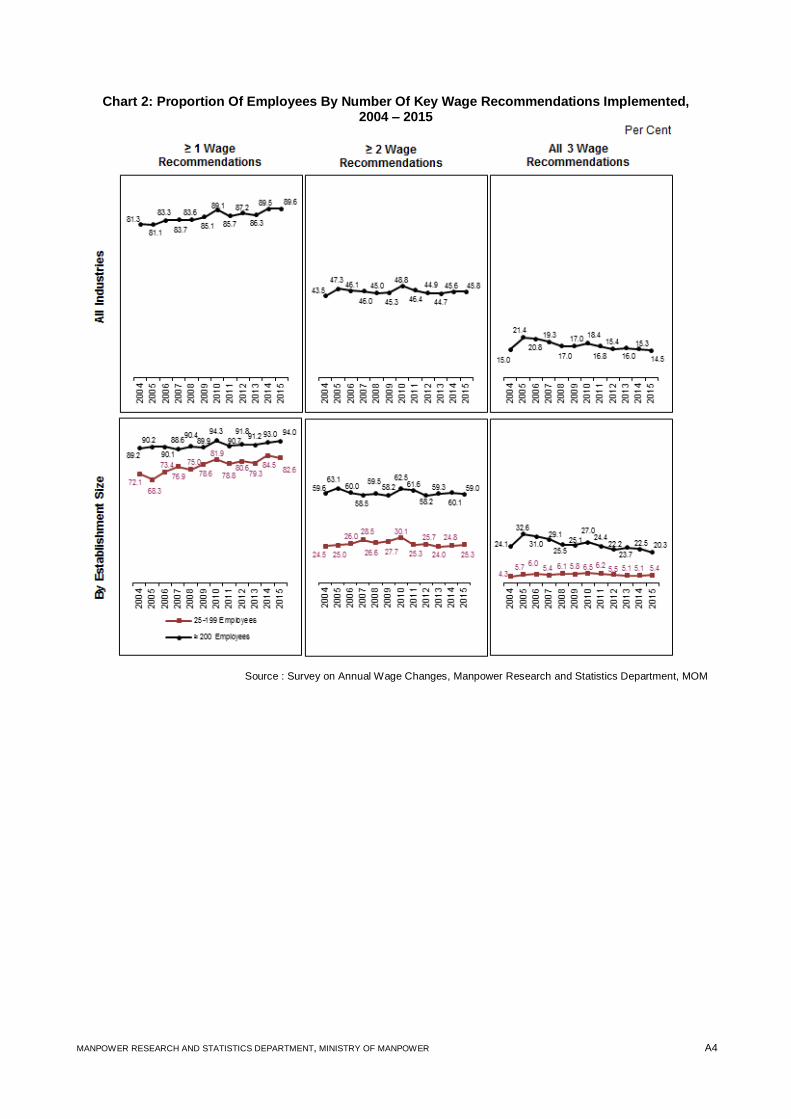
Chart 2: Proportion Of Employees By Number Of Key Wage Recommendations Implemented, 2004 – 2015
Source : Survey on Annual Wage Changes, Manpower Research and Statistics Department, MOM
MANPOWER RESEARCH AND STATISTICS DEPARTMENT, MINISTRY OF MANPOWER A5
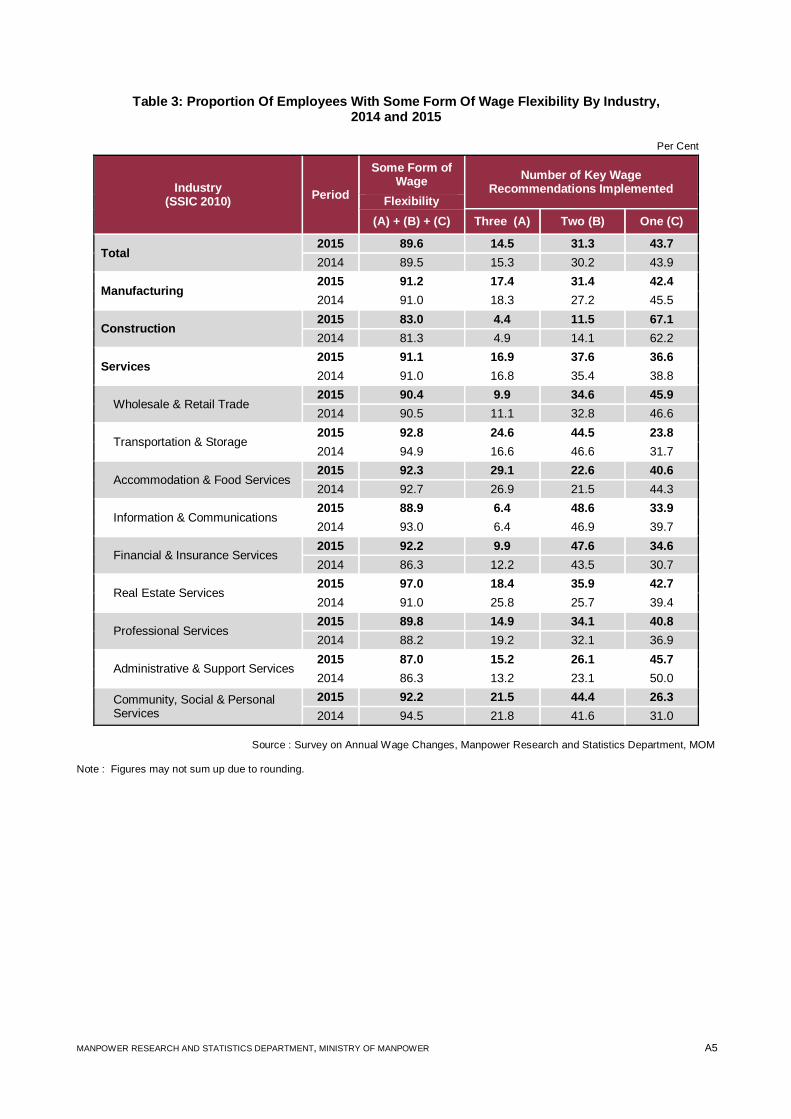
Table 3: Proportion Of Employees With Some Form Of Wage Flexibility By Industry, 2014 and 2015
Per Cent
Industry (SSIC 2010)
Period
Some Form of Wage
Number of Key Wage Recommendations Implemented
Flexibility
(A) + (B) + (C) Three (A) Two (B) One (C)
Total 2015 89.6 14.5 31.3 43.7
2014 89.5 15.3 30.2 43.9
Manufacturing 2015 91.2 17.4 31.4 42.4
2014 91.0 18.3 27.2 45.5
Construction 2015 83.0 4.4 11.5 67.1
2014 81.3 4.9 14.1 62.2
Services 2015 91.1 16.9 37.6 36.6
2014 91.0 16.8 35.4 38.8
Wholesale & Retail Trade 2015 90.4 9.9 34.6 45.9
2014 90.5 11.1 32.8 46.6
Transportation & Storage 2015 92.8 24.6 44.5 23.8
2014 94.9 16.6 46.6 31.7
Accommodation & Food Services 2015 92.3 29.1 22.6 40.6
2014 92.7 26.9 21.5 44.3
Information & Communications 2015 88.9 6.4 48.6 33.9
2014 93.0 6.4 46.9 39.7
Financial & Insurance Services 2015 92.2 9.9 47.6 34.6
2014 86.3 12.2 43.5 30.7
Real Estate Services 2015 97.0 18.4 35.9 42.7
2014 91.0 25.8 25.7 39.4
Professional Services 2015 89.8 14.9 34.1 40.8
2014 88.2 19.2 32.1 36.9
Administrative & Support Services 2015 87.0 15.2 26.1 45.7
2014 86.3 13.2 23.1 50.0
Community, Social & Personal Services
2015 92.2 21.5 44.4 26.3
2014 94.5 21.8 41.6 31.0
Source : Survey on Annual Wage Changes, Manpower Research and Statistics Department, MOM Note : Figures may not sum up due to rounding.
MANPOWER RESEARCH AND STATISTICS DEPARTMENT, MINISTRY OF MANPOWER A6
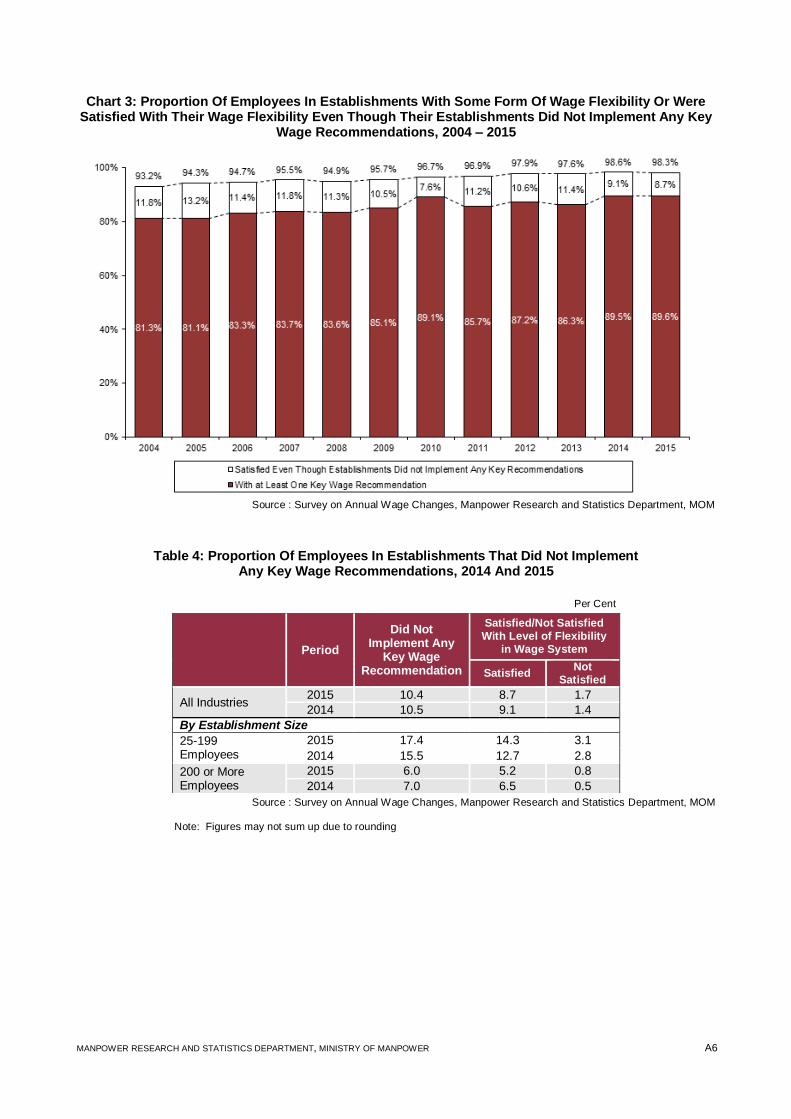
Chart 3: Proportion Of Employees In Establishments With Some Form Of Wage Flexibility Or Were Satisfied With Their Wage Flexibility Even Though Their Establishments Did Not Implement Any Key
Wage Recommendations, 2004 – 2015
Source : Survey on Annual Wage Changes, Manpower Research and Statistics Department, MOM
Table 4: Proportion Of Employees In Establishments That Did Not Implement
Any Key Wage Recommendations, 2014 And 2015
Source : Survey on Annual Wage Changes, Manpower Research and Statistics Department, MOM Note: Figures may not sum up due to rounding
Period
Did Not Implement Any
Key Wage Recommendation
Satisfied/Not Satisfied With Level of Flexibility
in Wage System
Satisfied Not
Satisfied
All Industries 2015 10.4 8.7 1.7
2014 10.5 9.1 1.4
By Establishment Size
25-199 Employees
2015 17.4 14.3 3.1
2014 15.5 12.7 2.8
200 or More Employees
2015 6.0 5.2 0.8
2014 7.0 6.5 0.5
Per Cent
MANPOWER RESEARCH AND STATISTICS DEPARTMENT, MINISTRY OF MANPOWER A7
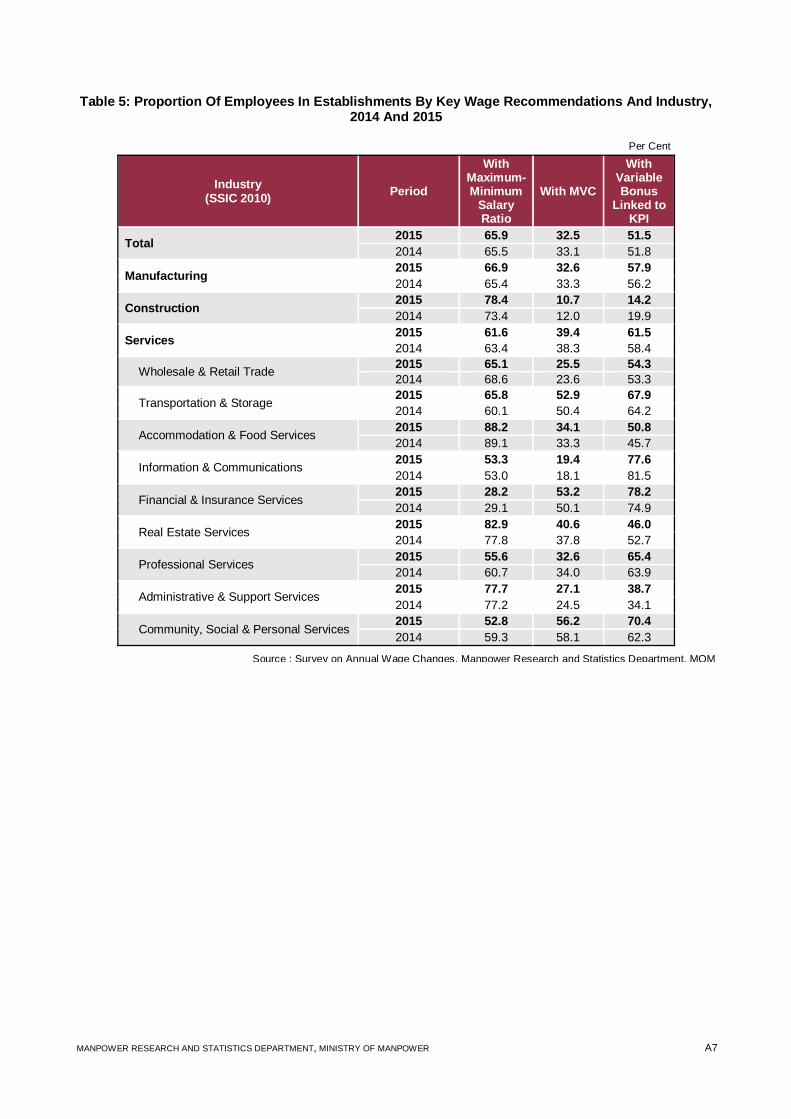
Table 5: Proportion Of Employees In Establishments By Key Wage Recommendations And Industry, 2014 And 2015
Per Cent
Industry (SSIC 2010)
Period
With Maximum-Minimum
Salary Ratio
With MVC
With Variable Bonus
Linked to KPI
Total 2015 65.9 32.5 51.5
2014 65.5 33.1 51.8
Manufacturing 2015 66.9 32.6 57.9
2014 65.4 33.3 56.2
Construction 2015 78.4 10.7 14.2
2014 73.4 12.0 19.9
Services 2015 61.6 39.4 61.5
2014 63.4 38.3 58.4
Wholesale & Retail Trade 2015 65.1 25.5 54.3
2014 68.6 23.6 53.3
Transportation & Storage 2015 65.8 52.9 67.9
2014 60.1 50.4 64.2
Accommodation & Food Services 2015 88.2 34.1 50.8
2014 89.1 33.3 45.7
Information & Communications 2015 53.3 19.4 77.6
2014 53.0 18.1 81.5
Financial & Insurance Services 2015 28.2 53.2 78.2
2014 29.1 50.1 74.9
Real Estate Services 2015 82.9 40.6 46.0
2014 77.8 37.8 52.7
Professional Services 2015 55.6 32.6 65.4
2014 60.7 34.0 63.9
Administrative & Support Services 2015 77.7 27.1 38.7
2014 77.2 24.5 34.1
Community, Social & Personal Services 2015 52.8 56.2 70.4
2014 59.3 58.1 62.3
Source : Survey on Annual Wage Changes, Manpower Research and Statistics Department, MOM
MANPOWER RESEARCH AND STATISTICS DEPARTMENT, MINISTRY OF MANPOWER A8
Annex 2
SURVEY COVERAGE AND METHODOLOGY SURVEY ON ANNUAL WAGE CHANGES, 2015 Introduction
The Survey on Annual Wage Changes, 2015 was conducted by the Manpower Research and Statistics Department of the Ministry of Manpower under the Statistics Act (Chapter 317). The survey fieldwork was conducted from 18 December 2015 to 29 February 2016. Objective
The survey was conducted to obtain information on the extent of wage changes and wage restructuring in 2015. Coverage The survey covered private sector establishments with at least 10 employees. All unionised establishments were surveyed. For the non-unionised sector, all establishments with 250 or more employees were surveyed. A systematic random sample was then drawn from the remaining establishments stratified by industry and employee size. This sampling methodology yielded an effective sample of 5,100 private establishments, of which 1,000 were unionised and 4,100 were non-unionised. These establishments employed 1,281,300 employees which included 598,300 full-time employees on the Central Provident Fund (CPF) scheme with at least 1 year in service (comprising 293,100 rank-and-file employees, 235,900 junior and 69,300 senior management staff). The survey response rate was 92%. The results were weighted to reflect the population of private sector establishments with at least 10 employees by using expansion factors based on sampling fraction. Methodology
The survey was conducted using mail questionnaires. Respondents could submit their returns
online, by post, email or fax, with clarifications made over the phone.
Reference Period
The reference period for the survey was from November/December 2014 to November/December 2015.
MANPOWER RESEARCH AND STATISTICS DEPARTMENT, MINISTRY OF MANPOWER A9
Data Collected
The establishments were asked to provide information on the average basic wage change, Annual Wage Supplement (AWS) and variable bonus to employees in 2015. The information collected pertains to full-time employees on the CPF scheme who had been with the establishment for at least one year as at 30 Nov 2015. The establishments were also surveyed on the progress of wage restructuring in terms of whether they had adopted the three key recommendations of the Tripartite Taskforce on Wage Restructuring namely:
(i) introduce Annual Variable Component (AVC) such as variable bonus in the wage system that is linked to Key Performance Indicators (KPI) i.e. have formulated, communicated and explained to their employees the KPI for the payment of the variable bonus;
(ii) introduce the monthly variable component (MVC) in the wage structure; and (iii) narrow the maximum-minimum salary ratio for majority of their employees to an average of
1.5 or less. Other information collected include establishments’ satisfaction with the level of flexibility of the wage system and maximum-minimum salary ratio of the job that has the largest number of employees among full-time employees. Since 2012, additional questions were asked to determine whether establishments gave a built-in wage increase to employees earning a monthly basic salary of up to $1,000 and the quantum given. In 2015, the same questions were asked but the basic salary level was raised to $1,100 and coverage was extended to include outsourced workers. Analysis
The first part of the report on the extent of wage changes in private sector in 2015 is based on private establishments with at least 10 employees. The second part of the report on wage restructuring is based on private establishments with at least 25 employees, unless otherwise specified. This is to be comparable with figures for the Inaugural Survey on Wage Restructuring as at June 2004. Classification
The industries of the surveyed firms were classified according to the Singapore Standard Industrial Classification (SSIC) 2010.
MANPOWER RESEARCH AND STATISTICS DEPARTMENT, MINISTRY OF MANPOWER A10
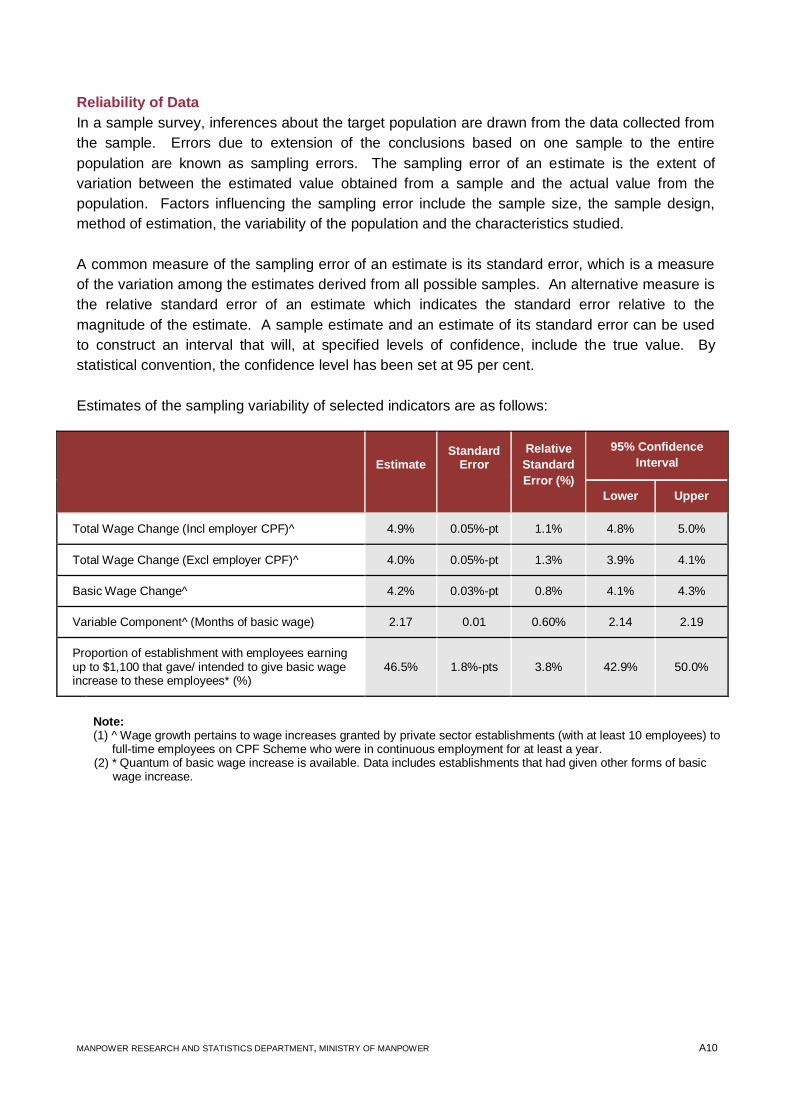
Reliability of Data
In a sample survey, inferences about the target population are drawn from the data collected from
the sample. Errors due to extension of the conclusions based on one sample to the entire
population are known as sampling errors. The sampling error of an estimate is the extent of
variation between the estimated value obtained from a sample and the actual value from the
population. Factors influencing the sampling error include the sample size, the sample design,
method of estimation, the variability of the population and the characteristics studied.
A common measure of the sampling error of an estimate is its standard error, which is a measure
of the variation among the estimates derived from all possible samples. An alternative measure is
the relative standard error of an estimate which indicates the standard error relative to the
magnitude of the estimate. A sample estimate and an estimate of its standard error can be used
to construct an interval that will, at specified levels of confidence, include the true value. By
statistical convention, the confidence level has been set at 95 per cent.
Estimates of the sampling variability of selected indicators are as follows:
Estimate Standard
Error
Relative
Standard
Error (%)
95% Confidence
Interval
Lower Upper
Total Wage Change (Incl employer CPF)^ 4.9% 0.05%-pt 1.1% 4.8% 5.0%
Total Wage Change (Excl employer CPF)^ 4.0% 0.05%-pt 1.3% 3.9% 4.1%
Basic Wage Change^ 4.2% 0.03%-pt 0.8% 4.1% 4.3%
Variable Component^ (Months of basic wage) 2.17 0.01 0.60% 2.14 2.19
Proportion of establishment with employees earning up to $1,100 that gave/ intended to give basic wage increase to these employees* (%)
46.5% 1.8%-pts 3.8% 42.9% 50.0%
Note: (1) ^ Wage growth pertains to wage increases granted by private sector establishments (with at least 10 employees) to
full-time employees on CPF Scheme who were in continuous employment for at least a year. (2) * Quantum of basic wage increase is available. Data includes establishments that had given other forms of basic
wage increase.
MANPOWER RESEARCH AND STATISTICS DEPARTMENT, MINISTRY OF MANPOWER A11
Estimate Standard
Error
Relative
Standard
Error (%)
95% Confidence
Interval
Lower Upper
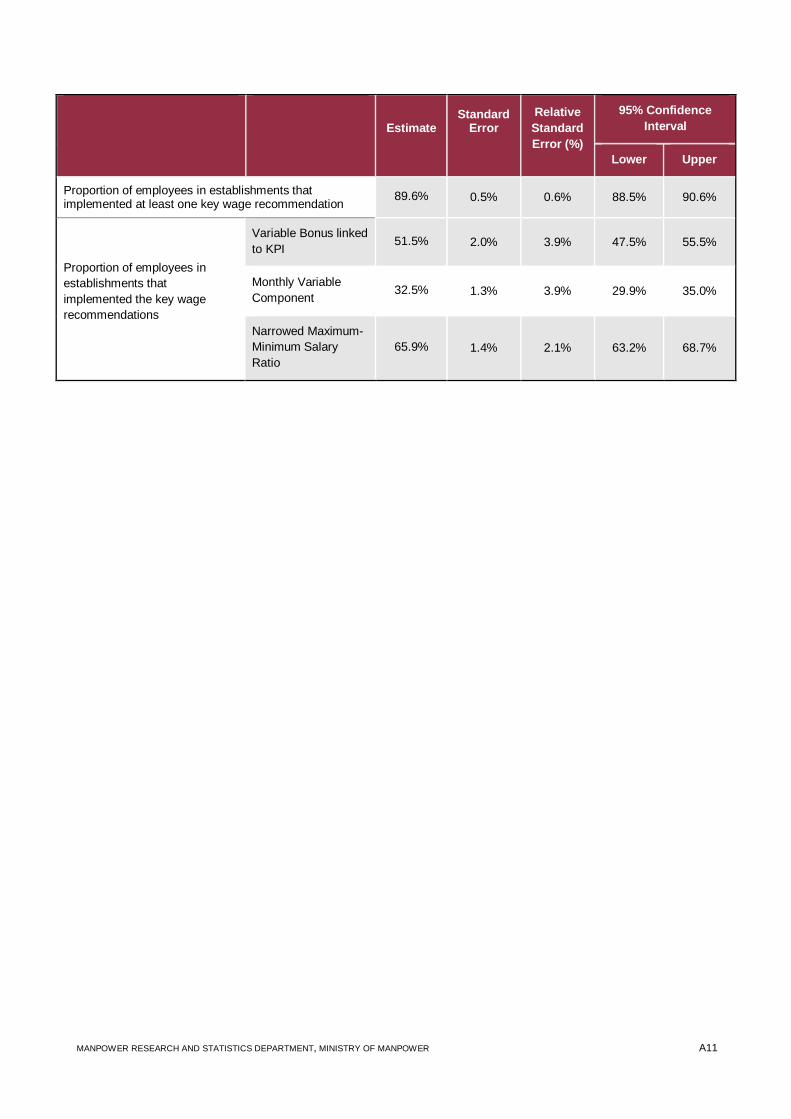
Proportion of employees in establishments that implemented at least one key wage recommendation
89.6% 0.5% 0.6% 88.5% 90.6%
Proportion of employees in
establishments that
implemented the key wage
recommendations
Variable Bonus linked
to KPI 51.5% 2.0% 3.9% 47.5% 55.5%
Monthly Variable
Component 32.5% 1.3% 3.9% 29.9% 35.0%
Narrowed Maximum-
Minimum Salary
Ratio
65.9% 1.4% 2.1% 63.2% 68.7%
MANPOWER RESEARCH AND STATISTICS DEPARTMENT, MINISTRY OF MANPOWER A12
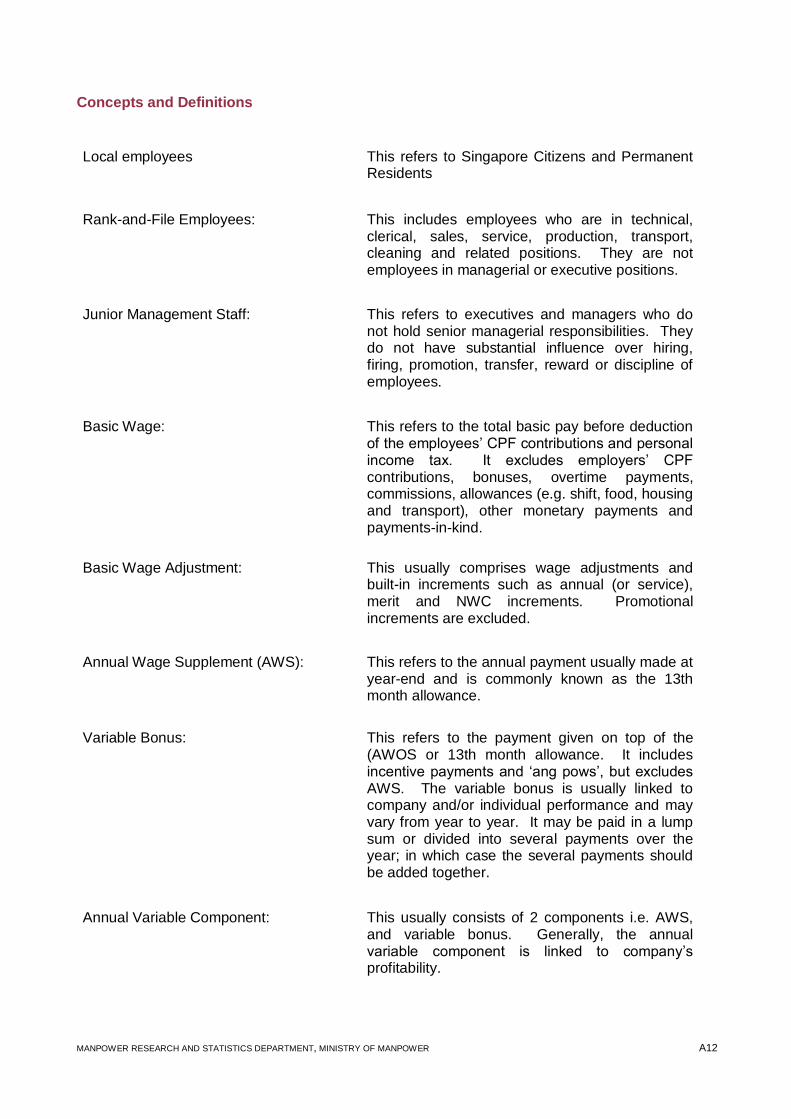
Concepts and Definitions
Local employees This refers to Singapore Citizens and Permanent
Residents
Rank-and-File Employees: This includes employees who are in technical, clerical, sales, service, production, transport, cleaning and related positions. They are not employees in managerial or executive positions.
Junior Management Staff: This refers to executives and managers who do not hold senior managerial responsibilities. They do not have substantial influence over hiring, firing, promotion, transfer, reward or discipline of employees.
Basic Wage: This refers to the total basic pay before deduction of the employees’ CPF contributions and personal income tax. It excludes employers’ CPF contributions, bonuses, overtime payments, commissions, allowances (e.g. shift, food, housing and transport), other monetary payments and payments-in-kind.
Basic Wage Adjustment: This usually comprises wage adjustments and built-in increments such as annual (or service), merit and NWC increments. Promotional increments are excluded.
Annual Wage Supplement (AWS): This refers to the annual payment usually made at year-end and is commonly known as the 13th month allowance.
Variable Bonus: This refers to the payment given on top of the (AWOS or 13th month allowance. It includes incentive payments and ‘ang pows’, but excludes AWS. The variable bonus is usually linked to company and/or individual performance and may vary from year to year. It may be paid in a lump sum or divided into several payments over the year; in which case the several payments should be added together.
Annual Variable Component: This usually consists of 2 components i.e. AWS, and variable bonus. Generally, the annual variable component is linked to company’s profitability.
MANPOWER RESEARCH AND STATISTICS DEPARTMENT, MINISTRY OF MANPOWER A13
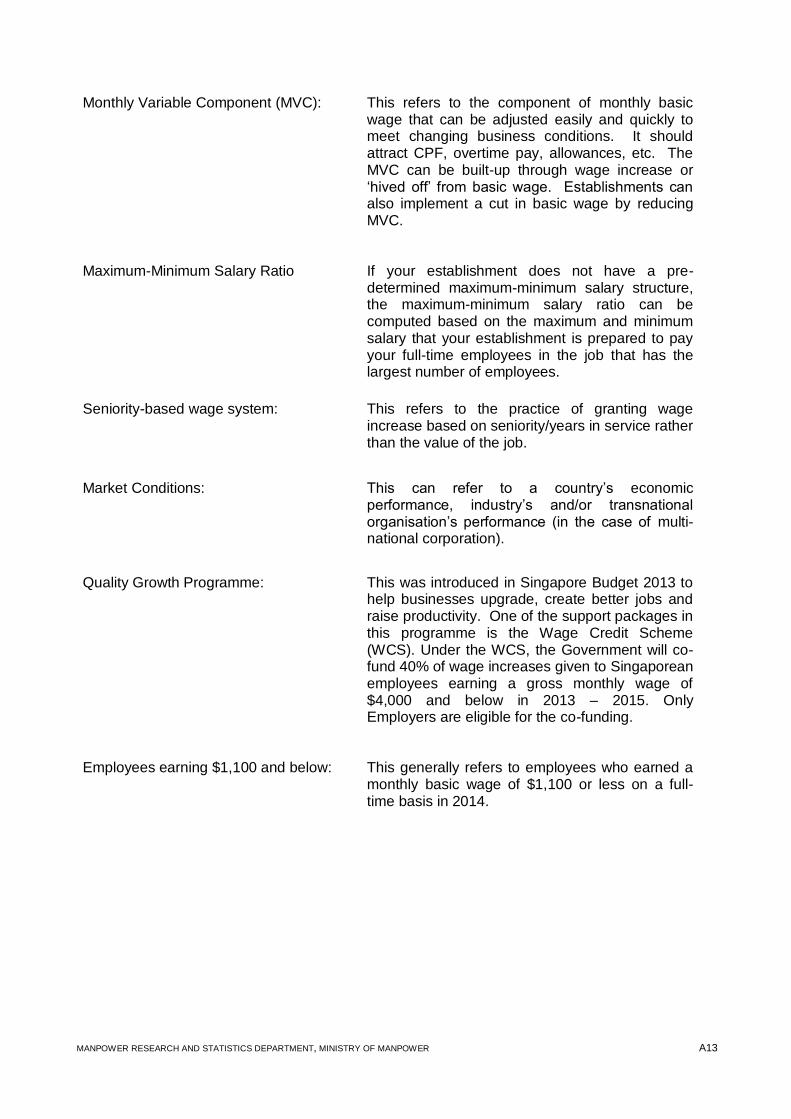
Monthly Variable Component (MVC): This refers to the component of monthly basic wage that can be adjusted easily and quickly to meet changing business conditions. It should attract CPF, overtime pay, allowances, etc. The MVC can be built-up through wage increase or ‘hived off’ from basic wage. Establishments can also implement a cut in basic wage by reducing MVC.
Maximum-Minimum Salary Ratio If your establishment does not have a pre-determined maximum-minimum salary structure, the maximum-minimum salary ratio can be computed based on the maximum and minimum salary that your establishment is prepared to pay your full-time employees in the job that has the largest number of employees.
Seniority-based wage system: This refers to the practice of granting wage increase based on seniority/years in service rather than the value of the job.
Market Conditions: This can refer to a country’s economic performance, industry’s and/or transnational organisation’s performance (in the case of multi-national corporation).
Quality Growth Programme: This was introduced in Singapore Budget 2013 to help businesses upgrade, create better jobs and raise productivity. One of the support packages in this programme is the Wage Credit Scheme (WCS). Under the WCS, the Government will co-fund 40% of wage increases given to Singaporean employees earning a gross monthly wage of $4,000 and below in 2013 – 2015. Only Employers are eligible for the co-funding.
Employees earning $1,100 and below:
This generally refers to employees who earned a monthly basic wage of $1,100 or less on a full-time basis in 2014.
MANPOWER RESEARCH AND STATISTICS DEPARTMENT, MINISTRY OF MANPOWER A14
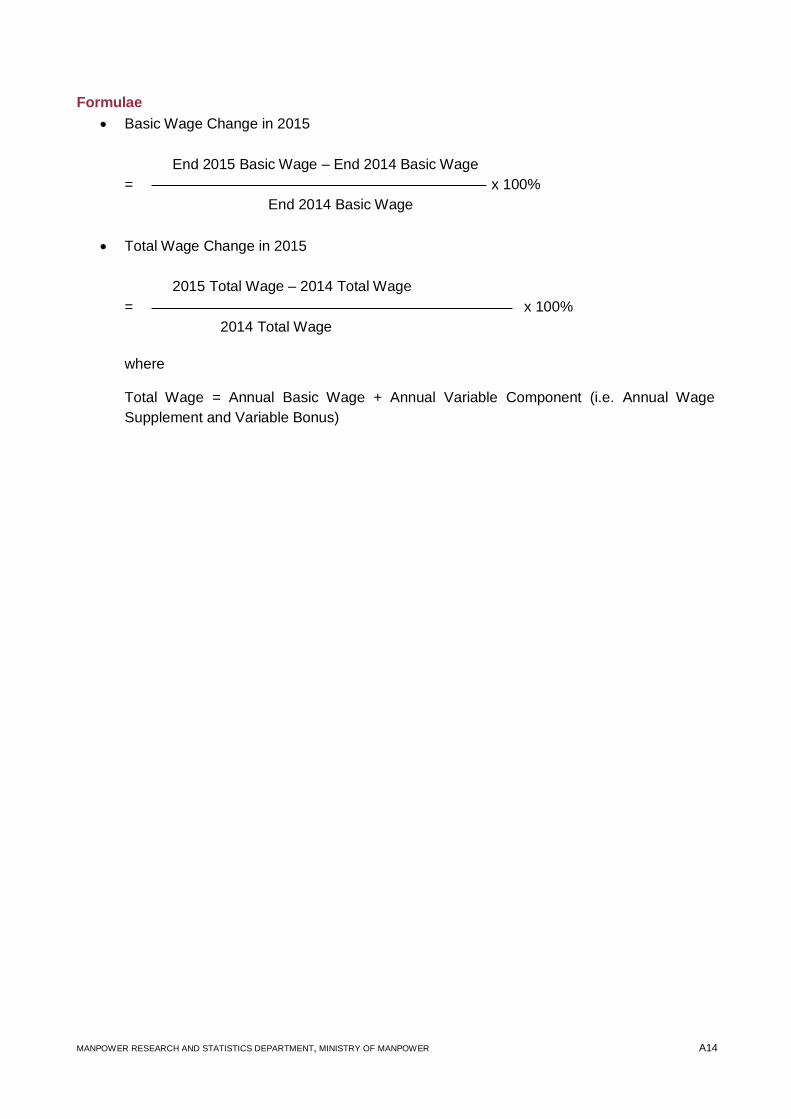
Formulae
Basic Wage Change in 2015
End 2015 Basic Wage – End 2014 Basic Wage
= x 100%
End 2014 Basic Wage
Total Wage Change in 2015
2015 Total Wage – 2014 Total Wage
= x 100%
2014 Total Wage
where Total Wage = Annual Basic Wage + Annual Variable Component (i.e. Annual Wage
Supplement and Variable Bonus)
FEEDBACK FORM
Report Title: Report on Wage Practices 2015 1. How would you rate this report in terms of :
Excellent Good Average Poor
a) Relevance to your work
b) Providing useful insights on prevailing labour market trends/development
c) Ease of understanding 2. Which area(s) of the report do you find most useful? Please provide reasons. 3. How do you find the length of the report?
Too detailed Just right Too brief
Excellent Good Average Poor
4. Overall, how would you rate this report? 5. What additional information (if any) would you like us to include in our future issues? 6. Any other comments or suggestions you wish to bring to our attention?
Thank you for your valuable feedback
Name : Designation :
Name and address of organisation :
Please return the above to :
Director Manpower Research and Statistics Department Ministry of Manpower 18 Havelock Road #05-01 Singapore 059764 Republic of Singapore Fax : 6317 1804 Email : [email protected]
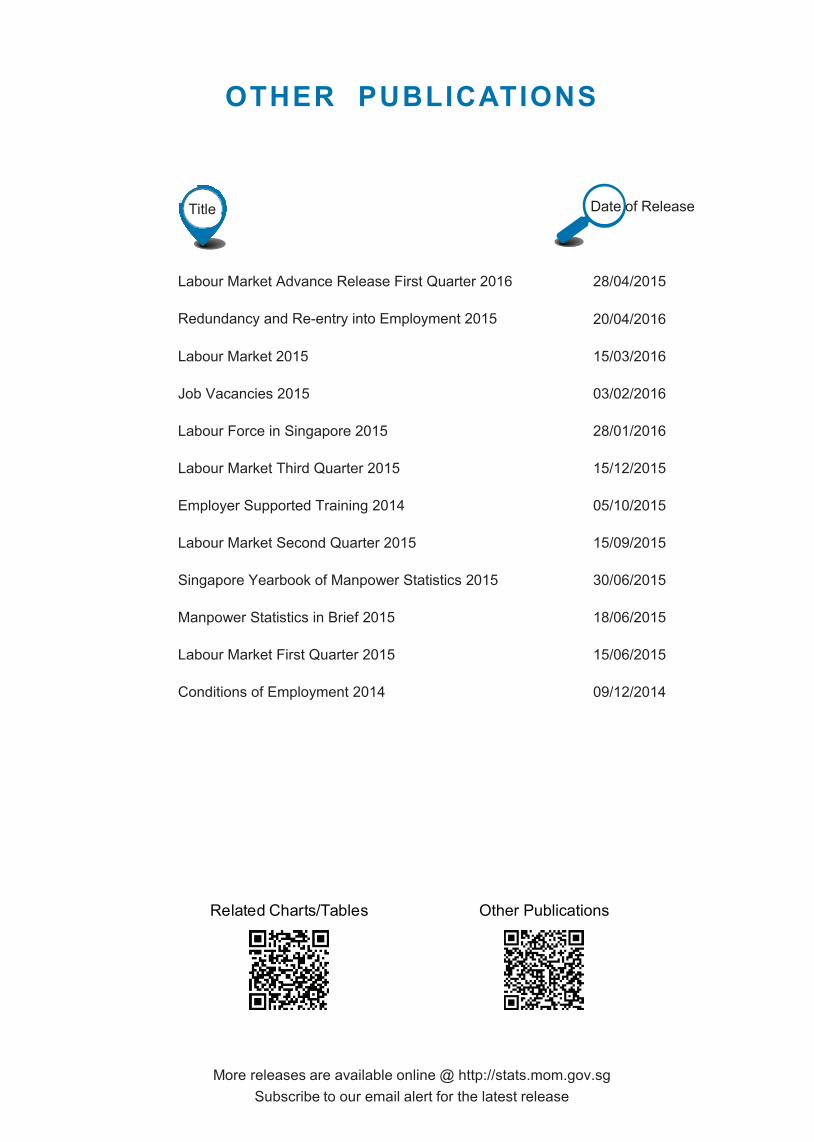
More releases are available online @ http://stats.mom.gov.sgSubscribe to our email alert for the latest release
Related Charts/Tables Other Publications
OTHER PUBLICATIONS
Date of ReleaseTitle
Conditions of Employment 2014 09/12/2014
Manpower Statistics in Brief 2015 18/06/2015
Job Vacancies 2015 03/02/2016
Labour Market 2015 15/03/2016
Labour Market Advance Release First Quarter 2016 28/04/2015
Labour Market Second Quarter 2015 15/09/2015
Singapore Yearbook of Manpower Statistics 2015 30/06/2015
Labour Market Third Quarter 2015 15/12/2015
Employer Supported Training 2014 05/10/2015
Labour Force in Singapore 2015 28/01/2016
Labour Market First Quarter 2015 15/06/2015
Redundancy and Re-entry into Employment 2015 20/04/2016