personality and the gender wage gap
TRANSCRIPT

This article was downloaded by: [Ellen Nyhus]On: 06 April 2015, At: 15:00Publisher: RoutledgeInforma Ltd Registered in England and Wales Registered Number: 1072954 Registered office: Mortimer House,37-41 Mortimer Street, London W1T 3JH, UK
Applied EconomicsPublication details, including instructions for authors and subscription information:http://www.tandfonline.com/loi/raec20
Personality and the gender wage gapEllen K. Nyhus a & Empar Pons ba Department of Economics and Business Administration , University of Agder ,Kristiansand , Norwayb Economics Department, Facultat d'Economia , Universitat de València , Valencia , SpainPublished online: 04 Feb 2011.
To cite this article: Ellen K. Nyhus & Empar Pons (2012) Personality and the gender wage gap, Applied Economics, 44:1,105-118, DOI: 10.1080/00036846.2010.500272
To link to this article: http://dx.doi.org/10.1080/00036846.2010.500272
PLEASE SCROLL DOWN FOR ARTICLE
Taylor & Francis makes every effort to ensure the accuracy of all the information (the “Content”) containedin the publications on our platform. However, Taylor & Francis, our agents, and our licensors make norepresentations or warranties whatsoever as to the accuracy, completeness, or suitability for any purpose of theContent. Any opinions and views expressed in this publication are the opinions and views of the authors, andare not the views of or endorsed by Taylor & Francis. The accuracy of the Content should not be relied upon andshould be independently verified with primary sources of information. Taylor and Francis shall not be liable forany losses, actions, claims, proceedings, demands, costs, expenses, damages, and other liabilities whatsoeveror howsoever caused arising directly or indirectly in connection with, in relation to or arising out of the use ofthe Content.
This article may be used for research, teaching, and private study purposes. Any substantial or systematicreproduction, redistribution, reselling, loan, sub-licensing, systematic supply, or distribution in anyform to anyone is expressly forbidden. Terms & Conditions of access and use can be found at http://www.tandfonline.com/page/terms-and-conditions

Applied Economics, 2012, 44, 105–118
Personality and the gender
wage gap
Ellen K. Nyhusa and Empar Ponsb,*
aDepartment of Economics and Business Administration, University of
Agder, Kristiansand, NorwaybEconomics Department, Facultat d’Economia, Universitat de Valencia,
Valencia, Spain
In this study, we investigate whether personality traits contribute towards a
better understanding of the reasons for the gender wage gap. We explore
whether two of the personality factors put forward by Bowles et al. (2001)
as likely to be incentive enhancing in the employer–employee relationship
can explain the difference in wages for women and men. These are
(1) personal self efficacy (Locus of Control (LoC)) and (2) time preference.
We also study the role of the so called Big Five personality traits
(extraversion, emotional stability, agreeableness, openness intellect and
conscientiousness), which have been associated with earnings in several
recent studies. Using a sample of Dutch employees, we found that 11.5%
of the observed gender wage gap could be ascribed to differences in the
personality trait scores (mainly in agreeableness and intellect), while less
than 0.5% could be ascribed to gender differences in the returns to the
traits. The addition of personality traits to a traditional human capital
model reduces the unexplained part of the gender wage gap from 75.2% to
62.7%. We therefore conclude that these traits represent a valuable
addition to the model.
I. Introduction
In this article, we use a behavioural approach to
investigate whether gender differences in personality
traits might explain why the wages of women tend to
be lower than that of men in most industrial
countries. For instance, the gross hourly earnings of
women across the European Union were, on average,
15% below those of men in 2005. Similar statistics
from the Organization for Economic Co-operation
and Development (OECD) member countries show
an average wage gap of 18% in 2006.1 The gender gap
in wages exists despite recent increases in women’s
capital acquisition and labour force participation, as
well as the implementation of anti-discrimination
policies. Furthermore, the gap seems universal and is
found within racial, national and immigrant groups,
and within different industries (e.g. Hayfron, 2002;
Hinks, 2002; Weichselbaumer and Winter-Ebmer,
2005). Clearly, we need to further our understanding
of why women earn less than men. Such insight is
necessary for any endeavour intended to reduce the
wage gap.Economists have offered several explanations for
the gender difference in wages and have debated the
extent to which the wage gap represents discrimina-
tion. For example, Becker (1973) suggests that
women, expecting a shorter career in the labour
*Corresponding author. E-mail: [email protected] to the 2008 edition of The life of women and men in Europe and the OECD Employment Outlook.
Applied Economics ISSN 0003–6846 print/ISSN 1466–4283 online � 2012 Taylor & Francis 105http://www.informaworld.com
DOI: 10.1080/00036846.2010.500272
Dow
nloa
ded
by [
Elle
n N
yhus
] at
15:
00 0
6 A
pril
2015
market because of childbearing, invest less in some
types of human capital than men. Alternative expla-nations appeal to discrimination,2 by referring tomembership of groups that are discriminated against
based on, for example, ethnicity, religion or age, or togender segregation by occupations characterized bydifferences in pay levels (e.g. Bergmann, 1974).
The usual empirical approach to studying the
gender wage gap is to decompose the observed rawgap into a portion explained by differences in humancapital endowments and a residual, the unexplained
component, that represents the difference in thereturn to human capital. It is the unexplained portionof the wage differential that is often interpreted as a
measure of discrimination. Weichselbaumer andWinter-Ebmer’s (2005) reviewed 260 wage gap anal-yses and found that there is a substantial part of the
wage gap unexplained across all studies. They alsofound that the unexplained wage gap was almostconstant between 1960 (23%) and 1990 (20%).
Recently, attempts have been made to disentangle
which part of the unexplained wage gap may becaused by discrimination and which part is assignableto omitted variables. If men and women with equal
human capital and in the same jobs differ in ways thataffect their earnings, then external factors, such asemployer discrimination, may be redundant in any
explanation of the gender wage gap. For example,Browne (2002, 2006) argues that gender differences intaste, or attitudes towards the career–family trade-
off, may reduce the component of the wage gapattributable to discrimination and occupational seg-regation. This notion is supported by findings from
psychology, biology and anthropology, which suggestthat temperamental sex differences caused by evolu-tionary or neurochemical factors may explain part of
the differences in the utility functions of men andwomen that affect their relation with earnings.
Evolutionary theory suggests that all psychologicalmechanisms are ultimately designed to promote our
reproductive success and that the strategies men andwomen use for being successful in reproduction willdiffer (Trivers, 1972). This may, in turn, produce
gender differences in preferences, since preferencesare likely to be correlated with the kind of parental
investment the two sexes make in order to achievereproductive success. Kanazawa (2005) argues that,
throughout evolutionary history, material resourceshave been the man’s means to reproductive success,whereas for the woman, this means has been phys-ically taking care of the children. Using the GeneralSocial Survey data collected at the University of
Chicago, he found support for the notion that menare more motivated to accumulate material resources(i.e. earn money) than women. He reported that sexdifferences in the desire to earn money are greateramong parents and married people than amongnonparents and unmarried people. In addition,
Kanazawa found life-cycle effects in that the genderdifference in the desire to earn money is greateramong older than among younger people. Womenwere found to be more concerned about theirearnings in periods when they are single, while the
gender difference in earnings disappears among menand women with equal motivation to earn money.Kanazawa concluded that women have evolvedpsychological mechanisms that first lead them,during the reproductive age, to ensure that they
have their own biological children; and, if they do, toinvest in them; and if they do not, to engage inproductive economic activities as well as care for theirkids in order to increase their reproductive success.Once they have found the best available mate, theircalculations change to the extent that they care less
about the size of their earnings. In line withKanazawa’s findings, Olsen (2009) found supportfor the gender-specialized theory of marital forma-tion, with men being valued more and women less fortheir economic contributions to the household.
Finally, several authors suggest that factors suchas culture, social environment and education may play
a role in shaping gender differences in preferences(Cavalli-Sforza and Feldman, 1973).3 Judge andLivingston (2008) showed that gender role orientationmay explain part of the wage gap. Fortin (2005) foundthat an anti-egalitarian attitude exhibits the strongest
negative association with female employment ratesand the gender pay gap. Fortin (2008) found that mentend to be more ambitious with respect to their careerand value money more, while women tend to place
2 Both Becker’s ‘taste for discrimination’ model (Becker, 1957) and Arrow’s ‘statistical discrimination’ argument (Arrow,1973) are rooted in this notion.3 The debate on whether preferences are uniquely conditioned by biology and evolution or moderated by culture, social normsor socialized values, is a classic one in the literature (e.g. Lippa, 2005). Evidence reported in Browne (1995) strongly supportsthe position that gender differences in temperament and behaviour have deep evolutionary roots and are relatively intractable.Likewise, Croson and Gneezy’s (2009) survey also provides support for the nature over nurture explanation of genderdifferences in preferences. Alesina and Giuliano (2007) and Vella (1994), on the other hand, find evidence indicating that theenvironment, and in particular the family, play an important role in shaping preferences. This debate is still open, despitesome authors who argue that the nature versus nurture debate is a misleading dichotomy (Browne, 1995). It overcomes theobjective of this study to close it.
106 E. K. Nyhus and E. Pons
Dow
nloa
ded
by [
Elle
n N
yhus
] at
15:
00 0
6 A
pril
2015

people and family first. Croson and Gneezy (2009)reported that, across several studies, women typicallyappear more cautious, altruistic and less competitivethan men. They point out that differences in thesepreferences could arise from both cultural and geneticdifferences. These differences in preferences may causewomen to remain in a job for longer, to seek positionscharacterized with lower mean salaries and to avoidcompetition. Over time, these behaviours might growinto wage differences and explain part of the wage gap.
Variables suitable for tapping differences in pref-erence are seldom included in wage setting analyses,but when such variables are included the results pointto a reduction in the unexplained component of thewage gap. The objective of this study is to follow anew line in the exploration of the unexplained part ofthe wage gap by examining the contribution of genderdifferences in personality traits. More specifically, weexamine the contribution of time preference, locus ofcontrol, and the Big Five personality traits forexplaining the gender wage gap. These personalitytraits are defined as follows.
Time preference/consideration of futureconsequences
The concept of Consideration of FutureConsequences (CFC; Strathman et al., 1994) isintended to describe differences to the extent towhich a person considers distant outcomes whenchoosing his or her present behaviour. At one end ofthe continuum are those individuals who value futurebenefits and the achievement of goals (despite imme-diate undesirable outcomes or efforts), and at theother end are those uninterested in the considerationof consequences, preferring to focus on the present.
Locus of control
Locus of Control (LoC) originates from Rotter’ssocial learning theory (Rotter, 1966) and reflects anindividual’s generalized belief about who controls theimportant events in his/her life: himself/herself orexternal factors such as chance, fate, ‘the system’ orpowerful others. People who believe their lives to becontrolled by their own actions are denoted ‘inter-nals’, whereas those who believe their lives arecontrolled by external factors are termed ‘externals’.
The Big Five personality traits
After decades of research on individual traits, liter-ature is approaching consensus on a general taxon-omy of personality traits called the Big Five
(e.g. Digman, 1990; John and Srivastava, 1999).The five factors are as follows:
– Extraversion, which describes a person’s ten-dency to seek stimulation and novelty. It aims tocapture qualities such as gregariousness andassertiveness.
– Emotional stability, which describes the degreeto which an individual may be termed tense,insecure, anxious, depressed and emotionalrather than calm, self-confident and cool.
– Agreeableness, which describes qualities such assympathy, kindness or affection. It incorporatesthe willingness to help others and to act inaccordance with the interests of others. Itconcerns the degree to which an individual iscooperative, warm and agreeable versus cold,disagreeable and antagonistic.
– Conscientiousness, which describes the extent towhich an individual is hardworking, organizedand dependable as opposed to lazy, disorganizedand unreliable. It measures a person’s tendencyto follow rules and schedules and is related to theneed for achievement.
– Openness to experience, which describes a per-son’s propensity to make independent decisionsand their degree of initiative and control. Theindex used in this study measures intellect.This emphasizes the controlled aspects of intel-ligence – such as being perceptive or reflective –as well as the expressive aspects: being imagina-tive, curious or broadminded. According to Johnand Srivastava (1999), the intellect factor is nota measure of intelligence and correlates onlyweakly with IQ measures and ScholasticAptitude Test (SAT) scores. They interpret theintellect factor as being one part of the broaderopenness factor.
Personality and wage
Several authors have already advocated a role forpersonality traits in determining effort, productivityand wages. Bowles et al. (2001), in the framework of aprincipal–agent model, argue that personality traitsmay influence how strongly an employee reacts toincentives. Employers may elicit effort at a lower costby rewarding such incentive-enhancing traits in thewage setting. One of the factors they propose asincentive enhancing is time preference, since it mayinfluence the motivation to behave in a mannerconducive to keeping a job. Research by Gattig(2002) supports the idea that future-oriented individ-uals are more motivated to perform. A secondincentive-enhancing factor is LoC. Internals are
Personality and the gender wage gap 107
Dow
nloa
ded
by [
Elle
n N
yhus
] at
15:
00 0
6 A
pril
2015
likely to be more motivated to perform than externalsbecause they regard themselves as able to produce thedesired outcomes (Goldsmith et al., 1997). Someempirical studies confirm that internals obtain higherearnings (Groves, 2005; Heckman et al., 2006;Semykina and Linz, 2007; Fortin, 2008).
An alternative, but related, explanation is thatpersonality may be linked to earnings throughproductivity differences. Salgado’s (1997) meta-study provided support for robust and generalrelationships between some personality traits (emo-tional stability and conscientiousness) and produc-tivity, while other traits have occupation-specificassociations with productivity.
Third, personality traits might affect wagesthrough the behaviour of employees within anorganization. Kyl-Heku and Buss (1996) and Lundet al. (2007) have found that personality traits areassociated with both the use of hierarchy negotiationtactics4 at work and with earnings. This may influ-ence both wage setting and the likelihood of promo-tion in a manner that does not necessarily rewardproductivity.
Gender differences in personality and in its returnsin the labour market
Numerous studies show that men and women exhibit,on average, differences in the personality traits. Forexample, in Feingold’s (1994) meta-analysis, it wasshown that men are more aggressive, assertive andhave higher self-esteem than females, while femalesscore higher on tender mindedness in particular. Buss(1995) has also found robust gender differences inrisk preferences, competitiveness, status seeking,achievement orientation and affiliate behaviour.These gender differences in personality traits arefound to be generally constant across age, year ofdata collection, educational levels and nations.
Some empirical studies on gender differences inpersonality have revealed differences in the traitsexplored in this study and in their relationship withearnings. Keough et al. (1999) reported that men tendto be more present-oriented than women, whilewomen are more future-oriented than men. Thesame result is found in Petrocelli (2003). Halpern(2000) suggests that differences in time preferencesmay, in part, be due to differences in gender roledevelopment. Males tend to be engaged in at-the-moment competition in order to be successful in
reproduction while, women tend to engage in repro-ductive activities that presuppose more long-termgoals such as childrearing. This would result in menbeing, on average, more present-oriented thanwomen. Following Bowles et al.’s (2001) hypothesisabout the link between time preference and earnings,the gender differences in future orientation givefemale employees an advantage in wage setting.
Sherman et al. (1997) and Semykina and Linz(2007) and others have also found gender differencesin LoC. Women have a higher likelihood of beingexternal, while men tend to be more internal.5
Semykina and Linz (2007) found that women’searnings are more affected by personality traits thanthose of men and that variation in both LoC andNeed for Affiliation/Challenge explains as much as8% of the gender wage gap.
Investigating samples from 55 countries, Schmittet al. (2008) found that women across most nationsreport higher levels of neuroticism, extraversion,agreeableness and conscientiousness than men.Furthermore, Bouchard and Loehlin (2001) carriedout a large review of studies including the Big FivePersonality traits, and concluded that agreeablenessand neuroticism are the two traits most consistentlyshowing the largest gender differences. Evolutionarytheory offers an explanation for some of thesedissimilarities based on gender differences in theancestral environment and strategies used in repro-duction.6 Men, who have to compete with other mento obtain a female and resources for maintaining thefamily and assure survival of their genes, are morecompetitive, status-seeking and risk-seeking (Mazurand Booth, 1998). Women, who assure their repro-duction by physically taking care of children, andwho have performed work that is usually sharedwithin a group, have higher scores, for example, inempathy, nurturance and cooperation (Low, 1989;Geary, 1998; Halpern, 2000). This pro-social dom-inance for women means that their concept of self iscentred on relationships. This will make womenmore empathic and people-orientated in line, forexample, with the definition of the agreeablenessfactor (Feingold, 1994). This was also found byNyhus and Pons (2005) and Mueller and Plug(2006), who studied gender differences in relationto return to Big Five traits. Mueller and Plug (2006)found that around 3% of the gender gap may beattributed to differences in the Big Five personalitytraits.
4Hierarchy-negotiations tactics are defined as the psychological and behavioural means by which individuals maintain orimprove their relative position or status (Kyl-Heku and Buss, 1996).5Mueller (2004), however, finds no statistically significant difference between men and women in terms of LoC.6 See Browne (1995) for an extended explanation of this argument.
108 E. K. Nyhus and E. Pons
Dow
nloa
ded
by [
Elle
n N
yhus
] at
15:
00 0
6 A
pril
2015

The Big Five traits are also related to genderdifferences in the use of tactics to get ahead in firms.Lund et al. (2007) found gender differences in thefrequency of use of deception/manipulation, indus-trious/knowledgeableness and social display/networking tactics. Men used deception/manipula-tion and industrious/knowledgeableness tactics moreoften while social display/networking tactics werereported to be used most frequently by women. In thesame vein, Sabatier (2008) reports evidence thatpromotion strategies are different for males andfemales. The gender-specific use of tactics representsan alternative explanation for the gender wage gapsince there may be an indirect effect of personality onwage through its relation with tactic use.
The rest of this article is organized as follows: InSection II, data collection and measures aredescribed; Section III explains the empirical model;results are presented in Section IV; and finally SectionV concludes.
II. Data and Measurement
Data
We used data from a large Dutch panel collected in2005 for the DNB Household Survey. The surveyincludes detailed information about participants’labour market details, family situation, as well asitems designed to tap various psychological con-cepts.7 The final sample was reduced from about 2000to 622 individuals on the basis of (1) missing data;(2) exclusion of participants who do not work, such asretired panel members and students and (3) partici-pants with more than one employer. The samplecomprised 370 men and 252 women aged 16–64.
Measurement
Hourly wage. Annual gross salary was used tocalculate hourly wage (annual gross salary wasdivided by the number of working weeks in therelevant year and then by the number of hoursworked each week). Because the question about hoursof work per week did not concern any employer orperiod in particular, we excluded employees who hadmore than one employer.
Personality traits. (1) Strathman et al.’s (1994)Consideration of Future Consequences 12-item scale
aims to measure the extent to which people considerdistant versus immediate consequences of possiblebehaviours. In this study, Cronbach’s alpha for the 12items is 0.75. A composite score was constructed byadding the scores of the 12 items. (2) Furnham’s(1986) Economic Locus of Control Scale is a measureof LoC specific to financial behaviour. The data setincludes the items comprising the subscales internaland chance. The factor internal is composed of itemsthat concern personal control over financial affairs.Furnham found this scale to correlate positively withRotter’s LoC scale. The subscale for chance com-prises items concerned with uncontrollable chancefactors. In our study the internal scale has aCronbach’s alpha of 0.70, while the chance scalehad a Cronbach’s alpha of 0.63. Composite factorscores were constructed by computing the averagescore for the items comprising each factor, respec-tively. (3) The Big Five personality traits wereassessed by a 50-item scale drawn from theInternational Personality Item Pool8 (Goldberg,1999). We obtain the following Cronbach’s alphasfor the five factors: extraversion (�¼ 0.86); emotionalstability (�¼ 0.85); agreeableness (�¼ 0.83); intellect/openness to experience (�¼ 0.76); and conscientious-ness (�¼ 0.79). The factor scores were constructed byadding the scores for the 10 items comprising eachfactor.9
One challenge for studies of the relationshipbetween psychological variables and earnings isendogeneity (Heckman et al., 2006). There is muchevidence supporting the notion that psychologicaltraits are relatively stable for adults, but otherssuggest that they may change as a result of adult lifeexperience. Srivastava et al. (2003) reported thatscores of conscientiousness and agreeableness typi-cally increase throughout early and middle adulthoodat varying rates. They also found that emotionalstability increases with age among women, but notamong men. It is also likely that there may be aninteraction between LoC and experiences in thelabour market. In this study, and in line withGroves (2005) and Nyhus and Pons (2005), weattempt to control for the effect of age by regressingthe personality variables against age (as well as thesecond and third-order term of age) and using thepredicted residuals as measures of the personalityvariables. As to labour-specific characteristics thatmay affect the personality traits, we lack the neces-sary data to control for this. We, therefore, have to becautious about any causal interpretation.
7Documentation for the surveys is available at CenterData’s website (http://www.uvt.nl/centerdata/dhs/documentation/).8 http://ipip.ori.org.9As advised on http://ipip.ori.org/newScoringInstructions.htm.
Personality and the gender wage gap 109
Dow
nloa
ded
by [
Elle
n N
yhus
] at
15:
00 0
6 A
pril
2015
Socio-economic and labour market variables
In addition to the personality variables, we included
the following variables in the analyses:
– Education and experience. Respondents were
asked about their highest level of completed
education, which was coded as ‘high’, ‘middle’
and ‘low’. Respondents also reported the infor-
mation needed to calculate work experience and
tenure.– Family status. Respondents reported informa-
tion such as marital status, the number of
children under 12 and the presence of children
under 5, since these factors may affect a worker’s
effort and productivity. Previous studies have
shown that the effect of these family variables
may differ by gender. For example, Correll et al.
(2007) found that women are subject to a
motherhood penalty, while fathers receive a
fatherhood premium. This motherhood penalty
may be related to maternity leaves that cause
women’s labour market activity to be more
discontinuous than that of men, as shown in, forexample, by Hotchkiss and Pitts (2005).
– Employment characteristics. The data setincludes variables representing workplace char-acteristics such as type of contract (permanent/temporary, fulltime/parttime, public/privatesector) because gender differences often arefound in these characteristics.10 Previousresearch shows that the inclusion of job charac-teristics reduces the unexplained wage differen-tial (e.g. Macpherson and Hirsch, 1995).
– Regional differences. Location dummies wereincluded in the analyses as regressors to accountfor any regional labour market differences anddifferences in the degree of urbanization.
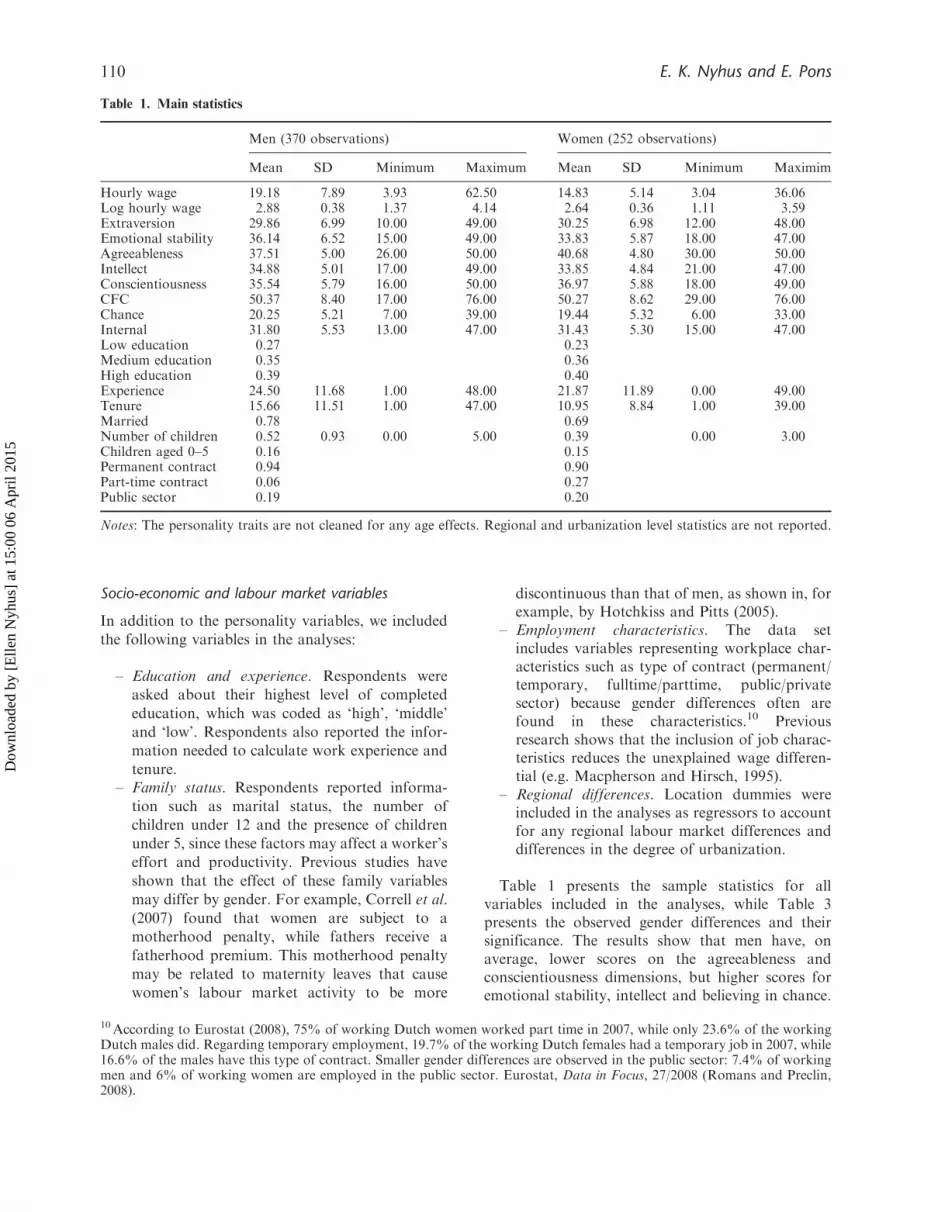
Table 1 presents the sample statistics for allvariables included in the analyses, while Table 3presents the observed gender differences and theirsignificance. The results show that men have, onaverage, lower scores on the agreeableness andconscientiousness dimensions, but higher scores foremotional stability, intellect and believing in chance.
Table 1. Main statistics
Men (370 observations) Women (252 observations)
Mean SD Minimum Maximum Mean SD Minimum Maximim
Hourly wage 19.18 7.89 3.93 62.50 14.83 5.14 3.04 36.06Log hourly wage 2.88 0.38 1.37 4.14 2.64 0.36 1.11 3.59Extraversion 29.86 6.99 10.00 49.00 30.25 6.98 12.00 48.00Emotional stability 36.14 6.52 15.00 49.00 33.83 5.87 18.00 47.00Agreeableness 37.51 5.00 26.00 50.00 40.68 4.80 30.00 50.00Intellect 34.88 5.01 17.00 49.00 33.85 4.84 21.00 47.00Conscientiousness 35.54 5.79 16.00 50.00 36.97 5.88 18.00 49.00CFC 50.37 8.40 17.00 76.00 50.27 8.62 29.00 76.00Chance 20.25 5.21 7.00 39.00 19.44 5.32 6.00 33.00Internal 31.80 5.53 13.00 47.00 31.43 5.30 15.00 47.00Low education 0.27 0.23Medium education 0.35 0.36High education 0.39 0.40Experience 24.50 11.68 1.00 48.00 21.87 11.89 0.00 49.00Tenure 15.66 11.51 1.00 47.00 10.95 8.84 1.00 39.00Married 0.78 0.69Number of children 0.52 0.93 0.00 5.00 0.39 0.00 3.00Children aged 0–5 0.16 0.15Permanent contract 0.94 0.90Part-time contract 0.06 0.27Public sector 0.19 0.20
Notes: The personality traits are not cleaned for any age effects. Regional and urbanization level statistics are not reported.
10According to Eurostat (2008), 75% of working Dutch women worked part time in 2007, while only 23.6% of the workingDutch males did. Regarding temporary employment, 19.7% of the working Dutch females had a temporary job in 2007, while16.6% of the males have this type of contract. Smaller gender differences are observed in the public sector: 7.4% of workingmen and 6% of working women are employed in the public sector. Eurostat, Data in Focus, 27/2008 (Romans and Preclin,2008).
110 E. K. Nyhus and E. Pons
Dow
nloa
ded
by [
Elle
n N
yhus
] at
15:
00 0
6 A
pril
2015

These gender differences in personality trait scoresare similar before and after cleaning the measures forany age effect. With the exception of our findingsconcerning extraversion (insignificant) and believingin chance being higher for men, these gender differ-ences are in line with findings from other studies.
III. Empirical Model
We follow the usual procedure for wage differentialdecomposition suggested by Blinder (1973) andOaxaca (1973). The total difference in mean logwages of men and women can be decomposed asfollows:
lnWm � lnWf ¼ X0m �_
m � X0f �_
f ð1Þ
where lnWm and lnWf denote the mean log wages ofmale and female employees, respectively, Xm and Xf
the mean of characteristics (including the personalitytraits) of men and women, and �
_
m and �_
f theestimated parameters from the male and female wageequations.
We adopt the structure proposed by Neumark(1988) in which the nondiscriminatory structure is avector of rates of return obtained by estimatingearnings functions based on the pooled sampleof the two demographic groups, �
_
pool. This can bewritten as
lnWm � lnWf
¼ Xm � Xf
� �0�_
pool þ Xm0
��� �_
m � �_
pool
� �
þ Xf0�_
pool � �_
f
� �ð2Þ
The first term on the right side of Equation 2represents the explained component of the wage gap,attributed to differences in characteristics. Theunexplained part is the second term (in squarebrackets) that may be attributed to returns to thesecharacteristics. This component is often considered areflection of labour market discrimination. However,as we have already noted, this gap may be related to
gender differences in omitted variables, which wouldcause the estimates of discrimination to be too high.
IV. Results
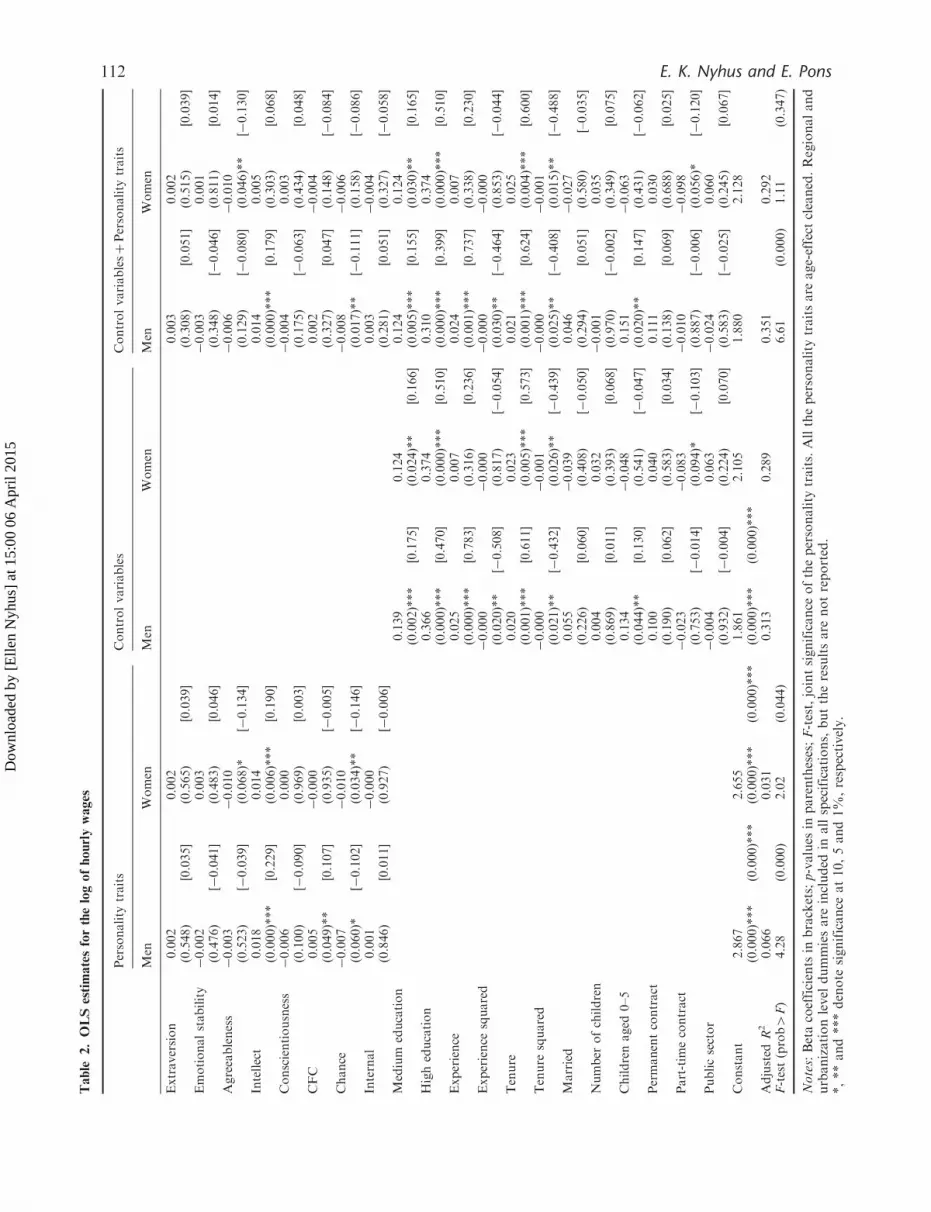
Earnings equation results
Table 2 reports the Ordinary Least Squares (OLS)estimates of the log hourly wage equation for themale and female samples respectively. Coefficientsand beta coefficients (in squared brackets) arereported. When we analyse the relationship betweenthe personality traits and wage (column 1) using themale sample, we find positive associations betweenintellect and CFC with wages, while we find anegative relationship between believing in chanceand wages.11 In the female sample, we find a positiverelationship between intellect and wages while therelationships between agreeableness, believing inchance, and wages are negative.12 In reference tothe explanatory power of the personality traits, wereport the adjusted R2 and the F-test of jointsignificance at the bottom of the table. The person-ality variables explain 3.1% of the variance in wagesfor women, while they explain 6.6% of the variance inmale wages. The F-test shows the joint significance ofthe personality traits.
In column two, we report estimation results of themodel including only the control variables. Theseestimations are consistent with results from previousstudies of wage determination. The model in the thirdcolumn includes all the variables from the two firstmodels. Despite the inclusion of many control vari-ables, we find significant effects of some of thepersonality traits on wages.13 In the male sample, weobserve a significant and positive relationshipbetween intellect and wages and a negative relation-ship between believing in chance and wages.14 Whenanalysing the female sample, we only find agreeable-ness to have a significant relationship with wages.One SD increase in agreeableness is associated with adecrease in women’s hourly wages by an average of13%. When the control variables are included, the
11 Looking at the beta coefficients, we observe that one SD increase in intellect and CFC increases men’s hourly wage, onaverage, by 22.9% and 10.7%, respectively. On the other hand, one SD increase in the score for the trait believing in chancedecreases men’s hourly wage by an average 10.2%.12One SD increase in the intellect factor increases women’s hourly wages by 19% on average while one SD increase inagreeableness and believing in chance decreases women’s hourly wages by averages of 13.4% and 14.6%, respectively.13 Part of the effect of noncognitive traits on hourly wages can be captured by the human capital, family structure andworkplace or contract variables.14One SD increase in intellect corresponds to an average increase in men’s hourly wage by 17.9%. This effect is higher thanthe impact of, for example, having medium education (12.4%). On the other hand, one SD increase in the score for the traitbelieving in chance is associated with a decrease in men’s hourly wages by, on average, 11.1%.
Personality and the gender wage gap 111
Dow
nloa
ded
by [
Elle
n N
yhus
] at
15:
00 0
6 A
pril
2015
Table
2.OLSestimatesforthelogofhourlywages
Personality
traits
Controlvariables
ControlvariablesþPersonality
traits
Men
Women
Men
Women
Men
Women
Extraversion
0.002
0.002
0.003
0.002
(0.548)
[0.035]
(0.565)
[0.039]
(0.308)
[0.051]
(0.515)
[0.039]
Emotionalstability�0.002
0.003
�0.003
0.001
(0.476)
[�0.041]
(0.483)
[0.046]
(0.348)
[�0.046]
(0.811)
[0.014]
Agreeableness
�0.003
�0.010
�0.006
�0.010
(0.523)
[�0.039]
(0.068)*
[�0.134]
(0.129)
[�0.080]
(0.046)**
[�0.130]
Intellect
0.018
0.014
0.014
0.005
(0.000)***
[0.229]
(0.006)***
[0.190]
(0.000)***
[0.179]
(0.303)
[0.068]
Conscientiousness
�0.006
0.000
�0.004
0.003
(0.100)
[�0.090]
(0.969)
[0.003]
(0.175)
[�0.063]
(0.434)
[0.048]
CFC
0.005
�0.000
0.002
�0.004
(0.049)**
[0.107]
(0.935)
[�0.005]
(0.327)
[0.047]
(0.148)
[�0.084]
Chance
�0.007
�0.010
�0.008
�0.006
(0.060)*
[�0.102]
(0.034)**
[�0.146]
(0.017)**
[�0.111]
(0.158)
[�0.086]
Internal
0.001
�0.000
0.003
�0.004
(0.846)
[0.011]
(0.927)
[�0.006]
(0.281)
[0.051]
(0.327)
[�0.058]
Medium
education
0.139
0.124
0.124
0.124
(0.002)***
[0.175]
(0.024)**
[0.166]
(0.005)***
[0.155]
(0.030)**
[0.165]
Higheducation
0.366
0.374
0.310
0.374
(0.000)***
[0.470]
(0.000)***
[0.510]
(0.000)***
[0.399]
(0.000)***
[0.510]
Experience
0.025
0.007
0.024
0.007
(0.000)***
[0.783]
(0.316)
[0.236]
(0.001)***
[0.737]
(0.338)
[0.230]
Experience
squared
�0.000
�0.000
�0.000
�0.000
(0.020)**
[�0.508]
(0.817)
[�0.054]
(0.030)**
[�0.464]
(0.853)
[�0.044]
Tenure
0.020
0.023
0.021
0.025
(0.001)***
[0.611]
(0.005)***
[0.573]
(0.001)***
[0.624]
(0.004)***
[0.600]
Tenure
squared
�0.000
�0.001
�0.000
�0.001
(0.021)**
[�0.432]
(0.026)**
[�0.439]
(0.025)**
[�0.408]
(0.015)**
[�0.488]
Married
0.055
�0.039
0.046
�0.027
(0.226)
[0.060]
(0.408)
[�0.050]
(0.294)
[0.051]
(0.580)
[–0.035]
Number
ofchildren
0.004
0.032
�0.001
0.035
(0.869)
[0.011]
(0.393)
[0.068]
(0.970)
[�0.002]
(0.349)
[0.075]
Childrenaged
0–5
0.134
�0.048
0.151
�0.063
(0.044)**
[0.130]
(0.541)
[�0.047]
(0.020)**
[0.147]
(0.431)
[�0.062]
Permanentcontract
0.100
0.040
0.111
0.030
(0.190)
[0.062]
(0.583)
[0.034]
(0.138)
[0.069]
(0.688)
[0.025]
Part-tim
econtract
�0.023
�0.083
�0.010
�0.098
(0.753)
[�0.014]
(0.094)*
[�0.103]
(0.887)
[�0.006]
(0.056)*
[�0.120]
Publicsector
�0.004
0.063
�0.024
0.060
(0.932)
[�0.004]
(0.224)
[0.070]
(0.583)
[�0.025]
(0.245)
[0.067]
Constant
2.867
2.655
1.861
2.105
1.880
2.128
(0.000)***
(0.000)***
(0.000)***
(0.000)***
(0.000)***
(0.000)***
Adjusted
R2
0.066
0.031
0.313
0.289
0.351
0.292
F-test(prob4F)
4.28
(0.000)
2.02
(0.044)
6.61
(0.000)
1.11
(0.347)
Notes:Betacoefficients
inbrackets;p-values
inparentheses;F-test,jointsignificance
ofthepersonality
traits.Allthepersonality
traitsare
age-effect
cleaned.Regionaland
urbanizationlevel
dummiesare
included
inallspecifications,buttheresultsare
notreported.
*,**and***denote
significance
at10,5and1%
,respectively.
112 E. K. Nyhus and E. Pons
Dow
nloa
ded
by [
Elle
n N
yhus
] at
15:
00 0
6 A
pril
2015

relationship between CFC and male wages is nonsig-nificant. This may be due to CFC having an indirectrelationship with wages through educational attain-ment. The returns to medium and high education formales decrease when the personality variables areincluded in the analyses, which is an indication thatpart of the effect of personality traits on wages iscaptured by the level of education. This means thatreturns to schooling may be overestimated whenpersonality traits are omitted from wage analyses(Feinstein, 2000; Coleman and DeLeire, 2003;Semykina and Linz, 2007).
Regarding the predictive power of the model thatincludes both the control and personality variables,we find that, in both the male and female samples,the inclusion of personality variables increases theadjusted R2, although the F-test of joint significanceof the personality traits is insignificant for thefemale sample. We therefore conclude, based onthe results presented in columns 1 and 3, thatpersonality traits are more important for the wagesof men than for the wages of women, which is inline with the results of Nyhus and Pons (2005), alsousing Dutch data.
Wage gap decomposition results
Table 3 presents the mean differences between the
male and female samples, differences in coefficients
for the three models as well as their associated
significance values. With regard to the estimated
coefficients, we do not find significant gender differ-
ences in return to personality traits when including
only the personality traits in the analyses. When we
include both the personality traits and the control
variables in the estimation, we find a significant
gender difference in believing in chance coefficient
that benefits women. This means that men who are
more fatalistic exhibit a greater wage penalty in
comparison to women.In Table 4, we report the results of the gender wage
gap decomposition. The gender wage gap of the
logarithm of hourly wages amounts to 0.25%, which
is similar to other studies of the gender wage gap in
the Netherlands (van der Merr, 2008). The first
column shows the results of the decomposition when
only the personality traits are included in the analysis.
The results show that 14.12% of the gender gap can
be attributed to differences in the personality traits,
Table 3. Male–female differences in means and coefficients
Coefficient differences
Mean differences Personality traits Control variablesPersonality traits þControl variables
Hourly wage 4.356***Log hourly wage 0.246***Extraversion �0.292 �0.0001 0.0007Emotional stability 2.106*** �0.0053 �0.0035Agreeableness �3.123*** 0.0072 0.0037Intellect 1.158*** 0.0033 0.0086Conscientiousness �1.587*** �0.0061 �0.0071CFC 0.108 0.0051 0.0056Chance 0.747* 0.0025 �0.0022*Internal 0.407 0.0011 0.0074Medium education �0.015 0.0146 0.0000High education �0.018 �0.0081 �0.0636Experience 2.632*** 0.0182* 0.0169*Experience squared 117.28*** �0.0003 �0.0002Tenure 4.708*** �0.0032 �0.0039Tenure squared 179.664*** 0.0002 0.0002Married 0.094*** 0.0935 0.0735Number of children 0.130* �0.0274 �0.0362Children 0–5 aged 0.015 0.1816* 0.2144**Permanent contract 0.039* 0.0593 0.0819Part-time contract �0.210*** 0.0603 0.0874Public �0.010 �0.0663 �0.0842Constant 0.2121 �0.2434 0.2480
Notes: All the personality variables are age-effect cleaned; differences in regional and urbanization dummies arenot reported.*, ** and *** denote significance at 10, 5 and 1%, respectively.
Personality and the gender wage gap 113
Dow
nloa
ded
by [
Elle
n N
yhus
] at
15:
00 0
6 A
pril
2015
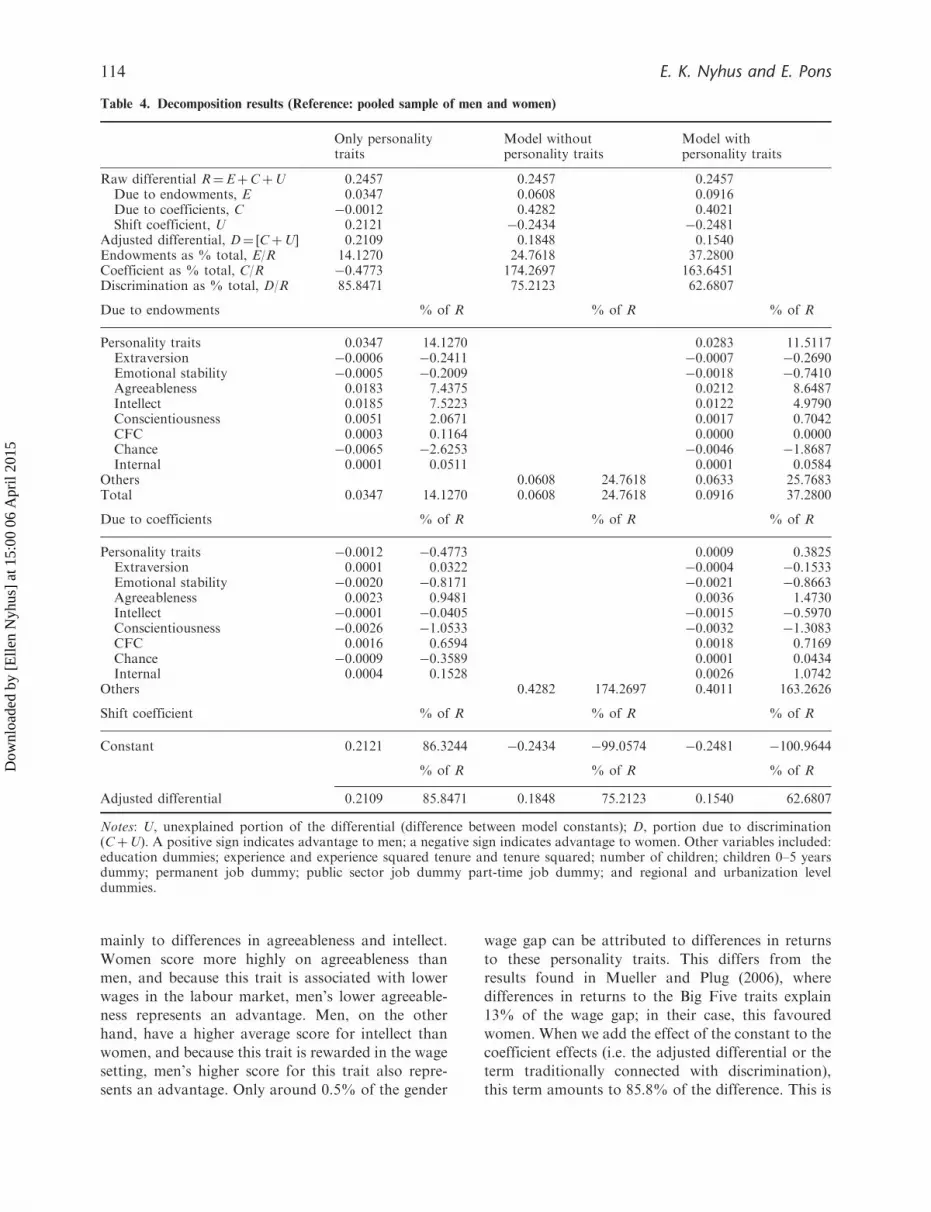
mainly to differences in agreeableness and intellect.
Women score more highly on agreeableness than
men, and because this trait is associated with lower
wages in the labour market, men’s lower agreeable-
ness represents an advantage. Men, on the other
hand, have a higher average score for intellect than
women, and because this trait is rewarded in the wage
setting, men’s higher score for this trait also repre-
sents an advantage. Only around 0.5% of the gender
wage gap can be attributed to differences in returns
to these personality traits. This differs from the
results found in Mueller and Plug (2006), where
differences in returns to the Big Five traits explain
13% of the wage gap; in their case, this favoured
women. When we add the effect of the constant to the
coefficient effects (i.e. the adjusted differential or the
term traditionally connected with discrimination),
this term amounts to 85.8% of the difference. This is
Table 4. Decomposition results (Reference: pooled sample of men and women)
Only personalitytraits
Model withoutpersonality traits
Model withpersonality traits
Raw differential R¼EþCþU 0.2457 0.2457 0.2457Due to endowments, E 0.0347 0.0608 0.0916Due to coefficients, C �0.0012 0.4282 0.4021Shift coefficient, U 0.2121 �0.2434 �0.2481
Adjusted differential, D¼ [CþU] 0.2109 0.1848 0.1540Endowments as % total, E/R 14.1270 24.7618 37.2800Coefficient as % total, C/R �0.4773 174.2697 163.6451Discrimination as % total, D/R 85.8471 75.2123 62.6807
Due to endowments % of R % of R % of R
Personality traits 0.0347 14.1270 0.0283 11.5117Extraversion �0.0006 �0.2411 �0.0007 �0.2690Emotional stability �0.0005 �0.2009 �0.0018 �0.7410Agreeableness 0.0183 7.4375 0.0212 8.6487Intellect 0.0185 7.5223 0.0122 4.9790Conscientiousness 0.0051 2.0671 0.0017 0.7042CFC 0.0003 0.1164 0.0000 0.0000Chance �0.0065 �2.6253 �0.0046 �1.8687Internal 0.0001 0.0511 0.0001 0.0584
Others 0.0608 24.7618 0.0633 25.7683Total 0.0347 14.1270 0.0608 24.7618 0.0916 37.2800
Due to coefficients % of R % of R % of R
Personality traits �0.0012 �0.4773 0.0009 0.3825Extraversion 0.0001 0.0322 �0.0004 �0.1533Emotional stability �0.0020 �0.8171 �0.0021 �0.8663Agreeableness 0.0023 0.9481 0.0036 1.4730Intellect �0.0001 �0.0405 �0.0015 �0.5970Conscientiousness �0.0026 �1.0533 �0.0032 �1.3083CFC 0.0016 0.6594 0.0018 0.7169Chance �0.0009 �0.3589 0.0001 0.0434Internal 0.0004 0.1528 0.0026 1.0742
Others 0.4282 174.2697 0.4011 163.2626
Shift coefficient % of R % of R % of R
Constant 0.2121 86.3244 �0.2434 �99.0574 �0.2481 �100.9644
% of R % of R % of R
Adjusted differential 0.2109 85.8471 0.1848 75.2123 0.1540 62.6807
Notes: U, unexplained portion of the differential (difference between model constants); D, portion due to discrimination(CþU). A positive sign indicates advantage to men; a negative sign indicates advantage to women. Other variables included:education dummies; experience and experience squared tenure and tenure squared; number of children; children 0–5 yearsdummy; permanent job dummy; public sector job dummy part-time job dummy; and regional and urbanization leveldummies.
114 E. K. Nyhus and E. Pons
Dow
nloa
ded
by [
Elle
n N
yhus
] at
15:
00 0
6 A
pril
2015
higher than the unexplained part of the wage gapfound in Mueller and Plug (2006) using a model thatincluded only the Big Five personality traits asregressors. Some of the differences between theresults based on the Dutch data used here and theUS data used by Mueller and Plug may be due tothe prevalence of centralized bargaining in theNetherlands, which may limit the role of personalitytraits in the wage setting.
In the second column of Table 4, we present theresults of a model that includes the control variables.They explain 24.8% of the gender wage gap, while75.2% remains unexplained. In the third column, thepersonality traits are added. We observe that differ-ences in personality traits account for a smaller partof the gender wage gap than in the model in the firstcolumn (11.5% against 14.1%). This indicates that acomponent of the effect of personality traits iscaptured by the control variables. The effect ofpersonality traits is higher than the effect found byMuller and Plug (2006) and by Semykina and Linz(2007) after the inclusion of control variables in theanalysis. The gender differences in returns to thepersonality traits are low, and can only explain 0.38%of the gender wage gap. In addition, the role ofdifferences in return to personality traits are lowerthan that reported in Muller and Plug (2006): theyfound that gender differences in the return to the BigFive personality traits could account for 5% of thewage gap, after controlling for human capitalvariables.
The inclusion of personality traits reduces theunexplained part of the gender wage gap from 75.2%to 62.7%, which is similar to the results reported bySemykina and Linz (2007), who found a similarreduction from 77.6% to 67.5%.15 Therefore, wehave found support for the hypothesis that a part ofthe gender wage gap that is not explained bydifferences in human capital variables is accountedfor by differences in personality traits.
V. Conclusions
Research on gender wage comparisons focus on theamount of the observed wage differential due togender differences in characteristics (typically focusedon traditional human capital variables) and theamount due to different returns to these characteris-tics, the unexplained part of the gender wage gap.
This unexplained part is often attributed to discrim-ination. However, it may also arise from the omissionof variables that capture differences in productivity,hierarchy negotiation tactics or preferences towardsearnings. This study contributes towards our under-standing of the unexplained part of the gender wagegap by considering the effect of personality traits.
Consistent with previous studies, we find thatagreeableness is negatively related to the wages offemales. Our results also show that intellect ispositively related to male wages, while men arepunished in the wage setting for having an externallocus of control. It is also observed that they arepunished slightly more for this trait than women.These findings may be associated occupationalchoices, with agreeable workers choosing low-paidservice occupations and the use of hierarchy negoti-ation tactics less effective in bargaining wages andopenness-to-experience/intellect being associated withmanagerial tasks. This should be addressed in futureresearch. In Bowles et al. (2001), it is also suggestedthat some personality traits would be incentive-enhancing, so that people characterized by thesetraits would react more to incentives than others. Inthis study, we found a weak support for theirproposition that time preference and locus of controlare incentive enhancing. We found a link betweenfuture orientation and male wages, although thisrelationship disappeared when education was addedto the model. We also observed a link between locusof control and wages, for both women and men.
Regarding the estimates of the gender wage gap, wefind that the raw wage gap in our data amount to24.6%. The results from the estimations of a modelthat include socio-economic and control variables asregressors show that the unexplained part of this gapis 18.5%. The inclusion of the personality traits in themodel results in a reduction of the unexplained partto 15.4%, the part of the wage gap traditionallyattributable to discrimination. We find that thegreater part of this reduction is attributable togender differences in the traits agreeableness andopenness-to-experience/intellect. Therefore, thegender wage gap may partly be explained by thenotion that gender differences in personality, andthe traits that characterize women more often thanmen, seem to be less rewarded in the labour market.We do not, however, find that the gender wage gap isdue to men or women being differentially rewarded orpunished for these traits. This indicates that a part ofthe unexplained wage gap might be a result of gender
15Mueller and Plug (2006) do not report the results from a model without the personality traits.
Personality and the gender wage gap 115
Dow
nloa
ded
by [
Elle
n N
yhus
] at
15:
00 0
6 A
pril
2015

differences in the lifestyle and labour market prefer-ences. It would question the implementation of stronganti-discrimination policies if these differences inpreferences are the result of biological differencesbetween the sexes.
However, the remaining amount of the unex-plained part of the wage gap in our analyses is stillsubstantial (15.4 pp), so there is still room fordiscrimination. In addition, although the unexplainedpart of the gender wage gap may get smaller as aresult of testing richer wage setting models, one couldvalue the need for policy measures aimed at closingthe wage gap. First, differences in preferences mightalso result from a world with pre-market discrimina-tion that forces men and women to choose differentroles. If so, policies should be implemented at the pre-market level, where the problem arises. This connectswith the ongoing debate about the origin of thepreferences. Second, one could argue that policies toimprove the situation of women would be fair sinceresults show that gender differences do not appear intraits linked to productivity, such as conscientious-ness and emotional stability (Salgado, 1997), or thetraits that Bowels et al. suggest as being incentiveenhancing. Rather, it is gender differences in the traitslinked to use of less-effective hierarchy negotiationtactics and a higher tendency to choose a low-paidservice occupation that can explain parts of thegender wage gap. It may be fruitful to focus onprocedures for occupational choice, recruitment andpromotion in order to address that part of the gapthat is due to differences in the trait agreeableness.Others, however, could argue that this type of policycan be paternalist and does not respect the freedomand the nature of women who choose these tactics oroccupations.
Finally, like other studies on the relationshipbetween personality and wages, our study has limi-tations. Our analyses of personality traits are basedon self-reported data and the traits are measured afterthe respondents have entered the labour market. Thismeans that we cannot capture the effect of labourmarket experience on the traits. Hence, we must becareful about drawing causal inferences. Despitethese limitations, we think that the results show anecessity to continue exploring the effects on thewage gap of other possible determinants of genderpreferences such as, for example, risk preferences andcompetitiveness. Hopefully, a better knowledge of thecauses of the wage gap, garnered through furtherstudy of variables that typically vary by gender, mayhelp the development of more accurate genderpolicies or illuminate the arguments that ask for theremoval of this type of policy. We hope this study willencourage studies with such a behavioural approach.
Acknowledgements
In this article, we made use of data from the DNB
Household Survey (formally known as the CentER
Saving Survey/VSB Panel) collected by Center for
Economic Research, Tilburg University). We are
grateful for the opportunity provided to use this data
set. We gratefully acknowledge the financial support
from Generalitat Valenciana, GVPRE/2008/2001 and
Ministerio de Ciencia e Innovacion (Spain), ECO2008-
06035/ECON. We thank Ian Hocking, the journal
editor, and an anonymous referee of this journal for
their useful comments and suggestions.
References
Alesina, A. and Giuliano, P. (2007) The power of thefamily, NBER Working Paper No. 13051, NationalBureau of Economic Research, Inc, New York.
Arrow, K. J. (1973) The theory of discrimination,in Discrimination in Labor Markets (Eds)O. A. Ashenfelter and A. Rees, Princeton UniversityPress, Princeton, pp. 3–33.
Becker, G. S. (1957) The Economics of Discrimination, TheUniversity of Chicago Press, Chicago.
Becker, G. (1973) A theory of marriage: part I, Journal ofPolitical Economy, 81, 813–46.
Bergmann, B. R. (1974) Occupational segregation, wagesand profits when employers discriminate by race orsex, Eastern Economic Journal, 1, 103–10.
Blinder, A. S. (1973) Wage discrimination: reduced formand structural elements, Journal of Human Resources,8, 436–55.
Bourchard, T. J. and Loehlin, J. C. (2001) Genes, evolutionand personality, Behavior Genetics, 31, 243–73.
Bowles, S., Gintis, H. and Osborne, M. (2001) Incentive-enhancing preferences: personality, behavior andearning, American Economic Review, 91, 155–8.
Browne, K. R. (1995) Sex and temperament in modernsociety: a Darwinian vie of the glass ceiling and thegender gap, Arizona Law Review, 37, 971–1106.
Browne, K. R. (2002) Biology at Work: Rethinking SexualEquality, Rutgers University Press, New Brunswick.
Browne, K. R. (2006) Evolved sex differences and occupa-tional segregation, Journal of OrganizationalBehaviour, 27, 143–62.
Buss, D. M. (1995) Psychological sex differences: originsthrough sexual selection, American Psychologist, 50,164–8.
Cavalli-Sforza, L. L. and Feldman, M. W. (1973) Culturalversus biological inheritance: phenotypic transmissionfrom parents to children. (A theory of the effect ofparental phenotypes on children’s phenotypes),American Journal of Human Genetics, 25, 618–37.
Coleman, M. and DeLeire, T. (2003) An economic model oflocus of control and the human capital investmentdecision, Journal of Human Resources, 38, 701–21.
Correll, S. J., Benard, S. and Paik, I. (2007) Getting a job:is there a motherhood penalty?, American Journal ofSociology, 112, 1297–338.
116 E. K. Nyhus and E. Pons
Dow
nloa
ded
by [
Elle
n N
yhus
] at
15:
00 0
6 A
pril
2015

Croson, R. and Gneezy, U. (2009) Gender differencesin preferences, Journal of Economic Literature, 47,448–74.
Digman, J. M. (1990) Personality structure: emergence ofthe 5-factor model, Annual Review of Psychology, 41,417–40.
Feingold, A. (1994) Gender differences in personality: ameta-analysis, Psychological Bulletin, 116, 429–56.
Feinstein, L. (2000) The relative economic importance ofacademic, psychological and behavioral attributesdeveloped in childhood, Centre for EconomicPerformance Discussion Paper No. 443. Centre forEconomic Performance, School of Economics,London.
Fortin, N. M. (2005) Gender role attitudes and the labour-market outcomes of women across OECD countries,Oxford Review of Economic Policy, 21, 416–38.
Fortin, N. M. (2008) The gender wage gap among youngadults in the United States: the importance of moneyversus people, Journal of Human Resources, 43,884–918.
Furnham, A. (1986) Economic locus of control, HumanRelations, 39, 29–43.
Gattig, A. L. W. (2002) Intertemporal decision making:studies on the working of myopia. DoctoralDissertation, University of Groningen, TheNetherlands. Available at http://irs.ub.rug.nl/ppn/238938085 (accessed 4 November 2008).
Geary, D. C. (1998) Male, Female: The Evolution of HumanSex Differences, American Psychological Association,Washington, DC.
Goldberg, L. R. (1999) A broad-bandwidth, public domain,personality inventory measuring the lower-level facetsof several five-factor models, in Personality Psychologyin Europe (Eds) I. Mervielde, I. Deary, F. De Fruytand F. Ostendorf, Tilburg University Press, Tilburg,pp. 7–28.
Goldsmith, A., Veum, J. and Darity, W. (1997) The impactof psychological and human capital on wages,Economic Inquiry, 35, 815–29.
Groves, M. O. (2005) How important is your personality?Labor market returns to personality for women in theUS and UK, Journal of Economic Psychology, 26,827–41.
Halpern, D. F. (2000) Sex Differences in Cognitive Abilities,Erlbaum, Hillsdale.
Hayfron, J. E. (2002) Panel estimates of the earnings gap inNorway: do female immigrants experience a doubleearnings penalty?, Applied Economics, 34, 1441–52.
Heckman, J. J., Stixrud, J. and Urzua, S. (2006) The effectsof cognitive and cognitive abilities on labor marketoutcomes and social behavior, Journal of LaborEconomics, 24, 411–82.
Hinks, T. (2002) Gender wage differentials and discrimi-nation in the New South Africa, Applied Economics,34, 2043–52.
Hotchkiss, J. L. and Pitts, M. M. (2005) Female labourforce intermittency and current earnings: switchingregression model with unknown sample selection,Applied Economics, 37, 545–60.
John, O. P. and Srivastava, S. (1999) The Big Five traittaxonomy: history, measurement and theoreticalperspectives, in Handbook of Personality: Theory andResearch (Eds) L. A. Pervin and O. P. John, GuilfordPress, New York, pp. 102–38.
Judge, T. A. and Livingston, B. A. (2008) Is the gap morethan gender? A longitudinal analysis of gender, genderrole orientation, and earnings, Journal of AppliedPsychology, 93, 994–1012.
Kanazawa, S. (2005) Is ‘discrimination’ necessary toexplain the sex gap in earnings?, Journal of EconomicPsychology, 26, 269–87.
Keough, K. A., Zimbardo, P. G. and Boyd, J. N. (1999)Who’s smoking, drinking and using drugs? Timeperspective as a predictor of substance use, Basic andApplied Social Psychology, 21, 149–64.
Kyl-Heku, L. M. and Buss, D. M. (1996) Tactics as units ofanalysis in personality psychology: an illustrationusing tactics of hierarchy negotiation, Personality andIndividual Differences, 21, 497–517.
Lippa, R. A. (2005) Gender, Nature, and Nurture, LawrenceErlbaum Associates, London.
Low, B. S. (1989) Cross-cultural patterns in the training ofchildren: an evolutionary perspective, Journal ofComparative Psychology, 103, 311–19.
Lund, O. C. H., Tamnes, C. K., Moestue, C., Buss, D. M.and Vollrath, M. (2007) Tactics of hierarchy negoti-ation, Journal of Research in Personality, 41, 25–44.
Macpherson, D. and Hirsch, B. (1995) Wages and gendercomposition: why do women’s job pay less?, Journal ofLabor Economics, 13, 426–71.
Mazur, A. and Booth, A. (1998) Testosterone and domi-nance in men, Behavioral and Brain Sciences, 21,352–97.
Mueller, S. (2004) Gender gaps in potential for entrepre-neurship across countries and cultures, Journal ofDevelopmental Entrepreneurship, 9, 199–223.
Mueller, G. and Plug, E. (2006) Estimating the effects ofpersonality on male-female earnings, Industrial andLabor Relations Review, 60, 3–22.
Neumark, D. (1988) Employers’ discriminatory behaviorand the estimation of wage discrimination, Journal ofHuman Resources, 13, 279–95.
Nyhus, E. K. and Pons, E. (2005) The effects of personalityon earnings, Journal of Economic Psychology, 26,363–84.
Oaxaca, R. (1973) Male-female wage differentials in urbanlabor markets, International Economic Review, 14,693–709.
Olsen, R. N. (2009) Marital status in a developingeconomy: gender, ethnicity and family structure,Applied Economics, 41, 151–69.
Petrocelli, J. V. (2003) Factor validation of the consider-ation of future consequences scale, Journal of SocialPsychology, 143, 404–13.
Romans, F. and Preclin, V. (2008) Population and socialconditions, Eurostat: Data in Focus, 27/2008.
Rotter, J. B. (1966) Generalized expectancies for internalversus external control of reinforcement, PsychologicalMonographs: General and Applied, 80, 1–28.
Sabatier, M. (2008) Do female researchers face a glassceiling in France? A hazard model of promotions,Applied Economics, first published on 5 December2008.
Salgado, J. F. (1997) The five factor model of personalityand job performance in the European community,Journal of Applied Psychology, 82, 30–43.
Schmitt, D. P., Realo, A., Voracek, M. and Allik, J. (2008)Why can’t a man be more like a woman?Sex differences in Big Five personality traits across
Personality and the gender wage gap 117
Dow
nloa
ded
by [
Elle
n N
yhus
] at
15:
00 0
6 A
pril
2015

55 cultures, Journal of Personality and SocialPsychology, 94, 168–82.
Semykina, A. and Linz, S. J. (2007) Gender differences inpersonality and earnings: evidence from Russia,Journal of Economic Psychology, 28, 387–410.
Sherman, A. C., Higos, G. E. and Williams, T. R. (1997)Gender differences in the locus of control construct,Psychology and Health, 12, 239–48.
Srivastava, S., John, O. P., Gosling, S. D. and Potter, S.(2003) Development of personality in early and middleadulthood: set like plaster or persistent change?,Journal of Personality and Social Psychology, 85,1041–53.
Strathman, A., Gleicher, F., Boninger, D. S. and Edwards,C. S. (1994) The consideration of future
consequences: weighing immediate and distant out-comes of behavior, Journal of Personality and SocialPsychology, 66, 742–52.
Trivers, R. L. (1972) Parental investment and sexualselection, in Sexual Selection and the Descent of Man(Ed.) B. G. Campbell, Aldine, Chicago, pp. 136–79.
van de Merr, P. (2008) Is the gender wage gap declining inthe Netherlands?, Applied Economics, 40, 149–60.
Vella, F. (1994) Gender roles and human capital invest-ment: the relationship between traditional attitudesand female labour market performance, Economica,61, 191–211.
Weichselbaumer, D. and Winter-Ebmer, R. (2005) A meta-analysis of the international gender wage gap, Journalof Economic Surveys, 19, 479–511.
118 E. K. Nyhus and E. Pons
Dow
nloa
ded
by [
Elle
n N
yhus
] at
15:
00 0
6 A
pril
2015