institutional wage effects: revisiting union and bargaining council wage premia in south africa
TRANSCRIPT
INSTITUTIONAL WAGE EFFECTS: Revisiting Union and Bargaining Council
Wage Premia in South Africa
HAROON BHORATCARLENE VAN DER WESTHUIZEN
SUMAYYA GOGA
DPRU WORKING PAPER 12/151JULY 2012
INSTITUTIONAL WAGE EFFECTS:
Revisiting Union and Bargaining Council
Wage Premia in South Africa
DEVELOPMENT POLICY RESEARCH UNIT
HAROON BHORAT
Development Policy Research Unit
CARLENE VAN DER WESTHUIZEN
Development Policy Research Unit
SUMAYYA GOGA
Development Policy Research Unit
Working Paper 12/151
ISBN 978-1-920055-92-9
July 2012
© University of Cape Town 2012
This work is licenced under the Creative Commons Attribution-Non-Commercial-Share Alike 2.5 South Africa License. To view a copy of this licence, visit http://creativecommons.org/licenses/by-nc-sa/2.5/za/ or send a letter to Creative Commons, 171 Second Street, Suite 300, San Francisco, California 94105, USA.
ABSTRACT
The literature on the union wage gap in South Africa is extensive, spanning a range of datasets and methodologies. There is however, little consensus on the appropriate method to correct for the endogeneity of union membership or the size of the union wage gap. Furthermore, there are very few studies on the bargaining council wage premium in South Africa due to the lack of data on coverage of employees under bargaining council agreements. Our study, using 2005 Labour Force Survey data, firstly reconsiders the union wage gap controlling for both firm-level and job characteristics. When correcting for endogeniety of union status through a two-stage selection model and including firm size, the type of employment, and non-wage benefits in our wage estimations, we find a much lower union wage premium for African workers in the formal sector than premia reported in some previous studies. Secondly, our study estimates bargaining council wage premia for the private and public sectors. We find that extension procedures are present in both the private and public bargaining council systems, but that unions negotiate for additional gains for their members at the plant-level. The total estimated wage premium for formal sector African workers in the public sector who are both union members and covered by bargaining council agreements stands at 22 percent. Furthermore, there is some evidence that unions negotiate for awards for their members in the private sector, irrespective of bargaining council coverage. Keywords: Union; Bargaining Council; Wage Premium; PSCBC; South Africa
Acknowledgements The research, from which this paper emanates, was commissioned and funded by the Department of Labour (DoL).
Disclaimer The Working Paper series is intended to catalyse policy debate. They express the views of their respective authors and not necessarily those of the Development Policy Research Unit (DPRU).
CONTENTS 1. INTRODUCTION 2
2.
LITERATURE REVIEW
2
3.
BARGAINING COUNCILS AND WAGE FORMATION IN SOUTH AFRICA
3
4.
DATASETS AND DESIGN
4
5.
DESCRIPTIVE STATISTICS: COVERAGE AND MEAN CHARACTERISTICS OF
UNION AND NON-UNION WORKERS
4
6.
THE ECONOMETRIC APPROACH
6
7.
CONCLUSION
12
REFERENCES
14
DPRU WORKING PAPER 12/151
2
1. INTRODUCTION Probably the most perplexing feature of the South African labour market remains its extraordinarily high unemployment rates. In explaining unemployment in post-apartheid South Africa, a number of both supply and demand-side factors have been posited, including low labour-absorbing growth, skills-biased growth, the rise in labour force participation, and institutionalised labour market rigidity (Bhorat, 2008). It is the last-mentioned factor which provides the entry point for this study. Indeed, the role played by labour market institutions such as trade unions in affording high premia to covered employees has been dealt with extensively in the literature, as discussed below. In contrast, the role played by institutionalized collective bargaining structures such as bargaining councils on economic outcomes such as wages and employment have been afforded less attention, due in large part, to the lack of easily accessible data on coverage under bargaining councils. This paper aims to make two contributions to the labour economics literature in South Africa. Firstly, the paper revisits the magnitude of the union wage premium for Africans in the formal sector, taking into account firm-level characteristics such as size of firm, as well as job characteristics and non-wage benefits. Secondly, the paper sheds light on an under-researched component of the labour market, that is, the bargaining council wage premium. To our knowledge, the only other paper to have attempted to estimate a bargaining council premium in South Africa was Butcher and Rouse (2001), using 1995 October Household Survey (OHS) data. Since we use Labour Force Survey (LFS) data from 2005 in our study, our contribution is a revised estimate of the bargaining council premium found in Butcher and Rouse (2001), using more recent and, arguably, better household survey data. The paper is set out as follows. We briefly review the literature concerning union and bargaining council wage premia in section 2 of the paper. Section 3 of the study considers the history and role of formalised collective bargaining and wage formation in South Africa. The survey data used in our analysis of bargaining councils on wage formation in post-apartheid South Africa is detailed in section 4. Section 5 provides a brief descriptive analysis of estimated bargaining council coverage for African formal sector workers, as well as mean characteristics of union and non-union workers. The models and results from the multivariate analysis on the union and bargaining council premia are outlined in section 6. We also correct for endogeneity of union status through a two-stage selection model. Section 7 concludes.
2. LITERATURE REVIEW The union wage premium literature in South Africa has generally found that unions compress the distribution of wages, and that racial inequality is lower in the union sector than in the non-union sector (Casale and Posel, 2011). Moll (1993) undertook one of the first studies analysing the union wage premium for Blacks and Whites in the South African economy. He found a union wage premium of 24 percent for Black (African, Asian and Coloured) blue-collar workers when correcting for union selection and estimating separate union and non-union earnings estimations. Using the 1993 PSLSD data, Schultz and Mwabu (1998) estimated both OLS and quantile regressions but did not correct for selection effects. They found a very high wage premium of 145 percent for African male workers at the 10th percentile, and a much lower premium of 19 percent at the 90th percentile. Hofmeyr and Lucas (2001) undertook a study of the evolution of the union wage premium between 1985 and 1993, a period during which union membership increased rapidly. The various multivariate estimations used in the paper give a wide set of results and no clear pattern; the only clear result obtained was that the union wage premium was larger in 1993 than 1985 for non-casual non-self employed workers. Butcher and Rouse (2001) used the 1995 OHS in their paper which estimated both a union and bargaining council premium. Using household fixed effects to correct for union endogeneity in the wage equation, they estimated a union wage premium of over 20 percent for African workers. In turn, Rospabe (2001), using a switching model, found that African union members earned a 20 percent premium, while Azam and Rospabe‟s (2007) treatment effects and endogenous switching models indicated very high premia of 100.46 percent and 83.82 percent respectively. Finally, Banerjee et al. (2008) found (using their preferred specification) that the union wage premium increased between 1995 and 2004. The premium stood at 23 percent for African males in 2004. The South African union wage gap literature thus shows a variety of results for African workers, with estimates differing significantly due to different data and specifications utilized. Furthermore, while some studies have attempted to correct for endogeneity of union status, others have not. In addition, where attempts
Institutional Wage Effects: Revisiting Union and Bargaining Council Wage Premia in South Africa
3
have been made at correction, different correction methods have been utilized, including two-stage estimations and household fixed effects. In terms of the bargaining council wage premium literature, to our knowledge, the only paper to consider the bargaining council wage premium in South Africa is Butcher and Rouse (2001). Using 1995 OHS data they found that African workers who were covered by an industrial council agreement but did not belong to a union, earned about ten percent more than workers outside of the bargaining council system. When these workers belonged to a union too, the wage premium increased to more than 30 percent (Butcher and Rouse, 2001). International studies on the impact of labour market institutions on economic outcomes have taken on increased importance since the 1980s (Freeman, 2008). Much of the international literature has however been drawn from advanced economies. In contrast, the literature on collective bargaining in many developing countries is scant, firstly, because it is difficult to estimate the number of workers covered under bargaining council agreements due to the lack of registration processes and monitoring of agreements (ILO, 2009), and secondly, because bargaining councils are less often present in developing country economies. Our study, using a single year of data (2005), is one of the few studies that attempts to shed light on the bargaining council wage premium for a developing country.
3. BARGAINING COUNCILS AND WAGE FORMATION IN SOUTH AFRICA Bargaining councils are the key institutions involved in the statutory system of collective bargaining and wage determination in the South African labour market. Bargaining councils can be established by one or more registered trade unions and one or more registered employer organisations for a specific sector and area. Worker interests are therefore represented at bargaining councils by the relevant trade unions. Participation by unions and employer organisations in the system is voluntary, and the issues to be negotiated are left to the discretion of the parties. Wage formation within the bargaining council system is thus a voluntary exercise ongoing annually between employer organizations and employees (represented by trade unions). In many cases, these councils have a long history of regularised bargaining and engagement around worker issues. An important feature of the bargaining council system in post-apartheid South Africa was the introduction of Public Service Co-ordinating Bargaining Council (PSCBC) in 1997. The PSCBC was provided for through the promulgation of the Labour Relations Act (LRA) in 1995, and effectively governs all public sector employees, except senior managers. Another important feature of the collective bargaining system in South Africa is the presence of plant-level bargaining. Historically, employers were reluctant to give recognition to unions at plants, but over time they began to sign recognition agreements. As a result plant-level bargaining became an entrenched part of the bargaining system in South Africa. Plant-level bargaining focuses on substantive issues such as wages and other working conditions, with a particular focus on narrowing the wage gap between skilled and unskilled workers (Vettori, 2005). We note though that certain bargaining council agreements explicitly disallow additional plant-level bargaining. For instance, Fallon and Lucas (1998) report that bargaining council agreements covering the furniture industry explicitly discouraged additional bargaining. One of the most contested features of the bargaining council system is the extension of council agreements, including minimum wages, to non-parties.
1 It has been argued that these extensions
place unnecessary wage burdens on small and new businesses that are not party to negotiated agreements (see for example Butcher and Rouse, 2001; Michaud and Vencatachellum, 2001). It is however unclear to what extent non-union workers in small enterprises are able to legally enforce these minimum wage floors (Schultz and Mwabu, 1998; Butcher and Rouse, 2001).
1 Section 32 of the LRA (RSA, 1995: 26, 27) regulates the extension of collective agreements concluded in a bargaining
council. A bargaining council can request the Minister in writing to extend a collective agreement to non-parties which fall within its jurisdiction. However, a number of provisions have to be adhered to before the Minister of Labour may approve the extension of an agreement, and companies can obtain exemptions from some or all of the clauses of an agreement, including extensions.
DPRU WORKING PAPER 12/151
4
4. DATASETS AND DESIGN Our study presents an analysis of union and bargaining council wage premia for Africans in the formal sector of the South African economy through the use of the September 2005 LFS. This survey is a nationally representative household survey providing a range of labour market data from households in South Africa; 28 thousand households were interviewed in the September round of the 2005 survey, representing 12.7 million households and 47 million individuals. The data was weighted using weights constructed from the 2001 Census. The 2005 LFS does not contain data on the coverage of workers by bargaining council agreements. Thus, prior to estimating the bargaining council wage premium, we were tasked with identifying workers covered by agreements in the survey. In estimating coverage, we used council agreements from the AWARD database
2, government gazettes as well as websites of bargaining councils.
Specifically, we used sector, occupation and geographical information from agreements in order to identify workers covered by councils in the survey. In turn, union membership is based on a question in the survey which asks respondents to self-report on their union membership status. It is essential at this point to note that workers belonging to unions are union members while workers within bargaining councils are covered by those councils. The latter do not belong to bargaining councils but are simply covered by bargaining council agreements in the industry within which they work. They are covered either through their membership of unions who are party to bargaining council agreements, or via extensions of agreements to non-union members. This is an essential point to grasp in the context of estimating union and bargaining council wage premia, as in our multivariate analysis below, and we return to it later. Given that coverage is not reported in the survey but estimated as detailed above, there is likely to be some measurement error in identifying workers within the bargaining council system in the dataset. More specifically, it is likely that some workers are coded as being covered by a bargaining council agreement in the data, but were in fact not covered by an agreement, with the result that the bargaining council wage premium estimates are likely to be biased downwards. Furthermore, in instances where workers were not covered by bargaining council agreements but are coded as falling within the bargaining council system, this bias is likely to be exacerbated. As far as identifying workers in the survey covered by extensions in agreements, we note that South African law only allows an agreement to be published in a government gazette if the Minister of Labour has given permission for the extension of the agreement to non-parties. Since coverage in 2005 was based on gazetted agreements, we are fairly confident that we captured most workers covered by extensions. However, we were unable to identify individual workers exempted from extension clauses in the data. Ultimately though, through the above, we were able to derive a uniquely coded representation of bargaining councils and their coverage for all workers employed in 2005.
5. DESCRIPTIVE STATISTICS: COVERAGE AND MEAN CHARACTERISTICS OF
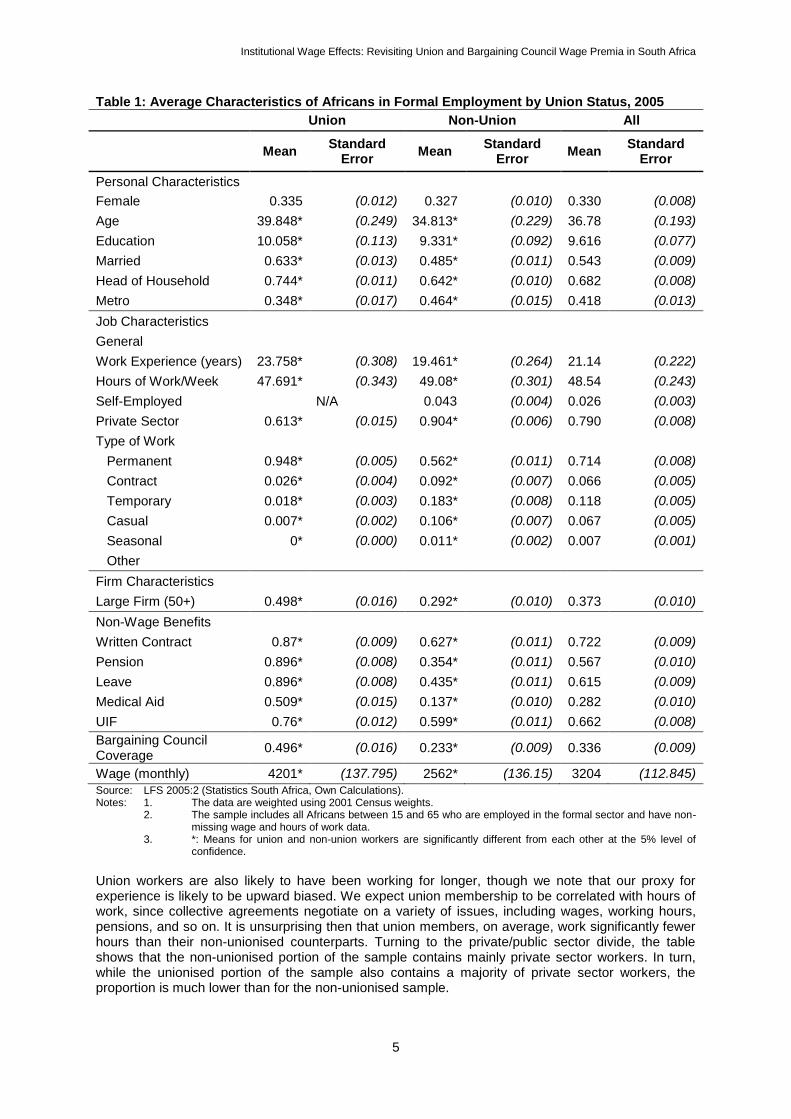
UNION AND NON-UNION WORKERS The South African economy consisted of 12.3 million employed in 2005, of whom around 8.6 million or seventy percent were found in the formal economy. We focus on the formal economy since the informal economy stands outside the industrial relations system in South Africa. Considering our sub-sample of formal sector African workers (4.7 million) then, Table 1 below compares the mean characteristics of union and non-union workers in our sample. It is clear that the mean productive characteristics of unionised and non-unionised workers differ significantly over all the variables in the table below, except gender. Unionised workers are significantly older and have invested more in their education relative to non-union workers. They are also more likely to be married, and the head of their households. Interestingly though, they are not more likely to live in metro areas compared to non-union workers.
2 The Actual Wage Rates Database (AWARD) (LRS, 2006) is managed by the Labour Research Service (LRS), and contains
information on wages and conditions of employment in the formal economy, as well as some of the wage agreements concluded in bargaining councils.
Institutional Wage Effects: Revisiting Union and Bargaining Council Wage Premia in South Africa
5
Table 1: Average Characteristics of Africans in Formal Employment by Union Status, 2005
Union Non-Union All
Mean
Standard Error
Mean Standard
Error Mean
Standard Error
Personal Characteristics
Female 0.335 (0.012) 0.327 (0.010) 0.330 (0.008)
Age 39.848* (0.249) 34.813* (0.229) 36.78 (0.193)
Education 10.058* (0.113) 9.331* (0.092) 9.616 (0.077)
Married 0.633* (0.013) 0.485* (0.011) 0.543 (0.009)
Head of Household 0.744* (0.011) 0.642* (0.010) 0.682 (0.008)
Metro 0.348* (0.017) 0.464* (0.015) 0.418 (0.013)
Job Characteristics
General
Work Experience (years) 23.758* (0.308) 19.461* (0.264) 21.14 (0.222)
Hours of Work/Week 47.691* (0.343) 49.08* (0.301) 48.54 (0.243)
Self-Employed N/A 0.043 (0.004) 0.026 (0.003)
Private Sector 0.613* (0.015) 0.904* (0.006) 0.790 (0.008)
Type of Work
Permanent 0.948* (0.005) 0.562* (0.011) 0.714 (0.008)
Contract 0.026* (0.004) 0.092* (0.007) 0.066 (0.005)
Temporary 0.018* (0.003) 0.183* (0.008) 0.118 (0.005)
Casual 0.007* (0.002) 0.106* (0.007) 0.067 (0.005)
Seasonal 0* (0.000) 0.011* (0.002) 0.007 (0.001)
Other
Firm Characteristics
Large Firm (50+) 0.498* (0.016) 0.292* (0.010) 0.373 (0.010)
Non-Wage Benefits
Written Contract 0.87* (0.009) 0.627* (0.011) 0.722 (0.009)
Pension 0.896* (0.008) 0.354* (0.011) 0.567 (0.010)
Leave 0.896* (0.008) 0.435* (0.011) 0.615 (0.009)
Medical Aid 0.509* (0.015) 0.137* (0.010) 0.282 (0.010)
UIF 0.76* (0.012) 0.599* (0.011) 0.662 (0.008)
Bargaining Council Coverage
0.496* (0.016) 0.233* (0.009) 0.336 (0.009)
Wage (monthly) 4201* (137.795) 2562* (136.15) 3204 (112.845)
Source: LFS 2005:2 (Statistics South Africa, Own Calculations). Notes: 1. The data are weighted using 2001 Census weights.
2. The sample includes all Africans between 15 and 65 who are employed in the formal sector and have non-missing wage and hours of work data.
3. *: Means for union and non-union workers are significantly different from each other at the 5% level of confidence.
Union workers are also likely to have been working for longer, though we note that our proxy for experience is likely to be upward biased. We expect union membership to be correlated with hours of work, since collective agreements negotiate on a variety of issues, including wages, working hours, pensions, and so on. It is unsurprising then that union members, on average, work significantly fewer hours than their non-unionised counterparts. Turning to the private/public sector divide, the table shows that the non-unionised portion of the sample contains mainly private sector workers. In turn, while the unionised portion of the sample also contains a majority of private sector workers, the proportion is much lower than for the non-unionised sample.
DPRU WORKING PAPER 12/151
6
The table further shows that almost all unionised workers (95 percent) reported being in permanent employment (as opposed to contract, temporary period, casual or seasonal work), while a far smaller proportion of non-unionised workers (57 percent) reported being permanently employed. To the extent that the type of job is an indicator of job stability, the data shows that union membership is associated positively with job stability. Almost 50 percent of union workers were located in firms with greater than 50 employees, while only around 30 percent of non-union workers work in firms containing more than 50 workers. The data indicates that more than 85 percent of workers belonging to a union have a written contract and access to pension and paid leave. In contrast, a much lower proportions of workers in the non-unionised sector have a written contract (63 percent), or access to pension (35 percent) and paid leave (44 percent). In relation to unemployment insurance contributions, a much larger proportion of workers in the unionised sector have employers who are contributors to the Unemployment Insurance Fund (UIF), while the share of contributors in the non-unionised sector is much lower. Finally, looking at medical aid coverage, though access in both the unionised and non-unionised sectors is lower than with other non-wage benefits, a larger proportion of workers in the unionised sector report having access to medical aid than in the non-unionised sector. In terms of bargaining council coverage, the table shows a higher prevalence of bargaining council coverage within the unionised portion of the sample than the non-unionised portion. More disaggregated data (not shown here) shows that 58 percent of those within the bargaining council system belong to a union while 42 percent do not; and furthermore that union membership is higher within the public bargaining council system than the private bargaining council system. Finally, as far as mean wages are concerned, the table shows that the mean monthly wages of all non-union workers stands at around 60 percent of union workers. Union workers thus have a higher mean wage than their non-unionised counterparts. In the analysis that follows in section 6 below we estimate the union and bargaining council wage premia in a multivariate context.
6. THE ECONOMETRIC APPROACH 6.1. Estimating the Union Wage Premium In this section, we investigate union and bargaining council wage premia more comprehensively by controlling for productivity-related characteristics of workers. Earnings are estimated using a Mincerian model. In order to understand the impact of type of job (permanent, contract, temporary, casual, seasonal), firm size, and non-wage benefits on the union wage premium, we firstly estimate a series of earnings equations as follows: Specification (1) contains an exogenous union membership dummy variable, and includes only standard controls. In specification (2) we add the type of work into the estimation, and in specification (3) we add the size of the firm. In specification (4) we add non-wage benefits associated with the job into the model, including whether the person has a written contract and access to paid leave, whether the employer makes pension and medical aid contributions on behalf of the employee, and whether the employer deducts unemployment insurance contributions for the employee. These various permutations in specification 1 to 4 are estimated using the following equation:
(1)
In equation (1) represents the natural logarithm of earnings for individual in our sample,
represents a vector of individual and job characteristics, indicates whether individual is a union
member or not and is a normally distributed error term. The coefficient on the union membership
dummy ( ) represents the union wage gap. Specification (5) is the same as specification (4), except
that we correct for endogeneity of union status. Endogeneity of union status is also corrected for in specification (6) and (7). In specification (6), we add a bargaining council dummy and bargaining council-union interaction term in order to examine the union and bargaining council wage premium, as follows:
( (2)
Institutional Wage Effects: Revisiting Union and Bargaining Council Wage Premia in South Africa
7
In equation (2) above, shows whether the individual in the sample was covered by a bargaining
council agreement, and is an interaction between bargaining council coverage and union
membership. shows the wage premium for individuals who are not union members but are covered by bargaining council agreements. If the bargaining council coefficient has a positive and statistically significant coefficient, this suggests that bargaining council agreements were extended to non-union
workers in the bargaining council sector. In turn, the coefficient shows the union wage premium for workers not covered by bargaining council agreements. Taking the coefficient of the union dummy
and the interaction term together ( + ) shows the union wage premium within bargaining councils,
while ( ) shows the „total‟ union premium for union members covered by a bargaining council agreement (Butcher and Rouse, 2001). In our final estimation, specification (7), we split the bargaining council dummy into two dummies: one
for those covered under agreements in the private sector (( ) and the other for those covered
under the PSCBC (( ). We also add two interaction terms, a private bargaining council-union
interaction and a public bargaining council-union interaction term, as shown below:
(
) ( ) (3)
Correcting for Endogeneity of Union Status The union wage premium literature commonly attempts to correct for the endogeneity of union status with regard to wages, since selection into unions may not be determined separately from the wages earned by unionised workers. In particular, the literature identifies that there may be a double selection problem, as follows. The benefits of becoming a union member may be most appealing to workers with low earnings potential since they have the most to gain from unionisation. However, not all workers who are seeking union employment will find this type of employment, with the result that employers can choose workers, and will probably choose workers with the best human capital characteristics, and thus those with the best earnings potential (Bryson, 2007). These two selection processes have offsetting effects on the estimated wage gap, but it is not possible to know the overall effect of the two selection processes on wages a priori since the magnitude of the two biases are unknown (Farber, 2001). The literature has attempted to account for unobservable worker characteristics that impact on both unionisation and wages through the use of, for instance, selection models, household fixed effects, instrumental variable estimations and panel data. Considering selection models first, union wage studies in South Africa have commonly corrected for selection into unions using two-stage selection models that predict union membership prior to estimating union wages. Instruments such as whether the individual lives in a household with other union members, a dependence ratio (number of young to wage-earners in the household), and a dummy capturing the presence of unemployed people in the household have been used (Casale and Posel, 2011). Casale and Posel (2011) in a review of the different methods used to correct for endogeneity of union status find that the only variable that is consistently and strongly positive in the selection studies is whether the individual lives in a household with other union members. They however note that there are concerns when using this variable since estimates from the selection models using this instrument are sensitive to its inclusion. In turn, other studies such as Butcher and Rouse (2001) used household fixed effects to correct for endogeneity of union status. Here, unobservable characteristics that are correlated with both union membership and wages can be corrected through a household fixed effects model if they are shared by the members of the household and they are time-invariant. This model may however bias results since, for instance, labour supply decisions may be jointly determined within a household (see Jorgensen, 2009 for discussion). We have opted to correct for endogeneity of union status through the use of a two-stage selection model rather than a household fixed effects model for the following reasons. The household fixed effects model can only be estimated on African households that contain at least two members who are employed as well as a mix of both union and non-union members; our sample size would thus be severely restricted if we were to use this model. Furthermore, the fixed effects model has the
DPRU WORKING PAPER 12/151
8
drawback of potentially biasing the union wage premium since household labour supply decisions may be jointly determined.
3
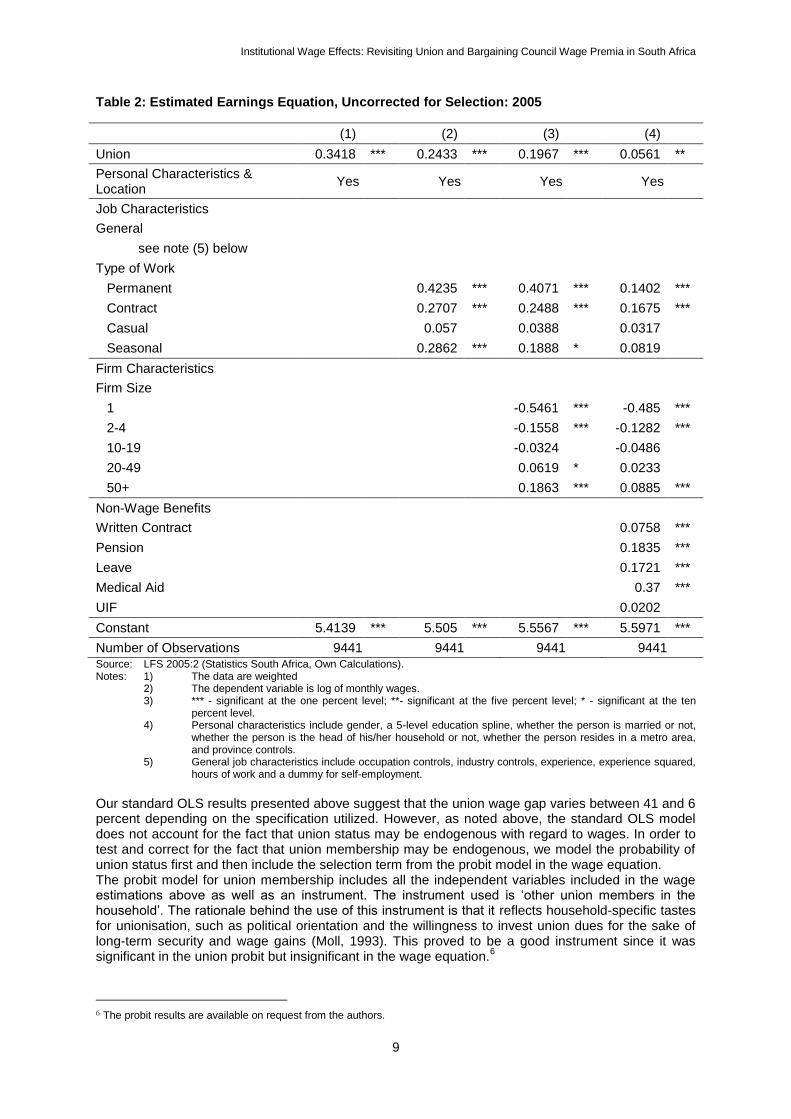
6.2 Results and Discussion The sample for the earnings estimations comprises all African working-age formally employed individuals who provided earnings information in the survey. Earnings in the estimation are the log of total monthly wages. We include a union membership dummy in all of the specifications below. With standard controls, specifications (2) to (4) in Table 2 show the impact on the union wage premium when we begin to control for other characteristics such as firm size, job type, and non-wage benefits. Table 2 below then shows first a set of estimates without correction for selection bias. Looking at specification (1) first, Table 2 below shows a fairly high premium of 41 percent
4 with just standard controls in the estimation.
However, when we include type of work in estimation (2), which controls for whether the job is „permanent‟, „temporary‟, a „contract‟, „casual‟, „seasonal‟ or „other‟, the union wage premium drops 13 percentage points to 28 percent. In specification (3), we use the standard controls from specification (1) and include controls for the type of work, as well as the firm size. The results show that larger firms, particularly those employing fifty or more people, pay higher wages, and furthermore that the union wage premium drops further. In estimation (4) we add non-wage benefits of employment, which together are arguably an indication of, among other things, level of formalization of the workplace as well quality of the workplace. The results show that non-wage benefits are an important predictor of wages. Holding all else constant, with the inclusion of these five non-wage benefits, the union wage premium declines to just 6 percent.
5 It is important to note though that even if we exclude non-wage benefits (due to endogeneity
concerns), the union wage gap declines to a value much lower than some of the estimates found in previous studies.
3 The endogeneity of union status can also be dealt with through instrumental variable regressions. In a recent (unpublished)
paper, Jorgensen (2009) argues that the motivation to join a union may be a social motivation rather than an economic one in South Africa, and that household members influence each other to join unions. However, members of the same household may have similar jobs with similar wages and sector union density, in which case, the characteristics of the work will be picked up in the estimation rather than social motivation to join a union. To deal with this, when creating his instrument he subtracted the average union density where the household members work from the household union density – a person with high social motivation to join a union would therefore be someone whose household members are more unionised than the average where they work. This approach requires there to be at least two persons working in the household for the household to be included in the sample, thus restricting the sample size. Furthermore, the approach entails creating mini labour markets using occupation, industry, province, and urban/rural area. The 2005 LFS does not however contain an urban/rural variable.
4 To calculate the percentage change in earnings from the coefficient on a dummy variable in a semi logarithmic model, we
used the following conversion: 100.{exp(B) – 1} where B is the value of the coefficient (see Halvorsen & Palmquist, 1980: 474-475).
5 Given however, that some of these benefits, particularly medical aid contributions and pension contributions, may be linked
with union negotiations, we ran correlations between union status and the non-wage benefit variables for our sample. The results show that correlations are not high. Results are available on request from the authors.
Institutional Wage Effects: Revisiting Union and Bargaining Council Wage Premia in South Africa
9
Table 2: Estimated Earnings Equation, Uncorrected for Selection: 2005
(1) (2) (3) (4)
Union 0.3418 *** 0.2433 *** 0.1967 *** 0.0561 **
Personal Characteristics & Location
Yes Yes Yes Yes
Job Characteristics
General
see note (5) below
Type of Work
Permanent 0.4235 *** 0.4071 *** 0.1402 ***
Contract 0.2707 *** 0.2488 *** 0.1675 ***
Casual 0.057
0.0388
0.0317
Seasonal 0.2862 *** 0.1888 * 0.0819
Firm Characteristics
Firm Size
1 -0.5461 *** -0.485 ***
2-4 -0.1558 *** -0.1282 ***
10-19 -0.0324
-0.0486
20-49 0.0619 * 0.0233
50+ 0.1863 *** 0.0885 ***
Non-Wage Benefits
Written Contract 0.0758 ***
Pension 0.1835 ***
Leave 0.1721 ***
Medical Aid 0.37 ***
UIF 0.0202
Constant 5.4139 *** 5.505 *** 5.5567 *** 5.5971 ***
Number of Observations 9441 9441 9441 9441 Source: LFS 2005:2 (Statistics South Africa, Own Calculations). Notes: 1) The data are weighted 2) The dependent variable is log of monthly wages.
3) *** - significant at the one percent level; **- significant at the five percent level; * - significant at the ten percent level.
4) Personal characteristics include gender, a 5-level education spline, whether the person is married or not, whether the person is the head of his/her household or not, whether the person resides in a metro area, and province controls.
5) General job characteristics include occupation controls, industry controls, experience, experience squared, hours of work and a dummy for self-employment.
Our standard OLS results presented above suggest that the union wage gap varies between 41 and 6 percent depending on the specification utilized. However, as noted above, the standard OLS model does not account for the fact that union status may be endogenous with regard to wages. In order to test and correct for the fact that union membership may be endogenous, we model the probability of union status first and then include the selection term from the probit model in the wage equation. The probit model for union membership includes all the independent variables included in the wage estimations above as well as an instrument. The instrument used is „other union members in the household‟. The rationale behind the use of this instrument is that it reflects household-specific tastes for unionisation, such as political orientation and the willingness to invest union dues for the sake of long-term security and wage gains (Moll, 1993). This proved to be a good instrument since it was significant in the union probit but insignificant in the wage equation.
6
6 The probit results are available on request from the authors.
DPRU WORKING PAPER 12/151
10
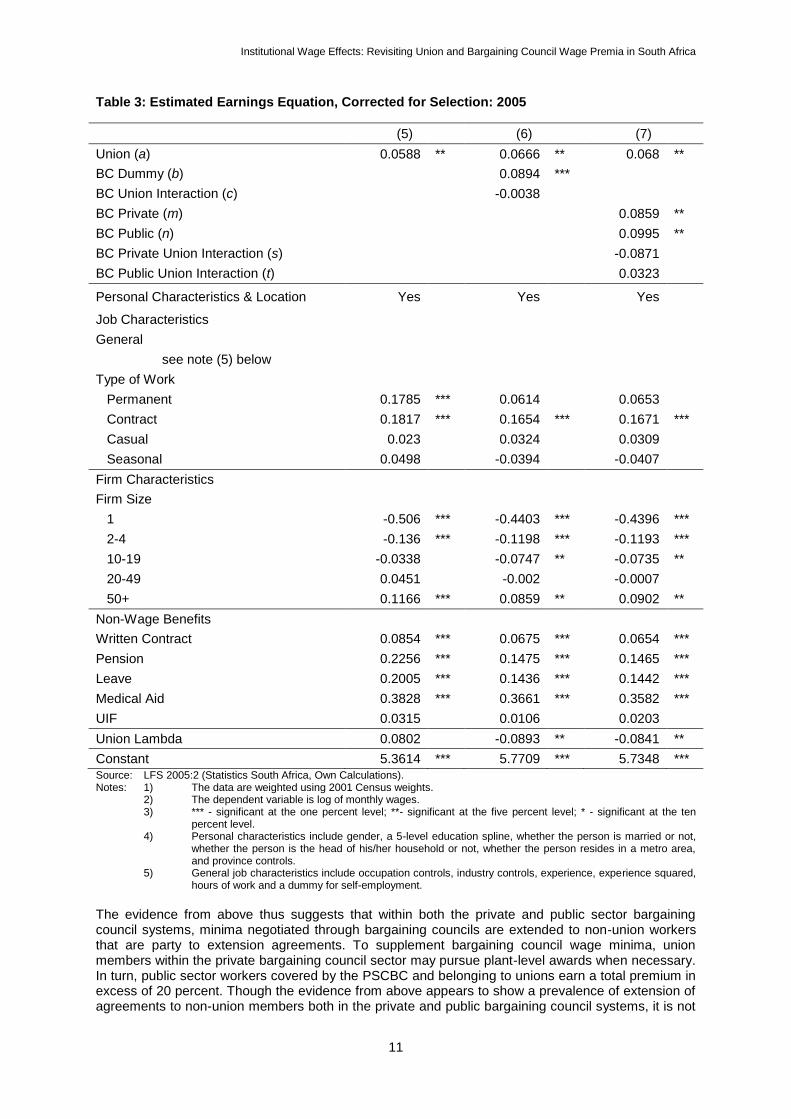
Our selectivity-corrected estimates are presented in Table 3 below. The union lambda is significant and negative in the latter two of the three estimations, implying that selection into unionisation was present among the African employed in the formal sector, and furthermore, that not taking this sample selection effect into account would bias the union wage estimates. Specification (5) below is essentially specification (4) above, but with correction for union membership. The union coefficient in the uncorrected specification (4) and the corrected specification (5) are very similar. Using equation (ii) from section 6.1 above, in specification (6), we include a bargaining council coverage dummy and a bargaining council-union interaction. In turn, using equation (iii) from section 6.1 above, in specification (7) we include a private bargaining council coverage dummy, a public bargaining council dummy, and two interaction terms – a private bargaining council-union interaction and a PSCBC-union interaction. For specification (6) and (7) in the table below, as with Butcher and Rouse (2001), we do not include industry dummies in the estimations since industry is correlated with bargaining council coverage. We note though that not including these industry dummies in our estimation may result in an upward bias in our estimates. Considering specification (6) first, the estimation shows that union members outside of the bargaining council system earned a premium of 6.9 percent (a). In turn, the results indicate that workers covered by bargaining councils (but not belonging to unions) earned a 9.4 percent (b) premium over non-union workers not covered by bargaining council agreements. The union premium within the bargaining council sector is 6.5 percent (a+c) implying that there is a premium to union workers within the bargaining council sector. Furthermore, given that both a+c and b are positive and significant, it follows that the premium for union members within the bargaining council sector derives from supplemental awards won at the plant-level. The total union premium for union members covered by bargaining council agreements then stands at around 16.4 percent (a+b+c). Turning next to estimation (7) which separates those covered under agreements in the private sector from those covered by the PSCBC, the estimation once more shows a union premium outside the bargaining council system of 7.04 percent (a). In turn, the bargaining council premium for non-union members in both the private and public sector is positive and statistically significant, though the premium in the private sector is slightly lower, standing at 8.97 percent (m), compared to the premium in the public sector of 10.5 percent (n). It is clear then that bargaining council coverage (outside of union membership) in both the private and public sectors is associated with a premium, though the premium is higher in the public sector. This suggests that bargained wages within both the private and public bargaining council systems are extended to non-unionised workers. In turn, the union premium within the private bargaining council sector (a+s) is not significant. However, since the sum of the coefficients on the private bargaining council dummy and the private bargaining council-union interaction term (s+m) is not significantly different from zero, we can infer that irrespective of bargaining council coverage, unions attempted to win certain wage increases for their members in the private sector. Thus, we deduce from this result that those unions that negotiated at the bargaining council level supplemented the minima negotiated with plant-level awards – not observed directly but deduced – when necessary. Finally, considering the wage premium to union members within the PSCBC system, the results show a significant union premium within the PSCBC of 11 percent (a+t). Furthermore, since both a+t and n are positive and significant, it follows that union members won supplemental awards, relative to non-union members, for their members at the plant level. The total premium to these union members stands at 22 percent (a+n+t).
Institutional Wage Effects: Revisiting Union and Bargaining Council Wage Premia in South Africa
11
Table 3: Estimated Earnings Equation, Corrected for Selection: 2005
(5) (6) (7)
Union (a) 0.0588 ** 0.0666 ** 0.068 **
BC Dummy (b)
0.0894 ***
BC Union Interaction (c)
-0.0038
BC Private (m)
0.0859 **
BC Public (n)
0.0995 **
BC Private Union Interaction (s)
-0.0871
BC Public Union Interaction (t)
0.0323
Personal Characteristics & Location Yes Yes Yes
Job Characteristics
General
see note (5) below
Type of Work
Permanent 0.1785 *** 0.0614
0.0653
Contract 0.1817 *** 0.1654 *** 0.1671 ***
Casual 0.023
0.0324
0.0309
Seasonal 0.0498
-0.0394
-0.0407
Firm Characteristics
Firm Size
1 -0.506 *** -0.4403 *** -0.4396 ***
2-4 -0.136 *** -0.1198 *** -0.1193 ***
10-19 -0.0338
-0.0747 ** -0.0735 **
20-49 0.0451
-0.002
-0.0007
50+ 0.1166 *** 0.0859 ** 0.0902 **
Non-Wage Benefits Written Contract 0.0854 *** 0.0675 *** 0.0654 ***
Pension 0.2256 *** 0.1475 *** 0.1465 ***
Leave 0.2005 *** 0.1436 *** 0.1442 ***
Medical Aid 0.3828 *** 0.3661 *** 0.3582 ***
UIF 0.0315
0.0106
0.0203
Union Lambda 0.0802 -0.0893 ** -0.0841 **
Constant 5.3614 *** 5.7709 *** 5.7348 *** Source: LFS 2005:2 (Statistics South Africa, Own Calculations). Notes: 1) The data are weighted using 2001 Census weights. 2) The dependent variable is log of monthly wages.
3) *** - significant at the one percent level; **- significant at the five percent level; * - significant at the ten percent level.
4) Personal characteristics include gender, a 5-level education spline, whether the person is married or not, whether the person is the head of his/her household or not, whether the person resides in a metro area, and province controls.
5) General job characteristics include occupation controls, industry controls, experience, experience squared, hours of work and a dummy for self-employment.
The evidence from above thus suggests that within both the private and public sector bargaining council systems, minima negotiated through bargaining councils are extended to non-union workers that are party to extension agreements. To supplement bargaining council wage minima, union members within the private bargaining council sector may pursue plant-level awards when necessary. In turn, public sector workers covered by the PSCBC and belonging to unions earn a total premium in excess of 20 percent. Though the evidence from above appears to show a prevalence of extension of agreements to non-union members both in the private and public bargaining council systems, it is not
DPRU WORKING PAPER 12/151
12
clear that the impact to small businesses - the segment of the economy that is thought to be most severely affected by extension agreements – is as severe as may be implied by the results above.
7
On a final note, one may also be concerned that there may be symmetrical selection effects that affect both coverage under bargaining council agreements and wages of those covered. For instance, it may be possible that since bargaining council coverage provides minimum wage benefits, labour market participants may queue to work in industries or sectors that are covered by agreements, with the result that the uncorrected estimates of the bargaining council dummies may be biased. It may thus be argued that selection into bargaining council „membership‟ may need to be corrected for. We note though that bargaining councils themselves are not institutions to which labour market participants gain „membership‟. Instead, labour market participants may choose to join a union and this union is then part (or not part) of a bargaining council agreement; workers are thus covered under bargaining council agreements. However, two types of workers are covered under agreements – those that belong to unions and those that do not, and the latter are covered under extension agreements. The former are dealt with in this paper through the union selection model. As far as the latter are concerned, we note that in order to correct for those covered under extension agreements, one would need to correct for selection into particular industries. The 2005 LFS is however a cross-sectional household survey dataset, and a suitable instrument which could be used to identify selection into industries, but does not significantly determine wages, is almost impossible to locate.
8
7. CONCLUSION
Union wage studies in South Africa have been undertaken using a variety of different data sets. In addition, researchers have used a range of methodologies to estimate the union wage premium, including use of a single OLS wage equation with a union dummy, separate union and non-union wage equations and quantile regressions. Furthermore, while only some studies correct for selection, those correcting for selection do so using a variety of methods including two-stage selection models, household fixed-effects, and instrumental variables. There is however, little consensus on the magnitude of the union wage premium or the best method to correct for endogeneity of union status, though most of the studies report a premium higher than 20 percent. Our study on collective bargaining wage premia firstly takes cognisance of the fact that wages of workers are dependent on a variety of factors including individual characteristics, job characteristics, firm characteristics, and the type of employment. With the inclusion of firm size, type of work and non-wage benefits, we find a significant drop in the union wage premium from around 40 percent to just 6 percent. It appears then that union wage premia from previous studies may be overestimated due to the exclusion of key controls that capture the nature of workplaces within which employees work and the type of jobs they find themselves in. This finding highlights both the importance of including firm and work characteristics in the wage equation, as well as the fact that the union wage premium, though significant, is possibly lower than implied in previous studies. The second contribution of this study is to estimate bargaining council wage premia within the private and public sectors. The dearth of literature on wage premia associated with bargaining council coverage in South Africa is attributed to difficulty with identifying covered workers in the household surveys. Since coverage in our study is inferred using location, occupation and industry data from agreements, we highlight that our estimates of bargaining council wage premia are possibly biased downwards due to measurement error. The model which corrects for the endogeneity of union status, with regard to wages shows wage premia of 9 and 10 percent respectively for non-union workers within the private and public bargaining council systems. Importantly then, there is evidence in the data of extensions of agreements to non-parties. This finding however, has to be tempered with findings in another qualitative study which
7 Godfrey et al. (2006) analysed the impact of extensions of agreements and exemptions from agreements on small firms in
2006 and found a minimal impact on SMEs. 8 We tried to control for coverage under an institution (either a bargaining council or union) by including the instrument „no of
other institution members in the household‟ (union members or those covered under bargaining council agreements) in our estimation, but found that this was not a useable instrument. Thus, we were unable to control for selection into „bargaining council coverage‟ in our study.

Institutional Wage Effects: Revisiting Union and Bargaining Council Wage Premia in South Africa
13
points to widespread exemptions for small businesses. The data however, also shows that unions negotiate at the plant-level for additional gains for their members. In particular, the total estimated premium to union workers within the public bargaining council system stands at 22 percent. In turn, there is some evidence showing that unions negotiate for supplemental awards for their members in the private sector (irrespective of bargaining council coverage), when necessary. The wage benefits of union membership, particularly within the public bargaining council system, are thus clear, though we note that premia are limited to under 25 percent, even for those with both union membership and bargaining council coverage. Overall, both the union and bargaining council estimates highlight the fact that institutional wage premia may be smaller than previously estimated.
DPRU WORKING PAPER 12/151
14
REFERENCES Azam, J. and Rospabe, S. (2007). “Trade Unions vs. Statistical Discrimination: Theory and Application to Post-apartheid South Africa”, Journal of Development Economics, 84(1), pp. 417–444 Banerjee, A., Galiani, S., Levinsohn, J., McLaren, Z. and Woolard, I. (2008). “Why has unemployment risen in the New South Africa”, Economics of Transition, 16(4), pp. 715-740 Bhorat, H. (2008). Unemployment in South Africa: Descriptors and Determinants. Unpublished Mimeo. Boccara, B. and Moll, P. (1997). Labor Market Flexibility and Industrial Councils in South Africa. Mimeo, The World Bank, Africa Region. Bryson, A. (2007). “The effect of trade unions on wages”, Reflets et perspectives de la vie economique, 46 (2/3), pp. 33-45 Butcher, K. & Rouse, C. (2001). “Wage Effects of Unions and Industrial Councils in South Africa”, Industrial and Labour Relations Review, 54(2), pp. 349-374. Casale, D. and Posel, D. (2011). “Unions and the gender wage gap in South Africa”, Journal of African Economies, 20(1), pp. 27–59 Fallon, P. and Lucas, R. (1998). South African Labor Markets. Adjustments and Inequalities. Discussion Paper 12, Southern African Department, World Bank. Farber, H. (2001). Notes on the Economics of Labour Unions. Princeton University Industrial Relations Section Working Paper No 452. Freeman, R. (2008). Labour Market Institutions Around the World. CEP Discussion Paper No 844. Godfrey, S., Maree, J. and Theron, J. (2006). Conditions of Employment and Small Business: Coverage, Compliance and Exemptions. Development Policy Research Unit Working Paper No 06/106. Cape Town: University of Cape Town. Halvorsen, R. and Palmquist, R. (1980). “The Interpretation of Dummy Variables in Semilogarithmic Equations”, The American Economic Review, 70(3), pp. 474-475 Hofmeyr, J. F. and Lucas, R. (2001). „The Rise in Union Wage Premiums in South Africa‟, Labour, 15(4), pp. 685–719 International Labour Organization. (2009). Global Wage Report 2008/09. Minimum Wages and Collective Bargaining. Towards Policy Coherence. Geneva: ILO. Jorgensen, O. (2009). Union Wage Premium in South Africa – An instrumental variable approach. Unpublished work. Labour Research Service. 2006. Actual Wage Rates Database (AWARD). Online database. http://award.lrs.org.za/home.php Michaud, P-C. and Vencatachellum, D. (2001). The Union Wage Premium for Blacks in South Africa. Paper presented at the DPRU/FES Conference. Labour Markets and Poverty in South Africa. 15-16 November 2001, Misty Hills Country Hotel, Johannesburg. Moll, P.G. (1993). ”Black South African Unions: Relative Wage Effects in International Perspective”, Industrial and Labor Relations Review, 46(2), pp. 245–261 Public Sector Coordinating Bargaining Council (PSCBS). (2005). Background. Available from http://www.pscbc.org.za/content.aspx?PageID=57
Institutional Wage Effects: Revisiting Union and Bargaining Council Wage Premia in South Africa
15
Republic of South Africa. (1995). Labour Relations Act. No 66 of 1995. Available at www.labour.gov.za Rospabe, S. (2001). Making Racial Wage Relations Fair in South Africa: A Focus on the Role of Trade Unions. Development Policy Research Unit Working Paper 01/48. Cape Town: University of Cape Town. Schultz, T. P. and Mwabu, G. (1998). “Labour unions and the distribution of wages and employment in South Africa”, The Industrial Labour Relation Review, 51(4), pp. 689-703 Statistics South Africa. 2006. Labour Force Survey September 2005. P0210. Vettori, M-S. (2005). Alternative Means to Regulate the Employment Relationship in the Changing World of Work. PhD thesis for Doctor of Law (LLD) Degree. Pretoria: University of Pretoria, Department of Mercantile Law.
Development Policy Research UnitUniversity of Cape TownPrivate BagRondebosch 7701Cape Town South Africa
Tel: +27 21 650 5705Fax: +27 21 650 5711
www.dpru.uct.ac.za