remote sensing of trichodesmium spp ... - biogeosciences
TRANSCRIPT
Remote Sensing of Trichodesmium spp. mats in the Western TropicalSouth PacificGuillaume Rousset1, Florian De Boissieu2, Christophe E. Menkes3, Jérôme Lefèvre4, Robert Frouin5,Martine Rodier6, Vincent Ridoux7,8, Sophie Laran7, Sophie Bonnet9, and Cécile Dupouy9
1IRD (Institut de Recherche pour le Développement), UMR ESPACE DEV, Nouméa, New Caledonia2IRSTEA, UMR TETIS, Montpellier, France3IRD-Sorbonne Universités (UPMC, Université Paris 06)-CNRS-MNHN, Laboratoire d’Océanographie et du Climat:Expérimentations et Approches Numériques (LOCEAN), IRD Nouméa BP A5, 98848 Nouméa Cedex, New Caledonia4LEGOS/MIO, 98800 Nouméa, New Caledonia5Scripps Institution of Oceanography, University of California San Diego, La Jolla, CA 92093-0224, USA6EIO (Ecosystèmes Insulaires Océaniens), Institut de Recherche pour le Développement-Université de la PolynésieFrançaise-Institut Malarmé-Ifremer, Papeete, French Polynesia7Observatoire Pelagis, UMS 3462, Université de la Rochelle/CNRS, La Rochelle, France8Centre d’Etude de Chizé, UMR 7273 - CNRS- Université de La Rochelle, 2 rue Olympe de Gouges, 17000 La Rochelle,France9Aix Marseille Université-CNRS-INSU, IRD, Mediterranean Institute of Oceanography (MIO), UM 110, IRD Nouméa, BPA5, 98848 Noumea Cedex, New Caledonia
Correspondence: Guillaume Rousset ([email protected])
Abstract. Trichodesmium is the major nitrogen-fixing species in the Western Tropical South Pacific (WTSP) region, a hotspot
of diazotrophy. Due to the paucity of in situ observations, remote-sensing methods for detecting Trichodesmium presence
on a large scale have been investigated to assess the regional-to-global impact of this organism on primary production and
carbon cycling. A number of algorithms have been developed to identify Trichodesmium surface blooms from space, but
determining with confidence their accuracy has been difficult, chiefly because of the scarcity of sea-truth information at time5
of satellite overpass. Here, we use a series of new cruises as well as airborne surveys over the WTSP to evaluate their ability
to detect Trichodesmium surface blooms in the satellite imagery. The evaluation, performed on MODIS data at 250 m and
1 km resolution acquired over the region shows limitations due to spatial resolution, clouds, and atmospheric correction. A
new satellite-based algorithm is designed to alleviate some of these limitations, by exploiting optimally spectral features in the
atmospherically corrected reflectance at 531, 645, 678, 748, and 869 nm. This algorithm outperforms former ones near clouds,10
limiting false positive detection and allowing regional scale automation. Compared with observations, 80% of the detected mats
are within a 2 km range, demonstrating the good statistical skill of the new algorithm. Application to MODIS imagery acquired
during the February-March 2015 OUTPACE campaign reveals the presence of surface blooms Northwest and East of New
Caledonia and near 20°S-172°W in qualitative agreement with measured nitrogen fixation rates. Improving Trichodesmium
detection requires measuring ocean color at higher spectral and spatial (< 250 m) resolution than MODIS, taking into account15
environment properties (e.g., wind, sea surface temperature), fluorescence, and spatial structure of filaments, and a better
1
understanding of Trichodesmium dynamics, including aggregation processes to generate surface mats. Such sub-mesoscale
aggregation processes for Trichodesmium are yet to be understood.
1 Introduction
The Western Tropical South Pacific (WTSP) is a Low Nutrient Low Chlorophyll (LNLC) region, harboring surface nitrate
concentrations close to detection limits of standard analytical methods, and limiting for the growth of the majority of phyto-5
plankton species (Le Borgne et al., 2011). This lack of inorganic nitrogen favors the growth of dinitrogen (N2)-fixing organisms
(or diazotrophs), which have the ability to use the inexhaustible pool of N2 dissolved in seawater and convert it into bioavail-
able ammonia. Several studies have reported high N2 fixation rates in the WTSP (Berthelot et al., 2017; Bonnet et al., 2009,
2015; Garcia et al., 2007), which has recently been identified as a hot spot of N2 fixation (Bonnet et al., 2017). During austral
summer conditions, N2 fixation supports nearly all new primary production and organic matter export (Caffin et al., 2018;10
Knapp et al., 2018) as nitrate diffusion across the thermocline and atmospheric sources of N are < 10% of new N inputs. The
cyanobacterium Trichodesmium is one of the most abundant diazotrophs in our oceans (Capone, 1997; Luo et al., 2012) and
in the WTSP in particular (Tenório et al., 2018; Stenegren et al., 2018). Cell-specific N2 fixation measurements recently con-
ducted in the WTSP have revealed Trichodesmium as the major N2-fixing organism, accounting for > 60% of total N2 fixation
(Bonnet et al., 2018). One of the characteristics of Trichodesmium is the presence of gas vesicles, which provide buoyancy (van15
Baalen and Brown, 1969; Villareal and Carpenter, 2003) and help maintain this cyanobacterium in the upper ocean surface.
Trichodesmium cells are aggregated and form long chains called trichomes. Trichomes then can gather into colonies called
“puffs” or “tuffs,” and these colonies can aggregate at the surface of the water and form large mats that can extend for miles.
They had already been observed during James Cook and Charles Darwin’s expeditions. During the southern austral summer,
Trichodesmium blooms have long been detected by satellite in the region, mostly around New Caledonia and Vanuatu (Dupouy20
et al., 2000, 2011), and later confirmed by microscopic enumerations (Shiozaki et al., 2014).
Identifying the occurrence and the spatial distribution of Trichodesmium blooms and mats is of primary importance to as-
sess their regional contribution to primary production and biogeochemical cycles. However because of their paucity, scientific
cruises alone are not sufficient to achieve such a goal, and remote sensing completed by sea observations of mats appear as
the unique alternative for assessing its global impact. By using Trichodesmium spectral characteristics, among which pig-25
ment absorption due to phycoerythrin (PE) between 490 and 570 nm, absorption/scattering increase in the red-Near-Infrared
(NIR), and particle backscattering (Subramaniam et al., 1999a, b; Hu et al., 2010), several empirical bio-optical algorithms
have been developed to detect Trichodesmium blooms from various satellite sensors. They are extensively documented in
Blondeau-Patissier et al. (2014) and Mckinna (2015). Former algorithms are classification schemes using thresholds applied
to reflectances in the blue-green (440-550) range, like those proposed by Subramaniam et al. (2002) and Dupouy et al. (2011).30
They were designed using Sea-viewing Wide Field-of-view Sensor (SeaWiFS) observations. Using spectral features in Mod-
erate Resolution Imaging Spectroradiometer (MODIS)-Aqua observations at 250 m in the red-NIR, McKinna et al. (2011)
elaborated a simple reflectance classification algorithm to detect dense Trichodesmium surface aggregation. By providing an
2
operational Floating Algae Index (FAI), Hu et al. (2010) also demonstrated the potential for using the red-edge effect, that is the
increasing absorption in the red (620-700) and scattering in the NIR (beyond 700) region of the spectrum due to floating algae.
Using Medium Resolution Imaging Spectrometer (MERIS) observations in the red-NIR band, Gower et al. (2014) provided
a similar index of Trichodesmium surface slicks. In their Trichodesmium bio-optical model, Westberry et al. (2005) used spe-
cific inherent optical properties (Trichodesmium specific absorption and backscattering parameters) to estimate Trichodesmium5
biomass from SeaWiFS reflectances.
The application of these algorithms to MODIS imagery revealed several issues, some of which were raised and discussed in
the aforementioned articles. For example, the red-edge over Trichodesmium mats can lead to controversial results, since at-
mospheric correction for aerosols is based on information at similar wavelengths (Hu et al., 2010). Sampling effects are also
exacerbated due to the occurrence of clouds in the WTSP, since the blooming period of Trichodesmium (mainly November10
to March (Dupouy et al., 2011)) coincides with the cloudiest period of South Pacific Convergence Zone making difficult the
identification of coincident in-situ mats in satellite imagery. Moreover, because Trichodesmium mats are narrow (v 50 m typi-
cally), the suitability of MODIS visible-NIR spatial resolution to detect such surface aggregations is questionable.
The aim of this study is to provide a systematic detection of Trichodesmium blooms in the vast WTSP Ocean between lati-
tudes 26° and 10°S and longitudes between 155° and 190° E, building on previously published algorithms and using marine15
reflectances measured by MODIS onboard Aqua. To evaluate the detection performance, a large database of historical mat ob-
servations in this region was created and updated with recent datasets and particularly the “Oligotrophy from Ultra-oligoTrophy
PACific Experiment” (OUTPACE) cruise of March-April 2015 (Moutin et al., 2017). As a consequence of improvements in
MODIS Collection 6 calibrations and algorithm updates for aerosol and cloud screening (Casey et al., 2017), Trichodesmium
detection algorithms developed with previous collections had to be adapted whenever possible. From this experience, a new20
algorithm less prone to contamination by clouds emerged, combining methods to detect Trichodesmium blooms from algo-
rithms by McKinna et al. (2011) and Hu et al. (2010) and was evaluated using high resolution MODIS imagery. The paper
is organized as follows. In Section 2 in-situ and satellite data used in this study are presented. In Section 3 methods to ex-
tract Trichodesmium spectral signature and their limitations are described, and details are provided about the former detection
algorithms of Hu et al. (2010) and McKinna et al. (2011), adapted for this study, as well as the newly developed algorithm.25
In Section 4 these algorithms are compared, and the proposed algorithm is evaluated along the OUTPACE cruise transect. In
Section 5 the new algorithm performance is discussed. In Section 6 the conclusions of the study are drawn and perspectives
are provided for future work.
2 Material
2.1 In situ observations30
The in-situ data used to train and test the Trichodesmium detection algorithm is a combination of three datasets, providing data
in the acquisition period of MODIS Aqua or Terra missions (March 2000-present). The first dataset includes Trichodesmium
mat observations published in Dupouy et al. (2011). These observations were made between 1998 and 2010, from aircraft,
3
French Navy ships, research vessels (e.g., R/V Alis), and ships of opportunity. Some of these visual observations were con-
firmed by water samples analyzed with photomicrographs confirming the abundant presence of Trichodesmium (Dupouy et al.,
2011). The second dataset includes airborne visual observations were also gathered in December 2014 in the vicinity of New
Caledonia during the “REcensement des Mammifères marins et autre Mégafaune pélagique par Observation Aérienne” (REM-
MOA) program (Laran et al., 2016). This second dataset provides a large number of Trichodesmium mat observations along5
numerous and repetitive transects, which is most favorable for satellite data validation. In total, the database created from the
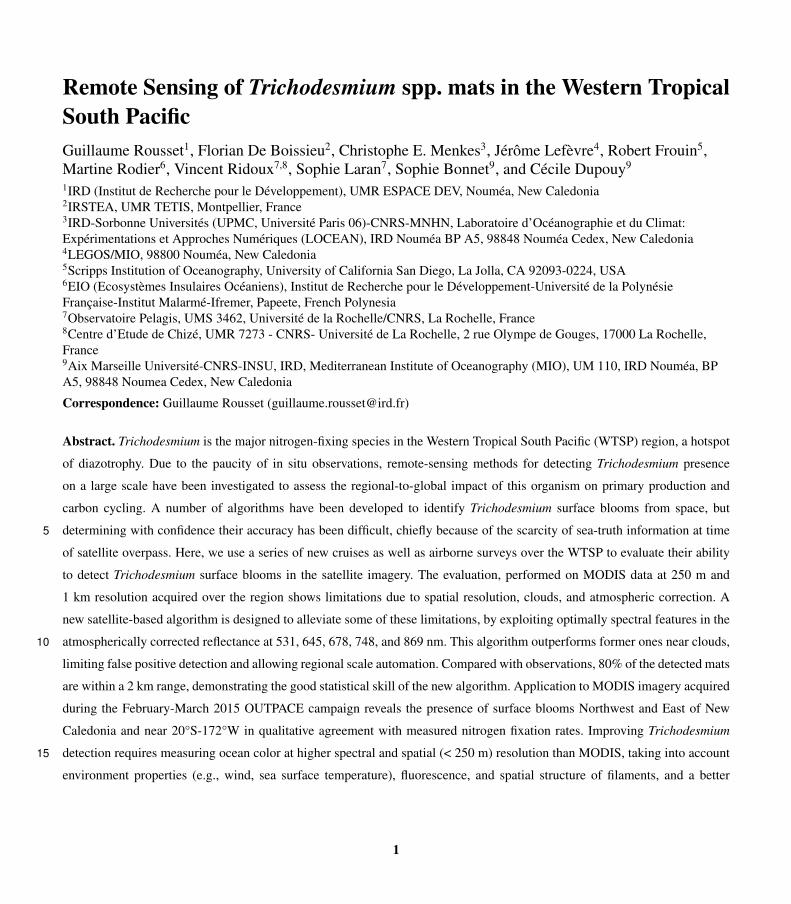
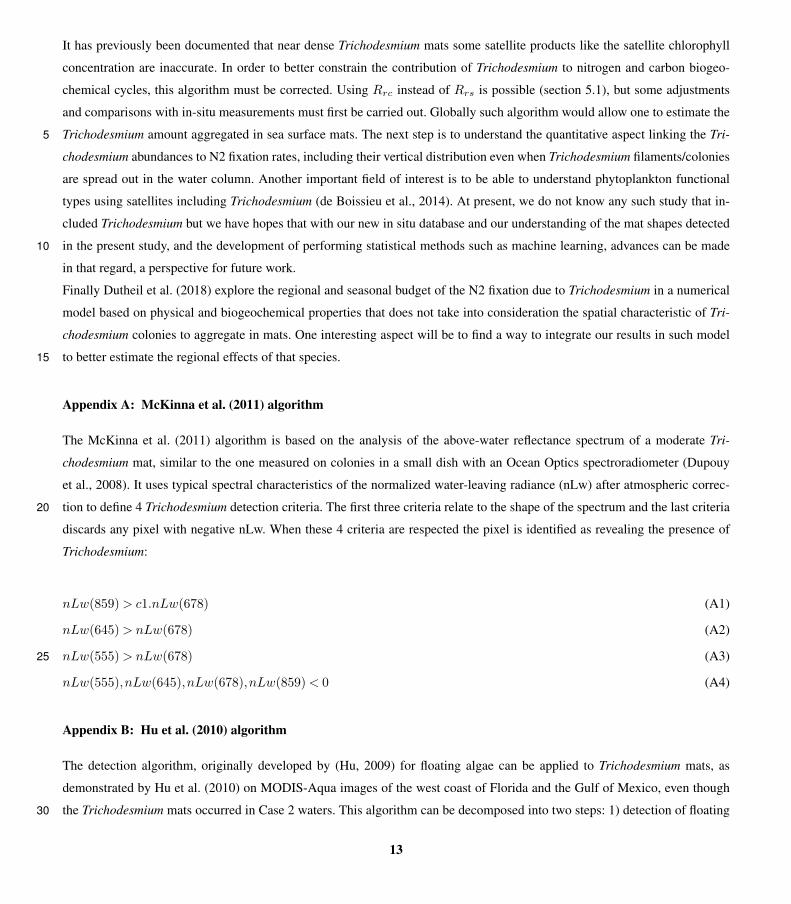
compilation of these two datasets contains 507 open ocean observations in the region 15°S-25°S, 155°E-180°E (Figure 1). It
is referred to as the Observation Base of Trichodesmium (OBT) in the following and used mainly for algorithm training.
A third dataset was obtained along a latitudinal transect around 20°S carried out during the OUTPACE scientific cruise
(Moutin et al., 2017) in the region 160°E-160°W from 23 February to 01 April 2015. Seawater samples were collected for10
Trichodesmium identification and estimation by quantitative PCR, a molecular method described in Stenegren et al. (2018),
microscopic counts at selected stations (Caffin, personal communication, 2017), as well as N2 fixation rates as described in
Bonnet et al. (2018). Moreover, Trichodesmium abundance from the Underwater Vision Profiler 5 (UVP5; Picheral et al.,
2010), calibrated on trichome concentration from pigment algorithms and on visual counts of surface samples at every stations,
allowed one to describe the Trichodesmium distribution along the transect (Dupouy et al., 2018).15
2.2 Satellite data
Marine reflectances from MODIS Aqua and Terra Collection 6 coinciding in time and space to the OBT database and the
OUTPACE campaign are used in this study. Level-1A observations were downloaded from NASA’s Goddard Space Flight
Center (http://oceandata.sci.gsfc.nasa.gov) and processed with SeaDAS v7.0.2 to produce Level-2 reflectances at 250 m and
1 km resolution. SeaDAS v7.0.2 default values were applied during this processing for atmospheric correction failure, land,20
sun glint, very high or saturated radiance, sensor view zenith angle exceeding threshold, stray light contamination, and cloud
contamination. Satellite observations with a proportion of valid pixels lower than 40% within the 0.5° searching radius around
each in-situ observation were screened out.
MODIS atmospherically corrected (aerosol + Rayleigh) remote sensing reflectances (Rrs) in the visible, NIR, and short wave-
length infrared (SWIR) were used at different resolutions: 250 m for bands 1 (645 nm) and 2 (859 nm), 500 m (bands 3-7,25
visible and SWIR land/clouds dedicated bands) and 1 km (bands 8-16). Bands 8 to 16 are dedicated to ocean color (Table 1),
but the information in high-resolution bands located in the visible-NIR region is also used to track floating blooms. To evaluate
the influence of resolution on detection performances, Level-2 remote sensing data was produced at both 250 m and 1 km
resolutions, with interpolation of 500 m and 1 km data and aggregation of 250 m and 500 m resolution data, respectively. The
consequences of these processing are discussed in Section 5.30
The aerosol correction was carried out with the standard Gordon and Wang (1994) method since the study was conducted in
the open ocean (Case-1 waters). For reasons detailed in next section, this type of correction is not appropriate in the presence
of strong floating algae concentrations. Therefore, Rayleigh-corrected only reflectances (Rrc) were computed in addition to
Rrs in Level-2 outputs.
4
3 Methods
3.1 Motivation in using Rayleigh-corrected reflectance (Rrc) in bio-optic algorithms for floating blooms
The atmospheric correction scheme of Gordon and Wang (1994) utilizes a pair of NIR bands at 748 and 869 nm. Spectral
differences in the two NIR bands are used to select the most probable aerosol model, allowing an estimation of the aerosol
effects in the visible. The aerosol contamination is then removed from the TOA signal after Rayleigh scattering correction to5
yield water-leaving radiance, thereforeRrs, in the visible. But to retrieve the aerosol model over Case-1 waters, the Gordon and
Wang (1994) method relies on the assumption that optical constituents have negligible contribution to water-leaving radiances
in the NIR region. Over floating mats, this assumption does not hold due to red edge effects, and the atmospheric correction
may give erroneous (i.e., too low and even negative) values of Rrs as detailed in Hu et al. (2010). For this reason, Rrc was
preferred in floating algal bloom concentration detection algorithms, as done with the Floating Algal Index (FAI) in Hu et al.10
(2010) or with the Maximum Chlorophyll Index (MCI) in Gower et al. (2008).
This issue is illustrated in Figure 2, which presents a MODIS-Aqua image of the Australian coast acquired just after a period
of heavy rain that led to a massive Trichodesmium bloom. Fortunately, this bloom was also documented through field studies
(McKinna et al., 2011). Figure 2A shows the “true-color” image obtained using a combination of Rrc at 469, 555 and 645
nm. On this image, large visible Trichodesmium mats distributed over a vast area can be seen. Figure 2B displays the SeaDAS-15
derived aerosol optical thickness (AOT) at 555 nm, an indicator of the aerosol load in the atmosphere. The high AOT values
match the filamentous spatial structure noticed in the “true color” image. However, this structure is more likely to be floating
material as the patterns are very thin and do not seem to be driven by wind. Moreover, several patches within this structure
are flagged as cloud in the center (grey patches on figure 2B), although the “true color” image does not indicate the presence
of clouds in this particular area. The misclassification of marine to cloudy pixel is a failure of the cloud detection algorithm,20
resulting from high water-leaving signal in the NIR bands exceeding the albedo threshold of 2.7% (Wang and Shi, 2005). Figure
2C shows the chlorophyll concentration (Chl_a) estimated according to the OC3 algorithm when Chl_a retrievals are above 0.2
mg.m−3 and to the OCI algorithm when they are below (Hu et al., 2012). Chl_a decreases systematically, even falling to zero,
in the vicinity of the Trichodesmium patches, although the real concentrations are certainly larger at the core of the mats than at
their periphery. In addition to biomass underestimation, the spectral miscorrection may reduce the performance of reflectance25
classification schemes, like those based on simple reflectance thresholds or using reflectance ratios in the blue-green range.
Prior to using such classification schemes, the spectral signature of Trichodesmium mats using MODIS Rrs and Rrc need to
be further investigated (see below).
3.2 Extraction of the spectral signature of mats
With the persistent cloud cover in the region, the number of strict coincidences of in-situ observations and cloud-free MODIS30
pixels with visible Trichodesmium mats is small. To extract the Trichodesmium spectral signature corresponding to the OBT,
6 tiles have been specifically selected (Table 2) and are used later on to test the different bio-optical algorithms designed to
detect the Trichodesmium presence. These images have been chosen because they are relatively free of clouds, Trichodesmium
5
mats are visible in the "true color" images, and they contain many “ground-truth” observations (Figure 3).
The NASA Ocean Biology Processing Group method (Bailey and Werdell, 2006) to select match-ups, i.e., average or nearest
pixel, was used to find coincidences between in situ observations and clear MODIS satellite pixels. A total of 468 coincident
MODIS Aqua pixels and OBT observations were found. After data screening, only 50 pairs remained, indicating that approx-
imately 90% of in-situ observations were not usable, primarily because of cloud cover. Once inspected, 19 MODIS-Aqua5
spectra out of the 50 pixels exhibited Trichodesmium features similar to those documented in Hu et al. (2010) and McKinna
et al. (2011). In order to increase the number of useful observations, the searching window was extended both in time (up to +/-
4 days), with the hypothesis that a bloom can last for vone week (e.g., Hegde et al., 2008), and extend spatially over +/- 50 km,
i.e., v200 pixels at 250 m resolution. This spatial relaxation up to +/- 50km is motivated by considering a maximum drifting
speed of v 10 cm.s−1 for algae mats compatible with the observed surface surface drifts in that region (Rousselet et al., 2018;10
Cravatte et al., 2015). Also, some in-situ observations close spatially and temporarily (in the same tile and at intervals of +/- 4
days) increased our degree of confidence in identifying the filamentous patterns as due to Trichodesmium.
After extending the searching window, a total of 1200 spectra were extracted. Spectra were labelled, based on information
provided by FAI (Hu, 2009) and the presence/absence of visible mats in the "true color" image. When the pixel is coinciding
with a visible mat on the "true color" image and is characterized with high FAI but low Chl_a, it is labeled Type i: it is the15
signature of high algae concentration. Pixels in close proximity to Trichodesmium mats with low FAI and undetected mats in
"true color" image are labeled Type ii. This second type of pixels is expected to have a high amount of Trichodesmium colonies
although not aggregated, offering an opportunity to detect spectral features due to the presence of Trichodesmium pigments
other than Chl_a.
3.3 Robust spectral features over and near Trichodesmium mats20
Figure 4B shows Type i average Rrc spectrum for 1km resolution images. Compared to blue water spectrum (see blue curve)
no Trichodesmium spectral feature could be detected in the visible and NIR spectral domain. The increase of Rrc beyond
700 nm indicates that, at low resolution, the red edge effect is weakly discernible over floating algae, contrasting with robust
signals detected by McKinna et al. (2011) and Hu et al. (2010) using both hyperspectral and MODIS 250x250 m observations
over Trichodesmium mats. As suggested by these authors, spectral sensors with 1 km resolution are inappropriate to capture25
floating Trichodesmium due to negligible signal from discrete mats once mixed with adjacent water in 1x1 km cells. Middle
and bottom rows of Figure 4 present Rrc and Rrs spectra interpolated to 250 m and partitioned in Type i and Type ii (second
row and third row respectively). For Type i, it is noteworthy that the red edge signal is well captured in the NIR region at 859
nm, a MODIS land band with true 250 m resolution , while in the 758 and 896 nm bands the derived signals using bilinear
interpolation are still low. One can notice that, after application of the NIR atmospheric correction, the shape of the mean Rrs30
spectra remains similar to that of Rrc, minus an offset in the visible region, corresponding to subtraction of the flawed aerosol
contribution (compare Figure 4C with Figure 4D). Derived Rrs at 748 and 869 nm are set to zero, as a result of the black pixel
approximation.
For Type ii, the red-edge effect totally disappears from the true 250 m band at 859 nm and the derived baseline 758-869 nm
6
appears above the Rrc (and Rrs) at 859 nm. Hu (2009) had already noticed this issue for pixels with strong spatial gradients
in the NIR part of the spectrum. It is interpreted as a result of the bilinear interpolation of 758 and 869 nm bands from 1 km to
250 m, using information from adjacent 1 km pixels.
Unfortunately, in the visible region, there is little useful information to capture Trichodesmium with Rrc (or Rrs) spectra
interpolated to 250 m, both in Type i and Type ii situations. In Trichodesmium blooms, a release of dissolved colored substance5
was observed, as suggested by Hu et al. (2010) for coastal waters. For oligotrophic waters studied here, there was no such
absorption in the blue region (412 nm) due to possible dissolved colored substances. Other characteristic features due to
absorption maxima around 495 and 550 nm caused by the presence of phycourobilin and phycoerythrobilin respectively (see
Figure 5 in Hu et al. (2010)), are not seen using the 600 spectra-composite spectrum. Finally, the only robust spectral feature
in the visible range is a minimum in Rrc (and Rrs) occurring at 678 nm, due to increasing reflectance beyond 700 nm.10
Interestingly, comparison between Rrc and Rrs shows that standard deviation error bars are much smaller for Rrc reflectances
while the range of magnitudes between wavelengths is larger. This is a significant argument for using Rrc instead of Rrs, as it
would lead to a better discrimination of Trichodesmium mat spectra against other spectra.
3.4 Two published algorithms
Among the existing Trichodesmium mat detection algorithms, only the McKinna et al. (2011) and Hu et al. (2010) ones were15
designed for the MODIS sensor and were tested in this study. The other algorithms were ignored as they were not adaptable to
MODIS sensor or would give erroneous results due to Chl_a misestimation over Trichodesmium mats.
The Trichodesmium mat detection algorithm of McKinna et al. (2011) is based on 4 criteria relative to the shape of Rrs
(given in te Appendix A). When applied to the same MODIS image (new collection) as the one used by McKinna et al.
(2011), more pixels were discarded due to the fourth criterion, which eliminated pixels whith negative nLw at 555, 645, 67820
or 859 nm). Indeed, the test of a negative Rrs value at 678 nm due to aerosol overcorrection excludes many pixels. Other
atmospheric corrections including that of Wang and Shi (2007) used by McKinna et al. (2011), have been applied with the
same results. Skipping the fourth criterion of the algorithm allowed matching the results of McKinna et al. (2011). Therefore,
this modification was adopted for the present study and the algorithm is called “McKinna modified” in the following.
The Trichodesmium detection algorithm presented in Hu et al. (2010) is based on a two-step analysis of Rrc spectra. The first25
step captures floating algae with FAI. The second step resolves the ambiguities between Trichodesmium and Sargassum, by
analyzing spectral features in the blue-green region. To overcome possible spectral influence due to inappropriate atmospheric
correction, Hu et al. (2010) proposed a simple correction method based on the difference of Rrc spectra between bloom and
nearby algae free region. After several tries on the data presented above, the second step was found to be sensitive to the choice
of the algae free region (not shown). Thus, the detection was made only by applying thresholds on FAI. After tuning, best30
results were obtained when FAI was between 0 and 0.04.
7
3.5 New algorithm criteria
Our criteria for detecting Trichodesmium mats were defined based on spectral characteristics of Rrs and Rrc (Figure 4).
Similarly to the algorithms of Hu et al. (2010) and McKinna et al. (2011) (see Appendix), three criteria given in equations
1-3 were defined to extract the typical spectrum shape of Trichodesmium. The first criterium (Eq. 1) takes advantage of the
systematic negative Rrs values at 678 nm over strong Trichodesmium mat concentrations. All pixels with negative Rrs value5
at this wavelength have a high probability to be floating algae and thus Trichodesmium in this region. Moreover, this criterium
has been found useful can also be used to detect some artifact, e.g., sun glint.
The second criterium (Eq. 2) is based on Rrc(748) and Rrc(859) to detect the spectral shape in the NIR associated with
the surface Trichodesmium mats. The third criterium (Eq. 3) uses Rrc(645) and Rrc(531) to resolve ambiguities between
Trichodesmium mats and incorrectly selected pixels after processing with the previous criteria, the misdetections occurring10
mostly near clouds (Eq. 3).
Rrs(678)< 0 (1)
Rrc(748)<Rrc(859) (2)
Rrc(645)<Rrc(531) (3)
4 Results15
4.1 Comparison with previous algorithms
The detection results of the three Trichodesmium detection algorithms are illustrated in Figure 5 on the MODIS tile A2007290.0355,
used in McKinna et al. (2011). The McKinna modified algorithm shows the same detection patterns as the ones found in McK-
inna et al. (2011). It is a vast Trichodesmium area within which the filamentous structures cannot be distinguished. The new
algorithm and the threshold FAI detect thin filamentous structures more similar to Trichodesmium mat structures observed in20
airborne photographs. When negative, the absolute value of Rrs(678) can also be used as an index of mats concentration as
values increase when getting to the core of patches.
Compared with both former algorithms, the new algorithm performs much better near clouds. Figure 6 is a zoom of the area
delineated by the red rectangle in Figure 5. This area presents a cloud patch where McKinna modified and FAI algorithms both
detect Trichodesmium pixels. These pixels were identified as false positives as their spatial distribution is sparse and only in the25
vicinity of clouds. This conclusion is also supported by the “true color” composition (Figure 2) where the only Trichodesmium
mats appear located at the bottom of the image. In that area the new algorithm does not make any false positive detection
while keeping the Trichodesmium mats at the bottom of the image. The robustness of the new detection algorithm to exclude
cloud-contaminated pixels while keeping accurate Trichodesmium mat detection is an important improvement for regions with
high cloudiness, such as the WTSP.30
8
4.2 Algorithm performance against in-situ mat observations
The exact coincidence in time and space between in-situ Trichodesmium mats observations and satellite mat detection is quite
difficult to reach in general. One of the main reasons is by far the cloud cover, which eliminates a large quantity of the
possible comparisons (90%). A second reason is the elapsed time between in-situ observations and the corresponding satellite
pass during which the floating algae could have drifted at sea surface and/or migrated vertically depending on sea conditions5
(temperature, wind, etc.). For example, the abundance of Trichodesmium at the sea surface may vary with the time of day, as
a daily cycle of rising and sinking colonies in the water column is often observed as a result of cell ballasting (Villareal and
Carpenter, 2003). Moreover, as Trichodesmium is a buoyant constituent, it can be advected by surface currents.
To circumvent that problem and perform a more statistically robust comparison of the detection results of our algorithm with
in-situ data, we used the following strategy. An analysis of the spatio-temporal distance between the in-situ observations and10
the nearest detected mats was conducted. As explained previously, for each day in a range of +/- 4 days around the date of
observation, the spatial distance between the position of the observation and the nearest detected mat was computed. Overall,
80% of the observed mats have a corresponding mat detection within less than 5 km range independent of the detection
algorithm used. These results demonstrate the statistical capability of the new algorithm to retrieve a mat near a point of
observation.15
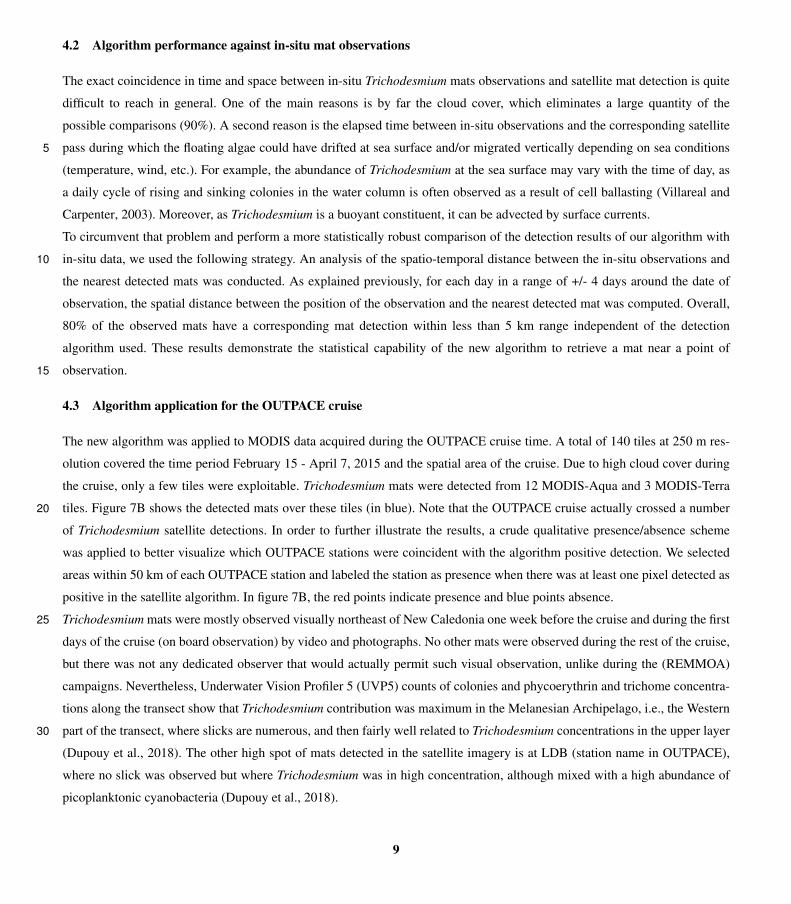
4.3 Algorithm application for the OUTPACE cruise
The new algorithm was applied to MODIS data acquired during the OUTPACE cruise time. A total of 140 tiles at 250 m res-
olution covered the time period February 15 - April 7, 2015 and the spatial area of the cruise. Due to high cloud cover during
the cruise, only a few tiles were exploitable. Trichodesmium mats were detected from 12 MODIS-Aqua and 3 MODIS-Terra
tiles. Figure 7B shows the detected mats over these tiles (in blue). Note that the OUTPACE cruise actually crossed a number20
of Trichodesmium satellite detections. In order to further illustrate the results, a crude qualitative presence/absence scheme
was applied to better visualize which OUTPACE stations were coincident with the algorithm positive detection. We selected
areas within 50 km of each OUTPACE station and labeled the station as presence when there was at least one pixel detected as
positive in the satellite algorithm. In figure 7B, the red points indicate presence and blue points absence.
Trichodesmium mats were mostly observed visually northeast of New Caledonia one week before the cruise and during the first25
days of the cruise (on board observation) by video and photographs. No other mats were observed during the rest of the cruise,
but there was not any dedicated observer that would actually permit such visual observation, unlike during the (REMMOA)
campaigns. Nevertheless, Underwater Vision Profiler 5 (UVP5) counts of colonies and phycoerythrin and trichome concentra-
tions along the transect show that Trichodesmium contribution was maximum in the Melanesian Archipelago, i.e., the Western
part of the transect, where slicks are numerous, and then fairly well related to Trichodesmium concentrations in the upper layer30
(Dupouy et al., 2018). The other high spot of mats detected in the satellite imagery is at LDB (station name in OUTPACE),
where no slick was observed but where Trichodesmium was in high concentration, although mixed with a high abundance of
picoplanktonic cyanobacteria (Dupouy et al., 2018).
9
Bonnet et al. (2018) reported a significant (p<0.05) correlation between N2 fixation rates and Trichodesmium abundances
during OUTPACE. Based on bulk and cell-specific N2-based isotopic measurements indicated that Trichodesmium accounted
for 50 to >80% of N2 fixation rates in this region at the time of the cruise. Such a high correlation between Trichodesmium
biomass (here phycoerythrin) was also measured in New-Caledonia waters (Tenório et al., 2018). Hence the in situ N2 fixation
rate measured during the cruise (Figure 7A) was used as a robust proxy of the Trichodesmium concentration to further evaluate5
accuracy of satellite detections. A qualitative comparison between Figures 7A and 7B indicates that when significant fixation
rates were observed, Trichodesmium presence was detected by the satellite algorithm and when N2 fixation rates were low,
Trichodesmium absence was stated. Although qualitative, this successful validation gives confidence in using our algorithm for
Trichodesmium detection.
5 Discussion10
5.1 Algorithm limitations
The proposed algorithm was designed to detect strong concentrations of floating Trichodesmium mats and limit wrong de-
tections. However, floating Trichodesmium mats are occurring when sea surface is little agitated since they tend to sink and
disperse in rough conditions. In such a case our algorithm does not allow to detect Trichodesmium even in strong concentration
because of the low penetration depth of NIR irradiance (below 1 m). This situation occurred during the OUTPACE cruise,15
where measurements reveal high Trichodesmium abundances near the Fiji island (Stenegren et al., 2018), while our algorithm
was unable to detect Trichodesmium mats (Figure 7, stations adjacent 180°E).
Another limitation concerns the validity of the new algorithm for future MODIS collections and other regions. The first cri-
terion is taking advantage of the aerosol overcorrection as an index of floating algae. The aerosol correction algorithm will
certainly be adapted in the future. Thus, first criterion would have to be replaced by another floating algae index; the FAI20
could be a good solution. However, it will always be possible to use the current (imperfect) aerosol correction. Moreover, the
zero threshold on Rrs(678), under which the pixel is labelled as a Trichodesmium mat, would have to be tested and tuned
in other situations, e.g., in the presence of aerosols and other floating material. This study was carried out in the WTSP area,
where the observed spectra seem slightly different from the ones reported in McKinna et al. (2011) and Hu et al. (2010). More
specifically, the spectral oscillations of reflectance observed by Hu et al. (2010) in the range [412, 678] nm were not noticed in25
the present study. Therefore, the robustness of this algorithm in the presence of other floating algae (e.g., Sargassum), as well
as in other regions of the world, would have to be tested to make it more general.
This study was limited to the processing of MODIS images, mainly because of the availability of images corresponding to
field measurements (2014 and before). However, it would be worth extending the detection algorithm to other sensors such
as MERIS, e.g., for comparison with the Gower et al. (2014) algorithm, and the recently launched Ocean and Land Colour30
Instrument (OLCI). This would require further investigations to adapt the algorithm to the specific bands of these sensors and
evaluate the results. However, since these sensors cover the same spectral range, one can expect a quite similar behavior.
10
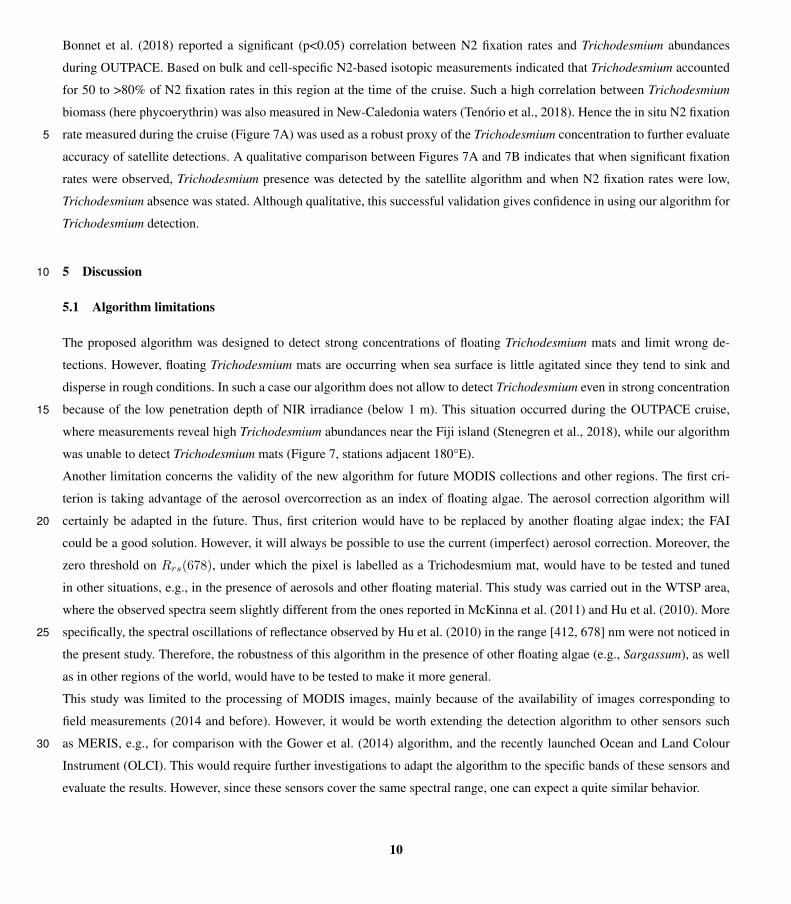
Aware of these limitations, one may consider using Rrc only, since Rrs is sensitive to the accuracy of the atmospheric
correction. To emulate an index of mats concentration, Equation (4) is proposed in place of Equation (1). The magnitude of the
trough at 678 nm is an indication of the mats concentration, which can be retrieved using the difference between the observed
Rrc(678) and the result of the linear Rrc interpolation between 645 and 748 nm. In the following, To confirm the trough at
678 nm, check the spectral form typical to Trichodesmium (Figure 4), and assess the red-edge of the signal, equations (5-7),5
similar to the form criteria of McKinna et al. (2011), could be used:
[(Rrc(645)+ (Rrc(748)−Rrc(645))×678− 645
748− 645]−Rrc(678)> 0 (4)
Rrc(678)<Rrc(859) (5)
Rrc(678)<Rrc(748) (6)
Rrc(678)<Rrc(667) (7)10
This alternative algorithm has the advantage of being easily adaptable to other sensors with similar spectral bands (e.g.
MODIS). Moreover, the procedure is free of atmospheric overcorrection while still exploiting the red-edge effect. However
in its application, a large part of pixels detected as Trichodesmium by the former algorithm (i.e., described in Section 3.5)
is discarded. The different criteria cannot be relaxed without a false positive detection increase. Therefore this alternative
algorithm is more restrictive, and its suitability and performance require further examination.15
5.2 Spatial resolution impact
As indicated previously, only few spectral bands (land channels) have a high resolution (250 m or 500 m), while the rest
have a nominal resolution at 1 km. To investigate the influence of resolution on the spectral signature of Trichodesmium mats
the spectral analysis was also conducted at a 1 km resolution. Dense groups of extended mats are still well detected at 1
km resolution. However, thinner mats with a weaker signal visible at 250 m resolution are lost at 1 km resolution. Figure 820
illustrates this behavior on MODIS data.
The spatial structure of Trichodesmium aggregates is complex. When mats are present, Trichodesmium have a tendency to form
a filamentous pattern much narrower than 250 m (50 m at most, according to visual detections), and thus the satellite sensor at
250 m resolution can only detect the largest ones (Figures 8 and 9). Hence there is a scale mismatch between the exact form
of the thin filaments and the actual detection by the current satellite data, which must average in a way the thin and strongest25
filaments into signals detectable at 250 m. Understanding the shape of the filaments, and their physical characteristics (e.g.,
width) will require much higher resolution satellite data (at least 50 m) which are available at present but without repetitive
coverage. Figure 9 additionally illustrates that the Trichodesmium filaments are but a tiny part of the chlorophyll tongues and
are inserted into the much wider chlorophyll patterns. There can exist, within a chlorophyll tongue such as that in Figure 9,
several thin elongated filaments.30
One would also intuitively believe that the filaments illustrate the presence of dynamical fronts where convergent dynamics
can maintain and participate in the mat aggregations. A natural dynamical criteria allowing one to characterize the presence
11
of the filaments could be found in the finite-size Lyapunov exponents (FSLE) methods (Rousselet et al., 2018). A relationship
between FSLE only and in situ chlorophyll edges “fronts” was found during OUTPACE with a 25% correlation score. The same
kind of relationship was expected for floating algae filaments. However, the relationship between FSLE and the organisation of
the filaments could not be proven within this study. We believe that it is here also a question of scale. The present calculation
of FSLE is using 12.5 km satellite data at best (Rousselet et al., 2018), thus it is difficult to think that such a resolution could5
catch dynamics Trichodesmium filaments wide of a few hundred meters. A dedicated in situ experiments would have to be
specifically undertaken to resolve the question of filament organization.
6 Conclusions and perspectives
At present, previously published algorithms detecting Trichodesmium using the current MODIS data archive (Hu et al., 2010;
McKinna et al., 2011), cannot be directly used in the South Pacific as they either miss the mats due to algorithms failures10
(Section 3.4) and/or do not eliminate numerous false positive in the presence of clouds. In our study, we have devised a new
algorithm building on the previous ones, which allows a cleaner and more robust detection of those mats. Validation was ac-
complished using a new, updated database of mats in the South Pacific. This algorithm can however detect only the densest
slick but achieves the goal of limiting the detection of false positive due to clouds. During the OUTPACE cruise, satellite de-
tections confirmed the presence of Trichodesmium slicks at much wider spatial range than what was possible to observe from15
the ship. This illustrates the important contribution and complementary nature of satellite observations to in situ measurements.
Yet, the new detection algorithm was developed and evaluated for the WTSP region. Hence, future prospects will be to extend
the evaluation to other regions, especially in the presence of other floating algae such as Sargassum.
During the same campaign Dupouy et al. (2018) found that ocean color measured with a Satlantic UV-VIS radiometer at
greenish blue and yellowish green wavelengths were not totally linked to Chl_a and that an extra factor independent of Chl_a,20
may be related to colony backscattering or fluorescence, governs part of the variability. This extra factor is not observed during
BIOSOPE (Biogeochemistry and Optics South Pacific Experiment), a cruise in the tropical Southern Pacific gyre (Claustre
et al., 2008), where the radiance is correlated to Chl_a only. Further investigations have to be conducted to confirm that such a
signal is produced by Trichodesmium and can be detected from space.
25
MODIS-Terra and MODIS-Aqua satellite sensors are acquiring data since 2000 and 2002, respectively. However, the data
quality of these sensors is becoming more and more uncertain with time going by, as their lifetime was not expected to last
more than 6 years. The new algorithm could be adapted to other satellite instruments with similar spectral bands, for example
Visible Infrared Imaging Radiometer Suite (VIIRS) onboard NPP and JPSS-1/NOAA-20 (1 km resolution) and OLCI onboard
Sentinel-3 (300 m spatial sampling), but the spatial resolution remains a problem as we observed that 250 m was already too30
coarse a resolution to understand the thinner mat dynamics. A study with a better spectral and spatial resolution may lead to
better performances and to a new and better algorithm. It may be possible, at least regarding spatial resolution, with Multispec-
tral Instrument (MSI) onboard the Sentinel-2 series (10 to 60 m resolution).
12
It has previously been documented that near dense Trichodesmium mats some satellite products like the satellite chlorophyll
concentration are inaccurate. In order to better constrain the contribution of Trichodesmium to nitrogen and carbon biogeo-
chemical cycles, this algorithm must be corrected. Using Rrc instead of Rrs is possible (section 5.1), but some adjustments
and comparisons with in-situ measurements must first be carried out. Globally such algorithm would allow one to estimate the
Trichodesmium amount aggregated in sea surface mats. The next step is to understand the quantitative aspect linking the Tri-5
chodesmium abundances to N2 fixation rates, including their vertical distribution even when Trichodesmium filaments/colonies
are spread out in the water column. Another important field of interest is to be able to understand phytoplankton functional
types using satellites including Trichodesmium (de Boissieu et al., 2014). At present, we do not know any such study that in-
cluded Trichodesmium but we have hopes that with our new in situ database and our understanding of the mat shapes detected
in the present study, and the development of performing statistical methods such as machine learning, advances can be made10
in that regard, a perspective for future work.
Finally Dutheil et al. (2018) explore the regional and seasonal budget of the N2 fixation due to Trichodesmium in a numerical
model based on physical and biogeochemical properties that does not take into consideration the spatial characteristic of Tri-
chodesmium colonies to aggregate in mats. One interesting aspect will be to find a way to integrate our results in such model
to better estimate the regional effects of that species.15
Appendix A: McKinna et al. (2011) algorithm
The McKinna et al. (2011) algorithm is based on the analysis of the above-water reflectance spectrum of a moderate Tri-
chodesmium mat, similar to the one measured on colonies in a small dish with an Ocean Optics spectroradiometer (Dupouy
et al., 2008). It uses typical spectral characteristics of the normalized water-leaving radiance (nLw) after atmospheric correc-
tion to define 4 Trichodesmium detection criteria. The first three criteria relate to the shape of the spectrum and the last criteria20
discards any pixel with negative nLw. When these 4 criteria are respected the pixel is identified as revealing the presence of
Trichodesmium:
nLw(859)> c1.nLw(678) (A1)
nLw(645)> nLw(678) (A2)
nLw(555)> nLw(678) (A3)25
nLw(555),nLw(645),nLw(678),nLw(859)< 0 (A4)
Appendix B: Hu et al. (2010) algorithm
The detection algorithm, originally developed by (Hu, 2009) for floating algae can be applied to Trichodesmium mats, as
demonstrated by Hu et al. (2010) on MODIS-Aqua images of the west coast of Florida and the Gulf of Mexico, even though
the Trichodesmium mats occurred in Case 2 waters. This algorithm can be decomposed into two steps: 1) detection of floating30
13

algae (FAI, Floating Algal Index), and 2) test-of-form criteria of the radiance spectrum.
The FAI aims at detecting the strong reflectance in the infrared (red-edge) of the algal agglomerate. To avoid the atmospheric
overcorrection linked to the red-edge effect of the floating algae organized in a heap (Hu, 2009), the calculation of this index
is applied to reflectance corrected only for the effects of Rayleigh scattering (Rrc). This correction accounts for the major
part of the color of the atmosphere if aerosols are not too abundant (i.e., small optical thickness). The FAI is then defined5
as the difference between Rrc in the infrared (859 nm for MODIS) and a reference reflectance (Rrc,0) calculated by linear
interpolation between the red and shortwave infrared, i.e., 667 nm and 1240 nm for MODIS:
Rrc,NIR +(Rrc,SWIR −Rrc,RED)× λNIR −λRED
λSWIR −λRED(B1)
λRED = 645nm,λNIR = 859nm,λSWIR = 1240nm (B2)
where RED = 645 nm, NIR = 859 nm, and SWIR = 1240 nm. According to Hu et al. (2010), the difference between Rrc and10
Rrc,0 (the second term of Equation B1) allows one to deal with the majority of the atmospheric effect which has a quasi-linear
spectral shape between 667nm and 1240nm. The second step of the algorithm consists in identifying the mats emphasized by
the FAI thanks to the shape of the spectrum in the visible domain. So as to correct the bias inferred in the visible part of the
spectrum by the possible presence of mats, Hu et al. (2010) suggest applying to the pixels presenting a strong FAI value the
correction of an area situated immediately next to this pixel and without bloom. This approach being very computer expensive,15
it is substituted by a simple difference between theRrc spectrum of the pixels considered (i.e., eventually with Trichodesmium)
and that of a nearby zone without mat. The spectrum of this Rrc difference presents a pattern (spectral signature) that seems to
be specific to Trichodesmium presence, i.e., a succession of high type low-top-low-top for the wavelengths 469-488-531-551-
555 nm.
Competing interests. no competing interests are present20
Acknowledgements. R. Frouin is supported by the National Aeronautics and Space Administration under various grants. We thank NASA
for the MODIS products.
14

References
Bailey, S. W. and Werdell, P. J.: A multi-sensor approach for the on-orbit validation of ocean color satellite data products, Remote Sensing
of Environment, 102, 12–23, https://doi.org/10.1016/j.rse.2006.01.015, 2006.
Berthelot, H., Benavides, M., Moisander P, H., Grosso, O., and Bonnet, S.: High-nitrogen fixation rates in the particulate and
dissolved pools in the Western Tropical Pacific (Solomon and Bismarck Seas), Geophysical Research Letters, 44, 8414–8423,5
https://doi.org/10.1002/2017GL073856, 2017.
Blondeau-Patissier, D., Gower, J. F. R., Dekker, A. G., Phinn, S. R., and Brando, V. E.: A review of ocean color remote sensing
methods and statistical techniques for the detection, mapping and analysis of phytoplankton blooms in coastal and open oceans,
https://doi.org/10.1016/j.pocean.2013.12.008, 2014.
Bonnet, S., Biegala, I. C., Dutrieux, P., Slemons, L. O., and Capone, D. G.: Nitrogen fixation in the western equatorial Pacific:10
Rates, diazotrophic cyanobacterial size class distribution, and biogeochemical significance, Global Biogeochemical Cycles, 23, 1–13,
https://doi.org/10.1029/2008GB003439, 2009.
Bonnet, S., Rodier, M., Turk-Kubo, K., Germineaud, C., Menkes, C., Ganachaud, A., Cravatte, S., Raimbault, P., Campbell, E., Quéroué,
F., Sarthou, G., Desnues, A., Maes, C., and Eldin, G.: Contrasted geographical distribution of N2 fixation rates and nifH phylotypes in
the Coral and Solomon Seas (southwestern Pacific) during austral winter conditions, Global Biogeochemical Cycles, 29, 1874–1892,15
https://doi.org/10.1002/2015GB005117, 2015.
Bonnet, S., Caffin, M., Berthelot, H., and Moutin, T.: Hot spot of N2 fixation in the western tropical South Pacific pleads for a
spatial decoupling between N2 fixation and denitrification, Proceedings of the National Academy of Sciences, 114, E2800–E2801,
https://doi.org/10.1073/pnas.1619514114, 2017.
Bonnet, S., Caffin, M., Berthelot, H., Grosso, O., Benavides, M., Helias-Nunige, S., Guieu, C., Stenegren, M., and Foster, R. A.: In depth20
characterization of diazotroph activity across the Western Tropical South Pacific hot spot of N2 fixation, Biogeosciences Discussions, pp.
1–30, https://doi.org/10.5194/bg-2017-567, 2018.
Caffin, M., Moutin, T., Foster, R. A., Bouruet-Aubertot, P., Doglioli, A. M., Berthelot, H., Guieu, C., Grosso, O., Helias-Nunige, S., Leblond,
N., Gimenez, A., Petrenko, A. A., de Verneil, A., and Bonnet, S.: N$_{2}$ fixation as a dominant new N source in the western tropical
South Pacific Ocean (OUTPACE cruise), Biogeosciences, 15, 2565–2585, https://doi.org/10.5194/bg-15-2565-2018, 2018.25
Capone, D. G.: Trichodesmium, a Globally Significant Marine Cyanobacterium, 1997.
Casey, K. A., Polashenski, C. M., Chen, J., and Tedesco, M.: Impact of MODIS sensor calibration updates on Greenland Ice Sheet surface
reflectance and albedo trends, The Cryosphere, 11, 1781–1795, https://doi.org/10.5194/tc-11-1781-2017, 2017.
Claustre, H., Sciandra, A., and Vaulot, D.: Introduction to the special section bio-optical and biogeochemical conditions in the South East
Pacific in late 2004: the BIOSOPE program, Biogeosciences, 5, 679–691, https://doi.org/10.5194/bg-5-679-2008, 2008.30
Cravatte, S., Kestenare, E., Eldin, G., Ganachaud, A., Lefèvre, J., Marin, F., Menkes, C., and Aucan, J.: Regional
circulation around New Caledonia from two decades of observations, Journal of Marine Systems, 148, 249–271,
https://doi.org/https://doi.org/10.1016/j.jmarsys.2015.03.004, 2015.
de Boissieu, F., Menkes, C., Dupouy, C., Rodier, M., Bonnet, S., Mangeas, M., and Frouin, R. J.: Phytoplankton global mapping from space
with a support vector machine algorithm, in: Ocean Remote Sensing and Monitoring from Space, edited by Frouin, R. J., Pan, D., and35
Murakami, H., https://doi.org/10.1117/12.2083730, 2014.
15
Dupouy, C., Jacques, N., Subramaniam, A., R. Mulholland, M., Montoya, J., Campbell, L., and et D. Capone, E.: Satellite captures Tri-
chodesmium blooms in the Soutwestern Tropical Pacific, Eos Transactions American Geophysical Union, 81, 13, 2000.
Dupouy, C., Neveux, J., Dirberg, G., Röttgers, R., Barboza Tenório, M. M., and Ouillon, S.: Bio-optical properties of the marine cyanobacteria
Trichodesmium spp., Journal of Applied Remote Sensing, 2, 023 503, https://doi.org/10.1117/1.2839036, 2008.
Dupouy, C., Benielli-Gary, D., Neveux, J., Dandonneau, Y., and Westberry, T. K.: An algorithm for detecting Trichodesmium surface blooms5
in the South Western Tropical Pacific, Biogeosciences, 8, 3631–3647, 2011.
Dupouy, C., Frouin, R., Tedetti, M., Maillard, M., Rodier, M., Lombard, F., Guidi, L., Picheral, M., Duhamel, S., Charrière, B., and Sem-
péré, R.: Diazotrophic \textit{Trichodesmium} influence on ocean color and pigment composition in the South West tropical Pacific,
Biogeosciences Discussions, pp. 1–43, https://doi.org/10.5194/bg-2017-570, 2018.
Dutheil, C., Aumont, O., Gorguès, T., Lorrain, A., Bonnet, S., Rodier, M., Dupouy, C., Shiozaki, T., and Menkes, C.: Modelling the pro-10
cesses driving \textit{Trichodesmium} sp. spatial distribution and biogeochemical impact in the tropical Pacific Ocean, Biogeosciences
Discussions, pp. 1–34, https://doi.org/10.5194/bg-2017-559, 2018.
Garcia, N., Raimbault, P., and Sandroni, V.: Seasonal nitrogen fixation and primary production in the Southwest Pacific:
Nanoplankton diazotrophy and transfer of nitrogen to picoplankton organisms, Marine Ecology Progress Series, 343, 25–33,
https://doi.org/10.3354/meps06882, 2007.15
Gordon, H. R. and Wang, M.: Retrieval of water-leaving radiance and aerosol optical thickness over the oceans with SeaWiFS: a preliminary
algorithm, Appl. Opt., 33, 443–452, https://doi.org/10.1364/AO.33.000443, 1994.
Gower, J., King, S., and Goncalves, P.: Global monitoring of plankton blooms using MERIS MCI, International Journal of Remote Sensing,
29, 6209–6216, https://doi.org/10.1080/01431160802178110, 2008.
Gower, J., King, S., and Young, E.: Global remote sensing of Trichodesmium, International Journal of Remote Sensing, 35, 5459–5466,20
https://doi.org/10.1080/01431161.2014.926422, 2014.
Hegde, S., Anil, A., Patil, J., Mitbavkar, S., Krishnamurthy, V., and V. Gopalakrishna, V.: Influence of environmental settings on the preva-
lence of Trichodesmium spp. in the Bay of Bengal, Marine Ecology Progress Series, 356, 2008.
Hu, C.: A novel ocean color index to detect floating algae in the global oceans, Remote Sensing of Environment, 113, 2118–2129,
https://doi.org/10.1016/j.rse.2009.05.012, 2009.25
Hu, C., Cannizzaro, J., Carder, K. L., Muller-Karger, F. E., and Hardy, R.: Remote detection of Trichodesmium blooms in optically complex
coastal waters: Examples with MODIS full-spectral data, Remote Sensing of Environment, 114, 2048–2058, 2010.
Hu, C., Lee, Z., and Franz, B.: Chlorophyll a algorithms for oligotrophic oceans: A novel approach based on three-band reflectance difference,
Journal of Geophysical Research: Oceans, 117, 1–25, https://doi.org/10.1029/2011JC007395, 2012.
Knapp, A. N., McCabe, K. M., Grosso, O., Leblond, N., Moutin, T., and Bonnet, S.: Distribution and rates of nitrogen fixation in the western30
tropical South Pacific Ocean constrained by nitrogen isotope budgets, Biogeosciences, 15, 2619–2628, https://doi.org/10.5194/bg-15-
2619-2018, 2018.
Laran, S., Hamani, V., Authier, M., Dorémus, G., Van Canneyt, O., Ridoux, V., and Watremez, P.: Distribution et abondance de la mégafaune
marine dans le sud-ouest du Pacifique. Campagne REMMOA - Nouvelle-Calédonie et Wallis et Futuna, Rapport final pour l’Agence des
aires marines protégées,105pp, 2016.35
Le Borgne, R., Allain, V., Griffithos, S. P., Matear, R. J., McKinnon, D. A., Richardson, A. J., and Young, J. W.: Vulnerability of open ocean
food webs in the tropical Pacific to climate change, in: Vulnerability of tropical Pacific fisheries and aquaculture to climate change, pp.
189–249, SPC, http://www.documentation.ird.fr/hor/fdi:010058145, 2011.
16
Luo, Y.-W., Doney, S. C., Anderson, L. a., Benavides, M., Berman-Frank, I., Bode, a., Bonnet, S., Boström, K. H., Böttjer, D., Capone, D. G.,
Carpenter, E. J., Chen, Y. L., Church, M. J., Dore, J. E., Falcón, L. I., Fernández, a., Foster, R. a., Furuya, K., Gómez, F., Gundersen, K.,
Hynes, a. M., Karl, D. M., Kitajima, S., Langlois, R. J., LaRoche, J., Letelier, R. M., Marañón, E., McGillicuddy, D. J., Moisander, P. H.,
Moore, C. M., Mouriño-Carballido, B., Mulholland, M. R., Needoba, J. a., Orcutt, K. M., Poulton, a. J., Rahav, E., Raimbault, P., Rees,
a. P., Riemann, L., Shiozaki, T., Subramaniam, a., Tyrrell, T., Turk-Kubo, K. a., Varela, M., Villareal, T. a., Webb, E. a., White, a. E., Wu,5
J., and Zehr, J. P.: Database of diazotrophs in global ocean: abundance, biomass and nitrogen fixation rates, Earth System Science Data,
4, 47–73, https://doi.org/10.5194/essd-4-47-2012, 2012.
McKinna, L., Furnas, M., and Ridd, P.: A simple, binary classification algorithm for the detection of Trichodesmium spp. within the Great
Barrier Reef using MODIS imagery, Limnology and Oceanography: Methods, 9, 50–66, https://doi.org/10.4319/lom.2011.9.50, 2011.
Mckinna, L. I. W.: Three decades of ocean-color remote-sensing Trichodesmium spp . in the World’s oceans : A review, Progress in Oceanog-10
raphy, 131, 177–199, https://doi.org/10.1016/j.pocean.2014.12.013, 2015.
Moutin, T., Doglioli, A. M., de Verneil, A., and Bonnet, S.: Preface: The Oligotrophy to the UlTra-oligotrophy PACific Experiment (OUT-
PACE cruise, 18 February to 3 April 2015), Biogeosciences, 14, 3207–3220, https://doi.org/10.5194/bg-14-3207-2017, 2017.
Picheral, M., Guidi, L., Stemmann, L., Karl, D. M., Iddaoud, G., and Gorsky, G.: The Underwater Vision Profiler 5: An advanced instru-
ment for high spatial resolution studies of particle size spectra and zooplankton, Limnology And Oceanography-methods, 8, 462–473,15
https://doi.org/10.4319/lom.2010.8.462, 2010.
Rousselet, L., de Verneil, A., Doglioli, A. M., Petrenko, A. A., Duhamel, S., Maes, C., and Blanke, B.: Large- to submesoscale surface
circulation and its implications on biogeochemical/biological horizontal distributions during the OUTPACE cruise (southwest Pacific),
Biogeosciences, 15, 2411–2431, https://doi.org/10.5194/bg-15-2411-2018, 2018.
Shiozaki, T., Kodama, T., and Furuya, K.: Large scale impact of the island mass effect through nitrogen fixation in the western South Pacific20
Ocean, Geophysical Research . . . , pp. 1–7, https://doi.org/10.1002/2014GL059835, 2014.
Stenegren, M., Caputo, A., Berg, C., Bonnet, S., and Foster, R. A.: Distribution and drivers of symbiotic and free-living diazotrophic
cyanobacteria in the western tropical South Pacific, Biogeosciences, 15, 1559–1578, https://doi.org/10.5194/bg-15-1559-2018, 2018.
Subramaniam, A., Carpenter, E. J., and Falkowski, P. G.: Bio-optical properties of the marine diazotrophic cyanobacteria Trichodesmium
spp. I. Absorption and photosynthetic action spectra, https://doi.org/10.4319/lo.1999.44.3.0618, 1999a.25
Subramaniam, A., Carpenter, E. J., and Falkowski, P. G.: Bio-optical properties of the marine diazotrophic cyanobacteria Trichodesmium
spp. II. A reflectance model for remote-sensing, https://doi.org/10.4319/lo.1999.44.3.0618, 1999b.
Subramaniam, A., Brown, C. W., Hood, R. R., Carpenter, E. J., and Capone, D. G.: Detecting Trichodesmium blooms in SeaWiFS imagery,
Deep-Sea Research Part II: Topical Studies in Oceanography, 49, 107–121, 2002.
Tenório, M. B., Dupouy, C., Rodier, M., and Neveux, J.: Trichodesmium and other planktonic cyanobacteria in New Caledonian waters (SW30
tropical Pacific) during an El Niño episode, Aquatic Microbial Ecology, 81, 219–241, 2018.
van Baalen, C. and Brown, R. M.: The ultrastructure of the marine blue green alga, Trichodesmium erythraeum, with special reference to the
cell wall, gas vacuoles, and cylindrical bodies, Archiv für Mikrobiologie, 69, 79–91, https://doi.org/10.1007/BF00408566, 1969.
Villareal, T. A. and Carpenter, E. J.: Buoyancy Regulation and the Potential for Vertical Migration in the Oceanic Cyanobacterium Tri-
chodesmium, Microbial Ecology, 45, 1–10, http://www.jstor.org/stable/4287673, 2003.35
Wang, M. and Shi, W.: Estimation of ocean contribution at the MODIS near-infrared wavelengths along the east coast of the U.S.: Two case
studies, Geophysical Research Letters, 32, https://doi.org/10.1029/2005GL022917, 2005.
17

Wang, M. and Shi, W.: The NIR-SWIR combined atmospheric correction approach for MODIS ocean color data processing, Optics Express,
15, 15 722, https://doi.org/10.1364/OE.15.015722, 2007.
Westberry, T. K., Siegel, D. A., and Subramaniam, A.: An improved bio-optical model for the remote sensing of Trichodesmium spp. blooms,
Journal of Geophysical Research: Oceans, 110, 1–11, 2005.
18
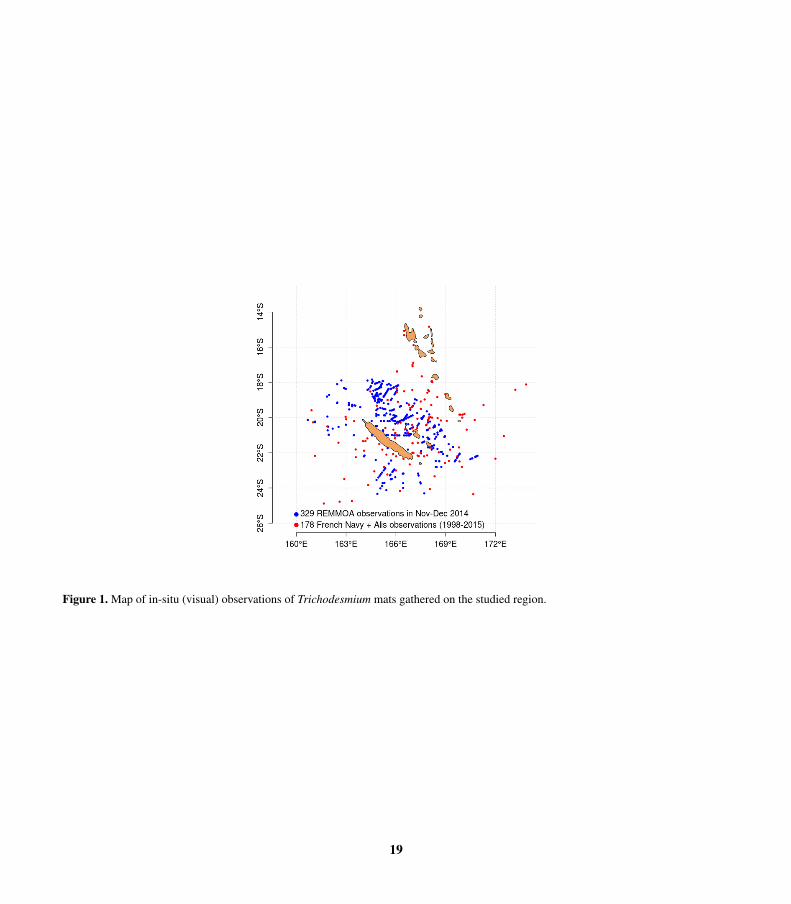
Figure 1. Map of in-situ (visual) observations of Trichodesmium mats gathered on the studied region.
19
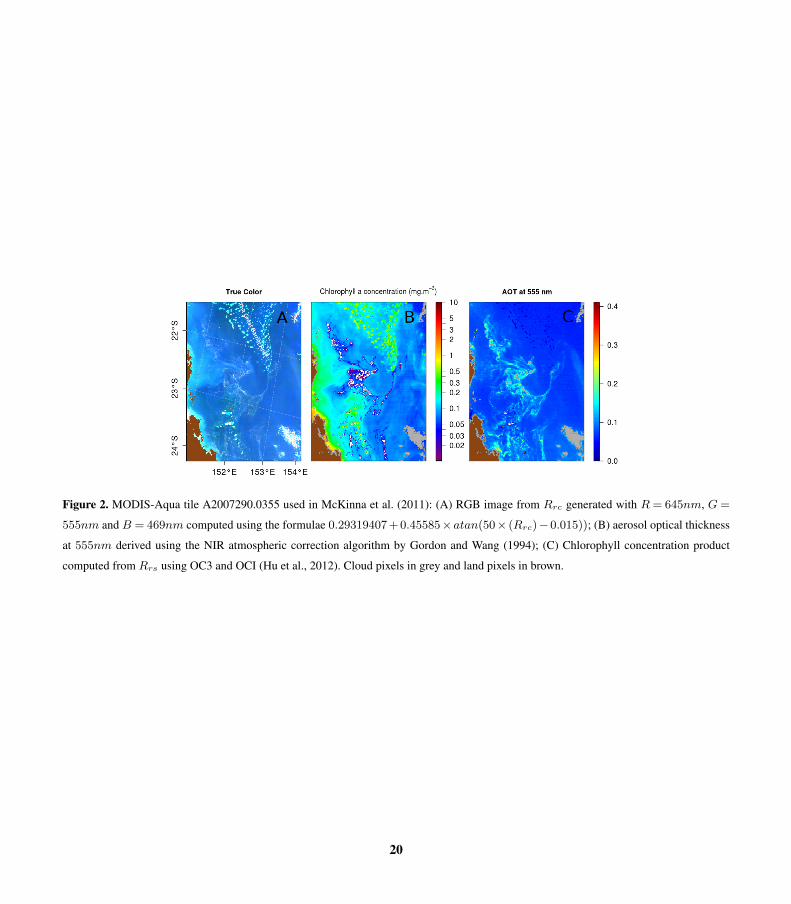
Figure 2. MODIS-Aqua tile A2007290.0355 used in McKinna et al. (2011): (A) RGB image from Rrc generated with R= 645nm, G=
555nm and B = 469nm computed using the formulae 0.29319407+0.45585×atan(50× (Rrc)−0.015)); (B) aerosol optical thickness
at 555nm derived using the NIR atmospheric correction algorithm by Gordon and Wang (1994); (C) Chlorophyll concentration product
computed from Rrs using OC3 and OCI (Hu et al., 2012). Cloud pixels in grey and land pixels in brown.
20
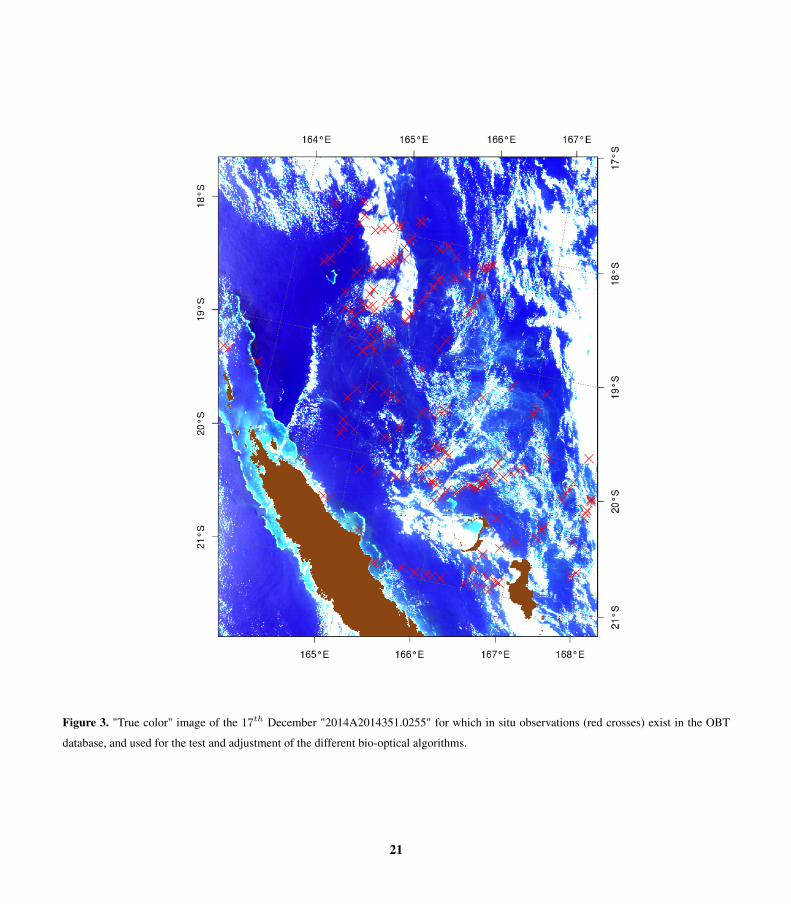
Figure 3. "True color" image of the 17th December "2014A2014351.0255" for which in situ observations (red crosses) exist in the OBT
database, and used for the test and adjustment of the different bio-optical algorithms.
21
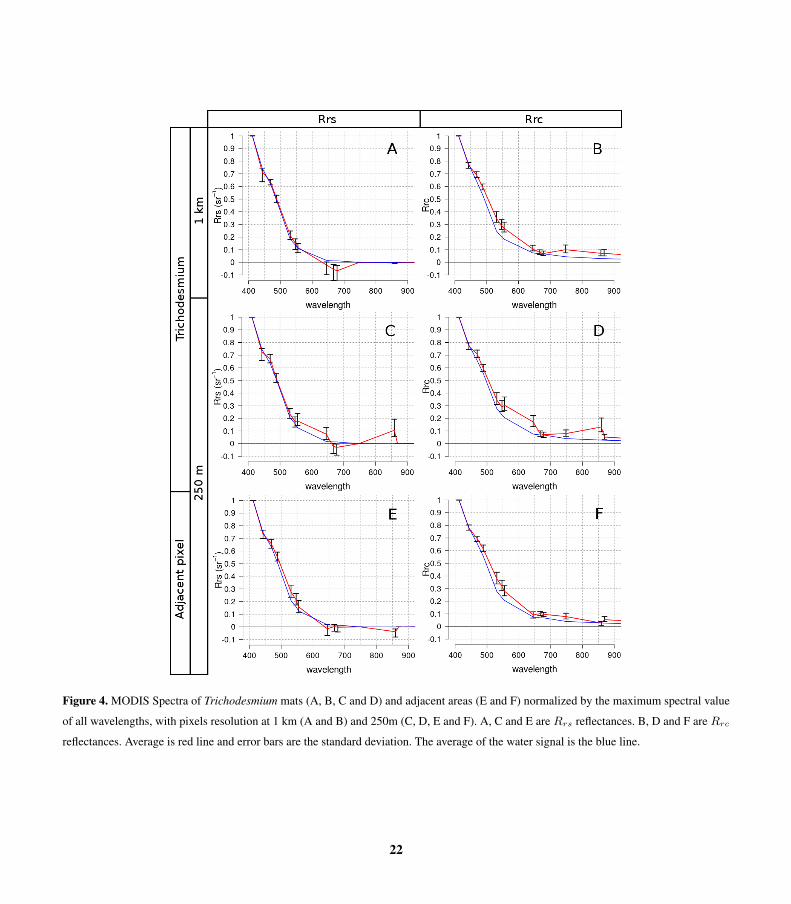
Figure 4. MODIS Spectra of Trichodesmium mats (A, B, C and D) and adjacent areas (E and F) normalized by the maximum spectral value
of all wavelengths, with pixels resolution at 1 km (A and B) and 250m (C, D, E and F). A, C and E are Rrs reflectances. B, D and F are Rrc
reflectances. Average is red line and error bars are the standard deviation. The average of the water signal is the blue line.
22
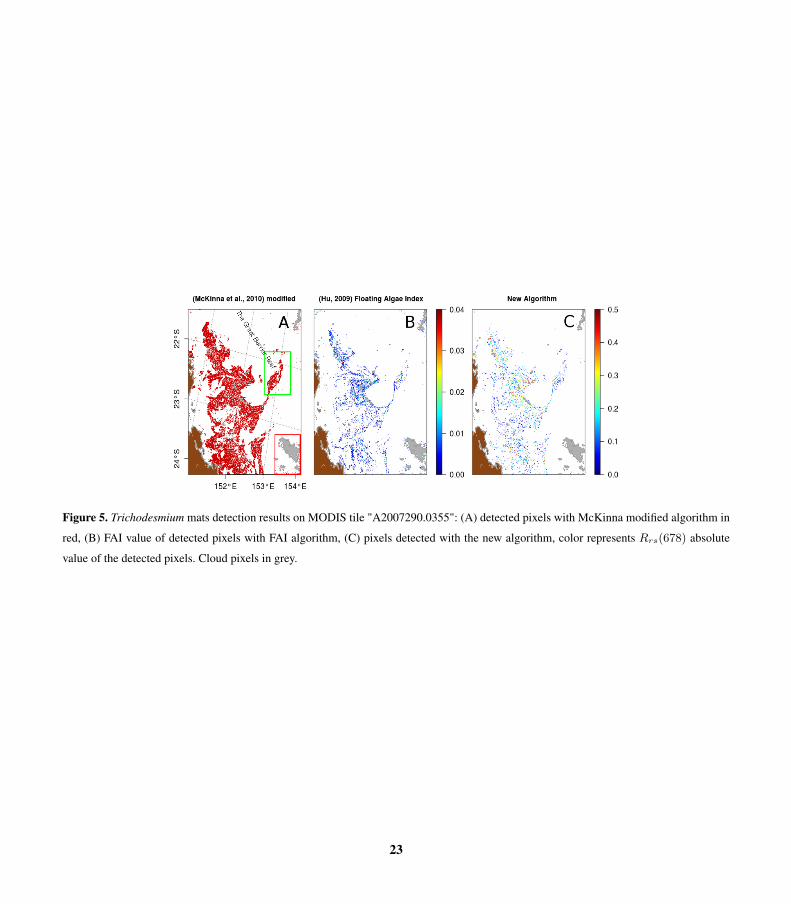
Figure 5. Trichodesmium mats detection results on MODIS tile "A2007290.0355": (A) detected pixels with McKinna modified algorithm in
red, (B) FAI value of detected pixels with FAI algorithm, (C) pixels detected with the new algorithm, color represents Rrs(678) absolute
value of the detected pixels. Cloud pixels in grey.
23

Figure 6. MODIS tile "A2007290.0355" zoomed of the red square area (24°S, Figure 5). Pixels resulting from a false positive detection of
(A) the McKinna modified algorithm, (B) FAI and (C) the new algorithm for the area in red on the Figure 5. Cloud pixels in grey.
24
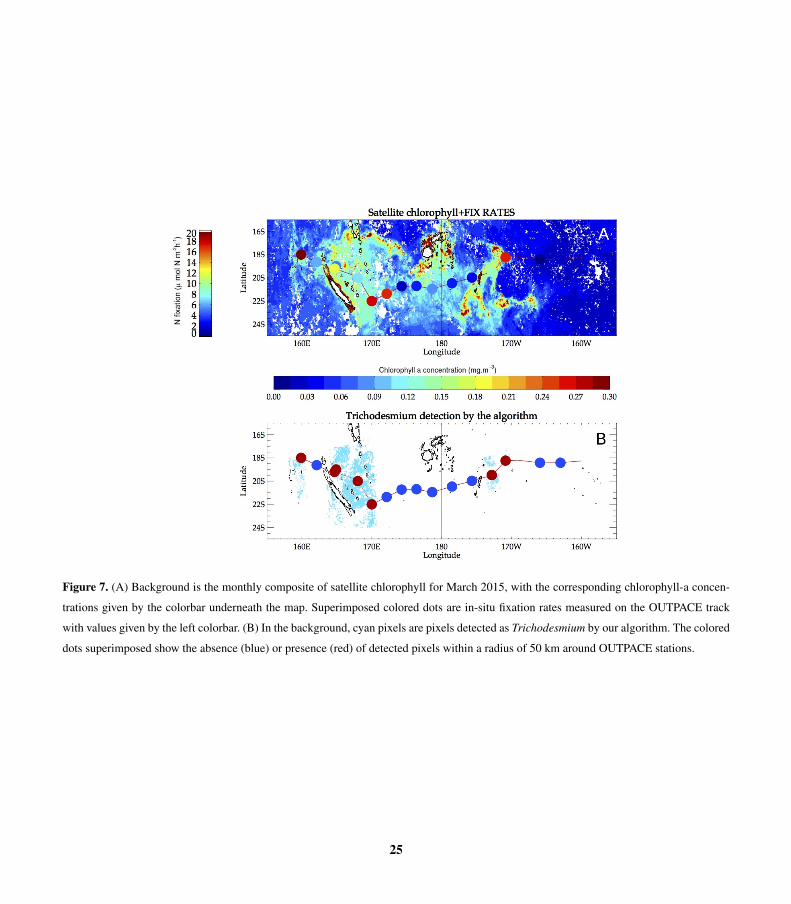
Figure 7. (A) Background is the monthly composite of satellite chlorophyll for March 2015, with the corresponding chlorophyll-a concen-
trations given by the colorbar underneath the map. Superimposed colored dots are in-situ fixation rates measured on the OUTPACE track
with values given by the left colorbar. (B) In the background, cyan pixels are pixels detected as Trichodesmium by our algorithm. The colored
dots superimposed show the absence (blue) or presence (red) of detected pixels within a radius of 50 km around OUTPACE stations.
25
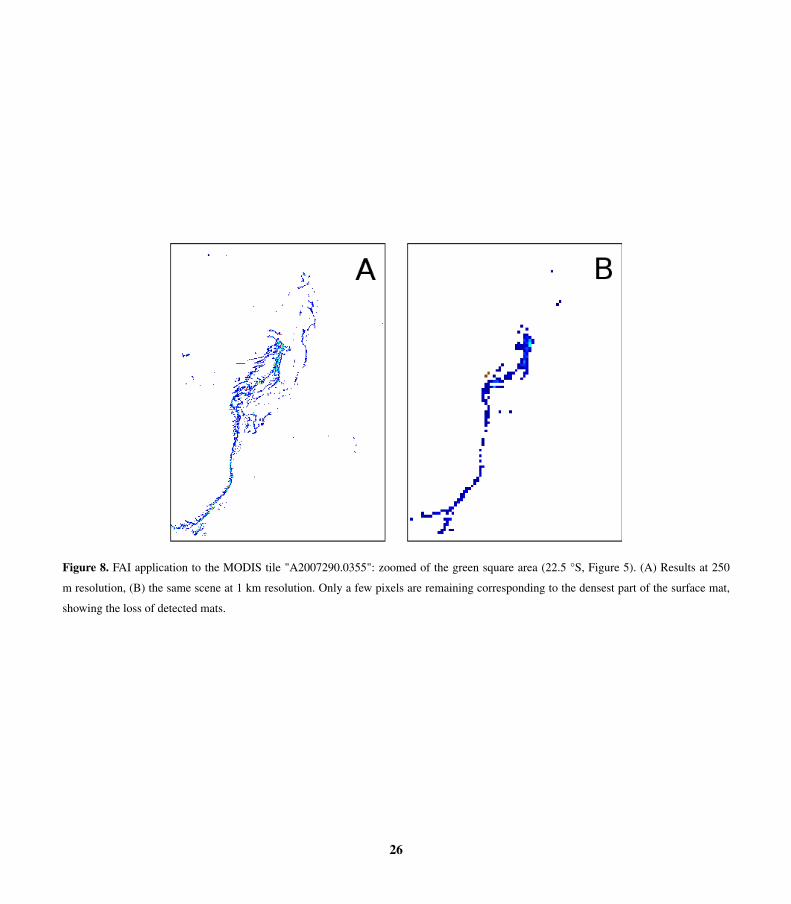
Figure 8. FAI application to the MODIS tile "A2007290.0355": zoomed of the green square area (22.5 °S, Figure 5). (A) Results at 250
m resolution, (B) the same scene at 1 km resolution. Only a few pixels are remaining corresponding to the densest part of the surface mat,
showing the loss of detected mats.
26
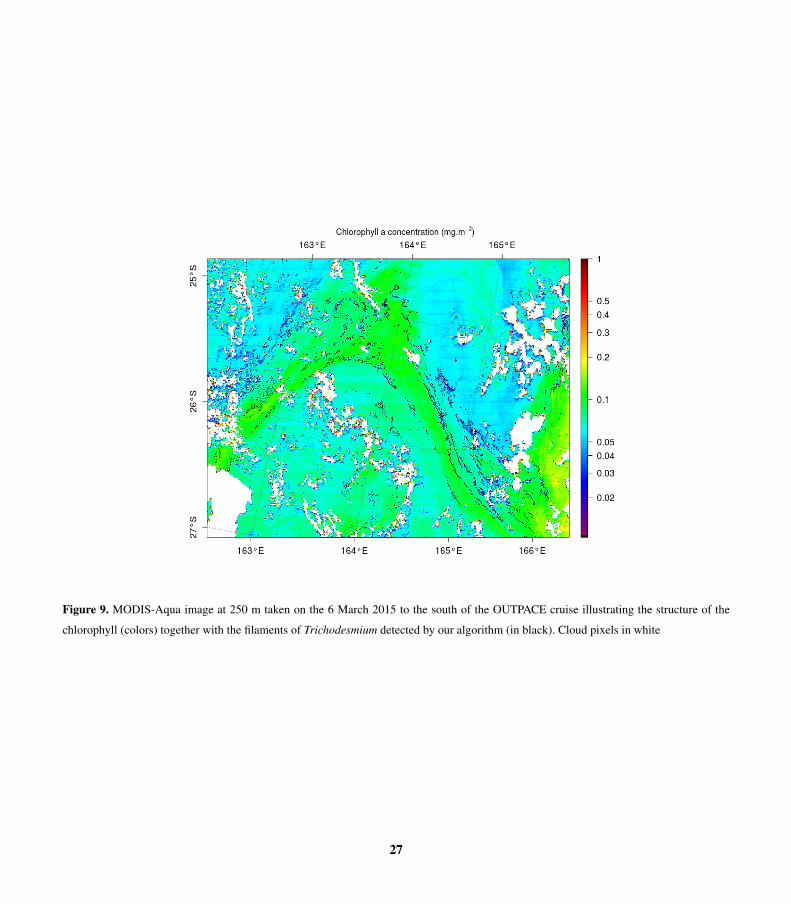
Figure 9. MODIS-Aqua image at 250 m taken on the 6 March 2015 to the south of the OUTPACE cruise illustrating the structure of the
chlorophyll (colors) together with the filaments of Trichodesmium detected by our algorithm (in black). Cloud pixels in white
27
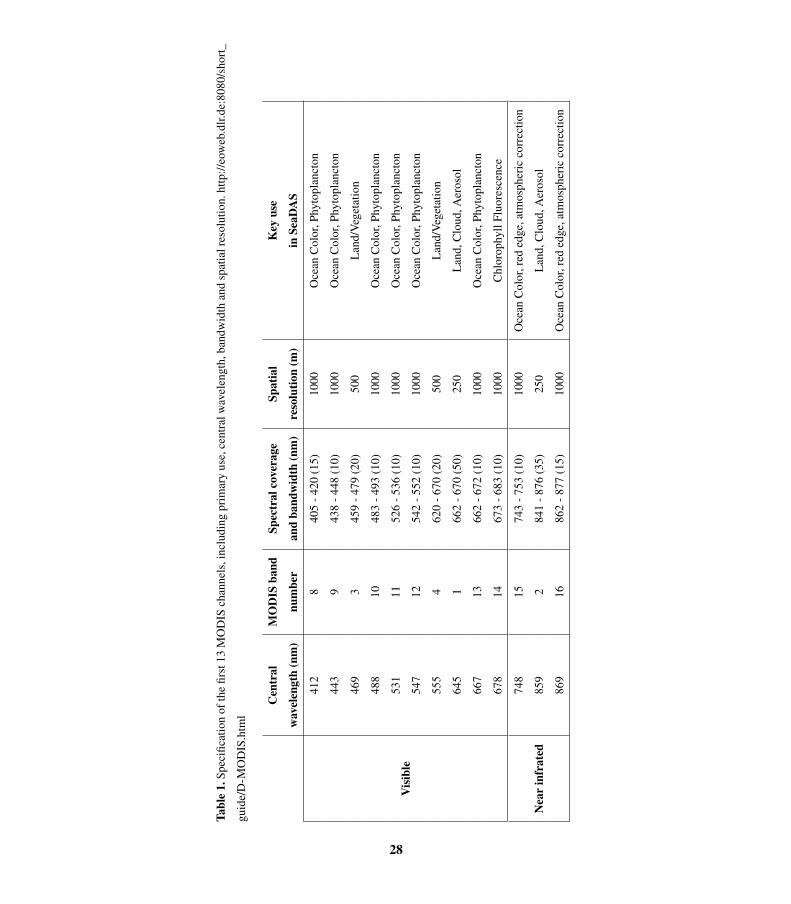
Tabl
e1.
Spec
ifica
tion
ofth
efir
st13
MO
DIS
chan
nels
,inc
ludi
ngpr
imar
yus
e,ce
ntra
lwav
elen
gth,
band
wid
than
dsp
atia
lres
olut
ion.
http
://eo
web
.dlr.
de:8
080/
shor
t_
guid
e/D
-MO
DIS
.htm
l
Cen
tral
wav
elen
gth
(nm
)
MO
DIS
band
num
ber
Spec
tral
cove
rage
and
band
wid
th(n
m)
Spat
ial
reso
lutio
n(m
)
Key
use
inSe
aDA
S
412
840
5-4
20(1
5)10
00O
cean
Col
or,P
hyto
plan
cton
443
943
8-4
48(1
0)10
00O
cean
Col
or,P
hyto
plan
cton
469
345
9-4
79(2
0)50
0L
and/
Veg
etat
ion
488
1048
3-4
93(1
0)10
00O
cean
Col
or,P
hyto
plan
cton
531
1152
6-5
36(1
0)10
00O
cean
Col
or,P
hyto
plan
cton
547
1254
2-5
52(1
0)10
00O
cean
Col
or,P
hyto
plan
cton
555
462
0-6
70(2
0)50
0L
and/
Veg
etat
ion
645
166
2-6
70(5
0)25
0L
and,
Clo
ud,A
eros
ol
667
1366
2-6
72(1
0)10
00O
cean
Col
or,P
hyto
plan
cton
Vis
ible
678
1467
3-6
83(1
0)10
00C
hlor
ophy
llFl
uore
scen
ce
748
1574
3-7
53(1
0)10
00O
cean
Col
or,r
eded
ge,a
tmos
pher
icco
rrec
tion
859
284
1-8
76(3
5)25
0L
and,
Clo
ud,A
eros
olN
ear
infr
ated
869
1686
2-8
77(1
5)10
00O
cean
Col
or,r
eded
ge,a
tmos
pher
icco
rrec
tion
28
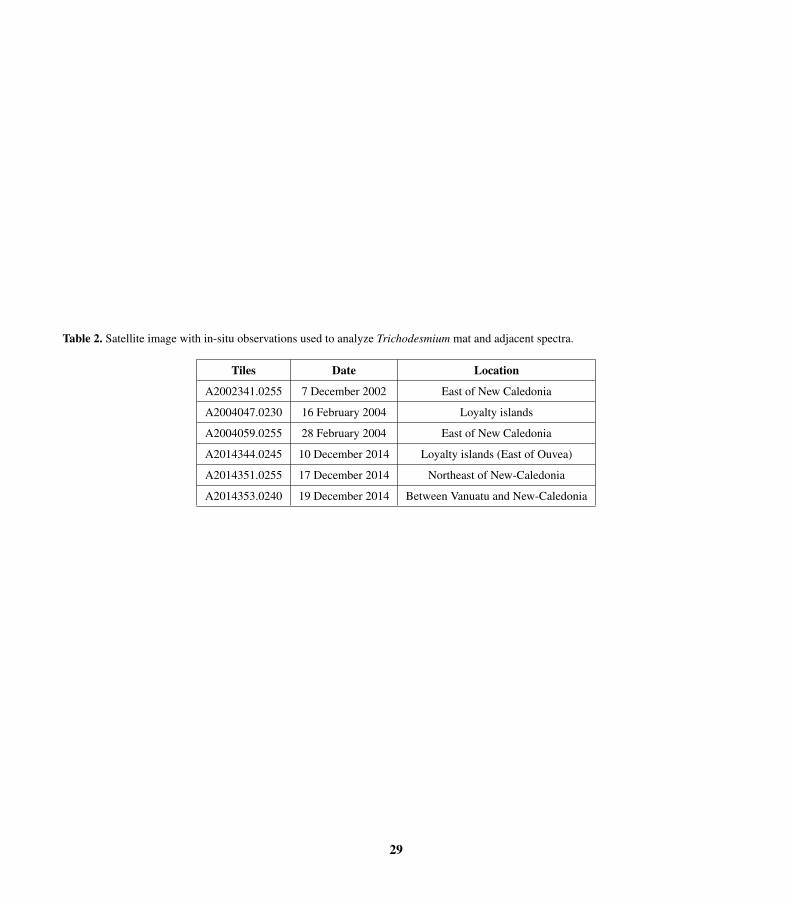
Table 2. Satellite image with in-situ observations used to analyze Trichodesmium mat and adjacent spectra.
Tiles Date Location
A2002341.0255 7 December 2002 East of New Caledonia
A2004047.0230 16 February 2004 Loyalty islands
A2004059.0255 28 February 2004 East of New Caledonia
A2014344.0245 10 December 2014 Loyalty islands (East of Ouvea)
A2014351.0255 17 December 2014 Northeast of New-Caledonia
A2014353.0240 19 December 2014 Between Vanuatu and New-Caledonia
29