remote sensing objectives of coastal managers
TRANSCRIPT

Remote Sensing Handbook for Tropical Coastal Management
Chapter 2. Remote Sensing Objectives of Coastal Managers Citation: Mumby, P.J., Edwards, A.J. (2000) Remote sensing objectives of coastal managers, pp. 31‐39, in: Green, E.P., Mumby, P.J., Edwards, A.J., Clark, C.D., (Ed. A.J. Edwards). Remote Sensing Handbook for Tropical Coastal Management. Coastal Management Sourcebooks 3, UNESCO, Paris.

Introduction
Remote sensing is used to address a wide variety of man-agement and scientific issues in the coastal zone. Thischapter aims to summarise the applications of remotesensing in a tropical coastal management context and, inso doing, provide practitioners with a practical perspec-tive on which management objectives might feasibly beaddressed using remote sensing.
Two approaches are taken to summarise the applica-tions of remote sensing. First, a summary of coastal man-agement applications is given based on a review ofpublished literature (Green et al. 1996). However, since agreat deal of remote sensing work is not published, onehundred and fifty coastal managers and scientists wereasked to complete a questionnaire. The questionnaireasked for respondents’ opinions on four key issues:
1. Which applications have remote sensing actually beenused for (i.e. what are the ‘real’as opposed to ‘potential’applications)?
2. What is the relative importance of different types ofinformation on coastal habitats?
3. To what degree is remote sensing considered a cost-effective tool?
4. What are the main hindrances to remote sensing?
The results of the questionnaire provide a second per-spective on the current utilisation of remote sensing fortropical coastal management. We would like to expressour thanks to the 60 individuals who took the time toreturn our questionnaire.
Remote sensing objectives –perspectives from the publishedliterature
The objectives of using remote sensing could be groupedinto 14 primary categories (Table 2.1). Each of these isdiscussed briefly overleaf with examples although many
Remote Sensing Objectives of Coastal Managers 31
Summary Remote sensing has been applied to many management and research issues. The most
common objectives include the production of coastal habitat maps and the identification of change in
habitat cover, usually as a result of development. Monitoring of mangrove loss and aquaculture devel-
opment is a particular concern.
Sixty coastal managers and scientists evaluated the usefulness of various types of information on
coastal ecosystems. The overall response for coral and seagrass ecosystems was that all types of infor-
mation are more or less equally useful and that specific information requirements are dependent on
study or management objectives. However, for mangrove ecosystems, users considered that the most
important information was (i) the location of boundaries, (ii) areas of clearance and (iii) mangrove den-
sity. Although potentially very useful features of mangroves (such as percentage canopy closure and leaf
area index) can be fairly readily mapped using remotely sensed imagery, these were considered of lower
priority.
The need for managers to consider carefully the precise objectives of using remote sensing and to
explore fully alternatives in terms of costs and effectiveness is stressed.
2Remote Sensing Objectives of Coastal Managers

32 Remote Sensing Handbook for Tropical Coastal Management
Table 2.1 Summary of remote sensing applications for tropical coastal zone management listing the number of papers reviewed in each category. API = Aerial Photographic Interpretation. For actual citations see Green et al. (1996).
Management Use Landsat Landsat SPOT SPOT Airborne APIMSS TM XS XP MSS
1. CARTOGRAPHIC BASE MAPPING 2 1 2 1 2
2. RESOURCE INVENTORY AND MAPPING
Coral reef 11 7 7 1 9Seagrass 3 13 7 2 2Mangrove 6 6 6 1Algae 4 2
3. CHANGE DETECTION
Tidal flats/salt affected land 1 1Extent of cyclone damage (reefs) 3Change in reef cover 1 2 1Change in seagrass cover 1 1Deforestation of mangrove 5 3 3
4. BASELINE ENVIRONMENTAL MONITORING
Coastal fisheries habitat 2 4Seasonal variation in reefal cover 3Sea-level change 1
5. ENVIRONMENTAL SENSITIVITY MAPPING
Exposure (storm vulnerability) 1Site assessment for marine parks 1Mangrove conservation areas 2 1Planning snorkel activity 1Oil spill – sensitive mangrove areas 2
6. MAPPING BOUNDARIES OF MANAGEMENT ZONES 2 2 1 1
7. BATHYMETRIC CHARTING
Mapping shipping hazards 2 2 1 1Mapping transport corridors 2Update/augment existing charts 12 3 5Planning hydrographic surveys 3 2Mapping sediment accumulation/loss 2Help interpretation of reef features 2 1
8. PLANNING FIELD SURVEYS
Coral reef 2 1 1Seagrass 1 1Mangrove 1Algae 1 1
9. PRODUCTIVITY MEASUREMENT
Phytoplankton chlorophyll-a 1 1Biomass of seagrass (g.m-2) 2
10. STOCK ASSESSMENT
Biomass of Trochus niloticus 2
11. AQUACULTURE MANAGEMENT
Inventory of aquaculture sites 5Shrimp aquaculture site selection 2 3Aid to the location of fish cages 1Monitoring pearl culture activity 3Site assessment for mariculture 2 1 1
12. EROSION AND SHORELINE DRIFT 1 2 4
13. IDENTIFICATION OF WATER BODIES / CIRCULATION 2 1 1
14. LOCATION OF SUSPENDED SEDIMENT PLUMES 5 2 2 1

of the applications are discussed in more detail in suc-ceeding chapters.
1. Cartographic base mapping
Cartographic mapping is primarily concerned with theaccurate delineation of land masses and water ways andis usually based on stereoscopic pairs of aerial pho-tographs, each of which have sufficient ground control toproduce a detailed and accurate map of the area of inter-est. Unfortunately, these techniques may be unsuitable formapping offshore islands because obtaining adequateground control is likely to be problematical (Friel andHaddad 1992, Mumby et al. 1995), and if the area to bemapped is large, it may be too expensive to use aerial pho-tography (Jupp et al. 1981). Satellite images cover muchlarger areas than aerial photographs and require much lessground control per unit area and so can be employed as analternative to conventional cartographic techniques. InAustralia, 24 Landsat MSS scenes were used to map theentire Great Barrier Reef Marine Park with a root meansquare accuracy of 64 m. This level of accuracy is con-sidered to be satisfactory for producing maps at a scale of1:250,000 (Jupp et al. 1985, Kenchington and Claasen1988).
2. Resource inventory and mapping
Of the papers reviewed, 74% of applications were associ-ated with assessing coastal resources and most of these(37%) concern their general inventory and mapping. Interms of coastal management, the fate of a resource inven-tory is not always clear. The resource map may be used toidentify representative areas of distinct habitats whichmay be selected for protection (e.g. McNeill 1994) orused to demarcate and map the boundaries to manage-ment zones (Kenchington and Claasen 1988, Danaher andSmith 1988). Perhaps more commonly, the resource mapmay simply serve as background materials for a manage-ment plan. Provided the spatial and classification accu-racy of the map are known, it can serve as a valuablebaseline for future comparisons. For further details, referto chapters on specific ecosystems (Part 3). Landsat TMappeared the most commonly used sensor in this category(34%), closely followed by SPOT XS and Landsat MSS(25% and 23% respectively).
3. Change detection
Intuitively, remote sensing appears ideally suited to thetask of assessing changes in the coastal environment. Forexample, Landsat TM imagery is theoretically availablefor all tropical areas at time intervals of 16 days (seeChapter 3). In theory then, future changes in marine
resources can be monitored almost twice-monthly or his-toric changes assessed by reference to archived imagery.In practice, however, change detection is complicated byseveral issues which are discussed throughout this book.The main limitations are the cost of obtaining multiplesets of imagery (Part 6), the need to standardise imagesfor different atmospheric conditions (Chapter 7), cloudcover, (Chapters 3 and 5), the sensors’ ability to detectchange reliably, which is partly a function of pixel size(Chapter 3), and the fact that most satellite data are notavailable in real time, which can create a delay between(say) a major impact and acquisition of new imagery (seeChapter 5).
There have been some successful change detectionstudies, such as the impact of tropical cyclones on reefs ofthe Aitutaki atoll, Cook Islands (Loubersac et al. 1989),the decline of dense coral reefs over seven years inBahrain (Zainal et al. 1993) and the extent of mangrovedeforestation in the Pulang Redang Marine Park,Malaysia (Ibrahim and Yosuh 1992). Hopley and Catt(1989) have demonstrated the potential application ofhigh resolution digital aerial photography for assessingthe recovery of shallow reef flats from predation by thecrown of thorns starfish (Acanthaster planci). Changedetection analysis has become increasingly viable withthe advent of satellite-borne synthetic aperture radar(SAR), which can acquire data on the Earth’s surfacedespite the presence of clouds. However, SAR cannotpenetrate water so its use is largely restricted to change onland (e.g. mangrove loss).
4. Baseline environmental monitoring
The success of remote sensing in providing baseline envi-ronmental monitoring seems to be restricted to large scalestudies which generally have not been performed on aroutine basis. For example, several papers clearly outlinethe potential of using low-altitude colour and infra-redaerial photography for mapping coral and algal cover(Catt and Hopley 1988, Hopley and Catt 1989, Tham-rongnawasawat and Catt 1994). At this stage, however, itseems that the use of these techniques for routine man-agement is confined to the Surin Marine National Park inThailand (see Thamrongnawasawat and Hopley 1995).
5. Environmental sensitivity mapping
Several of the remote sensing studies reviewed in Table2.1 have extremely clear objectives which stem from aparticular management requirement. Biña et al. (1980) setout the selection criteria for mangrove conservation areasin the Philippines. Criteria which were detectable usingLandsat MSS included locations (i) near a river mouth,(ii) near urban centres, (iii) offering a natural protection
Remote Sensing Objectives of Coastal Managers 33

from hazards, (iv) comprising primary dense young forestof greater than 10% small islands. Similarly, Biña (1982)described how Landsat MSS products were used to high-light potential sites for marine reserve status. The selec-tion criteria included: (i) clusters of reefs that occurredwithin 300 km2, (ii) atolls and fringing reefs greater than10 km in length, (iii) a diverse range of habitats bothwithin and adjacent to reefs, and (iv) areas not situatednear potential threats.
In the Surin Marine National Park (Thailand) efforts arecurrently under way to manage snorkelling activity usinglarge scale digital aerial photography (Thamrongnawa-sawat and Hopley 1995). Analysis of these photographsreveals the presence of living corals and areas of dead coraland sand. The authors suggest that such data will allowplanners to lay interpretative snorkelling routes for touristsand estimate the reefs' carrying capacity for snorkellingactivity based on the ratio of massive to branching coral(assuming that massive corals are less vulnerable tosnorkelling-induced damage).
Environmental sensitivity mapping has also been car-ried out for mangrove ecosystems. By using mangrovecanopy cover as a surrogate measure of tree density, SPOTdata were used to map mangrove density in Florida (Jensenet al. 1991). The authors suggest that such information willbe important in identifying which mangrove areas are mostsusceptible to oil spill (assuming that oil dispersal isinversely proportional to tree density).
6. Mapping boundaries of management zones
Maps of coastal habitats have been used to demarcate theboundaries of management zones (Kenchington andClaasen 1988, Danaher and Smith 1988). This may includethe delineation of fisheries-exclusion zones, marine parkareas and so on.
7. Bathymetric charting
A great deal has been published on the application ofremote sensing techniques for mapping bathymetry.Chapter 15 discusses the theory and methods behindbathymetric mapping but the fundamental principle isdescribed here. Different wavelengths of light penetratewater to varying degrees: red light attenuates rapidly inwater and does not penetrate deeper than 5 m or so,whereas blue light penetrates much further and, in clearwater, the seabed will reflect enough light to be detected bya satellite sensor even when the depth of water approaches30 m. The depth of penetration depends on the wavelengthof light and the water turbidity. Suspended sediment parti-cles, phytoplankton and dissolved organic compounds willall affect the depth of penetration because they scatter andabsorb light. Taking a Landsat MSS example from the
Great Barrier Reef, it is known that green light (band 1,0.50–0.60 µm) will penetrate to a maximum depth of about15 m, red light (band 2, 0.60–0.70 µm) to 5 m, near infra-red (band 3, 0.70–0.80 µm) to 0.5 m and infra-red (band 4,0.80–1.1 µm) is fully absorbed (Jupp 1988). Appropriateimage processing enables the analyst to derive a ‘depth ofpenetration’ image which is segmented into depth zones.Each zone represents a region in which light is reflected inone band but not the next. For example, if light is detectedin band 2 but not in band 1, the depth should lie between5 m and 15 m. Using this approach, three zones can bederived from a Landsat MSS image: 5–15 m, 0.5–5 m and0–0.5 m (zero being the surface). Taken a stage further,each depth zone can be subdivided into discrete depth con-tours. This is achieved using a small amount of field workand assumptions about the homogeneity of substrate,water quality and atmospheric conditions (see Jupp 1988).Sensors with a greater number of spectral bands willclearly allow the analyst to generate a greater number ofdepth zones (e.g. Airborne MSS, see Danaher and Cottrell1987). Chapter 15 explains several of these methods inmore detail.
Depth of penetration type images have been used toaugment existing charts (Bullard 1983, Pirazolli 1985),assist in interpreting reef features (Jupp et al. 1985) andmap ship transportation corridors (Kuchler et al. 1986).However, they have not been used as a primary source ofbathymetric data for navigational purposes (e.g. mappingshipping hazards). The major limitation is inadequatespatial resolution. For example, an emergent coral out-crop that is much smaller than the sensor pixel willremain undetected and therefore the image is not detailedenough for safe navigation. In addition, where the sub-stratum is variable there may be too much uncertaintyattached to specific depth measurements for their safe usein navigation.
Bathymetric measurements are feasible in areas of clearwater less than 20 m deep with a uniform substratum. Ifthese conditions are met then bathymetry can be measuredto an accuracy of about ± 10% (Warne 1978, Danaher andSmith 1987, Lantieri 1988). If there is reason to believethat there are ephemeral patches of turbid water, imagesshould be taken at different times of year, with little cloud,calm seas and a high sun elevation (UNESCO 1986).
Radar images may also be used to map depth changes.Water is an excellent reflector of microwaves and so thecharacteristics of a radar image are controlled by the natureof the sea surface. Variations in centimetre-scale rough-ness are strongly correlated with changes in water depth ofup to approximately 100 m but only if a significant currentis flowing across a fairly smooth seabed. SAR imagery(Chapter 3) has provided information on bathymetry,although the highly specific conditions of sea state and cur-rents (Lodge 1983, Hesselmans et al. 1994) necessary for
34 Remote Sensing Handbook for Tropical Coastal Management

such analysis have prevented general application.Surprisingly, Landsat MSS was the most popular sen-
sor for this type of study with 55% of bathymetric studiesusing it, despite its relatively poor spatial resolution andlimited water penetration.
8. Planning field surveys
Remote sensing products can play an important role inplanning detailed field studies, particularly where chartsor maps are poor. Biña et al. (1980) used Landsat MSSimagery of the Philippines to plan detailed aerial surveysof intact mangrove areas. The MSS data revealed whichareas of mangrove had already been denuded and allowedthe survey planners to target the surveys with an estimated50% saving in fuel and air time. Benny and Dawson(1983) suggested that Landsat products would be a cost-effective way to plan hydrographic surveys in shallowwater (< 30 m depth).
9. Productivity measurement
Armstrong (1993) used Landsat TM to map seagrass bio-mass in the Bahamas and Mumby et al. (1997) conductedsimilar tests for a variety of sensors in the Turks andCaicos Islands (Chapter 16). Greenway and Fry (1988)made anecdotal remarks relating the colour of aerial photographs and airborne MSS data to seagrass biomassbut, unfortunately, the relationship was not assessedquantitatively.
10. Stock assessment
Several authors have attempted to conduct stock assess-ment of finfish and shellfish, a subject that is reviewed indetail in Chapter 18. For example, Bour (1989) estimatedthe biomass of the commercial mollusc Trochus niloticusin New Caledonia. This was essentially a two-stageprocess. Firstly, field data were used to identify the den-sity of Trochus in various marine habitats. Secondly, sincethese habitats could be mapped using satellite imagery (inthis case, SPOT XS), an estimate of total biomass wasmade by multiplying Trochus density (and thus biomass)by the total area of the habitat.
11. Aquaculture management
Over the past decade, tropical shrimp production hasdoubled every two to three years, fuelling a progressivesearch for new aquaculture sites (Meaden and Kapetsky1991). SPOT imagery has been used to satisfy the fol-lowing site selection criteria for shrimp ponds (Louber-sac and Populus 1986): location, bathymetry, possiblepond shape and pattern, site area, potential for expansion,
access routes, practicalities of pumping seawater and theidentification of possible sources of pollution. This typeof information has been central to the development ofshrimp farming in New Caledonia (IFREMER 1987).SPOT data have also been used successfully to monitoron-going aquaculture activity. For example, active(water-filled) ponds can be easily distinguished fromredundant (empty) ponds (IFREMER 1987, Populus andLantieri 1991). Pearl oyster (Pinctada margaratifera)beds in French Polynesia can be distinguished fromundisturbed sea bed (Hauti 1990, Chenon et al. 1990).SPOT XS was the most widely used sensor (67%) foraquaculture applications.
12. Erosion and longshore drift
Several authors have attempted to use satellite imagery toexamine coastal erosion (Welby 1978) or longshore drift(Kunte and Wagle 1993). Since both applications involvedetecting change, these studies are subjected to the limi-tations outlined earlier such as pixel size and temporalresolution. For example, the minimum shift in shorelinethat Landsat TM could detect would be in the order of30 m (1 pixel width) and when geometric correctionerrors are considered (Chapter 6), the practical detectablechange might be as large as several pixel widths (about100 m). However, Danaher and Smith (1988) overcamesome of these problems by using a high resolution air-borne scanner (pixel size 2.5 m) to measure bathymetryof the Gold Coast, Australia. The results were used tounderstand the dynamics of sand accumulation/lossalthough the authors concede that the use of an airbornescanner was expensive.
13. Identification of water bodies / water circulation
Most of the published oceanographic applications ofremote sensing (e.g. measurement of sea surface temper-ature and chlorophyll concentration) are confined tooceanic systems and temperate coastal areas. The statusand relevance of these studies to coastal management arereviewed in Chapter 14.
14. Location of suspended sediment plumes
Chapter 14 reviews the use of remote sensing for estimat-ing suspended sediment concentration but we present asingle case study here for illustrative purposes.
Enhanced discharge of suspended sediment plumesdue to excessive land clearance is one of the major threatsto coral reefs world-wide (Wilkinson 1992). In manage-ment terms, it is useful to identify the pathways of coastalsuspended sediments and land based run-off, since thiswill highlight regions in which particulate matter or
Remote Sensing Objectives of Coastal Managers 35
solutes may directly influence the community. This wascarried out in a pro-active sense using Landsat MSS in thePhilippines where mining activities were terminatedbecause mining-induced sediments were found to bereaching coral reefs (Biña, 1982).
Remote sensing objectives – a survey ofcoastal managers and scientists
Aims of the questionnaire
The questionnaire was designed to assess the current util-isation of remote sensing for tropical coastal resourcesassessment and management. The specific objectives ofthe questionnaire were to:
1. identify the actual (as opposed to potential) uses ofremote sensing,
2. assess the relative importance of different types ofinformation on coastal habitats,
3. ascertain the degree to which remote sensing was con-sidered cost-effective, and
4. identify the main hindrances to remote sensing.
The results of the first two objectives are presented inthis chapter. Cost-effectiveness (objective 3) is discussedin Part 6 and hindrances to remote sensing (objective 4)are outlined in Chapter 3.
Respondents to the questionnaire
A questionnaire was completed by 60 managers andscientists throughout the world including the Caribbean,Central America, South America, the USA, the Mediter-ranean, the Indian Ocean, South East Asia, Micronesia,Australia, West Africa and East Africa. Of 60 respondents,28 worked for government departments, 23 for educa-
tional/research institutes, 5 for non-governmental organ-isations or private companies and 4 for the United Nations(UNEP, UNDP, UNESCO).
A broad spectrum of management and research man-dates were represented (Table 2.2) although the responsi-bilities of many individuals fell under several categories,usually owing to an integrated approach to coastal zonemanagement and research. Approximately half (29) ofrespondents considered themselves to be primarilyresearch-orientated (scientists) and the other half (31)described themselves as coastal managers.
Actual uses of remote sensing by coastal managersand scientists
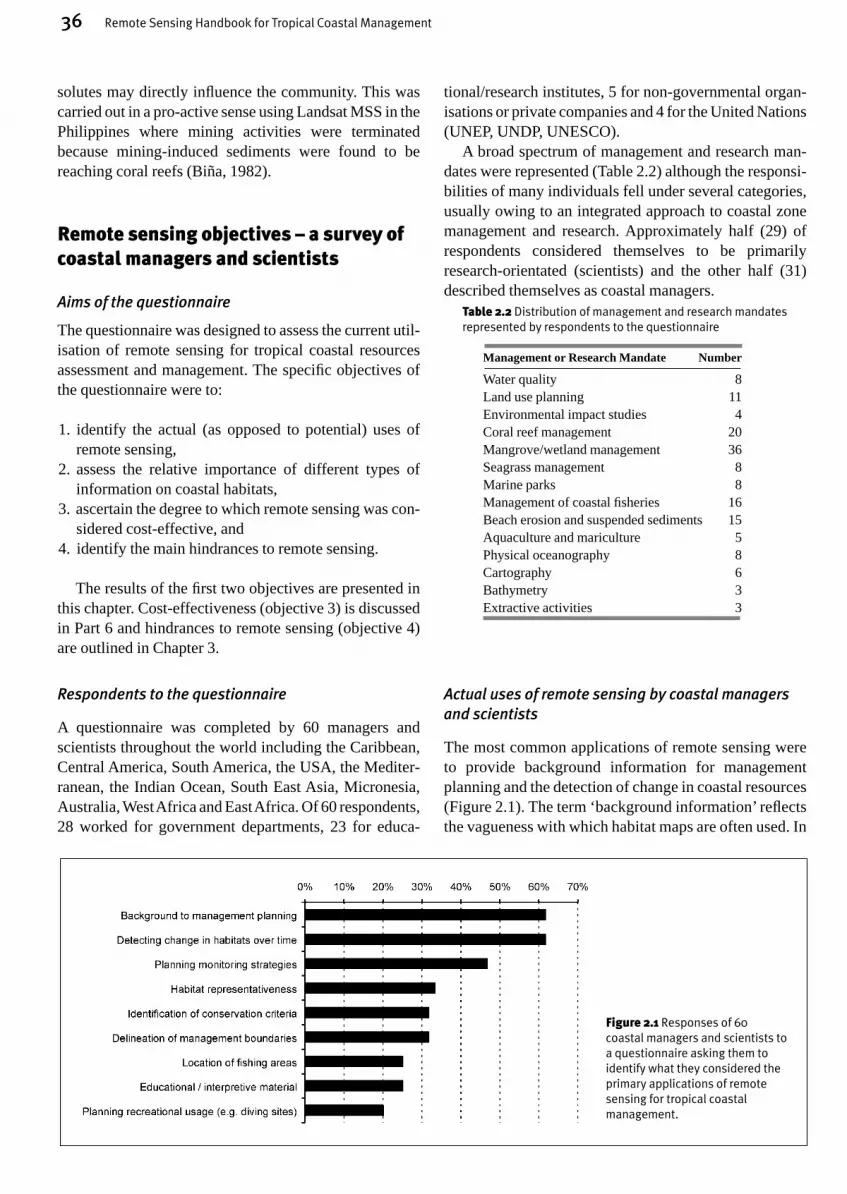
The most common applications of remote sensing wereto provide background information for managementplanning and the detection of change in coastal resources(Figure 2.1). The term ‘background information’ reflectsthe vagueness with which habitat maps are often used. In
36 Remote Sensing Handbook for Tropical Coastal Management
Figure 2.1 Responses of 60coastal managers and scientists toa questionnaire asking them toidentify what they considered theprimary applications of remotesensing for tropical coastalmanagement.
Table 2.2 Distribution of management and research mandatesrepresented by respondents to the questionnaire
Management or Research Mandate Number
Water quality 8Land use planning 11Environmental impact studies 4Coral reef management 20Mangrove/wetland management 36Seagrass management 8Marine parks 8Management of coastal fisheries 16Beach erosion and suspended sediments 15Aquaculture and mariculture 5Physical oceanography 8Cartography 6Bathymetry 3Extractive activities 3

many cases, the habitat map simply provides the locationof coastal habitats but such information might not beused explicitly (e.g. to identify representative habitats forinclusion in marine parks). This result mirrors that of theliterature review above.
Approximately 70% of the respondents who usedremote sensing to detect changes in coastal areas wereconcerned with mangrove assessment and/or shrimpfarming (Plate 3). Maps of mangrove are used to identifydeforested areas such as shrimp farms and urban expan-sions. This does not necessarily suggest that a timesequence of images has been used to identify changes incoastal resources because deforested areas can usually beidentified visually in a single image due to the contrastagainst forested areas and the presence of linear bound-aries (e.g. near roads and settlements).
Almost half of the respondents used habitat maps toplan monitoring strategies (e.g. locating seagrass bedsfor a seagrass monitoring programme). Habitat mapswere also used to provide information on conservationcriteria, such as habitat representativeness, rarity anddiversity.
Respondents to the questionnaire highlighted the useof habitat maps for educational and interpretative ma-terial. This application did not arise in the literaturereview and marks the importance of habitat maps to awide range of users including owners of small boats,recreational fishermen and tourists.
Informational requirements of coastal managers and scientists
Respondents were asked to prioritise the usefulness ofvarious types of information on coastal resources for coralreef, seagrass and mangrove ecosystems. The intervalscale for ‘usefulness’ was: U (unknown), 1 (poor), 2(fairly useful), 3 (moderately useful) and 4 (extremelyuseful). The results are summarised hereafter for eachtype of ecosystem. In each case, Kruskal–Wallis tests (Zar1996) were used to identify significant differences in theusefulness of various types of information (e.g. whetherlive coral cover was considered to be significantly moreuseful than coral reef boundaries). The analyses were notconducted separately for coastal managers and scientistsbecause the distinction is somewhat arbitrary and wewished to represent the views of a broad range of remotesensing users.
Coral reefsFive types of information on coral reefs were listed in thequestionnaire (Table 2.3). In increasing order of detail(and difficulty to obtain using remote sensing) these were:coral reef boundaries, geomorphological zones of coralreefs, coral density, individual coral colonies and live
coral cover.Table 2.3 Usefulness of various types of coral reef information torespondents of questionnaire.
Objectives Mean usefulnessNumeric Interpreted
Coral reef boundaries 2.7 fair–moderateGeomorphological zones 2.5 fair–moderateCoral density 2.9 moderateCoral colonies 2.7 fair–moderateLive coral cover 3.1 moderate
The mean usefulness of these data ranged from 2.5(geomorphology) to 3.1 (live coral cover) – i.e. fairly tomoderately useful. Usefulness was not found to differ sig-nificantly between different types of information (P = 0.56, n = 31, df = 4). As is shown in Chapter 11, coralreef boundaries and geomorphological zones can bemapped readily with both satellites and airborne instru-ments but coral density, coral colonies and live coralcover can only be evaluated in shallow clear water withairborne sensors.
SeagrassUsefulness was assessed for seagrass boundaries,exposed versus submerged seagrass, seagrass density andseagrass biomass (Table 2.4). The averaged responsessuggested that data were of fair to moderate use but that,as for coral reefs, the usefulness of various types of infor-mation did not vary significantly (P = 0.49, n = 32, df = 3).All these objectives can be achieved using both satelliteand airborne sensors (Chapter 12).
Table 2.4 Usefulness of various types of seagrass information torespondents of questionnaire.
Objectives Mean usefulnessNumeric Interpreted
Seagrass boundaries 2.5 fair–moderateExposed/submerged seagrass 2.6 fair–moderateSeagrass density 2.8 moderateSeagrass biomass 2.8 moderate
MangroveIn terms of usefulness (Table 2.5), mangrove parametersfell into two groups which differed significantly (P < 0.001, n = 40, df = 6). The most useful informationwas considered to be mangrove boundaries, cleared man-grove and mangrove density. The remaining parameterswere considered to be fairly useful.
As discussed in Chapter 13, the first five objectives canbe achieved using both satellite and airborne imagery,whereas mangrove species composition normallyrequires airborne instruments. However, mangrove bio-
Remote Sensing Objectives of Coastal Managers 37

mass cannot realistically be mapped at present.The difference in perceived usefulness of the different
types of mangrove information was surprising and mayreflect the current availability of information on man-grove parameters. For example, canopy closure has onlyrecently been measured using remote sensing (Jensen etal. 1991, Green et al. 1997). The application of synopticmeasures of canopy closure (and leaf area index) are onlynow becoming clear. Leaf area index can be related to thenet photosynthetic primary production of mangrove(English et al. 1994) and it is now possible to map thisparameter throughout an entire mangal (Green et al.1997). This may have implications for forestry manage-ment and help prioritise the selection of sites for protec-tion (e.g. to protect the most productive mangrove in aparticular ecosystem). Once the full implications of suchinformation are realised, managers and scientists mightassign greater importance to these data in future.
Conclusions
Most types of information on coastal resources are usefulfor one application or another. This chapter provides ageneral overview and it must be borne in mind that theusefulness of any particular type of information willdepend on the specific objectives of research or manage-ment. For example, if we need to assess a reef’s responseto sewage run-off, live coral cover is likely to be a moreinformative measure than (say) a map of reef geomor-phology.
Above all, managers need to think clearly about theprecise objectives they wish to achieve using remote sens-ing and fully explore alternatives in terms of costs andeffectiveness. They also need to be aware that some man-agement objectives will not be achievable using remotesensing. This volume seeks to allow managers to makemore informed decisions when matching remote sensingmethods to survey objectives.
References
Armstrong, R.A., 1993, Remote sensing of submerged vegetationcanopies for biomass estimation. International Journal ofRemote Sensing, 14, 10–16.
Benny, A.H., and Dawson, G.J., 1983, Satellite imagery as an aid tobathymetric charting in the Red Sea. Cartography Journal, 20,5–16.
Biña, R.T., 1982, Application of Landsat data to coral reef man-agement in the Philippines. Proceedings of the Great BarrierReef Remote Sensing Workshop, Townsville, May 5th 1982,(Townsville: James Cook University), pp. 1–39.
Biña, R.T., Jara, R.B., and Roque, C.R., 1980, Application ofmulti-level remote sensing survey to mangrove forest resourcemanagement in the Philippines. Natural Resources Manage-ment Center Research Monograph No. 2 (Manila: NRMC),pp. 1–5.
Bour, W., 1989, SPOT images for coral reef mapping in New Cale-donia. A fruitful approach for classic and new topics. In Pro-ceedings of the 6th International Coral Reef Symposium, editedby J.H. Choat et al. (Townsville: Sixth International Coral ReefSymposium Committee, Townsville) 2, 445–448.
Bullard, R.K., 1983, Detection of marine contours from Landsatfilm and tape. In Remote Sensing Applications in Marine Scienceand Technology, edited by A.P. Cracknell, (Dordrecht: D. Rei-del), pp. 373–381.
Catt, P., and Hopley, D., 1988, Assessment of large scale photo-graphic imagery for management and monitoring of the GreatBarrier Reef. Proceedings of the Symposium on Remote Sensingof the Coastal Zone, Gold Coast, Queensland. (Brisbane:Department of Geographic Information). pp. III.1.1–1.14.
Chenon, F., Varet, L., Loubersac, L., Grand, S., and Hauti, A., 1990,SIGMA POE RAVA a GIS of the Fisheries and AquacultureDepartment. A tool for a better monitoring of public ownershipand pearl oyster culture. Proceedings of the International Work-shop on Remote Sensing and Insular Environments in thePacific: Integrated Approaches, (Noumea: ORSTOM/IFRE-MER), pp. 561–572.
Danaher, T.J., and Smith, P., 1988, Applications of shallow watermapping using passive remote sensing. Proceedings of the Sym-posium on Remote Sensing of the Coastal Zone, Gold Coast,Queensland, September 1988 (Brisbane: Department of Geo-graphic Information), pp. VII.3.2–8
Danaher, T.J., and Cottrell, E.D., 1987, Remote sensing: acost–effective tool for environmental management and monitor-ing. Pacific Rim Congress, Gold Coast Australia, 1987pp. 557–560.
English, S., Wilkinson, C., andBaker, V., 1994, Survey manual fortropical marine resources. ASEAN–Australia Marine ScienceProject: Living Coastal Resources, (Townsville: AIMS).
Friel, C., and Haddad, K., 1992, GIS manages marine resources.GIS World, 5, 33–36.
Green, E.P., Mumby, P.J., Edwards, A.J., and Clark, C.D., 1996, Areview of remote sensing for the assessment and management oftropical coastal resources. Coastal Management, 24, 1–40.
Green, E.P., Mumby, P.J., Ellis, A.C., Edwards, A.J., and Clark,C.D., 1997, Estimating leaf area index of mangroves from satel-lite data. Aquatic Botany, 58, 11–19.
38 Remote Sensing Handbook for Tropical Coastal Management
Table 2.5. Usefulness of various types of mangrove information torespondents of questionnaire.
Objectives Mean usefulnessNumeric Interpreted
Mangrove boundaries 3.0 moderateCleared mangrove 2.9 moderateMangrove density 3.0 moderateMangrove height 2.0 fairCanopy cover of mangrove 1.8 poor–fairMangrove species composition 2.0 fairMangrove biomass 2.1 fair

Greenway, M., and Fry, W., 1988, Remote sensing techniques forseagrass mapping. Proceedings of the Symposium Remote Sens-ing Coastal Zone, Gold Coast, Queensland, (Brisbane: Depart-ment of Geographic Information), pp. VA.1.2–1.11.
Hauti, A., 1990, Monitoring marine concessions for pearl aquacul-ture. Problematics and first solutions. Proceedings of the Inter-national Workshop on Remote Sensing and InsularEnvironments in the Pacific: Integrated Approaches, (Noumea:ORSTOM/IFREMER), pp. 547–560.
Hesselmans, G.H.F.M., Wensink, G.J., and Calkoen, C.J., 1994,The use of optical and SAR observations to assess bathymetricinformation in coastal areas. Proceedings of the 2nd ThematicConference Remote Sensing for Marine Coastal Environments,New Orleans, (Michigan: ERIM), 1, 215–224.
Hopley, D., and Catt, P.C., 1989, Use of near infra-red aerial pho-tography for monitoring ecological changes to coral reef flats onthe Great Barrier Reef. Proceedings of the 6th InternationalCoral Reef Symposium, Townsville, 3, 503–508.
Ibrahim, M., and Yosuh, M., 1992, Monitoring the developmentimpacts on the coastal resources of Pulau Redang marine park byremote sensing. In Third ASEAN Science & Technology WeekConference Proceedings, edited by L.M. Chou and C.R. Wilkin-son (Singapore: University of Singapore), Vol. 6 Marine ScienceLiving Coastal Resources. pp. 407–413.
IFREMER (Institut français de recherche pour l’exploitation de lamer), 1987, The preselection of sites favourable for tropicalshrimp farming. France Aquaculture.
Jensen, J.R., Ramsey, E., Davis, B.A., and Thoemke, C.W., 1991,The measurement of mangrove characteristics in south-westFlorida using SPOT multispectral data. Geocarto International,2, 13–21.
Jupp, D.L.B., 1988, Background and extensions to depth of pene-tration (DOP) mapping in shallow coastal waters. Proceedingsof the Symposium on Remote Sensing of the Coastal Zone, GoldCoast, Queensland, September 1988, (Brisbane: Department ofGeographic Information), pp. IV 2.1–19.
Jupp D.L.B., Mayo, K.K., Kuchler, D.A., Claasen, D.R., Kench-ington, R.A., and Guerin, P.R., 1985, Remote sensing for plan-ning and managing the Great Barrier Reef Australia.Photogrammetria, 40, 21–42.
Jupp, D.L.B., Mayo, K.K., Kuchler, D.A., Heggen, S.J., andKendall, S.W., 1981. Remote sensing by Landsat as support formanagement of the Great Barrier Reef. 2nd Australasian RemoteSensing Conference: Papers & Programme pp. 9.5.1–9.5.6.
Kenchington, R.A., and Claasen, D.R., 1988, Australia's Great Bar-rier Reef – management technology. Proceedings of the Sympo-sium on Remote Sensing of the Coastal Zone, Gold Coast,Queensland, (Brisbane: Department of Geographic Informa-tion) pp. KA.2.2–2.13.
Kuchler, D.A., Jupp, D.L.B., Claasen, D.R., and Bour, W., 1986,Coral reef remote sensing applications. Geocarto International,4, 3–15.
Kunte, P.D., and Wagle, B.G., 1993, Determination of net shoredrift direction of central west coast of India using remotelysensed data. Journal of Coastal Research, 9, 811–822.
Lantieri, D., 1988, Use of high resolution satellite data for agri-cultural and marine applications in the Maldives. Pilot studyon Laamu Atoll. FAO Technical Report TCP/MDV/4905.No. 45.
Lodge, D.W.S., 1983, Surface expressions of bathymetry onSEASAT synthetic aperture radar images. International Journalof Remote Sensing, 4, 639–653.
Loubersac, L., Dahl, A.L., Collotte, P., LeMaire, O., D'Ozouville,L., and Grotte, A., 1989, Impact assessment of Cyclone Sally onthe almost atoll of Aitutaki (Cook Islands) by remote sensing.Proceedings of the 6th International Coral Reef Symposium,Townsville, 2, 455–462.
Loubersac, L., and Populus, J., 1986, The applications of high res-olution satellite data for coastal management and planning in aPacific coral island. Geocarto International, 2, 17–31.
McNeill, S.E., 1994, The selection and design of marine protectedareas: Australia as a case study. Biodiversity and Conservation,3, 586–605.
Meaden, G.J., and Kapetsky, J.M., 1991, Geographical informationsystems and remote sensing in inland fisheries and aquaculture.FAO Fisheries Technical Paper No. 318.
Mumby, P.J., Gray, D.A., Gibson, J.P., and Raines, P.S., 1995, Geo-graphic Information Systems: a tool for integrated coastal zonemanagement in Belize. Coastal Management, 23, 111–121.
Mumby, P.J., Green, E.P., Edwards, A.J., and Clark, C.D., 1997,Measurement of seagrass standing crop using satellite and digi-tal airborne remote sensing. Marine Ecology Progress Series,159, 51–60.
Pirazzoli, P.A., 1985, Bathymetry mapping of coral reefs and atollsfrom satellite. Proceedings of the 5th International Coral ReefSymposium Tahiti, 6, 539–545.
Populus, J., and Lantieri, D., 1991, Use of high resolution satellitedata for coastal fisheries. FAO RSC Series No. 58, Rome.
Thamrongnawasawat, T., and Catt, P., 1994, High resolutionremote sensing of reef biology: the application of digitised airphotography to coral mapping. Proceedings of the 7th Aus-tralasian Remote Sensing Conference, Melbourne pp. 690–697.
Thamrongnawasawat, T., and Hopley, D., 1995, Digitised aerialphotography applied to small area reef management in Thailand.In Recent Advances in Marine Science and Technology 94,edited by O. Bellwood, J.H. Choat, N. Saxena, (Townsville:James Cook University of N. Queensland), pp. 385–394.
UNESCO, 1986, The application of digital remote sensing tech-niques in coral reef, oceanographic and estuarine studies. Reporton a regional Unesco/COMAR/GBRMPA Workshop. UnescoReports in Marine Science 42 (Paris: UNESCO).
Warne, D.K., 1978, Landsat as an aid in the preparation of hydro-graphic charts. Photogrammetric Engineering and Remote Sens-ing, 44, 1011–1016.
Welby, C.W., 1978, Application of Landsat imagery to shorelineerosion. Photogrammetric Engineering and Remote Sensing, 44,1173–1177.
Wilkinson, C.R., 1992, Coral reefs of the world are facing wide-spread devastation: can we prevent this through sustainablemanagement practices? Proceedings of the 7th InternationalCoral Reef Symposium, (Guam: University of Guam), 1,11–21.
Zainal, A.J.M., Dalby, D.H., and Robinson, I.S., 1993, Monitoringmarine ecological changes on the east coast of Bahrain withLandsat TM. Photogrammetric Engineering and Remote Sens-ing, 59, 415–421.
Zar, J.H., 1996, Biostatistical Analysis. (New Jersey: Prentice-Hall).
Remote Sensing Objectives of Coastal Managers 39