corporate objectives - bse
TRANSCRIPT


35th Annual Report 2010-2011 1
CORPORATE OBJECTIVES
To realise the vision and mission, eight key corporate objectives have been identified. These objectives would provide the link between the defined mission and the functional strategies:
Business portfolio growth
Customer Focus
Agile Corporation
Performance Leadership
Human Resource Development
Financial Soundness
Sustainable Power Development
Research and Development

35th Annual Report 2010-20112
REFERENCE INFORMATION
Registered Office Bankers
Subsidiaries
Registrar & Share Transfer Agent
Shares listed at
Depositories Auditors
Company Secretary

35th Annual Report 2010-2011 3
CONTENTS
• Letter to Shareholders ................................................................................................................................................. 5
• Notice of AGM ............................................................................................................................................................ 7
• Achievements & Accolades ..................................................................................................................................... 12
• Station-wise Generation ............................................................................................................................................. 14
• Selected Financial Information .................................................................................................................................. 16
• Directors’ Profi le ........................................................................................................................................................ 17
• Senior Management Team ......................................................................................................................................... 22
• Directors’ Report ....................................................................................................................................................... 23
• Management Discussion and Analysis ...................................................................................................................... 42
• Report on Corporate Governance ............................................................................................................................. 73
• Accounting Policies ................................................................................................................................................ 106
• Balance Sheet .......................................................................................................................................................... 110
• Profi t & Loss Account .............................................................................................................................................. 111
• Cash Flow Statement ............................................................................................................................................... 112
• Auditors’ Report ...................................................................................................................................................... 147
• Comments of the Comptroller and Auditor General of India .................................................................................. 150
• Employee Cost Summary ........................................................................................................................................ 151
• Revenue Expenditure on Social Overheads ........................................................................................................... 151
• Subsidiary Companies ............................................................................................................................................ 152
• Consolidated Financial Statements ......................................................................................................................... 199

35th Annual Report 2010-2011
THE YEAR AT A GLANCE
2010-11 2009-10
"
"
`
"
"
" 3133 3133
"
"
"
"
" 37797
"
"
" 17331# 23797
`
%
`
"
"
"
Growth in Sales
Sales of Energy in ` billion Electricity sold in billion units
2006-07
520
470
420
370
320
325
177 188
369194
205 207
462
175
195
215
235
255
275
295547
CAGR 15.46%418
2007-08 2008-09 2009-10 2010-11
CAGR 9.4%
Profit after Tax
2006-070
1000
2000
3000
4000
5000
6000
7000
80006,864.72
7,414.81
8,201.308,728.20
9,102.59
9000
10000
2007-08 2008-09 2009-10 2010-11
` C
rore
Year

35th Annual Report 2010-2011
LETTER TO SHAREHOLDERS
2,490 MWthe best year in NTPC’s history
annual capacity addition
‘Maharatna’ first
Company to exercise the Maharatna powers.
` ``
`
operational performance world class Seven
NTPC Stations figured among the top ten Stations in the country in terms of PLF.
continuous improvement in generation efficiency and maintaining a high standard of performance.
effective customer relationship management
sound strategies for capacity addition and fuel security
ensuring sale of the power generated
ensuring fuel supply for the new projects
` We aim at reducing cost while driving growth.
Disciplined capital expenditure and prudent resource mobilization strategies largest ever
loan to any company in India or abroad `
confidence of the investor community in the robust business fundamentals of NTPC.
Environmental concern underpins our growth strategy as we strive for a low carbon future.
2Our investment in technology is directly linked to creating value for our shareholders

35th Annual Report 2010-2011
and society a
series of super critical units of 660 MW and 800 MW sizeAdvanced Ultra Super Critical technology
2
2
Asia Pacific Partnership to combat 2 emissions
IGCC
making firm global footprints
nodal agency for implementation of the first phase of Jawahar Lal Nehru National Solar Mission
socio-economic vitality and health of the communities around our business unitsFor us CSR is Corporate Social Relationship
NTPC often being the only PSU to be consistently ranked among the best employers in prestigious surveys
the role of power sector and NTPC will also grow larger and more rewarding.

35th Annual Report 2010-2011 7
NOTICE
Thirty Fifth Annual General Meeting NTPC Limited Tuesday, September 20, 2011 at 10.30 a.m.
ORDINARY BUSINESS
SPECIAL BUSINESS
(A.K. Rastogi) Regd. Office:

35th Annual Report 2010-2011
NOTES:-
3. A MEMBER ENTITLED TO ATTEND AND VOTE AT THE MEETING IS ENTITLED TO APPOINT A PROXY TO ATTEND AND VOTE INSTEAD OF HIMSELF/HERSELF AND THE PROXY NEED NOT BE A MEMBER OF THE COMPANY. IN ORDER TO BE EFFECTIVE, THE PROXY FORM DULY COMPLETED SHOULD BE DEPOSITED AT THE REGISTERED OFFICE OF THE COMPANY NOT LESS THAN FORTY - EIGHT HOURS BEFORE THE SCHEDULED TIME OF THE ANNUAL GENERAL MEETING. BLANK PROXY FORM IS ENCLOSED.
note that due to strict security reasons mobile phones, brief cases, eatables and other belongings are not allowed inside the Auditorium.
`
`

35th Annual Report 2010-2011 9
`
Annexure to NoticeEXPLANATORY STATEMENT
Item No. 8

35th Annual Report 2010-2011
Item No. 9
Item No. 10
(A.K. Rastogi)
Regd. Office:

35th Annual Report 2010-2011 11
BRIEF RESUME OF THE DIRECTORS SEEKING RE-ELECTION AT THE 35TH AGM
Name
Date of Birth & Age
Date of Appointment
Qualifications
Expertise in specific functional area
Directorship held in other companies
Part-time Chairman
Part-time Director
- Part-time Director Chairman
Managing Director
Director
Memberships/Chairmanship of Committees across all Public Companies
- Shareholders’/ Investors’ Grievance Committee-Member
Audit Committee-Member
Remuneration Committee-Member

35th Annual Report 2010-201112
ACHIEVEMENTS & ACCOLADES

35th Annual Report 2010-2011 13
Year
Application of funds
20000
40000
60000
80000
100000
2006-07
` C
rore
2007-08 2008-09 2009-10 2010-11
120000
0
Investments
Assets under Construction
Net Block
Working Capital
-20%
-0.2%
-0.2%
0.0%
0% 20% 40 % 60 % 80 % 100 %
2006-07
2007-08
2008-09
2009-10
2010-11
61.6%
59.8%
59.9%
55.0%
56.0%
10.3% 5.4% 4.3%3.7%
4.9% 7.4% 4.4%
2.6%7.7%5.4%
4.4%4.0%
4.1%4.5%
4.7%8.4% 7.1%
0.7%
5.8%8.6%3.3%5.3%
4.4%5.9%10.8%
5.2%
5.3%
10.5%
10.1%
9.5% 4.3%4.6%
3.7% 4.9% 6.4% 5.1%
Distribution of Income
Year
0.3%
Percentage
Debt to Net Worth
Net Worth Debt Ratio
2006-070.00 0.00
0.10
0.20
0.30
0.40
0.50
0.60
0.70
10000.00
20000.00
30000.00
40000.00
50000.00
60000.00
70000.00
80000.00
0.50
48,597
24,48427,191
34,56837,797
43,188
52,639
57,37062,437
67,892
0.52
0.60 0.610.64
2007-08 2008-09 2009-10 2010-11
` C
rore
Year
Year
Sources of Funds
20000
40000
60000
80000
100000
2006-07
` C
rore
2007-08 2008-09 2009-10 2010-11
120000
0
Reserves & Surplus
Deferred revenue & Net deferred forex liability
Loan Funds
Share Capital

35th Annual Report 2010-2011
STATION-WISE GENERATION 2010-11STATIONS Fuel Type Capacity (MW) Gross Gen. (MUs)
Northern Region 5490 45382
National Capital Region 4837 32042
Western Region (WR-I & WR-II) 8153 60785
17377
Eastern Region (ER-I & ER-II) 7900 51449
3797
Southern Region 4450 30879
Total 30830 220536
Share of Generating Capacity Share of Electricity Generated
27%
73%

35th Annual Report 2010-2011
NTPC PLF Vs All India PLF
100% 89%
77%
92% 91%
77%
91%
78%
88%
75%90%80%70%60%50%40%30%20%10%
0%2006-07 2007-08 2008-09 2009-10 2010-11
NTPC All INDIA
PLF
79%
Growth in GenerationNTPC vs Rest of India
900.00
800.00
700.00
600.00
500.00
400.00
300.00
200.00
100.00
2006-07 2007-08 2008-09 2009-10 2010-110.00
470.75
659.42
188.67
503.59
704.45
200.86
516.85
723.79
206.94
552.71
771.55
218.84
590.60
811.14
220.54
Generation-NTPC Generation- Rest of India Total
BU
s
Growth in Installed Capacity NTPC vs Rest of India
160,000
180,000
140,000
120,000
100,000
80,000
60,000
40,000
20,000
2006-07 2007-08 2008-09 2009-10 2010-110.00
132,329
26,350
115,711
143,061
27,350
120,115
147,965
27,850
130,558
159,398
28,840
142,796
173,626
30,830
105,979
Installed Capacity-NTPC Installed Capacity-India excl. NTPC Total
Year
Year
Year
MW

35th Annual Report 2010-2011
SELECTED FINANCIAL INFORMATION`
2010-11 2009-10 2008-09 2007-08 2006-07
A) Operating Income
Total 57399.49 49233.88 45229.06 40011.31 35376.67 Paid & Provided for
Profit before Depreciation, Interest & Finance Charges and Tax 16684.37 15344.45 13720.17 14191.47 12842.19
Profit before Interest & Finance Charges and Tax 14198.68 12694.39 11356.69 12052.97 10766.81
Profit before tax 12049.60 10885.46 9359.47 10254.93 8907.43
Profit after tax 9102.59 8728.20 8201.30 7414.81 6864.72
Retained Profit 5454.55 5067.31 4731.23 4038.44 3836.53B) What is Owned
Total Net Assets 125248.22 112488.49 104251.41 89388.07 80764.33C) What is Owed
Total Liabilities 56261.15 48555.18 45256.35 35120.50 31510.75D) Others
Total 1094.82 1495.89 1624.97 1628.90 656.80E) Net Worth
Net Worth 67892.25 62437.42 57370.07 52638.61 48596.71F) Capital Employed 71374.57 69572.54 64183.42 58886.77 56433.15G) Value Added 19139.99 17331.30 14054.75 12753.79 11101.15H) No. of Shares 8245464400 8245464400 8245464400 8245464400 8245464400I) No. of Employees * 23797 23743 23639 23674 23602J) Ratios
`
`

35th Annual Report 2010-2011 17
DIRECTORS’ PROFILE
Shri Arup Roy Choudhury,
“SCOPE Award for Excellence and Outstanding Contribution in the Public Sector Management (2008-09) - Individual Category” The Exemplary Leadership Award for People Excellence”
Shri A.K. Singhal,

35th Annual Report 2010-2011
Shri I. J. Kapoor,
Shri B. P. Singh,
Shri D. K. Jain,
Shri S. P. Singh,

35th Annual Report 2010-2011 19
Shri N. N. Misra,
Shri M. N. Buch,
Shri Shanti Narain,
Shri P. K. Sengupta,
Shri K. Dharmarajan,

35th Annual Report 2010-2011
Dr. M. Govinda Rao,
Shri Kanwal Nath,
Shri Adesh C. Jain,
Shri A. K. Sanwalka,
Shri Santosh Nautiyal,

35th Annual Report 2010-2011 21
Shri I. C. P. Keshari,
Shri Rakesh Jain,
Chief Vigilance Officer
Shri T. Venkatesh,

35th Annual Report 2010-201122
S.No. Executive Directors
S.No. General Managers
29
37
S.No. General Managers
97
S. No. General Managers
119
Posted in Subsidiary/Joint Venture Companies and others
S.No. Executive Directors
S.No. General Managers
SENIOR MANAGEMENT TEAM

35th Annual Report 2010-2011 23
DIRECTORS’ REPORT
1. FINANCIAL RESULTS
Income 2010-11 2009-10
` Crore US $ Mn* ` Crore US $ Mn*
37
Total Income 57399.49 12691 49233.88 10885
Expenditure
237
Total Expenditure 45444.27 10048 38428.12 8496
Profit before tax, provisions and prior period adjusts. 11955.22 2643 10805.76 2389
Profit after tax but before provisions and prior period 9008.21 1992 8648.50 1912
Net Profit after tax 9102.59 2013 8728.20 1929
Appropriations:
117
2 1
`

35th Annual Report 2010-2011
2. FINANCIAL PERFORMANCE
2.1 Income
``
2.2 Profit After Tax:
``` `
3. DIVIDEND
3.1 Interim and Final Dividend:
`
`
` `
`
4. OPERATIONAL PERFORMANCE
4.1 Generation:
5. COMMERCIAL PERFORMANCE
5.1 Realisation of Dues:
5.2 Rebate Scheme/ One Time Settlement Scheme for realization of dues:
`
32%
Dividend Payout: 40% of Net profit
Perc
enta
ge
Year
` Cr
ore

35th Annual Report 2010-2011
`
5.3 Power Purchase Agreements:
5.4 Commercial Capacity:
Project / Unit Capacity (MW)
COD*
Total 1600
5.5 Determination of Tariff:
5.6 Strengthening Customer Relationship:
6. INSTALLED CAPACITY
Project / Unit Capacity (MW)NTPC owned
Under JVs
Net addition 2,490
6.1 Installed Capacity of NTPC Group:
Owned by NTPC Capacity (MW)
Sub-total 30,830Joint Ventures & Subsidiaries
Sub-total 3,364Total 34,194
7. CAPACITY ADDITION PROGRAM

35th Annual Report 2010-2011
7.1 Projects under Implementation
Name of the Project Capacity (MW)
I. Project under NTPC LtdA. Coal Based Projects
Sub Total (A) 9530B. Hydro Electric Power Projects (HEPP)
Sub Total(B) 1320C. Renewable Projects
Sub Total (C) 8Total I (A)+(B)+(C) 10,858II Projects under JVsCoal Based Projects
Total II 3890Total On-Going Projects (I)+(II) 14,748
7.2 New Projects
7.3 Project Management – A New Approach

35th Annual Report 2010-2011 27
7.4 Capacity addition through Subsidiaries and Joint Ventures (JVs)
Name ofCompany
JV Partner Details

35th Annual Report 2010-2011
Other Initiatives:
7.5 Hydro Power
7.5.1
Project Location Capacity
7.5.2
7.5.3
7.5.4
8. STRATEGIC DIVERSIFICATION- INCREASING SELF-RELIANCE
Name of Company
JV Partner Activitiesundertaken

35th Annual Report 2010-2011 29
8.2
8.2.1 NTPC-BHEL Power Projects Pvt. Limited (NBPPL),
8.2.2 BF-NTPC Energy Systems Limited
8.2.3Transformers and Electricals Kerala Limited
8.2.4
KINESCO Power and Utilities Private Limited
9. GLOBALISATION INITIATIVES9.1
9.2
9.3
10. FINANCING OF NEW PROJECTS

35th Annual Report 2010-2011
` ``
`
`
`
11. FIXED DEPOSITS
` `
12. FUEL SECURITY
12.1 Diversified Fuel Mix
2
12.1.1 Coal Supplies
12.1.2 Sourcing of coal through E-auction
12.2 Gas supplies
12.3 Development of Coal Mining projects

35th Annual Report 2010-2011 31
Particulars Coal Blocks
Pakri Barwadih Chatti-Bariatu
Kerandari Talaipalli Dulanga Chatti-Bariatu
(South)*
Environment Clearance
Forest Clearance
Land Acquisition
Mine Developer-cum-Operator (MDO)
13
Status of award of Other Packages

35th Annual Report 2010-201132
12.4 Other initiatives for securing coal supply
Name of Company JV Partners Purpose
12.5 Exploration Activities
`
`
13. BUSINESS EXCELLENCE: GLOBAL
BENCHMARKING
14. RENOVATION & MODERNISATION
14.1 Need for R&M:

35th Annual Report 2010-2011 33
14.2 S trategy by the Company:
14.3 Benefits from R&M:
Name of the Plant
PLF prior to Take-over
PLF in 2010-11
15. VIGILANCE
15.1 Viligance Mechanism:
15.2 Workshops and Vigilance Awareness Week
15.3 Implementation of Integrity Pact
`
`
15.4 Implementation of Fraud Prevention Policy
16. HUMAN RESOURCE MANAGEMENT

35th Annual Report 2010-2011
FY 2010-11 FY 2009-10NTPC
Subsidiaries & Joint Ventures
Total employees 25,144 24,955
16.2 Employee Relations
16.3 Safety
6.58 7.11 7.43 7.81 7.99 8.48 8.75 9.22 9.27
1.02 0.980.91 0.91 0.91 0.87 0.85 0.82
0.77
0
0.2
0.4
0.6
0.8
1
1.2
2002-032003-04
2004-052005-06
2006-072007-08
2008-092009-10
2010-11
Year
012345678910
Gen
./Em
ploy
ee (M
U)
16.4 Training and Development

35th Annual Report 2010-2011
17. INCLUSIVE GROWTH
17.1 Corporate Social Responsbility:
Initiatives undertaken by the Company:17.2 NTPC Foundation
Initiatives undertaken by the Company:

35th Annual Report 2010-2011
17.3 Rehabilitation & Resettlement
Initiatives undertaken by the Company:
18. IMPLEMENTATION OF OFFICIAL LANGUAGE
19. SUSTAINABLE ENERGY DEVELOPMENT
Vision Statement on Sustainable Energy Development:
G H G GHG
Initiatives undertaken by the Company:

35th Annual Report 2010-2011 37
20. NETRA – R&D Mission in Power Sector
21. ENVIRONMENT MANAGEMENT – CONTINUOUS IMPROVEMENTS
21.1
3
3

35th Annual Report 2010-2011
2
21.2 Clean Development Mechanism (CDM)
21.3 Ash Utilisation
21.4 CenPEEP – towards enhancing efficiency
2

35th Annual Report 2010-2011 39
22. RURAL ELECTRIFICATION
23. RIGHT TO INFORMATION
24. USING INFORMATION AND COMMUNICATION TECHNOLOGY FOR PRODUCTIVITY ENHANCEMENT
25. NTPC GROUP: JOINT VENTURES AND SUBSIDIARIES

35th Annual Report 2010-2011
26. STATUTORY AND OTHER INFORMATION REQUIREMENTS
NTPC GROUP
Particulars Annexure
**INFORMATION AS PER COMPANIES (PARTICULARS OF EMPLOYEES) RULES, 1975
``
27. STATUTORY AUDITORS

35th Annual Report 2010-2011
28. MANAGEMENT COMMENTS ON STATUTORY AUDITORS’ REPORT
29. REVIEW OF ACCOUNTS BY COMPTROLLER & AUDITOR GENERAL OF INDIA
30. COST AUDIT
31. BOARD OF DIRECTORS
32. DIRECTORS’ RESPONSIBILITY STATEMENT
33. ACKNOWLEDGEMENT

35th Annual Report 2010-2011
Annexure-I to Directors’ ReportMANAGEMENT DISCUSSION AND ANALYSIS
INDUSTRY STRUCTURE AND DEVELOPMENTS
Structure of power market
SNAP SHOT 2010-11
Existing Installed Capacity
Sector Total Capacity (MW) % share
Total* 173,626.40 100.00%
Fuel Total Capacity (MW) % share
Total 173,626.40 100.0%
Capacity Utilization
Sector wise PLF (Thermal)
SectorPlant Load Factor
2008-09 2009-10 2010-11

35th Annual Report 2010-2011
Progress during 11th plan
Capacity in MWSector Thermal Hydro Nuclear Total Likely
Addition
Total 59,693 15,627 3,380 78,700 62,374
Approach to 12th Plan
Capacity in MW
Particulars Hydro Thermal Nuclear Total13,99811,69532,390
Total 5,847 51,536 700 58,083
12

35th Annual Report 2010-2011
GENERATION
Year Energy Requirement
(TWh)
Annual Peak Load at Power
Stn. (GW)
Existing Generation
Sector Total Generation (BUs)
% share
Total 811.14 100.00%
Fuel Type Total Generation (BUs)
% share
Total 811.14 100.00%
Main reasons for shortfall in generation in 2010-11 vis-à-vis the target were as under:
•
•
•
•
•
Demand and Supply position

35th Annual Report 2010-2011
Years Peak Deficit % Energy Deficit %
Actual Power Demand- Supply Position
Years Requirement Availability Surplus/Deficit (+/-)
Consumption
TRANSMISSION AND DISTRIBUTION
Private Sector Participation in Transmission/Distribution
737 777

35th Annual Report 2010-2011
POWER TRADING
PARTICULARS FY 2010-11 FY 2009-10
``
RURAL ELECTRIFICATION
R-APDRP
POLICY FRAMEWORKElectricity Act 2003
(EA 2003)

35th Annual Report 2010-2011
RECENT INITIATIVES
(a) CERC (Terms and Conditions for Renewable Energy Certificate for Renewable Energy Generation) Regulations, 2010.
(b) Amendment of Coal Linkage Policy for 12th Plan Power Projects
(c) Procedure for the implementation of the Mechanism of Renewable Regulatory Fund (RRF) under Indian Electricity Grid Code Regulation, 2010.
(d) Sharing of Inter-state Transmission Charges and Losses Regulations, 2010.

35th Annual Report 2010-2011
(e) CERC (Terms and Conditions of Tariff) (Second Amendment) Regulations, 2011
OPPORTUNITIES AND THREATS
Opportunities
Increasing demand for electricity
Conducive Regulatory Framework for investment by Private Sector
Ultra Mega Power Projects
UMPPs at Glance
Particulars No. of UMPPs Capacity (MW)
12
Transmission
Renewable Energy
Renewable Energy Sources (RES) Potential

35th Annual Report 2010-2011
Hydro Potential
12
Nuclear Potential
Threats
Slow investment in power sector
(US $ million)
2009-10 2010-11 Cummulative April 2000-March 2011
High AT&C /T&D Losses

35th Annual Report 2010-2011
Deteriorating Financials of State Utilities
` `
` `
`
` `
` `
`
` ` `
``
`
Fuel Constraints

35th Annual Report 2010-2011
Slow development of coal mines allocated to Power Developers
OTHER RISKS AND CONCERNS
OUTLOOK
NTPC LEADERSHIP POSITION IN INDIAN POWER SECTOR
All India NTPC % share
PLF Comparison (%)2010-11 2009-10
NTPC 88.29 90.81
COMPETITION

35th Annual Report 2010-2011
RISKS & CONCERNS
For Company
• • • • • •
•
INTERNAL CONTROL

35th Annual Report 2010-2011
FINANCIAL DISCUSSION AND ANALYSIS
A Results of Operations1 Gross Income
FY 2010-11 FY 2009-10 %ChangeUnits of electricity sold (million units)
206,582 205,091 0.73%
Income `1
2
3
Total (4+5) 2,460.81 2,856.19 -13.84%Gross Income (1+2+3+6)
57,399.49 49,233.88 16.59%
` `
Tariffs for computation of Sale of Energy
Capacity Charge
•
•
•
•

35th Annual Report 2010-2011
•
•
•
•
Energy Charges
Other Charges
•
•
•
Sale of Electricity
`
`
`
`
1

35th Annual Report 2010-2011
`
`
`
FY 2010-11
FY 2009-10
%Change
Energy Sales (Excl Electricity Duty and tax recoverable from customers)
54,344.32 46,640.13 17%
Energy Internally Consumed
Consultancy and other services
` `
` ``
Other Income
``
`
FY 2010-11 FY 2009-10

35th Annual Report 2010-2011
`
FY 2010-11 FY 2009-10
Total 2,517.12 2,900.69
Net other income 2,460.81 2,856.19
``
`
` `
`
`
`
``
``
``
Adjusted Gross Income
`
` ``
`
`
`
FY 2010-11 FY 2009-10Gross Income 57,399.49 49,233.88Less:
Adjusted Gross Income 56,734.20 48,797.75
2 Expenditure
2.1 Expenditure related to operations
Year FY 2010-11 FY 2009-10
`
Expenditures FY 2010-11
` / kWh
FY 2009-10
`/kWh
Total 40,809.50 1.85 33,969.13 1.56
``
``
`
2.1.1 Fuel

35th Annual Report 2010-2011
``
FY 2010-11 FY 2009-10Fuel cost (`/Crore) 35,373.78 29,462.74
% break-up
1%
` `
`
Supplies in the range of Rate of Incentive
`

35th Annual Report 2010-2011
2.1.2 Employees’ Remuneration and Benefits
```
``
2.1.3 Generation, Administration and Other Expenses

35th Annual Report 2010-2011
``
``
`
` `
` `
`
2.1.4 Adjusted Expenditure related to Operations
`
FY 2010- 11 FY 2009-10
Total Expenditure related to Operations
40,809.50 33,969.13
Less:
Adjusted Expenditure related to Operations
40,428.88 33,969.13
2.2 Depreciation
``
`
` ``
`
`
2.3 Provisions made (and written back)
``
`
` `

35th Annual Report 2010-2011
2.4 Interest and Finance Charges
``
`
FY 2010-11 FY 2009-10
Total Interest charges 2,930.24 2,519.30
Total 3,893.00 3,289.68Less: Adjustments and transfers
Net interest and finance charges
2,149.08 1,808.93
`
``
` `
` `
` `
`
17%.
`

35th Annual Report 2010-2011
`
FY 2010-11 FY 2009-10
Net interest and finance charges
1,997.22 1,808.90
Add :
Less:
Less :
Total Adjusted Interest and Finance charges
2,149.08 1,780.18
2.5 Prior period income / expenditure
``
1
`
`
`
3. Profit before tax, provisions and prior period adjustments
`
Reported AdjustedFY
2010-11FY
2009-10FY
2010-11FY
2009-10
Less:
Profit before tax, prov. & prior period adjust.
4. Provision for Tax
31
Provision for Current Tax
`
`
Provision for deferred tax

35th Annual Report 2010-2011
`
`
FY 2009-10 Current
taxDeferred
taxFBT* Total
FY 2010-11 Current
taxDeferred
taxFBT* Total
` ``
5. Profit After Tax before provisions made and written back and prior period adjustments
Reported (`/Crs) Adjusted (`/Crs)FY
2010-11FY
2009-10FY
2010-11FY
2009-10Profit before tax, provisions and prior period adjustments
11,955.22 10,805.76 11,475.57 10,398.38
Profit after tax (before prov. and prior period adjust.)
9,008.21 8,648.50 8,922.25 8,450.12
6. Net Profit After Tax
`
Reported AdjustedFY
2010-11FY
2009-10FY
2010-11FY
2009-10Profit after tax (before provisions and prior period adjustments)
9,008.21 8,648.50 8,922.25 8,450.12
Net profit after tax
9,102.59 8,728.20 8,911.76 8,451.99
`
7. Segment-wise performance
``
``

35th Annual Report 2010-2011
``
B Financial Position1 Net worth
``
` `
2 Loan Funds
``
`
As at March 31 % change2011 2010
Secured Loans
11%
Sub-total 9,910.68 9,079.92 9%Unsecured Loans
27%
Total 43,188.24 37,797.02 14%
`
` `
`
Source Debt Raised & Utilised
Re- payment
Net
Total 9,045.79 3,998.50 5,047.29
Total 5,391.22
`
`
`
` `
`
`

35th Annual Report 2010-2011
`
Rupee Loans incl. Bonds
& PDS
Foreign Currency
loans
Total
Total 32,497.28 10,690.96 43,188.24
3 Fixed Assets
`
`
`
As at March 31 % Change2011 2010
9%13%
19%
Total fixed assets 77,506.59 66,865.60 16%
4 Investments
`
As at March 312011 2010
Total investments 12,344.84 14,807.09
`
`
`
Name of JV Amount
Total 641.32
`
`Name of Subsidiary Amount
Total 316.71

35th Annual Report 2010-2011
`
` .5 Current Assets
` Current Assets As at March31 YoY
Change%
Change2011 2010
9%
37%
19%
12%
Total Current Assets
35,396.79 30,815.80 4,580.99 15%
` `
`
`
`
`
` `
`
`
`
S.No Description Amount
Total 2,367.29`
`
`
` `
`
`

35th Annual Report 2010-2011
``
` `
` ` `
`
6 Current Liabilities `
As at March 31 YoY change
% change2011 2010
Total Current Liabilities
13,072.91 10,758.16 2,314.75 22%
` `
` `
` ``
7 Provisions
``
` `
`
`
8 Cash flows
`
For the year ended March 31 2011 2010 2009 2008 2007
Opening Cash & cash equivalents
14,460 16,272 14,933 13,315 8,471
Closing cash & cash equivalents
16,185 14,460 16,272 14,933 13,315
``
` `
`
` `
``
`

35th Annual Report 2010-2011
`
` `
`
BUSINESS AND FINANCIAL REVIEW OF SUBSIDIARIES
(a) NTPC Electric Supply Company Limited (NESCL)
Particulars FY 2010-11 FY 2009-10`
`
`
Joint venture of NESCL
` `
(b) NTPC Vidyut Vyapar Nigam Limited (NVVN)
Particulars FY 2010-11 FY 2009-10`
`

35th Annual Report 2010-2011
` (c) NTPC Hydro Limited (NHL)
`
Particulars FY 2010-11 FY 2009-10
• Lata Tapovan hydro electric project
`
• Rammam-III (120 MW) in the state of West Bengal
12
` `
(d) Kanti Bijlee Utpadan Nigam Limited
` `
`
Particulars FY 2010-11 FY 2009-10
`
(e) Bhartiya Rail Bijlee Company Limited (BRBCL)
``
`
Particulars FY 2010-11 FY 2009-10`
`

35th Annual Report 2010-2011
BUSINESS AND FINANCIAL REVIEW OF JOINT VENTURE COMPANIES
a) Utility Powertech Limited (UPL)
Particulars FY 2010-11 FY 2009-10`
`
`
`
b) NTPC-SAIL Power Company Pvt. Ltd. (NSPCL)
`
Particulars FY 2010-11 FY 2009-10
`
`
` `
c) NTPC-ALSTOM Power Services Private Limited (NASL)
Particulars FY 2010-11 FY 2009-10`
`
`
`
d) NTPC Tamil Nadu Energy Company Ltd. (NTECL)
`
``
e) Ratnagiri Gas and Power Pvt. Limited (RGPPL)

35th Annual Report 2010-2011
` `
`
Particulars FY 2010-11 FY 2009-10
`
f) Aravali Power Company Private Limited
`
``
`
Particulars FY 2010-11 FY 2009-10
`
g) NTPC-SCCL Global Venture Pvt. Ltd
`
h) Meja Urja Nigam Private Limited
`
` `
i) NTPC BHEL Power Projects Pvt Ltd. (NBPPL)

35th Annual Report 2010-2011 71
`
Particulars FY 2010-11 FY 2009-10`
`
j) BF-NTPC Energy Systems Limited
`
k) Nabinagar Power Generating Company Private Limited
`
l) National Power Exchange Limited (NPEX)
``
`
m) International Coal Ventures Private Limited (ICVL)
`
n) National High Power Test Laboratory Private Limited (NHPTLPL)
` `

35th Annual Report 2010-201172
o) Energy Efficiency Services Pvt. Limited
``
p) Transformers and Electricals Kerala Limited (TELK)
`
` `
Particulars FY 2010-11 FY 2009-10`
`
q) CIL NTPC Urja Private Limited
`
r) Anushakti Vidhyut Nigam Limited
Consolidated Financial Statements of NTPC Ltd, its Subsidiaries and Joint Venture Companies
`
FY 2010-11 FY 2009-10
CAUTIONARY STATEMENT

35th Annual Report 2010-2011 73
Annex-II to Directors’ ReportREPORT ON CORPORATE GOVERNANCE
Corporate Governance Philosophy
1.2 CORPORATE GOVERNANCE RECOGNITIONS
2. BOARD OF DIRECTORS
2.1 Size of the Board
2.2 Composition
2.3 Age limit and tenure of Directors

35th Annual Report 2010-2011
2.4 Resume of Directors
2.5 Board Meetings
S.No.
Directors
Meeting held during respective tenures of Directors
No. of Board
Meetings Attended
Attendance at the last AGM
(held on 23.09.10)
Number of other Director-
ships held on 31.03.11
Number of Committee memberships in
companies on 31.03.11$
Functional Directors7
1
1 1
13 1
7 1
7 7 3

35th Annual Report 2010-2011
S.No.
Directors
Meeting held during respective tenures of Directors
No. of Board
Meetings Attended
Attendance at the last AGM
(held on 23.09.10)
Number of other Director-
ships held on 31.03.11
Number of Committee memberships in
companies on 31.03.11$
Non-executive Directors (Government Nominees)1
2 3
Independent Directors
12 2
1 1
11 2 1
12 1 1
1 1
11 3
13 1
2
2.6 Information placed before the Board of Directors:

35th Annual Report 2010-2011
3. COMMITTEES OF THE BOARD OF DIRECTORS
3.1 AUDIT COMMITTEE
Scope of Audit Committee

35th Annual Report 2010-2011 77
Constitution
Composition
Meetings and Attendance

35th Annual Report 2010-2011
Members of Audit Committee
Meetings held during his tenure
Meetings attended
77 777 77
3.2 SHAREHOLDERS’ / INVESTORS’ GRIEVANCE COMMITTEE
Scope of the Committee
Constitution
Composition
Meeting and Attendance
Members of Shareholders’ / Investors’
Grievance Committee
Meetings held
Meetings attended
3 3
3 3
2 1
3 3
Name and designation of Compliance Officer
Investor Grievances
Particulars Opening Balance
Received Resolved Pending
73
7
12
Number of pending share transfers

35th Annual Report 2010-2011 79
3.3 REMUNERATION COMMITTEE
Meeting and Attendance
Members of Remuneration
Committee
Meetings held
Meetings attended
2 2
2 1
2 1
2 1
3.4 COMMITTEE ON MANAGEMENT CONTROLS
3.5 CONTRACTS SUB-COMMITTEE
``
`
`
3.6 PROJECT SUB-COMMITTEE

35th Annual Report 2010-2011
3.7 INVESTMENT/CONTRIBUTION COMMITTEE
` ``
3.8 COMMITTEE FOR ALLOTMENT AND POST-ALLOTMENT ACTIVITIES OF NTPC’S SECURITIES
3.9 COMMITTEE OF FUNCTIONAL DIRECTORS FOR CONTRACTS
` `
4. GROUP OF DIRECTORS
(i) Group of Directors for Corporate Social Responsibility:
(ii) Group of Directors for Vigilance Matters and Non-Vigilance Matters:

35th Annual Report 2010-2011
(iii) Group of Directors for implementation of DPE Guidelines pertaining to Revision of Pay Scales:
(iv) Group of Directors for Import of Coal:
(v) Group of Directors for appointment of Financial Consultant for carrying out due diligence of Coal Mines/ Blocks:
(vi) Group of Directors for Examination of proposal for Mine Developer cum Operator:
5. REMUNERATION OF DIRECTORS
`

35th Annual Report 2010-2011
`
Name of the Director Salary Benefits Bonus/ Commission
Performance Linked
Incentives
Total
7. RISK MANAGEMENT
`
Name of Part-time non-official
Directors
Sitting Fees Total
Board Meeting
Committee / Group of Directors Meeting
6. ACCOUNTABILITY OF DIRECTORS

35th Annual Report 2010-2011
8. SUBSIDIARY MONITORING FRAMEWORK
9. GENERAL BODY MEETINGS
Annual General Meeting
Date & Time
September 17, 2008
September 17, 2009
September 23, 2010
`
Special Resolution passed through Postal Ballot

35th Annual Report 2010-2011
10. DISCLOSURES
Schedule of Compliances with Presidential Directives during the last three years is at Annex-2
CEO/CFO Certification
11. MEANS OF COMMUNICATION
•
•
•
•
Quarterly Results
Newspapers Date of publication of results for the quarter ended
30.06.2010 30.09.2010 31.12.2010
Official Releases and Presentations
12. CODE OF CONDUCT

35th Annual Report 2010-2011
Declaration as required under clause 49 of the listing Agreement
13. Code of Internal Procedures and Conduct for Prevention of Insider Trading
“Code of Internal Procedures and Conduct for Prevention of Insider Trading”
14. SHAREHOLDERS’ INFORMATION
i) Annual General Meeting
ii) Financial Calendar for FY 2011-12
Particulars Date
iii) Book Closure
iv) Payment of Dividend
`
`
`
v) Dividend History
Year Total paid-up capital (` in crore)
Total amount of dividend paid (` in crore)
Date of AGM in which dividend was declared
Date of payment
#

35th Annual Report 2010-2011
vi) Listing on Stock Exchanges
National Stock Exchange of India Limited
Bombay Stock Exchange Limited
Stock Code : ISIN – INE733E01010
vii) Market Price Data – NSE
Month High (`)
Low (`)
Closing (`)
viii) Market Price Data – BSE
Month High (`)
Low (`)
Closing(`)
ix) Performance in comparison to indices
BSE Sensex and NTPC Share Price
NSE NIFTY and NTPC Share Price
x) Registrar and Share Transfer Agent
xi) Share Transfer System

35th Annual Report 2010-2011
xii) Distribution of Shareholding
According to Size
Distribution of shareholding according to size, % a. of holding as on March 31, 2011:
Number of shares
Number of shareholders
% of share-holders
Total No. of shares
% of shares
72
127
379
Shareholding pattern as on March 31, 2011b.
Category Total no. of shares
% to Equity
Major Shareholdersc.
Name of Shareholder
No. of Shares
% to Paid-up Capital
Category
xiii) Dematerialisation of Shares and Liquidity
No. of shares held in dematerialized and physical mode
No. of shares % of total capital issued
The names and addresses of the Depositories are as under:
xiv) Demat Suspense Account:

35th Annual Report 2010-2011
Details of “KCL Escrow Account NTPC – IPO Offer” (account opened and maintained after IPO):
Opening Bal(as on
01.04.2010)
Disposed off during
2010-2011
Closing Bal (as on
31.03.2011)Cases Shares Cases Shares Cases Shares
Details of “NTPC LIMITED – FPO Unclaimed Shares Demat Suspense Account” (account opened and maintained after FPO):
Opening Bal(as on
01.04.2010)
Disposed off during
2010-2011
Closing Bal (as on
31.03.2011)Cases Shares Cases Shares Cases Shares
39172
xv) Outstanding GDRs/ ADRs/ Warrants or any Convertible instruments, conversion date and likely impact on equity
Number of Shares held by the Directors as on March 31, 2011
Directors No. of shares
922
Directors No. of shares
xvii) Locations of NTPC plants
National Capital Region (NCR-HQ)
Thermal Power Stations
Gas Power Stations
Eastern Region (ER-HQ)- I
Thermal Power Stations
Eastern Region (ER-HQ)- II
Thermal Power Stations

35th Annual Report 2010-2011
Northern Region (NR-HQ)
Thermal Power Stations
Southern Region (SR-HQ)
Thermal Power Stations
Gas Power Stations
Wind Energy Project, Belgaum, Karnataka
Western Region (WR-HQ)-I
Thermal Power Stations
Gas Power Stations
Western Region (WR-HQ)-II
Thermal Power Stations
HYDRO PROJECTS
JOINT VENTURE POWER PROJECTS
POWER PROJECTS UNDER SUBSIDIARY COMPANIES
Thermal Power Projects

35th Annual Report 2010-2011
Hydro Power Projects
xviii) Address for correspondence:
Telephone No.
Fax No.
Telephone No.
Fax No.
(Arup Roy Choudhury)Chairman & Managing Director
Place: New DelhiDate: May 10, 2011
ANNEX-1
Non – Mandatory Requirements
1. The Board
2. Remuneration Committee
3. Shareholder Rights
4. Audit Qualification
5. Training to Board Members
6. Mechanism for evaluating non-executive Board Members:
7. Whistle Blower Policy:

35th Annual Report 2010-2011 91
Annex-II
Schedule of Compliances with Presidential Directive issued during last three years:
Year Content of Presidential Directives Compliance
2010-2011
2009-10
1.
2.
3.
2008-2009
1.
2.
2007-2008

35th Annual Report 2010-201192
CHIEF EXECUTIVE OFFICER (CEO) & CHIEF FINANCIAL OFFICER (CFO) CERTIFICATION

35th Annual Report 2010-2011 93
AUDITORS’ CERTIFICATE

35th Annual Report 2010-2011
Annex-III to Directors’ Report
PARTICULARS REQUIRED UNDER THE COMPANIES (DISCLOSURE OF PARTICULARS IN THE REPORT OF THE BOARD OF DIRECTORS) RULES, 1988:
A. CONSERVATION OF ENERGY:
a) Energy conservation measures taken:
ENERGY AUDITS
AUXILIARY POWER CONSUMPTION
LIGHTING
HEAT ENERGY
MISCELLANEOUS WATER
b) Additional investments and proposals for reduction in consumption of energy:
`

35th Annual Report 2010-2011
c) Impact of measures taken for energy conservation:
S.No. Area/Activities Energy Unit Savings Qty. of units ` (in Crore)
1
3
Grand Total 30.621
`
B. Technology Absorption:
C. FOREIGN EXCHANGE EARNINGS AND OUTGO
Total Foreign Exchange Used/Earned (2010-2011) ` (in Crore)

35th Annual Report 2010-2011
FORM B
FORM FOR DISCLOSURE OF PARTICULARS WITH RESPECT TO ABSORPTION OF TECHNOLOGY
1.0 Specific areas in which NETRA activities have been carried out during 2010 - 11:
a. MOU Projects for 2010 – 11 Completed:2
2
b. Developmental Projects undertaken by NETRA:
2
c. Scientific Support to NTPC Stations:

35th Annual Report 2010-2011 97
d. Scientific Support to Other Utilities:
2.0 Benefits derived as a result of above Research & Technology Development:
2
3.0 FUTURE PLANS
Developmental Projects planned to be taken up:
2
2
2
4.0 Expenditure on R&D:
S.No. Description Expenditure in (`/Crore)
2010 – 2011 2009 - 2010
a)
b)
c)
d)

35th Annual Report 2010-2011
5.0 Technology Absorption, Adaptation and Innovation
S.No. Technology Year Stations
2
2
3
7

35th Annual Report 2010-2011 99
Annex-V to Directors’ Report
STATEMENT PURSUANT TO SECTION 212 OF THE COMPANIES ACT, 1956 RELATING TO SUBSIDIARY COMPANIES
NAME OF THE SUBSIDIARY*
NTPC ELECTRIC SUPPLY
COMPANY LTD.
NTPC VIDYUT VYAPAR NIGAM
LTD.
NTPC HYDRO LTD.
KANTI BIJLEE UTPADAN
NIGAM LIMITED
BHARTIYA RAIL BIJLEE
COMPANY LIMITED
` ` ` ` `

35th Annual Report 2010-2011
Annex- VI to Directors’ Report
STATISTICAL DATA OF GRIEVANCE CASES
2010-2011
S. No.
Particulars Public Grievance Cases
Staff Grievances Cases
1
1
22
2

35th Annual Report 2010-2011
Annex-VII to Directors’ Report
STATICAL INFORMATION ON RESERVATION OF SCs/STs FOR THE YEAR 2010
Representation of SCs/STs as on 01.01.2011:
Group Employees on Roll SCs %age STs %age
B
1137
Total 26104 3741 14.33 1507 5.77
Recruitment of SCs/STs during the year 2010:
Group Total Recruitment SCs %age STs %age
1129 121
B
132 1
23 7
Total 1284 159 12.38 59 4.59
Promotions of SCs/STs during the year 2010:
Group Total SCs %age STs %age
377 119
B
1237 232
31 9
Total 5624 784 13.94 269 4.78

35th Annual Report 2010-2011
Annex- VIII to Directors’ ReportPHYSICALLY CHALLENGED PERSONS
`
` `
-

35th Annual Report 2010-2011
Annex-IX to Directors’ Report
UNGC – Communication on Progress (2010-11)
Human Rights: Principle 1-2
Labour Standard: Principle 3-6

35th Annual Report 2010-2011
Environment: Principle 7-9
Anti-corruption: Principle 10

35th Annual Report 2010-2011
Annex-X to Directors’ Report
The quantity of ash produced, ash utilized and percentage of such utilization during the FY 2010-11 from NTPC Stations is as under:
Sl. No. Stations Ash Produced Ash Utilization % Utilization
Lakh MTs Lakh MTs %
1
2
3
7
9
11
12
13
Total 472.05 260.28 55.14

35th Annual Report 2010-2011
ACCOUNTING POLICIES
1. BASIS OF PREPARATION
2. USE OF ESTIMATES
3. GRANTS-IN-AID
4. FIXED ASSETS
5. CAPITAL WORK-IN-PROGRESS
6. OIL AND GAS EXPLORATION COSTS

35th Annual Report 2010-2011
7. DEVELOPMENT OF COAL MINES
8. FOREIGN CURRENCY TRANSACTIONS
9. BORROWING COSTS
10. INVESTMENTS
11. INVENTORIES
12. PROFIT AND LOSS ACCOUNT

35th Annual Report 2010-2011
`

35th Annual Report 2010-2011
`
13. LEASES
14. PROVISIONS AND CONTINGENT LIABILITIES
15. CASH FLOW STATEMENT

35th Annual Report 2010-2011
BALANCE SHEET`
As at March 31, 2011
SOURCES OF FUNDSSHAREHOLDERS’ FUNDS
1 8,245.462 59,646.79
67,892.25DEFERRED REVENUE ON ACCOUNT OF ADVANCE AGAINST DEPRECIATION 3 792.05DEFERRED INCOME FROM FOREIGN CURRENCY FLUCTUATION 62.43LOAN FUNDS
9,910.6833,277.5643,188.24
DEFERRED FOREIGN CURRENCY FLUCTUATION LIABILITY 96.54DEFERRED TAX LIABILITY (Net) 4,554.40
3,951.45602.95
TOTAL 112,634.46APPLICATION OF FUNDSFIXED ASSETS
72,755.1533,519.1939,235.96
7 33,326.344,944.29
77,506.59INVESTMENTS 9 12,344.84DEFERRED FOREIGN CURRENCY FLUCTUATION ASSET 459.15CURRENT ASSETS, LOANS AND ADVANCES
3,639.1211 7,924.3112 16,185.2613 1,046.97
6,601.1335,396.79
LESS: CURRENT LIABILITIES AND PROVISIONS10,320.48
2,752.4313,072.9122,323.88
DEFERRED EXPENDITURE FROM FOREIGN CURRENCY FLUCTUATION -TOTAL 112,634.46

35th Annual Report 2010-2011 111
PROFIT & LOSS ACCOUNT`
For the year ended March 31, 2011
INCOME17 55,152.01
278.01 54,874.00
64.68 7.81
19 2,460.81Total 57,407.30EXPENDITURE
35,373.78 2,789.71
21 2,646.01 2,485.69
22 1,552.1523 2,149.08
Total 46,996.42Profit before Tax and Prior Period Adjustments 10,410.88
(1,638.72)Profit before tax 12,049.60Provision for :
2,497.30 56.02
-
133.24 260.45
2,947.01Profit after tax 9,102.59
29.59 250.00
9,382.18Appropriations
494.94 6.87
5,200.00
2,473.63 659.63
410.84 103.93
Balance carried to Balance Sheet 32.34Expenditure during construction period (net)
` ` 11.04

35th Annual Report 2010-2011112
CASH FLOW STATEMENT`
For the year ended March 31, 2011
A. CASH FLOW FROM OPERATING ACTIVITIESNet Profit before tax and Prior Period Adjustments 10,410.88Adjustment for:
2,485.69 (1,113.05)
1,552.15 (818.79) (58.48)
90.46 3,104.40
60.03 (852.93) 1,638.72
(35.13) (7.81)
2.44 (8.16) 60.87
6,100.41Operating Profit before Working Capital Changes 16,511.29Adjustment for:
(2,804.13) (169.75) 1,478.65 (693.34) (273.12)
(2,461.69)Cash generated from operations 14,049.60
(2,954.40)Net Cash from Operating Activities - A 11,095.20
B. CASH FLOW FROM INVESTING ACTIVITIES (11,114.96)
29.42 (15,848.17)
19,268.07 (957.65)
6.19 923.12
- 35.13
Net cash used in Investing activities - B (7,658.85)C. CASH FLOW FROM FINANCING ACTIVITIES
9,845.01 (4,797.45) (3,040.55)
(63.82) (3,133.26)
(518.06) (2.44)
Net cash flow from financing activities - C (1,710.57) 1,725.78
14,459.48 16,185.26
` 10.25 crore `` 11.69 crore `

35th Annual Report 2010-2011 113
Schedules to the Balance Sheet`
As at March 31, 2011
Schedule 1
SHARE CAPITALAUTHORISED
`
` 10,000.00 ISSUED, SUBSCRIBED AND PAID-UP
`
` 8,245.46
Schedule 2RESERVES AND SURPLUS
144.74 6.87 0.27
151.88
2,228.11
1,986.72 494.94 250.00
2,231.66
49,802.80 5,200.00
55,002.80
32.34
Total 59,646.79
Schedule 3DEFERRED REVENUE ON ACCOUNT OF ADVANCE AGAINST DEPRECIATION
1,610.84 27.73 39.28
807.24
Total 792.05

35th Annual Report 2010-2011
Schedules to the Balance Sheet`
As at March 31, 2011 Schedule 4
SECURED LOANSBonds
`
1
100.00
`
2
525.00
`
2
525.00
` 3
100.00
` 3
50.00
` 300.00
` 50.00
` 400.00
`
7
900.00
` 500.00
` 500.00
` 500.00
`
9
500.00
`
9
500.00
`
9
350.00
` 9
1,000.00
` 9
550.00

35th Annual Report 2010-2011
Schedules to the Balance Sheet`
As at March 31, 2011 Schedule 4
SECURED LOANS`
9 700.00
` 9
500.00
`
9
105.00
` 9
195.00
`
9
150.00
`
9
120.00
`
9
75.00
` 9
300.00
Loans and Advances from Banks
` 156.78 crore, ` 414.47
Other Loans and Advances
` 0.56 crore `11
1.21
TOTAL 9,910.68
Notes :
1
2
3

35th Annual Report 2010-2011
Schedules to the Balance Sheet
Schedule 4
SECURED LOANSNotes :
7
9
11
Note:

35th Annual Report 2010-2011 117
Schedules to the Balance Sheet
`
As at March 31, 2011
Schedule 5
UNSECURED LOANSFixed Deposits 13.26
` 0.87 crore `
Bonds
` -
` -
` -
` 75.00
Foreign Currency Bonds / Notes
` Nil ` -
1,356.90
Loans and Advances
` 121.16 crore `2,884.39
` 647.39 crore`
6,035.20
` 1,874.67 crore ` 22,912.81
TOTAL 33,277.56

35th Annual Report 2010-2011
Schedules to the Balance Sheet
Schedule 6
FIXED ASSETS `
Net Block
As at Upto As at
31.03.2011 31.03.2011 31.03.2011
TANGIBLE ASSETS
1,861.67 - 1,861.67 498.67 105.89 392.78 514.12 153.74 360.38
2,886.16 1,128.52 1,757.64 2,101.86 768.46 1,333.40
50.57 22.02 28.55 29.75 29.75 -
588.99 272.79 316.20
1,079.18 555.47 523.71 289.37 136.87 152.50 179.69 82.03 97.66
60,769.90 29,248.84 31,521.06 482.08 282.47 199.61
352.60 234.56 118.04
11.07 5.67 5.40 138.23 70.62 67.61 303.44 138.92 164.52
88.57 44.94 43.63 27.35 14.87 12.48 29.65 11.16 18.49
2.45 1.31 1.14 171.21 120.75 50.46
2.84 - 2.84 2.84 - 2.84 2.14 - 2.14
INTANGIBLE ASSETS 6.46 1.29 5.17
199.52 6.66 192.86
90.45 81.59 8.86
Total 66,850.07 5,146.42 (758.66) 72,755.15 32,088.78 2,643.80 1,213.39 33,519.19 39,235.96 34,761.29
`
2011
Deduction/Adjustments from Gross Block for the year includes: 163.13
(806.15) (128.52)
12.88 (758.66)

35th Annual Report 2010-2011 119
Schedules to the Balance Sheet
Schedule 6
FIXED ASSETS `
2011
Deduction/Adjustments from Depreciation/Amortisation for the year includes: 81.00
1,121.08
11.31
1,213.39
Depreciation/Amortisation for the year is allocated as given below:
2,485.69
124.87
24.77
0.52
7.95 2,643.80
Schedule 7
CAPITAL WORK-IN-PROGRESS As at
31.03.2011
408.24 18.33
505.24
2,404.82 384.22
7.49 53.04
2,513.28 241.22 154.33 119.45
25,830.16 8.84 2.22 0.18 0.18
114.06 0.27 0.19 2.24 0.03
12.74 7.65
195.05 32,983.47
Expenditure pending allocation 82.33
(280.32) 153.56 54.16
2,723.74 2,371.69
33,345.25 18.91
Total 33,326.34

35th Annual Report 2010-2011
Schedules to the Balance Sheet `
As at March 31, 2011
Schedule 8
CONSTRUCTION STORES AND ADVANCES CONSTRUCTION STORES *
868.72
37.94
1,263.77
2,170.43
1.44
2,168.99
ADVANCES FOR CAPITAL EXPENDITURE
17.36
1,673.50
1,084.44
2.21
2,777.51
2.21
2,775.30
Total 4,944.29
1,500.74
As at March 31, 2011
Schedule 9
INVESTMENTS
`
I. LONG TERM (Trade - unless otherwise specified)
A) Quoted
Equity Shares (fully paid-up)
12.00
Sub Total (A) 12.00
B) Unquoted (fully paid-up)
a) Bonds
i) 8.50 % Tax-Free State Government Special Bonds of the Government of ( # )
630.33
25.73
947.20
241.61

35th Annual Report 2010-2011 121
As at March 31, 2011
Schedule 9 (Cont.)
INVESTMENTS
`
418.62
537.50
16.69
183.68
480.06
501.20
415.42
190.70
551.44
173.11
58.00
17.10
1,994.95
199.83
587.12
b) Equity Shares in Joint Venture Companies
1.00
3.00
475.25
581.00
692.90
658.52
0.05
25.00
73.43
Schedules to the Balance Sheet `

35th Annual Report 2010-2011122
As at March 31, 2011
Schedule 9 (Cont.)
INVESTMENTS
`
5.88
2.19
153.00
31.34
2.62
1.40
0.63
c) Equity Shares in Subsidiary Companies
-
0.08
20.00
113.96
57.15
355.20
d) Shares in Cooperative Societies ß
Sub Total (B) 11,423.89
C) Share application money pending allotment in :
0.50
164.73
318.96
154.26
60.00
-
11.00
-
-
0.08
24.38
Sub Total (C) 733.91
Total (I) 12,169.80
Schedules to the Balance Sheet `

35th Annual Report 2010-2011 123
As at March 31, 2011
Schedule 9 (Cont.)
INVESTMENTS
`
II. CURRENT (Non-trade - unquoted)
Mutual Funds
175.04
Total (II) 175.04
Total (I + II) 12,344.84
Quoted Investments
12.00
100.92
Unquoted Investments
12,332.84
` 6,518.83 crore `
`
Mutual Funds No. of Units Purchase Cost
` `
ß Shares in Co-operative societies (unquoted) 2011
5,000
2,500
5,000
2,700
5,000
5,000
5,000
30,200
Schedules to the Balance Sheet `

35th Annual Report 2010-2011
Schedules to the Balance Sheet `
As at March 31, 2011
Schedule 10
INVENTORIES
1,741.25 5.48
1,255.50 191.22 117.37 45.81 16.50
319.03 3,692.16
2.34
50.70
Total 3,639.12
132.07
Schedule 11
SUNDRY DEBTORS
840.84
840.84
9,450.76
10,291.60
840.84
1,526.45
Total 7,924.31
Schedule 12
CASH & BANK BALANCES
` 0.36 crore ` 0.36
30.80
295.18
15,858.92
Total 16,185.26
` 10.25 crore `
` 11.69 crore `
Schedule 13
OTHER CURRENT ASSETS
382.33 608.35 43.52 10.34 2.43
Total 1,046.97

35th Annual Report 2010-2011
Schedules to the Balance Sheet `
As at March 31, 2011
Schedule 14
LOANS AND ADVANCES
456.62
152.66
0.25
574.36
21.71
50.00
0.02
25.38
2.24
722.16
1.41
11.61
0.08
9,789.49
7,171.59
2,617.90
145.37
-
1,638.79
11.96
6,432.52
13.70
6,418.82
182.31
Total 6,601.13
37.06
0.11
101.00
0.15
127.88

35th Annual Report 2010-2011
Schedules to the Balance Sheet `
As at March 31, 2011 Schedule 15
CURRENT LIABILITIES
2.62 3,797.17
6.61 3,821.50
4.12 1,616.69
11.06 9,237.65
451.25 206.07 10.25
32.78 121.48 258.86
2.14 Total 10,320.48
Schedule 16PROVISIONS
- 2,553.32
(4,618.27) 7,171.59
-
659.63 659.63 659.63 659.63
107.23 103.93 107.23 103.93
2,034.57 383.31 641.65 44.26
1,731.97
266.76 13.79 19.78 5.37
255.40
2.39 0.74 0.02 1.61 1.50
Total 2,752.43

35th Annual Report 2010-2011 127
Schedules to the Profit & Loss Account `
For the year ended March 31, 2011
Schedule 17
SALES
54,892.80
(11.55)
79.75
(1.54)
54,982.56
169.45
Total 55,152.01
` 338.51 crore `` 21.72 crore `
Schedule 18
PROVISIONS WRITTEN BACK
-
0.04
0.01
0.11
1.89
5.15
0.15
0.46
7.81

35th Annual Report 2010-2011
Schedules to the Profit & Loss Account `
For the year ended March 31, 2011
Schedule 19
OTHER INCOME
Income from Long Term Investments
14.00
21.13
799.76
` Nil ` -
-
-
-
-
Income from Current Investments (Non-Trade)
53.17
Income from Others
` 126.57 crore `
50.85
1,195.32
20.45
116.16
36.42
3.16
-
-
10.81
2.59
8.16
31.34
153.80
2,517.12
24.91
31.34
0.06
Total 2,460.81
Schedule 20
EMPLOYEES’ REMUNERATION AND BENEFITS
2,764.00
337.83
293.44
3,395.27
171.79
28.98
404.79
Total 2,789.71

35th Annual Report 2010-2011 129
Schedules to the Profit & Loss Account `For the year ended March 31, 2011Schedule 21GENERATION, ADMINISTRATION & OTHER EXPENSES
144.04 15.93
128.11 294.48
31.33 22.21 6.81
15.40 98.35
125.29
1,272.43 0.71
1,273.14 97.05 91.87 24.06 38.50
70.85 4.77
66.08 35.08
149.82 24.48 2.75
21.73 2.87
13.78 244.68
12.83 13.80 1.34
12.46 25.41
1.86 -
79.48 0.43
79.05 1.64 0.23
1.41 0.28
1.59 39.39
- 39.39 12.29 15.69 12.22
3.64 43.10 71.42
0.05 4.50
60.87 3,149.68
210.46 14.04
279.17Total 2,646.01
807.11

35th Annual Report 2010-2011
Schedules to the Profit & Loss Account `
For the year ended March 31, 2011
Schedule 22
PROVISIONS
4.83
1,526.45
0.25
1.45
8.80
0.33
9.29
0.75
Total 1,552.15
Schedule 23
INTEREST AND FINANCE CHARGES
Interest on :
805.35
177.52
1,703.92
1.24
162.75
3.61
75.85
174.16
3,104.40
Finance Charges :
1.85
35.57
25.92
(2.42)
711.28
4.96
3.00
0.59
0.09
-
6.50
0.87
0.39
788.60
Sub-Total 3,893.00
7.67
1,736.25
Total 2,149.08

35th Annual Report 2010-2011 131
Schedules to the Profit & Loss Account `
For the year ended March 31, 2011
Schedule 24
PRIOR PERIOD INCOME/EXPENDITURE (NET)
INCOME
520.62
0.02
520.64
EXPENDITURE
(2.49)
1.35
(1,113.05)
0.13
-
-
(0.04)
0.70
-
-
-
(0.63)
(1,114.03)
Net Expenditure/(Income) (1,634.67)
4.05
-
Total (1,638.72)

35th Annual Report 2010-2011132
Schedules to the Profit & Loss Account `
For the year ended March 31, 2011
Schedule 25
EXPENDITURE DURING CONSTRUCTION PERIOD (NET)
A. Employees remuneration and other benefits
340.64
32.32
31.83
Total (A) 404.79
B. Other Expenses
80.73
1.01
79.72
58.60
2.96
5.91
0.24
11.39
17.54
0.38
1.03
4.77
28.76
6.91
0.12
6.79
0.48
37.91
2.02
2.60
0.16
0.71
1.61
5.45
1.30
1.35
0.96
24.07
Total (B) 279.17
C. Depreciation 24.77
Total (A+B+C) 708.73

35th Annual Report 2010-2011 133
Schedules to the Profit & Loss Account `
For the year ended March 31, 2011
D. Interest and Finance Charges
504.95
86.26
1,066.78
37.47
14.63
0.05
-
21.55
4.56
Total (D) 1,736.25
E. Less: Other Income
22.74
1.61
-
0.56
TOTAL (E) 24.91
F. Prior Period Adjustments 4.05
GRAND TOTAL (A+B+C+D-E+F) 2,424.12*
* Balance carried to Capital Work-in-progress - (Schedule 7)

35th Annual Report 2010-2011
SCHEDULE-26NOTES ON ACCOUNTS
11,043 acres ` 538.18 crore `` 135.58 crore ` 8,995 acres
` 252.51 crore `
819 acres ` 29.67 crore `
1,181 acres
1,245 acres ` 15.03 crore `
` 118.74 crore `
98 acres 79 acres19 acres ` 0.21 crore `
` 0.21 crore
` 6.46 crore `
` 199.52 crore `
` 6.13 crore `
` 48,935.31 crore `
` 47,519.21 crore `
` 4,528.39 crore`
` 4,416.12 crore `
` 800.87 crore `
` 1,262.86 crore
` 79.75 crore
` 252.22 crore
` 2,698.86 crore `

35th Annual Report 2010-2011
` 263.59 crore
` 115.58 crore`
` 94.56 crore ` 468.78 crore
` 276.80 crore ` ` 269.70 crore `
` 7.17 crore `
` 0.37 crore
` 255.82 crore
` 748.82 crore
1,489 acres
` 190.19 crore `
35th Annual Report 2010-2011
` 1,116.50 crore ` 279.62 crore` 1,396.12 crore
` 727.49 crore
` 212.67 crore
` ` ` `` `
` 0.43 crore `
. Disclosure as per Accounting Standard (AS) 15
A. Provident Fund
` 191.19 crore `
B. Gratuity & Pension
` 0.10 crore
C. Post-Retirement Medical Facility (PRMF)
D. Terminal Benefits
E. Leave

35th Annual Report 2010-2011 137
Expenses recognised in Profit & Loss Account `
Gratuity/Pension
PRMF Leave Terminal Benefits
The amount recognised in the Balance Sheet `
Gratuity/Pension
PRMF Leave Terminal Benefits
Changes in the present value of the defined benefit obligations: `
Gratuity/Pension
PRMF Leave Terminal Benefits
Changes in the fair value of plan assets: `
Gratuity/Pension
PRMF Leave Terminal Benefits
35th Annual Report 2010-2011
`
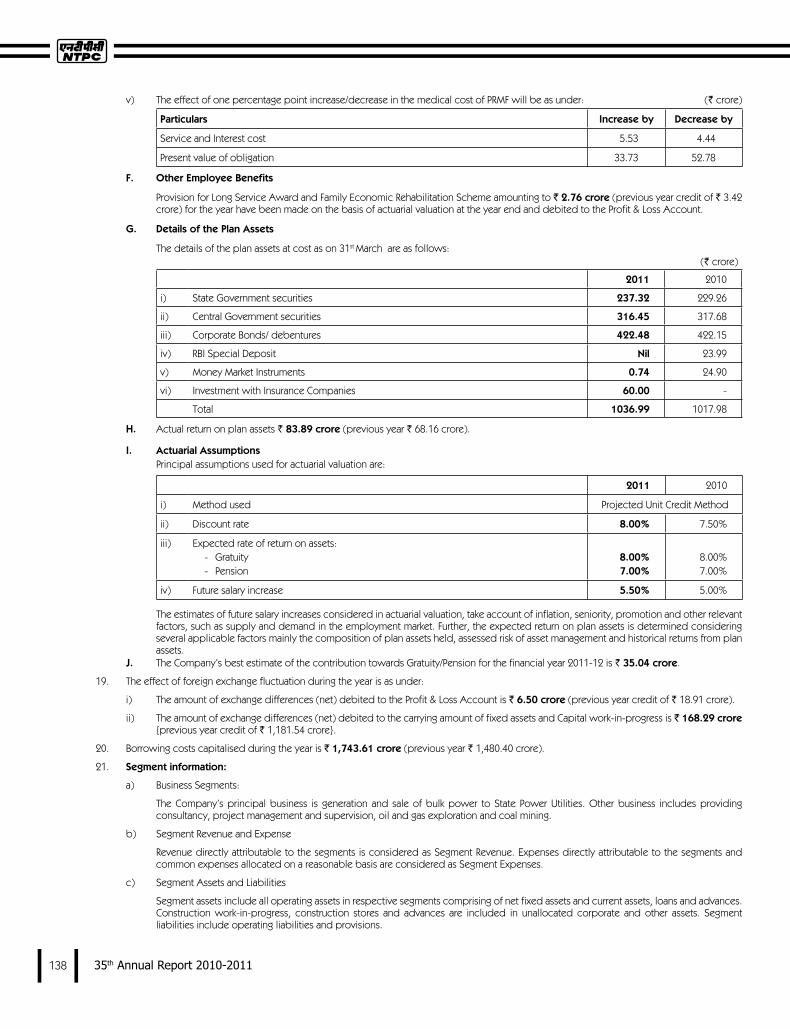
Particulars Increase by Decrease by
F. Other Employee Benefits
` 2.76 crore `
G. Details of the Plan Assets
`
2011
237.32
316.45
422.48
Nil
0.74
60.00
1036.99
H. ` 83.89 crore `
I. Actuarial Assumptions
2011
8.00%
8.00%7.00%
5.50%
J. ` 35.04 crore
` 6.50 crore `
` 168.29 crore`
` 1,743.61 crore `
Segment information:

35th Annual Report 2010-2011 139
`
Business Segments
Generation Others Total
Current Year Current Year Current Year
54,704.55 169.45 54,874.00
64.68 - - 64.68
54,769.23 169.45 54,938.68
12,094.83 50.20 12,145.03
2,166.43
2,261.86
12,049.60
2,947.01
9,102.59
53,166.50 110.76 53,277.26
72,430.11
53,166.50 110.76 125,707.37
7,906.27 106.51 8,012.78
49,802.34
7,906.27 106.51 57,815.12
1,333.45 0.13 1,333.58
1,542.64 1.45 1,544.09
11,864.09 270.21 12,134.30
` 1,139.38 crore `` 10,955.45 crore `
Related Party Disclosures:
1
2
3
7

35th Annual Report 2010-2011
`
Particulars Current Year
Transactions during the year
:240.5214.15
0.500.57
1.000.36
0.600.87
47.1617.52
0.660.93
` 4.18 crore `
` 3.06 crore `` 0.11 crore `
23. Disclosure regarding leases:
a) Finance leases
`
31.03.2011
0.680.70
-1.38
0.570.64
-1.210.17
b) Operating leases
` 70.23 crore `
Earning per share:
Current Year
` 9,102.59
824,54,64,400
` 11.04
` 10/-

35th Annual Report 2010-2011
`
31.03.2011
6,082.92
1,205.52
323.00
1,528.52
4,554.40
3,951.45
602.95
` 393.69 crore `
` 28.30 crore `
Interest in Joint Ventures:
a) Joint Venture Entities :
Company Proportion of ownership interest as on(Excluding Share Application Money)
31.03.2011
% age
50
50
50
50
30.17
50
50
50
50
49
50
16.67
14.28
25
44.60
25
50

35th Annual Report 2010-2011
`
31.03.2011
• 10,573.99
• 1,255.69
11,829.68
• 7,472.12
• 1,127.83
8,599.95
123.10
2,673.05
Current Year
2,442.99
2,125.75
b) Joint Venture Operations:
`
Item 2010-11 (Un-audited)
3.11
0.03
3.14
81.03
(equivalent ` 33.99 crore)
`
Item 2010-11(Un-audited)
0.43
14.64
1.92
78.50

35th Annual Report 2010-2011
Foreign currency exposure not hedged by a derivative instrument or otherwise `
31.03.2011
JPY7,157.373,125.17
441.21
1,144.72540.9530.31
2.08
2,361.573,311.03
25.22
` 112.75 crore `` 34.96 crore `
` 77.79 crore `
`
Current year
0.82
0.29
0.82
0.74
0.20
2.87
`
Sl. Particulars Amount
`
`
Name of Subsidiary Outstanding Balance as at
Maximum Amount Outstanding
31.03.2011 31.03.2011
7.82 12.56
1.25 9.20
0.38 14.07
36.11 37.10
1.53 2.14
47.09 75.07

35th Annual Report 2010-2011
`
Name of the Company
31.03.2011 31.03.2011
21.71 26.29
Nil Nil
`
` 23,779.74 crore `
Contingent Liabilities:
` 3,485.85 crore `
` 1,851.08 crore `
` 1,246.62 crore `
`
` 146.97 crore `
` 2,465.26 crore`
` 1,793.36 crore `
` 398.74 crore `
`
Current Year
2.26
0.40
0.40
0.28

35th Annual Report 2010-2011
`
Current Year
29,892
162
141
220,379
206,582
`
965.31
98.73
`
5.80
514.43
12.21
`%age Amount %age Amount
21.68 7,835.18
78.32 28,304.29
`
1.01
0.11

35th Annual Report 2010-2011
Information pursuant to Part IV of Schedule VI of the Companies Act, 1956
BALANCE SHEET ABSTRACT AND COMPANY'S GENERAL BUSINESS PROFILEI. Registration Details
7 9 1 9 7 7
3 1 3 1 1II. Capital Raised during the year (Amount in ` Thousands).
III. Position of Mobilisation and Deployment of Funds (Amount in ` Thousands)
2 9 2 3 2 9 2 3
Sources of Funds
2 9 7 7
9 9 1 3 3 3 2 7 7 9
2 9 7 1 9 1 1 2
Application of Funds
7 7 9 1 2 3
2 2 3 2 3 9 3
9 1
IV. Performance of Company (Amount in ` Thousands)
7 7 3 3 3 7 9 9 2
1 2 9 3 9 1 2 9 2
`
1 1 3
V. Generic Names of Three Principal Products/Services of Company (as per monetary terms)
F Y
Y
F P W

35th Annual Report 2010-2011
AUDITORS’ REPORTTo the Members of
NTPC LIMITED
NTPC LIMITED

35th Annual Report 2010-2011
ANNEXURE TO THE AUDITORS’ REPORTStatement referred to in paragraph (3) of our report of even date to the members of NTPC LIMITED on the accounts for the year ended 31st March 2011
`
Sl.No. Name of Statute Nature of dues Forum where the dispute is pending ` crore
1
2
Total 172.86

35th Annual Report 2010-2011

35th Annual Report 2010-2011
COMMENTS OF THE COMPTROLLER AND AUDITOR GENERAL OF INDIA UNDER SECTION 619(4) OF THE COMPANIES ACT, 1956 ON THE ACCOUNTS OF NTPC LIMITED, NEW DELHI, FOR THE YEAR ENDED 31 MARCH 2011

35th Annual Report 2010-2011
Revenue Expenditure on Social Overheads for the Year ended 31st March 2011`
1
2
3
7
9
EMPLOYEE COST SUMMARY`
2010-11
3,101.83
293.44
111.64
24.45
120.34
5.04
14.84
22.23
591.98
Total ( A+B ) 1,003.40 1,015.70 1,108.30 1,149.90 1,286.60 1,540.30 2,425.00 3,099.60 3,117.30 3,693.81
23,797
23,770
` 1,304,935
` 249,045
` 1,553,980

35th Annual Report 2010-2011
SUBSIDIARY COMPANIESNTPC ELECTRIC SUPPLY COMPANY LIMITED
DIRECTORS’ REPORT
FINANCIAL RESULTS`
2010-11
Total Income/Revenue 64.05
Profit before Tax 9.09
Profit after Tax 6.01
Balance available for appropriation 49.20
Surplus carried forward 43.93
DIVIDEND
` ` `
OPERATIONAL REVIEW
``
FIXED DEPOSITS
31
AUDITORS’ REPORT AND MANAGEMENT COMMENTS THEREON
C&AG REVIEW
CONSERVATION OF ENERGY, TECHNOLOGY ABSORPTION, FOREIGN EXCHANGE EARNING AND OUTGO
PARTICULARS OF EMPLOYEES
DIRECTORS’ RESPONSIBILITY STATEMENT
DIRECTORS
ACKNOWLEDGEMENT
For and on behalf of the Board of Directors
(ARUP ROY CHOUDHURY)Chairman

35th Annual Report 2010-2011
ANNEXURE-IMANAGEMENT DISCUSSION AND ANALYSIS
INDUSTRY STRUCTURE AND DEVELOPMENTSDISTRIBUTION
Development of Renewable Energy Sources (RES)
STRENGTH AND WEAKNESS
OPPORTUNITIES AND OUTLOOK
RISKS AND CONCERNS
INTERNAL CONTROL
PERFORMANCE DURING THE YEAROperations

35th Annual Report 2010-2011
Project Management Consultancy Services
Financial Performance
`
2010-1157.256.80
Total 64.05
`
2010-1132.17
16.16Total operating expenses 48.33
`
2010-11Total operating expenses 48.33
0.196.44
Total Expenses including operating expenses 54.96
`
` `
2010-119.09
-9.093.08
Net profit after tax 6.01
` `
Reserves & Surplus`
`
Current Assets, Loans and Advances`
` `
31.3.20118.59
919.0110.1114.77
Total Current Assets, Loans and Advances 952.48
Current Liabilities and Provisions
` `
`
31.3.2011898.14
4.92Total Liabilities and Provisions 903.06
Cash Flow Statement `
2010-11
1103.70
(186.36)
6.35
(4.68)
(184.69)
919.01
` `
Financial Indicators
2010-11` 50.73
` 50.7317.92%11.85%
4944` 743.42
Human Resources
CAUTIONARY STATEMENT
For and on behalf of the Board of Directors
(ARUP ROY CHOUDHURY)Chairman

35th Annual Report 2010-2011
ACCOUNTING POLICIES1. BASIS OF PREPARATION
2. USE OF ESTIMATES
3. FIXED ASSETS
4. INVESTMENTS
5. PROFIT AND LOSS ACCOUNT
`
`
6. PROVISIONS AND CONTINGENT LIABILITIES
7. CASH FLOW STATEMENT
NTPC ELECTRIC SUPPLY COMPANY LIMITEDBALANCE SHEET AS AT 31st MARCH 2011
`Schedule 31.03.2011 31.03.2010
SOURCES OF FUNDSSHAREHOLDERS’ FUNDS
1 8091002 506539836
655227TOTAL 508004163APPLICATION OF FUNDSFixed Assets 3
198156849074896
10740788INVESTMENTS 3100000CURRENT ASSETS, LOANS AND ADVANCES
859120759190067223
7 101113709147663575
9524756582LESS : CURRENT LIABILITIES AND PROVISIONS
9 898138163749211570
9030593207494163375
TOTAL 508004163
19
For Bhudladia & Company
(Puneet Singla) (Vishwaroop) (A K Singhal) (Arup Roy Choudhury)
PROFIT AND LOSS ACCOUNT FOR THE PERIOD ENDED 31st MARCH 2011`
Schedule 31.03.2011 31.03.2010INCOME
11 57254401212 4545813 67953955
Total 640543425EXPENDITURE
321689390
161585430
1921997
17 64364005Total 549560821Profit before Tax & Prior Period Adjustments 90982604
- Profit before tax 90982604Provision for:
3080300029804
30832804Profit after tax 60149800
431934036492083836
6100000
- 40000000
- 6644000
Balance carried to Balance Sheet 439339836
`743.42
For Bhudladia & Company
(Puneet Singla) (Vishwaroop) (A K Singhal) (Arup Roy Choudhury)

35th Annual Report 2010-2011
NTPC ELECTRIC SUPPLY COMPANY LIMITEDSchedule 1CAPITAL `
31.03.2011Authorised
`` 100000000
Issued, Subscribed and Paid-Up``
809100
Schedule 2RESERVES AND SURPLUS
`31.03.2011
61100000
6100000
67200000
439339836 Total 506539836
Schedule 3 FIXED ASSETS `
As at As at31.03.2011 31.03.2011
TANGIBLE ASSETS190549 -
11424232 73012447264008 3439544
936895 - Total 18825670 1043301 53287 7167713 1921997 14814 9074896 11657957
18825670 11657957
Schedule 4INVESTMENTS
`
`
31.03.2011
LONG TERM
500000
2600000 Total 3100000
Schedule 5SUNDRY DEBTORS
298478
85613597Total 85912075
Schedule 6CASH AND BANK BALANCES
3064971568883570067
Total 9190067223
Schedule 7OTHER CURRENT ASSETS
993712091742500
Total 101113709
Schedule 8LOANS & ADVANCES
604095
1501533
400107732 254549785
145557947 Total 147663575
Schedule 9CURRENT LIABILITIES `
31.03.2011
620370627361113
226908271667258
38047614610128522
844094119278168519
Total 8981381637
Schedule 10PROVISIONS
- 30803000
(223746785)254549785
-
40000000400000004000000040000000
6798000664400067980006644000
3811992 -
12444222567570
45458 -
45458 -
Total 49211570
Schedule 11SALES
572544012Total 572544012
Schedule 12PROVISIONS WRITTEN BACK
45458Total 45458

35th Annual Report 2010-2011
Schedule 13OTHER INCOME `
31.03.201111809
` `
513273198
451784557
614886416441816
47046985
Total 67953955
Schedule 14EMPLOYEES’ REMUNERATION AND BENEFITS
2829601602472794714001282
Total 321689390
Schedule 15ADMINISTRATION AND OTHER EXPENSES
6820444291505
4617926146179261
419129121454
421539630083774
767200119250
647950105650
26664720600
1533312353890
11350124154 111139
4861653912450
11077291192748
188494542290377
Total 161585430
Schedule 16PROVISIONS
- Total -
Schedule 17INTEREST AND FINANCE CHARGES
64361447
2558Total 64364005
Schedule 18PRIOR PERIOD INCOME/EXPENDITURE (NET)INCOME - EXPENDITURE
- -
Total -
` `
` `
`
31.03.2011
6,70,327
(15,100)
-6,55,227
``
CompanyProportion of ownership interest as on (excluding Share Application Money)
31.03.201150%
`31.03.2011
674.95205.75880.70
B 85.13795.57880.70 25.42
-Current Year
943.81F 879.83
``
` `
`
Current Year4841.34
54653.28
30551.50
Nil
2.23
SCHEDULE - 19NOTES ON ACCOUNTS
Current Year` 6,01,49,800
80,910
` 743.42` 10.00

35th Annual Report 2010-2011
`
Current Year66,00024,500
15,150-
1,05,650`
`
` `
` `
`
Current Period18,86,338 1,61,418
99,681
`
BALANCE SHEET ABSTRACT AND COMPANY’S GENERAL BUSSINESS PROFILEI. Registration Details
1 2 2 1 1 3
3 1 3 2 1 1II. Capital Raised during the year (` in Thousands)
III. Position of Mobilization and Deployment of Funds (Amount in ` Thousands)
9 3 9 7 9 3 9 7Source of Funds
9
Application of Funds
1 7 1 3 1
9 1 3
IV. Performance of Company(Amount in ` Thousands)
7 2 9 1
9 9 3 1`
7 3 2 9 3 7V. Generic Name of three Principal Product/Services of Company
For Bhudladia & Company
(Puneet Singla) (Vishwaroop) (A K Singhal) (Arup Roy Choudhury)
CASH FLOW STATEMENT FOR THE YEAR ENDED 31st MARCH 2011`
31.03.2011A. CASH FLOW FROM
OPERATING ACTIVITIES Net Profit/(Loss) before tax and Prior Period Adjustments
90982604
Adjustment for:1921997
- (61488641)
- (45458)
Operating Profit before Working Capital Changes
31370502
Adjustment for: 120446042
(1981831932)
144247576093031 (1840868102)
Cash generated from operations
(1809497599)
Direct Taxes Paid 54081250Net Cash from Operating Activities - A
(1863578850)
B. CASH FLOW FROM INVESTING ACTIVITIES
(1004828)64465618
-Net cash flow from Investing Activities - B
63460790
C. CASH FLOW FROM FINANCING ACTIVITIES
(40000000)(6798000)
Net Cash flow from Financing Activities - C
(46798000)
D. OTHERS - Net Increase/Decrease in Cash & Cash equivalents (A + B + C + D)
(1846916059)
Cash & cash equivalents (Opening balance)
11036983283
Cash & cash equivalents (Closing balance)
9190067223
For Bhudladia & Company
(Puneet Singla) (Vishwaroop) (A K Singhal) (Arup Roy Choudhury)
AUDITORS’ REPORT

35th Annual Report 2010-2011
ANNEXURE TO THE AUDITORS’ REPORT
`
Statue Nature of Dues Amount (`)
Forum where disputes are pending
COMMENTS OF THE COMPTROLLER AND AUDITOR GENERAL OF INDIA UNDER SECTION 619 (4) OF THE COMPANIES ACT, 1956, ON THE ACCOUNTS OF NTPC ELECTRIC SUPPLY COMPANY LIMITED FOR THE YEAR ENDED 31 MARCH 2011.

35th Annual Report 2010-2011
NTPC HYDRO LIMITED
DIRECTORS’ REPORT
OPERATIONAL REVIEW
FINANCIAL REVIEW
`
Particulars FY 2010-11 FY 2009-10
MANAGEMENT DISCUSSION & ANALYSIS
FIXED DEPOSITS
31
AUDITORS’ REPORT
COMPTROLLER & AUDITOR GENERAL REVIEW
AUDIT COMMITTEE
PARTICULARS OF EMPLOYEES
CONSERVATION OF ENERGY, TECHNOLOGY ABSORPTION, FOREIGN EXCHANGE EARNING & OUTGO
DIRECTORS RESPONSIBILITY STATEMENT
31
BOARD OF DIRECTORS
ACKNOWLEDGEMENT

35th Annual Report 2010-2011
ANNEXURE-IMANAGEMENT DISCUSSION AND ANALYSIS REPORT
I. INDUSTRY STRUCTURE AND DEVELOPMENT
Installed Capacity (MW)
Total 173626.40
II. STRENGTHS
Strong design and engineering support
Power Purchase Agreements with customers
III. OPPORTUNITIES
IV. OUTLOOK
V. RISK & CONCERNS/WEAKNESS/ THREATS
VI. INTERNAL CONTROL SYSTEM
VII. FINANCIAL PERFORMANCE
` ` `
VIII. HUMAN RESOURCE
IX. ENVIRONMENT PROTECTION
X. CAUTIONARY STATEMENT
INSTALLED CAPACITY (MW)
22%
3%

35th Annual Report 2010-2011
SIGNIFICANT ACCOUNTING POLICIES
1. BASIS OF PREPARATION
2. USE OF ESTIMATES
3. FIXED ASSETS
4. CAPITAL WORK-IN-PROGRESS
5. PROFIT AND LOSS ACCOUNT
EXPENDITURE
1
2
3
`
`
6 PROVISIONS AND CONTINGENT LIABILITIES
7. CASH FLOW STATEMENT
NTPC HYDRO LIMITEDBALANCE SHEET AS AT 31st March 2011
`As at
31.03.2011SOURCES OF FUNDS
1 1,139,595,000
5,000,000 Total 1,144,595,000 APPLICATION OF FUNDS FIXED ASSETS
2 232,061,369 7,328,951
224,732,418 3 790,905,993
71,667,987 1,087,306,398
CURRENT ASSETS, LOANS AND ADVANCES
2,086,045 312,249
7 10,311 2,408,605
LESS: CURRENT LIABILITIES & PROVISIONS
26,442,624 9 4,071
26,446,695 (24,038,090)
PROFIT & LOSS ACCOUNT 81,326,692 Total 1,144,595,000
For M/s KSMN & COMPANY
(Praveen Kumar Verma) (Manish Kumar) (A K Singhal) (Arup Roy Choudhury)

35th Annual Report 2010-2011
NTPC HYDRO LIMITEDPROFIT & LOSS ACCOUNT FOR THE YEAR ENDED 31st MARCH, 2011
` Current Year
31.03.2011INCOME
- EXPENDITURE
11 - 12 - 2 - 13 -
Total Expenditure - Loss before Tax and Prior Period Adjustment
-
- Loss before Tax -
- Loss after Tax
(81,326,692)Balance carried to Balance Sheet (81,326,692)
-
For M/s KSMN & COMPANY
(Praveen Kumar Verma) (Manish Kumar) (A K Singhal) (Arup Roy Choudhury)
NTPC HYDRO LIMITEDSCHEDULES – FORMING PART OF ACCOUNT
`
As at31.03.2011
Schedule 1
CAPITAL
AUTHORISED
`
`
5,000,000,000
ISSUED,SUBSCRIBED AND PAID-UP
` 1,139,595,000
Total 1,139,595,000
Schedule 2
FIXED ASSETS `
Gross Block Depreciation Net Block
Fixed Assets As at31.03.2011
Upto31.03.2011
As at31.03.2011
TANGIBLE ASSETS
Land
156,618,560 - 156,618,560
17,534,711 1,910,947 15,623,764
78,825 25,408 53,417
4,841,852 2,313,010 2,528,842
4,232,545 2,765,825 1,466,720
82,569 14,277 68,292
48,101,711 - 48,101,711
INTANGIBLE ASSETS
570,596 299,484 271,112
Total 232,061,369 7,328,951 224,732,418
229,738,740 5,557,631 224,181,109
Current YearDepreciation for the year is allocated as given below:-
1,552,769 1,552,769
Total
Schedule 3CAPITAL WORK-IN-PROGRESS
As at 31.03.2011 27,039,851
208,518,960 81,520,537
420,628,666 53,197,979
Total 790,905,993 683,358,940

35th Annual Report 2010-2011
Schedule 4CONSTRUCTION STORES AND ADVANCES `
As at31.03.2011
ADVANCES FOR CAPITAL EXPENDITURE -
16,393,679 55,274,308
Total 71,667,987
Schedule 5CASH & BANK BALANCES
2,036,045 50,000
Total 2,086,045
`
Schedule 6LOANS AND ADVANCESADVANCES
149,194
100,000
63,055
Total 312,249
Schedule 7OTHER CURRENT ASSETS
10,311
Total 10,311
Schedule 8CURRENT LIABILITIES
11,796,603
4,061,432 5,758,246
- 21,616,281 3,792,166
25,408,447 1,034,177
Total 26,442,624
Schedule 9PROVISIONS
265,671 -
261,600 Total 4,071
Schedule 10Other Income
4,839
83,477 -
88,316 88,316
Total -
Schedule 11EMPLOYEES’ REMUNERATION AND BENEFITS `
As at31.03.2011
39,108,461 3,475,157 1,419,877
44,003,495 Less: 44,003,495
Total -
Schedule 12ADMINISTRATION & OTHER EXPENSES `
Current Year 110,040
4,562 4,788,311
1,464,868 958,717 15,771
1,723,799 88,240 30,000 29,651
383,010 193,906
2,279,854
560,144 15,113 65,240 7,645
559,026 27,521
227,380 503,500 52,000
683,242 14,771,540
Less: 14,771,540
Total -
Schedule 13FINANCE CHARGES
10,041 Less: 10,041
Total -
Schedule 14PRIOR PERIOD EXPENDITUREExpenditure
- -
(305,972) 218,551 (87,421)
Less: (87,421)
Total -

35th Annual Report 2010-2011
Schedule 15EXPENDITURE DURING CONSTRUCTION `
Current YearA. Employees remuneration and other benefits
39,108,461 3,475,157 1,419,877
Total (A) 44,003,495
B. Administration & Other Expenses 110,040
4,562 4,788,311
1,464,868 958,717 15,771
1,723,799 88,240 30,000 29,651
383,010 193,906
2,279,854
560,144 15,113 65,240 7,645
559,026 27,521
227,380 503,500
52,000 683,242
Total (B) 14,771,540
C. Depreciation 1,552,769 Total (C ) 1,552,769
D. Interest & Finance Charges Capitalised 10,041
Total (D) 10,041
E. Fringe Benefit Tax - Total (E) -
F. Prior Period Expenditure
(87,421) Total (F) (87,421)
G. Other Income 88,316 Total (G) 88,316 Total (A+B+C+D+E+F-G) 60,162,108
Schedule 16
NOTES ON ACCOUNT
` `
` `
` `
``
`
Current Year
0
101267769
` -
101267769
` -
` 10
``
``
``
`
Current Year
2831682
254836
151759

35th Annual Report 2010-2011
BALANCE SHEET ABSTRACT AND COMPANY’S GENERAL BUSSINESS PROFILEI. Registration Details
1 1 2 2 1 1 1 3
3 1 3 2 1 1II. Capital Raised during the year (Amount in ` Thousands)
1 3 1
III. Position of Mobilization and Deployment of funds (Amount in ` Thousands)
1 1 7 1 2 1 1 7 1 2Source of Funds
1 1 3 9 9
Application of Funds
1 7 3
2 3
1 3 2 7IV. Performance of Company(Amount in ` Thousands)
`
V. Generic Name of three Principal Product/Services of Company
F Y
For M/s KSMN & COMPANY
(Praveen Kumar Verma) (Manish Kumar) (A K Singhal) (Arup Roy Choudhury)
Cash Flow Statement for the Period Ended on 31st March 2011S.N. Particulars Current Period 2010-11A CASH FLOW FROM OPERATING
ACTIVITIES
Operating Profit before Working Capital Changes
(16738034)4145677
4178 (12588179)
Cash generated from operations
Net Cash from Operating Activities-A (12588179)B CASH FLOW FROM INVESTING
ACTIVITIES(108030619)
(108030619)C CASH FLOW FROM FINANCING
ACTIVITIES119104600
Net cash flow from Financing Activities-C
119104600
Net Increase/Decrease in Cash and Cash equivalents (A-B+C)
(1514198)
Cash and cash equivalents (Opening Balance)
3600243
Cash and cash equivalents (Closing Balance)
2086045
For M/s KSMN & COMPANY
(Praveen Kumar Verma) (Manish Kumar) (A K Singhal) (Arup Roy Choudhury)
AUDITORS’ REPORT
To the Members of NTPC Hydro Limited
31
Annexure referred to in paragraph 3 of our report of even date,

35th Annual Report 2010-2011
COMMENTS OF THE COMPTROLLER AND AUDITOR GENERAL OF INDIA UNDER SECTION 619 (4) OF THE COMPANIES ACT, 1956, ON THE ACCOUNTS OF NTPC HYDRO LIMITED FOR THE YEAR ENDED 31 MARCH 2011.

35th Annual Report 2010-2011
NTPC Vidyut Vyapar Nigam Limited(A wholly owned subsidiary of NTPC Limited)
Directors’ Report
FINANCIAL RESULTS `
FY 2010-11Total Income/Revenue 78.95
33.82Profit before Tax 45.13
15.07Profit after tax 30.06
0.79Profit available for appropriation 30.85
13.0015.002.43
Surplus carried forward 0.42
DIVIDEND` `
`
POWER TRADING-BUSINESS
`
`
BUSINESS INITIATIVES
FIXED DEPOSITS
31MANAGEMENT DISCUSSION AND ANALYSIS
AUDITORS’ REPORT
REVIEW OF ACCOUNTS BY THE COMPTROLLER & AUDITOR GENERAL OF INDIA
CONSERVATION OF ENERGY, TECHNOLOGY ABSORPTION, FOREIGN EXCHANGE EARNING AND OUTGO
`
PARTICULARS OF EMPLOYEES
AUDIT COMMITTEE
DIRECTORS’ RESPONSIBILITY STATEMENT
BOARD OF DIRECTORS

35th Annual Report 2010-2011
ANNEXURE - IMANAGEMENT DISCUSSION AND ANALYSIS
INDUSTRY STRUCTURE AND DEVELOPMENTS
``
Total 810
Total 54
STRENGTH AND WEAKNESS
OPPORTUNITIES AND THREATS
OUTLOOK
ACKNOWLEDGMENT
For and on behalf of the Board of Directors
(ARUP ROY CHOUDHURY)Chairman
RISKS AND CONCERNS
INTERNAL CONTROL
PERFORMANCE DURING THE YEAR
Operations
FY 2010-11
34043529
Total 6933
Financial Performance
`
FY 2010-111549.301534.92 14.38
13.7330.31
-
20.53Total 78.95

35th Annual Report 2010-2011
``
`
2010-110.12
-24.48
8.97Total operating expenses 33.57
`
``
`
2010-1133.57
0.060.19
33.82
``
2010-1145.1315.07
Net profit after tax 30.06
` `
Dividend
` ` `
Reserves & Surplus
`
Current Assets, Loans and Advances
` `
`
31.03.20110.02
117.55144.71
3.214.24
269.73
` `
` `
Current Liabilities and Provisions`
`
`
31.03.201184.5717.56
102.13
` `
Cash Flow Statement `
2010-11112.2238.795.36
(11.66)32.49
144.71
` `
Financial Indicators
`
Description 2010-11108.91108.91
B 41.44%27.60%
75` 15.03
` `
Human Resources
CAUTIONARY STATEMENT
For and on behalf of the Board of Directors
(ARUP ROY CHOUDHURY)Chairman

35th Annual Report 2010-2011 171
NTPC VIDYUT VYAPAR NIGAM LIMITEDACCOUNTING POLICIES1. BASIS OF PREPARATION
2. USE OF ESTIMATES
3. FIXED ASSETS
4. FOREIGN CURRENCY TRANSACTIONS
5. INVENTORIES
6. PROFIT AND LOSS ACCOUNT 6.1. INCOME RECOGNITION
6.2. EXPENDITURE
`
`
7. OPERATING LEASE
8. PROVISIONS AND CONTINGENT LIABILITIES
9. CASH FLOW STATEMENT
BALANCE SHEET AS AT 31st MARCH 2011`
31.03.2011SOURCES OF FUNDSSHAREHOLDERS’ FUNDS
1 2000000002 889094005
Sub-total (Shareholders’ funds) 1089094005FLY ASH UTILIZATION FUND 3 589596896DEFERRED TAX LIABILITY (Net) 149151TOTAL 1678840052APPLICATION OF FUNDSFIXED ASSETS
656673037300472836683
CURRENT ASSETS, LOANS AND ADVANCES
2260251175528357
7 144704230632129710
9 42373864Sub-total (Current Assets, Loans and Advances) 2697300262LESS: CURRENT LIABILITIES AND PROVISIONS
84570004511 175596848
Sub-total (Current Liabilities and Provisions) 1021296893
1676003369TOTAL 1678840052
For Aiyar & Co.
(C.Chuttani) (Nitin Mehra) (A.K.Singhal) (Arup Roy Choudhury)
PROFIT & LOSS ACCOUNT FOR THE YEAR ENDED 31st MARCH 2011`
Current YearINCOME
12 281155124303136135
13 205226941Total 789518200EXPENDITURE
1220373 -
5743038932299358
244748386566034
17 1956513Total 338221053Profit before Tax 451297147
150727389 (12134)
Total (a+b) 150715255 Profit after tax 300581892
7961907308543799130000000150000000
24333750Balance carried to Balance Sheet 4210049
` 15.03
For Aiyar & Co.
(C.Chuttani) (Nitin Mehra) (A.K.Singhal) (Arup Roy Choudhury)

35th Annual Report 2010-2011172
SCHEDULES FORMING PART OF ACCOUNTS`
31.03.2011Schedule 1SHARE CAPITAL AUTHORISED
`` 200000000
ISSUED, SUBSCRIBED AND PAID UP`
` 200000000
Schedule 2RESERVES AND SURPLUS
754883956130000000884883956
4210049Total 889094005
`
31.03.2011Schedule 3
FLY ASH UTILIZATION FUND
106227627
580162287
2205544
55768507
38818967
96793018
Total 589596896
Schedule 4FIXED ASSETS `
Gross Block Depreciation Net Block As at
31.03.2011upto
31.03.2011 As at
31.03.2011TANGIBLE ASSETS
1195000 94604 11003961829467 673824 1155643
3301185 2720541 580644INTANGIBLE ASSETS
241078 241078 - Total 6110716 456014 - 6566730 3164013 566034 - 3730047 2836683 2946703
6110716 27911 3164013 2946703
Current YearDeductions/Adjustments from Gross Block includes
- - - -
Deductions/Adjustments from Depreciation includes - - -
`
31.03.2011Schedule 5INVENTORIES
226025
Schedule 6SUNDRY DEBTORS
-
1175528357Total 1175528357
Schedule 7CASH & BANK BALANCES
106303491436411957
Total 1447042306` `
`
31.03.2011
Schedule 8
OTHER CURRENT ASSETS
32129710
Schedule 9
LOANS AND ADVANCES
125000
706994457
689325593
17668864
24580000
Total 42373864

35th Annual Report 2010-2011 173
`
31.03.2011Schedule 10CURRENT LIABILITIES
7481352351254012141352102
802027458401423533530234
Total 845700045
Schedule 11PROVISIONS
152348969(536976624)
689325593-
100000000150000000100000000150000000
16608750243337501660875024333750
1056502320664
-114068
1263098Total 175596848
`
Current YearSchedule 12SALES
281155124
-Total 281155124
Schedule 13OTHER INCOME
` ` 76304879877424
7724789050796748
-Total 205226941
`
Current YearSchedule 14COST OF FLY ASH/ASH PRODUCTS
2205544
2205544Total
Schedule 15EMPLOYEES’ REMUNERATION AND BENEFITS
9737111483641607463622
11319889655768507
Total 57430389
Schedule 16ADMINISTRATION & OTHER EXPENSES
152744729084055
245722266774
300000017500
5384576417511
291609547940
80246541015283367430
364621615592
73546351792220
174152614118
204102471118325
38818967Total 32299358
Schedule 17INTEREST AND FINANCE CHARGES
9835316227001721053
235460Total 1956513

35th Annual Report 2010-2011
SCHEDULE 18
NOTES ON ACCOUNTS
` `
` `` `
`
`
``
` `
``
`
Particulars
Business Segments Total
Energy Trading Fly Ash/Ash products trading
Current YearCurrent Year Current Year
REVENUE
281155124 - 281155124
127829106 1092956 128922062
Total 408984230 1092956 410077186
Segment Results 375522012 1092956 376614968
76304879
1622700
150715255
Profit after Tax 300581892
OTHER INFORMATION
Segment assets 1632899913 837438458 2470338371
229798574
Total Assets 2700136945
Segment Liabilities 746376357 686653448 1433029805
178013135
Total Liabilities 1611042940
566034
456014
` `
Current Year
` 3,00,581,892
2,00,00,000
` 15.03
` 10

35th Annual Report 2010-2011
(`)
31.03.2011
Deferred Tax Liability
1,49,151
Less: Deferred Tax Assets
NIL
Deferred tax Liability (Net) 1,49,151
` 12,134`
(`)
Current Year
50,000
-
-
(2060)*
47,940
`
` `
` `
`
(`)
Current Year
25,53,152
2,16,043
1,56,871
NIL
Current Year
3404
3529
2337115
600
`
2, 92,562
For Aiyar & Co.
(C.Chuttani) (Nitin Mehra) (A.K.Singhal) (Arup Roy Choudhury)
Information pursuant to Part IV of Schedule VI of the Companies Act, 1956BALANCE SHEET ABSTRACT AND COMPANY’S GENERAL BUSSINESS PROFILE
I. Registration Details
1 2 2 1 1 7
3 1 3 2 1 1II. Capital Raised during the year (Amount in ` Thousands)
III. Position of Mobilization and Deployment of funds (Amount in ` Thousands)
2 7 1 3 7 2 7 1 3 7Source of Funds
2 9 9
9 9 7
1 9Application of Funds
2 3 7
1 7 3
IV. Performance of Company (Amount in ` Thousands)
7 9 1 3 3 2 2 1
1 2 9 7 3 2`
1 3 7V. Generic Name of three Principal Product/Services of Company
For Aiyar & Co.
(C.Chuttani) (Nitin Mehra) (A.K.Singhal) (Arup Roy Choudhury)

35th Annual Report 2010-2011
CASH FLOW STATEMENT FOR THE YEAR ENDED 31ST MARCH 2011`
Current Year
A. CASH FLOW FROM OPERATING ACTIVITIES
Net profit before tax 451297147
Adjustment for:
-
(74117265)
Operating Profit before Working Capital Changes 377179882
Adjustment for:
483369269
168712403
Cash generated from operations
545892285
Direct taxes paid (158016000)
Net Cash from Operating Activities-A 387876285
B. CASH FLOW FROM INVESTING ACTIVITIES
Net Cash used in Investing Activities -B 53614740
C. CASH FLOW FROM FINANCING ACTIVITIES
(100000000)
(16608750)
Net Cash flow from Financing Activities-C
(116608750)
Net Increase/(Decrease) in Cash and Cash equivalents (A+B+C) 324882275
Cash and Cash equivalents (Opening balance) * 1122160031
Cash and Cash equivalents (Closing balance)* 1447042306
` `
For Aiyar & Co.
(C.Chuttani) (Nitin Mehra) (A.K.Singhal) (Arup Roy Choudhury)
AUDITORS’ REPORT
To the Members ofNTPC VIDYUT VYAPAR NIGAM LIMITED
NTPC VIDYUT VYAPAR NIGAM LIMITED

35th Annual Report 2010-2011 177
ANNEXURE TO THE AUDITORS’ REPORT
31
COMMENTS OF THE COMPTROLLER AND AUDITOR GENERAL OF INDIA UNDER SECTION 619 (4) OF THE COMPANIES ACT, 1956, ON THE ACCOUNTS OF NTPC VIDYUT VYAPAR NIGAM LIMITED, NEW DELHI FOR THE YEAR ENDED, 31 MARCH, 2011

35th Annual Report 2010-2011
KANTI BIJLEE UTPADAN NIGAM LIMITEDDIRECTORS’ REPORT
VISION
MISSION
OPERATIONAL AND COMMERCIAL PERFORMANCE
MILESTONES ACHIEVED
2 2
FINANCIAL REVIEW
`
Particulars FY 2010-11 FY 2009-1088,50,75,370
2,56,15,22,3372,98,04,80,256
61,11,30,1791,60,03,97,5251,59,97,08,3354,10,41,68,904
7,912,39,6071,20,39,11,807
48,58,07,3172,48,32,980
65,64,67,05914,58,26,762
` (1.66)
FIXED DEPOSITS
31CONSERVATION OF ENERGY, TECHNOLOGY ABSORPTION, FOREIGN EXCHANGE EARNING & OUTGO
INCLUSIVE GROWTH
AUDIT COMMITTEE
AUDITORS’ REPORT
COMPTROLLER & AUDITOR GENERAL REVIEW
PARTICULARS OF EMPLOYEES`
`
DIRECTORS’ RESPONSIBILITY STATEMENT
31BOARD OF DIRECTORS
ACKNOWLEDGEMENT

35th Annual Report 2010-2011 179
Annex-1 to the Directors’ ReportMANAGEMENT DISCUSSION AND ANALYSIS
INDUSTRY SECTOR AND DEVELOPMENTS
GENERATIONExisting Installed Capacity
Total Capacity MW % share
Total 173626.40 100%
Generation
Total Generation
Target(Million Units)
Achievement(Million Units)
% of achievement
Total 824208.5 805494.11 97.72
Capacity Utilisation
SWOT ANALYSISStrength/ Opportunity:
Weakness/ Threats:
RISK AND CONCERN
Hazard risks
Financial Risks
Operational risks
INTERNAL CONTROL
FINANCIAL DISCUSSION AND ANALYSIS
``
``
```
` `` `
``
`
HUMAN RESOURCE

35th Annual Report 2010-2011
KANTI BIJLEE UTPADAN NIGAM LIMITED
ACCOUNTING POLICIES 2010-111. BASIS OF PREPARATION
2. USE OF ESTIMATES
3. GRANTS-IN-AID
4. FIXED ASSETS
5. CAPITAL WORK-IN-PROGRESS
6. FOREIGN CURRENCY TRANSACTIONS
7. BORROWING COSTS
8. INVENTORIES
9 EXPENDITURE
`
`
OUTLOOK
CAUTIONARY STATEMENT

35th Annual Report 2010-2011
KANTI BIJLEE UTPADAN NIGAM LTD.BALANCE SHEET AS AT 31ST MARCH, 2011
`
As at31.03.2011
SOURCES OF FUNDSSHAREHOLDERS’ FUNDS
1 885075370.00
2561522337.002 2980480256.00
6427077963.00LOAN FUNDS
3 611130179.00TOTAL 7038208142.00APPLICATION OF FUNDSFIXED ASSETS
1774138423.54173740898.42
1600397525.121599708335.41
4104168904.107304274764.63
CURRENT ASSETS, LOANS AND ADVANCES7 24207989.20
430925117.509 224230095.76
4861631.0011 107014773.47
791239606.93LESS: CURRENT LIABILITIES AND PROVISIONS
12 1173849583.9213 30062223.00
1203911806.92Net current assets (412672199.99)
Profit & Loss account 146605577.36TOTAL 7038208142.00
22
For GRA & Assiciates
(S. K. Agrawal) (Ruchi Aggarwal) (P. K. Rai) (Arup Roy Choudhury)
KANTI BIJLEE UTPADAN NIGAM LTD.PROFIT & LOSS ACCOUNT FOR THE YEAR ENDED 31ST MARCH, 2011
`
For the year ended March
31, 2011INCOME
485486583.50320734.20
24832980.04Total 510640297.74EXPENDITURE
353324561.67104094008.10
50678199.75
109807982.70336890.46
19 38227027.16Total 656468669.84Profit before Tax and Prior Period Adjustments
(145828372.10)
(1610.24)Profit before tax (145826761.86)Provision for :
0.00Profit after tax (145826761.86)
(778815.50)Balance carried to Balance Sheet (146605577.36)Expenditure during construction period (net)
``
(1.66)
For GRA & Assiciates
(S. K. Agrawal) (Ruchi Aggarwal) (P. K. Rai) (Arup Roy Choudhury)
`
10. PROVISIONS AND CONTINGENT LIABILITIES
11. CASH FLOW STATEMENT

35th Annual Report 2010-2011
`
As at 31.03.2011
Schedule 1
SHARE CAPITAL
AUTHORISED
`
`
10000000000.00
ISSUED, SUBSCRIBED AND PAID-UP
`
`
885075370.00
`
` 885075370.00
`
As at 31.03.2011
Schedule 2RESERVES AND SURPLUS
1874907150.001129144894.00(23571788.00)
2980480256.00Total 2980480256.00
Schedule 3 SECURED LOANS
393987321.00
` `
217142858.00
Total 611130179.00Schedule 4FIXED ASSETS `
Gross Block Depreciation Net BlockAs at
31.03.2011Upto
31.03.2011As at
31.03.2011TANGIBLE ASSETSLand :
33.00 4.26 28.7412430863.00 2391021.60 10039841.40
113508719.00 31505460.66 82003258.34191498666.00 30690291.29 160808374.71
4444628.00 882613.66 3562014.3418393666.00 919683.30 17473982.70
1412081340.19 100487495.57 1311593844.6210197021.47 3221797.34 6975224.134690718.44 2526290.90 2164427.54
0.00 0.00 0.005462417.33 279986.89 5182430.44366565.02 27030.48 339534.54112566.50 2858.50 109708.0034946.00 25856.93 9089.0747845.29 0.00 47845.29
INTANGIBLE ASSETS868428.30 780507.04 87921.26
Total 1774138423.54 173740898.42 1600397525.12334868757.22 56811103.96 278057653.26
Deduction/Adjustments from Gross Block for the year includes: 2011
(6800.00)(33.00)
699644.48Total 692811.48Deduction/Adjustments from Depreciation for the year includes:
(3.07)
1064336.48Total 1064333.41Deduction/adjustments from depreciation for the year includes:
109807982.708186147.77
Total 117994130.47

35th Annual Report 2010-2011
Schedule 5CAPITAL WORK-IN-PROGRESS `
Sub Total 2086952643.59 1447444672.47 905053974.50 1435202567.47 1194140774.09Expenditure pending allocation
Grand Total 1468733115.60 1694559564.78 128381777.50 1435202567.47 1599708335.41
`
As at 31.03.2011
Schedule 6CONSTRUCTION STORES AND ADVANCES
4855409.52899238.65
792292469.54798047117.71
798047117.71ADVANCES FOR CAPITAL EXPENDITURE
1217166610.692088955175.703306121786.39
Total 4104168904.10
667236879.00
Schedule 7INVENTORIES
628177.25
14503502.009300244.16
3120.00597451.25 -
25032494.6640495.00
784010.46
Total 24207989.20
8594053.00
`
As at 31.03.2011
Schedule 8SUNDRY DEBTORS
0.000.00
430925117.50430925117.50
Total 430925117.50
Schedule 9CASH & BANK BALANCES
`
0.00
9179826.04215050269.72
Total 224230095.76
Schedule 10OTHER CURRENT ASSETS
4861631.00
Total 4861631.00
Schedule 11LOANS AND ADVANCES
94261459.18

35th Annual Report 2010-2011
`
As at 31.03.2011
Schedule 11 (Cont.)
5000.00
1791410.00
668027.2996725896.47
10288877.00Total 107014773.47
Schedule 12CURRENT LIABILITIES
125110.29788141684.61
54348.51176299147.42144260262.95
26036331.99
899476.001134017409.77
39832174.15Total 1173849583.92
Schedule 13PROVISIONS
24822209.005783269.00(543255.00)
30062223.00
Total 30062223.00
`
For the year ended March
31, 2011Schedule 14SALES
485486583.50Total 485486583.50
Schedule 15OTHER INCOME Income from Others
` `
8301390.00901356.00
24587508.0133790254.01
8957273.97Total 24832980.04
`
For the year ended March
31, 2011Schedule 16EMPLOYEES’ REMUNERATION AND BENEFITS
186135763.5415154372.0015658643.01
216948778.55
112854770.45
Total 104094008.10
Schedule 17GENERATION, ADMINISTRATION & OTHER EXPENSES
320734.20
232815.1387919.07
266537.20
-0.00
7614108.48
45957742.83 72185515.6245957742.83
295803.217206494.70
63184.00316971.00145257.00
0.00145257.00
2018187.8912279241.682104294.00188852.00
1915442.00109169.0019200.00
53139482.22557529.87
4395675.0059555.00
4336120.00191094.75
0.00191094.75
2104244.0015905100.00
934937.00341366.84
9114310.261033002.21
165952445.21
115274245.46Total 50678199.75
11679321.37

35th Annual Report 2010-2011
`
For the year ended March
31, 2011Schedule 18PROVISIONS
336890.460.00
Sub-Total 336890.46
0.00
Total 336890.46
Schedule 19INTEREST AND FINANCE CHARGES Interest on :
65324745.00Finance Charges :
1248700.68
1248700.68Sub-Total 66573445.68
28346418.52Total 38227027.16
Schedule 20PRIOR PERIOD INCOME/EXPENDITURE (NET)INCOME
0.00EXPENDITURE
(364688.93)
(364688.93)Net Expenditure/(Income) (364688.93)
(363078.69)Total (1610.24)
Schedule 21EXPENDITURE DURING CONSTRUCTION PERIOD (NET)
98654556.236805127.007395087.22
Total (A) 112854770.45B. Other Expenses
0.00
145398.34 (145398.34)
0.00
5961566.6626286535.4032248102.06
3963709.70316971.00887841.71
6551190.922185523.00106852.00
2078671.0035526.0019200.00
42793191.58
`
For the year ended March
31, 2011Schedule 21 (Cont.)
178936.002449000.00
0.001677759.00
15905100.006000.00
207032.606101412.23
Total (B) 115274245.46C. Depreciation 8186147.77Total (A+B+C) 236315163.68D. Interest and Finance Charges
28142372.84204045.68
Total 28346418.52E. Less: Other Income
7495910.001461363.97
TOTAL (E) 8957273.97F. Prior Period Adjustments (363078.69)GRAND TOTAL (A+B+C+D-E+F) 255341229.54*
Schedule-22
Notes on Accounts:
``
`
`
`
`
` `
` `

35th Annual Report 2010-2011
BALANCE SHEET ABSTRACT AND COMPANY’S GENERAL BUSSINESS PROFILE
I. Registration Details
1 2 2 1 3 1 7
3 1 3 2 1 1
II. Capital Raised during the year (Amount in ` Thousands)
III. Position of Mobilization and Deployment of funds (Amount in ` Thousands)
7 3 2 7 3 2
Source of Funds
7 2 9
1 1 1 3
Application of Funds
7 3 2 7
1 2 7 2
IV. Performance of Company(Amount in ` Thousands)
9
1 2 7 1 2 7
`
1
V. Generic Name of three Principal Product/Services of Company
F Y
(S.K. Agarwal) (Ruchi Aggarwal) (P.K. Rai) (A.R. Choudhury)
`
` `
` `
Related Party Disclosures:
Operating leases-
` `
Earning per share :-
Current year
` (145827323)
88507537
` (1.65)
` -
` 10/-
Current Year
` 55150
` 33090
`
` `
Current year
199.40
169.29
120.17
103.94

35th Annual Report 2010-2011
CASH FLOW STATEMENT FOR THE YEAR ENDED 31st MARCH, 2011
`
For the year ended March
31, 2011
A. CASH FLOW FROM OPERATING ACTIVITIES
Net Profit/(Loss) before tax and Prior Period Adjustments
(145826762)
Adjustment for:
116929795
336890
(8301390) 108965295
Operating Profit before Working Capital Changes
(36861467)
Adjustment for:
(299684317)
(14859804)
932735907
(96195918)
(2266876) 519728992
Cash generated from operations 482867525
0
Net Cash from Operating Activities - A 482867525
B. CASH FLOW FROM INVESTING ACTIVITIES
(4258495216)
Net Cash Flow from Investing Activities - B (4258495216)
C. CASH FLOW FROM FINANCING ACTIVITIES
227398542
1105573106
8301390
2517722337
Net Cash Flow from Financing Activities - C 3858995375
Net increase/Decrease in cash and cash equivalents (A+B+C)
83367685
Cash and cash equivalents (Opening Balance)
140862411
Cash and cash equivalents (Closing Balance)
224230096
(S.K. Agarwal) (Ruchi Aggarwal) (P.K. Rai) (A.R. Choudhury)
AUDITOR’S REPORT
KANTI BIJLEE UTPADAN NIGAM LTD.
ANNEXURE TO AUDITORS’ REPORT

35th Annual Report 2010-2011
` `
COMMENTS OF THE COMPTROLLER AND AUDITOR GENERAL OF INDIA UNDER SECTION 619 (4) OF THE COMPANIES ACT, 1956, ON THE ACCOUNTS OF KANTI BIJLEE UTPADAN NIGAM LTD., NEW DELHI FOR THE YEAR ENDED 31 MARCH 2011.

35th Annual Report 2010-2011
BHARTIYA RAIL BIJLEE COMPANY LIMITED DIRECTORS’ REPORT
OPERATIONAL REVIEW
`
FINANCIAL REVIEW
`
Particulars FY 2010-11 FY 2009-10
AUDIT COMMITTEE
FIXED DEPOSITS
PARTICULARS OF EMPLOYEES
``
AUDITORS’ REPORT
COMPTROLLER & AUDITOR GENERAL REVIEW
CONSERVATION OF ENERGY, TECHNOLOGY ABSORPTION, FOREIGN EXCHANGE EARNING & OUTGO
DIRECTORS’ RESPONSIBILITY STATEMENT
DIRECTORS
ACKNOWLEDGEMENT:

35th Annual Report 2010-2011
RISK AND CONCERN
Hazard risks
Operational risks
INTERNAL CONTROL
FINANCIAL DISCUSSION AND ANALYSIS
`` `
`` `
``
`
`
` `
`
`
`
HUMAN RESOURCE
`
REHABILITATION AND RESETTLEMENT PLAN
Annex-1 to the Directors’ ReportMANAGEMENT DISCUSSION AND ANALYSIS
INDUSTRY SECTOR AND DEVELOPMENTS
GENERATION
Existing Installed Capacity
Total Capacity MW % share
Total 173626.40 100%
Existing Generation
Total Generation Target(Million Units)
Achievement(Million Units)
% of achievement
Total 824208.5 805494.11 97.72
Capacity Utilisation
SWOT ANALYSIS
Strength/ Opportunity:
Weakness/ Threats:
OUTLOOK

35th Annual Report 2010-2011 191
CAUTIONARY STATEMENT
Bhartiya Rail Bijlee Company Limited
ACCOUNTING POLICIES : 2010-11
1. BASIS OF PREPARATION
2. USE OF ESTIMATES
3. FIXED ASSETS
4. CAPITAL WORK-IN-PROGRESS
5. FOREIGN CURRENCY TRANSACTIONS
6. BORROWING COSTS
7. PROFIT AND LOSS ACCOUNT
EXPENDITURE
`
`
8. PROVISIONS AND CONTINGENT LIABILITIES
9. CASH FLOW STATEMENT

35th Annual Report 2010-2011192
BHARTIYA RAIL BIJLEE COMPANY LIMITEDBALANCE SHEET AS AT 31st MARCH, 2011
`
Current Year 31.03.2011
SOURCES OF FUNDSSHAREHOLDERS’ FUNDS
1 4,800,000,000 2 2,914,639,000
7,714,639,000 LOAN FUNDS
3 1,245,531,352 TOTAL 8,960,170,352 APPLICATION OF FUNDSFIXED ASSETS
1,834,521,271 12,319,754
1,822,201,517 2,044,359,389 4,129,152,396 7,995,713,302
CURRENT ASSETS, LOANS AND ADVANCES7 1,426,802,430
2,130,654 9 5,795,848
1,434,728,932 LESS: CURRENT LIABILITIES AND PROVISIONS
475,390,870 11 -
959,338,062 5,118,988
TOTAL 8,960,170,352
H.S. Madan A. Chaudhuri S. K. Saxena B. P. Singh
BHARTIYA RAIL BIJLEE COMPANY LIMITEDPROFIT AND LOSS ACCOUNT FOR THE YEAR ENDED 31ST MARCH, 2011
`
Current Year 31.03.2011
INCOME12 -
TOTAL - EXPENDITURE
13 -
231,384
- -
TOTAL 231,384 -
Profit / (Loss) before Tax (231,384)Provision for :
-
Profit / (Loss) After Tax (231,384)Balance(Loss) brought forward (4,887,604)Balance (Loss) carried to Balance Sheet (5,118,988)
17
` ` 0.00
H.S. Madan A. Chaudhuri S. K. Saxena B. P. Singh
SCHEDULES FORMING PART OF ACCOUNTS
`
Current Year 31.03.2011
SCHEDULE - 1CAPITALAUTHORISED
` 16,060,000,000
`
` 4,800,000,000
`
Total 4,800,000,000
`
Current Year 31.03.2011
SCHEDULE - 2SHARE CAPITAL DEPOSIT
1,542,639,000
1,372,000,000 Total 2,914,639,000
SCHEDULE - 3Secured Loan 1,245,531,352
Total 1,245,531,352

35th Annual Report 2010-2011 193
SCHEDULE -4FIXED ASSETS `
GROSS BLOCK DEPRECIATION NET BLOCK As at
31.03.2011 Upto
31.03.2011 As at
31.03.11
TANGIBLE ASSETS
1,585,278,764 - 1,585,278,764 534,632 326,758 207,874
13,575,154 6,591,008 6,984,146
81,296 8,281 73,015
42,724 9,943 32,781
10,476,855 1,813,490 8,663,365
1,542,232 83,240 1,458,992 4,034,672 990,205 3,044,467
19,442,887 1,753,137 17,689,750 3,037,587 233,121 2,804,466 2,073,711 133,976 1,939,735
1,361,344 148,509 1,212,835 192,020,631 - 192,020,631
- - 1,018,782 228,086 790,696
TOTAL 1,468,794,303 365,727,238 270 1,834,521,271 4,670,802 7,709,767 60,815 12,319,754 1,822,201,517 1,464,123,501
1,468,794,303 4,670,802 1,464,123,501
Current year (`) `
270 270
Current year (`) `
60,545 270
60,815
Current year (`) `
- 7,709,767 7,709,767
SCHEDULE-5CAPITAL WORK-IN-PROGRESS `
As at 31.03.11
151059693 74,000
18041977828159990
23,789 1,241,798
49,748 1,867,401
400,165,861 36,884,642
- 19,150,000
819,096,700 Expenditure pending allocation
785,746,251 439,516,438
1,225,262,689 TOTAL 824,359,877 1,421,665,926 - 201,666,414 2,044,359,389
1,761,923 824,359,877

35th Annual Report 2010-2011
`
Current Year 31.03.2011
SCHEDULE - 6
CONSTRUCTION STORES AND ADVANCES
201,567,198
21,146,160
60,462,260
283,175,618
-
283,175,618
3,192,389,997
653,586,781
3,845,976,778
-
3,845,976,778
Total 4,129,152,396
SCHEDULE - 7
CASH & BANK BALANCES
5,839
Balances with Scheduled Banks
26,796,591
1,400,000,000
Total 1,426,802,430
SCHEDULE - 8
OTHER CURRENT ASSETS
2,130,654
Total 2,130,654
SCHEDULE - 9
LOANS & ADVANCES
8,112
3,190,805
2,596,931
Total 5,795,848
SCHEDULE - 10
CURRENT LIABILITIES
Sundry Creditors
For Capital Expenditure
12,071,232
315,390,418
For Goods & Services
15,326,469
17,557,984
51,629,996
63,414,771 Total 475,390,870
`
Current Year 31.03.2011
SCHEDULE - 11PROVISIONS
- - -
Employee Benefits - - -
-
SCHEDULE - 12OTHER INCOME
10,686,901 `
`
11,107,211 303,582 489,770
Total 22,587,464
22,587,464 -
SCHEDULE - 13EMPLOYEES REMUNERATION AND BENEFITS
109,973,997
9,240,327 10,515,800
129,730,124
129,730,124 -
SCHEDULE - 14ADMINISTRATION AND OTHER EXPENSES
3,810,367
7,599,082 492,268 121,824
- 231,384
1,690,914
7,790,859 5061632
50640 5,010,992
44,120 32,031
172,961 4,958,146
721,808 868,292 29,959 838,333
- 1,445,676
19,070 3,336,705
66,520

35th Annual Report 2010-2011
`
Current Year 31.03.2011
SCHEDULE - 14 (Cont.) 141,722 80,160
657,218 10265256499752
- 7,802
3,799,643 401,711
7,628,999
86,753
4,512 82,241 1,159,980
- 59,868,813
59,637,429 Total 231,384
SCHEDULE - 15INTEREST AND FINANCE CHARGESFINANCE CHARGES
8,465,955 46,647,690 20,663,326
Total : 75,776,971
75,776,971 Total : -
SCHEDULE - 16PRIOR PERIOD ADJUSTMENT:
(60,545) -Total (60,545) -
(60,545) -
Total - -
SCHEDULE - 17EXPENDITURE DURING CONSTRUCTION A. EMPLOYEES REMUNERATION AND
BENEFITS
109,973,997 9,240,327
10,515,800 Total (A) 129,730,124
B. ADMINISTRATION AND OTHER EXPENSES 3,810,367
7,599,082 492,268 121,824
- 1,690,914
7,790,859 5061632
50640 5,010,992
44,120 32,031
172,961
`
Current Year 31.03.2011
SCHEDULE - 17 (Cont.) 4,958,146
721,808 868,292 29,959 838,333
- 1,445,676
19,070 3,336,705
66,520 141,722
80,160 657,218 10265256499752
- 7,802
3,799,643 401,711
7,628,999
86,753
4,512 82,241 1,159,980
- Total (B) 59,637,429 C. DEPRECIATION 7,709,767 D. INTEREST AND FINANCE CHARGES
8,465,955 46,647,690 20,663,326
Total (D) 75,776,971 E. LESS : OTHER INCOME
10,686,901 11,107,211
303,582 489,770
Total (E) 22,587,464 F. FRINGE BENEFIT TAX
- Total (F) - G. PRIOR PERIOD ADJUSTMENT:
(60,545) Total (G) (60,545)GRAND TOTAL (A+B+C+D-E+F+G) 250,206,282
SCHEDULE-18
NOTES ON ACCOUNTS:
` `
` `
` `

35th Annual Report 2010-2011
Current Year
` (2,31,384)
45,87,39,726
` (0.00)
`
` `
` `
` `
``
`
`
Current Year (`) `
22,46,113
1,63,5206,04,481
`
`
`
`
` ` `
` `
BALANCE SHEET ABSTRACT AND COMPANY’S GENERAL BUSSINESS PROFILE
I. Registration Details
1 2 2 7 P 1 7 1
3 1 3 2 1 1
II. Capital Raised during the year (Amount in ` Thousands)
III. Position of Mobilization and Deployment of funds (Amount in ` Thousands)
9 3 1 9 3 1
Source of Funds
2 9 1 3 9
1 2 3 1
Application of Funds
7 9 9 7 1 3
9 9 3 3
1 1 9
IV. Performance of Company (Amount in ` Thousands)
2 3 1
2 3 1 2 3 1
`
V. Generic Name of three Principal Product/Services of Company
F Y
H.S. Madan A. Chaudhuri S.K. Saxena B. P. Singh

35th Annual Report 2010-2011 197
BHARTIYA RAIL BIJLEE COMPANY LIMITEDCASH FLOW STATEMENT FOR THE YEAR ENDED 31ST MARCH, 2011
`
Current Year A. CASH FLOW FROM OPERATING
ACTIVITIES (231,384)
Adjustment for: -
Operating Loss before Working Capital Changes
(231,384)
Adjustment for: 88,722,821 (1,946,258)
(693,621) 86,082,942
Net Cash from Operating Activities-A 85,851,558 B. CASH FLOW FROM INVESTMENT
ACTIVITIES (2,351,524,797)
Net Cash used in Investing Activities-B (2,351,524,797)C. CASH FLOW FROM FINANCING
ACTIVITIES 800,000,000
1,453,100,000 1,245,531,352
3,498,631,352 Net Increase/(Decrease) in Cash and Cash equivalents (A+B+C) 1,232,958,113
193,844,317
1,426,802,430
NOTES :
H.S. Madan A. Chaudhuri S.K. Saxena B. P. Singh
AUDITORS’ REPORT TO THE MEMBERS OFBHARTIYA RAIL BIJLEE COMPANY LIMITED
ANNEXURE TO AUDITORS’ REPORT
BHARTIYA RAIL BIJLEE COMPANY LIMITED
However, Share Capital Deposit still has an unadjusted balance of ` 291.46 Crores as on 31/03/2011 against which no shares have been allotted by Company so far.
Company has awarded a Consultancy Contract of ` 76.00 Crores to NTPC Ltd., holding Company. During this year, amount paid/payble is to the tune of ` 29.09 Crores (total payment made including service tax is ` 77.41 Crores upto

35th Annual Report 2010-2011
31/03/2011) against this contract. Most of the Directors in Company are from NTPC Ltd. and Interest of Directors as required U/s 299 of Companies Act has already been disclosed in the Board’s Meetings. As per Notification No. GSR 233 dt.31/01/1978 published in the Gazattee of India, Section 3(i) dt.11/02/1978, provisions of Section 297 are not applicable.
`
`
`
`
`
`
COMMENTS OF THE COMPTROLLER AND AUDITOR GENERAL OF INDIA UNDER SECTION 619 (4) OF THE COMPANIES ACT, 1956, ON THE ACCOUNTS OF BHARTIYA RAIL BIJLEE COMPANY LIMITED, NEW DELHI FOR THE YEAR ENDED 31 MARCH 2011.

35th Annual Report 2010-2011 199
ACCOUNTING POLICIES
1. BASIS OF PREPARATION
2. USE OF ESTIMATES
3. GRANTS-IN-AID
4. FIXED ASSETS
5. CAPITAL WORK-IN-PROGRESS
6. OIL AND GAS EXPLORATION COSTS
7. DEVELOPMENT OF COAL MINES
8. FOREIGN CURRENCY TRANSACTIONS
NTPC Limited Consolidated Financial Statements

35th Annual Report 2010-2011
9. BORROWING COSTS
10. INVESTMENTS
11. INVENTORIES
12. PROFIT AND LOSS ACCOUNT
NTPC Limited Consolidated Financial Statements

35th Annual Report 2010-2011
`
`
13. LEASES
14. PROVISIONS AND CONTINGENT LIABILITIES
15. CASH FLOW STATEMENT
NTPC Limited Consolidated Financial Statements

35th Annual Report 2010-2011
CONSOLIDATED BALANCE SHEET`
As at March 31, 2011
SOURCES OF FUNDS
SHAREHOLDERS’ FUNDS1 8,245.46 2 60,139.10
68,384.56 FLY ASH UTILISATION FUND 58.96 DEFERRED REVENUE ON ACCOUNT OF ADVANCE AGAINST DEPRECIATION 3 792.05 DEFERRED INCOME FROM FOREIGN CURRENCY FLUCTUATION 62.43 LOAN FUNDS
17,426.40 33,328.43 50,754.83
DEFERRED FOREIGN CURRENCY FLUCTUATION LIABILITY 96.67
DEFERRED TAX LIABILITY (NET) 4,640.14 3,968.49
671.65 MINORITY INTEREST 485.05 TOTAL 121,306.20
APPLICATION OF FUNDSGOODWILL ON CONSOLIDATION 0.62 FIXED ASSETS
79,209.51 34,346.30 44,863.21 38,566.11
6,288.89 89,718.21
INVESTMENTS 8,357.33 DEFERRED FOREIGN CURRENCY FLUCTUATION ASSET 459.15 CURRENT ASSETS, LOANS AND ADVANCES
3,910.83 11 8,399.87 12 17,859.83 13 1,071.58
6,803.21 38,045.32
LESS: CURRENT LIABILITIES AND PROVISIONS 12,438.76
2,835.67 15,274.43 22,770.89
DEFERRED EXPENDITURE FROM FOREIGN CURRENCY FLUCTUATION - TOTAL 121,306.20

35th Annual Report 2010-2011
CONSOLIDATED PROFIT & LOSS ACCOUNT`
For the year ended March 31, 2011
INCOME 57,731.93
313.47 57,418.46
64.71 7.84
2,517.17 Total 60,008.18 EXPENDITURE
36,414.35 7.90
2,922.26 247.14
2,921.00 2,719.69
22 1,552.77 23 2,492.87
Total 49,277.98 Profit before Tax and Prior Period Adjustments 10,730.20
(1,662.13)Profit before tax 12,392.33 Provision for :
2,546.14
56.02
-
181.49 260.45
-
3,044.10 Profit after tax 9,348.23
3.35 250.00
9,601.58 Appropriations
494.94 6.87
5,216.14
2,473.63 662.18
410.84 107.65
Balance carried to Balance Sheet 229.33 Expenditure during construction (net)
` ` 11.34
` 2,471.87 Crore ` ` 2,153.16 Crore `
` 5.17 Crore ` ` 239.76 Crore `

35th Annual Report 2010-2011
NTPC Limited Consolidated Financial Statements
CASH FLOW STATEMENT`
For the Year ended March 31, 2011
A. CASH FLOW FROM OPERATING ACTIVITIESNet Profit before tax and Prior Period Adjustments 10,730.20 Adjustment for:
2,719.69 (1,170.72)
1,552.77 (818.79)
(58.28) 90.46
3,804.66 62.09
(852.93) 1,662.13
(21.13) (7.84) 2.53
6,964.64 Operating Profit before Working Capital Changes 17,694.84 Adjustment for:
(2,850.90) (252.20) 1,480.93 (689.86) (273.75)
(2,585.78)Cash generated from operations 15,109.06
(3,034.16) Net Cash from Operating Activities - A 12,074.90 B. CASH FLOW FROM INVESTING ACTIVITIES
(13,735.84) (15,848.17)
19,268.07 923.12
- 21.13
Net cash used in Investing Activities - B (9,371.69)C. CASH FLOW FROM FINANCING ACTIVITIES
11,370.82 (5,108.44)
327.50 (3,745.62)
(65.88) (3,149.16)
(523.08) (2.53)
Net Cash flow from Financing Activities - C (896.39)Net Increase/Decrease in Cash and Cash equivalents (A+B+C) 1,806.82 Cash and cash equivalents (Opening balance) * 16,053.01 Cash and cash equivalents (Closing balance) * 17,859.83
Notes :
` 11.69 crore `` 10.25 crore `

35th Annual Report 2010-2011
Schedules forming part of Consolidated Balance Sheet `
As at March 31, 2011
Schedule 1
SHARE CAPITALAUTHORISED
`
` 10,000.00
ISSUED, SUBSCRIBED AND PAID-UP
`
` 8,245.46
Schedule 2
RESERVES AND SURPLUS
282.44
6.87
113.18
39.67
362.82
2,228.11
1,986.72
494.94
250.00
2,231.66
49,871.20
5,216.14
0.16
55,087.18
229.33
Total # 60,139.10
` 171.70 crore `
Schedule 3
DEFERRED REVENUE - ON ACCOUNT OF ADVANCE AGAINST DEPRECIATION 1,610.84
27.73
39.28
807.24
Total # 792.05
` Nil `

35th Annual Report 2010-2011
Schedules forming part of Consolidated Balance Sheet `
As at March 31, 2011
Schedule 4
SECURED LOANSBonds
`
1
100.00
`
2
525.00
`
2
525.00
` 3
100.00
` 3
50.00
` 300.00
` 50.00
` 400.00
`
7
900.00
` 500.00
` 500.00
` 500.00
`
9
500.00
`
9
500.00
`
9
350.00
` 9
1,000.00
` 9
550.00
` 9
700.00

35th Annual Report 2010-2011
Schedules forming part of Consolidated Balance Sheet `
As at March 31, 2011
Schedule 4
SECURED LOANS`
9 500.00
`
9
105.00
` 9
195.00
`
9
150.00
`
9
120.00
`
9
75.00
` 9
300.00
Loans and Advances from Banks and Financial Institutions
` 156.78 crore ` 414.47
` 197.77 crore ` 11 7,476.20
39.40
Other Loans and Advances
` 0.59 crore `12
1.33
Total # 17,426.40
` 7,351.79 crore `
Notes:
1
2
3

35th Annual Report 2010-2011
Schedules forming part of Consolidated Balance SheetSchedule 4
SECURED LOANSNotes:
7
9
11
`
12
Note:

35th Annual Report 2010-2011
Schedules forming part of Consolidated Balance Sheet `
As at March 31, 2011
Schedule 5
UNSECURED LOANSFixed Deposits 13.26
` 0.87 crore `
Bonds
` -
` -
` -
` 75.00
Foreign Currency Bonds / Notes
` Nil ` -
1,356.90
Loans and Advances
From Banks and Financial Institutions
` 121.16 crore ` 2,884.39
` 647.39 crore`
6,035.20
` 1,880.17 crore ` 22,963.68
Total # 33,328.43
# ` 50.87 crore `

35th Annual Report 2010-2011
Schedules forming part of Consolidated Balance Sheet
Schedule 6
FIXED ASSETS `
Net Block
As at Upto As at
31.03.2011 31.03.2011 31.03.2011
TANGIBLE ASSETS
2,413.34 - 2,413.34
561.32 113.68 447.64
528.65 154.93 373.72
3,186.61 1,161.23 2,025.38
2,178.55 783.29 1,395.26
51.35 22.08 29.27
32.51 31.60 0.91
621.84 276.08 345.76
1,108.20 558.20 550.00
339.16 137.72 201.44
200.46 82.12 118.34
65,971.43 29,990.14 35,981.29
504.70 288.98 215.72
360.85 238.95 121.90
11.46 5.83 5.63
151.17 73.53 77.64
321.69 141.13 180.56
90.19 45.17 45.02
27.35 14.87 12.48
33.73 13.00 20.73
2.64 1.41 1.23
210.42 121.53 88.89
2.84 - 2.84
2.84 - 2.84
2.21 - 2.21
INTANGIBLE ASSETS
7.79 1.32 6.47
199.52 6.66 192.86
92.37 82.85 9.52
Total # 71,526.77 6,849.82 (832.92) 79,209.51 32,722.64 2,889.23 1,265.57 34,346.30 44,863.21 38,804.13
` 5,261.18 crore `

35th Annual Report 2010-2011 211
Schedules forming part of Consolidated Balance Sheet
Schedule 7
CAPITAL WORK-IN-PROGRESS `
As at 31.03.2011
475.92
45.71
812.63
2,563.49
444.05
11.88
59.85
2,534.13
241.57
154.33
145.92
30,066.68
9.33
2.22
0.33
120.76
0.35
2.24
0.03
16.52
7.65
195.05
37,910.64
Expenditure pending allocation
281.46
(280.32)
161.71
54.24
3,330.88
2,873.59
38,585.02
18.91
Total # 38,566.11
` 4,797.94 crore `

35th Annual Report 2010-2011212
Schedules forming part of Consolidated Balance Sheet `
As at March 31, 2011
Schedule 8
CONSTRUCTION STORES AND ADVANCESCONSTRUCTION STORES *
982.38
44.98
1,499.99
2,527.35
1.44
2,525.91
ADVANCES FOR CAPITAL EXPENDITURE
18.13
2,266.85
1,478.00
2.21
3,765.19
2.21
3,762.98
Total # 6,288.89
1,572.56
` 514.10 crore `

35th Annual Report 2010-2011 213
Schedules forming part of Consolidated Balance Sheet `
As at March 31, 2011
Schedule 9
INVESTMENTS
`
I. LONG TERM (Trade - unless otherwise specified)
A) Quoted
Equity Shares (fully paid-up)
12.00
Sub Total (A) 12.00
B) Unquoted (fully paid-up)
Bonds
i) 8.50 % Tax-Free State Government Special Bonds of the Government of ( # )
630.33
25.73
947.20
241.61
418.62
537.50
16.69
183.68
480.06
501.20
415.42
190.70
551.44
173.11

35th Annual Report 2010-2011
Schedules forming part of Consolidated Balance Sheet `
As at March 31, 2011
Schedule 9 (Cont.)
INVESTMENTS
`
58.00
17.10
1,994.95
199.83
587.12
Sub Total (B) 8,170.29
-
Sub Total ( I ) 8,182.29
II. CURRENT (Non - Trade - Unquoted)
-
-
-
175.04
Sub Total ( II ) 175.04
Total ( I + II )# 8,357.33
Quoted Investments
12.00
100.92
Unquoted Investments
8,345.33
` 6,518.83 crore `
` Nil `

35th Annual Report 2010-2011
Schedules forming part of Consolidated Balance Sheet `
As at March 31, 2011
Schedule 10
INVENTORIES
1,871.96
5.60
1,306.58
211.33
155.30
49.89
18.19
345.26
3,964.11
2.36
50.92
Total # 3,910.83
153.26
` 269.27 crore `
Schedule 11
SUNDRY DEBTORS
60.63
841.69
902.32
9,865.69
10,768.01
841.69
1,526.45
Total # 8,399.87
` 306.34 crore `
Schedule 12
CASH & BANK BALANCES
` 0.36 crore ` 0.49
-
30.80
362.05
17,466.49
Total # 17,859.83
` 445.55 crore `
` 10.25 crore `
` 11.69 crore `

35th Annual Report 2010-2011
Schedules forming part of Consolidated Balance Sheet `
As at March 31, 2011
Schedule 13
OTHER CURRENT ASSETS
382.33
630.10
43.69
10.53
4.93
Total # 1,071.58
` 10.59 crore `
Schedule 14
LOANS AND ADVANCES
458.99
154.10
0.25
574.36
50.00
0.02
2.24
808.16
1.43
11.71
0.08
10,141.41
7,402.79
2,738.62
162.80
-
1,648.44
11.96
13.72
6,609.44
193.77
Total # 6,803.21
` 218.80 crore `

35th Annual Report 2010-2011 217
Schedules forming part of Consolidated Balance Sheet `
As at March 31, 2011
Schedule 15
CURRENT LIABILITIES
2.73
4,097.49
6.91
4,099.52
9.34
2,098.99
11.29
10,303.69
1,421.32
267.58
10.27
32.78
142.12
258.86
2.14
Total # 12,438.76
` 986.89 crore `

35th Annual Report 2010-2011
Schedules forming part of Consolidated Balance Sheet `
As at March 31, 2011
Schedule 16
PROVISIONS
-
2,602.16
(4,800.63)
7,402.79
-
675.53
662.18
675.53
662.18
112.03
107.65
112.03
107.65
2,056.48
386.14
646.56
44.26
1,751.80
299.91
39.31
24.06
5.47
309.69
6.38
3.60
5.15
0.48
4.35
Total # 2,835.67
` 76.58 crore `

35th Annual Report 2010-2011 219
Schedules forming part of Consolidated Profit & Loss Account `
For the year ended March 31, 2011
Schedule 17
SALES 57,106.99
(11.55)
79.75
(1.54)
57,196.75
535.18
Total # 57,731.93
` 338.51 crore `` 21.72 crore `
` 2440.17 crore `
Schedule 18
PROVISIONS WRITTEN BACK -
0.04
0.01
0.11
1.92
5.15
0.15
0.46
Total # 7.84
` 0.03 crore `

35th Annual Report 2010-2011
Schedules forming part of Consolidated Profit & Loss Account `
For the year ended March 31, 2011
Schedule 19
OTHER INCOME Income from Long Term Investments
Trade
21.13
799.76
` Nil, ` -
Non -Trade
-
-
-
-
Income from Current Investments (Non-Trade)
53.17
Income from Others
` 136.35 crore `
50.85
1,243.18
20.60
116.16
40.38
1.87
-
1.87
10.90
2.59
8.37
31.49
181.27
2,581.72
33.00
31.49
0.06
Total # 2,517.17
` 43.72 crore `
Schedule 20
EMPLOYEES’ REMUNERATION AND BENEFITS 2,940.80
352.90
311.74
3,605.44
178.46
28.98
475.74
Total # 2,922.26
` 84.23 crore `

35th Annual Report 2010-2011 221
Schedules forming part of Consolidated Profit & Loss Account `
For the year ended March 31, 2011
Schedule 21GENERATION, ADMINISTRATION & OTHER EXPENSES
152.68 16.32
136.36 307.00 38.55
30.21 6.81
23.40 98.35
129.41
1,465.19 0.73
1,465.92 108.90 96.27 25.97 38.63
73.05 4.77
68.28 37.80
161.88 27.82 2.88
24.94 3.09
14.98 260.25 13.82
15.03 1.37
13.66 25.50 2.85
- 80.19 0.43
79.76 2.32 0.23
2.09 1.61
48.02 -
48.02 15.85 16.36 13.23 3.64
131.31 0.05 4.53
62.22 3,474.48
214.67 14.04
324.77
Total # 2,921.00
734.36
` 250.52 `

35th Annual Report 2010-2011222
Schedules forming part of Consolidated Profit & Loss Account `
For the year ended March 31, 2011
Schedule 22
PROVISIONS 1,531.84
0.25
1.47
8.84
0.33
9.29
0.75
Total # 1,552.77
` 0.59 crore `
Schedule 23
INTEREST AND FINANCE CHARGES Interest on :
805.35
177.52
2,397.48
1.24
162.75
3.61
82.55
174.16
3,804.66
Finance Charges :
1.85
35.65
25.92
(2.42)
747.32
4.96
5.87
0.59
0.09
6.64
-
2.94
0.41
829.82
Sub-Total 4,634.48
2,133.89
7.67
0.05
Total # 2,492.87
` 334.87 crore `

35th Annual Report 2010-2011 223
Schedules forming part of Consolidated Profit & Loss Account `
For the year ended March 31, 2011
Schedule 24
PRIOR PERIOD INCOME/EXPENDITURE (NET)INCOME
520.68
0.03
520.71
EXPENDITURE
(2.49)
26.32
(1,170.72)
39.76
-
0.70
(0.03)
-
0.49
(1,105.97)
(1,626.68)
35.45
-
Total # (1,662.13)
` 23.41 crore `

35th Annual Report 2010-2011
Schedules forming part of Consolidated Balance Sheet `
For the year ended March 31, 2011
Schedule 25
EXPENDITURE DURING CONSTRUCTION PERIOD (NET)A. Employees remuneration and other benefits
400.94 37.88 36.92
Total (A) 475.74 B. Other Expenses
87.12 1.15
85.97 58.93 4.51
7.82 0.24
16.81 24.87 0.86 1.52 5.74
32.65 9.44 0.15
9.29 0.06 0.51
44.32 2.37 3.23 0.16 0.71 1.77 5.91 4.09 1.47 1.21
34.62 Total (B) 324.77 Depreciation (C) 32.16 Total (A+B+C) 832.67 D. Interest and Finance Charges
504.95 86.26
1,460.49 37.47
0.02 14.63
0.05 -
21.55 8.47
Total (D) 2,133.89 E. Less Other Income
3.23 26.60
1.61 0.59 0.97
TOTAL (E) 33.00 F. Prior Period Adjustments 35.45 G. Fringe Benefit Tax - GRAND TOTAL (A+B+C+D-E+F+G) # 2,969.01 *
* Balance carried to Capital Work-in-progress - Schedule 7` 489.93 crore `

35th Annual Report 2010-2011
SCHEDULE-26
NOTES ON ACCOUNTS
BASIS OF CONSOLIDATION
Basis of Accounting:
Principles of consolidation
31.03.2011
Subsidiary Companies:
100
100
100
64.57
74
Joint Venture Companies:
31.03.2011
50
50
50
50
30.17
NTPC Limited Consolidated Financial Statements

35th Annual Report 2010-2011
31.03.2011
50
50
50
50
49
50
16.67
14.28
25
44.60
25
50
31 `
`
Item 2010-11 (Un-audited)
3.11
0.03
3.14
81.03
NTPC Limited Consolidated Financial Statements

35th Annual Report 2010-2011 227
(equivalent ̀ 33.99 crore).
`
Item 2010-11 (Un-audited)
0.43
14.64
1.92
78.50
12,378 acres ` 697.27 crore` ` 135.58 crore `
9,627 acres ` 299.99 crore `
819 acres ` 29.67 crore `
1,181 acres
1,245 acres ` 15.03 crore `
` 118.74 crore `
98 acres 79 acres19 acres ` 0.21 crore `
` 0.21 crore
` 7.79 crore `
` 199.52 crore `
` 6.13 crore `
` 48,935.31 crore`
` 47,519.21 crore `
NTPC Limited Consolidated Financial Statements

35th Annual Report 2010-2011
NTPC Limited Consolidated Financial Statements
` 4,528.39 crore `
` 4,416.12 crore `
` 819.77 crore `
` 1,262.86 crore
` 79.75 crore
` 252.22 crore
` 72.14 crore
` 2,698.86 crore `
` 263.59 crore
` 115.58 crore `
` 94.56 crore ` 468.78 crore
`276.80 crore ` ` 269.70 crore `` 7.17 crore `

35th Annual Report 2010-2011 229
NTPC Limited Consolidated Financial Statements
` 255.82 crore
29
` 748.82 crore
1,489 acres
` 190.19 crore `

35th Annual Report 2010-2011
NTPC Limited Consolidated Financial Statements
` 1,173.04 crore ` 324.23 crore` 1,497.27 crore
` 727.49 crore
` 212.67 crore
` ` `` ` 1,365.78 crore` 969.53 crore
` 0.43 crore `
` 48.34 crore` 9.67 crore
Disclosure as per Accounting Standard (AS) 15
A. Provident Fund
` 191.88 crore `
B. Gratuity & Pension
` 0.10 crore
C. Post-Retirement Medical Facility (PRMF)
D. Terminal Benefits
E. Leave

35th Annual Report 2010-2011 231
i) Expenses recognised in Profit & Loss Account`
Gratuity/Pension
PRMF Leave Terminal Benefits
The amount recognised in the Balance Sheet `
Gratuity/Pension
PRMF Leave Terminal Benefits
Changes in the present value of the defined benefit obligations:`
Gratuity/Pension
PRMF Leave Terminal Benefits
NTPC Limited Consolidated Financial Statements

35th Annual Report 2010-2011232
Changes in the fair value of plan assets:`
Gratuity/Pension
PRMF Leave Terminal Benefits
`
Particulars Increase by Decrease by
F. Other Employee Benefits
` 2.76 crore`
` 6.50 crore `
` 170.04 crore `
` 2,075.72 crore `
NTPC Limited Consolidated Financial Statements

35th Annual Report 2010-2011 233
`
Business SegmentsGeneration Others Total
Current Year
Current Year
Current Year
56,839.96 578.50 57,418.46
64.71 - 64.7156,904.67 578.50 57,483.17
# 12,676.69 135.98 12,812.672,149.27
2,569.61
12,392.333,044.10
Profit after Tax 9,348.23Other informationSegment assets 59,973.14 1,626.95 61,600.09
74,980.5459,973.14 1,626.95 136,580.63
9,465.50 1,330.60 10,796.1057,399.76
9,465.50 1,330.60 68,195.861,508.14 1.77 1,509.911,542.70 2.01 1,544.71
14,638.58 276.46 14,915.04
` 1,180.00 crore `` 11,496.69 crore `
Related party disclosures
1
2
3
7
NTPC Limited Consolidated Financial Statements

35th Annual Report 2010-2011
NTPC Limited Consolidated Financial Statements
`
Current Year
Transactions during the year
240.5214.15
0.500.57
1.000.36
0.600.87
47.1617.52
0.660.91
` 4.18 crore `
` 3.06 crore `` 0.11 crore ( `
Disclosure regarding leases
a) Finance leases
`
31.3.2011
0.72
0.80-
1.52
0.610.73
-1.340.18
b) Operating leases
` 76.99 crore `

35th Annual Report 2010-2011
Earning Per Share
Current year
` 9,348.23
8245,464,400
` 11.34
` 10/-
`
31.3.2011
6,265.08
1,301.88
323.00
1,624.88
4640.20
3,968.49
671.71
` 442.00 crore `
` 28.30 crore `
Foreign currency exposure not hedged by a derivative instrument or otherwise: `
Sl. Particulars Currencies 31.3.2011
JPY7,157.373,125.17
441.21
1189.05601.7630.31
2.08
2,493.044,197.59
25.22
` 130.28 crore `` 34.96 crore `
` 95.32 crore `
` 31,496.08 crore ` ` 2,673.05 crore `
Contingent Liabilities:

35th Annual Report 2010-2011
` 3,525.43 crore `
` 1,851.08 crore `
` 1,248.00 crore `
` 1,495.35 crore
` 146.97 crore `
` 2,547.79 crore `
` 1,793.37 crore `
` 408.57 crore `
` 123.09 crore `

35th Annual Report 2010-2011 237
AUDITORS’ REPORT ON THE CONSOLIDATED FINANCIAL STATEMENTS
To
The Board of Directors
NTPC Ltd.
`
Name of the Companies Assets Revenues Net Cash Flows
Subsidiaries:
` ``
Joint Ventures:
Total 10738.37 1853.41 70.53

35th Annual Report 2010-2011
`
Name of the Companies Assets Revenues Net Cash Flows
Total 4176.78 812.52 7.57

35th Annual Report 2010-2011 239
NTPC LimitedRegd. Office :
ATTENDANCE SLIP35th Annual General Meeting to be held on Tuesday, September 20, 2011 at 10.30 a.m.
NTPC Limited
Regd. Office :
FORM OF PROXY

35th Annual Report 2010-2011

