remote sensing application to estimate the volume of water in the form of snow on mount lebanon /...
TRANSCRIPT
Hydrological Sciences–Journal–des Sciences Hydrologiques, 49(4) August 2004
* Based on a paper presented at the Conference on Snow Hydrology of Mediterranean Regions held at Beirut,
Lebanon, 15–17 December 2002. Open for discussion until 1 February 2005
643
Remote sensing application to estimate the volume of water in the form of snow on Mount Lebanon* AMIN SHABAN, GHALEB FAOUR, MOHAMAD KHAWLIE & CHADI ABDALLAH Lebanese National Council for Scientific Research, National Center for Remote Sensing, Beirut, Lebanon [email protected]
Abstract At least one-quarter of the Lebanese terrain is covered by snow annually, thus contributing integrally to feeding surface and subsurface water resources. However, only limited estimates of snow cover have been carried out and applied locally. The use of remote sensing has enhanced significantly the delineation of snow cover over the mountains. Several satellite images and sensors are used in this respect. In this study, SPOT-4 (1-km resolution) satellite images are used. They have the capability to acquire consecutive images every 10 days, thus monitoring the dynamic change of snow and its maximum coverage could be achieved. This was applied to Mount Lebanon for the years 2001–2002. The areas covered by snow were delineated, and then manipulated with the slope angle and altitudes in order to classify five major zones of snowmelt potential. The field investigation was carried out in each zone by measuring depths and snow/water ratio. A volume of around 1100 × 106 m3 of water was derived from snowmelt over the given period. This is equivalent to a precipitation rate of about 425 mm in the region, revealing the considerable portion of water that is derived from snowmelt. Key words Mount Lebanon; snow cover; SPOT-4; water volume
Application de la télédétection à l’estimation du volume d’eau sous forme de neige sur le Mont Liban Résumé La neige couvre annuellement au moins le quart de la superficie du Liban, contribuant intégralement à l’alimentation de ressources en eaux de surface et de sub-surface. Néanmoins, rares sont les estimations locales de la couverture neigeuse. L’utilisation de la télédétection a ouvert des perspectives significatives pour la cartographie de la couverture neigeuse en zones montagneuses. Plusieurs images et capteurs satellitaires sont utilisés dans ce sens. Nous utilisons, dans cette étude, des images du satellite SPOT-4 (de résolution 1 km). Il est possible d’acquérir des images consécutives tous les 10 jours, ce qui permet de suivre l’évolution de la neige, ainsi que la couverture maximale. Cela a été appliqué au Mont Liban pour les années 2001–2002. Les zones couvertes par la neige ont été délimitées, puis croisées avec des données de relief (angle de pente et altitude) afin d’identifier une classification du potentiel de fonte en cinq zones principales. La profondeur et le rapport neige/eau ont été mesurés in situ dans chaque zone. Un volume d’eau de fonte d’environ 1100 × 106 m3 a été estimé pour la période d’étude. Cela équivaut à un cumul de précipitation d’environ 425 mm sur la région, ce qui met en évidence la part considérable que représente la fonte de la neige dans le bilan hydrologique. Mots clefs Mont Liban; couverture neigeuse; SPOT-4; volume d’eau
INTRODUCTION In Lebanon, a substantial portion of the freshwater resources is stored temporarily in the form of snow, which acts as an important element in the water budget. Rivers and
Amin Shaban et al.
644
springs are fed a large amount of water from the melting snow in the mountains. In some regions, these waters may contribute up to about two thirds of the total volume of yearly discharge of those sources. For example, Abd-El-Al (1947) estimated that, for the Ibrahim River (a major Lebanese river), of 300 × 106 m3 year-1 discharged water, around 200 × 106 m3 are derived from melting snow. It is a common practice that local inhabitants project the expected yearly debits in springs and rivers directly from the snow thickness and the time of snow fall. Accurate knowledge of the distribution of snowfields and their volumes in terms of water equivalents is required to know exactly how much water is stored. The elevated regions of Mount Lebanon are typical zones for snow accumulation, with large coverage every winter. As this snow melts in spring it becomes an inherent part of surface and subsurface waters. In Lebanon, local measurements of snow depth have been carried out only at limited stations, which makes it insufficient to establish a final figure on the volume of water resulting from snowmelt. A number of new estimates have been carried out recently on that snow water. These are still in their initial phases, and rely mainly on the use of remote sensing tools. Therefore, proper quantification of the water volume from snow has not been established yet. This is attributed mainly to the difficulty in assessing the actual yearly area of land covered by snow, as well as to lack of specific meteorological data. The application of remote sensing in this respect serves to help in solving the problem, although this application is still under research (Girard & Girard, 1999). Satellite imagery offers a new and valuable approach for snow monitoring and mapping, as the technique can cover several aspects relevant to snow, namely: areal extent, variation through time, land morphology, sloping terrain, land cover (forest or barren), as well as climate and solar inputs. Nevertheless, determination of snow thick-ness or its water equivalent is still under study in present operational satellite systems. The most widely used satellite images for snow cover identification are the visible and infrared bands of Landsat, SPOT, NOAA and AVHRR (Shi & Dozier, 1995) as well as radar sensors (Bernier & Fortin,1992; Rott & Nagler 1995; Baghdadi et al., 1997; Kelly, 1996). Further, these images cover large areas at short time intervals. Until quite recently, the problem facing interpretation of snow cover from satellite imagery involved the differentiation of snow from other features, especially those of cloud cover, bare rocks and shadows on sloping terrain, as well as vegetation cover which reduces the reflectance (Lucas & Harrison, 1990). This study is supplementary research to a preliminary investigation done in 2002 by the authors. It aims to use satellite imagery, particularly to determine the snow coverage area, in an attempt to estimate better the water volume that results from snowmelt on the mountainous regions of western Lebanon (i.e. Mount Lebanon). The results would help evaluate water replenishment of the issuing rivers and springs, as well as provide accurate values for the water budget estimation of the area. METHOD Determining the volume of snow requires measurement of two principal variables: areal coverage and depth. In addition to estimating the snow volume, it is necessary to estimate the water-snow equivalent (or snow/water ratio, SWR = ratio of water volume to snow volume) to establish the volume of water in the form of snow. In mountainous
Remote sensing to estimate the volume of water in the form of snow on Mount Lebanon
645
Total area
Area
abo
ve a
giv
en a
ltitu
de
0 Lowest Highest
Altitude
ESA
Area of snow cover
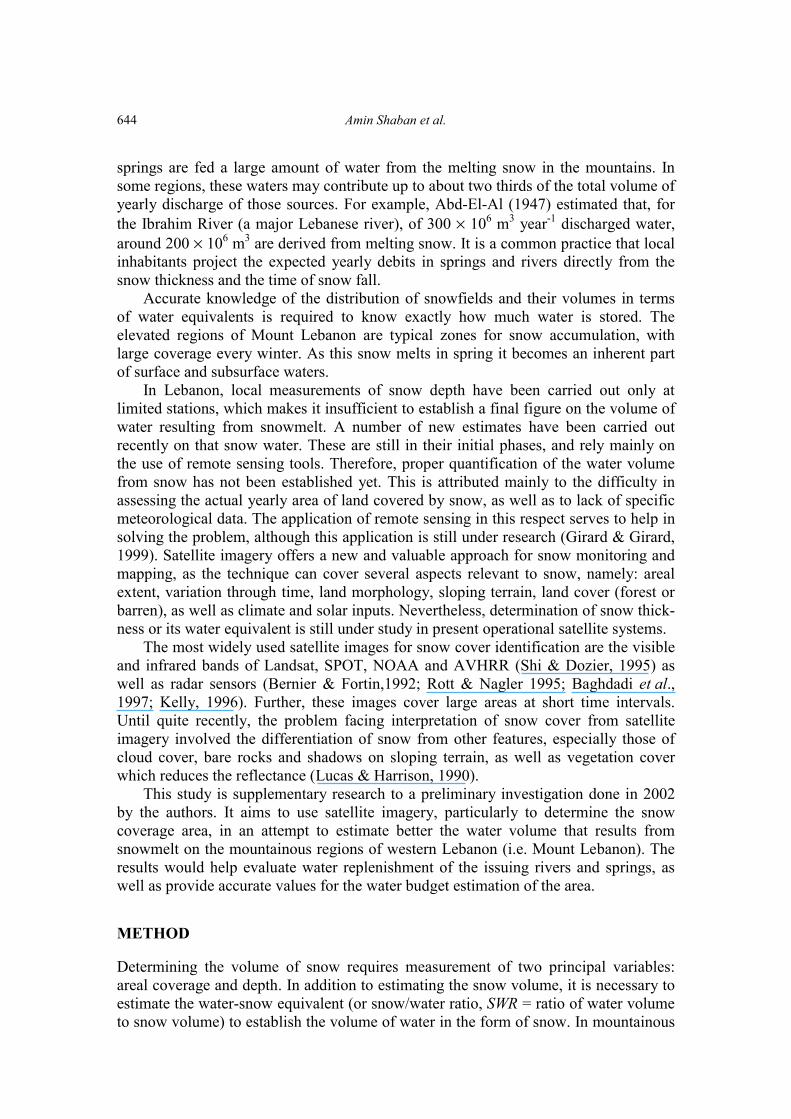
Fig. 1 Snow line/altitude curve to estimate the average area of snow cover (according to Lucas & Harrison, 1990).
regions, the snow line/altitude method (Fig. 1) is generally applied (Engman & Gurney, 1985; Lucas & Harrison, 1990; Maxfield, 1994). This method depends on classifying the snow cover distribution with respect to different altitudes. However, it does not involve essential parameters that control the quantitative measures of snow cover. In this study, in addition to altitude, two other fundamental parameters were taken into consideration. First is the slope angle, because it is indicative of the relative snow depth—the steeper the angle of slope, the lesser the thickness of snow. Second is the maximum surface area of snow coverage during the whole period of snow accumulation. Accordingly, having determined the area of maximum snow coverage and different slope angles, as well as the altitudes for that area, a map showing snowmelt potential zones can be developed (Shaban, 2003). Snow depth and SWR can then be measured in these zones. The primary stage is the determination of the snowmelt potential zones according to the following steps: Mapping of snow coverage The availability of SPOT-4 “Vegetation” images is useful in this approach. These images are interpreted using ERDAS Imagine software. The introduction of a new spectral band on the SPOT-4 instruments in the field of “SWIR” wavelength (short wave infrared: 1.55–1.75 µm) enables one to obtain a better mapping of snow layers. These images have a resolution of 1 km, and measurement periods of 10 days, which allows estimation of the maximum snow accumulation in a specific year. The images used are for the period April 2001–September 2002, i.e. 90 images. Figure 2 shows an example of these images.
Amin Shaban et al.
646
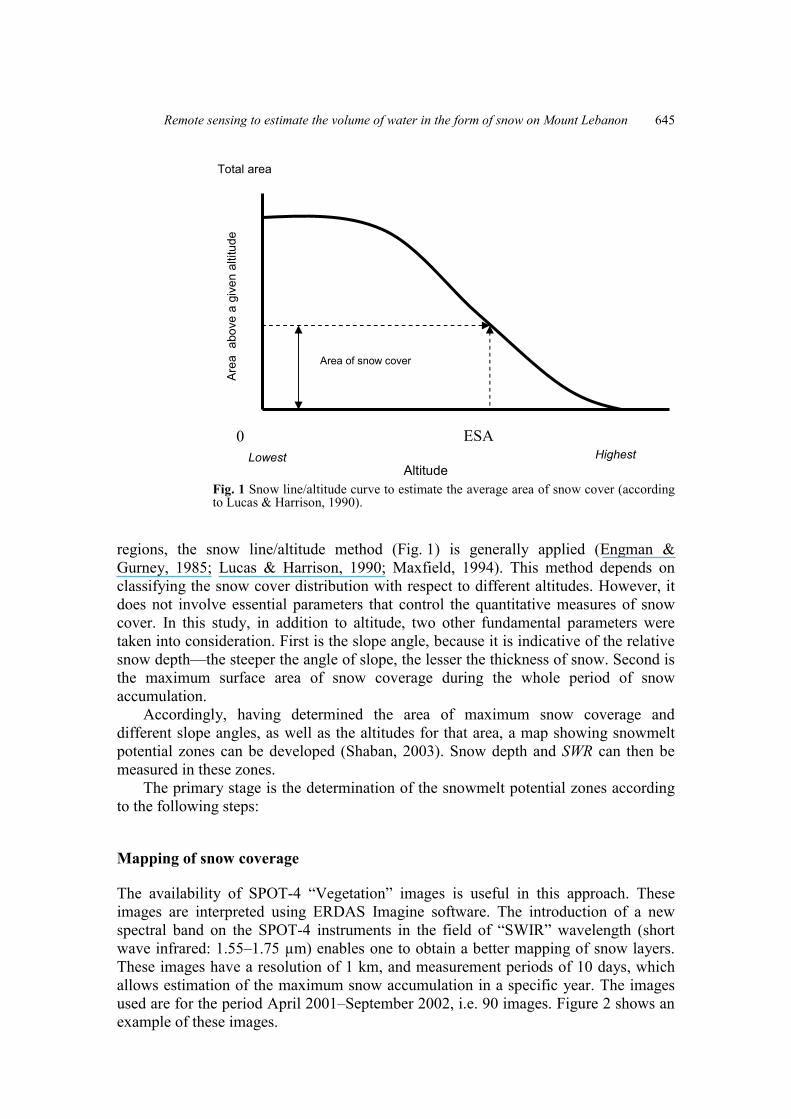
Fig. 2 Selective images of snow covVEG.
Next, the image of the maximum snow covgreatest areal cover of snow. From the availamaximum coverage can be clearly seen in the i Classification of snow coverage zones From the image of maximum snow coverageLebanon is classified into zones according to thto as “snow coverage”. This can be obtaineAccording to Koskinen et al. (1999), who studclassification of snow coverage zones was assnow; (b) more than half of the area covered covered by snow; (d) snow only exists in forest
In this study, a similar classification was foto represent the percentage of snow coverage: <10% (Shaban et al., 2002).
First snow accumulation on crests
Snow cover shapes the limit of Mount Lebanon and Anti-Lebanon Maximum snow cover (20/02/2000)
Mediterranean Sea
Beirut
20/02/2002
20/01/2002 20/12/2001erage on Lebanon as identified from
erage is selected, since it represble set of satellite images (Figmage of 20 February 2002.
, the area covered by snow one density of snow distribution, d through a supervised classiied the density of snow distribu follows: (a) zones totally covby snow; (c) less than half of s; and (e) dissipated snow (Fig. llowed, but relying on numerica>90%, 90–60%, 60–40%, 40–1
20/11/2001
20/10/2001 20/09/2001SPOT-4,
ents the . 2), the
Mount referred fication. tion, the ered by the area 3(a)). l values
0 % and
Remote sensing to estimate the volume of water in the form of snow on Mount Lebanon
647
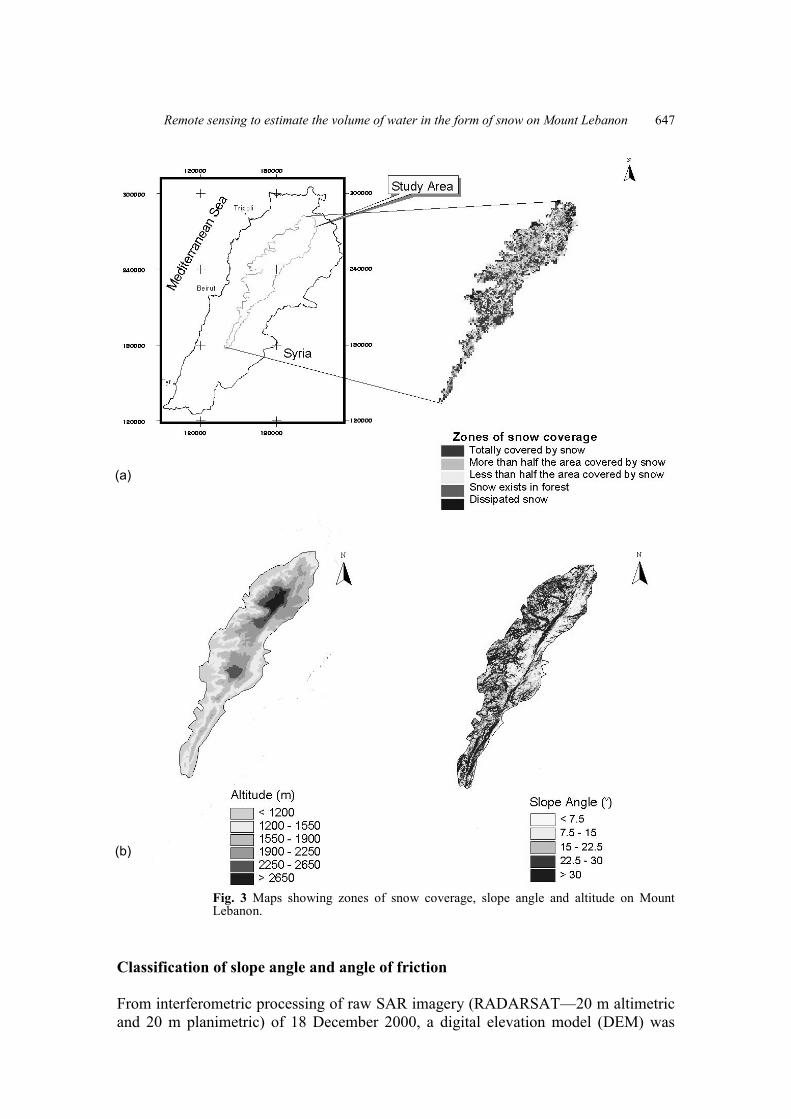
Fig. 3 Maps showing zones of snow coverage, slope angle and altitude on Mount Lebanon.
Classification of slope angle and angle of friction From interferometric processing of raw SAR imagery (RADARSAT—20 m altimetric and 20 m planimetric) of 18 December 2000, a digital elevation model (DEM) was
(a)
(b)
Amin Shaban et al.
648
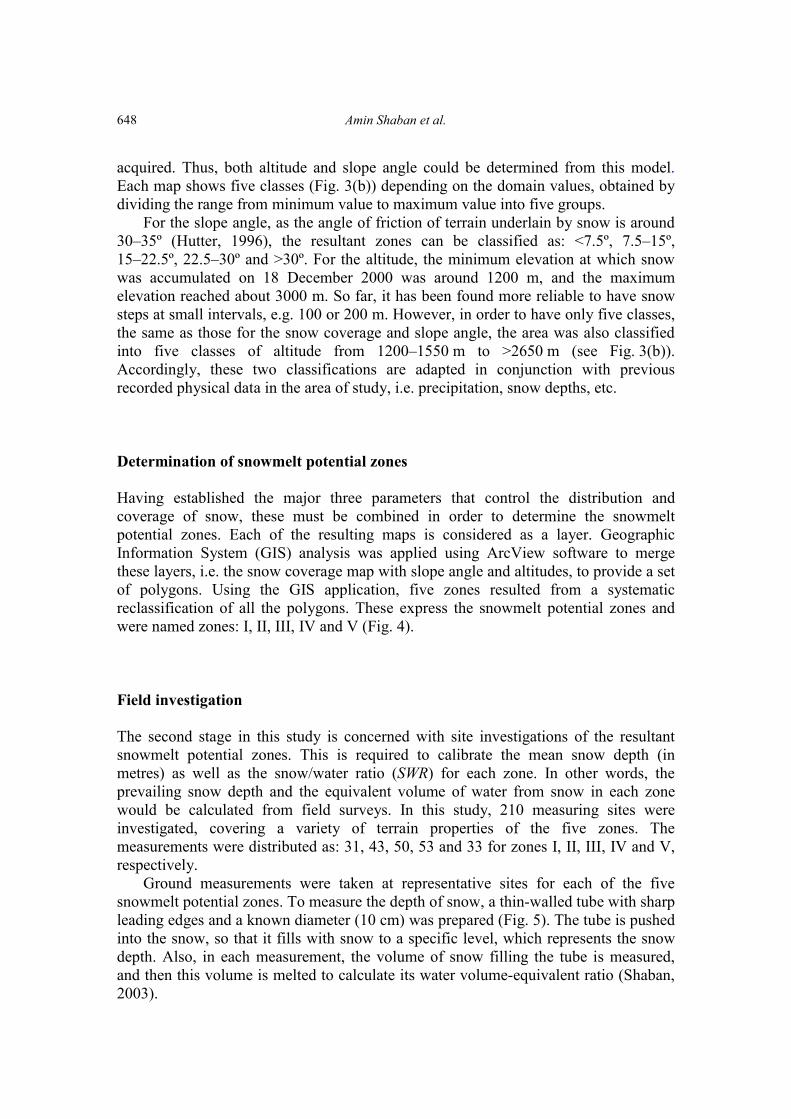
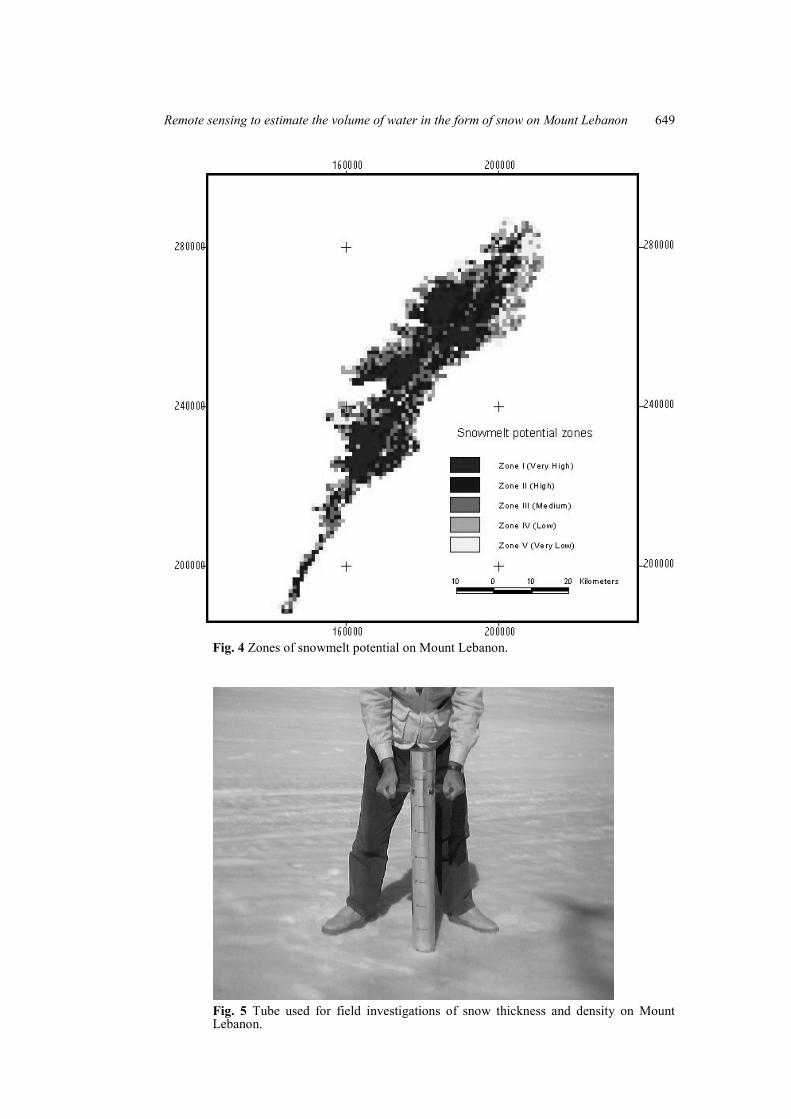
acquired. Thus, both altitude and slope angle could be determined from this model. Each map shows five classes (Fig. 3(b)) depending on the domain values, obtained by dividing the range from minimum value to maximum value into five groups. For the slope angle, as the angle of friction of terrain underlain by snow is around 30–35º (Hutter, 1996), the resultant zones can be classified as: <7.5º, 7.5–15º, 15–22.5º, 22.5–30º and >30º. For the altitude, the minimum elevation at which snow was accumulated on 18 December 2000 was around 1200 m, and the maximum elevation reached about 3000 m. So far, it has been found more reliable to have snow steps at small intervals, e.g. 100 or 200 m. However, in order to have only five classes, the same as those for the snow coverage and slope angle, the area was also classified into five classes of altitude from 1200–1550 m to >2650 m (see Fig. 3(b)). Accordingly, these two classifications are adapted in conjunction with previous recorded physical data in the area of study, i.e. precipitation, snow depths, etc. Determination of snowmelt potential zones Having established the major three parameters that control the distribution and coverage of snow, these must be combined in order to determine the snowmelt potential zones. Each of the resulting maps is considered as a layer. Geographic Information System (GIS) analysis was applied using ArcView software to merge these layers, i.e. the snow coverage map with slope angle and altitudes, to provide a set of polygons. Using the GIS application, five zones resulted from a systematic reclassification of all the polygons. These express the snowmelt potential zones and were named zones: I, II, III, IV and V (Fig. 4). Field investigation The second stage in this study is concerned with site investigations of the resultant snowmelt potential zones. This is required to calibrate the mean snow depth (in metres) as well as the snow/water ratio (SWR) for each zone. In other words, the prevailing snow depth and the equivalent volume of water from snow in each zone would be calculated from field surveys. In this study, 210 measuring sites were investigated, covering a variety of terrain properties of the five zones. The measurements were distributed as: 31, 43, 50, 53 and 33 for zones I, II, III, IV and V, respectively. Ground measurements were taken at representative sites for each of the five snowmelt potential zones. To measure the depth of snow, a thin-walled tube with sharp leading edges and a known diameter (10 cm) was prepared (Fig. 5). The tube is pushed into the snow, so that it fills with snow to a specific level, which represents the snow depth. Also, in each measurement, the volume of snow filling the tube is measured, and then this volume is melted to calculate its water volume-equivalent ratio (Shaban, 2003).
Remote sensing to estimate the volume of water in the form of snow on Mount Lebanon
649
Fig. 4 Zones of snowmelt potential on Mount Lebanon.
Fig. 5 Tube used for field investigations of snow thickness and density on Mount Lebanon.
Amin Shaban et al.
650
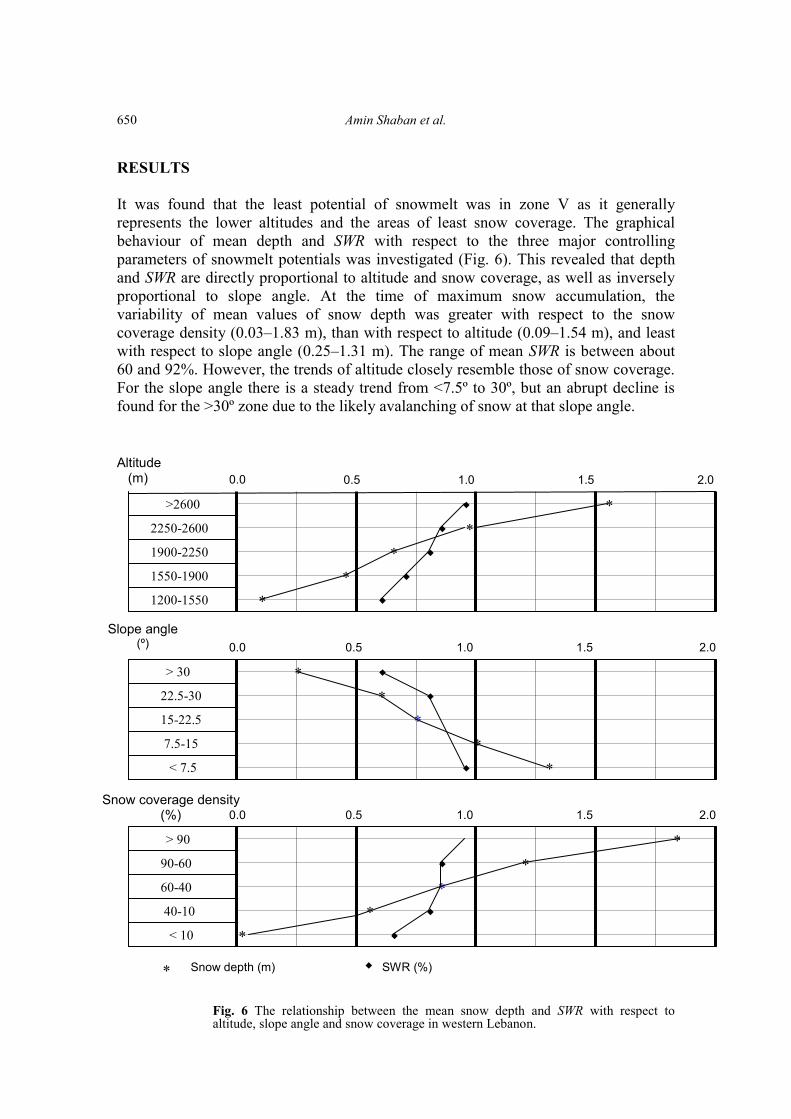
RESULTS It was found that the least potential of snowmelt was in zone V as it generally represents the lower altitudes and the areas of least snow coverage. The graphical behaviour of mean depth and SWR with respect to the three major controlling parameters of snowmelt potentials was investigated (Fig. 6). This revealed that depth and SWR are directly proportional to altitude and snow coverage, as well as inversely proportional to slope angle. At the time of maximum snow accumulation, the variability of mean values of snow depth was greater with respect to the snow coverage density (0.03–1.83 m), than with respect to altitude (0.09–1.54 m), and least with respect to slope angle (0.25–1.31 m). The range of mean SWR is between about 60 and 92%. However, the trends of altitude closely resemble those of snow coverage. For the slope angle there is a steady trend from <7.5º to 30º, but an abrupt decline is found for the >30º zone due to the likely avalanching of snow at that slope angle. Altitude (m)
Fig. 6 The relationaltitude, slope angle
0.0
Snow coverage den
(%)
Slope angle (º)
*
*
0
*
*
0.5
ship between the mand snow coverage i
�*�
* �
*
*
1.0
ean snow depth andn western Lebanon.
*�
�
**
**
1.5
SWR with respect t
*
2.0
1200-1550
1550-1900
1900-2250
2250-2600
>2600
0.0 0.5 1.0 1.5o
*
2.0
< 7.5
7.5-15
15-22.5
22.5-30
> 30
��
�
*
sity 0.0 0.5 1.0 1.5 2.0< 1
40-10
60-40
90-60
> 90
��
�
Snow depth (m)
SWR (%) �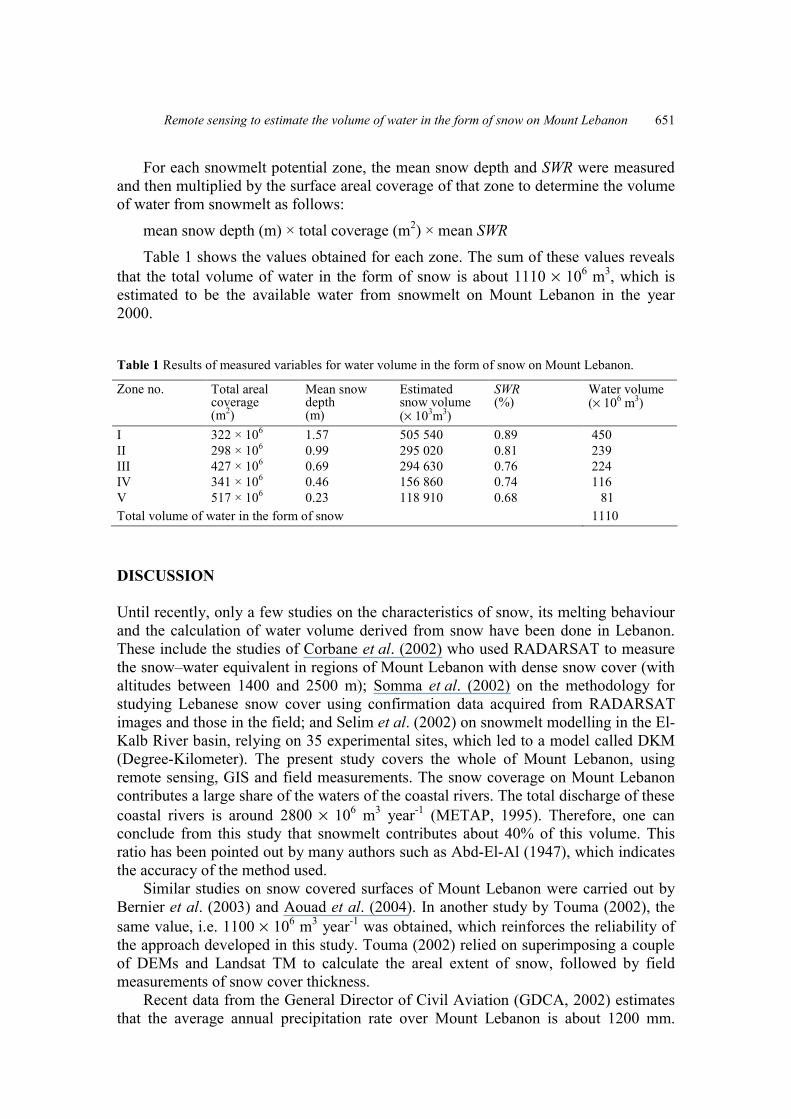
Remote sensing to estimate the volume of water in the form of snow on Mount Lebanon
651
For each snowmelt potential zone, the mean snow depth and SWR were measured and then multiplied by the surface areal coverage of that zone to determine the volume of water from snowmelt as follows:
mean snow depth (m) × total coverage (m2) × mean SWR
Table 1 shows the values obtained for each zone. The sum of these values reveals that the total volume of water in the form of snow is about 1110 × 106 m3, which is estimated to be the available water from snowmelt on Mount Lebanon in the year 2000. Table 1 Results of measured variables for water volume in the form of snow on Mount Lebanon.
Zone no. Total areal coverage (m2)
Mean snow depth (m)
Estimated snow volume (× 103m3)
SWR (%)
Water volume (× 106 m3)
I 322 × 106 1.57 505 540 0.89 450 II 298 × 106 0.99 295 020 0.81 239 III 427 × 106 0.69 294 630 0.76 224 IV 341 × 106 0.46 156 860 0.74 116 V 517 × 106 0.23 118 910 0.68 81 Total volume of water in the form of snow 1110
DISCUSSION Until recently, only a few studies on the characteristics of snow, its melting behaviour and the calculation of water volume derived from snow have been done in Lebanon. These include the studies of Corbane et al. (2002) who used RADARSAT to measure the snow–water equivalent in regions of Mount Lebanon with dense snow cover (with altitudes between 1400 and 2500 m); Somma et al. (2002) on the methodology for studying Lebanese snow cover using confirmation data acquired from RADARSAT images and those in the field; and Selim et al. (2002) on snowmelt modelling in the El-Kalb River basin, relying on 35 experimental sites, which led to a model called DKM (Degree-Kilometer). The present study covers the whole of Mount Lebanon, using remote sensing, GIS and field measurements. The snow coverage on Mount Lebanon contributes a large share of the waters of the coastal rivers. The total discharge of these coastal rivers is around 2800 × 106 m3 year-1 (METAP, 1995). Therefore, one can conclude from this study that snowmelt contributes about 40% of this volume. This ratio has been pointed out by many authors such as Abd-El-Al (1947), which indicates the accuracy of the method used. Similar studies on snow covered surfaces of Mount Lebanon were carried out by Bernier et al. (2003) and Aouad et al. (2004). In another study by Touma (2002), the same value, i.e. 1100 × 106 m3 year-1 was obtained, which reinforces the reliability of the approach developed in this study. Touma (2002) relied on superimposing a couple of DEMs and Landsat TM to calculate the areal extent of snow, followed by field measurements of snow cover thickness. Recent data from the General Director of Civil Aviation (GDCA, 2002) estimates that the average annual precipitation rate over Mount Lebanon is about 1200 mm.
Amin Shaban et al.
652
Dividing the resulting value, i.e. 1100 × 106 m3, of water volume derived from snow in the area of Mount Lebanon, a rate of 400–425 mm would be obtained. This suggests that about two thirds of the precipitation is derived from snowfall and not directly from rain. This indicates the essential role that snow plays in replenishing the water resources in Lebanon, such as rivers, springs and groundwater. At present, while meteorological gauging stations to measure and monitor trends of precipitation and river discharge are lacking, such a study can be usefully applied. If the behaviour of the variables used (i.e. snow depth and SWR), when monitored over several years, is found not to change, then only measurements of the snow coverage area and snow coverage depth would be needed. These can be easily obtained from satellite images. However, comparable trends of precipitation and river discharge should also be calculated. The application of remote sensing served the purpose of this study well. It was shown to enable the monitoring and estimation of the areal coverage of snow, while it is expanding and contracting, which is not readily done by conventional methods. REFERENCES Abd-El-Al., I. (1947) Hydrological Study on Ibrahim River, vol. 2. UNESCO, Damascus. Aouad, A., Travi, Y., Blavoux, B., Job, J.-O. & Najem, W. (2004) Etude isotopique de la pluie et de la neige sur le Mont
Liban: premiers résultats. Hydrol. Sci. J. 49(3), 429–441. Baghdadi, N., Gauthier, Y. & Bernier, M. (1997) Capability of multitemporal ERS-1 SAR data for wet-snow mapping.
Remote Sens. Environ. 60, 174–189. Bernier, P. Y. & Fortin, J. -P. (1992) Potential of ERS-1 SAR data for snow cover monitoring. In: Geosciences and
Remote Sensing (International Symposium, Huston, Texas, 24–29 May 1992), 1664–1666. American Society for Photogrammetry and Remote Sensing.
Bernier, M., Fortin, J.-P., Gauthier, Y., Corbane, C., Somma, J. & Dedieu, J. P. (2003) Intégration de données satellitaires a la modélisation hydrologique du Mont Liban. Hydrol. Sci. J. 48(6), 999–1012.
Corbane, C., Somma, J., Bernier, M., Fortin, J., Dedieu, J. & Gauthier, Y. (2002) Potentiel des images radarsat-1 pour une estimation de l’équivalent en eau du couvert nival en Montagne Libanaise. IRD-CREEN. In: Hydrologie Nivale en Méditerranée (Séminaire Int., Beyrouth, Liban, 15–17 décembre 2002). Publ. de l’Université St. Joseph, Liban.
Engman, E. & Gurney, R. (1985) Remote Sensing in Hydrology. Chapman & Hall, London, UK. Girard, M.-C. & Girard, C.-M. (1999) Traitement des données de télédétection. Dunod, France. GDCA (2002) Precipitation rates. Annual Report given by the Lebanese General Director of Civil Aviation. Hutter, K. (1996) Avalanche dynamics. In: Hydrology of Disasters (ed. by V. P. Singh), 317–397. Kluwer, Dordrecht, The
Netherlands. Kelly, R. E. J. (1996) Snow monitoring in the UK using active microwave data. In: Progress in Environmental Research
and Applications EARSeL (15th Annual Symposium, Basle, Switzerland. 4–6 September, 1995). ESA Publishing. Koskinen, J., Metsamaki, S., Grandell, J., Janne, L. & Hallikainnen, M. (1999) Snow monitoring using radar and optical
satellite data. Remote Sens. Environ. 9(69), 16–29. Lucas, R. & Harrison, A. (1990) Snow observation by satellite: a review. Remote Sens. Rev. 4(3), 285–348. Maxfield, A. (1994) Radar satellite snowmelt detection in the Canadian Rocky Mountains. In: International Geoscience
and Remote Sensing Symposium 94 (Proc., Pasadena, California, 8–12 June 1994), vol. 4, 2074–2077. American Society for Photogrammetry and Remote Sensing.
METAP (1995) Lebanon: assessment of the state of the environment. Final Report, Mediterranean Environmental & Technical Assistance Program. Beirut, Lebanon.
Rott, H. & Nagler, T. (1995) Monitoring temporal dynamics of snowmelt with ERS-1 SAR. In: International Geoscience and Remote Sensing Symposium 95 (Proc., Florence, Italy, 10–14 July 1995), 1747–1749. American Society for Photogrammetry and Remote Sensing.
Selim, K., Job, O., Bacquillon, C. & Najem, W. (2002) DKM: un modèle de fonte de la neige pour le Mont Liban. IRD-CREEN. In: Hydrologie Nivale en Méditerranée (Séminaire Int., Beyrouth, Liban, 15–17 décembre 2002). Publ. de l’Université St. Joseph, Liban.
Shaban, A. (2003) Etude de l’hydrogéologie au Liban occidental: utilisation de la télédétection. Thèse doctorale, Bordeaux I Université, France.
Shaban, A., Faour, G., Khawlie, M. & Abdallah, C. (2002) Remote sensing application in preliminary investigations to estimate the volume of water in the form of snow on Mount Lebanon. IDR-CREEN Int. Workshop on Snow Hydrology in Mediterranean Regions (Hydrologie Nivale en Méditerranée, Séminaire Int., Beyrouth, Liban, 17 décembre 2002).
Shi, J. & Dozier, J. (1995) Inferring snow wetness using C-band data from SIR-C’s polarimetric synthetic aperture radar. IEEE Trans. Geosci. Remote Sens. 13(4), 905–914.

Remote sensing to estimate the volume of water in the form of snow on Mount Lebanon
653
Somma, J., Corbane, C., Bernier, M., Fortin, J. & Dedieu, J. (2002) Etude préliminaire du manteau neigeux libanais: méthodologie de mesure des profiles de densité apparente. In: Hydrologie Nivale en Méditerranée (Séminaire Int., Beyrouth, Liban, 15–17 décembre 2002). Publication de l’Université St. Joseph, Liban.
Touma, T. (2002) Calcul des superficies enneigées sur le Mont Liban. Mémoire de DEA, CREEN, Université St. Joseph, Beyrouth, Liban.
Received 21 February 2003; accepted 31 March 2004
