relevance of radiative transfer processes on nd3+ doped phosphate glasses for temperature sensing by...
TRANSCRIPT
Rgi
CKa
Eb
Ec
a
ARR2AA
KONEFTP
P77P
1
t[tsTmaed
h0
Sensors and Actuators B 195 (2014) 324–331
Contents lists available at ScienceDirect
Sensors and Actuators B: Chemical
jo u r nal homep age: www.elsev ier .com/ locate /snb
elevance of radiative transfer processes on Nd3+ doped phosphatelasses for temperature sensing by means of the fluorescencentensity ratio technique
. Pérez-Rodrígueza,∗, L.L. Martína, S.F. León-Luisa,b, I.R. Martína,b,
. Kiran Kumarc, C.K. Jayasankarc
Departamento de Física Fundamental y Experimental, Electrónica y Sistemas, Universidad de La Laguna, Av. Astrofísico Francisco Sánchez, s/n,-38206 La Laguna, Tenerife, SpainMALTA Consolider Team, Instituto de Materiales y Nanotecnología (IMN), Universidad de La Laguna, Av. Astrofísico Francisco Sánchez, s/n,-38206 La Laguna, Tenerife, SpainDepartment of Physics, SriVenkateswara University, Tirupati 517502, India
r t i c l e i n f o
rticle history:eceived 5 April 2013eceived in revised form4 November 2013ccepted 9 January 2014vailable online 25 January 2014
eywords:ptical temperature sensord3+
nergy transferluorescence Intensity Ratio
a b s t r a c t
We analyze the suitability of Nd3+ doped phosphate glasses as optical temperature sensors based onthe response of their luminescence bands to temperature. At room temperature, laser excitation of thesample at 532 nm results in an emission spectrum with an intense band centered at 880 nm and anadjacent weak broad band centered at 810 nm, corresponding to the Nd3+ ion transitions: 4F3/2 → 4I9/2
and 4F5/2 → 4I9/2 respectively. Because of thermalization effects between the next 4F3/2 and 4F5/2 energylevels (�E ≈ 908 cm−1), a detectable change on the relative intensities of these emission bands occurswhen temperature is increased, affording the experimental calibration of the fluorescence intensity ratiowith temperature in the range 300–850 K. It has been shown that the radiative transfer processes favoredby the content of Nd3+ ions are also responsible for changes to the spectra shapes and so play an importantrole in the fluorescence intensity ratio. A reliable thermal sensing operation was obtained in a 0.1 mol%doped Nd3+ phosphate glass with relative sensitivity values ranging from 153 × 10−4 K−1 at 300 K to
hermal sensitivityhosphate glasses
ACS:8.20.N− Thermo−optic effects8.55.−m Photoluminescenceroperties and materials
22 × 10−4 K−1 for 850 K, demonstrating good prospects for optical temperature measurements comparedto other reported results. However, the reabsorption measurements seen in the samples with a higherNd3+ content reveal that the reliability of the sensing performance is compromised with the dopingconcentration and the experimental conditions of the measurement.
© 2014 Elsevier B.V. All rights reserved.
. Introduction
Of note among the various optical methods for developingemperature sensors are those based on luminescence properties1,2]. These sensors analyze the thermally induced changes inhe spectral features of the light emitted by ions, such as inten-ity, phase, polarization, wavelength, lifetime and band shape.herefore spectral analysis is required to obtain temperature infor-ation with these sensors. These kinds of systems demonstrate
dvantages over their electrical counterparts as they are free fromlectromagnetic interference, are electrically isolated, show a wideynamic range and can sense the emission remotely through a
∗ Corresponding author. Tel.: +34922318651.E-mail addresses: [email protected], [email protected] (C. Pérez-Rodríguez).
ttp://dx.doi.org/10.1016/j.snb.2014.01.037925-4005/© 2014 Elsevier B.V. All rights reserved.
transparent medium without the need for wires or coupling devices[3]. Regarding their construction and the region measured, thesesystems are designed to be small sized [4,5] or distributed [3]. Aswith several other sensing devices, temperature optical sensors arewidely proposed in the form of optical fibers since, apart from theirinherent light guiding of the luminescence, this construction alsoconfers light weight, small size and low cost [6]. Linked with theoptical fibers, the trivalent Rare Earth (RE) elements have been onethe most reported luminescence centers in the literature. Severalfluorescence emissions from RE3+ in adequate hosts have exhibitedspectral changes associated with a temperature variation. Someremarkable examples are the variations in the intensity of the
emission lines from Eu3+ in La2O2S [7], or the thermal inducedevolution of the Ce3+ emission decays in YAG nanocrystals [8].Uniquely, the RE3+ luminescence emitters - Pr3+, Nd3+, Sm3+,Ho 3+, Er3+, Dy3+, Er3+ and Yb3+ - undergo modifications in the
s and A
btcbattpwdbsasip
fiipaotaielootti
NtTcpNampt[aircFellt(tsoteiwc4
stl
C. Pérez-Rodríguez et al. / Sensor
and shapes of specific emissions due to the effect of the tempera-ure that suggest its study for sensing applications. The band shapehange is caused by a thermally induced population redistributionetween two adjacent energy levels of the emitting center. In theforementioned ions there is a high probability of non-radiativeransitions between the two energy levels that causes them to behermally coupled states, additionally, each level is optically cou-led to a lower common level [9]. Hence, the intensities associatedith the relaxations from the thermalized pairs are temperatureependent, as is the ratio between these intensities, which woulde the measurable output of the sensor. The advantages of this mea-urement, known as the Fluorescence Intensity Ratio (FIR) method,re that it reduces the influences of different factors such as mea-uring conditions, resolution and time exposures [10]. The relativentensities of the luminescence bands should depend only on tem-erature and not on the local concentration of the emitting center.
However, these luminescence systems may present some dif-culties caused by the superposition of different effects that
nfluence the unambiguous interpretation of the signals. One exam-le is the Eu3+ ion, in which the thermal response of its FIR varies bylmost an order of magnitude when the temperature is increasednly a few tens of degrees. This behavior points to a potential emit-er with an excellent sensitivity; unfortunately, the FIR method aspplied to Eu3+ is not reliable because this hyperthermal sensitiv-ty has been shown to rely on the strong thermal dependence of itsnergy transfer rate [11–13] and not on the thermal coupling of theevels. This fact exemplifies that several aspects related to the originf the luminescence at the microscopic level must be considered inrder to obtain an optimized optical temperature sensor based onhe RE3+ luminescence features. In general terms, the key factors arehe properties of the host, the choice of RE3+ ions, the concentrationn which they are found and the transitions considered.
Our aim in this work is to fully characterize the luminescence ofd3+ doped phosphate bulk glasses with different doping concen-
rations so as to gain an insight into its application to thermometry.he phosphate matrix possesses the suitable qualities for opti-al sensors provided in Wade’s conscientious thesis [6], since itrovides a favorable environment for the intense emission of thed3+ doping ions [14,15]. As demonstrated in this work, they have
wide thermal operating range between 300–850 K and can beanufactured in the form of optical fibers with good mechanical
roperties [16]. They also have a low manufacturing cost [17]. Con-rary to the continuous attention aroused by Er3+ doped materials5,18–21], the FIR thermal response of Nd3+ was the object of only
few reports in the early 2000’ [6,22]. However, since very recentlyt has started to attract attention and this use of the ion has beeneported in a variety of forms: bulk, microspheres and nanoparti-les [4,10,23]. There are several reasons that support this interest.irst, for thermal sensing purposes, the Nd3+ ion exhibits sev-ral luminescence transitions from the thermally coupled energyevels 4F5/2 and 4F3/2 that are attainable under excitation withow-cost, diode-pumped, solid-state lasers. Among these possibleransitions, the relaxations 4F3/2 → 4I9/2 (890 nm) and 4F5/2 → 4I9/2810 nm) yield a sensitivity value in FIR that is higher comparedo those terminating at the 4F11/2 or 4F13/2 levels [6]. The spectralhape of the former transitions shows well separated bands with-ut overlaps, which is critical to reducing errors when determininghe fluorescence intensity ratio. Moreover, the 800 and 890 nmmissions lying in the operating range of inexpensive CCD detectorss a feature that enables its industrial production. For these reasons,
e can conclude that the promising results of the Nd3+ fluores-ence intensity ratio response are associated with the relaxations
F3/2 → 4I9/2 and 4F5/2 → 4I9/2, and hence these are the transitionstudied in this work in keeping with the example in most ofhe available FIR reports involving Nd3+. In addition, the energyevel distribution of the Nd3+ ion permits employing an indirectctuators B 195 (2014) 324–331 325
pumping at 532 nm to populate the 4F3/2 level that is well sep-arated from the spectral emissions being analyzed. This strategyis used here in order to avoid the errors caused by detecting thelaser overlapped with the emission bands, and is suggested sinceit simplifies the detection of fluorescence. We note here that theprototype shown in reference [6] exemplifies temperature mea-surement without the need for either spectrographs or opticalspectrum analyzers. It uses a simple scheme consisting mainlyof an Nd3+ doped silica fiber as sensing material coupled by afiber coupler arrangement to low-cost excitation and detectionbranches, consisting respectively of an 808 nm laser diode and twosilicon detectors with proper band pass filters for each of the afore-mentioned transitions. The output of the silicon detectors is justmeasured with voltmeters, and the proper ratio of these measure-ments is proportional to FIR and related to the temperature of thedoped fiber surroundings. The fact that FIR thermal sensing is notconstrained to bulk shapes makes it possible to apply this methodto biomedicine. U. Rocha et al. [23] propose a scheme in which asolution of Nd3+ doped LaF3 nanoparticles can sense temperaturevariations in the biological range for human tissues, and indicateits potential use as tool for early disease detection and control ofthermal treatments.
These sensor applications require high fluorescence intensitiesto yield a good signal to noise ratio when using low-cost detec-tors. Since the power of the pumping laser should be low to avoidoptically heating the glass, the dopant concentration is the param-eter to optimize in order to obtain a bright emission. Recent results[24] show that certain concentrations of Er3+ in fluorotellurite bulkglasses cause the FIR response to be dependent on the zone in thesample where the spectra are measured due to reabsorption effects.Reabsorption, due to the overlap between the absorption and emis-sion spectra, is for most luminescence applications an importantloss factor to be avoided. Regarding the FIR application, this effectcan be a source of disagreement with the theory according to ref-erence [24]. To investigate the relevance of this effect in the Nd3+
doped phosphate glass under study, we tested the FIR in a set ofsamples with different concentrations of dopants. A. Stoita et al.proposed in [25] an experimental arrangement useful for deter-mining the reabsorption effects on the luminescence lifetimes andthat is used extensively here for measuring emission spectra. Thework by Stoita et al. reveals that the reabsorption and total internalreflection effects can significantly affect the result of the lifetimemeasurements if certain experimental conditions are not estab-lished. Taking these results into account we have researched thecorrelation between the FIR response and the concentration of Nd3+
in phosphate glasses.
2. Experimental methods
This section describes the experimental procedure, from sam-ple preparation to optical measurements, followed to obtain theinformation presented in this paper.
2.1. Glass preparation
A conventional melt-quenching method was used to fabricatethe phosphate glasses doped with Nd3+. The glasses presented inthis study have the following chemical compositions: (59−x/2)P2O5, 17.45 K2O, 14.55 BaO, 9 Al2O3 and xNd2O3 with x = 0.1, 2 or4. They are labeled PKBANx. To ensure a very smooth surface theglass samples were carefully polished with a carbide abrasive paper
and then with a FIS polishing film. Their resulting thickness was0.8 mm. Specimens in the shape of 1 cm squares were extractedfrom the preliminary samples by means of a diamond point cutter.A refractive index of 1.525 was measured on an Abbe refractometer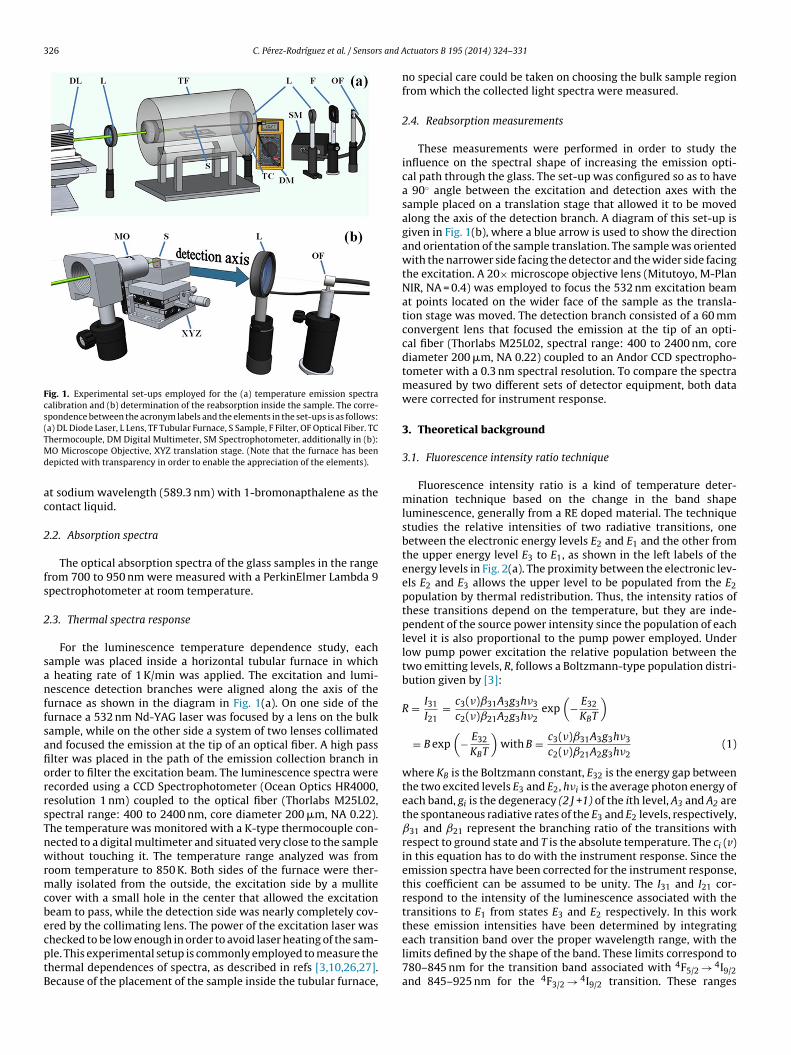
326 C. Pérez-Rodríguez et al. / Sensors and A
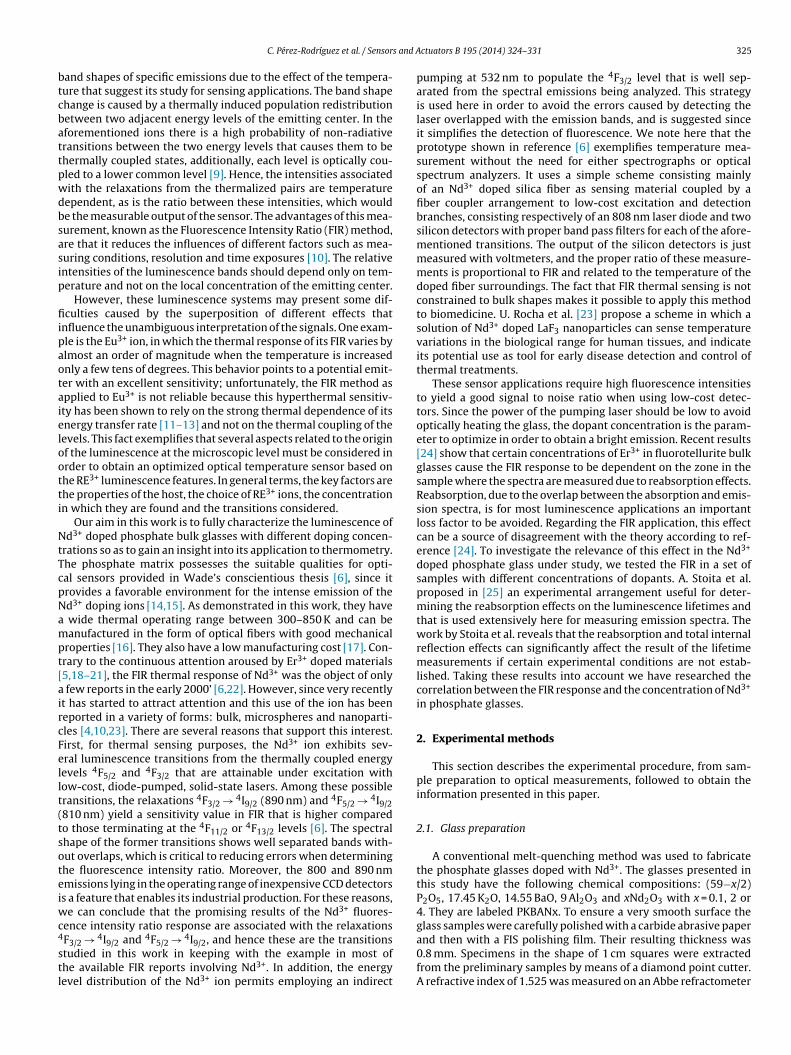
Fig. 1. Experimental set-ups employed for the (a) temperature emission spectracalibration and (b) determination of the reabsorption inside the sample. The corre-spondence between the acronym labels and the elements in the set-ups is as follows:(a) DL Diode Laser, L Lens, TF Tubular Furnace, S Sample, F Filter, OF Optical Fiber. TCTMd
ac
2
fs
2
sanffsafiorrsTnwrmcbecptB
hermocouple, DM Digital Multimeter, SM Spectrophotometer, additionally in (b):O Microscope Objective, XYZ translation stage. (Note that the furnace has been
epicted with transparency in order to enable the appreciation of the elements).
t sodium wavelength (589.3 nm) with 1-bromonapthalene as theontact liquid.
.2. Absorption spectra
The optical absorption spectra of the glass samples in the rangerom 700 to 950 nm were measured with a PerkinElmer Lambda 9pectrophotometer at room temperature.
.3. Thermal spectra response
For the luminescence temperature dependence study, eachample was placed inside a horizontal tubular furnace in which
heating rate of 1 K/min was applied. The excitation and lumi-escence detection branches were aligned along the axis of the
urnace as shown in the diagram in Fig. 1(a). On one side of theurnace a 532 nm Nd-YAG laser was focused by a lens on the bulkample, while on the other side a system of two lenses collimatednd focused the emission at the tip of an optical fiber. A high passlter was placed in the path of the emission collection branch inrder to filter the excitation beam. The luminescence spectra wereecorded using a CCD Spectrophotometer (Ocean Optics HR4000,esolution 1 nm) coupled to the optical fiber (Thorlabs M25L02,pectral range: 400 to 2400 nm, core diameter 200 �m, NA 0.22).he temperature was monitored with a K-type thermocouple con-ected to a digital multimeter and situated very close to the sampleithout touching it. The temperature range analyzed was from
oom temperature to 850 K. Both sides of the furnace were ther-ally isolated from the outside, the excitation side by a mullite
over with a small hole in the center that allowed the excitationeam to pass, while the detection side was nearly completely cov-red by the collimating lens. The power of the excitation laser was
hecked to be low enough in order to avoid laser heating of the sam-le. This experimental setup is commonly employed to measure thehermal dependences of spectra, as described in refs [3,10,26,27].ecause of the placement of the sample inside the tubular furnace,ctuators B 195 (2014) 324–331
no special care could be taken on choosing the bulk sample regionfrom which the collected light spectra were measured.
2.4. Reabsorption measurements
These measurements were performed in order to study theinfluence on the spectral shape of increasing the emission opti-cal path through the glass. The set-up was configured so as to havea 90◦ angle between the excitation and detection axes with thesample placed on a translation stage that allowed it to be movedalong the axis of the detection branch. A diagram of this set-up isgiven in Fig. 1(b), where a blue arrow is used to show the directionand orientation of the sample translation. The sample was orientedwith the narrower side facing the detector and the wider side facingthe excitation. A 20× microscope objective lens (Mitutoyo, M-PlanNIR, NA = 0.4) was employed to focus the 532 nm excitation beamat points located on the wider face of the sample as the transla-tion stage was moved. The detection branch consisted of a 60 mmconvergent lens that focused the emission at the tip of an opti-cal fiber (Thorlabs M25L02, spectral range: 400 to 2400 nm, corediameter 200 �m, NA 0.22) coupled to an Andor CCD spectropho-tometer with a 0.3 nm spectral resolution. To compare the spectrameasured by two different sets of detector equipment, both datawere corrected for instrument response.
3. Theoretical background
3.1. Fluorescence intensity ratio technique
Fluorescence intensity ratio is a kind of temperature deter-mination technique based on the change in the band shapeluminescence, generally from a RE doped material. The techniquestudies the relative intensities of two radiative transitions, onebetween the electronic energy levels E2 and E1 and the other fromthe upper energy level E3 to E1, as shown in the left labels of theenergy levels in Fig. 2(a). The proximity between the electronic lev-els E2 and E3 allows the upper level to be populated from the E2population by thermal redistribution. Thus, the intensity ratios ofthese transitions depend on the temperature, but they are inde-pendent of the source power intensity since the population of eachlevel it is also proportional to the pump power employed. Underlow pump power excitation the relative population between thetwo emitting levels, R, follows a Boltzmann-type population distri-bution given by [3]:
R = I31
I21= c3(�)ˇ31A3g3h�3
c2(�)ˇ21A2g3h�2exp
(− E32
KBT
)
= B exp(
− E32
KBT
)with B = c3(�)ˇ31A3g3h�3
c2(�)ˇ21A2g3h�2(1)
where KB is the Boltzmann constant, E32 is the energy gap betweenthe two excited levels E3 and E2, h�i is the average photon energy ofeach band, gi is the degeneracy (2 J +1) of the ith level, A3 and A2 arethe spontaneous radiative rates of the E3 and E2 levels, respectively,ˇ31 and ˇ21 represent the branching ratio of the transitions withrespect to ground state and T is the absolute temperature. The ci (v)in this equation has to do with the instrument response. Since theemission spectra have been corrected for the instrument response,this coefficient can be assumed to be unity. The I31 and I21 cor-respond to the intensity of the luminescence associated with thetransitions to E1 from states E3 and E2 respectively. In this workthese emission intensities have been determined by integrating
each transition band over the proper wavelength range, with thelimits defined by the shape of the band. These limits correspond to780–845 nm for the transition band associated with 4F5/2 → 4I9/2and 845–925 nm for the 4F3/2 → 4I9/2 transition. These ranges
C. Pérez-Rodríguez et al. / Sensors and Actuators B 195 (2014) 324–331 327
Fig. 2. (a) Partial energy levels diagramof the Nd3+ ions showing the 532 nm pumping and the transitions that originate the 880 nm and the 810 nm emissions. (b) Roomtemperature absorption spectrum and emission spectra at 310 K and 693 K obtained in a PKBAN glass doped with 0.1 mol % Nd3+. The absorption coefficient is plotted in bluec d in bo rsion
dceiaa
ftpm˝Ed
R
3
gtbrls
S
Ebtabwb
ontinuous line and the emission spectra obtained after 532 nm excitation are plottef the references to colour in this figure legend, the reader is referred to the web ve
etermine the Boltzmann fitting and therefore establish the appli-ation of the temperature calibration. The energy levels of the Nd3+
mitters in the phosphate glass samples studied are shown partiallyn Fig. 2(a). In this ion the FIR involves the levels E3: 4F5/2, E2: 4F3/2nd E1: 4I9/2, with the corresponding transitions being 4F5/2 → 4I9/2nd 4F3/2 → 4I9/2.
All the pre-exponential factors can be grouped together in the Bactor, which is determined using the Judd-Ofelt theory to calculatehe rates A3, A2 and the branching ratios ˇ31 and ˇ21. The Judd-Ofeltarameters of the PKBAN Nd3+ doped glass samples were deter-ined in the review of [14] and resulted in ˝2 = 9.23 ×· 10−20 cm2,4 = 7 × 10⁻²⁰ cm2 and ˝6 = 8.74 × 10⁻²⁰ cm2. Using the value of
32 = 908 cm−1 from the absorption spectrum, the theoretical FIRependence Rth yields:
th = 5.36 exp(
−908KBT
)(2)
.2. Sensitivity
A key descriptive parameter of a sensor is its sensitivity S, whichives an estimate of how the sensor output reacts when the value ofhe measured quantity changes. For a fluorescence intensity ratioased sensor, the sensitivity is the rate of change of the intensityatio with the temperature (S = |dR/dT|). However, in order to ana-yze the sensing performance of various host materials, a relativeensitivity SR is often reported, defined as [3]:
R = S
R= 1
R
∣∣∣dR
dT
∣∣∣ = E32
KBT2(3)
From this equation it would seem that larger energy gaps for the32 transition confer greater sensitivities. In practice, the separationetween the energy levels must allow for significant thermaliza-
ion, resulting in the upper level being sufficiently populated sos to obtain a detectable transition. Moreover, the levels need toe sufficiently separated to avoid overlap of the two fluorescenceavelengths, meaning the eligible range for the energy gaps isetween 200–2000 cm−1.
lack continuous line for 310 K and in black dashed line for 693 K. (For interpretationof this article.).
4. Results and discussion
4.1. Absorption and luminescence spectra of Nd3+ doped PKBANsamples
The absorption and luminescence spectra of the 0.1 mol% Nd3
doped PKBAN glass samples are shown in the graph in Fig. 2(b). Theabsorption spectrum plotted in blue in Fig. 2(b) shows three bandscentered at 750 nm, 800 nm and 870 nm with their correspond-ing transitions from the ground state: 4I9/2 → 4F7/2, 4I9/2 → 4F5/2and 4I9/2 → 4F3/2. The energy gap between the 4F5/2 and 4F3/2 wasdetermined by the distance between the centroids of the last twoabsorption transition bands, yielding a value of 908 cm−1.
In Fig. 2(b), the luminescence resulting from laser excitation at532 nm on the PKBAN01 sample at 310 K is plotted with a solidline, while that measured at 693 K is shown in the spectrum witha dashed black line. The mechanisms that give place to this lumi-nescence can be followed with the aid of the energy diagram inFig. 2(a). The pump at 532 nm excites the Nd3+ ions from theground state 4I9/2 to the 4G7/2 levels, as represented with a greenup arrow in the diagram. As a consequence of the small energy gapsbetween the adjacent lower levels, there are successive non- radia-tive de-excitations to the 4F3/2 level, depicted with a dashed downarrow. The energy distance between the 4F3/2 level and the nextlower 4I15/2 level is large enough to ensure that non-radiative de-excitations do not occur. Instead, radiative transitions predominate,like the relaxation to the ground state 4F3/2 → 4I9/2 associated withthe intense emission band centered at 880 nm, shown on the dia-gram with a solid down arrow. Additionally, at 693 K the emissionspectrum shows a strong emission band related to the 4F5/2 → 4I9/2transition centered at 810 nm. This band exists at this temperaturebecause an induced thermal redistribution of the 4F3/2 populationincrements the population of 4F5/2 and triggers the transition of the4F5/2 level to the ground state. Moreover, the next higher level 4F7/2
can also be populated through thermalization from the 4F5/2 and aweaker band associated with the 4F7/2 → 4I9/2 transition is evidentin the spectrum at 740 nm. Thermal induced redistributions aredepicted by curved red arrows in Fig. 2(a).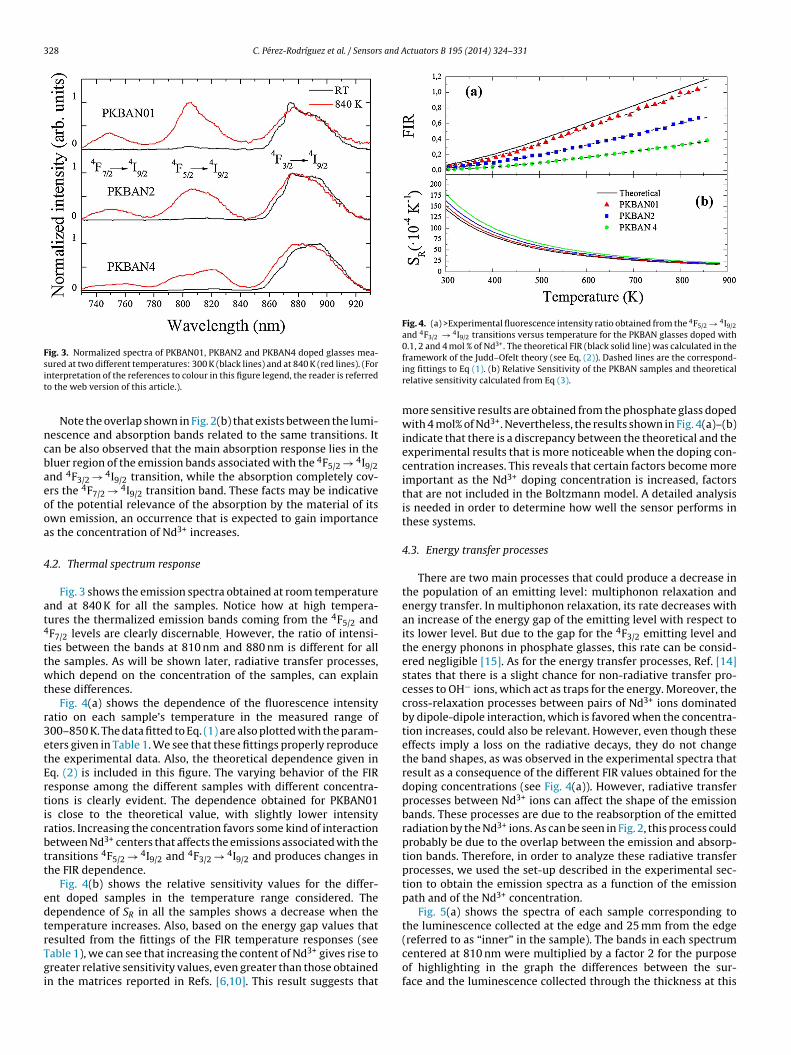
328 C. Pérez-Rodríguez et al. / Sensors and Actuators B 195 (2014) 324–331
Fig. 3. Normalized spectra of PKBAN01, PKBAN2 and PKBAN4 doped glasses mea-sit
ncbaeooa
4
at4
ttwt
r3etErtirbtt
edtrTgi
Fig. 4. (a) >Experimental fluorescence intensity ratio obtained from the 4F5/2 → 4I9/2
and 4F3/2 → 4I9/2 transitions versus temperature for the PKBAN glasses doped with0.1, 2 and 4 mol % of Nd3+. The theoretical FIR (black solid line) was calculated in the
ured at two different temperatures: 300 K (black lines) and at 840 K (red lines). (Fornterpretation of the references to colour in this figure legend, the reader is referredo the web version of this article.).
Note the overlap shown in Fig. 2(b) that exists between the lumi-escence and absorption bands related to the same transitions. Itan be also observed that the main absorption response lies in theluer region of the emission bands associated with the 4F5/2 → 4I9/2nd 4F3/2 → 4I9/2 transition, while the absorption completely cov-rs the 4F7/2 → 4I9/2 transition band. These facts may be indicativef the potential relevance of the absorption by the material of itswn emission, an occurrence that is expected to gain importances the concentration of Nd3+ increases.
.2. Thermal spectrum response
Fig. 3 shows the emission spectra obtained at room temperaturend at 840 K for all the samples. Notice how at high tempera-ures the thermalized emission bands coming from the 4F5/2 andF7/2 levels are clearly discernable. However, the ratio of intensi-ies between the bands at 810 nm and 880 nm is different for allhe samples. As will be shown later, radiative transfer processes,hich depend on the concentration of the samples, can explain
hese differences.Fig. 4(a) shows the dependence of the fluorescence intensity
atio on each sample’s temperature in the measured range of00–850 K. The data fitted to Eq. (1) are also plotted with the param-ters given in Table 1. We see that these fittings properly reproducehe experimental data. Also, the theoretical dependence given inq. (2) is included in this figure. The varying behavior of the FIResponse among the different samples with different concentra-ions is clearly evident. The dependence obtained for PKBAN01s close to the theoretical value, with slightly lower intensityatios. Increasing the concentration favors some kind of interactionetween Nd3+ centers that affects the emissions associated with theransitions 4F5/2 → 4I9/2 and 4F3/2 → 4I9/2 and produces changes inhe FIR dependence.
Fig. 4(b) shows the relative sensitivity values for the differ-nt doped samples in the temperature range considered. Theependence of SR in all the samples shows a decrease when theemperature increases. Also, based on the energy gap values that
esulted from the fittings of the FIR temperature responses (seeable 1), we can see that increasing the content of Nd3+ gives rise toreater relative sensitivity values, even greater than those obtainedn the matrices reported in Refs. [6,10]. This result suggests thatframework of the Judd–Ofelt theory (see Eq, (2)). Dashed lines are the correspond-ing fittings to Eq (1). (b) Relative Sensitivity of the PKBAN samples and theoreticalrelative sensitivity calculated from Eq (3).
more sensitive results are obtained from the phosphate glass dopedwith 4 mol% of Nd3+. Nevertheless, the results shown in Fig. 4(a)–(b)indicate that there is a discrepancy between the theoretical and theexperimental results that is more noticeable when the doping con-centration increases. This reveals that certain factors become moreimportant as the Nd3+ doping concentration is increased, factorsthat are not included in the Boltzmann model. A detailed analysisis needed in order to determine how well the sensor performs inthese systems.
4.3. Energy transfer processes
There are two main processes that could produce a decrease inthe population of an emitting level: multiphonon relaxation andenergy transfer. In multiphonon relaxation, its rate decreases withan increase of the energy gap of the emitting level with respect toits lower level. But due to the gap for the 4F3/2 emitting level andthe energy phonons in phosphate glasses, this rate can be consid-ered negligible [15]. As for the energy transfer processes, Ref. [14]states that there is a slight chance for non-radiative transfer pro-cesses to OH− ions, which act as traps for the energy. Moreover, thecross-relaxation processes between pairs of Nd3+ ions dominatedby dipole-dipole interaction, which is favored when the concentra-tion increases, could also be relevant. However, even though theseeffects imply a loss on the radiative decays, they do not changethe band shapes, as was observed in the experimental spectra thatresult as a consequence of the different FIR values obtained for thedoping concentrations (see Fig. 4(a)). However, radiative transferprocesses between Nd3+ ions can affect the shape of the emissionbands. These processes are due to the reabsorption of the emittedradiation by the Nd3+ ions. As can be seen in Fig. 2, this process couldprobably be due to the overlap between the emission and absorp-tion bands. Therefore, in order to analyze these radiative transferprocesses, we used the set-up described in the experimental sec-tion to obtain the emission spectra as a function of the emissionpath and of the Nd3+ concentration.
Fig. 5(a) shows the spectra of each sample corresponding tothe luminescence collected at the edge and 25 mm from the edge
(referred to as “inner” in the sample). The bands in each spectrumcentered at 810 nm were multiplied by a factor 2 for the purposeof highlighting in the graph the differences between the sur-face and the luminescence collected through the thickness at this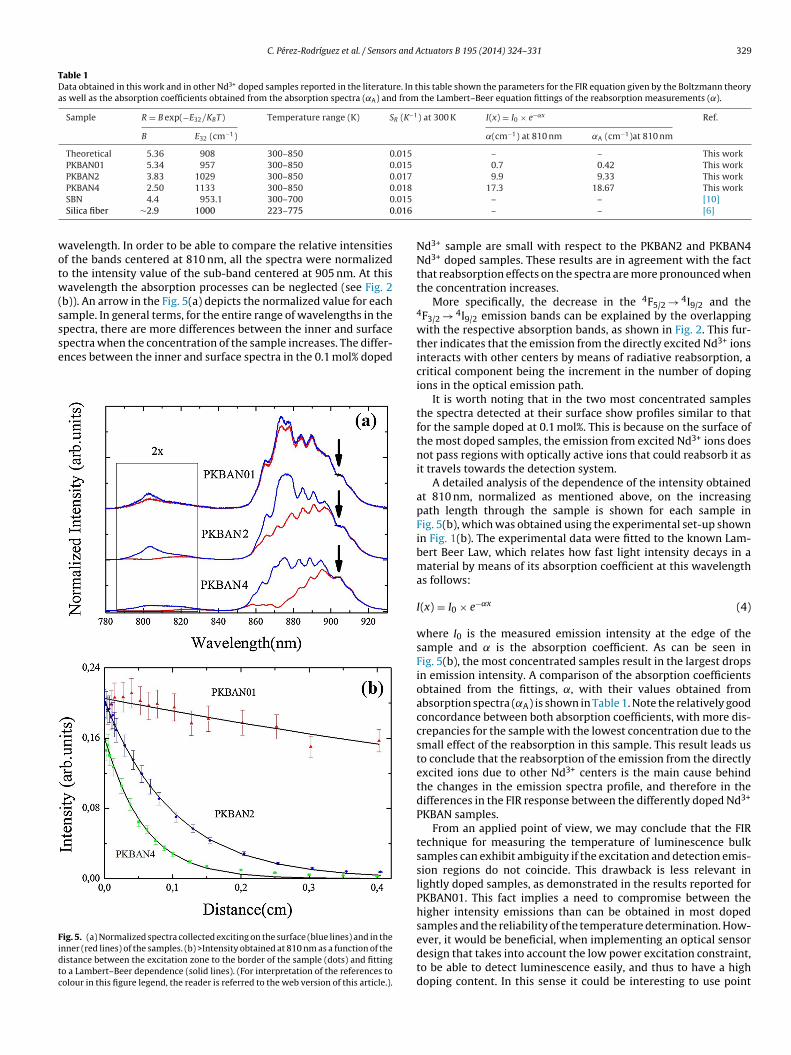
C. Pérez-Rodríguez et al. / Sensors and Actuators B 195 (2014) 324–331 329
Table 1Data obtained in this work and in other Nd3+ doped samples reported in the literature. In this table shown the parameters for the FIR equation given by the Boltzmann theoryas well as the absorption coefficients obtained from the absorption spectra (˛A) and from the Lambert–Beer equation fittings of the reabsorption measurements (˛).
Sample R = B exp(−E32/KBT) Temperature range (K) SR (K−1) at 300 K I(x) = I0 × e−˛x Ref.
B E32 (cm−1) ˛(cm−1) at 810 nm ˛A (cm−1)at 810 nm
Theoretical 5.36 908 300–850 0.015 – – This workPKBAN01 5.34 957 300–850 0.015 0.7 0.42 This workPKBAN2 3.83 1029 300–850 0.017 9.9 9.33 This work
.018
.015
.016
wotw(ssse
Fidtc
PKBAN4 2.50 1133 300–850 0SBN 4.4 953.1 300–700 0Silica fiber ∼2.9 1000 223–775 0
avelength. In order to be able to compare the relative intensitiesf the bands centered at 810 nm, all the spectra were normalizedo the intensity value of the sub-band centered at 905 nm. At thisavelength the absorption processes can be neglected (see Fig. 2
b)). An arrow in the Fig. 5(a) depicts the normalized value for each
ample. In general terms, for the entire range of wavelengths in thepectra, there are more differences between the inner and surfacepectra when the concentration of the sample increases. The differ-nces between the inner and surface spectra in the 0.1 mol% dopedig. 5. (a) Normalized spectra collected exciting on the surface (blue lines) and in thenner (red lines) of the samples. (b) >Intensity obtained at 810 nm as a function of theistance between the excitation zone to the border of the sample (dots) and fittingo a Lambert–Beer dependence (solid lines). (For interpretation of the references toolour in this figure legend, the reader is referred to the web version of this article.).
17.3 18.67 This work– – [10]– – [6]
Nd3+ sample are small with respect to the PKBAN2 and PKBAN4Nd3+ doped samples. These results are in agreement with the factthat reabsorption effects on the spectra are more pronounced whenthe concentration increases.
More specifically, the decrease in the 4F5/2 → 4I9/2 and the4F3/2 → 4I9/2 emission bands can be explained by the overlappingwith the respective absorption bands, as shown in Fig. 2. This fur-ther indicates that the emission from the directly excited Nd3+ ionsinteracts with other centers by means of radiative reabsorption, acritical component being the increment in the number of dopingions in the optical emission path.
It is worth noting that in the two most concentrated samplesthe spectra detected at their surface show profiles similar to thatfor the sample doped at 0.1 mol%. This is because on the surface ofthe most doped samples, the emission from excited Nd3+ ions doesnot pass regions with optically active ions that could reabsorb it asit travels towards the detection system.
A detailed analysis of the dependence of the intensity obtainedat 810 nm, normalized as mentioned above, on the increasingpath length through the sample is shown for each sample inFig. 5(b), which was obtained using the experimental set-up shownin Fig. 1(b). The experimental data were fitted to the known Lam-bert Beer Law, which relates how fast light intensity decays in amaterial by means of its absorption coefficient at this wavelengthas follows:
I(x) = I0 × e−˛x (4)
where I0 is the measured emission intensity at the edge of thesample and ̨ is the absorption coefficient. As can be seen inFig. 5(b), the most concentrated samples result in the largest dropsin emission intensity. A comparison of the absorption coefficientsobtained from the fittings, ˛, with their values obtained fromabsorption spectra (˛A) is shown in Table 1. Note the relatively goodconcordance between both absorption coefficients, with more dis-crepancies for the sample with the lowest concentration due to thesmall effect of the reabsorption in this sample. This result leads usto conclude that the reabsorption of the emission from the directlyexcited ions due to other Nd3+ centers is the main cause behindthe changes in the emission spectra profile, and therefore in thedifferences in the FIR response between the differently doped Nd3+
PKBAN samples.From an applied point of view, we may conclude that the FIR
technique for measuring the temperature of luminescence bulksamples can exhibit ambiguity if the excitation and detection emis-sion regions do not coincide. This drawback is less relevant inlightly doped samples, as demonstrated in the results reported forPKBAN01. This fact implies a need to compromise between thehigher intensity emissions than can be obtained in most dopedsamples and the reliability of the temperature determination. How-
ever, it would be beneficial, when implementing an optical sensordesign that takes into account the low power excitation constraint,to be able to detect luminescence easily, and thus to have a highdoping content. In this sense it could be interesting to use point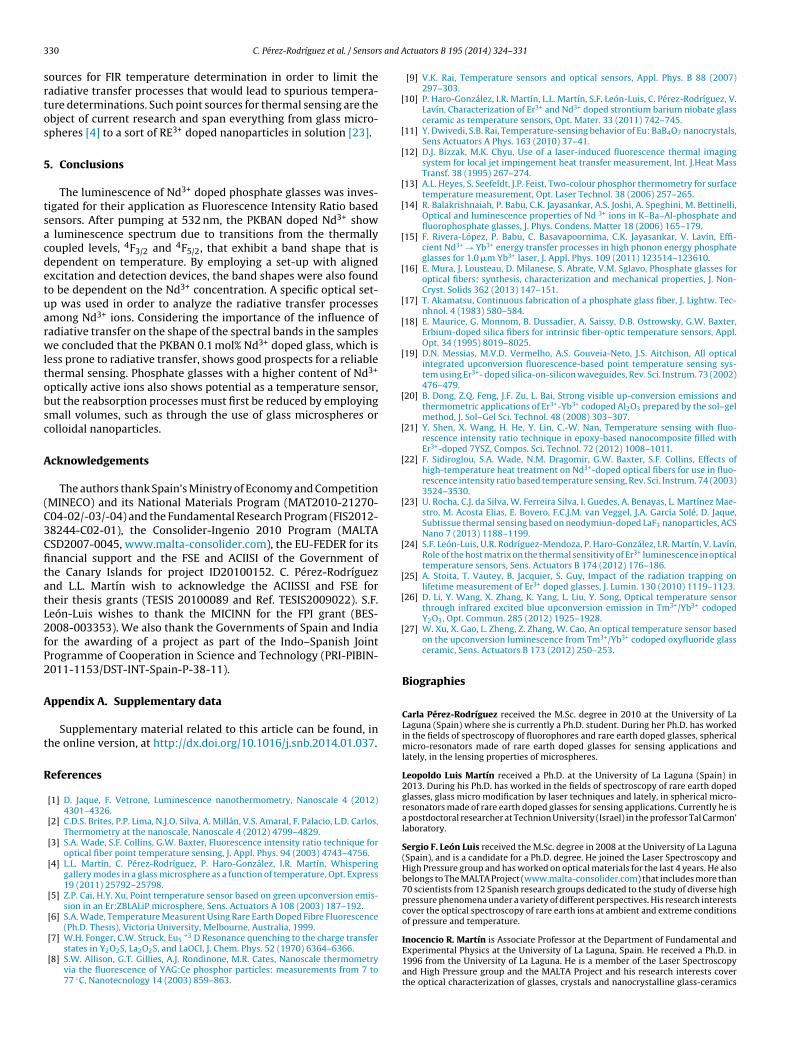
3 s and A
srtos
5
tsacdetuarwltobsc
A
(C3CfitatL2fP2
A
t
R
[
[
[
[
[
[
[
[
[
[
[
[
[
[
[
[
[
[
30 C. Pérez-Rodríguez et al. / Sensor
ources for FIR temperature determination in order to limit theadiative transfer processes that would lead to spurious tempera-ure determinations. Such point sources for thermal sensing are thebject of current research and span everything from glass micro-pheres [4] to a sort of RE3+ doped nanoparticles in solution [23].
. Conclusions
The luminescence of Nd3+ doped phosphate glasses was inves-igated for their application as Fluorescence Intensity Ratio basedensors. After pumping at 532 nm, the PKBAN doped Nd3+ show
luminescence spectrum due to transitions from the thermallyoupled levels, 4F3/2 and 4F5/2, that exhibit a band shape that isependent on temperature. By employing a set-up with alignedxcitation and detection devices, the band shapes were also foundo be dependent on the Nd3+ concentration. A specific optical set-p was used in order to analyze the radiative transfer processesmong Nd3+ ions. Considering the importance of the influence ofadiative transfer on the shape of the spectral bands in the samplese concluded that the PKBAN 0.1 mol% Nd3+ doped glass, which is
ess prone to radiative transfer, shows good prospects for a reliablehermal sensing. Phosphate glasses with a higher content of Nd3+
ptically active ions also shows potential as a temperature sensor,ut the reabsorption processes must first be reduced by employingmall volumes, such as through the use of glass microspheres orolloidal nanoparticles.
cknowledgements
The authors thank Spain’s Ministry of Economy and CompetitionMINECO) and its National Materials Program (MAT2010-21270-04-02/-03/-04) and the Fundamental Research Program (FIS2012-8244-C02-01), the Consolider-Ingenio 2010 Program (MALTASD2007-0045, www.malta-consolider.com), the EU-FEDER for itsnancial support and the FSE and ACIISI of the Government ofhe Canary Islands for project ID20100152. C. Pérez-Rodrígueznd L.L. Martín wish to acknowledge the ACIISSI and FSE forheir thesis grants (TESIS 20100089 and Ref. TESIS2009022). S.F.eón-Luis wishes to thank the MICINN for the FPI grant (BES-008-003353). We also thank the Governments of Spain and Indiaor the awarding of a project as part of the Indo–Spanish Jointrogramme of Cooperation in Science and Technology (PRI-PIBIN-011-1153/DST-INT-Spain-P-38-11).
ppendix A. Supplementary data
Supplementary material related to this article can be found, inhe online version, at http://dx.doi.org/10.1016/j.snb.2014.01.037.
eferences
[1] D. Jaque, F. Vetrone, Luminescence nanothermometry, Nanoscale 4 (2012)4301–4326.
[2] C.D.S. Brites, P.P. Lima, N.J.O. Silva, A. Millán, V.S. Amaral, F. Palacio, L.D. Carlos,Thermometry at the nanoscale, Nanoscale 4 (2012) 4799–4829.
[3] S.A. Wade, S.F. Collins, G.W. Baxter, Fluorescence intensity ratio technique foroptical fiber point temperature sensing, J. Appl. Phys. 94 (2003) 4743–4756.
[4] L.L. Martín, C. Pérez-Rodríguez, P. Haro-González, I.R. Martín, Whisperinggallery modes in a glass microsphere as a function of temperature, Opt. Express19 (2011) 25792–25798.
[5] Z.P. Cai, H.Y. Xu, Point temperature sensor based on green upconversion emis-sion in an Er:ZBLALiP microsphere, Sens. Actuators A 108 (2003) 187–192.
[6] S.A. Wade, Temperature Measurent Using Rare Earth Doped Fibre Fluorescence(Ph.D. Thesis), Victoria University, Melbourne, Australia, 1999.
[7] W.H. Fonger, C.W. Struck, Eu5+3 D Resonance quenching to the charge transfer
states in Y2O2S, La2O2S, and LaOCI, J. Chem. Phys. 52 (1970) 6364–6366.[8] S.W. Allison, G.T. Gillies, A.J. Rondinone, M.R. Cates, Nanoscale thermometry
via the fluorescence of YAG:Ce phosphor particles: measurements from 7 to77 ◦C, Nanotecnology 14 (2003) 859–863.
ctuators B 195 (2014) 324–331
[9] V.K. Rai, Temperature sensors and optical sensors, Appl. Phys. B 88 (2007)297–303.
10] P. Haro-González, I.R. Martín, L.L. Martín, S.F. León-Luis, C. Pérez-Rodríguez, V.Lavín, Characterization of Er3+ and Nd3+ doped strontium barium niobate glassceramic as temperature sensors, Opt. Mater. 33 (2011) 742–745.
11] Y. Dwivedi, S.B. Rai, Temperature-sensing behavior of Eu: BaB4O7 nanocrystals,Sens Actuators A Phys. 163 (2010) 37–41.
12] D.J. Bizzak, M.K. Chyu, Use of a laser-induced fluorescence thermal imagingsystem for local jet impingement heat transfer measurement, Int. J.Heat MassTransf. 38 (1995) 267–274.
13] A.L. Heyes, S. Seefeldt, J.P. Feist, Two-colour phosphor thermometry for surfacetemperature measurement, Opt. Laser Technol. 38 (2006) 257–265.
14] R. Balakrishnaiah, P. Babu, C.K. Jayasankar, A.S. Joshi, A. Speghini, M. Bettinelli,Optical and luminescence properties of Nd 3+ ions in K–Ba–Al-phosphate andfluorophosphate glasses, J. Phys. Condens. Matter 18 (2006) 165–179.
15] F. Rivera-López, P. Babu, C. Basavapoornima, C.K. Jayasankar, V. Lavín, Effi-cient Nd3+ → Yb3+ energy transfer processes in high phonon energy phosphateglasses for 1.0 �m Yb3+ laser, J. Appl. Phys. 109 (2011) 123514–123610.
16] E. Mura, J. Lousteau, D. Milanese, S. Abrate, V.M. Sglavo, Phosphate glasses foroptical fibers: synthesis, characterization and mechanical properties, J. Non-Cryst. Solids 362 (2013) 147–151.
17] T. Akamatsu, Continuous fabrication of a phosphate glass fiber, J. Lightw. Tec-nhnol. 4 (1983) 580–584.
18] E. Maurice, G. Monnom, B. Dussadier, A. Saissy, D.B. Ostrowsky, G.W. Baxter,Erbium-doped silica fibers for intrinsic fiber-optic temperature sensors, Appl.Opt. 34 (1995) 8019–8025.
19] D.N. Messias, M.V.D. Vermelho, A.S. Gouveia-Neto, J.S. Aitchison, All opticalintegrated upconversion fluorescence-based point temperature sensing sys-tem using Er3+- doped silica-on-silicon waveguides, Rev. Sci. Instrum. 73 (2002)476–479.
20] B. Dong, Z.Q. Feng, J.F. Zu, L. Bai, Strong visible up-conversion emissions andthermometric applications of Er3+-Yb3+ codoped Al2O3 prepared by the sol–gelmethod, J. Sol–Gel Sci. Technol. 48 (2008) 303–307.
21] Y. Shen, X. Wang, H. He, Y. Lin, C.-W. Nan, Temperature sensing with fluo-rescence intensity ratio technique in epoxy-based nanocomposite filled withEr3+-doped 7YSZ, Compos. Sci. Technol. 72 (2012) 1008–1011.
22] F. Sidiroglou, S.A. Wade, N.M. Dragomir, G.W. Baxter, S.F. Collins, Effects ofhigh-temperature heat treatment on Nd3+-doped optical fibers for use in fluo-rescence intensity ratio based temperature sensing, Rev. Sci. Instrum. 74 (2003)3524–3530.
23] U. Rocha, C.J. da Silva, W. Ferreira Silva, I. Guedes, A. Benayas, L. Martínez Mae-stro, M. Acosta Elias, E. Bovero, F.C.J.M. van Veggel, J.A. García Solé, D. Jaque,Subtissue thermal sensing based on neodymiun-doped LaF3 nanoparticles, ACSNano 7 (2013) 1188–1199.
24] S.F. León-Luis, U.R. Rodríguez-Mendoza, P. Haro-González, I.R. Martín, V. Lavín,Role of the host matrix on the thermal sensitivity of Er3+ luminescence in opticaltemperature sensors, Sens. Actuators B 174 (2012) 176–186.
25] A. Stoita, T. Vautey, B. Jacquier, S. Guy, Impact of the radiation trapping onlifetime measurement of Er3+ doped glasses, J. Lumin. 130 (2010) 1119–1123.
26] D. Li, Y. Wang, X. Zhang, K. Yang, L. Liu, Y. Song, Optical temperature sensorthrough infrared excited blue upconversion emission in Tm3+/Yb3+ codopedY2O3, Opt. Commun. 285 (2012) 1925–1928.
27] W. Xu, X. Gao, L. Zheng, Z. Zhang, W. Cao, An optical temperature sensor basedon the upconversion luminescence from Tm3+/Yb3+ codoped oxyfluoride glassceramic, Sens. Actuators B 173 (2012) 250–253.
Biographies
Carla Pérez-Rodríguez received the M.Sc. degree in 2010 at the University of LaLaguna (Spain) where she is currently a Ph.D. student. During her Ph.D. has workedin the fields of spectroscopy of fluorophores and rare earth doped glasses, sphericalmicro-resonators made of rare earth doped glasses for sensing applications andlately, in the lensing properties of microspheres.
Leopoldo Luis Martín received a Ph.D. at the University of La Laguna (Spain) in2013. During his Ph.D. has worked in the fields of spectroscopy of rare earth dopedglasses, glass micro modification by laser techniques and lately, in spherical micro-resonators made of rare earth doped glasses for sensing applications. Currently he isa postdoctoral researcher at Technion University (Israel) in the professor Tal Carmon’laboratory.
Sergio F. León Luis received the M.Sc. degree in 2008 at the University of La Laguna(Spain), and is a candidate for a Ph.D. degree. He joined the Laser Spectroscopy andHigh Pressure group and has worked on optical materials for the last 4 years. He alsobelongs to The MALTA Project (www.malta-consolider.com) that includes more than70 scientists from 12 Spanish research groups dedicated to the study of diverse highpressure phenomena under a variety of different perspectives. His research interestscover the optical spectroscopy of rare earth ions at ambient and extreme conditionsof pressure and temperature.
Inocencio R. Martín is Associate Professor at the Department of Fundamental andExperimental Physics at the University of La Laguna, Spain. He received a Ph.D. in1996 from the University of La Laguna. He is a member of the Laser Spectroscopyand High Pressure group and the MALTA Project and his research interests coverthe optical characterization of glasses, crystals and nanocrystalline glass-ceramics

s and A
dno
KVdo
C. Pérez-Rodríguez et al. / Sensor
oped with optically active ions. He has over 110 publications in peer reviewed jour-als and conference proceedings. Currently he is involved in optical characterizationf microspheres doped with rare-earth ions and their applications in sensors.
. Kiran Kumar received his Master degree in Physics in 1999 from Srienkateswara University, Tirupati, India and currently he is working for his Ph.D.egree. He joined in the Photonics group in the Department of Physics and workingn the “Solid state spectroscopy of rare earth elements” for the last five years.
ctuators B 195 (2014) 324–331 331
C. K. Jayasankar is a Professor at the Department of Physics, Sri Venkateswara Uni-versity, Tirupati, India. He received his Ph.D. degree in 1984 from Sri VenkateswaraUniversity, Tirupati. He is having 24 years of teaching experience for students of Mas-
ter of Science in Physics besides 34 years of research experience in the field of SolidState Spectroscopy and development of luminescent materials. He has over 165 pub-lications in internationally reputed journals and conference proceedings. Presentlyhe is involved in optical characterization of lanthanide doped glasses, glass-ceramicsand nanocrystals for photonic applications.