release of gas bubbles from lake sediment traced by noble gas isotopes in the sediment pore water
TRANSCRIPT

wwwelseviercomlocateepsl
=Earth and Planetary Science L
Release of gas bubbles from lake sediment traced by
noble gas isotopes in the sediment pore water
Matthias S BrennwaldaT Rolf Kipferac Dieter M Imbodenb
aDepartment of Water Resources and Drinking Water Swiss Federal Institute for Environmental Science and Technology
Dubendorf SwitzerlandbDepartment of Environmental Sciences Swiss Federal Institute of Technology Zurich Switzerland
cDepartment of Isotope Geochemistry and Mineral Resources Swiss Federal Institute of Technology Zurich Switzerland
Received 29 September 2004 received in revised form 11 February 2005 accepted 4 March 2005
Available online 23 May 2005
Editor K Parley
Abstract
The release of gas bubbles from lacustrine or oceanic sediments into the overlying water (ebullition) is a major mechanism
for the discharge of biogenic or geogenic gases into the water body Ebullition of methane or carbon dioxide for instance
contributes considerably to the release of these potent greenhouse gases through the sedimentwater interface Depending on the
rate of ebullition the pore water will show a depletion in dissolved atmospheric noble gases because the poorly soluble noble
gases escape from the pore water into the gas bubbles
In this study the depletion of dissolved noble gases in sediment pore water was analyzed for the first time to study bubble
formation and ebullition in sediments The noble gases in the pore water of the sediments of Soppensee (Switzerland) show a
distinct depletion due to ebullition of biologically produced methane This depletion is lowest in the deep sediment and increases
towards the sediment surface The noble gas isotope ratios in the pore water indicate that vertical diffusion barely affects the
observed noble gas profiles The isotope ratios further show that the methane bubbles remain long enough in the sediment to
attain noble gas solubility equilibrium before escaping into the overlying water The volume of gas released from the sediment by
ebullition can therefore be reconstructed from the extent of the noble gas depletion in the pore water using a simple gas-
equilibration model The noble gas profiles in the sediment indicate that ebullition increased in Soppensee during the Holocene
and that ebullition contributed strongly to the release of methane from the sediment Our case study thus illustrates that noble
gases are sensitive proxies for the release of gas from lacustrine and marine sediments or similar aquatic environments
D 2005 Elsevier BV All rights reserved
Keywords lake sediment pore water Soppensee methane carbon dioxide ebullition
0012-821X$ - see front matter D 2005 Elsevier BV All rights reserved
doi101016jepsl200503004
T Corresponding author
E-mail address matthiasbrennwaldeawagch
(MS Brennwald)
1 Introduction
The concentrations of dissolved atmospheric noble
gases in lake sediment pore water have been shown to
etters 235 (2005) 31ndash44
MS Brennwald et al Earth and Planetary Science Letters 235 (2005) 31ndash4432
reflect the (past) noble gas concentrations in the
overlying water [12] This noble gas archive allowed
the paleosalinity and lake level to be reconstructed in
Lake Issyk-Kul (Kyrgyzstan) [2] Further recent work
has shown that if gas bubbles are present in the
sediment eg due to supersaturation with biogenic
CH4 noble gases tend to escape from the sediment
pore water into these bubbles resulting in a character-
istic noble gas depletion of the pore water [1] Noble
gases are therefore expected to be useful tracers to
study the release of gas bubbles from lacustrine or
marine sediments (ebullition)
Ebullition has been identified as a major process
for the transport of CH4 and CO2 through the
sedimentwater interface and may therefore play an
important role in the release of these potent green-
house gases into the atmosphere [3ndash6] Apart from
biological gas production depletion of dissolved
noble gases due to removal by gas bubbles can be
used to study gaswater partitioning in hydrothermal
systems in the ocean eg at mid-ocean ridges or in the
Red Sea where noble gas depletion indicates that
fluids cycling through the subsurface are partially
degassed due to boiling in a hydrothermal system
before they are fed back into the deep water [7]
Further the gas release from submarine gas vents that
are often associated with mud volcanoes or the
occurrence of gas hydrates in the sediment can be
studied based on noble gas depletion in the water
above the vents (eg in the Black Sea [89]) The
noble gas signature of the pore water of the sediment
in the vicinity of gas vents is expected to reflect the
Zurich
Bern
Soppensee
Basel
50 km
Fig 1 Left map of Switzerland showing the geographical location of
(after [12])
amount and geochemical origin of the gases released
Finally noble gases can be removed from ground-
water by incorporation into gas bubbles escaping from
the groundwater into the unsaturated zone Analo-
gously to surface waters the resulting noble gas
depletion of the groundwater can therefore be used to
study degassing in aquifers [1011]
Until now however noble gas depletion in
sediment pore water due to gas loss into bubbles
has only been considered as an artifact interfering
with the reconstruction of past noble gas concen-
trations and the corresponding environmental con-
ditions in the overlying water [1] but not as a proxy
for ebullition and the formation of gas bubbles in the
sediment
In this study we analyzed noble gas concentrations
in the sediment pore water of Soppensee a eutrophic
lake in Switzerland These data are used to study the
gas partitioning between pore water and gas bubbles
and the vertical transport of noble gases in the
sediment Our study therefore illustrates the useful-
ness of the pore water as a noble gas archive for the
reconstruction of ebullition in the past
2 Methods
21 Study site
Soppensee (central Switzerland Fig 1) is a small
freshwater lake with a surface area of 023 km2 and a
maximum water depth of 27 m situated at an
Sampling site8ordm488E 47ordm542N
100 m
12 m
24 m
20 m
16 m
8 m
Soppensee (596 masl) Right bathymetric map of Soppensee
06 08 1
0
1
2
3
4
5
6
7
φ [vv]
C
V
H
Sed
imen
t dep
th [m
]
YD
0
02
10
39
68
98
132
145
Sed
imen
t age
[kyr
]
Fig 2 Sediment lithology and porosity (unpublished data M
Sturm EAWAG) determined from a long core taken at the centre
of the lake (SO89-23 [19]) The lithological units (simplified after
[19]) are homogeneous sediment (H) (partly) varved sediment
(V) homogeneous clay (C) YD marks the Younger Dryas cold
period [18]
MS Brennwald et al Earth and Planetary Science Letters 235 (2005) 31ndash44 33
elevation of 596 masl The Soppensee sediments
have been thoroughly studied with a view to
ascertaining the paleoclimatic conditions prevailing
in and around the lake since 14 kyr BP [12ndash19]
At the centre of the lake the sediment is 7 m thick
Between 6 and 7 m the sediment consists of
homogeneous clay (Fig 2) whereas above 6 m it is
rich in organic material Between 27 and 6 m
sediment depth the sediment is varved whereas
above 27 m it is homogeneous [19] The distribution
pattern of chironomids in the sediment indicates
qualitatively that Soppensee was oligotrophic during
Ne Ar
25 50 75 100 25 50 75 100
Ci
0
1
2
3
4
5
6
7
Sed
imen
t dep
th [m
]
Fig 3 Leftmost panel arrangement of the overlapping sediment cores and
gas concentrations Ci (normalized to the atmospheric equilibrium concentra
age The circles correspond to the pore water the squares to the overlying w
than the circles representing the data and are therefore not shown
the Younger Dryas and increasingly eutrophic during
the Holocene [18] Because of intense agriculture in
its catchment area Soppensee has become hyper-
trophic in recent decades [19] Correspondingly the
sediment shows a high rate of CH4 production as a
result of the biological degradation of organic matter
[20] The deep water (with an annual mean temper-
ature of 55 8C) is anoxic during the warm season
when the hypolimnion is well separated from the
epilimnion by chemical and temperature gradients
During the cold season the lake is well mixed and the
deep water becomes oxic [20] The existence of
varves in the sediment deposited during the earlier
Holocene indicates that such seasonal cycling in the
oxic conditions of the deep water has been occurring
since the beginning of the Holocene [20]
22 Noble gas sampling and analysis
Sediment samples for noble gas analysis [1] were
collected in the centre of the lake using an UWITEC
piston corer operated from a floating platform [21]
Three 3-m long vertically overlapping sediment
segments were taken Together these segments cover
the whole sediment series (Fig 3) To minimize the
lateral offset between the three segments the platform
was fixed by an anchor and by ropes fixed at the
shore The resulting lateral offset of the segments is
expected to be ]1 m
In addition a gravity core covering the uppermost
70 cm of the sediment was taken The water just
above the sediment surface was sampled for noble gas
Kr Xe
25 50 75 100 25 50 75 100
Ci []
00
02
10
39
68
98
132
145
Sed
imen
t age
[kyr
]
the sampling ports (black dots) Remaining panels measured noble
tions in the overlying water Ci) plotted against sediment depth and
ater Note that the error bars of the measurements would be smaller
MS Brennwald et al Earth and Planetary Science Letters 235 (2005) 31ndash4434
analysis [22] from the sediment liner of this gravity
core No gas bubbles were observed in the gravity
core during the first few minutes after recovery when
the overlying water was sampled
Sediment samples for noble gas analysis were
prepared immediately after recovery of the sediment
cores to minimize exsolution of supersaturated CH4 in
the cores Bulk sediment was transferred from the
sediment cores into the sample containers (Cu tubes)
without exposure to the atmosphere or other gas
reservoirs [1] The noble gases were then extracted
from the pore water by degassing the sediment in an
evacuated extraction vessel [1] The noble gas
abundance was then analyzed by mass spectrometry
with an overall 1r uncertainty of ~ 2 in the
concentrations and ~ 01 in the isotope ratios
following the experimental procedures described in
[1] and [22]
Samples were collected at sediment depths of 050
m 111 m 396 m 496 m 656 m and 686 m (Fig
3) Inspection of the cores after sampling indicated
that the uncertainty in the sampling depth due to
squeezing is about 5 cm Excessive gas exsolution
prevented reliable sediment sampling between 15 and
35 m sediment depth Replicate samples were
Table 1
Noble gas concentrations and isotope ratios measured in the sediment por
above the sediment surface
z (m) Concentrations
(cmSTP3 g)
Ne108 Ar104 Kr108
Sediment pore water
05 0301 121 418
111 0474 197 646
396 123 290 782
396 0988 290 804
496 142 343 917
496 117 324 867
656 162 348 859
656 153 341 836
686 170 360 885
686 169 368 911
Overlying water
ndash 182 390 960
ndash 186 392 963
The analytical errors are b 2 for the concentrations and b 01 for the iso
depth where the errors in the 20Ne22Ne ratios are larger (04 and
spectrometric analysis were affected by the low Ne abundance in these sa
collected from each sampling depth except at 050
m and 111 m where only one sample could be taken
before the formation of gas bubbles prevented further
reliable sediment sampling
During noble gas analysis radiogenic He can be
released from the sediment grains as a result of the
heating of the sample during gas extraction [1] To
assess the amount of He released from the sediment
grains a stepwise heating experiment as described in
[1] was carried out for two sediment samples (one
from the clayey sediment and one from the facies rich
in organic matter) This showed that the He concen-
trations measured in Soppensee may exceed the actual
He concentrations in the pore water by up to 20
Because it is impossible to quantify reliably the
contribution of the He released from the sediment
grains to the total He measured the He data will not
be discussed further
3 Results and discussion
Fig 3 shows the noble gas concentration profiles
measured in the sediment pore water and in the
overlying lake water (see also Table 1) The noble gas
e water at sediment depth z and in the overlying water immediately
Isotope ratios
Xe108 20Ne22Ne 36Ar40Ar103
0878 989 3398
126 982 3387
131 982 3382
134 976 3378
145 978 3382
144 978 3382
131 981 3388
132 978 3382
137 976 3382
141 977 3382
146 979 3383
144 979 3374
tope ratios (relative 1r errors) except at 05 m and 111 m sediment
025 respectively) because the counting statistics of the mass-
mples
MS Brennwald et al Earth and Planetary Science Letters 235 (2005) 31ndash44 35
concentrations are undersaturated relative to the
atmospheric equilibrium concentrations computed
from the temperature of the overlying water In the
sediment this undersaturation is greatest just below
the sediment surface and decreases with increasing
sediment depth In the overlying water the noble gas
concentrations are also depleted (confirming previous
observations [23]) but to a much lesser extent than in
the sediment pore water This is due to noble gas
stripping by the gas bubbles rising through the water
body
The observed noble gas depletion decreases with
increasing atomic mass and hence with gas solubility
Such a depletion pattern is indicative of the loss of
dissolved noble gases to a gas or oil phase which was
initially free of noble gases [11124] Given the high
rate of CH4 production in the Soppensee sediment the
depletion pattern can be attributed to degassing into
gas bubbles which form in the sediment due to CH4
supersaturation
It may be expected that part of the observed noble
gas depletion arose during sediment sampling
because gas bubbles formed in the sediment after
recovery of the sediment cores The replicate samples
taken at 4 m and 5 m sediment depth show slightly
different Ne concentrations whereby the samples
which were taken first show a smaller depletion than
the subsequent samples This might be interpreted as
an indication that during sampling part of the
dissolved Ne was stripped into gas bubbles which
were not captured in the sediment sample However
the measured concentrations of the heavier noble
gases do not support this interpretation as the Ar Kr
and Xe concentrations of the replicate samples agree
within the analytical uncertainty The discrepancy of
the Ne replicates at 4 m and 5 m sediment depth
therefore seems to be due to an unknown artifact other
than degassing during sampling This is supported by
the fact that the noble gases are undersaturated even in
the overlying water [23] which shows a residence
time of about 1 yr as estimated from 3H3He data from
the deep water Also the 20Ne22Ne and 36Ar40Ar
isotope ratios in the pore water indicate that gas
exchange has attained steady state (see Section 31)
which is expected to occur within several hours
[2526] whereas the noble gas samples were collected
from the sediment core within a few minutes after
recovery It is therefore concluded that the noble gases
were not stripped from the water during sampling but
rather by gas bubbles which formed in the sediment
prior to sampling
31 Transfer of noble gases from the pore water into
CH4 bubbles
The transfer of dissolved noble gases into gas
bubbles forming in the sediment occurs by diffusion
through the gaswater interface between the gas
bubble and the pore water until the gas bubble
escapes from the sediment or until solubility equili-
brium is attained
If the gas bubbles escape from the sediment
before solubility equilibrium is approached the
noble gas abundance in the pore water will show
an isotopic fractionation corresponding to the extent
of degassing [1127] the lighter isotopes are more
mobile and are therefore removed from the pore
water more easily which results in a relative
enrichment of the heavier isotopes in the pore water
During the initial phase of the noble gas partitioning
between the bubbles and the pore water ie as long
as the gas exchange process is far from steady state
the noble gas concentrations in the bubble are much
smaller than the equilibrium concentrations Then
the loss of a species i from the pore water into the
gas bubble is controlled by its diffusion through the
gaswater interface The concentration decrease dCi
during a time interval dt is approximately propor-
tional to DiCidt [2829] where Di is the diffusivity
and Ci is the concentration of species i in the pore
water (see Table 2 for the notation used here) The
ratio of the concentration changes of two species i
and j is therefore given by
dCi
dCj
frac14 DiCi
DjCj
The solution of this differential equation is given
by the Rayleigh equation [28]
Ci
Cj
frac14 Ci0
Cj0
Cj
Cj0
DiDj1
where the subscript 0 denotes the initial state before
degassing With RijuCiCj the ratio of the concen-
trations of two species i and j in the pore water
fjuCjCj0 the fraction of species j remaining in the
Table 2
List of symbols
Symbol Description Dimension
t Time [T]
z Sediment depth positive down-
wards z =0 at the sediment surface
[L]
BBt Time derivative for z = const
(Eulerian derivative) Note that this
is generally not equal to the time
derivative in a fixed sediment layer
eg in the layer deposited in the
year 1950 (Lagrangian derivative)
Ci Concentration of species i in the
pore water (STP-volume of dis-
solved gas per unit mass of pore
water)
[L3M]
Rij Concentration ratio of two species i
and j in the pore water
[ndash]
Di0 Molecular diffusivity of solute i in
bulk water
[L2T]
Di Effective diffusivity of solute i in
the pore water
[L2T]
a ij Fractionation parameter [ndash]
Porosity (fraction of pore volume
per unit volume of bulk sediment)
[ndash]
a Tortuosity parameter of the sedi-
ment pore space
[ndash]
ri Production rate of species i per unit
volume of pore water
[NTL3]
U Burial velocity of pore water rela-
tive to the sediment surface
[LT]
x Burial velocity of solid sediment
relative to the sediment surface
[LT]
B STP bubble volume per unit mass
of pore water (dry gas)
[L3M]
Hi Henry coefficient of species i [(MLT2)(L3M)]
MS Brennwald et al Earth and Planetary Science Letters 235 (2005) 31ndash4436
pore water and aijuDiDj1 the bfractionationparameterQ the Rayleigh equation reads
Rij frac14 Rij0 faijj eth1THORN
To compare the concentration ratio of species i and
j (Rij) with that of two other species k and l (Rkl) one
can write
fj
flfrac14 Cj=Cj0
Cl=Cl0frac14 Rjl
Rjl0frac14zeth1THORN
fajll
Thus fj = fajl +1l Combining this with Eq (1) allows
Rij and Rkl to be expressed simultaneously as
functions of fl
Rij frac14 Rij0 fajlaijthornaijl and Rkl frac14 Rkl0 f
akll eth2THORN
Fig 4 compares the measured 20Ne22Ne and36Ar40Ar ratios with the Rayleigh fractionation
expected from Eq (2) where i =20Ne j =22Ne
k =36Ar l =40Ar and f40Ar ranges from 30 (max
observed 40Ar depletion) to 100 (no depletion)
The fractionation parameters were calculated by
assuming that the ratios of the noble gas isotope
diffusivities in the sediment are the same as the
respective ratios of the molecular diffusivities in bulk
water (Table 3)
The predicted Rayleigh fractionation corresponds
to changes in the isotope ratios of up to 9
(20Ne22Ne) and 7 (36Ar40Ar) In contrast the
measured isotope ratios correspond to the atmospheric
equilibrium ratios within the analytical uncertainties
of 02 (20Ne22Ne) and 01 (36Ar40Ar)
The noble gas partitioning between the pore water
and the gas bubbles is therefore not controlled by
diffusion On the contrary the noble gas depletion
rather reflects a solubility equilibrium between pore
water and gas bubbles This is in line with the
expectation that equilibrium between pore water and
gas bubble is attained within a few hours [2526]
whereas bubble growth in the sediment occurs on a
time scale of several days or weeks [3031]
32 Vertical noble gas transport in the sediment
pore space
The vertical transport of noble gases within the
pore space may be controlled either by vertical
diffusion (such as in Lake Zug [32]) or by pore-water
advection relative to the sediment surface (such as in
Lake Issyk-Kul [2]) This leads to the two following
hypotheses to explain the noble gas concentration
profiles observed in Soppensee
Hypothesis A (Diffusion hypothesis) The vertical
transport of noble gases is controlled by vertical
diffusion The existence of vertical concentration
gradients therefore implies that noble gas profiles
reflect a dynamic state This leads to the following
interpretation (see also Fig 5) ebullition was (vir-
tually) absent before it abruptly set in during recent
decades or centuries Before the onset of ebullition
the noble gas concentrations in the pore water were
the same as those in the overlying water The noble
gas depletion observed in the sediment which was
31 32 33 34
88
9
92
94
96
98
10
36Ar 40Ar [10-3 ]
20N
e 22
Ne
337 338 339
975
98
985
36Ar 40Ar [10-3 ]
20N
e 22
Ne
Max observed 40Ar depletion
No depletion
Fig 4 20Ne22Ne vs 36Ar40Ar Left panel comparison of the Rayleigh fractionation line with the measured isotope ratios The solid line
reflects the isotopic signature expected from the Rayleigh Eq (2) The line spans the fractionation range expected from the observed 40Ar
depletion Right panel magnification of the measured data in the pore water (circles) and the overlying water (squares) The star represents the
isotope ratios of air-equilibrated water [22] The error bars illustrate the analytical 1r uncertainty
MS Brennwald et al Earth and Planetary Science Letters 235 (2005) 31ndash44 37
deposited before the onset of ebullition is due to the
vertical rearrangement of the noble gas deficit by
vertical diffusion
Hypothesis B (Advection hypothesis) The vertical
noble gas transport is controlled by pore-water
advection due to sediment accumulation and compac-
tion In contrast to Hypothesis A this implies that
ebullition occurred throughout the entire Holocene
and increased gradually with time The noble gas
depletion resulting from degassing is archived in the
sediment by the continuous pore-water burial
These two complementary hypotheses are dis-
cussed using the advectionndashdiffusion model for the
vertical transport of solutes in sediment pore water
described in [32ndash34] For a steady-state porosity
Table 3
Molecular diffusivities of 20Ne 22Ne 36Ar and 40Ar in water at
55 8C (Di0 in 109 m2s) and the corresponding fractionation
factors a ij =Di0Dj
01 used in Eq (2)
i D0i ai 22Ne a i 40Ar
20Ne 2657 0049 ndash22Ne 2534 ndash 051936Ar 1758 ndash 005440Ar 1668 ndash ndash
The molecular diffusivities were calculated from empirical diffu-
sivity measurements [35] whereby the molecular diffusivities were
assumed to be inversely proportional to the square root of the
atomic mass
profile ie BBt=0 the vertical transport is charac-
terized by
zeth THORN BCi zteth THORNBt
frac14 B
Bz zeth THORNDi zeth THORN BCi zteth THORN
Bz
zeth THORNU zteth THORN BCi zteth THORNBz
thorn zeth THORNri zteth THORN eth3THORN
If it is assumed that a depth z exists below which
compaction is absent and if pore-water advection
relative to the sediment matrix is assumed to be zero
below zT then the burial velocities of the pore water
and the solid sediment are given by
U zteth THORN frac14ethzTHORN x teth THORN and x zteth THORN frac14
1 1 zeth THORN x teth THORN
eth4THORN
where T and xT are the porosity and the burial
velocity respectively of the sediment at depth zT
If vertical diffusion is the dominant transport
process (Hypothesis A) the loss of dissolved noble
gases from the bebullition zoneQ (the vertical range ofsediment from where gas bubbles are released) results
in a diffusive flux of noble gases both from the deeper
sediment and the overlying water into the ebullition
zone Fig 5 illustrates the relevant transport processes
and the temporal evolution of the resulting noble gas
profiles
Table 4
Henry coefficients Hi for Ne Ar Kr and Xe in freshwater at a
temperature of 55 8C in bar(cmSTP3 g) (STP=standard temperature
and pressure)
i Ne Ar Kr Xe
Hi 872 220 111 568
water
sediment ebullition zone
turbulent diffusion ebullition
molecular diffusion t3 gt t2 gt t1
Ci
Ci0
z
z=0z0
Fig 5 Illustration of the situation corresponding to Hypothesis A (bDiffusion hypothesisQ) Left diagram of the relevant transport processes
determining the vertical noble gas concentration profiles in the sediment pore water Right concentration profiles Ci(z) in the sediment
resulting from an abrupt onset of ebullition in the bebullition zoneQ between z =0 and z = z0 (at times t1 t2 and t3 after the onset of
ebullition)
MS Brennwald et al Earth and Planetary Science Letters 235 (2005) 31ndash4438
For the upper boundary condition needed to solve
Eq (3) the concentrations in the overlying water were
assumed to correspond to the atmospheric equilibrium
concentrations in the overlying water which were
considered to be constant over time The small
degassing depletion of the overlying water was
neglected For the lower boundary condition the
underlying bedrock was assumed to present an
impermeable boundary at the bottom of the sediment
column For the initial condition (ie for the state
prevailing before the onset of ebullition) the noble
gas concentrations in the pore water were assumed to
correspond to the atmospheric equilibrium concen-
trations in the overlying water
After the onset of ebullition (at time t0) the rate of
bubble production per unit volume of pore water was
assumed to be time-independent and to be constant
throughout the entire ebullition zone ie in the
sediment between z =0 and z= z0 It was further
assumed that bubbles are formed only in the sediment
accumulating after the onset of ebullition Thus if x0
is the sediment accumulation rate z0(tz t0) =
x0 d (t t0) where x0=5 mmyr was estimated from
the chronology of the sediment deposited during the
last two centuries (Fig 2)
If the gas bubbles escape continuously from the
sediment (after noble gas equilibration with the pore
water) the loss of noble gas i from the pore water
per unit time and pore-water volume (ndashri in Eq
(3)) depends on the gas production rate per unit
volume of pore water (rb) and on the partial pressure
of noble gas i in the bubble Pi =HiCi where Hi is the
respective Henry coefficient at the temperature of the
pore water (55 8C Table 4) If Pb is the total gas
pressure in the bubbles and with kbu rbPb it follows
that
ri zteth THORNfrac14 Pi
Pbrbfrac14 HiCi
Pbrbfrac14kbHiCi for 0VzVz0 teth THORN
0 for zNz0 teth THORN
eth5THORNThe porosity profile shown in Fig 2 seems not to
reflect a steady state (ie BBt p 0) because the
porosity does not decrease steadily with depth and the
lithology of the sediment indicates several changes in
the sedimentary regime of the lake Under the
assumption that the vertical transport is controlled
by vertical diffusion (Hypothesis A) however the
non-stationarity in the pore-water advection relative to
the sediment matrix due to sediment compaction can
be neglected Constant values of U =x0 and =085
(typical for the uppermost 6 m of the sediment) were
therefore used to solve Eq (3) The effective noble
gas diffusivities in the pore space were calculated
from their molecular diffusivities in bulk water [35] at
the mean deep-water temperature (55 8C) and the
following tortuosity relation [36]
Di zeth THORN frac14 D0i
1thorn a 1 zeth THORNeth THORN
Practically the noble gas concentration profiles were
calculated by the numerical integration of Eq (3) [32]
-2 0 2 4
0
2
4
6
z [m
]
δNe
[]-2 0 2 4
δAr
[]
Fig 7 Comparison of the measured 20Ne22Ne and 36Ar40Ar
profiles with the modeled profiles corresponding to Hypothesis A
The d i are the relative deviations of the isotope ratios measured in
the pore water (Ri) from those of air-saturated water (Ri [22])
di =RiRi1
MS Brennwald et al Earth and Planetary Science Letters 235 (2005) 31ndash44 39
The unknown values of the parameters t0 kb and a
were determined by least-squares regression of the
modeled noble gas profiles on the measured noble gas
concentrations (t0c1800 AD kb=12 d 102 cmSTP
3
gbaryr ac103)
Fig 6 shows that the modeled concentration
profiles roughly agree with the measured profiles
although discrepancies are evident for the heavier
noble gases However using the same model to
calculate the concentration profiles of 20Ne 22Ne36Ar and 40Ar reveals that vertical noble gas diffusion
from the deep sediment into the ebullition zone would
strongly affect the 20Ne22Ne and 36Ar40Ar ratios
(Fig 7) because the lighter isotopes diffuse faster
than the heavier ones (see also Table 3) However the
measured profiles of the isotope ratios do not show
such an isotopic fractionation (Fig 7) This indicates
that the diffusive transport of dissolved noble gases
from the deep sediment into the ebullition zone is
insignificant Thus although the modeled profiles of
the element concentrations are (coincidentally) con-
sistent with the measured concentrations the diffusion
Hypothesis A must be rejected based on the isotope
ratio measurements It is therefore concluded that the
noble gas depletion at a given sediment depth reflects
the bubble production at the time when the pore water
at this depth was deposited (Hypothesis B)
0
2
4
6
z [m
]
0
2
4
6
z [m
]
Ne Ar
0 25 50 75 100
Kr
0 25 50 75 100
Xe
Ci Ci [] Ci Ci []
Fig 6 Comparison of the measured noble gas profiles with the
modeled profiles corresponding to Hypothesis A (bDiffusionhypothesisQ) The noble gas concentrations Ci are normalized to the
atmospheric equilibrium concentrations Ci in the overlying water
It should be noted however that compaction of the
bulk sediment causes a decrease in the pore-space
volume which results in an upward offset of the pore
water relative to the solid sediment [32ndash34] The pore
water at a given sediment depth can therefore be older
than the sediment matrix at the same depth In the
deep sediment ie below the compaction zone this
age difference can extend up to a few centuries [32]
To calculate the age difference reliably the sediment
porosity and the burial velocities of the pore water and
the solid sediment would have to be known as
functions of sediment depth and time throughout the
entire history of the lake However as this information
is not available for Soppensee we refrain from
attempting to calculate the exact pore-water offset
with respect to the solid sediment
33 Quantification of the gas loss from the sediment
by ebullition
As shown in Section 31 noble gas depletion in the
pore water can be modeled as the result of gas
equilibration between pore water and gas bubbles
The concentration Ci in the pore water after equili-
bration with a gas bubble is given by the initial
concentration in the water (ie the atmospheric
equilibrium concentration Ci) the STP volume of
dry gas per unit mass of pore water in the equilibrated
gas bubble (B) and the Henry coefficient Hi of noble
gas i (Table 4) As shown in [1] Ci can be computed
by the d1-step degassing modelT
Ci frac14Ci4
1thorn Bgii frac14 Ne Ar Kr Xe eth6THORN
MS Brennwald et al Earth and Planetary Science Letters 235 (2005) 31ndash4440
where gi =HiP0 with the STP dry-gas pressure
P0=101325 bar1
In the case of repeated gas bubble formation and
noble gas equilibration the noble gas concentrations
in the pore water will follow a series of degassing
steps If B reflects the total amount of gas produced
after n such steps the mean STP volume of dry gas
per unit mass of pore water in each step is Bn If all
gas bubbles can be assumed to be of similar size Eq
(6) can be applied iteratively to yield the dcontinuousdegassing modelT for nYl
Ci frac14Ci4
1thorn Bngi
n YnYleBgiCi
4 ifrac14Ne AR Kr Xe
eth7THORN
where the limit nYl reflects a degassing series
consisting of an infinite number of consecutive
equilibration steps involving infinitesimally small
bubbles
The choice of which degassing model is to be
used for the interpretation of the noble gas depletion
depends on the mechanisms controlling bubble
growth in the sediment Bubbles were found to
grow on time scales of several weeks and bubble
sizes of up to a few centimeters in diameter have
been reported [3ndash5] The growth of isolated bubbles
in the sediment was modeled in [30] Due to the
inhomogeneous distribution of CH4 sources (organic
matter) in the sediment the bubbles were assumed to
be separated by distances much larger than their
diameter Also the bubbles were assumed to be
spherical which led to the interpretation that the
observed bubble growth times of several weeks are
due to the limitation of bubble growth by diffusive
transport of the dissolved CH4 from its source to the
bubble [30] However it was found later that
bubbles grow by fracturing the sediment which
results in flat disc-shaped bubbles [37] The surface-
area to volume ratio of such bubbles is much larger
than that of spherical bubbles The diffusion limit is
therefore much smaller for the growth of disc-shaped
bubbles than for the growth of spherical bubbles
1 Note that in [1] Eq (6) is written with the term ziCi in place of
g i (where zi is the volume fraction of gas i in dry air) This is
consistent with the notation chosen here because ziCi=HiP0=g i
according to Henryrsquos Law
[31] Thus bubble growth is not limited by CH4
diffusion but by the mechanical resistance of the
sediment [3137]
Consequently the available literature indicates that
noble gas equilibration occurs with relatively large
but few bubbles (and that bubbles grow slowly
enough for the noble gases to attain solubility
equilibrium) This tends to support the 1-step degass-
ing model rather than the continuous degassing
model However both models reflect extreme cases
of either a single degassing step or an infinite series of
degassing steps Note that in Section 32 the bubbles
were assumed to be continuously removed from the
sediment (continuous degassing model) which seems
inconsistent with the current discussion However the
choice of degassing model is irrelevant for the
conclusion reached in Section 32 because the argu-
ment needed to reject the diffusion hypothesis is that
the noble gas partitioning between the pore water and
the bubbles is controlled by Henryrsquos Law which
results in virtually no isotopic fractionation The
continuous degassing model was used in Section 32
because the current implementation of the computer
program used can only handle source terms ri of
zeroth or first order in Ci
Fig 8 compares the ratios of the measured noble
gas concentrations with those predicted by the two
degassing models In agreement with the above
discussion the 1-step degassing model fits the
measured data better than the continuous degassing
model In general the model curves of the 1-step
degassing model match the trends of the measured
data However a systematic offset between the model
curves and the measured data is apparent suggesting
that the noble gas concentrations are affected by an as
yet unknown process which is not accounted for by
either of the two degassing models However the
offset is smaller for the 1-step degassing model than
for the continuous degassing model
To quantify the amount of gaseous CH4 that was
released from the sediment the 1-step degassing
model was therefore used to estimate the degassing
parameter B by least-squares regression from the
measured Ne Ar Kr and Xe concentrations (Fig 9)
The atmospheric equilibration temperature was
assumed to be the same for all pore water samples
The value used for this was the present annual mean
temperature of the overlying water (55 8C) Because
5
1-stepdegassing
model
0degC5degC
10degC
continuousdegassing
model
6 7
1
15
2
25
3
KrXe
Ar
Xe
[104 ]
5 6 7
4
6
8
10
12
14
16
KrXe
Ne
Xe
15 2 25 3
4
6
8
10
12
14
16
ArXe [104]
Ne
Xe
25 3 35 405
1
15
2
ArKr [103]
Ne
Kr
Fig 8 Three-element plots of Ne Ar Kr and Xe The grey lines illustrate the various element ratios in air-saturated water at temperatures
ranging from 0 8C to 10 8C The black lines reflect the element ratios predicted by the 1-step degassing and continuous degassing models The
error bars illustrate the analytical 1r uncertainty
MS Brennwald et al Earth and Planetary Science Letters 235 (2005) 31ndash44 41
temperature mostly affects the concentrations of the
heavier noble gases which are least sensitive to
degassing the estimate of B is insensitive to the
temperature prevailing during gas equilibration with
0 20 40 60 80 100
0
2
4
6Sed
imen
t dep
th [m
]
B [10-3 cmSTPg]3
overlying water
Fig 9 Degassing parameter B estimated from measured Ne Ar Kr
and Xe concentrations using the 1-step degassing model The error
bars correspond to the differences between the measured noble gas
concentrations and the concentrations predicted by the 1-step
degassing model with the best-fit values of B
the atmosphere Sensitivity tests showed that the
estimates of B remain within the estimated uncertainty
(Fig 9) for temperatures between 4 8C and 7 8C atemperature range which is not expected to be
exceeded in the deep water of Soppensee
The number of bubbles produced per unit mass of
pore water is given by N =(P0B)(PbVb) where Vb is
the mean bubble volume and Pb is the pressure in the
gas bubbles which is assumed to correspond approx-
imately to the total ambient pressure in the sediment
Ptot (the pressure caused by the tension of the curved
bubble surface is neglected) Ptot is given by the sum
of the atmospheric pressure at the lake surface (~ 1
bar) and the hydrostatic pressure of the water column
(~ 27 bar at the sampling site) Hence Pbc37 bar
The volume of a typical bubble in the sediment
roughly corresponds to that of a spherical bubble with
a radius of 5 mm [31] thus Vbc05 cm3 With
BV (8F1)102 cmSTP3 g (Fig 9) these values yield
N N (44F5) bubbles per kilogram of water This
indicates that only few bubbles are involved in the
MS Brennwald et al Earth and Planetary Science Letters 235 (2005) 31ndash4442
degassing process which conforms to the 1-step
degassing model
Gas bubbles can form in the sediment only if the
sum of the partial pressures Pi of all dissolved gases
exceeds the total ambient pressure in the sediment
ie ifP
i PiNPtot To estimate roughly the CH4
concentration which must be exceeded to trigger
bubble formation dissolved gases other than CH4
and O2 (which is consumed in the sediment) are
assumed to be conservative and to be mainly of
atmospheric origin Their partial pressures Pi there-
fore correspond to their partial pressures in the
atmosphere With PO2=0 the sum of the partial
pressures of the atmospheric gases ie the gases other
than CH4 isP
i pCH4Pic08 bar The partial pressure
of CH4 which must be exceeded to trigger bubble
formation is therefore PCH4frac14 Ptot
Pi p CH4
Pic29bar At 55 8C (the mean deep-water temperature) this
corresponds to a CH4 saturation concentration of 014
cmSTP3 g [38] which corresponds to about twice the
maximum value of B This means that the amount of
CH4 released from the sediment by ebullition is of a
similar magnitude to that which can be stored in the
sediment pore water
4 Conclusions
The noble gas concentrations in the pore water of
the Soppensee sediment show a pronounced depletion
pattern which reflects the gas loss by ebullition The20Ne22Ne and 36Ar40Ar ratios in the pore water
indicate that the noble gas depletion is not controlled
by the kinetics of diffusion through the gaswater
interface but rather reflects a solubility equilibrium
between pore water and gas bubbles The isotope
ratios further indicate that the vertical diffusion of
dissolved noble gases is insignificant The noble gas
profiles therefore correspond to the stratigraphy of the
sediment which allows a time scale to be associated
with the noble gas record While the mechanisms
responsible for the strong restriction of vertical
diffusion remain unknown this study supports the
speculation made in an earlier study [2] that vertical
diffusion in the pore water may be strongly restricted
in undisturbed and fine-grained sediments with low
permeability and anisotropic pore space such as the
Soppensee sediment
The uniform increase in the depletion of noble
gases from the deep sediment towards the sediment
surface indicates that ebullition in Soppensee
increased gradually throughout the entire Holocene
This is in line with the increase in the degree of
eutrophication of Soppensee that occurred during the
Holocene [1819] because the CH4 production rate in
the sediment increases with decreasing oxygen avail-
ability in the deep water and hence with increasing
eutrophication
In the recent sediment where noble gas depletion
is greatest the volume of CH4 released per unit
mass of pore water reaches values as high as
(8F1)102 cmSTP3 g which corresponds to about
60 of the maximum amount of CH4 that can be
dissolved in the pore water This indicates that the
amount of CH4 produced in the sediment signifi-
cantly exceeds the maximum amount of CH4 that
can be stored in the sediment and confirms that
ebullition does indeed play an important role in the
transport of CH4 from the sediment into the over-
lying water
Our study indicates that dissolved noble gases and
their isotopes can be employed as sensitive tracers to
study the formation of gas bubbles in sediments (and
possibly other aquatic environments) the dynamics of
gas partitioning between the bubbles and the sur-
rounding water and the gas fluxes associated with the
emission of these bubbles from the sediment The
analysis of noble gases dissolved in sediment pore
water thus has great potential as a method of
quantifying and reconstructing both the amount of
gas produced in lacustrine and marine sediments and
the associated gas fluxes that have pertained since the
sediment was deposited However because this
method is not yet fully established further studies
need to be conducted to assess its broader potential to
characterize the formation and release of gases not
only from lake sediments but also from other similar
environments such as oceanic sediments (eg at gas
vents) and aquifers
Acknowledgements
Thanks are due to M Hofer T Kulbe and F
Peeters for their assistance in the field and to K
Strassmann for valuable discussions on the ideas
MS Brennwald et al Earth and Planetary Science Letters 235 (2005) 31ndash44 43
presented in this work Further we thank D M
Livingstone and the two reviewers M C Castro and
G Winckler for their helpful comments and editing
assistance This research was made possible by
funding from the Swiss National Science Foundation
(SNF 2000-068191) EAWAG and ETH Zqrich
References
[1] MS Brennwald M Hofer F Peeters W Aeschbach-Hertig
K Strassmann R Kipfer DM Imboden Analysis of
dissolved noble gases in the pore water of lacustrine sedi-
ments Limnol Oceanogr Methods 1 (2003) 51ndash62
[2] MS Brennwald F Peeters DM Imboden S Giralt M
Hofer DM Livingstone S Klump K Strassmann R Kipfer
Atmospheric noble gases in lake sediment pore water as
proxies for environmental change Geophys Res Lett 31
(2004) L04202 doi1010292003GL019153
[3] RF Strayer JM Tiedje In situ methane production in a
small hypereutrophic hard-water lake loss of methane from
sediments by vertical diffusion and ebullition Limnol Ocean-
ogr 23 (1978) 1201ndash1206
[4] CS Martens JV Klump Biogeochemical cycling in an
organic-rich coastal marine basin 1 Methane sediment-water
exchange processes Geochim Cosmochim Acta 44 (1980)
471ndash490 doi1010160016-7037(80)90045-9
[5] JP Chanton CS Martens CA Kelley Gas-transport from
methane-saturated tidal fresh-water and wetland sediments
Limnol Oceanogr 34 (1989) 807ndash819
[6] I Ostrovsky Methane bubbles in Lake Kinneret quantifica-
tion and temporal and spatial heterogeneity Limnol Ocean-
ogr 48 (2003) 1030ndash1036
[7] G Winckler R Kipfer W Aeschbach-Hertig R Botz M
Schmidt S Schuler R Bayer Sub sea floor boiling of Red
Sea brines new indication from noble gas data Geochim
Cosmochim Acta 64 (2000) 1567ndash1575 doi101016S0016-
7037(99)00441-X
[8] CP Holzner S Klump H Amaral MS Brennwald R
Kipfer Using noble gases to study methane release from high-
intensity seeps in the Black Sea European Geosciences Union
1st General Assembly Geophysical Research Abstracts vol 6
Nice France 2004 p 01595
[9] CP Holzner H Amaral MS Brennwald S Klump R
Kipfer Assessment of methane emission from bubble plumes
in the Black Sea by noble gases Abstracts of the 14th Annual
VM Goldschmidt Conference 2004 Geochim Cosmochim
Acta vol 68 Elsevier Copenhagen Denmark 2004 p A323
[10] JM Thomas GB Hudson M Stute JF Clark Noble gas
loss may indicate groundwater flow across flow barriers in
southern Nevada Environ Geol 43 (2003) 568ndash579
doi101007s00254-002-0681-1
[11] CJ Ballentine R Burgess B Marty Tracing fluid origin
transport and interaction in the crust in D Porcelli CJ
Ballentine R Wieler (Eds) Noble Gases in Cosmochemistry
and Geochemistry Rev Mineral Geochem vol 47 Mi-
neralogical Society of America Geochemical Society 2002
pp 539ndash614
[12] AF Lotter Evidence of annual layering in Holocene sediments
of Soppensee Switzerland Aquat Sci 51 (1989) 19ndash30
[13] AF Lotter How long was the Younger Dryas Preliminary
evidence from annually laminated sediments of Soppensee
(Switzerland) Hydrobiologia 214 (1991) 53ndash57
[14] I Hajdas SD Ivy J Beer G Bonani D Imboden AF
Lotter M Sturm M Suter AMS radiocarbon dating and
varve chronology of Lake Soppensee 6000 to 12000 14C
years BP Clim Dyn 9 (1993) 107ndash116
[15] I Hajdas G Bonani B Zolitschka Radiocarbon dating of
varve chronologies Soppensee and Holzmaar Lakes after ten
years Radiocarbon 42 (2000) 349ndash353
[16] W Tinner AF Lotter Central European vegetation response
to abrupt climate change at 82 ka Geology 29 (2001) 551ndash554
doi1011300091-7613(2001)029b0551CEVRTAN20CO2
[17] DM Livingstone I Hajdas Climatically relevant periodicities
in the thicknesses of biogenic carbonate varves in Soppensee
Switzerland (9740ndash6870 calendar yr BP) J Paleolimnol 25
(2001) 17ndash24 doi101023A1008131815116
[18] W Hofmann Late-GlacialHolocene succession of the chiro-
nomid and cladoceran fauna of the Soppensee (Central Switzer-
land) J Paleolimnol 25 (2001) 411ndash420 doi101023
A1011103820283
[19] AF Lotter The palaeolimnology of Soppensee (Central
Switzerland) as evidenced by diatom pollen and fossil-
pigment analyses J Paleolimnol 25 (2001) 65 ndash 79
doi101023A1008140122230
[20] N Gruber B Wehrli A Wuest The role of biogeochemical
cycling for the formation and preservation of varved
sediments in Soppensee (Switzerland) J Paleolimnol 24
(2000) 277ndash291
[21] M Melles M Kulbe PP Overduin S Verkulich Reports on
polar research Technical Report 148 Alfred-Wegner-Institut
fqr Polar- und Meeresforschung Germany 1994
[22] U Beyerle W Aeschbach-Hertig DM Imboden H Baur T
Graf R Kipfer A mass spectrometric system for the analysis
of noble gases and tritium from water samples Environ Sci
Technol 34 (2000) 2042ndash2050 doi101021es990840h
[23] W Aeschbach-Hertig Helium und Tritium als Tracer fqrphysikalische Prozesse in Seen Diss ETH Nr 10714 ETH
Zqrich 1994 httpe-collectionethbibethzchshowtype=
dissampnr=10714
[24] A Bosch E Mazor Natural gas association with water and
oil as depicted by atmospheric noble gases case studies from
the Southeastern Mediterranean Coastal Plain Earth Planet
Sci Lett 87 (1988) 338ndash346 doi1010160012-821X(88)
90021-0
[25] J Holocher F Peeters W Aeschbach-Hertig M Hofer M
Brennwald W Kinzelbach R Kipfer Experimental inves-
tigations on the formation of excess air in quasi-saturated
porous media Geochim Cosmochim Acta 66 (2002)
4103ndash4117 doi101016S0016-7037(02)00992-4
[26] J Holocher F Peeters W Aeschbach-Hertig W Kinzelbach
R Kipfer Kinetic model of gas bubble dissolution in
MS Brennwald et al Earth and Planetary Science Letters 235 (2005) 31ndash4444
groundwater and its implications for the dissolved gas
composition Environ Sci Technol 37 (2003) 1337ndash1343
doi101021es025712z
[27] K Nagao N Takaoka O Matsabayashi Isotopic anomalies
of rare gases in the Nigorikawa geothermal area Hokkaido
Japan Earth Planet Sci Lett 44 (1979) 82ndash90 doi101016
0012-821X(79)90010-4
[28] JWS Rayleigh Theoretical considerations respecting the
separation of gases by diffusion and similar processes Philos
Mag 42 (1896) 493ndash498
[29] RP Schwarzenbach PM Gschwend DM Imboden Envi-
ronmental Organic Chemistry 2nd edition John Wiley and
Sons New York 2003
[30] BP Boudreau BS Gardiner BD Johnson Rate of growth
of isolated bubbles in sediments with a diagenetic source of
methane Limnol Oceanogr 46 (2001) 616ndash622
[31] BS Gardiner BP Boudreau BD Johnson Growth of disk-
shaped bubbles in sediments Geochim Cosmochim Acta 67
(2003) 1485ndash1494 doi101016S0016-7037(02)01072-4
[32] KM Strassmann MS Brennwald F Peeters R Kipfer
Dissolved noble gases in porewater of lacustrine sediments as
palaeolimnological proxies Geochim Cosmochim Acta 65
(7) (2005) 1665ndash1674 doi101016jgca200407037
[33] RA Berner Diagenetic models of dissolved species in the
interstitial waters of compacting sediments Am J Sci 275
(1975) 88ndash96
[34] DM Imboden Interstitial transport of solutes in non-steady
state accumulating and compacting sediments Earth Planet
Sci Lett 27 (1975) 221ndash228 doi1010160012-821X(75)
90033-3
[35] B J7hne G Heinz W Dietrich Measurement of the diffusion
coefficients of sparingly soluble gases in water J Geophys
Res 92 (1987) 10767ndash10776
[36] N Iversen BB Jbrgensen Diffusion coefficients of sulfate
and methane in marine sediments influence of porosity Geo-
chim Cosmochim Acta 57 (1993) 571ndash578 doi101016
0016-7037(93)90368-7
[37] BD Johnson BP Boudreau BS Gardiner R Maass
Mechanical response of sediments to bubble growth Mar Geol
187 (2002) 347ndash363 doi101016S0025-3227(02)00383-3
[38] DR Lide (Ed) CRC Handbook of Chemistry and Physics
75th edition CRC Press Boca Raton 1994
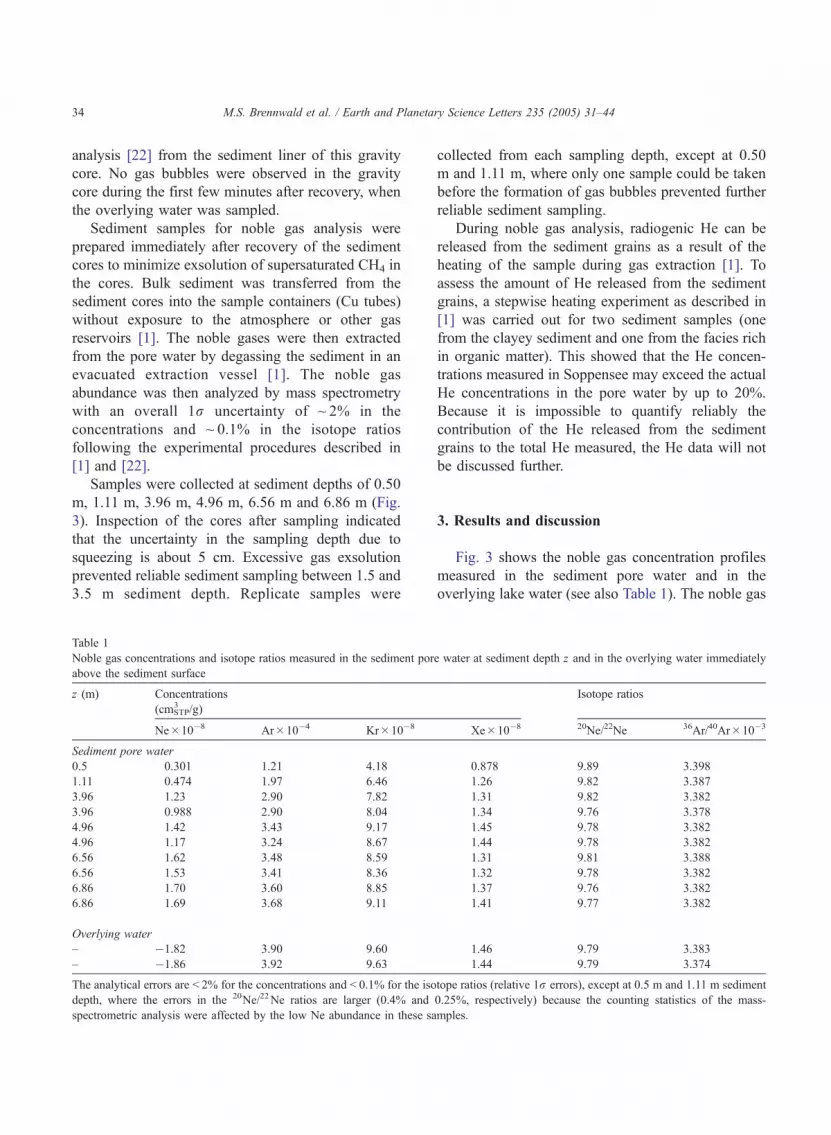