relationships between tacs, fish landings and fishing effort in the north sea
TRANSCRIPT

Not to be cited without prior reference to and permission from the author.
Relationships between TACs, Fish Landings, and Fishing Effort in the North Sea
Simon Greenstreet1, Leonie Robinson1, Ruth Callaway2, Henning Reiss3,
Siegfried Ehrich7, Gerjan Piet4, Johan Craeymeersch4, Ingrid Kröncke3, Helen Fraser1, John Lancaster2, Liz Jorgensen6 and Annelies Goffin5
1: Fisheries Research Services, Marine Laboratory, Aberdeen, Scotland. 2: University, of Wales Swansea, Swansea, Wales. 3: Forschunginstitut Senckenberg, Wilhelmshaven, Germany. 4: The Netherlands Institute for Fisheries Research, Ijmuiden, Netherlands. 5: University of Ghent, Ghent, Belgium. 6: Institute of Marine Research, Tromso, Norway. 7: Institute for Sea Fisheries, Hamburg, Germany
Dr S.P.R. Greenstreet, Fisheries Research Services, Marine Laboratory, PO Box 101, Victoria Road, Aberdeen, AB11 9DB, Scotland
MAFCON S

Not to be quoted without prior reference to the authors © Crown Copyright 2007
Fisheries Research Services Collaborative Report No 06/07 RELATIONSHIPS BETWEEN TACS, FISH LANDINGS AND FISHING EFFORT IN THE NORTH SEA Simon Greenstreet, Leonie Robinson, Ruth Callaway, Henning Reiss, Siegfried Ehrich, Gerjan Piet, Johan Craeymeersch, Ingrid Kröncke, Helen Fraser, John Lancaster, Liz Jorgensen and Annelies Goffin
Fisheries Research Services Marine Laboratory 375 Victoria Road Aberdeen AB11 9DB

SUMMARY In order for management to be proactive, it is necessary to predict the ecological consequences of specific management actions. To date fisheries management has involved catch limitation through the setting of Total Allowable Catches (TACs) for each coming year. However, the ecological consequences of fishing are generally modelled on the basis of variation in fishing effort. To predict the ecological consequences associated with particular sets of TACs therefore requires that the patterns of fishing activity necessary to achieve these TACs be estimated. This requires knowledge of the relationship between landings and fishing effort. Five specific hypotheses relating TACs/quotas, landings and fishing effort were posed and tested in five individual fleet case studies; the English, Scottish, Norwegian, German and Dutch fleets. The hypotheses were: 1. Total Landings of species(i) in year(a) are closely related to TAC/Quota of species
(i) in year(a). 2. Landings of species(i) by gear(x) in year(a) are closely related to effort by gear(x) in
year(a). 3. Effort by gear(x) in year(a) are closely related to TAC/Quota for species(i) in year(a). 4. Landings of species(i) by gear(x) in year (a) from ICES rectangle(ψ) are closely
related to effort by gear(x) in year (a) in ICES rectangle(ψ) (a spatial analysis in each year).
5. Landings of species(i) by gear(x) from ICES rectangle(ψ) in each year(a) are closely
related to effort by gear(x) in ICES rectangle(ψ) in that year (a) (a temporal analysis in each rectangle).
For each of the case study fleets, landings and quotas tended to be closely related for the species that were the major targets of the fleets concerned. Landings of the less important species for any particular country were less closely related to the individual country’s quota. In some cases, quota swapping may have explained these discrepancies. Examination of the relationships between the landings of species taken by particular gears and effort by that gear produced confusing results. Even for the main species targeted by a particular gear by some countries, landings and effort were not always significantly correlated. On many occasions, landings of what might be considered to be a bycatch species in a particular gear were on the other hand positively related with effort by the gear involved, but not always. Consequently, the relationships between quotas and fishing effort for the individual case studies were far from straight forward. In each of the case studies, strong spatial relationships between landings and fishing effort were apparent in each year - that is to say, the more effort was expended in each ICES rectangle, the more landings were reported from the rectangle. Such relationships tended to be strongest for the main target species for each gear/fleet concerned. Temporal relationships (trends between landings and efforts over time) in individual ICES rectangles tended to be strongest where effort was highest, ie in the area where most fishing for a particular species using appropriate gears, and where landings tended to be highest. However, the strength of these temporal correlations was variable across the North Sea for most species and gears. For the whole North Sea, the relationship between TAC and total international landings was very close for five of the six fish species examined. The exception to this was saithe, where both early and late on in the time series examined, landings were substantially below the TACs set. Landings and effort data for seven species (cod, haddock, whiting, saithe, plaice,

sole and Nephrops) and four main fishing gear categories (beam trawl, otter trawl directed at fish, otter trawl directed at Nephrops, and Seine net) for the period 1998 to 2004 were compiled specifically for the MAFCONS project for the same five case study countries. These data were combined and analysed to provide an “international” examination of the remaining four hypotheses. As with the individual case studies, relationships between landings and effort were not consistent, although landings of the main species targeted by particular gears tended to be positively correlated with effort by the gear. Few of the relationships between TAC for each species and effort by the four main gears were positive and statistically significant. There was no indication that variation in TAC influenced variation in fishing effort in any clear and consistent manner. However, spatial variation in landings and effort tended to be strongly correlated in each year and temporal variation in most ICES rectangles also tended to be closely linked. In conclusion, adequately predicting the likely patterns of fishing effort from particular combinations of TAC was not possible. Consequently, determining the likely ecological consequences of particular combinations of TACs would be continue to be problematic, making continued management through catch limitation difficult to reconcile with a proactive ecosystem approach to management.
TABLE OF CONTENTS 1. INTRODUCTION..............................................................................................................1 2. TERMINOLOGY...............................................................................................................1 3. ISSUES ............................................................................................................................2
3.1. The Relationship Between TAC/Quotas and Landings ............................................2 3.2. The Relationship Between Landings and Fishing Effort ...........................................4 3.3. The Relationship Between TAC/Quota and Fishing Effort........................................4
4. DATA................................................................................................................................5 4.1. Problems with Availability and Accuracy of Data......................................................5 4.2. TAC Data Available for the Workshop......................................................................5 4.3. Availability of Landings and Effort Data ....................................................................6
4.3.1. Case Study 1: The UK fleet landing in England................................................6 4.3.2. Case Study 2: The UK fleet landing in Scotland...............................................6 4.3.3. Case Study 3: The Norwegian fleet ................................................................11 4.3.4. Case Study 4: The German fleet ....................................................................11 4.3.5. Case Study 5: The Dutch fleet........................................................................11
4.4. List of Hypotheses ..................................................................................................11 5. RESULTS: CASE STUDIES...........................................................................................12
5.1. Case Study 1: The UK Fleet Landing in England ...................................................12 5.1.1. Relationship between Quotas and Landings ..................................................12 5.1.2. Relationship between annual landings of key species reported for main gear types and effort expended annually by each gear type ..................................................15 5.1.3. Relationship between TAC/Quotas and Fishing Effort ...................................22 5.1.4. Spatial relationships between landings and effort in time...............................25 5.1.5. Temporal relationships between landings and effort in space........................28
5.2. Case Study 2: The UK Fleet Landing in Scotland ..................................................31 5.2.1. Relationships between TAC/Quotas and Landings ........................................31 5.2.2. Relationships between annual landings of key species reported for main gear types and effort expended annually by each gear type. .................................................33 5.2.3. Relationships between TAC/Quotas and Effort ..............................................44 5.2.4. Spatial relationships between landings and effort in time...............................49 5.2.5. Temporal relationships between landings and effort in space........................60
5.3. Case Study 3: The Norwegian Fleet.......................................................................65 5.3.1. Relationships between TAC/Quotas and Landings ........................................65 5.3.2. Relationships between annual landings of key species reported for main gear types and effort expended annually by each gear type. .................................................67 5.3.3. Relationships between TAC/Quotas and Effort ..............................................72 5.3.4. Spatial relationships between landings and effort in time...............................73 5.3.5. Temporal relationships between landings and effort in space........................75
5.4. Case Study 4: The German Fleet ...........................................................................76 5.4.1. Relationships between TAC/Quotas and Landings ........................................76 5.4.2. Relationship between annual landings of key species reported for main gear types and effort expanded annually by each gear type ..................................................83 5.4.3. Relationship between TAC/Quotas and Effort ................................................93 5.4.4. Spatial relationships between landings and effort in time.............................100 5.4.5. Temporal relationships between landings and effort in space......................100
5.5. Case Study 5: The Dutch Fleet ............................................................................103 5.5.1. Relationships between Quotas and landings................................................103 5.5.2. Relationships between annual landings and effort .......................................104 5.5.3. Relationship between TAC and effort ...........................................................109 5.5.4. Spatial relationships between landings and effort in time.............................113 5.5.5. Temporal relationships between landings and effort in space......................115
6. CASE STUDY SUMMARIES AND CONCLUSIONS....................................................116 6.1. UK: English and Scottish Case Studies Combined ..............................................116
6.2. Norway .................................................................................................................118 6.3. Germany...............................................................................................................119 6.4. The Netherlands ...................................................................................................121
7. ANALYSES OF INTERNATIONAL DATA ....................................................................122 7.1. Relationships Between TAC/Quotas and Landings..............................................122
7.1.1. Cod ...............................................................................................................122 7.1.2. Haddock........................................................................................................123 7.1.3. Saithe............................................................................................................125 7.1.4. Whiting..........................................................................................................126 7.1.5. Sole...............................................................................................................128 7.1.6. Plaice ............................................................................................................128
7.2. Assessing validity of MAFCONS partners’ data ...................................................129 7.3. Relationships between international landings and effort (by gear) .......................131 7.4. Relationships Between TACs and Effort...............................................................136 7.5. Spatial relationships between landings and effort in time.....................................141 7.6. Temporal relationships between landings and effort in space..............................144
8. INTERNATIONAL ANALYSES SUMMARY AND CONCLUSIONS .............................149 9. OVERALL CONCLUSIONS..........................................................................................150 10. REFERENCES.............................................................................................................152

Relationships between TACs, Fish Landings and Fishing Effort in the North Sea
1. INTRODUCTION This report documents the work carried out to investigate the relationships between TACs/quotas, catch/landings and fishing effort in North Sea demersal fisheries. Much of this work was done at a workshop that took place at the Senckenberg Institute, Wilhelmshaven, Germany, in February 2004. The purpose of the workshop was to help refine and develop the objectives of work package 6 of the EU funded MAFCONS project, the aim of which was ‘to determine the relationship between landings and the pattern of fishing effort needed to attain these’. This relationship was fundamental to the intended management concept, aimed at quantifying the consequences on groundfish and benthic species diversity associated with particular fisheries management objectives, that both ROAME MF0753 and the MAFCONS project sought to validate (Greenstreet et al 2007a). Attaining such a concept first requires an understanding of the relationship between fish and benthic invertebrate community species diversity and the ecological disturbance caused by fishing (see Greenstreet et al 2007a; 2007b; 2007c)). Secondly, the relationship between fishing activity patterns and the resulting ecological disturbance needs to be elucidated (see Greenstreet 2007c). Finally, in order for the management concept to be proactive, in other words, able to anticipate the likely diversity consequences of a specific set of proposed Total Allowable Catches (TACs), the likely patterns of fishing activity associated with particular suites of single species TACs needs to be predictable. This requires the relationships between landings and fishing effort for each species to be defined. This then was the objective of the workshop and of this report. Currently, Total Allowable Catches (TACs) are the management tool most widely and regularly used to regulate North Sea fisheries. Other forms of fisheries management, such as restriction of effort and establishment of closed areas are now being considered, and are starting to be applied in the regulation of some fleets and in some areas of the North Sea. Whilst TACs continue to be the primary tool for management, the relationship between these and the amount and distribution of effort required to attain particular landings levels must be clearly defined if wider ecosystem objectives are also to be achieved. However, if management does move towards restriction of fishing effort on a fleet by fleet basis, this step in the management protocol will cease to be necessary. Such a step would make an ecosystem approach to management much easier to adopt, and remove an analytical step that would always be likely to be prone to considerable error and imprecision.
2. TERMINOLOGY The use of terminology in this area of fisheries science is extremely vague and inconsistent. Thus as a first step, the workshop decided that there was a need to define a number of key terms that would be used. Concern over the improper use of these terms at an international level has been expressed by a number of the leading scientists that work with these data. • “Catch” = Total amount of fish/invertebrates taken from the sea by a vessel. • “Landings” = That part of the catch of fish/invertebrates that is actually landed at
ports. • “Discards” = That part of the catch that is not landed and is thrown overboard
(discarded) • Thus, “Catch” = “Landings” + “Discards”
1

Relationships between TACs, Fish Landings and Fishing Effort in the North Sea
“Bycatch” is another term often met in the literature. Bycatch is often confused with discards, but this is not the case at all. Fish and invertebrates caught as part of the bycatch are often landed. For example, Nephrops caught in haddock trawling operations may often by landed by the trawler concerned. We therefore define “Bycatch”, as all the biological material taken in the catch that does not consist of the “target” species. Much of the bycatch will be discarded, but some might be landed. Thus the whole situation starts to become somewhat confusing! It becomes even more confusing when target species are discarded. This can occur under several circumstances, either because the individuals caught are undersized, or in an attempt to increase the value of the fish to be landed under circumstances of restricted quotas (ie discarding legal-sized small fish in the hope of catching larger, higher value individuals). Thus a single vessel’s catch on a fishing trip can consist of: • the landed target species (part of the landings), • the landed non-target fish (part of the bycatch and landings), • the discarded target species fish (discards), and • the discarded non-target fish (part of the bycatch that is discarded). The first two categories make up the landings and the last two categories make up the discards: all are part of the catch. If this is so, the management unit, the TAC, short for Total Allowable Catch should actually be the TAL, or Total Allowable Landings, as it is the total amount of each species landed that managers attempt to regulate. Applying the same logic, the term used for the index of fish abundance in the stock assessment literature, Catch per Unit Effort, or CPUE, is in reality, the Landings per Unit Effort (LPUE). However, there are situations where the same term is actually used in its strict sense, referring to actual catches per unit fishing effort, for example with respect to groundfish survey data. Thus, TAC really refers Total Allowable Landings (TAL),while CPUE tends to refer to Landings per Unit Effort (LPUE) under some circumstances and really does refer to Catch per Unit Effort (CPUE) under others. When considering the Norwegian fisheries the situation changes somewhat. Discarding of commercial species is prohibited in Norwegian waters, so here the situation exists where, theoretically, “Landings” and “Catch” should be one and the same. However, discarding of non-commercial species is not prohibited. Exactly what happens when Norwegian vessels fish in EC waters and vice versa?
3. ISSUES 3.1. The Relationship Between TAC/Quotas and Landings The principal basis underlying catch limitation management of fisheries is that the catch limit, the Total Allowable Catch (TAC), restricts the amount of fish landed by fishermen who would otherwise land more fish if they could. Thus TACs and Landings should be closely correlated and, in circumstances where the TAC is really limiting fishing activity, the slope of the regression of TAC on Landings should be close to 1.0 (eg Figure 3.1.1). Examination of the relationship between TACs and actual landings directly addresses the question, “how effective are TACs as a management tool? Does a reduction in TAC effectively reduce landings by the anticipated amount? This is a fundamental question to address. If variation
2

Relationships between TACs, Fish Landings and Fishing Effort in the North Sea
in the TACs set by managers does not induce directly proportional changes in landings, then the relationship between TACs and fishing effort will be a complex one, and much more difficult to determine. Indeed it is possible, if in fact TACs are an ineffective means of managing landings, that there may be no direct relationship between TACs and fishing effort. Under such circumstances it will be impossible to predict the patterns of fishing activity that will result from the setting of a particular suite of TACs. Within the proposed management concept, it would then be impossible to predict the consequences of varying fisheries objectives on broader ecosystem attributes, such as the species diversity of fish and benthic invertebrate communities. If this were to be the case, then if managers are serious about adopting an ecosystem approach to fisheries management, management through the application of TACs would have to be abolished in favour of direct management of fishing effort.
0 40000 80000 120000 160000 200000TAC
0
40000
80000
120000
160000
200000
LAN
DIN
GS
Y = 1.012 * X - 510.8
r = 0.995
Figure 3.1.1: Hypothetical relationship between TAC and Landings in a situation where the catch limitation plays the major role in limiting fishing activity. TACs tend to be determined at a regional scale, ie a TAC for the whole North Sea. These TACs are subsequently divided into individual quotas for each fleet, and ultimately for each vessel within a fleet. Thus, the original question can now be divided into two separate issues. Firstly, is there a close relationship between the individual quotas set for particular fleets and the actual quantities of fish landed by each fleet? Secondly, is there close agreement between the sums of the landings reported by all fleets with an individual quota and the original regional North Sea TAC? Several factors might tend to cloud such relationships. Quota swapping between fleets may not be rigorously recorded. This may lead to apparent miss-matches in the individual fleet quota-landings relationships, but the sum of all fleet landings-TAC relationship might still be expected to hold. Sharp reductions in the value of a particular species may result in their becoming uneconomical to fish, leading to full quotas and TACs not being taken up. In circumstances of unusually low CPUE, fleets may simply run out of time to catch a particular quota. Many fisheries in the North Sea are mixed species fisheries, ie targeting cod, haddock and whiting simultaneously. It may well be that reaching the quota limit for one of these species might limit the ability of a fleet to take its full quota of the other target species. The issue of black-landings also obscures this whole issue. It may well be that close relationships between
3
Relationships between TACs, Fish Landings and Fishing Effort in the North Sea
“reported” landings and TACs/Quotas exist in the data sets, thus giving the appearance that management by TAC really does influence fishing activity. But if in reality, as TACs are reduced, the proportion of fish landed on the black market simply increases, then these relationships provide nothing more than an illusion of effective management. 3.2. The Relationship Between Landings and Fishing Effort The models of the ecological disturbance caused by fishing developed during this project are based on fishing effort statistics (see Greenstreet et al 2007c). In order to be able to predict variation in the ecological disturbance caused by fishing on the basis of variation in TACs, it is important that not only is there a clear relationship between TACs/Quotas and landings, but that there is also a well defined relationship between landings and fishing effort. The simplest hypothetical situation would be that there are simple linear relationships between the three variables; that halving TACs/Quotas would lead to a halving of the amount of fish landed, requiring only half the effort to catch. However, in addition to the confounding influences on the relationship between TACs/Quotas and landings many factors might also distort the relationship between landings and fishing effort. Under circumstances of restrictive quotas fishermen may actually discard fish which, although above legal landing size, are still relatively small and therefore of lower value than larger fish. This practice is known as “high-grading”. They do not wish to use up their limited quotas on lower value fish, and would rather continue fishing in hope of catching larger higher value fish. Such practices are also considerably influenced by numerous other factors, such as the cost of fuel. High-grading would tend to distort the relationship between landings and effort, resulting in the expending of more effort than otherwise anticipated to land a given tonnage of fish. This situation is most likely to occur when TACs and quotas are small. Thus as landings decrease, a corresponding decline in effort might not occur. In mixed-species fisheries relationships between landings and effort are likely to be complex and non-intuitive. If, for example two species vary in value, fishermen may concentrate their effort towards catching the more valuable species. This could decouple the link between landings and effort for the lesser value species. Alternatively, the quota of the more valuable species might be reached, and the vessel then shifts its focus onto the lesser-valued species. This could have two consequences. Firstly, two different relationships between landings and effort for the lower value species might develop, the first while the vessel was concentrating on the more valuable species, and the second when the vessel switches focus onto the second lower value species. Secondly, while the vessel continues to fish for the second species, it may also continue to catch, and have to discard, the first more valuable species. Whether this could be considered to distort the relationship between effort and landings for this first species or not is open to question, depending on how the effort is reported. Similar situations can be posed for mixed-species fisheries for species of similar value, but with very different quotas. 3.3. The Relationship Between TAC/Quota and Fishing Effort The discussion in the two sections above suggests that the relationships between TACs/quotas and landings and between landings and effort are unlikely to be simple and intuitive. Consequently, simple relationships between TACs/quotas and effort are unlikely to be found. In addition to the considerations already raised, several other factors can serve to distort the relationship between TACs/quotas and fishing effort. For example low TACs and quotas are likely to be set when fish stocks reach low levels. This could have a major impact on CPUE, making it much more difficult for fishermen to catch their intended quarry resulting in the expenditure of more effort to take a given catch.
4
Relationships between TACs, Fish Landings and Fishing Effort in the North Sea
Other factors that affect CPUE, for example changes in the distribution of fish, will also serve to decouple any link between quotas and effort. Changes in market value of fish, or the cost of diesel, will also affect fishing behaviour, altering discard patterns, or fishing location (and consequently possibly also CPUE) for example. All such factors can only serve to add variability to the situation. Management initiatives, such as limitation of the number of days at sea, or closure of specific fishing grounds, also influence the behaviour of fishermen, and hence distort any relationship between quotas and effort.
4. DATA 4.1. Problems with Availability and Accuracy of Data It was clear from the start that there would be a number of difficulties experienced in trying to access reliable and consistent data for each of the countries involved in the workshop. Most participating institutes had brought landings and effort data for a number of years over the period 1990-2002. The organisation of the data was however variable, with different resolutions of gear category between institutes and different units of fishing effort in some cases. It was therefore decided that the initial analyses of the relationships between TACs, landings and effort should be carried out separately on the individual data sets of the national fleets, effectively treating them as individual case studies. Results of the analyses on each case study could then be interpreted and compared between studies to examine the applicability of models of effort distribution based on TACs and quotas, across the different fleets represented in the North Sea. Workshop participants were particularly frustrated by the difficulty in accessing ‘user-friendly’ TAC and quota data. Having made enquiries with contacts at the EC, it was concluded that these data are only available from the EC web site as individual PDF and HTML files for recent years and thus must be entered by hand into a database. How to access older data not available on the web site has still to be satisfactorily addressed. Worryingly there were also clear discrepancies between the figures reported in the Official Journal of the European Commission and the reported data in the ICES annual stock assessment report (ICES 2003), raising questions about the reliability of the available data. For one year, 1995, all TACs and quotas for 7 of the key target species were different and in fact it appeared that the figures in the Official Journal of the EC might be wrong! 4.2. TAC Data Available for the Workshop TACs are set for an entire stock, which may cover more than one ICES management region. For example, the North Sea Cod stock TAC covers management area IV and part of areas II and VII (S. Ehrich, pers. comm.). They are determined on the basis of the stock assessments for targeted species and then partitioned across the fleets that have a quota for that stock. The division of quotas is based on historical agreements of how quotas are split up and ‘swaps’ may then take place between fleets to exchange quota for specific stocks. Individual national fleets will then have shares in the quotas for a number of different targeted species. Quotas are assigned at national level and then vessel level. The national fleet definition will change over time as vessels are withdrawn or added. Despite the problems encountered in accessing the TACs and quotas, data were extracted for the years 1993 to 2002 for sole and 1994 to 2002 for six of the other major stocks targeted in the North Sea; cod, whiting, haddock, saithe, plaice and Nephrops (Table 4.2.1). In addition, TACs and quotas for the UK fleet were also available for all stocks apart from saithe, for the years 1990-1993. No quota data were available for the Norwegian fleet
5
Relationships between TACs, Fish Landings and Fishing Effort in the North Sea
6
fishing in North Sea waters and at first it was thought that an estimated quota could be assigned from the difference seen between the sum of all quotas for EC countries and the TAC for that stock (‘Unaccounted’ in Table 4.2.1). However, following initial exploration of these estimated data it was found that there were many instances where Norwegian landings far exceeded the ‘quota’, or even where there was no ‘quota’ at all for a stock with landings data. Evidently our estimated Norwegian quota data were not reliable and it was concluded that none of the analyses examining the relationships with TAC/Quota could be applied to the Norwegian fleet at this stage. 4.3. Availability of Landings and Effort Data Each of the MAFCONS partners represented at the workshop brought a time series of landings and effort data extracted from their institute or from a co-operating institute. A summary of the available data for each of the case studies is given below. In all cases fleets are targeted at demersal stocks. 4.3.1. Case Study 1: The UK fleet landing in England Landings and fishing effort data for this case study were supplied by CEFAS (Lowestoft, UK). Data were available for 1996 – 2002 for all ICES rectangles in division IV (North Sea). Landings data were provided for cod, haddock, whiting, saithe, plaice and sole. Effort data were recorded in hours per year per ICES rectangle for 11 gear types. These were grouped into five classes: Beam trawling; otter trawling targeting fish (heavy otter trawl, light otter trawl, twin otter trawl, triple otter trawl, unspecified otter trawl); otter trawling targeting Nephrops (Nephrops otter trawl, twin Nephrops otter); seine netting (Danish anchor seine, Scottish fly seine); and bottom pair trawling. The size of the reporting trawlers ranged from 5m to 53m length. Reporting for vessels < 10m is optional and may be prone to error. Of all reported landings 2% came from vessels < 10m length and 2% of vessels did not report their size. Landings data were recorded in kilograms and available for the four species: cod, haddock, plaice and sole. 4.3.2. Case Study 2: The UK fleet landing in Scotland Effort and landings data were available for the period 1990 to 1998 for ICES management area IV (The North Sea). Approximately 20 gear codes were used in the Scottish database over the period but these were amalgamated to four main fishing gear types; otter trawl directed at fish, otter trawl directed at Nephrops, beam trawl and Seine net gear. Effort data are recorded in hours fished per year (aggregated from monthly data) at the resolution of the ICES rectangle, broken down into the four main gear categories. Landings data were recorded in kilograms and were available for the seven species.
Relationships between TACs, Fish Landings and Fishing Effort in the North Sea
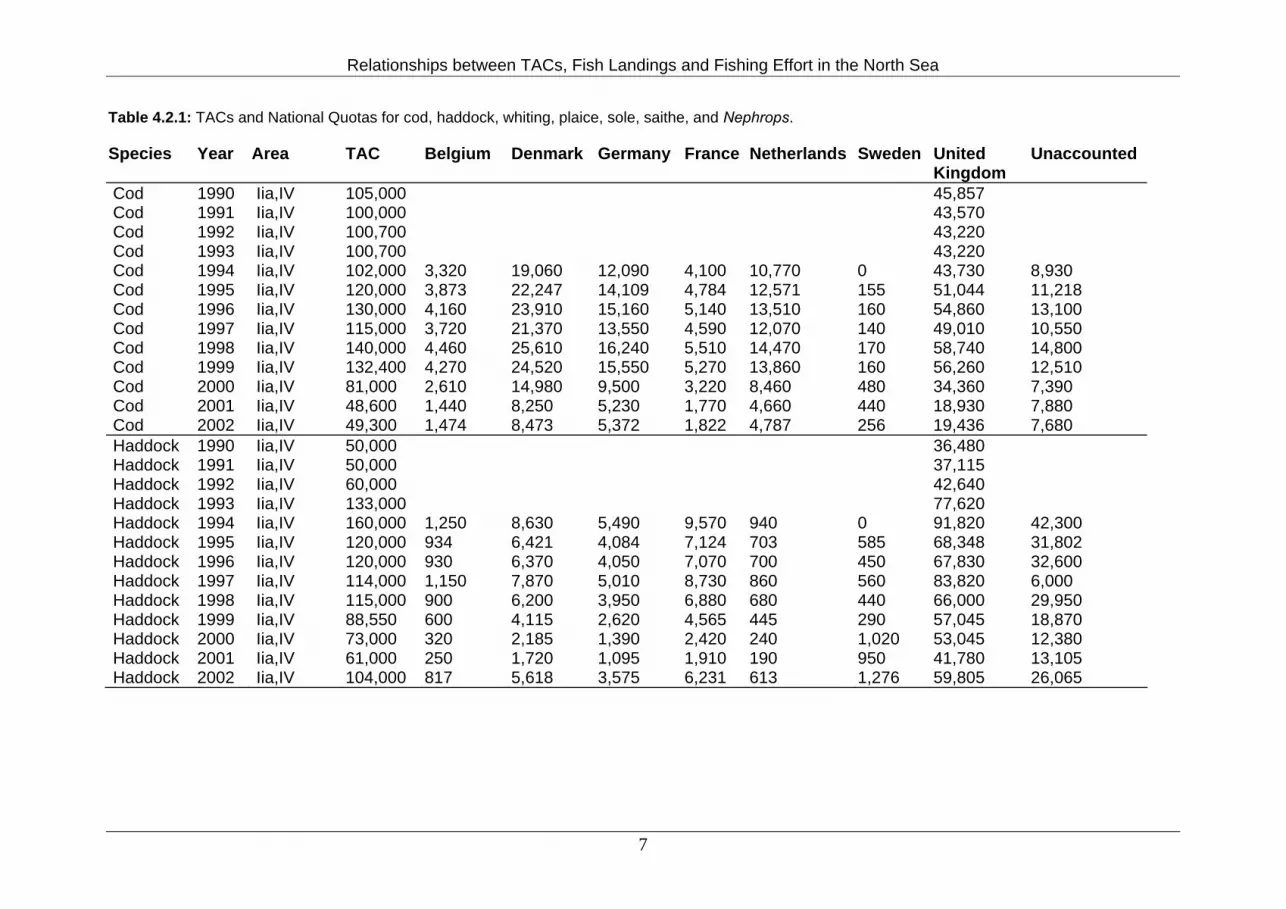
Table 4.2.1: TACs and National Quotas for cod, haddock, whiting, plaice, sole, saithe, and Nephrops. Species Year Area TAC Belgium Denmark Germany France Netherlands Sweden United
Kingdom Unaccounted
Cod 1990 Iia,IV 105,000 45,857 Cod 1991 Iia,IV 100,000 43,570 Cod 1992 Iia,IV 100,700 43,220 Cod 1993 Iia,IV 100,700 43,220 Cod 1994 Iia,IV 102,000 3,320 19,060 12,090 4,100 10,770 0 43,730 8,930 Cod 1995 Iia,IV 120,000 3,873 22,247 14,109 4,784 12,571 155 51,044 11,218 Cod 1996 Iia,IV 130,000 4,160 23,910 15,160 5,140 13,510 160 54,860 13,100 Cod 1997 Iia,IV 115,000 3,720 21,370 13,550 4,590 12,070 140 49,010 10,550 Cod 1998 Iia,IV 140,000 4,460 25,610 16,240 5,510 14,470 170 58,740 14,800 Cod 1999 Iia,IV 132,400 4,270 24,520 15,550 5,270 13,860 160 56,260 12,510 Cod 2000 Iia,IV 81,000 2,610 14,980 9,500 3,220 8,460 480 34,360 7,390 Cod 2001 Iia,IV 48,600 1,440 8,250 5,230 1,770 4,660 440 18,930 7,880 Cod 2002 Iia,IV 49,300 1,474 8,473 5,372 1,822 4,787 256 19,436 7,680 Haddock 1990 Iia,IV 50,000 36,480 Haddock 1991 Iia,IV 50,000 37,115 Haddock 1992 Iia,IV 60,000 42,640 Haddock 1993 Iia,IV 133,000 77,620 Haddock 1994 Iia,IV 160,000 1,250 8,630 5,490 9,570 940 0 91,820 42,300 Haddock 1995 Iia,IV 120,000 934 6,421 4,084 7,124 703 585 68,348 31,802 Haddock 1996 Iia,IV 120,000 930 6,370 4,050 7,070 700 450 67,830 32,600 Haddock 1997 Iia,IV 114,000 1,150 7,870 5,010 8,730 860 560 83,820 6,000 Haddock 1998 Iia,IV 115,000 900 6,200 3,950 6,880 680 440 66,000 29,950 Haddock 1999 Iia,IV 88,550 600 4,115 2,620 4,565 445 290 57,045 18,870 Haddock 2000 Iia,IV 73,000 320 2,185 1,390 2,420 240 1,020 53,045 12,380 Haddock 2001 Iia,IV 61,000 250 1,720 1,095 1,910 190 950 41,780 13,105 Haddock 2002 Iia,IV 104,000 817 5,618 3,575 6,231 613 1,276 59,805 26,065
7
Relationships between TACs, Fish Landings and Fishing Effort in the North Sea
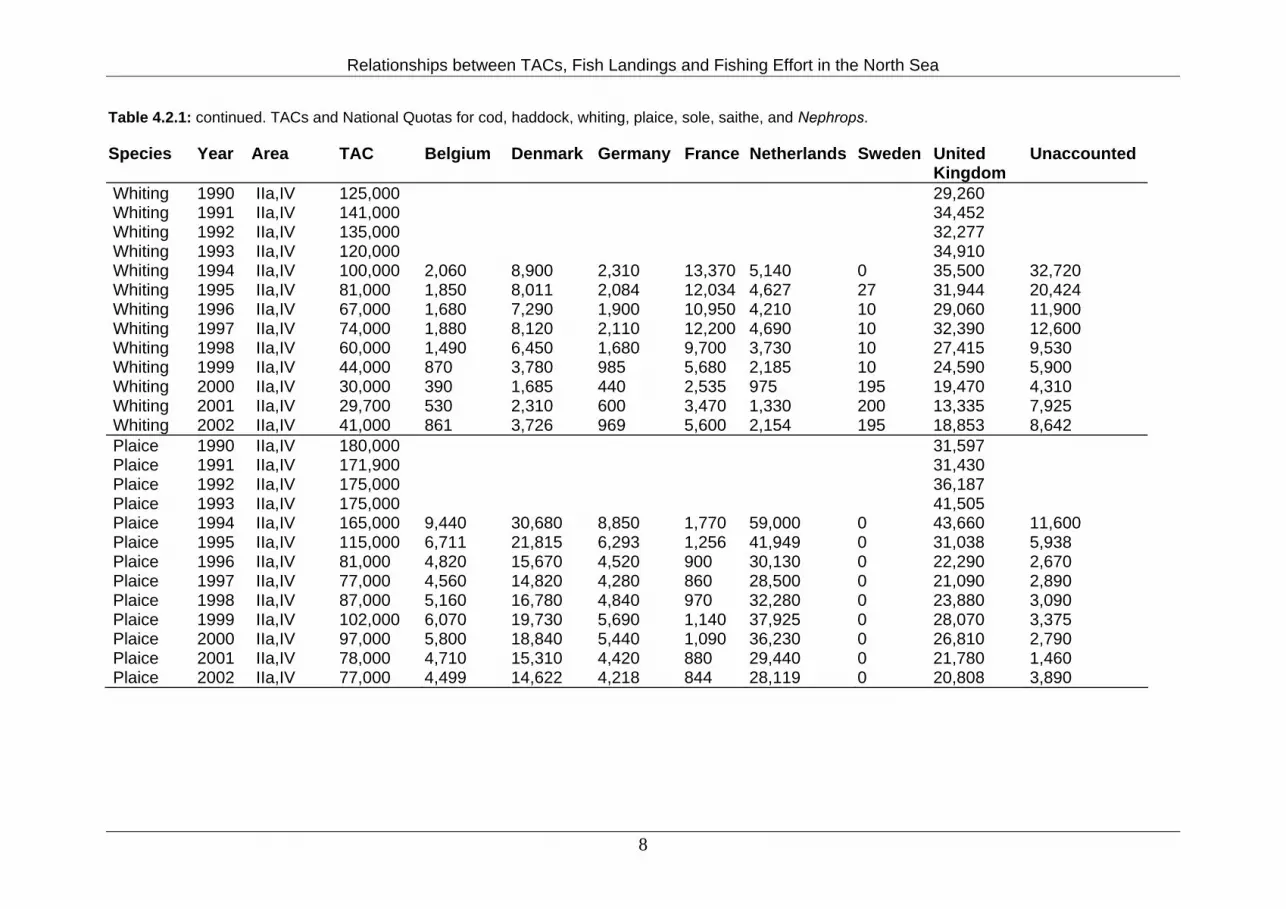
Table 4.2.1: continued. TACs and National Quotas for cod, haddock, whiting, plaice, sole, saithe, and Nephrops. Species Year Area TAC Belgium Denmark Germany France Netherlands Sweden United
Kingdom Unaccounted
Whiting 1990 IIa,IV 125,000 29,260 Whiting 1991 IIa,IV 141,000 34,452 Whiting 1992 IIa,IV 135,000 32,277 Whiting 1993 IIa,IV 120,000 34,910 Whiting 1994 IIa,IV 100,000 2,060 8,900 2,310 13,370 5,140 0 35,500 32,720 Whiting 1995 IIa,IV 81,000 1,850 8,011 2,084 12,034 4,627 27 31,944 20,424 Whiting 1996 IIa,IV 67,000 1,680 7,290 1,900 10,950 4,210 10 29,060 11,900 Whiting 1997 IIa,IV 74,000 1,880 8,120 2,110 12,200 4,690 10 32,390 12,600 Whiting 1998 IIa,IV 60,000 1,490 6,450 1,680 9,700 3,730 10 27,415 9,530 Whiting 1999 IIa,IV 44,000 870 3,780 985 5,680 2,185 10 24,590 5,900 Whiting 2000 IIa,IV 30,000 390 1,685 440 2,535 975 195 19,470 4,310 Whiting 2001 IIa,IV 29,700 530 2,310 600 3,470 1,330 200 13,335 7,925 Whiting 2002 IIa,IV 41,000 861 3,726 969 5,600 2,154 195 18,853 8,642 Plaice 1990 IIa,IV 180,000 31,597 Plaice 1991 IIa,IV 171,900 31,430 Plaice 1992 IIa,IV 175,000 36,187 Plaice 1993 IIa,IV 175,000 41,505 Plaice 1994 IIa,IV 165,000 9,440 30,680 8,850 1,770 59,000 0 43,660 11,600 Plaice 1995 IIa,IV 115,000 6,711 21,815 6,293 1,256 41,949 0 31,038 5,938 Plaice 1996 IIa,IV 81,000 4,820 15,670 4,520 900 30,130 0 22,290 2,670 Plaice 1997 IIa,IV 77,000 4,560 14,820 4,280 860 28,500 0 21,090 2,890 Plaice 1998 IIa,IV 87,000 5,160 16,780 4,840 970 32,280 0 23,880 3,090 Plaice 1999 IIa,IV 102,000 6,070 19,730 5,690 1,140 37,925 0 28,070 3,375 Plaice 2000 IIa,IV 97,000 5,800 18,840 5,440 1,090 36,230 0 26,810 2,790 Plaice 2001 IIa,IV 78,000 4,710 15,310 4,420 880 29,440 0 21,780 1,460 Plaice 2002 IIa,IV 77,000 4,499 14,622 4,218 844 28,119 0 20,808 3,890
8

Relationships between TACs, Fish Landings and Fishing Effort in the North Sea
Table 4.2.1: continued. TACs and National Quotas for cod, haddock, whiting, plaice, sole, saithe, and Nephrops. Species Year Area TAC Belgium Denmark Germany France Netherlands Sweden United
Kingdom Unaccounted
Sole 1990 IIa,IV 25,000 1,670 Sole 1991 IIa,IV 27,000 1,830 Sole 1992 IIa,IV 27,500 1,480 Sole 1993 II,IV 29,000 2,415 1,105 1,935 485 21,815 0 1,245 0 Sole 1994 II,IV 32,000 2,665 1,220 2,135 535 24,075 0 1,370 0 Sole 1995 II,IV 28,000 2,335 1,065 1,865 465 21,070 0 1,200 0 Sole 1996 II,IV 23,000 1,915 875 1,535 385 17,305 0 985 0 Sole 1997 II,IV 18,000 1,500 685 1,200 300 13,545 0 770 0 Sole 1998 II,IV 19,100 1,590 730 1,275 320 14,365 0 820 0 Sole 1999 II,IV 22,000 1,835 840 1,465 365 16,550 0 945 0 Sole 2000 II,IV 22,000 1,835 840 1,465 365 16,550 0 945 0 Sole 2001 II,IV 19,000 1,585 725 1,265 315 14,295 0 815 0 Sole 2002 II,IV 16,000 1,333 610 1,067 267 12,038 0 686 0 Saithe 1990 IIa,IIIabcd,IV Saithe 1991 IIa,IIIabcd,IV Saithe 1992 IIa,IIIabcd,IV Saithe 1993 IIa,IIIabcd,IV Saithe 1994 IIa,IIIabcd,IV 97,000 40 4,250 10,730 25,240 110 0 8,230 48,400 Saithe 1995 IIa,IIIabcd,IV 107,000 41 4,561 11,524 27,103 119 1,255 8,834 53,564 Saithe 1996 IIa,IIIabcd,IV 111,000 40 4,600 11,630 27,350 120 630 8,910 57,720 Saithe 1997 IIa,IIIabcd,IV 115,000 40 4,770 12,040 28,350 120 650 9,230 59,800 Saithe 1998 IIa,IIIabcd,IV 97,000 30 4,020 10,160 23,910 100 550 7,790 50,440 Saithe 1999 IIa,IIIabcd,IV 110,000 40 4,560 11,520 27,100 120 630 8,830 57,200 Saithe 2000 IIa,IIIabcd,IV 85,000 30 3,520 8,900 20,960 90 1,360 6,820 43,320 Saithe 2001 IIa,IIIabcd,IV 87,000 30 3,610 9,110 21,440 90 1,380 6,980 44,360 Saithe 2002 IIa,IIIabcd,IV 135,000 47 5,598 14,137 33,270 141 2,119 10,838 68,850
9

Relationships between TACs, Fish Landings and Fishing Effort in the North Sea
10
Table 4.2.1: continued. TACs and National Quotas for cod, haddock, whiting, plaice, sole, saithe, and Nephrops. Species Year Area TAC Belgium Denmark Germany France Netherlands Sweden United
Kingdom Unaccounted
Nephrops 1990 IIa,IV Nephrops 1991 IIa,IV Nephrops 1992 IIa,IV 12,000 12,000 0 Nephrops 1993 IIa,IV 12,000 600 420 5 5 0 0 9,970 1,000 Nephrops 1994 IIa,IV 13,000 680 680 10 20 350 0 11,260 0 Nephrops 1995 IIa,IV 15,200 795 795 10 25 410 0 13,165 0 Nephrops 1996 IIa,IV 15,200 795 795 10 25 410 0 13,165 0 Nephrops 1997 IIa,IV 15,200 795 795 10 25 410 0 13,165 0 Nephrops 1998 IIa,IV 15,200 795 795 10 25 410 0 13,165 0 Nephrops 1999 IIa,IV 15,200 795 795 10 25 410 0 13,165 0 Nephrops 2000 IIa,IV 17,200 900 900 15 25 465 0 14,895 0 Nephrops 2001 IIa,IV 15,480 810 810 10 25 415 0 13,410 0 Nephrops 2002 IIa,IV 16,623 870 870 13 26 448 0 14,398 0

Relationships between TACs, Fish Landings and Fishing Effort in the North Sea
4.3.3. Case Study 3: The Norwegian fleet Effort and catch data were available for the years 1992 to 2002 for ICES management area IV (The North Sea). These data were for the Norwegian demersal fleet fishing in the North Sea and landing in Norway. Effort data are recorded in hours fished per year (aggregated from monthly data), at the resolution of the ICES rectangle, broken down into two gear categories. The gear categories were beam trawl and otter trawl. Landings data were recorded in tonnes and were available for all seven species cod, whiting, haddock, Nephrops, plaice, saithe and sole. It is important to remember at this point that, with respect to commercial fish species, the Norwegian catch data is the whole catch, including discards. 4.3.4. Case Study 4: The German fleet Effort and landings data were available for the years 1995 to 2003 for ICES management area IV (The North Sea). These Data are for the German fleet landing in Germany and foreign countries. Effort data are recorded in hours fished per year (aggregated from monthly data) at the resolution of the ICES rectangle, broken down into two gear categories. The gear categories were beam trawl and otter trawl. Landings data were recorded in kilograms and were available for all of the seven species except Nephrops. 4.3.5. Case Study 5: The Dutch fleet Effort and landings data were available for the years 1990 to 2002 for ICES management area IV (The North Sea). These data are for the Dutch demersal fleet (large vessels only with >300Hp power) landing in The Netherlands. Effort data are recorded in days at sea per year (aggregated from monthly data) at the resolution of the ICES rectangle, broken down into two gear categories. The gear categories were beam trawl and otter trawl. Landings data were recorded in kilograms and were available for five of the seven species. Haddock and Nephrops were excluded, but data for brill and turbot were examined instead: species that were targeted by the beam trawl fishery. 4.4. List of Hypotheses Having considered the availability of data a number of hypotheses were selected for examination. Each case study would be analysed separately allowing for differences in resolution of data, for example in the gear code categories. Each hypothesis was applied to the data for each of the stocks that were available in the case study data sets and to each of the gears that were used to catch those stocks. These hypotheses are listed in Box 4.4.1. All these relationships are likely to be influenced by variation in stock size (both in time and space), which in the models developed to test the above hypotheses, should be considered as a possible additional explanatory variable. Box 4.4.1. Hypotheses relating TAC/Quotas to Landings and both to Effort 6. Total Landings of species(i) in year(a) are closely related to TAC/Quota of species(i) in
year(a). 7. Landings of species(i) by gear(x) in year(a) are closely related to effort by gear(x) in year(a). 8. Effort by gear(x) in year(a) are closely related to TAC/Quota for species(i) in year(a). 9. Landings of species(i) by gear(x) in year (a) from ICES rectangle(ψ) are closely related to
effort by gear(x) in year (a) in ICES rectangle(ψ) (a spatial analysis in each year). 10. Landings of species(i) by gear(x) from ICES rectangle(ψ) in each year(a) are closely related
to effort by gear(x) in ICES rectangle(ψ) in that year (a) (a temporal analysis in each rectangle).
11

Relationships between TACs, Fish Landings and Fishing Effort in the North Sea
5. RESULTS: CASE STUDIES Initially results of the examination of each hypothesis are presented as fleet by fleet case studies. The final section examines additional “international” data obtained from the stock assessment literature (ICES 2002; 2003; 2005). 5.1. Case Study 1: The UK Fleet Landing in England Data were only analysed for fishing vessels registered in England and Wales. 5.1.1. Relationship between Quotas and Landings Landings of the most important commercial groundfish species and Nephrops caught by fishing vessels registered in England and Wales were compared with the UK quotas for these species (Tables 5.1.1 & 5.1.2). Landings and quotas were significantly correlated for cod, saithe, whiting and sole (Table 5.1.3, Figure 5.1.1). No significant correlation was found for haddock, plaice and Nephrops. In the case of haddock this may be due to English and Welsh registered vessels catching only 5% or less of the UK quota. However, the English and Welsh fleet also caught less than 10% of the UK whiting quota and around 20% of cod, and for both species landings and quotas correlated significantly. Year Cod Haddock Saithe Whiting Sole Plaice Nephrops
1996 54.860 67.830 8.910 29.060 0.985 22.290 13.1651997 49.010 83.820 9.230 32.390 0.770 21.090 13.1651998 58.740 66.000 7.790 27.415 0.820 23.880 13.1651999 56.260 57.045 8.830 24.590 0.945 28.070 13.1652000 34.360 53.045 6.820 19.470 0.945 26.810 14.8952001 18.930 41.780 6.980 13.335 0.815 21.780 13.4102002 19.436 59.805 10.838 18.853 0.686 20.808 14.398
Table 5.1.1.1: Total annual UK quotas (in 1000 tonnes) for demersal fish species and Year Cod Haddock Saithe Whiting Sole Plaice Nephrops
1996 9.860 2.681 2.833 1.954 0.650 12.334 2.0441997 8.510 2.825 2.539 2.296 0.363 12.369 1.8931998 11.862 2.827 2.279 2.420 0.414 10.002 1.4191999 5.780 2.155 2.865 1.937 0.480 9.164 1.7392000 4.089 1.670 1.223 1.563 0.482 10.769 1.5902001 2.516 2.233 1.182 0.960 0.433 9.949 1.8492002 2.099 3.077 2.520 1.156 0.301 7.289 1.509
Table 5.1.1.2: Total annual landings (in 1000 tonnes) of demersal fish species and Nephrops by vessels registered in England and Wales.
12

Relationships between TACs, Fish Landings and Fishing Effort in the North Sea
Species R P nCod 0.882779 0.008 7Haddock 0.582717 0.17 7Saithe 0.763777 0.046 7Whiting 0.918504 0.003 7Sole 0.911823 0.004 7Plaice -0.080627 0.864 7Nephrops -0.467614 0.29 7 Table 5.1.1.3: Correlation between UK quotas (1996 to 2002) for demersal fish species and Nephrops and landings of these species by vessels registered in England and Wales.
13

Relationships between TACs, Fish Landings and Fishing Effort in the North Sea
Cod
0102
00
99
9796
98
0
2
4
6
8
10
12
14
0 20 40 60 80
Land
ings
[100
0 to
nnes
]Haddock
9802
979601 99
00
0
1
2
3
4
5
0 20 40 60 80 100
Land
ings
[100
0 to
nnes
]
Saithe
00
9697
99
01
9802
0
1
2
3
4
5
0 5 10 15
Land
ings
[100
0 to
nnes
] Whiting
000201
99 969798
0
1
2
3
4
5
0 10 20 30 40
Land
ings
[100
0 to
nnes
]
Sole
0297
010099
96
98
0
0.2
0.4
0.6
0.8
1
0 0.5 1 1.5
Land
ings
[100
0 to
nnes
]
Plaice 9697
01 9800
99
02
0
2
4
6
8
10
12
14
15 20 25 30
Land
ings
[100
0 to
nnes
]
Nephrops
000298
99 019796
0
1
2
3
13 14 15
UK quota [x1000 tonnes]
Land
ings
[100
0 to
nnes
]**
**
* **
Figure 5.1.1.1: Relationship between the annual reported landings of demersal fish and Nephrops by vessels registered in England and Wales, and UK quota for each species in 1996-2002. Significance levels are indicated as P<0.05*, P<0.01**, P<0.001***.
14
Relationships between TACs, Fish Landings and Fishing Effort in the North Sea
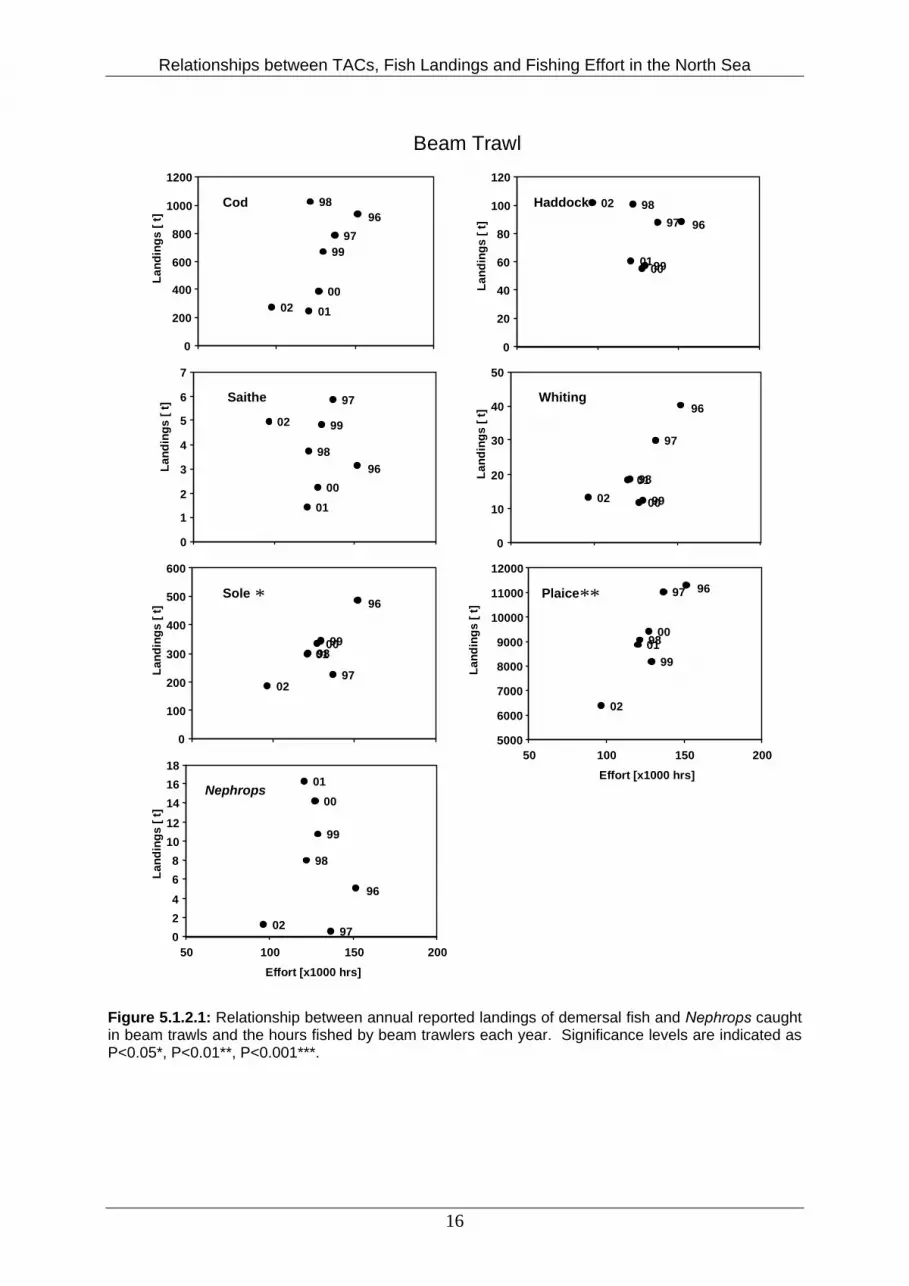
5.1.2. Relationship between annual landings of key species reported for main gear types and effort expended annually by each gear type
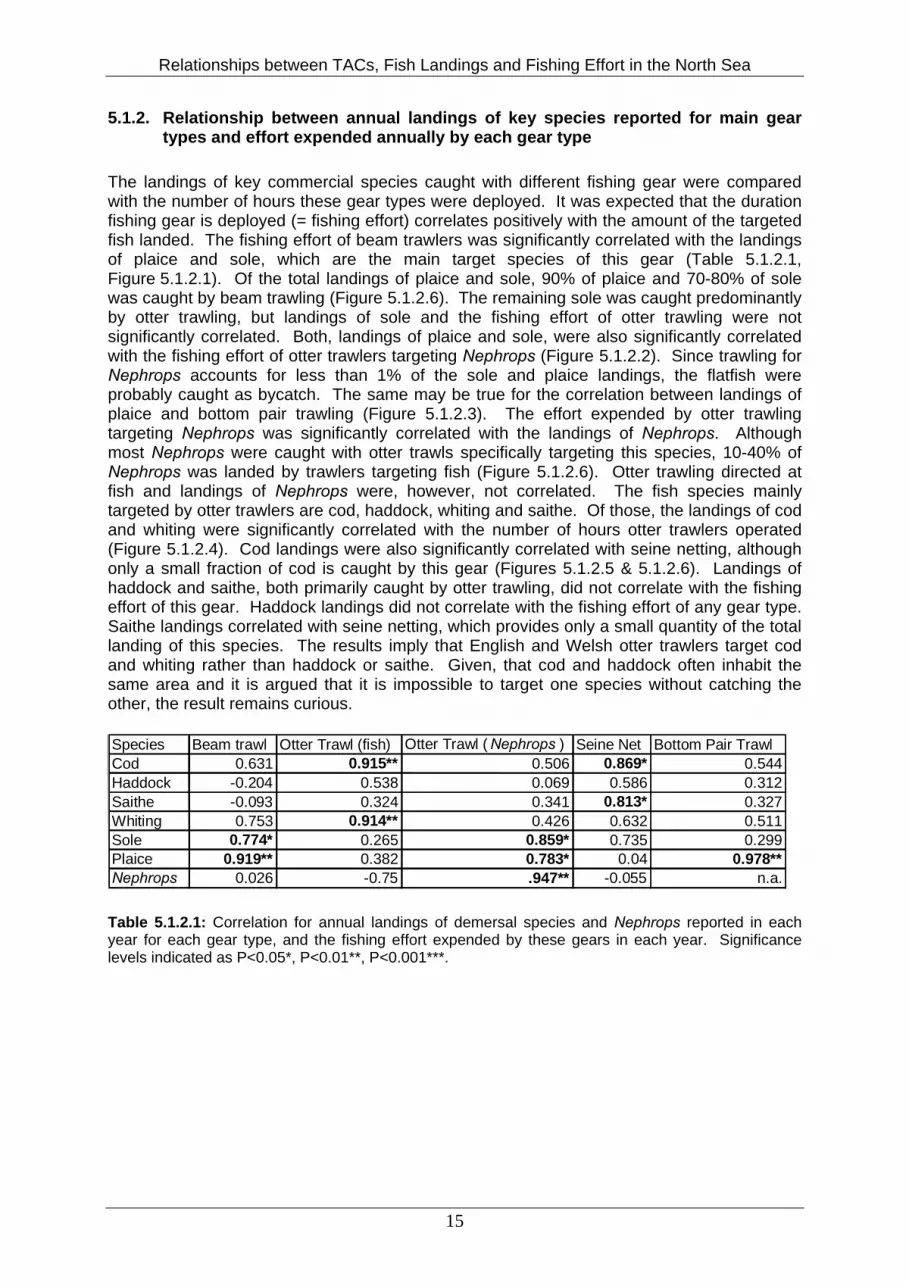
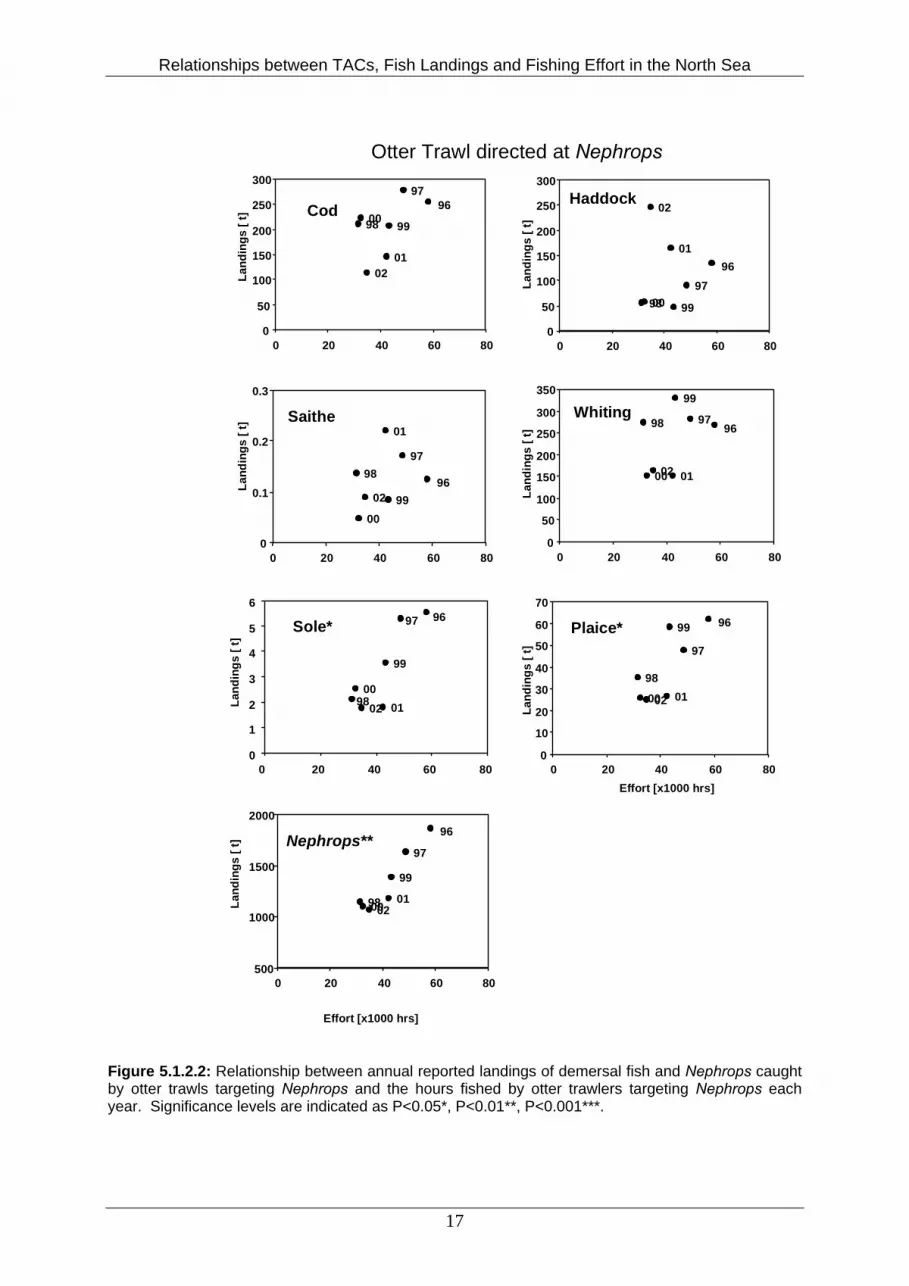
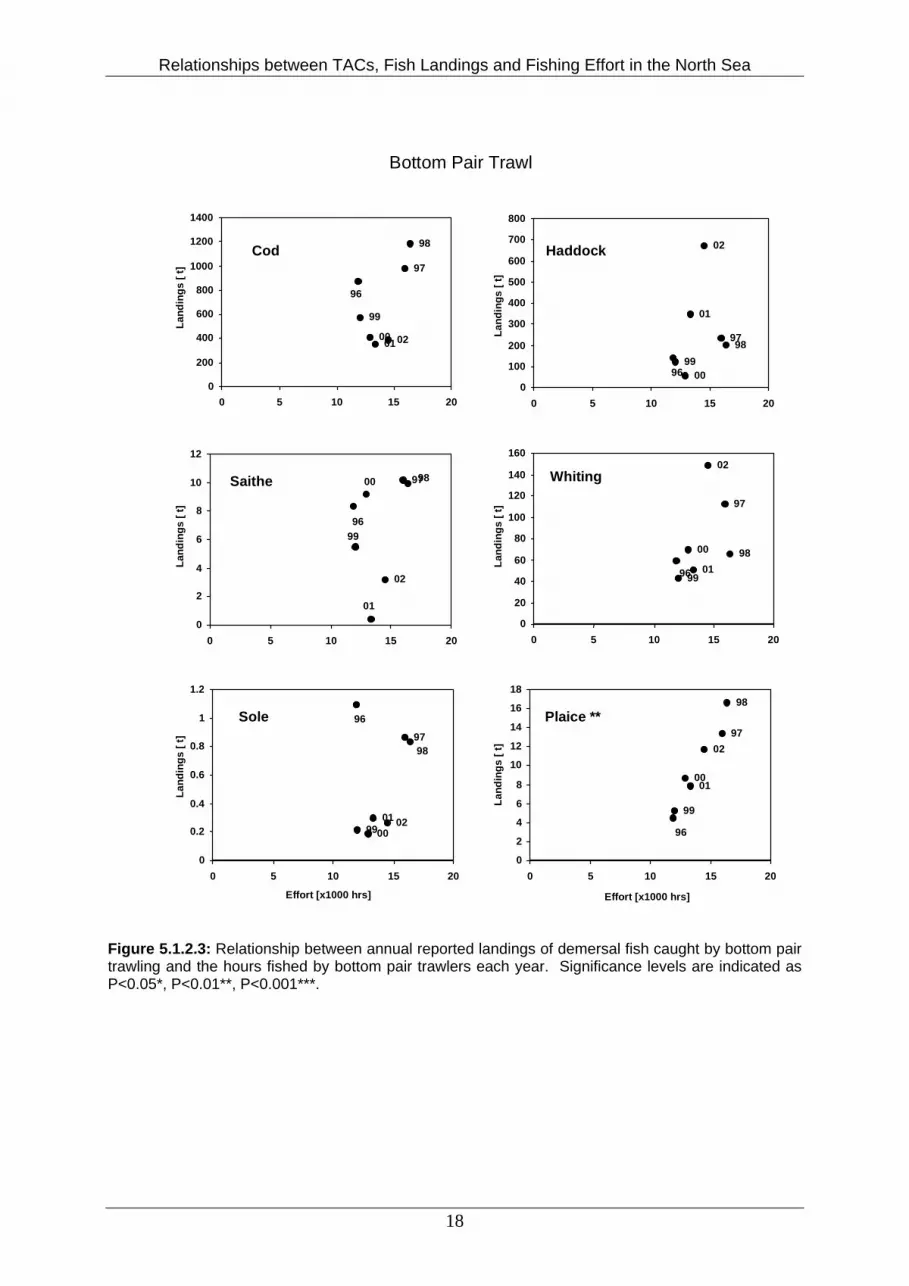
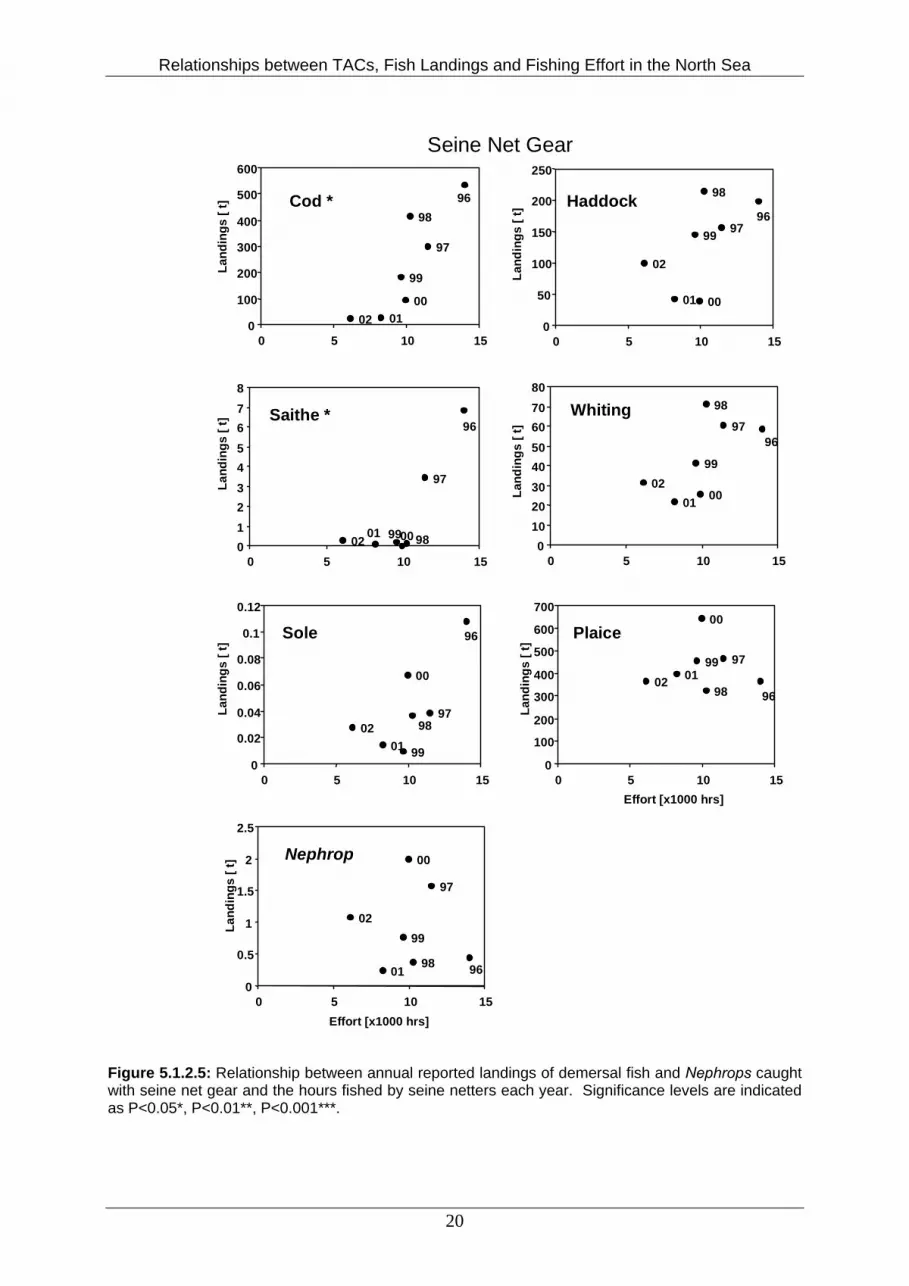
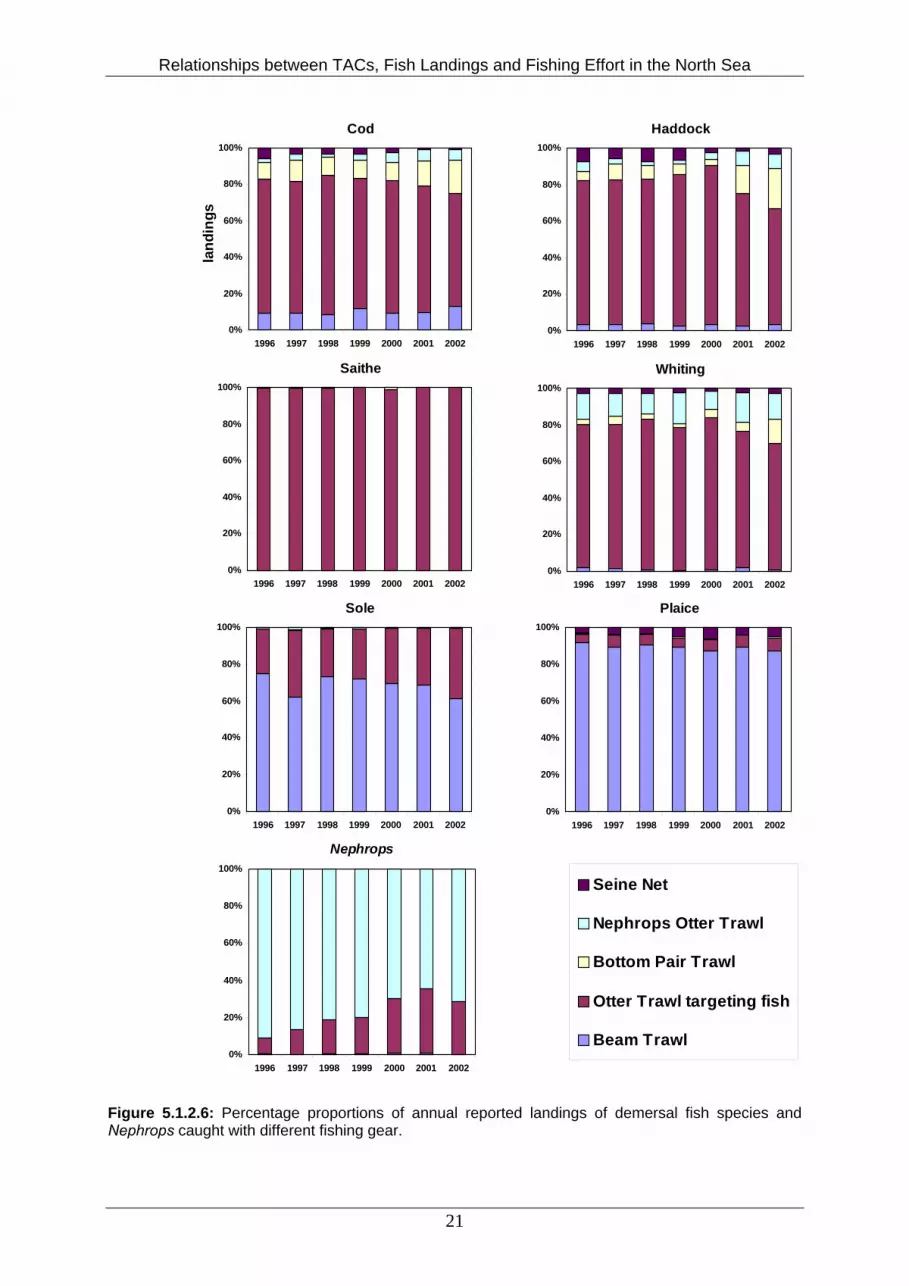
The landings of key commercial species caught with different fishing gear were compared with the number of hours these gear types were deployed. It was expected that the duration fishing gear is deployed (= fishing effort) correlates positively with the amount of the targeted fish landed. The fishing effort of beam trawlers was significantly correlated with the landings of plaice and sole, which are the main target species of this gear (Table 5.1.2.1, Figure 5.1.2.1). Of the total landings of plaice and sole, 90% of plaice and 70-80% of sole was caught by beam trawling (Figure 5.1.2.6). The remaining sole was caught predominantly by otter trawling, but landings of sole and the fishing effort of otter trawling were not significantly correlated. Both, landings of plaice and sole, were also significantly correlated with the fishing effort of otter trawlers targeting Nephrops (Figure 5.1.2.2). Since trawling for Nephrops accounts for less than 1% of the sole and plaice landings, the flatfish were probably caught as bycatch. The same may be true for the correlation between landings of plaice and bottom pair trawling (Figure 5.1.2.3). The effort expended by otter trawling targeting Nephrops was significantly correlated with the landings of Nephrops. Although most Nephrops were caught with otter trawls specifically targeting this species, 10-40% of Nephrops was landed by trawlers targeting fish (Figure 5.1.2.6). Otter trawling directed at fish and landings of Nephrops were, however, not correlated. The fish species mainly targeted by otter trawlers are cod, haddock, whiting and saithe. Of those, the landings of cod and whiting were significantly correlated with the number of hours otter trawlers operated (Figure 5.1.2.4). Cod landings were also significantly correlated with seine netting, although only a small fraction of cod is caught by this gear (Figures 5.1.2.5 & 5.1.2.6). Landings of haddock and saithe, both primarily caught by otter trawling, did not correlate with the fishing effort of this gear. Haddock landings did not correlate with the fishing effort of any gear type. Saithe landings correlated with seine netting, which provides only a small quantity of the total landing of this species. The results imply that English and Welsh otter trawlers target cod and whiting rather than haddock or saithe. Given, that cod and haddock often inhabit the same area and it is argued that it is impossible to target one species without catching the other, the result remains curious. Species Beam trawl Otter Trawl (fish) Otter Trawl ( Nephrops ) Seine Net Bottom Pair TrawlCod 0.631 0.915** 0.506 0.869* 0.544Haddock -0.204 0.538 0.069 0.586 0.312Saithe -0.093 0.324 0.341 0.813* 0.327Whiting 0.753 0.914** 0.426 0.632 0.511Sole 0.774* 0.265 0.859* 0.735 0.299Plaice 0.919** 0.382 0.783* 0.04 0.978**Nephrops 0.026 -0.75 .947** -0.055 n.a. Table 5.1.2.1: Correlation for annual landings of demersal species and Nephrops reported in each year for each gear type, and the fishing effort expended by these gears in each year. Significance levels indicated as P<0.05*, P<0.01**, P<0.001***.
15
Relationships between TACs, Fish Landings and Fishing Effort in the North Sea
Cod
010200
9997
9698
0
200
400
600
800
1000
1200
50 100 150 200Effort [x1000 hrs]
Land
ings
[ t]
Beam Trawl
Haddock 989697
9900
02
01
0
20
40
60
80
100
120
50 100 150 200Effort [x1000 hrs]
Land
ings
[ t]
Saithe
9896
97
99
00
02
01
0
1
2
3
4
5
6
7
50 100 150 200Effort [x1000 hrs]
Land
ings
[ t]
Whiting
0102 0099
97
96
98
0
10
20
30
40
50
50 100 150 200Effort [x1000 hrs]
Land
ings
[ t]
Sole
01
02
0099
97
96
98
0
100
200
300
400
500
600
50 100 150 200Effort [x1000 hrs]
Land
ings
[ t]
Plaice
98
9697
99
00
02
01
5000
6000
7000
8000
9000
10000
11000
12000
50 100 150 200Effort [x1000 hrs]
Land
ings
[ t]
Nephrops
98
96
97
99
00
02
01
02468
1012141618
50 100 150 200Effort [x1000 hrs]
Land
ings
[ t]
* **
Figure 5.1.2.1: Relationship between annual reported landings of demersal fish and Nephrops caught in beam trawls and the hours fished by beam trawlers each year. Significance levels are indicated as P<0.05*, P<0.01**, P<0.001***.
16
Relationships between TACs, Fish Landings and Fishing Effort in the North Sea
Effort [x1000 hrs]
Cod98
9697
9900
0201
0
50
100
150
200
250
300
0 20 40 60 80
Land
ings
[ t]
Haddock
98
9697
9900
02
01
0
50
100
150
200
250
300
0 20 40 60 80
Land
ings
[ t]
Saithe01
02
0099
97
9698
0
0.1
0.2
0.3
0 20 40 60 80
Land
ings
[ t]
Whiting98 96
97
99
0002 01
0
50
100
150
200
250
300
350
0 20 40 60 80
Land
ings
[ t]
Sole*
010200
99
97 96
98
0
1
2
3
4
5
6
0 20 40 60 80
Land
ings
[ t]
Plaice*
98
96
97
99
0002 01
0
10
20
30
40
50
60
70
0 20 40 60 80Effort [x1000 hrs]
Land
ings
[ t]
Nephrops**
98
96
97
99
000201
500
1000
1500
2000
0 20 40 60 80
Land
ings
[ t]
Otter Trawl directed at Nephrops
Figure 5.1.2.2: Relationship between annual reported landings of demersal fish and Nephrops caught by otter trawls targeting Nephrops and the hours fished by otter trawlers targeting Nephrops each year. Significance levels are indicated as P<0.05*, P<0.01**, P<0.001***.
17
Relationships between TACs, Fish Landings and Fishing Effort in the North Sea
Cod 98
96
97
99
00 0201
0
200
400
600
800
1000
1200
1400
0 5 10 15 20
Land
ings
[ t]
Haddock
98
96
97
9900
02
01
0
100
200
300
400
500
600
700
800
0 5 10 15 20
Land
ings
[ t]
Saithe
01
02
00
99
97
96
98
0
2
4
6
8
10
12
0 5 10 15 20
Land
ings
[ t]
Whiting
98
96
97
99
00
02
01
0
20
40
60
80
100
120
140
160
0 5 10 15 20
Land
ings
[ t]
Sole
01 020099
97
96
98
0
0.2
0.4
0.6
0.8
1
1.2
0 5 10 15 20
Land
ings
[ t]
Plaice **98
96
97
99
00
02
01
0
2
4
6
8
10
12
14
16
18
0 5 10 15 20
Effort [x1000 hrs]
Land
ings
[ t]
Bottom Pair Trawl
Effort [x1000 hrs]
Figure 5.1.2.3: Relationship between annual reported landings of demersal fish caught by bottom pair trawling and the hours fished by bottom pair trawlers each year. Significance levels are indicated as P<0.05*, P<0.01**, P<0.001***.
18

Relationships between TACs, Fish Landings and Fishing Effort in the North Sea
Cod**98
9697
9900
02 01
0
2000
4000
6000
8000
10000
50 100 150 200 250Effort [x1000 hrs]
Land
ings
[ t]
Haddock 989697
99
00
02
01
0
500
1000
1500
2000
2500
50 100 150 200 250Effort [x1000 hrs]
Land
ings
[ t]
Saithe
01
02
00
999796
98
0
500
1000
1500
2000
2500
3000
50 100 150 200 250Effort [x1000 hrs]
Land
ings
[ t]
Whiting**
0102
0099
97
96
98
0
500
1000
1500
2000
2500
0 50 100 150 200 250Effort [x1000 hrs]
Land
ings
[ t]
Sole01
02
0099 97
96
98
0
60
120
180
50 100 150 200 250Effort [x1000 hrs]
Land
ings
[ t]
Plaice
9896
97
99
00
02
01
0
300
600
900
50 100 150 200 250Effort [x1000 hrs]
Land
ings
[ t]
Nephrops
98
96
9799
0002
01
0
100
200
300
400
500
600
700
50 100 150 200 250Effort [x1000 hrs]
Land
ings
[ t]
Otter Trawl directed at Fish
Figure 5.1.2.4: Relationship between annual reported landings of demersal fish and Nephrops caught by otter trawls targeting fish and the hours fished by otter trawlers each year. Significance levels are indicated as P<0.05*, P<0.01**, P<0.001***.
19
Relationships between TACs, Fish Landings and Fishing Effort in the North Sea
Cod *98
96
97
99
0002 010
100
200
300
400
500
600
0 5 10 15
Land
ings
[ t] Haddock 98
969799
00
02
01
0
50
100
150
200
250
0 5 10 1
Land
ings
[ t]
5
Saithe *
0102 0099
97
96
98012345678
0 5 10 15
Land
ings
[ t]
Whiting 98
9697
99
0002
01
01020304050607080
0 5 10
Land
ings
[ t]
15
Sole
0102
00
99
97
96
98
0
0.02
0.04
0.06
0.08
0.1
0.12
0 5 10 15
Land
ings
[ t]
Plaice
98 96
9799
00
02 01
0
100
200
300
400
500
600
700
0 5 10 15Effort [x1000 hrs]
Land
ings
[ t]
Nephrop
98 96
97
99
00
02
010
0.5
1
1.5
2
2.5
0 5 10 15Effort [x1000 hrs]
Land
ings
[ t]
Seine Net Gear
Figure 5.1.2.5: Relationship between annual reported landings of demersal fish and Nephrops caught with seine net gear and the hours fished by seine netters each year. Significance levels are indicated as P<0.05*, P<0.01**, P<0.001***.
20
Relationships between TACs, Fish Landings and Fishing Effort in the North Sea
Cod
0%
20%
40%
60%
80%
100%
1996 1997 1998 1999 2000 2001 2002
Saithe
0%
20%
40%
60%
80%
100%
1996 1997 1998 1999 2000 2001 2002
Haddock
0%
20%
40%
60%
80%
100%
1996 1997 1998 1999 2000 2001 2002
Whiting
0%
20%
40%
60%
80%
100%
1996 1997 1998 1999 2000 2001 2002
Sole
0%
20%
40%
60%
80%
100%
1996 1997 1998 1999 2000 2001 2002
Plaice
0%
20%
40%
60%
80%
100%
1996 1997 1998 1999 2000 2001 2002
Nephrops
0%
20%
40%
60%
80%
100%
1996 1997 1998 1999 2000 2001 2002
land
ings
Seine Net
Nephrops Otter Trawl
Bottom Pair Trawl
Otter Trawl targeting fish
Beam Trawl
Figure 5.1.2.6: Percentage proportions of annual reported landings of demersal fish species and Nephrops caught with different fishing gear.
21

Relationships between TACs, Fish Landings and Fishing Effort in the North Sea
5.1.3. Relationship between TAC/Quotas and Fishing Effort It was hypothesised that fishing quotas for commercially important fish species and Nephrops are positively correlated with the amount of time fishing vessels operate. The hypothesis was confirmed for the UK quotas of cod and whiting related to the fishing effort by otter trawlers targeting fish (Table 5.1.3.1, Figure 5.1.3.1). Quotas for flatfish and the fishing effort of beam trawlers, the second most common fishing method, were not correlated, although the correlation with the quota of sole fell just below the significance level (Figure 5.1.3.2). Even the fishing effort of otter trawling directed at Nephrops was not significantly correlated with the quota of its target species (Figure 5.1.3.3). Species Beam trawl Otter Trawl (fish) Otter Trawl ( Nephrops ) Seine Net Bottom Pair TrawlCod 0.662 0.891** 0.321 0.74 0.054Haddock 0.387 0.615 0.372 0.527 0.504Saithe -0.279 -0.261 0.222 -0.188 0.149Whiting 0.61 0.823* 0.459 0.73 0.304Sole 0.739 0.496 0.37 0.662 -0.727Plaice 0.165 0.183 -0.278 0.078 -0.455Nephrops -0.501 -0.594 -0.576 -0.484 -0.122 Table 5.1.3.1: Correlation between UK quotas for demersal fish species and Nephrops between1996 and 2002 and the annual fishing effort expended by five major fishing gear types. Significance levels are indicated as P<0.05*, P<0.01** and P<0.001***.
22

Relationships between TACs, Fish Landings and Fishing Effort in the North Sea
01
02
00 99
9796
98
0
50
100
150
200
250
0 20 40 60 80
UK cod quota [1000 tonnes]
Fish
ing
effo
rt [1
000
hour
s]
01
02
0099
979698
80
100
120
140
160
180
200
220
240
0 20 40 60 80 10
UK haddock quota [1000 tonnes]
Fish
ing
effo
rt [1
000
hour
s]
0
9896
97
9900
02
01
80
100
120
140
160
180
200
220
240
0 2 4 6 8 10 12
UK saithe quota [1000 tonnes]
Fish
ing
effo
rt [1
000
hour
s]
01
02
0099
979698
80
100
120
140
160
180
200
220
240
0 10 20 30 4
UK whiting quota [1000 tonnes]
Fish
ing
effo
rt [1
000
hour
s]
0
01
02
0099
9796
98
0
50
100
150
200
250
0 0.2 0.4 0.6 0.8 1 1.2
UK sole quota [1000 tonnes]
Fish
ing
effo
rt [1
000
hour
s]
9896
97
9900
02
01
0
50
100
150
200
250
10 11 12 13 14 15 16
UK Nephrops quota [1000 tonnes]
Fish
ing
effo
rt [1
000
hour
s]
Otter trawl directed at fish
Cod **
Saithe
Haddock
Whiting *
NephropsSole
Figure 5.1.3.1: Relationships between hours fished [year-1] with otter trawls directed at fish by trawlers registered in England and Wales and the UK quotas for the main target fish species, P<0.05*, P<0.01**, P<0.001***.
23

Relationships between TACs, Fish Landings and Fishing Effort in the North Sea
98
9697
9900
02
01
80
90
100
110
120
130
140
150
160
0 20 40 60 80
UK cod quota [1000 tonnes]
Fish
ing
effo
rt [1
000
hour
s]
98
9697
9900
02
01
80
90
100
110
120
130
140
150
160
0 0.2 0.4 0.6 0.8 1 1.2
UK sole quota [1000 tonnes]
Fish
ing
effo
rt [1
000
hour
s]
98
9697
9900
02
01
80
90
100
110
120
130
140
150
160
10 15 20 25 30
UK plaice quota [1000 tonnes]
Fish
ing
effo
rt [1
000
hour
s]Beam Trawl
Plaice Sole
Cod
Bottom Pair Trawl
98
96
97
99
00
02
01
8
9
10
11
12
13
14
15
16
17
0 20 40 60 80
UK cod quota [1000 tonnes]
Fish
ing
effo
rt [1
000
hour
s]
01
02
00
99
97
96
98
8
9
10
11
12
13
14
15
16
17
0 20 40 60 80 10
UK haddock quota [1000 tonnes]
Fish
ing
effo
rt [1
000
hour
s]
Cod Haddock
0
Figure 5.1.3.2: Relationships between hours fished [year-1] with beam trawls and bottom pair trawls by trawlers registered in England and Wales and the UK quotas for the main target fish species, P<0.05*, P<0.01**, P<0.001***.
24

Relationships between TACs, Fish Landings and Fishing Effort in the North Sea
Otter trawl directed at Nephrops
01
0200
99
9796
98
0
10
20
30
40
50
60
70
0 10 20 30 4
UK whiting quota [1000 tonnes]
Fish
ing
effo
rt [1
000
hour
s]
0
01
0200
99
9796
98
0
10
20
30
40
50
60
70
10 11 12 13 14 15 16
UK Nephrops quota [1000 tonnes]
Fish
ing
effo
rt [1
000
hour
s] Nephrops Whiting
Figure 5.1.3.3: Relationships between hours fished [year-1] with otter trawls directed at Nephrops by trawlers registered in England and Wales and the UK quotas for the main target species, P<0.05*, P<0.01**, P<0.001***. 5.1.4. Spatial relationships between landings and effort in time Landings of demersal fish species and Nephrops caught with different gear in individual ICES rectangles were compared with the fishing effort of the gear types in these rectangles (Table 5.1.4.1). A strong positive correlation for a particular species suggests that in each ICES rectangle similar fishing effort was necessary to catch a unit amount of a species. It is an indication that the species may have been targeted. A weak correlation in turn suggests that different degrees of fishing effort were necessary in the rectangles to catch the same amount of a particular species. It is likely that the species was caught as bycatch rather than being targeted. Landings of cod per ICES rectangle were significantly correlated with the fishing effort of all gear types. The correlation was particularly strong for otter trawling targeting fish or Nephrops and beam trawling. These gear types are responsible for the majority of landings of this species (Figure 5.1.2.6). For haddock the relationships between landings and fishing effort were the same as for cod, with the exception of seine netting showing significant relationships only for two of the seven years tested. As for cod, seine netting contributes 5% or less of the total landings, which suggests that the species is probably caught as bycatch. Whiting, primarily caught by otter trawling for fish and Nephrops, showed a strong correlation between landings and effort for these gear types, but also for bottom pair trawling. Saithe is almost exclusively caught by otter trawling directed at fish, but the relationship between landings of this species per ICES rectangle and fishing effort by otter trawlers was not significant. This reflects that otter trawling by English and Welsh registered vessels is directed mainly at other species, namely cod, haddock and whiting. Otter trawlers target gadoid-rich areas, with or without saithe, and targeting saithe does not drive the fishing effort expended with this gear.
25

Relationships between TACs, Fish Landings and Fishing Effort in the North Sea
1996 1997 1998 1999 2000 2001 2002 Cod .812
.000 92
.799
.000 97
.817
.000 94
.650
.000 80
.645
.000 77
.694
.000 80
.776
.000 79
Haddock .407 .000 75
.556
.000 84
.555
.000 78
.460
.000 67
.492
.000 60
.437
.000 69
.476
.000 63
Saithe .302 .044 45
.334
.038 39
.308
.037 46
.335
.026 44
.386
.009 45
-.010 .951 41
.256
.097 43
Whiting .496 .000 73
.138
.263 68
.402
.000 74
.451
.000 57
.222
.100 56
.573
.000 70
.271
.032 63
Sole .458 .000 87
.455
.000 80
.398
.000 82
.361
.001 77
.486
.000 69
.520
.000 74
.398
.000 74
Plaice .831 .000 98
.783
.000 100
.836
.000 93
.631
.000 84
.703
.000 82
.799
.000 85
.724
.000 89
Beam trawl
Nephrops .444 .065 18
.371
.261 11
-.152 .589 15
.249
.263 22
.131
.516 27
.329
.094 27
.498
.016 23
Cod .787 .000 133
.815
.000 122
.825
.000 128
.806
.000 130
.799
.000 125
.729
.000 114
.667
.000 114
Haddock .673 .000 118
.780
.000 107
.567
.000 111
.602
.000 116
.611
.000 110
.712
.000 106
.815
.000 98
Saithe .140 .172 97
.160
.126 93
.038
.713 98
-.181 .081 94
-.152 .161 87
-.025 .818 85
.102
.339 90
Whiting .737 .000 101
.816
.000 101
.788
.000 95
.713
.000 104
.757
.000 108
.775
.000 94
.672
.000 90
Sole .720 .000 60
.735
.000 47
.771
.000 53
.693
.000 56
.737
.000 58
.773
.000 50
.788
.000 48
Plaice .795 .000 110
.706
.000 105
.764
.000 92
.769
.000 89
.638
.000 105
.598
.000 93
.488
.000 105
Otter trawl targeting fish
Nephrops .593 .007 19
.667
.000 27
.424
.115 15
.422
.009 37
.711
.000 43
.778
.000 35
.772
.000 46
Cod .933 .000 17
.905
.000 17
.956
.000 14
.981
.000 16
.920
.000 12
.959
.000 12
.964
.000 12
Haddock .852 .001 11
.773
.000 18
.893
.000 13
.879
.000 17
.914
.000 11
.948
.000 13
.923
.000 11
Saithe .889 .044 5
.815
.393 3
.462
.538 4
.412
.358 7
-.105 .895 4
.401
.599 4
-.366 .634 4
Whiting .955 .000 14
.952
.000 16
.929
.000 12
.947
.000 15
.952
.000 11
.975
.000 10
.981
.000 7
Otter trawl targeting Nephrops
Sole .965 .000 12
.925
.000 12
.923
.000 11
.756
.007 11
.867
.001 11
.967
.000 8
.974
.001 6
Table 5.1.4.1: Relationship between spatially differentiated landings of demersal fish species and Nephrops (log10 transformed landings per ICES rectangle) related to fishing effort (log10 transformed effort data per ICES rectangle) from 1996 to 2002. Each cell gives the correlation coefficient (R), the significance value (p) and the number of ICES rectangles (n).
26

Relationships between TACs, Fish Landings and Fishing Effort in the North Sea
Plaice .889 .000 17
.867
.000 15
.892
.00015
.937
.000 15
.927
.000 12
.979
.00013
.861
.001 11
Nephrops .984 .000 19
.988
.000 22
.974
.00015
.985
.000 17
.988
.000 15
.970
.00015
.986
.000 13
Cod .781 .000 46
.750
.000 31
.674
.00044
.817
.000 31
.698
.000 28
.277
.19124
.508
.031 18
Haddock .472 .002 40
.455
.017 27
.309
.05938
.143
.477 27
.230
.303 22
.357
.14618
.380
.162 15
Saithe .265 .123 35
.232
.355 18
.160
.54117
.344
.193 16
.429
.336 7
n.a. .738 .472 3
Whiting .200 .318 27
.157
.509 20
.672
.00029
.713
.001 19
-.089.724 18
.880
.3153
-.003 .995 7
Sole .326 .150 21
-.041.948 5
.512
.1958
-.115.854 5
.562
.046 13
n.a. .566 .144 8
Plaice .796 .000 50
.843
.000 32
.749
.00041
.773
.000 31
.876
.000 28
.946
.00024
.876
.000 20
Seine net
Nephrops -.256 .744 4
n.a. n.a. n.a. .026 .943 10
n.a. .701 .505 3
Cod .756 .000 33
.791
.000 35
.849
.00029
.865
.000 35
.921
.000 32
.986
.0144
.972
.001 6
Haddock .573 .001 29
.914
.000 27
.925
.00020
.929
.000 24
.863
.000 26
.989
.0114
.955
.003 6
Saithe .134 .562 21
.496
.022 21
.332
.17818
.856
.000 22
.404
.045 25
.233
.8513
.916
.010 6
Whiting .562 .024 16
.543
.009 22
.846
.0346
.279
.380 12
.648
.002 20
.975
.0254
.986
.000 6
Sole .750 .052 7
.290
.637 5
.650
.1147
.539
.270 6
.656
.040 10
.927
.2443
.977
.004 5
Plaice .740 .000 28
.787
.000 31
.827
.00029
.922
.000 28
.911
.000 30
.951
.0494
.935
.020 5
Bottom pair trawl
Nephrops n.a. n.a. n.a. n.a. n.a. n.a. n.a.
Table 5.1.4.1: continued. Relationship between spatially differentiated landings of demersal fish species and Nephrops (log10 transformed landings per ICES rectangle) related to fishing effort (log10 transformed effort data per ICES rectangle) from 1996 to 2002. Each cell gives the correlation coefficient (R), the significance value (p) and the number of ICES rectangles (n). Landings of flatfish, which are mainly caught by beam trawling and to a lesser extent by otter trawling, were significantly correlated with the fishing effort of both gear types for all years from 1996 to 2002. Landings of Dover sole were also significantly correlated with otter trawling directed at Nephrops and landings of plaice were significantly correlated with all gear
27

Relationships between TACs, Fish Landings and Fishing Effort in the North Sea
types. Even as bycatch landings of these species show a strong positive relationship with the fishing effort of gear that does not target them. However, correlations for fishing gear not targeting the two species were based on data for as few as 3 out of 187 ICES rectangles and were, hence, of minor relevance. Landings of Nephrops per ICES rectangle were significantly correlated with the amount of otter trawling for fish and Nephrops in these rectangles. This suggests that where Nephrops is present in an area, otter trawlers will catch the species in proportion to their fishing effort. 5.1.5. Temporal relationships between landings and effort in space For each ICES rectangle, the relationship between English fishing effort and reported landings in each year between 1996 and 2002 was analysed (Figures 5.1.5.1 to 5.1.5.3). For each species the most important fishing method was analysed, i.e. otter trawling for cod, haddock, whiting, saithe and Nephrops (only otter trawling targeting Nephrops) and beam trawling for sole and plaice (see Figure 5.1.2.6). For cod no distinctive area with either high or low correlations between landings and fishing effort was found (Figure 5.1.5.1). The results for haddock and whiting were similar, but the correlation was generally higher in the central North Sea than in other regions (Figure 5.1.5.1). The scattered spatial patterns may be an indication of the mixed gadoid fisheries and the varying population strength of the species from year to year, requiring different fishing effort to catch the same amount of fish. The correlation of otter trawling effort and landings of saithe was high in offshore regions of the central North Sea and north and west of the Shetland Islands. In the far north saithe seems to drive the otter trawling effort (Figure 5.1.5.1). For flatfish the results are similar to the Dutch fleet. Targeting plaice seems to drive the beam trawl effort in eastern and northern parts of the southern North Sea, while sole determines the fishing effort along the Belgium, English and Dutch coast in the Southwest (Figure 5.1.5.2). Correlations between landings of Nephrops and the hours of otter trawling targeting Nephrops were predictably high for all Nephrops fishing grounds (Figure 5.1.5.3).
28

Relationships between TACs, Fish Landings and Fishing Effort in the North Sea
cod
-1 to -0.07-0.07 to 0.430.43 to 0.710.71 to 0.870.87 to 1
cod
-1 to -0.07-0.07 to 0.430.43 to 0.710.71 to 0.870.87 to 1
haddock
-0.97 to 0.010.01 to 0.420.42 to 0.710.71 to 0.860.86 to 1
haddock
-0.97 to 0.010.01 to 0.420.42 to 0.710.71 to 0.860.86 to 1
saithe
-0.82 to -0.17-0.17 to 0.390.39 to 0.640.64 to 0.850.85 to 0.99
whiting
-0.86 to -0.11-0.11 to 0.250.25 to 0.620.62 to 0.850.85 to 0.97
whiting
-0.86 to -0.11-0.11 to 0.250.25 to 0.620.62 to 0.850.85 to 0.97
Figure 5.1.5.1: Correlation between otter trawling effort and cod, haddock, saithe and whiting landings from 1996-2002 within each ICES rectangle.
29
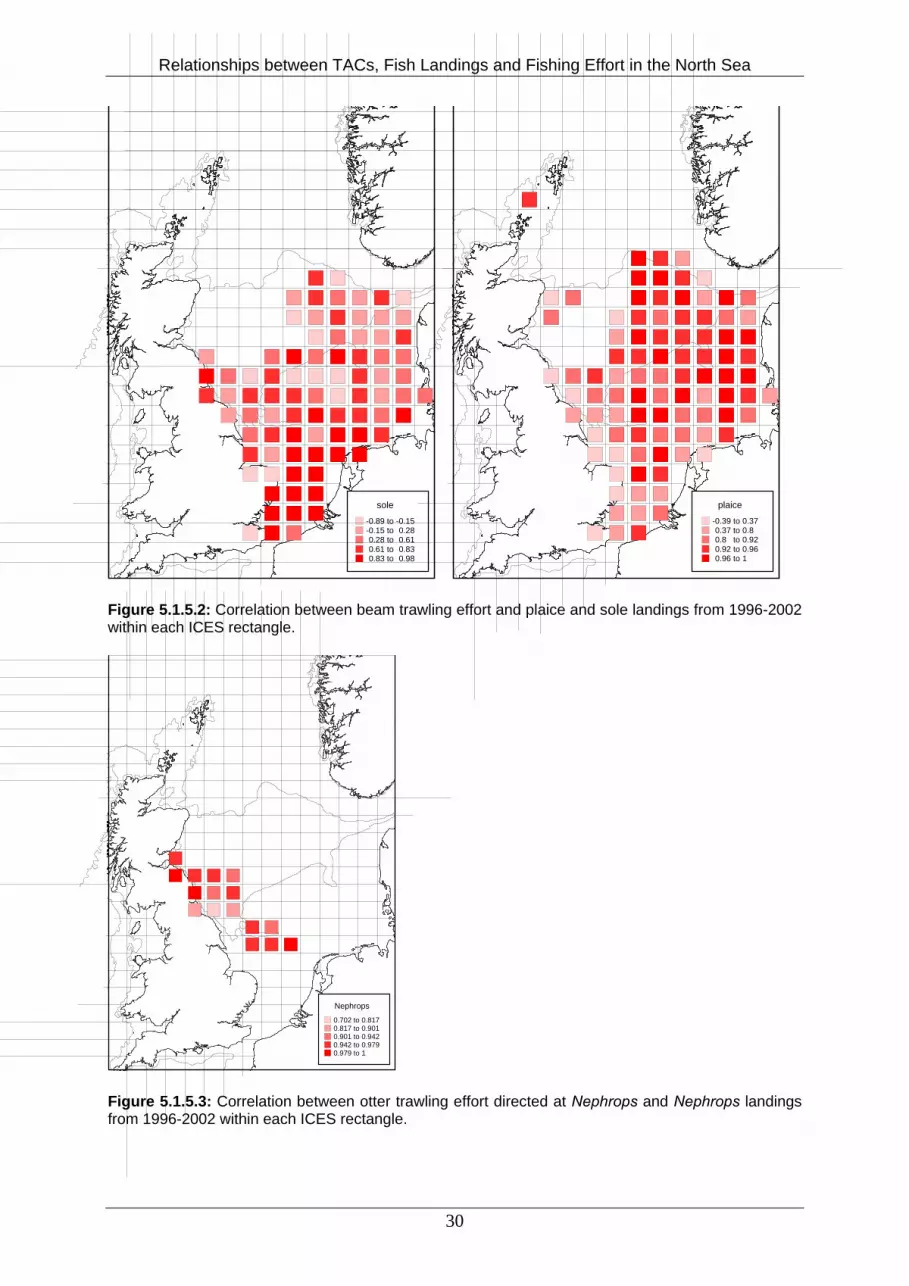
Relationships between TACs, Fish Landings and Fishing Effort in the North Sea
sole
-0.89 to -0.15-0.15 to 0.280.28 to 0.610.61 to 0.830.83 to 0.98
sole
-0.89 to -0.15-0.15 to 0.280.28 to 0.610.61 to 0.830.83 to 0.98
plaice
-0.39 to 0.370.37 to 0.80.8 to 0.920.92 to 0.960.96 to 1
plaice
-0.39 to 0.370.37 to 0.80.8 to 0.920.92 to 0.960.96 to 1
Figure 5.1.5.2: Correlation between beam trawling effort and plaice and sole landings from 1996-2002 within each ICES rectangle.
Nephrops
0.702 to 0.8170.817 to 0.9010.901 to 0.9420.942 to 0.9790.979 to 1
Nephrops
0.702 to 0.8170.817 to 0.9010.901 to 0.9420.942 to 0.9790.979 to 1
Figure 5.1.5.3: Correlation between otter trawling effort directed at Nephrops and Nephrops landings from 1996-2002 within each ICES rectangle.
30
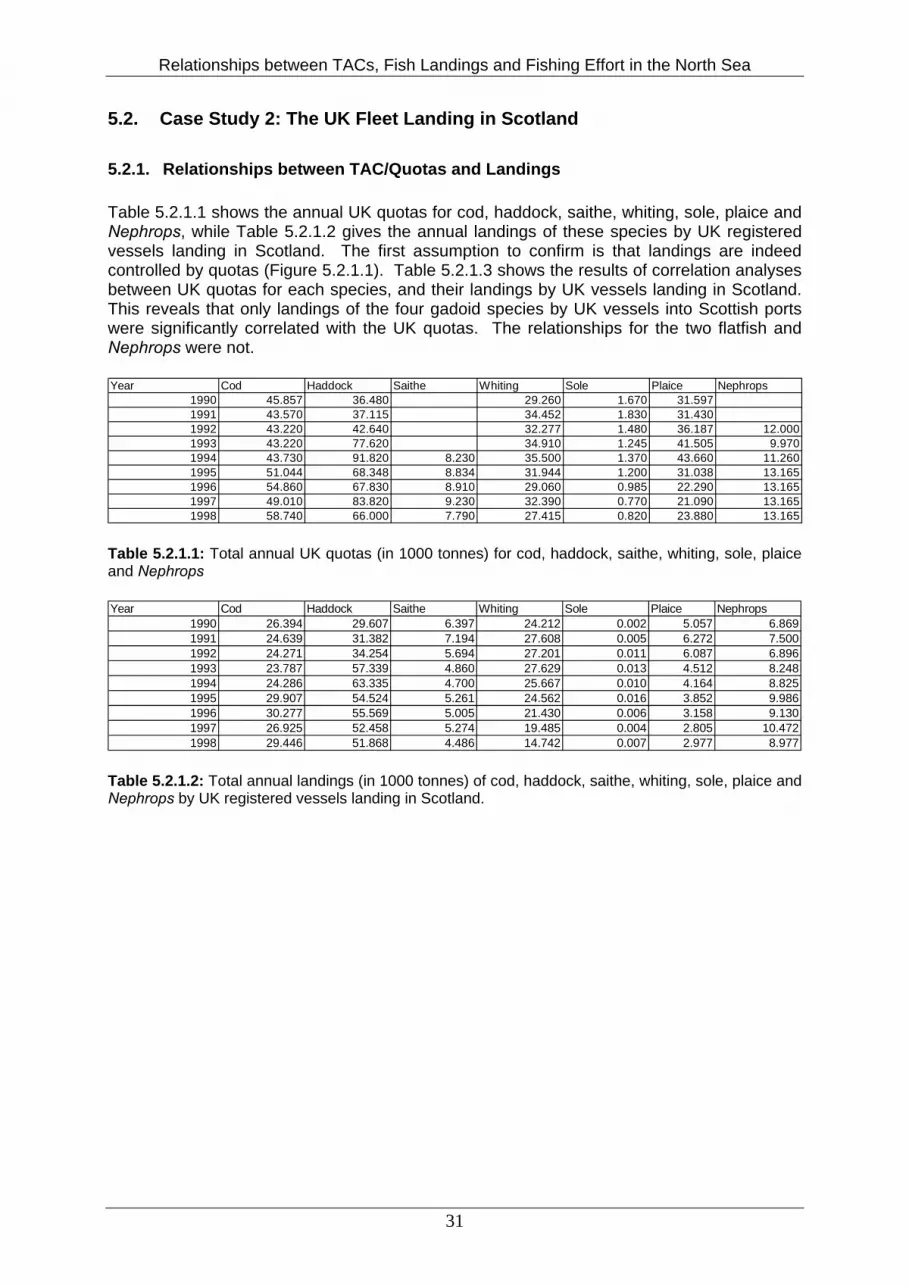
Relationships between TACs, Fish Landings and Fishing Effort in the North Sea
5.2. Case Study 2: The UK Fleet Landing in Scotland 5.2.1. Relationships between TAC/Quotas and Landings Table 5.2.1.1 shows the annual UK quotas for cod, haddock, saithe, whiting, sole, plaice and Nephrops, while Table 5.2.1.2 gives the annual landings of these species by UK registered vessels landing in Scotland. The first assumption to confirm is that landings are indeed controlled by quotas (Figure 5.2.1.1). Table 5.2.1.3 shows the results of correlation analyses between UK quotas for each species, and their landings by UK vessels landing in Scotland. This reveals that only landings of the four gadoid species by UK vessels into Scottish ports were significantly correlated with the UK quotas. The relationships for the two flatfish and Nephrops were not. Year Cod Haddock Saithe Whiting Sole Plaice Nephrops
1990 45.857 36.480 29.260 1.670 31.5971991 43.570 37.115 34.452 1.830 31.4301992 43.220 42.640 32.277 1.480 36.187 12.0001993 43.220 77.620 34.910 1.245 41.505 9.9701994 43.730 91.820 8.230 35.500 1.370 43.660 11.2601995 51.044 68.348 8.834 31.944 1.200 31.038 13.1651996 54.860 67.830 8.910 29.060 0.985 22.290 13.1651997 49.010 83.820 9.230 32.390 0.770 21.090 13.1651998 58.740 66.000 7.790 27.415 0.820 23.880 13.165
Table 5.2.1.1: Total annual UK quotas (in 1000 tonnes) for cod, haddock, saithe, whiting, sole, plaice and Nephrops Year Cod Haddock Saithe Whiting Sole Plaice Nephrops
1990 26.394 29.607 6.397 24.212 0.002 5.057 6.8691991 24.639 31.382 7.194 27.608 0.005 6.272 7.5001992 24.271 34.254 5.694 27.201 0.011 6.087 6.8961993 23.787 57.339 4.860 27.629 0.013 4.512 8.2481994 24.286 63.335 4.700 25.667 0.010 4.164 8.8251995 29.907 54.524 5.261 24.562 0.016 3.852 9.9861996 30.277 55.569 5.005 21.430 0.006 3.158 9.1301997 26.925 52.458 5.274 19.485 0.004 2.805 10.4721998 29.446 51.868 4.486 14.742 0.007 2.977 8.977
Table 5.2.1.2: Total annual landings (in 1000 tonnes) of cod, haddock, saithe, whiting, sole, plaice and Nephrops by UK registered vessels landing in Scotland.
31

Relationships between TACs, Fish Landings and Fishing Effort in the North Sea
40 44 48 52 56 60
22
24
26
28
30
32La
ndin
gs (x
1000
tonn
es)
1990
1991199219931994
1995 1996
1997
1998
20 40 60 80 100
20
30
40
50
60
70
199019911992
19931994
1995199619971998
7.6 8 8.4 8.8 9.2 9.6
4.4
4.6
4.8
5
5.2
5.4
Land
ings
(x10
00to
nnes
)
1994
1995
1996
1997
1998
26 28 30 32 34 36
12
16
20
24
28
1990
19911992 19931994
1995
19961997
1998
0.4 0.8 1.2 1.6 2
0
0.004
0.008
0.012
0.016
Land
ings
(x10
00to
nnes
)
1990
1991
19921993
1994
1995
19961997
1998
20 25 30 35 40 45UK Quota (x1000tonnes)
2
3
4
5
6
7
1990
1991 1992
19931994
19951996
19971998
9 10 11 12 13 14UK Quota (x1000tonnes)
6
7
8
9
10
11
Land
ings
(x10
00to
nnes
)
1992
19931994
1995
1996
1997
1998
Cod Haddock
Saithe Whiting
Plaice
Sole
Nephrops
Figure 5.2.1.1: Relationships between the annual reported landings of cod, haddock, saithe, whiting, sole, plaice and Nephrops by UK registered vessels landing in Scotland, and the UK quota for each species in each year.
32

Relationships between TACs, Fish Landings and Fishing Effort in the North Sea
Species R P n Cod +.914 .001 9 Haddock +.954 .000 9 Saithe +.948 .014 5 Whiting +.747 .021 9 Sole -.067 .863 9 Plaice +.544 .130 9 Nephrops +.540 .211 7 Table 5.2.1.3: Correlation coefficients relating UK quotas for cod, haddock, saithe, whiting, sole, plaice and Nephrops and their landings by UK registered vessels landing in Scottish ports over the period 1990 to 1998. Statistical significance of each correlation is indicated along with the number of years for which data were available. 5.2.2. Relationships between annual landings of key species reported for main gear
types and effort expended annually by each gear type. Four main gear types were considered: beam trawl, otter trawl directed at fish, otter trawl directed at Nephrops and seine net gear. Relationships between the landings of cod, haddock, saithe, whiting, sole, plaice and Nephrops reported in each year for each gear type, and the effort expended by these gears in each year, were examined (Figures 5.2.2.1 to 5.2.2.4). Results of correlation analyses are shown in Table 5.2.2.1. Significant correlations between beam trawl effort and landings from beam trawlers were observed for two species, plaice and haddock. For otter trawl directed at fish, none of the relationships between landings and effort were statistically significant. As expected, for otter trawl directed at Nephrops, the relationship between Nephrops landings and effort was significant, but none of the relationships between the landings of other species and effort were significant. Four significant relationships between seine net effort and landings by seine netters were detected, however, one of these, for Nephrops, was negative. Significant positive relationships were observed for whiting saithe and plaice. Species Beam Trawl Otter Trawl (fish) Otter Trawl (Nephrops) Seine Net Cod +.269 +.011 +.543 +.436 Haddock +.911** +.383 +.049 -.102 Saithe +.141 -.632 +.477 +.800* Whiting +.023 +.494 +.456 +.954*** Sole +.060 +.577 +.281 +.634 Plaice +.966*** +.111 +.519 +.820** Nephrops -.396 +.228 +.715* -.867** Table 5.2.2.1: Correlation coefficients for annual landing of cod, haddock, saithe, whiting, sole, plaice and Nephrops reported in each year for each gear type, and the effort expended by these gears in each year. Significance levels indicated as P<0.05*, P<0.01**, and P<0.001***.
33

Relationships between TACs, Fish Landings and Fishing Effort in the North Sea
0 10 20 30 40 50
40
80
120
160
200
240
Land
ings
(ton
nes)
1990
19911992
1993
19941995
1996
19971998
0 10 20 30 40 50
0
20
40
60
80
100
120
1990
1991
1992
19931994
19951996
19971998
0 10 20 30 40 50
0
1
2
3
4
Land
ings
(ton
nes)
19901991
19921993
1994
199519961997
1998
0 10 20 30 40 50
0
4
8
12
16
20
1990
1991 1992
19931994
19951996
1997
1998
0 10 20 30 40 50
0
4
8
12
16
Land
ings
(ton
nes)
19901991
19921993
1994
1995
199619971998
0 10 20 30 40 50Effort (x1000hrs)
0
400
800
1200
1600
2000
2400
1990
19911992
19931994
1995
199619971998
0 10 20 30 40 50Effort (x1000hrs)
0
4
8
12
Land
ings
(ton
nes)
1990 1991 199219931994
1995
1996
1997
1998
Beam Trawl
Cod Haddock
Saithe Whiting
PlaiceSole
Nephrops
Figure 5.2.2.1: Relationships between the annual reported landings of cod, haddock, saithe, whiting, sole, plaice and Nephrops caught in beam trawls, and the hours fished by beam trawlers in each year.
34
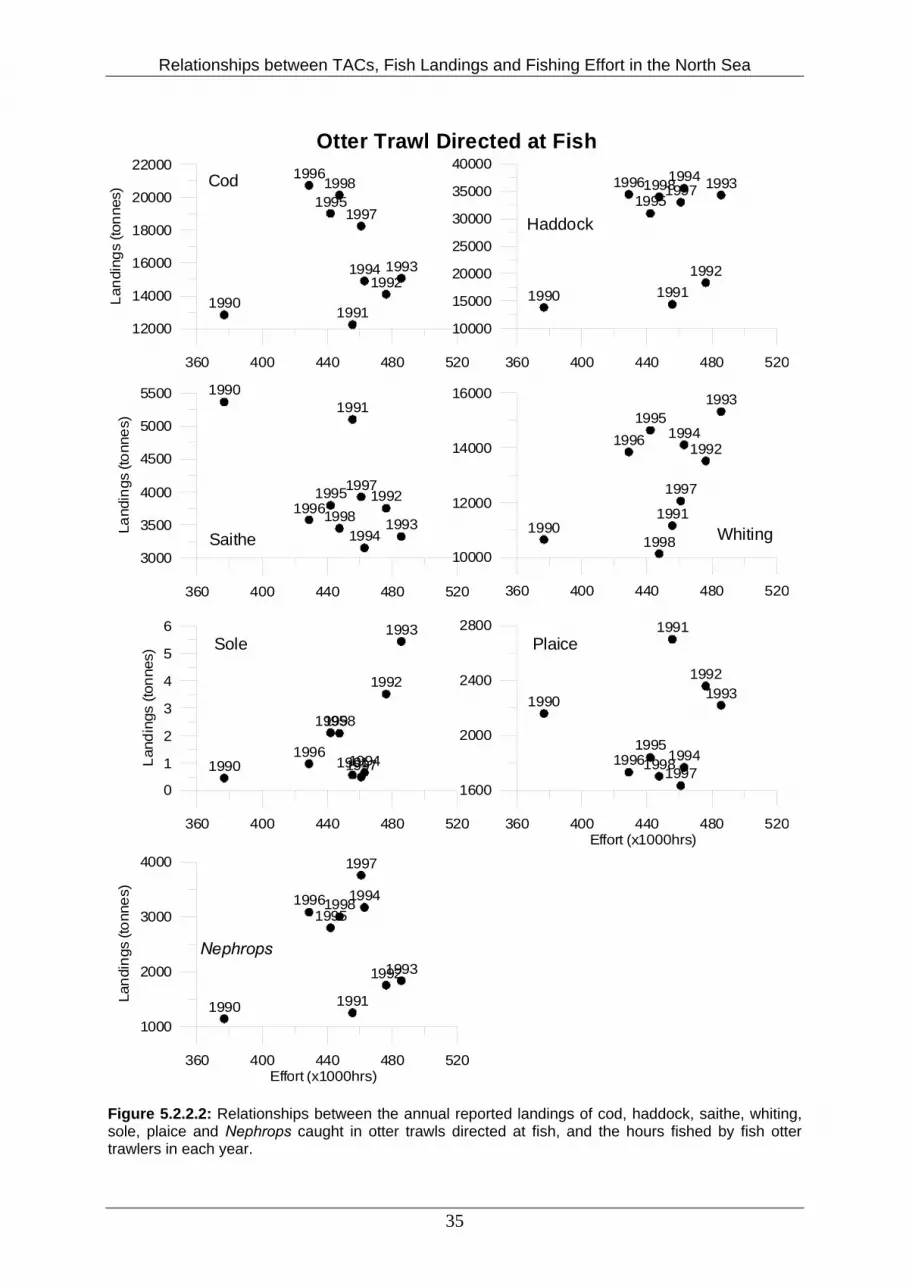
Relationships between TACs, Fish Landings and Fishing Effort in the North Sea
360 400 440 480 520
12000
14000
16000
18000
20000
22000
Land
ings
(ton
nes)
19901991
199219931994
1995
1996
1997
1998
360 400 440 480 520
10000
15000
20000
25000
30000
35000
40000
1990 19911992
19931994
19951996 19971998
360 400 440 480 520
3000
3500
4000
4500
5000
5500
Land
ings
(ton
nes)
19901991
1992
19931994
19951996
1997
1998
360 400 440 480 520
10000
12000
14000
16000
19901991
1992
1993
19941995
1996
1997
1998
360 400 440 480 520
0
1
2
3
4
5
6
Land
ings
(ton
nes)
1990 1991
1992
1993
1994
1995
19961997
1998
360 400 440 480 520Effort (x1000hrs)
1600
2000
2400
2800
1990
1991
19921993
19941995
199619971998
360 400 440 480 520Effort (x1000hrs)
1000
2000
3000
4000
Land
ings
(ton
nes)
1990 1991
19921993
19941995
1996
1997
1998
Otter Trawl Directed at Fish
Cod
Haddock
Saithe Whiting
PlaiceSole
Nephrops
Figure 5.2.2.2: Relationships between the annual reported landings of cod, haddock, saithe, whiting, sole, plaice and Nephrops caught in otter trawls directed at fish, and the hours fished by fish otter trawlers in each year.
35
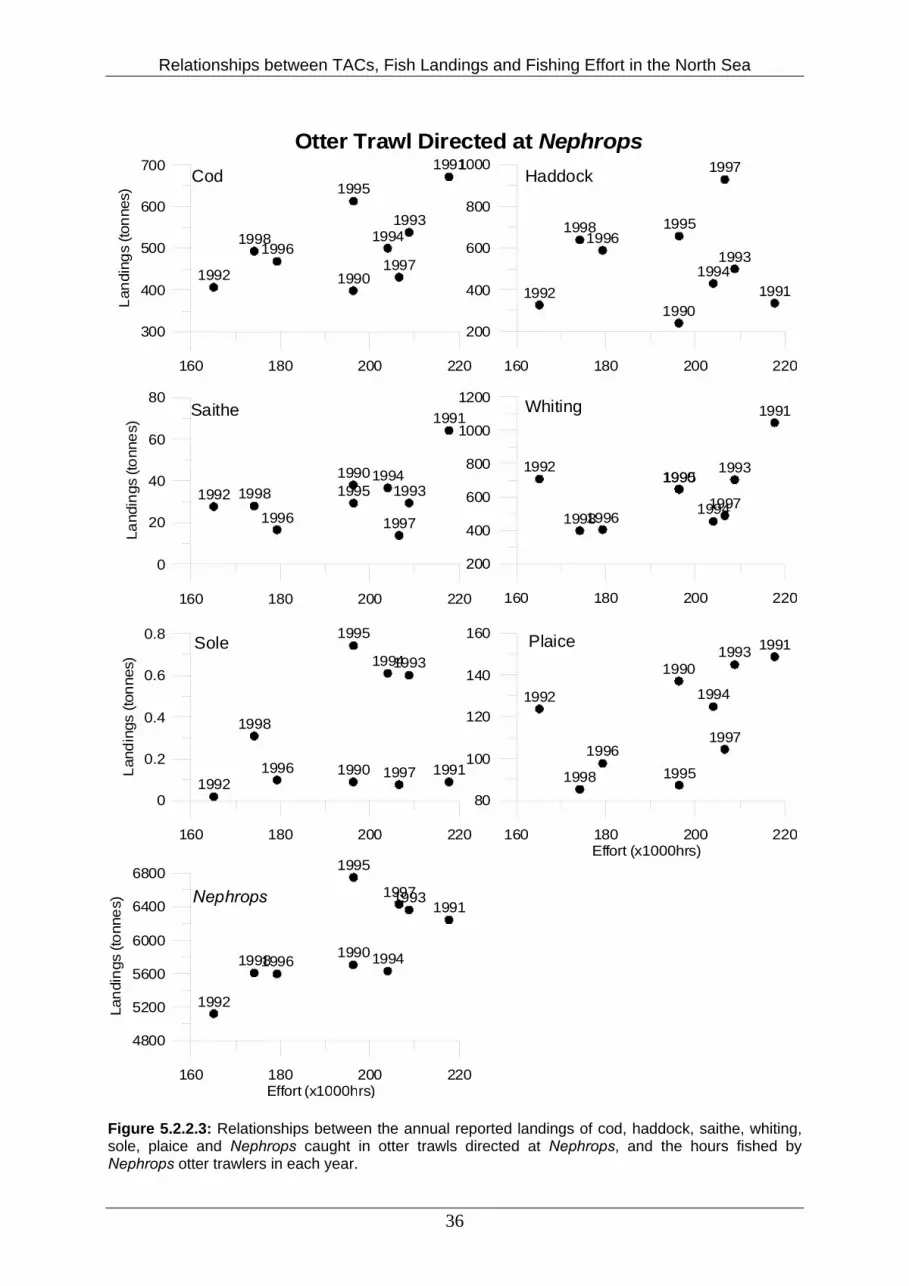
Relationships between TACs, Fish Landings and Fishing Effort in the North Sea
160 180 200 220
300
400
500
600
700
Land
ings
(ton
nes)
1990
1991
1992
19931994
1995
19961997
1998
160 180 200 220
200
400
600
800
1000
199019911992
19931994
19951996
1997
1998
160 180 200 220
0
20
40
60
80
Land
ings
(ton
nes)
1990
1991
1992 19931994
1995
1996 1997
1998
160 180 200 220
200
400
600
800
1000
1200
1990
1991
1992 1993
1994
1995
19961997
1998
160 180 200 220
0
0.2
0.4
0.6
0.8
Land
ings
(ton
nes)
1990 19911992
19931994
1995
1996 1997
1998
160 180 200 220Effort (x1000hrs)
80
100
120
140
160
1990
1991
1992
1993
1994
19951996
1997
1998
160 180 200 220Effort (x1000hrs)
4800
5200
5600
6000
6400
6800
Land
ings
(ton
nes)
1990
1991
1992
1993
1994
1995
1996
1997
1998
Otter Trawl Directed at NephropsCod Haddock
Saithe Whiting
PlaiceSole
Nephrops
Figure 5.2.2.3: Relationships between the annual reported landings of cod, haddock, saithe, whiting, sole, plaice and Nephrops caught in otter trawls directed at Nephrops, and the hours fished by Nephrops otter trawlers in each year.
36

Relationships between TACs, Fish Landings and Fishing Effort in the North Sea
120 160 200 240 280 320 360
6000
8000
10000
12000
14000
Land
ings
(ton
nes)
1990
1991
1992
19931994
1995
199619971998
120 160 200 240 280 320 360
12000
16000
20000
24000
28000
19901991
1992
1993
1994
1995
19961997
1998
120 160 200 240 280 320 360
800
1200
1600
2000
2400
Land
ings
(ton
nes)
1990
19911992
19931994199519961997
1998
120 160 200 240 280 320 360
4000
8000
12000
16000
1990
1991
199219931994
1995
19961997
1998
120 160 200 240 280 320 360
0
0.4
0.8
1.2
1.6
Land
ings
(ton
nes)
1990
1991
1992
1993199419951996
1997
1998
120 160 200 240 280 320 360Effort (x1000hrs)
400
800
1200
1600
20001990
199119921993
19941995
199619971998
120 160 200 240 280 320 360Effort (x1000hrs)
0
10
20
30
40
50
60
Land
ings
(ton
nes)
19901991
199219931994
19951996
1997
1998
Seine Net GearCod Haddock
Saithe Whiting
PlaiceSole
Nephrops
Figure 5.2.2.4: Relationships between the annual reported landings of cod, haddock, saithe, whiting, sole, plaice and Nephrops caught in seine nets, and the hours fished by seine netters in each year.
37

Relationships between TACs, Fish Landings and Fishing Effort in the North Sea
Landings of plaice are between two and three orders of magnitude larger than sole (Table 5.2.1.2). It is likely therefore that the targeting of plaice directly influenced the small UK beam trawler fleet landing in Scotland, thereby explaining the significant correlation between landings and effort for this species and gear. Catches of sole, Nephrops, and the four commercial gadoid species taken by beam trawlers were effectively taken as part of the bycatch, and as such a significant correlation between landings and effort might not be expected. With the exception of haddock, this was what was observed. This correlation is difficult to explain in terms of the strategies and behaviour of the fishermen involved, since landings of haddock taken by beam trawlers in each year made up less than 0.5% of total annual haddock landings (Figure 5.2.2.5). It is possible that temporal and spatial variation in the abundance and distributions of plaice and haddock co-varied closely, thus providing a spurious significant correlation. The total landings of sole are too small to have influenced the behaviour of beam trawl fishermen, nevertheless, beam trawl caught sole made up the greater fraction of all sole landed in each year (Figure 5.2.2.5). Otter trawl effort directed at fish accounted for a substantial part of the total annual landings of all species (Figure 5.2.2.6). Despite this, none of the relationships between fish otter trawl effort and landings were statistically significant (Table 5.2.2.1). Not surprisingly, Nephrops trawlers accounted for over 60% of the total annual landings of Nephrops, and less than 5% of the total annual landings of the six fish species (Figure 5.2.2.7). Nephrops trawlers exclusively target Nephrops, consequently the significant correlation between landings of this species and effort by these fishermen, and the lack of any significant correlation for the six fish species, is entirely to be expected. Seine net gears accounted for a substantial fraction of the total annual landings of cod, whiting, haddock saithe and plaice (Figure 5.2.2.8). Less than 1% of the total Nephrops landing was taken by this gear, and the significant relationship between landings and effort for this species and gear indicated in Table 5.2.1.1 is most likely spurious. Three significant positive relationships between seine net effort and landings were detected; for saithe, whiting and plaice. Of these species, both total annual landings (Table 5.2.1.2), and the proportion of the total landings taken by this gear (Figure 5.2.2.8), were largest for whiting. It is likely therefore that the targeting of whiting had the greatest influence on seine net activity. Otter trawl directed at fish in each year was not correlated with the annual landings of any one species. This fishing activity by UK registered vessels landing in Scotland has traditionally been a mixed fishery operation targeted primarily at gadoid species. The possibility that effort with this gear might be correlated with landings of combinations of these species was therefore examined (Figure 5.2.2.9). Once again, however, no significant correlations were detected (Table 5.2.2.2). Combined Landings of: Correlation Coefficient Cod and Haddock +.303 Cod and Whiting +.246 Haddock and Whiting +.436 Cod, Haddock and Whiting +.355 Table 5.2.2.2: Correlation coefficients for annual landing of combinations of gadoid species and annual otter trawl effort directed at fish. Significance levels indicated as P<0.05*, P<0.01**, and P<0.001***.
38
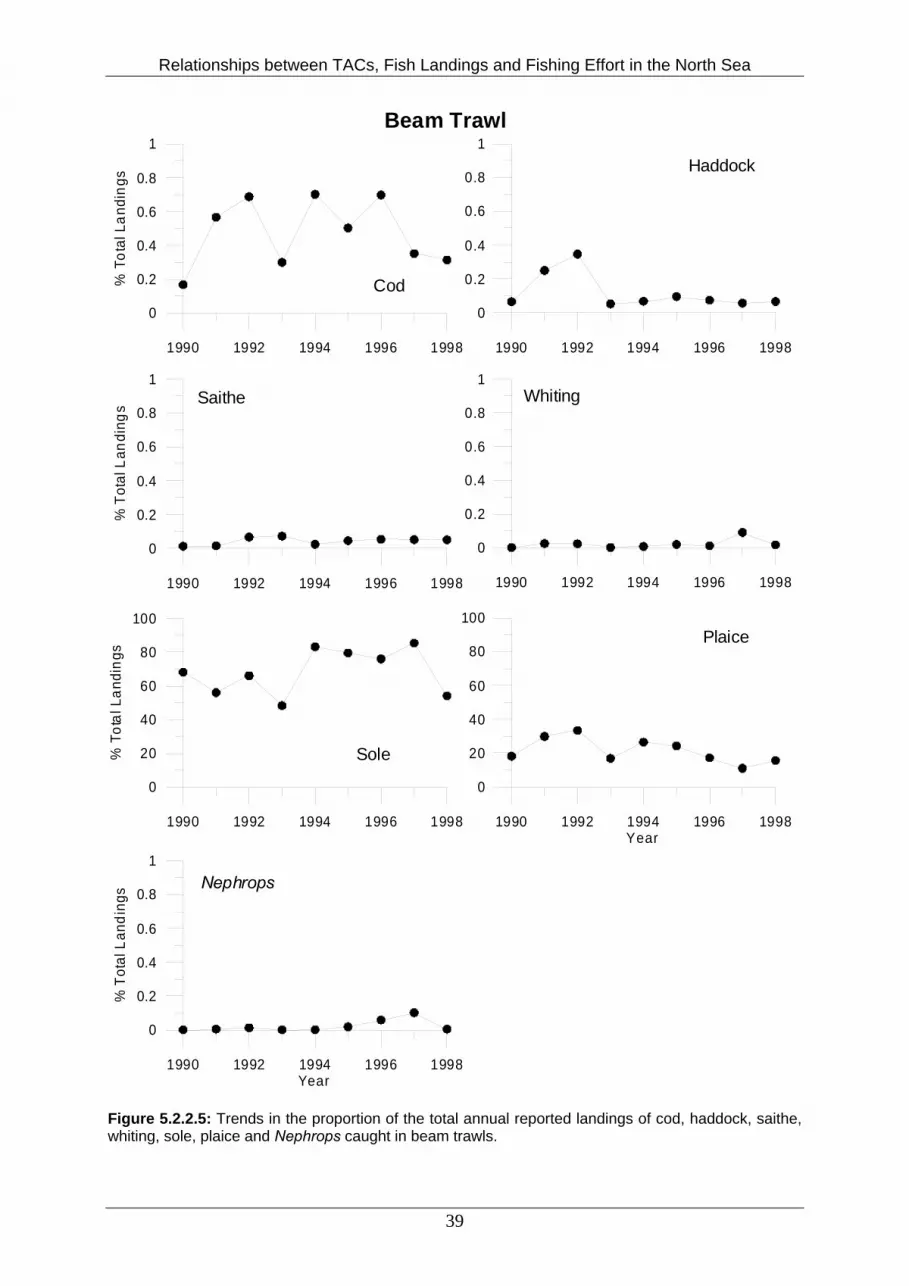
Relationships between TACs, Fish Landings and Fishing Effort in the North Sea
1990 1992 1994 1996 1998
0
0.2
0.4
0.6
0.8
1%
Tot
al L
andi
ngs
1990 1992 1994 1996 1998
0
0.2
0.4
0.6
0.8
1
1990 1992 1994 1996 1998
0
0.2
0.4
0.6
0.8
1
% T
otal
Lan
ding
s
1990 1992 1994 1996 1998
0
0.2
0.4
0.6
0.8
1
1990 1992 1994 1996 1998
0
20
40
60
80
100
% T
otal
Lan
ding
s
1990 1992 1994 1996 1998Year
0
20
40
60
80
100
1990 1992 1994 1996 1998Year
0
0.2
0.4
0.6
0.8
1
% T
otal
Lan
ding
sBeam Trawl
Cod
Haddock
Saithe Whiting
Plaice
Sole
Nephrops
Figure 5.2.2.5: Trends in the proportion of the total annual reported landings of cod, haddock, saithe, whiting, sole, plaice and Nephrops caught in beam trawls.
39
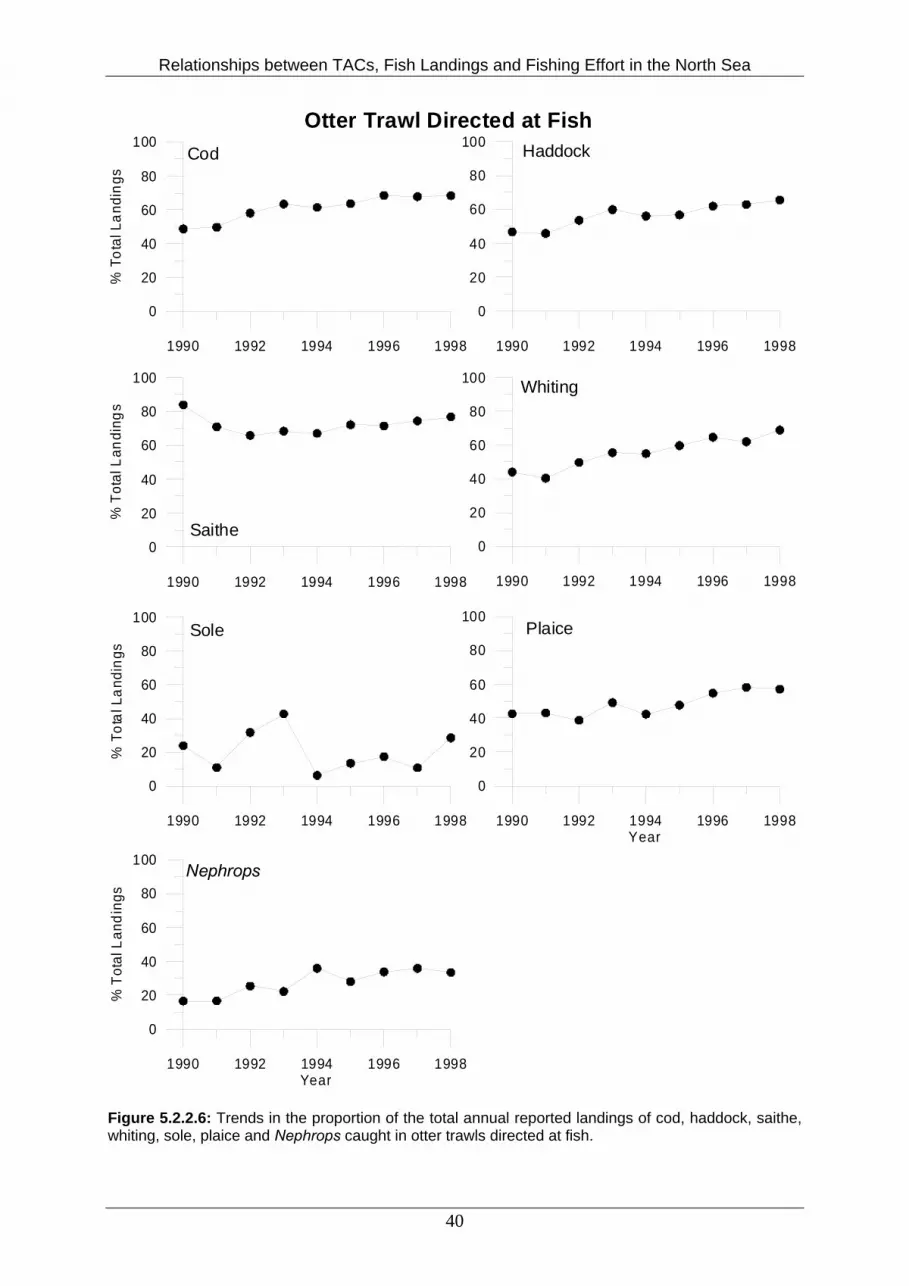
Relationships between TACs, Fish Landings and Fishing Effort in the North Sea
1990 1992 1994 1996 1998
0
20
40
60
80
100
% T
otal
Lan
ding
s
1990 1992 1994 1996 1998
0
20
40
60
80
100
1990 1992 1994 1996 1998
0
20
40
60
80
100
% T
otal
Lan
ding
s
1990 1992 1994 1996 1998
0
20
40
60
80
100
1990 1992 1994 1996 1998
0
20
40
60
80
100
% T
otal
Lan
ding
s
1990 1992 1994 1996 1998Year
0
20
40
60
80
100
1990 1992 1994 1996 1998Year
0
20
40
60
80
100
% T
otal
Lan
ding
sOtter Trawl Directed at Fish
Cod Haddock
Saithe
Whiting
PlaiceSole
Nephrops
Figure 5.2.2.6: Trends in the proportion of the total annual reported landings of cod, haddock, saithe, whiting, sole, plaice and Nephrops caught in otter trawls directed at fish.
40
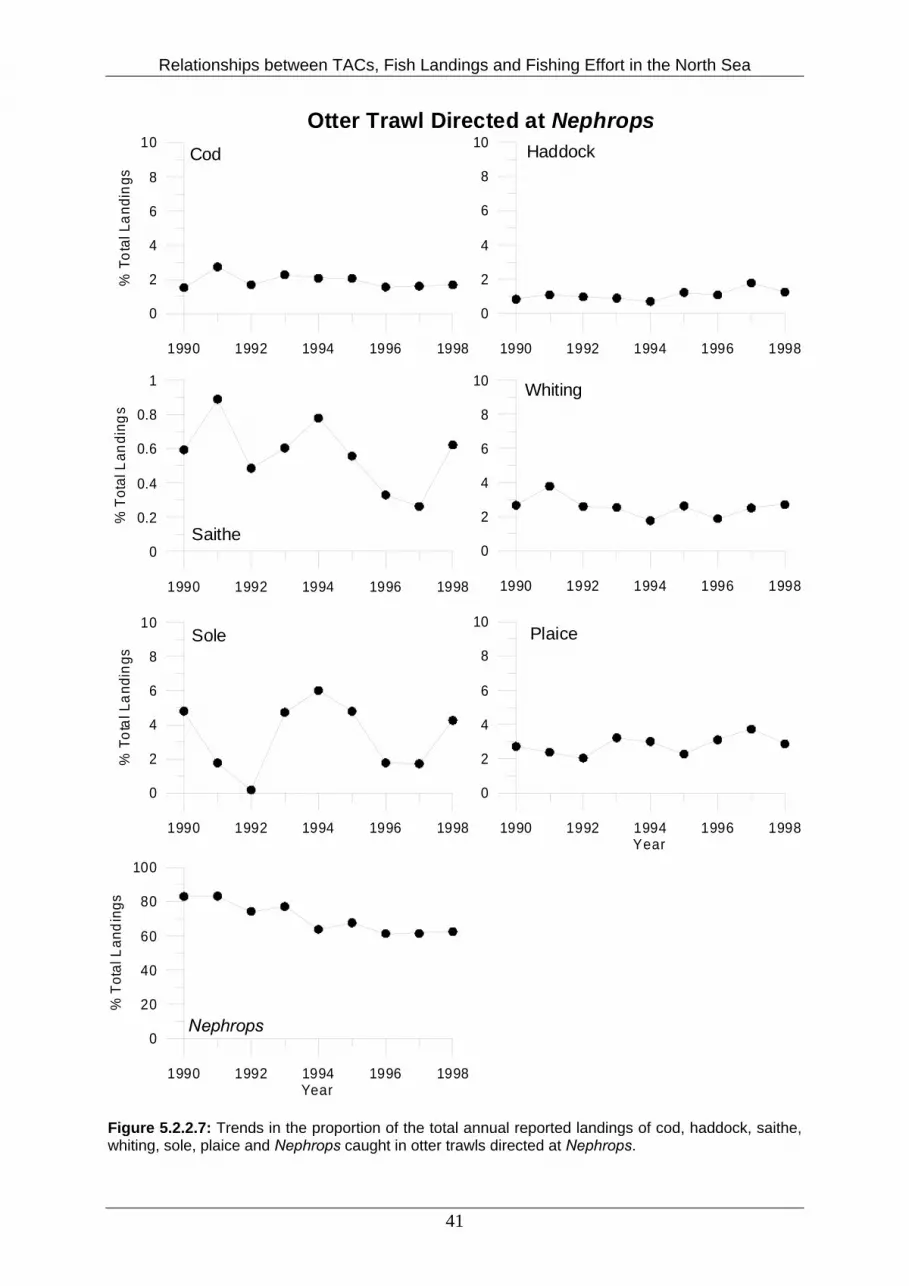
Relationships between TACs, Fish Landings and Fishing Effort in the North Sea
1990 1992 1994 1996 1998
0
2
4
6
8
10%
Tot
al L
andi
ngs
1990 1992 1994 1996 1998
0
2
4
6
8
10
1990 1992 1994 1996 1998
0
0.2
0.4
0.6
0.8
1
% T
otal
Lan
ding
s
1990 1992 1994 1996 1998
0
2
4
6
8
10
1990 1992 1994 1996 1998
0
2
4
6
8
10
% T
otal
Lan
ding
s
1990 1992 1994 1996 1998Year
0
2
4
6
8
10
1990 1992 1994 1996 1998Year
0
20
40
60
80
100
% T
otal
Lan
ding
sOtter Trawl Directed at Nephrops
Cod Haddock
Saithe
Whiting
PlaiceSole
Nephrops
Figure 5.2.2.7: Trends in the proportion of the total annual reported landings of cod, haddock, saithe, whiting, sole, plaice and Nephrops caught in otter trawls directed at Nephrops.
41
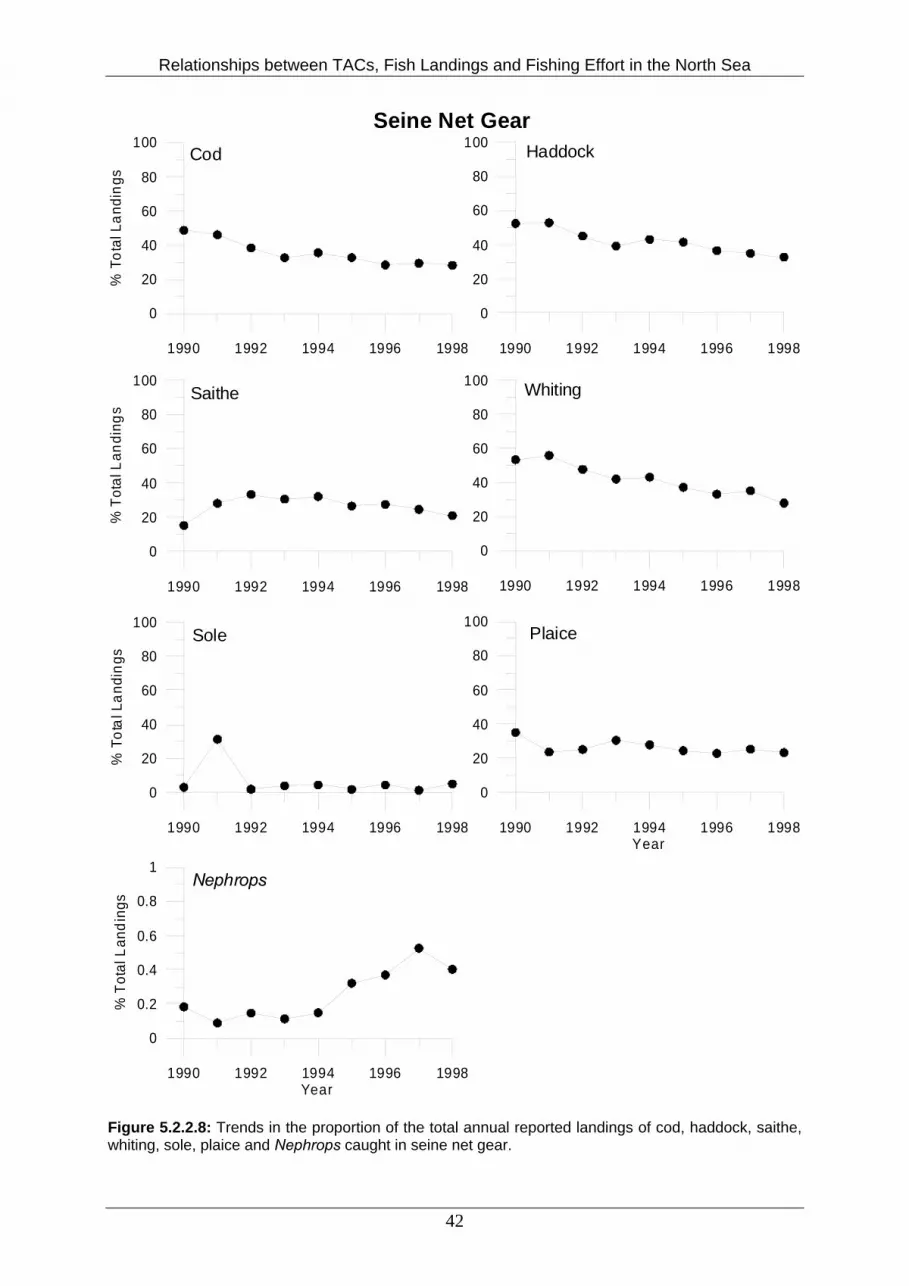
Relationships between TACs, Fish Landings and Fishing Effort in the North Sea
1990 1992 1994 1996 1998
0
20
40
60
80
100
% T
otal
Lan
ding
s
1990 1992 1994 1996 1998
0
20
40
60
80
100
1990 1992 1994 1996 1998
0
20
40
60
80
100
% T
otal
Lan
ding
s
1990 1992 1994 1996 1998
0
20
40
60
80
100
1990 1992 1994 1996 1998
0
20
40
60
80
100
% T
otal
Lan
ding
s
1990 1992 1994 1996 1998Year
0
20
40
60
80
100
1990 1992 1994 1996 1998Year
0
0.2
0.4
0.6
0.8
1
% T
otal
Lan
ding
sSeine Net Gear
Cod Haddock
Saithe Whiting
PlaiceSole
Nephrops
Figure 5.2.2.8: Trends in the proportion of the total annual reported landings of cod, haddock, saithe, whiting, sole, plaice and Nephrops caught in seine net gear.
42

Relationships between TACs, Fish Landings and Fishing Effort in the North Sea
360 400 440 480 520
20000
30000
40000
50000
60000
Land
ings
(ton
nes)
1990 1991
1992
199319941995
1996
1997
1998
360 400 440 480 520
20000
24000
28000
32000
36000
1990 1991
1992
1993
1994
19951996
19971998
360 400 440 480 520Effort (x1000hrs)
20000
30000
40000
50000
Land
ings
(ton
nes)
19901991
1992
19931994
1995
1996
19971998
360 400 440 480 520Effort (x1000hrs)
30000
40000
50000
60000
70000
1990 1991
1992
199319941995
1996
19971998
Otter Trawl Directed at Fish
Cod and Haddock Cod and Whiting
Haddock and Whiting Cod, Haddock and Whiting
Figure 5.2.2.9: Relationships between the annual reported landings of combinations cod and haddock, cod and whiting, haddock and whiting, and cod, haddock and whiting caught in otter trawls directed at fish, and the hours fished by fish otter trawlers in each year.
43
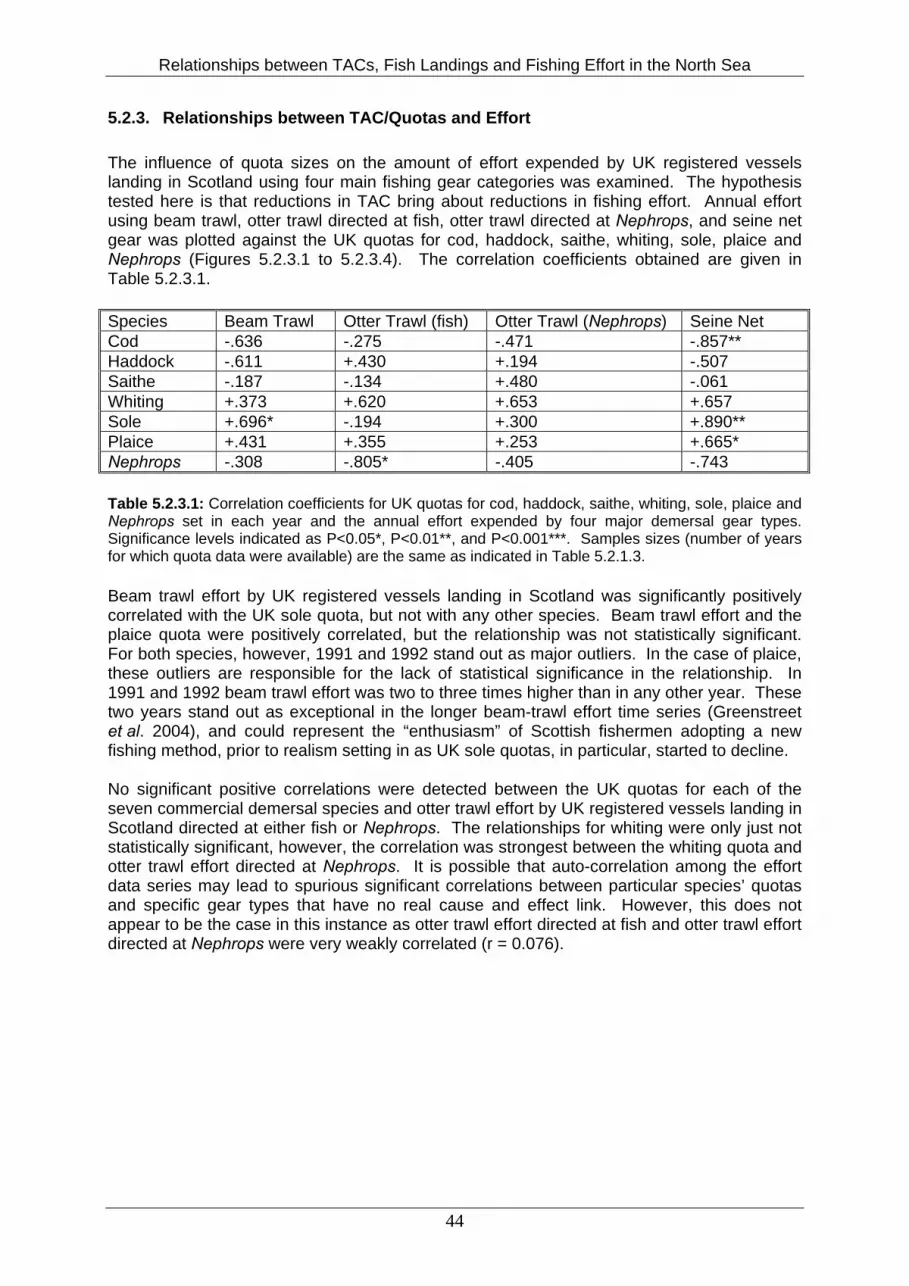
Relationships between TACs, Fish Landings and Fishing Effort in the North Sea
5.2.3. Relationships between TAC/Quotas and Effort The influence of quota sizes on the amount of effort expended by UK registered vessels landing in Scotland using four main fishing gear categories was examined. The hypothesis tested here is that reductions in TAC bring about reductions in fishing effort. Annual effort using beam trawl, otter trawl directed at fish, otter trawl directed at Nephrops, and seine net gear was plotted against the UK quotas for cod, haddock, saithe, whiting, sole, plaice and Nephrops (Figures 5.2.3.1 to 5.2.3.4). The correlation coefficients obtained are given in Table 5.2.3.1. Species Beam Trawl Otter Trawl (fish) Otter Trawl (Nephrops) Seine Net Cod -.636 -.275 -.471 -.857** Haddock -.611 +.430 +.194 -.507 Saithe -.187 -.134 +.480 -.061 Whiting +.373 +.620 +.653 +.657 Sole +.696* -.194 +.300 +.890** Plaice +.431 +.355 +.253 +.665* Nephrops -.308 -.805* -.405 -.743 Table 5.2.3.1: Correlation coefficients for UK quotas for cod, haddock, saithe, whiting, sole, plaice and Nephrops set in each year and the annual effort expended by four major demersal gear types. Significance levels indicated as P<0.05*, P<0.01**, and P<0.001***. Samples sizes (number of years for which quota data were available) are the same as indicated in Table 5.2.1.3. Beam trawl effort by UK registered vessels landing in Scotland was significantly positively correlated with the UK sole quota, but not with any other species. Beam trawl effort and the plaice quota were positively correlated, but the relationship was not statistically significant. For both species, however, 1991 and 1992 stand out as major outliers. In the case of plaice, these outliers are responsible for the lack of statistical significance in the relationship. In 1991 and 1992 beam trawl effort was two to three times higher than in any other year. These two years stand out as exceptional in the longer beam-trawl effort time series (Greenstreet et al. 2004), and could represent the “enthusiasm” of Scottish fishermen adopting a new fishing method, prior to realism setting in as UK sole quotas, in particular, started to decline. No significant positive correlations were detected between the UK quotas for each of the seven commercial demersal species and otter trawl effort by UK registered vessels landing in Scotland directed at either fish or Nephrops. The relationships for whiting were only just not statistically significant, however, the correlation was strongest between the whiting quota and otter trawl effort directed at Nephrops. It is possible that auto-correlation among the effort data series may lead to spurious significant correlations between particular species’ quotas and specific gear types that have no real cause and effect link. However, this does not appear to be the case in this instance as otter trawl effort directed at fish and otter trawl effort directed at Nephrops were very weakly correlated (r = 0.076).
44
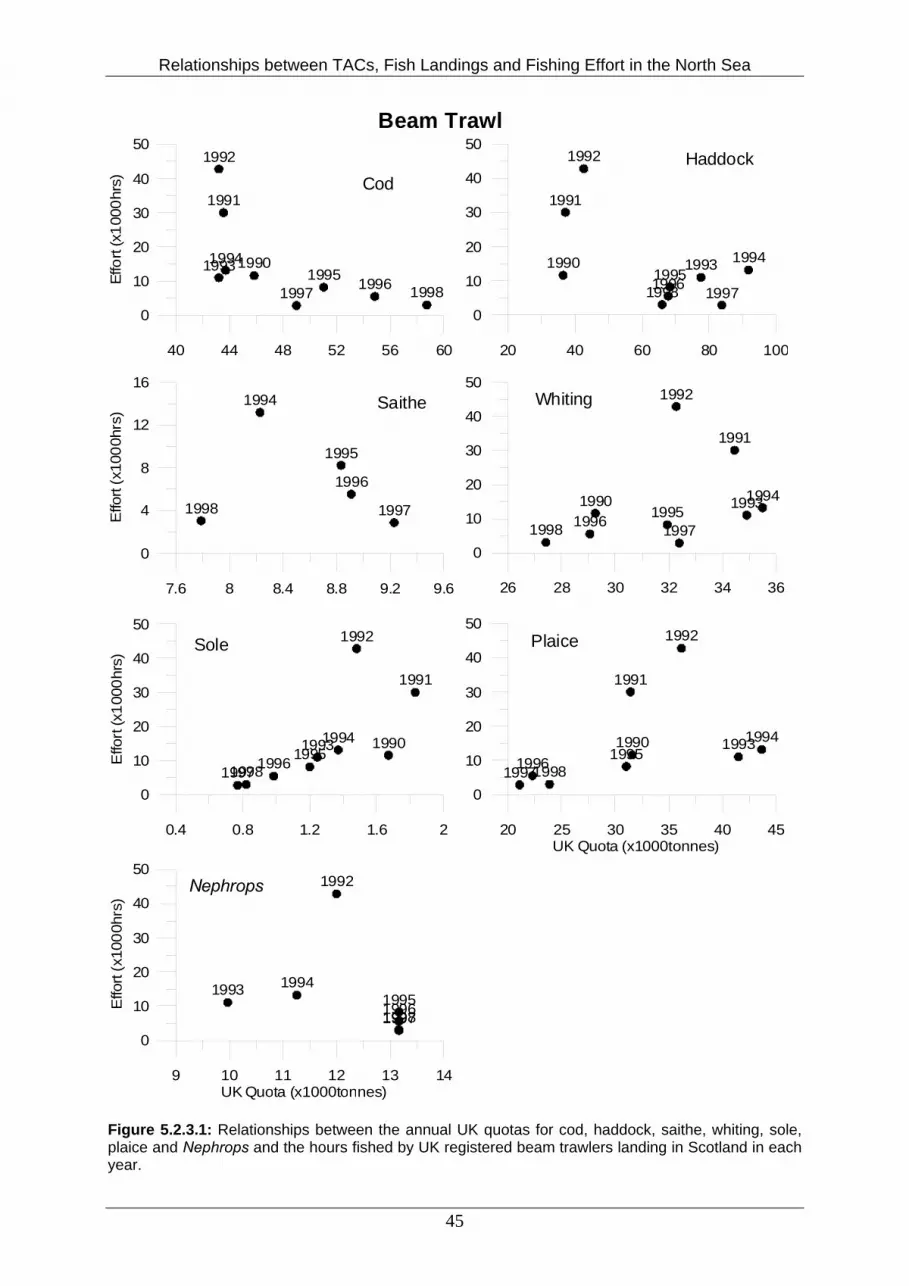
Relationships between TACs, Fish Landings and Fishing Effort in the North Sea
40 44 48 52 56 60
0
10
20
30
40
50
Effo
rt (x
1000
hrs)
1990
1991
1992
199319941995 19961997 1998
20 40 60 80 100
0
10
20
30
40
50
1990
1991
1992
1993 199419951996 19971998
7.6 8 8.4 8.8 9.2 9.6
0
4
8
12
16
Effo
rt (x
1000
hrs)
1994
1995
1996
19971998
26 28 30 32 34 36
0
10
20
30
40
50
1990
1991
1992
1993199419951996 19971998
0.4 0.8 1.2 1.6 2
0
10
20
30
40
50
Effo
rt (x
1000
hrs)
1990
1991
1992
199319941995199619971998
20 25 30 35 40 45UK Quota (x1000tonnes)
0
10
20
30
40
50
1990
1991
1992
199319941995199619971998
9 10 11 12 13 14UK Quota (x1000tonnes)
0
10
20
30
40
50
Effo
rt (x
1000
hrs)
1992
1993 19941995199619971998
Beam Trawl
CodHaddock
Saithe Whiting
PlaiceSole
Nephrops
Figure 5.2.3.1: Relationships between the annual UK quotas for cod, haddock, saithe, whiting, sole, plaice and Nephrops and the hours fished by UK registered beam trawlers landing in Scotland in each year.
45
Relationships between TACs, Fish Landings and Fishing Effort in the North Sea
40 44 48 52 56 60
360
400
440
480
520
Effo
rt (x
1000
hrs)
1990
1991199219931994
19951996
19971998
20 40 60 80 100
360
400
440
480
520
1990
19911992
1993
199419951996
19971998
7.6 8 8.4 8.8 9.2 9.6
420
430
440
450
460
470
Effo
rt (x
1000
hrs)
1994
1995
1996
1997
1998
26 28 30 32 34 36
360
400
440
480
520
1990
19911992
19931994
19951996
19971998
0.4 0.8 1.2 1.6 2
360
400
440
480
520
Effo
rt (x
1000
hrs)
1990
19911992
19931994
19951996
19971998
20 25 30 35 40 45UK Quota (x1000 tonnes)
360
400
440
480
520
1990
19911992
1993
19941995
1996
19971998
9 10 11 12 13 14UK Quota (x1000tonnes)
420
440
460
480
500
Effo
rt (x
1000
hrs) 1992
1993
1994
1995
1996
1997
1998
Otter Trawl Directed at Fish
Cod Haddock
Saithe Whiting
PlaiceSole
Nephrops
Figure 5.2.3.2: Relationships between the annual UK quotas for cod, haddock, saithe, whiting, sole, plaice and Nephrops and the hours fished by UK registered otter trawlers fishing for fish landing in Scotland in each year.
46

Relationships between TACs, Fish Landings and Fishing Effort in the North Sea
40 44 48 52 56 60
160
180
200
220
Effo
rt (x
1000
hrs)
1990
1991
1992
19931994
1995
1996
1997
1998
20 40 60 80 100
160
180
200
220
1990
1991
1992
19931994
1995
1996
1997
1998
7.6 8 8.4 8.8 9.2 9.6
170
180
190
200
210
Effo
rt (x
1000
hrs)
1994
1995
1996
1997
1998
26 28 30 32 34 36
160
180
200
220
1990
1991
1992
19931994
1995
1996
1997
1998
0.4 0.8 1.2 1.6 2
160
180
200
220
Effo
rt (x
1000
hrs)
1990
1991
1992
19931994
1995
1996
1997
1998
20 25 30 35 40 45UK Quota (x1000tonnes)
160
180
200
220
1990
1991
1992
19931994
1995
1996
1997
1998
9 10 11 12 13 14UK Quota (x1000tonnes)
160
170
180
190
200
210
Effo
rt (x
1000
hrs)
1992
19931994
1995
1996
1997
1998
Otter Trawl Directed at Nephrops
Cod
Haddock
Saithe
Whiting
PlaiceSole
Nephrops
Figure 5.2.3.3: Relationships between the annual UK quotas for cod, haddock, saithe, whiting, sole, plaice and Nephrops and the hours fished by UK registered otter trawlers fishing for Nephrops landing in Scotland in each year.
47

Relationships between TACs, Fish Landings and Fishing Effort in the North Sea
40 44 48 52 56 60
120
160
200
240
280
320
360
Effo
rt (x
1000
hrs)
1990
1991
1992
19931994
199519961997
1998
20 40 60 80 100
120
160
200
240
280
320
360
1990
19911992
1993 1994
19951996 1997
1998
7.6 8 8.4 8.8 9.2 9.6
120
160
200
240
280
Effo
rt (x
1000
hrs) 1994
1995
1996 19971998
26 28 30 32 34 36
120
160
200
240
280
320
360
1990
1991
1992
19931994
19951996 1997
1998
0.4 0.8 1.2 1.6 2
120
160
200
240
280
320
360
Effo
rt (x
1000
hrs)
1990
19911992
19931994
199519961997
1998
20 25 30 35 40 45UK Quota (x1000tonnes)
120
160
200
240
280
320
360
1990
19911992
19931994
199519961997
1998
9 10 11 12 13 14UK Quota (x1000tonnes)
120
160
200
240
280
320
Effo
rt (x
1000
hrs)
1992
1993 1994
1995199619971998
Seine Net Gear
CodHaddock
Saithe Whiting
PlaiceSole
Nephrops
Figure 5.2.3.4: Relationships between the annual UK quotas for cod, haddock, saithe, whiting, sole, plaice and Nephrops and the hours fished by UK registered seine netters landing in Scotland in each year.
48

Relationships between TACs, Fish Landings and Fishing Effort in the North Sea
49
Use of seine net gear by UK registered vessels landing in Scotland was significantly positively correlated with variation in the UK quotas for sole and plaice. The extent to which this gear is used to target plaice and sole is not clear. Generally less than 10% of the total annual landings of sole are taken by seine netters, but around 20 to 30% of the annual plaice landing is taken in seine nets (Figure 5.2.2.8). Once again the relationship was almost, but not quite significant for whiting. As with the two otter trawl gears, just the slight increase in statistical power associated with the addition of one or two years more data, would probably have resulted in statistically significant results. Seine net effort was negatively correlated with cod, haddock and Nephrops quotas, and in the case of cod this relationship was statistically significant. The strong correlation for Nephrops was only just not significant, and this was because the sample size was smaller. It is difficult to explain these strong negative correlations, except to suggest that these are spurious, resulting from the fact that this is a fishing method in decline over a period when quotas for these species have increased. One major conclusion can be drawn from this analysis. Changes in the quotas of the four major commercial gadoid species has had no significant impact on the amount of effort expended by UK registered vessels landing in Scotland using any of the four different gear type categories, at least in the direction anticipated by the stated hypothesis. 5.2.4. Spatial relationships between landings and effort in time Reported landings of each species caught by each main gear type in each ICES statistical rectangle was plotted against the annual hours of fishing by each gear in each rectangle. Both variables were first log-transformed in an attempt to normalise the data distributions. This was done for each year over the period 1990 to 1998 for which data were available (Figures 5.2.4.1 to 5.2.4.8). R2 correlation values are given in Table 5.2.4.1. Of 252 individual correlations only 31 were not statistically significant at the P=0.05 significance level. The relationships for Nephrops taken in beam trawl and for Dover sole taken in seine net were not significant in any of the nine years, accounting for 18 of the non-significant relationships. Eight of the 13 remaining non-significant relationships also involved Dover sole. The remaining five non-significant relationships involved saithe and whiting taken by beam trawl. The spatial relationships between log-effort and log-landings of cod, haddock and plaice were statistically significant in all years for all gears. Likewise, the relationships for whiting and saithe taken by otter trawls directed at both fish and Nephrops and in Seine Net were also statistically significant in all years. Figure 5.2.4.9 shows the mean R2 values (± one standard deviation) for each species taken by each gear.
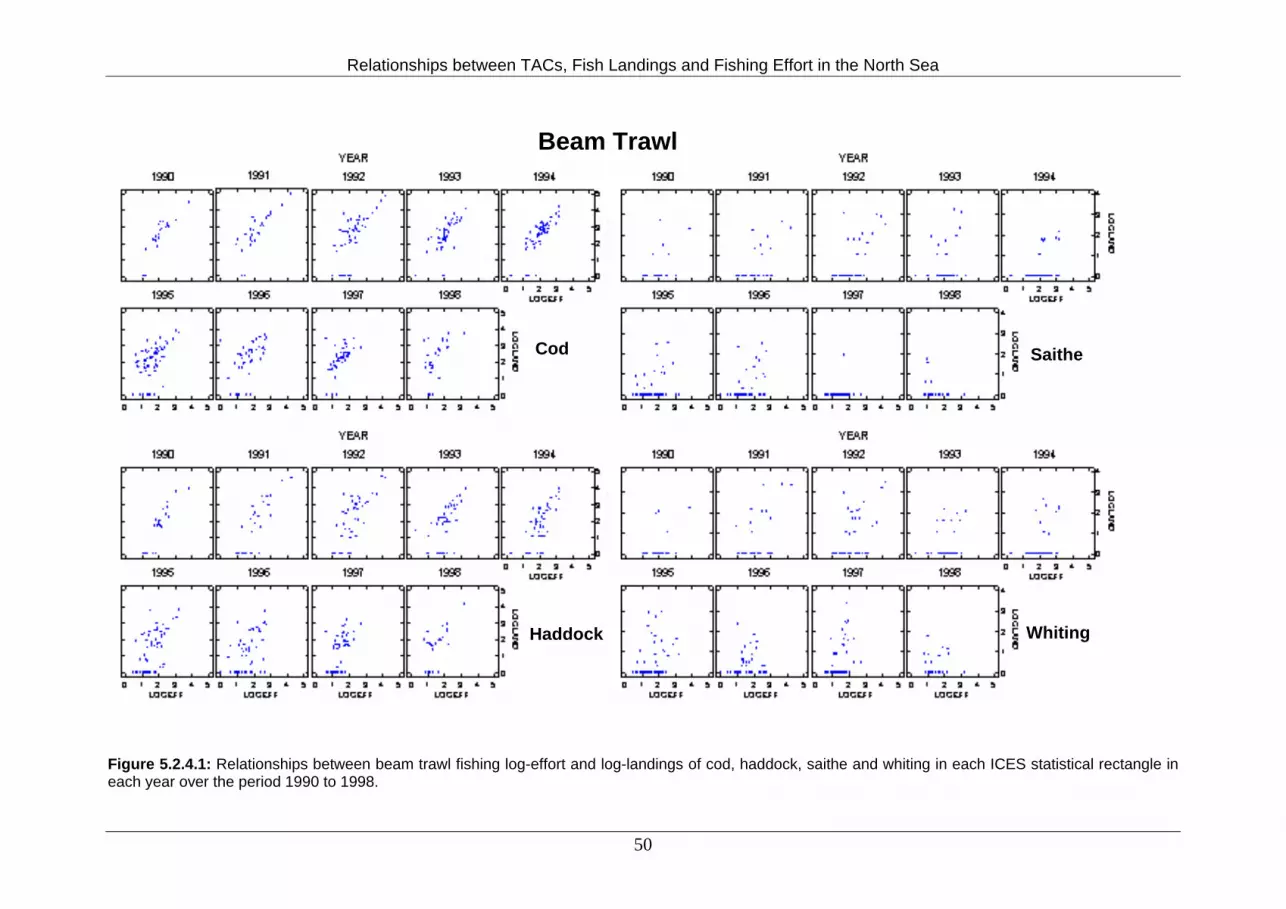
Relationships between TACs, Fish Landings and Fishing Effort in the North Sea
Cod
Haddock
Saithe
Whiting
Beam Trawl
Figure 5.2.4.1: Relationships between beam trawl fishing log-effort and log-landings of cod, haddock, saithe and whiting in each ICES statistical rectangle in each year over the period 1990 to 1998.
50

Relationships between TACs, Fish Landings and Fishing Effort in the North Sea
Doversole
Plaice
Nephrops
Beam Trawl
Figure 5.2.4.2: Relationships between beam trawl fishing log-effort and log-landings of dover sole, plaice and Nephrops in each ICES statistical rectangle in each year over the period 1990 to 1998.
51

Relationships between TACs, Fish Landings and Fishing Effort in the North Sea
Cod
Haddock
Saithe
Whiting
Otter Trawl directed at Fish
Figure 5.2.4.3: Relationships between otter trawl fishing log-effort directed at fish and log-landings of cod, haddock, saithe and whiting in each ICES statistical rectangle in each year over the period 1990 to 1998.
52
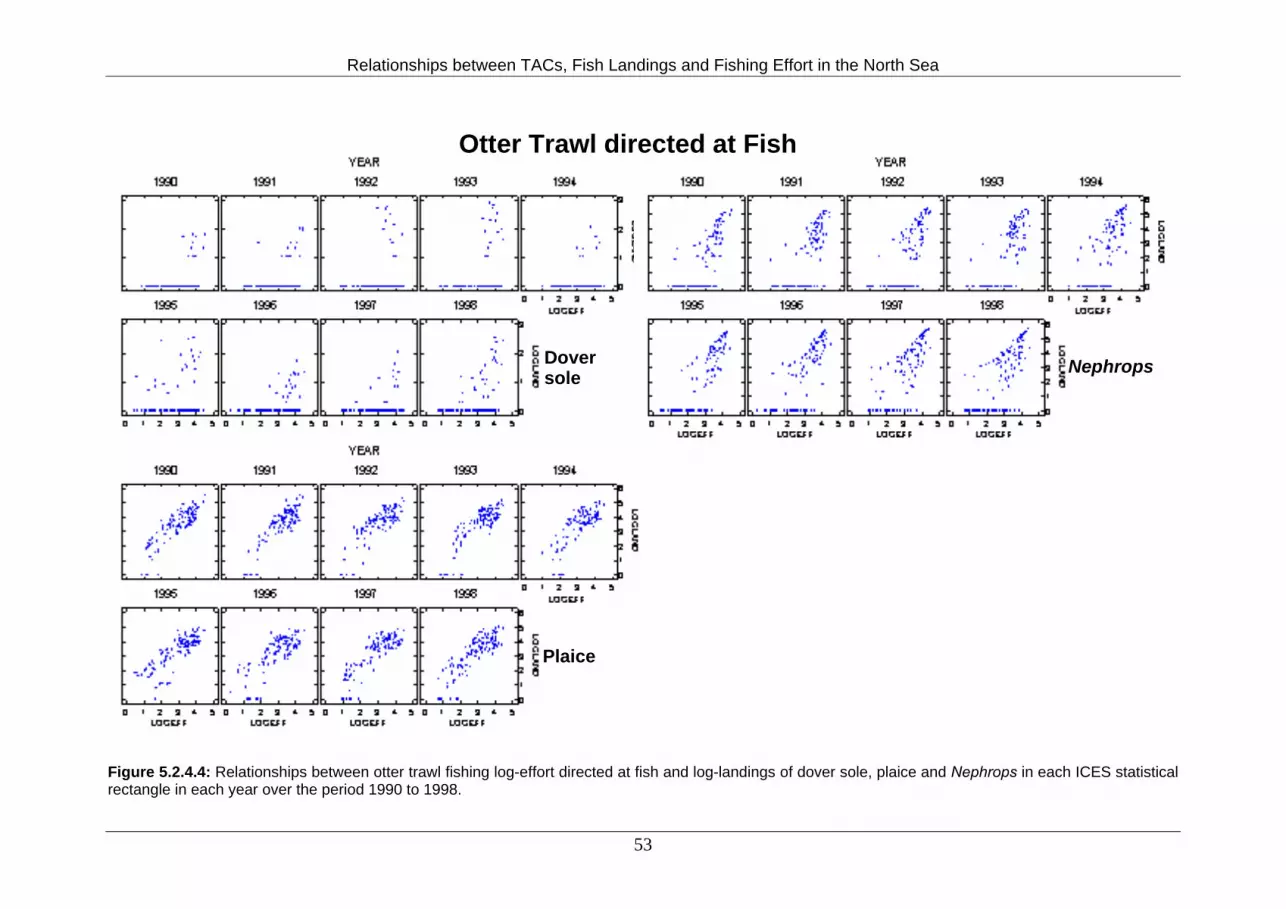
Relationships between TACs, Fish Landings and Fishing Effort in the North Sea
Doversole
Plaice
Nephrops
Otter Trawl directed at Fish
Figure 5.2.4.4: Relationships between otter trawl fishing log-effort directed at fish and log-landings of dover sole, plaice and Nephrops in each ICES statistical rectangle in each year over the period 1990 to 1998.
53
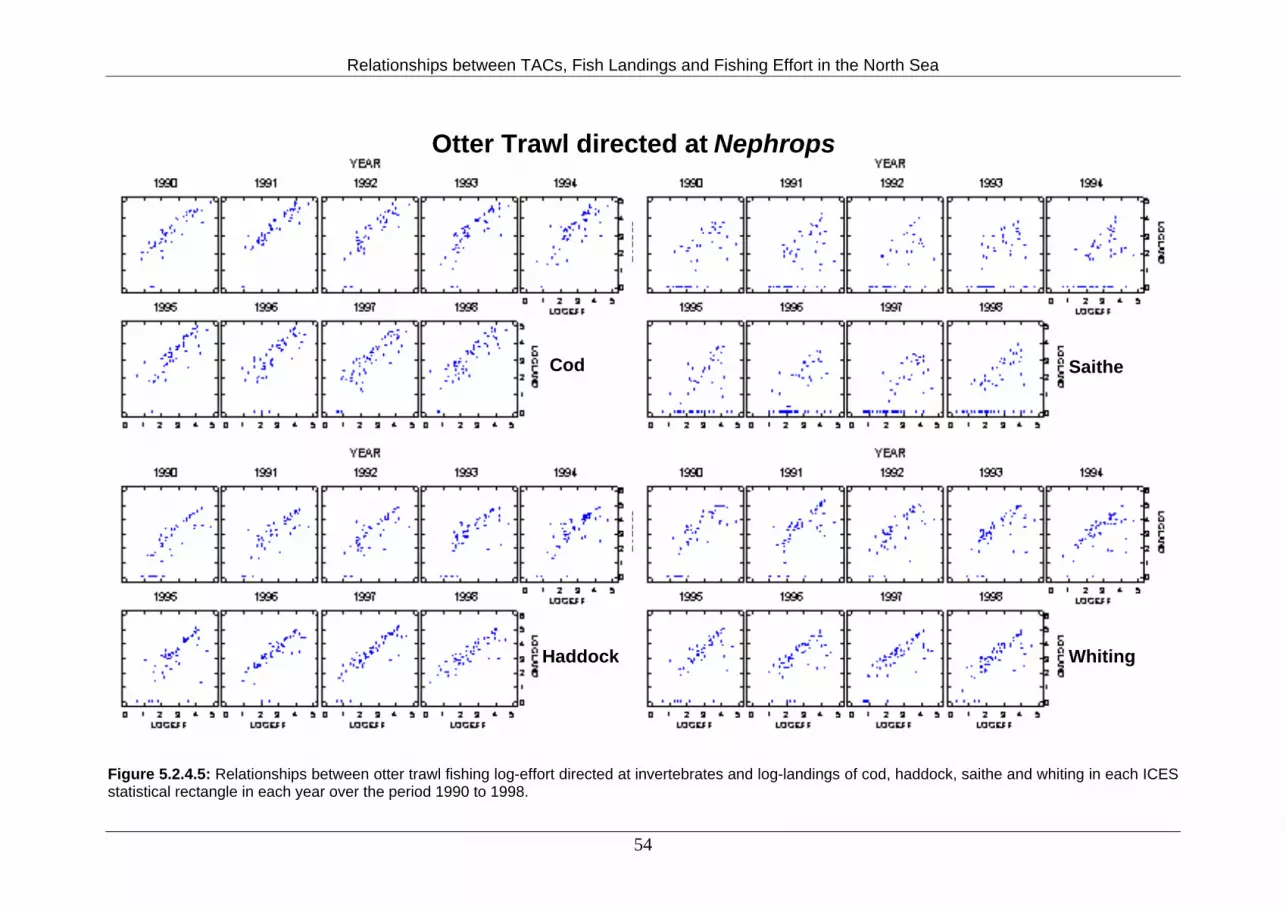
Relationships between TACs, Fish Landings and Fishing Effort in the North Sea
Cod
Haddock
Saithe
Whiting
Otter Trawl directed at Nephrops
Figure 5.2.4.5: Relationships between otter trawl fishing log-effort directed at invertebrates and log-landings of cod, haddock, saithe and whiting in each ICES statistical rectangle in each year over the period 1990 to 1998.
54
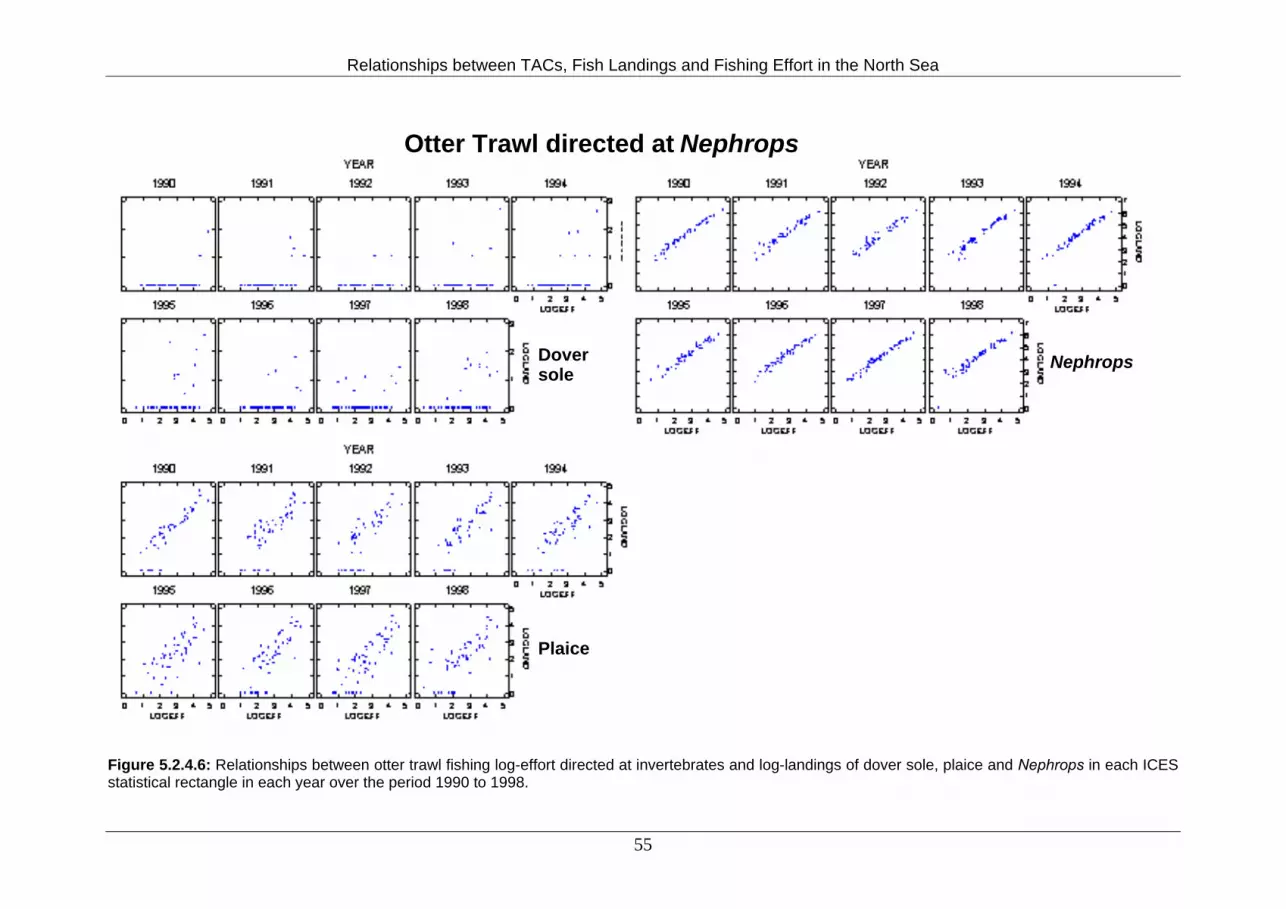
Relationships between TACs, Fish Landings and Fishing Effort in the North Sea
Otter Trawl directed at Nephrops
Doversole
Plaice
Nephrops
Figure 5.2.4.6: Relationships between otter trawl fishing log-effort directed at invertebrates and log-landings of dover sole, plaice and Nephrops in each ICES statistical rectangle in each year over the period 1990 to 1998.
55

Relationships between TACs, Fish Landings and Fishing Effort in the North Sea
Cod
Haddock
Saithe
Whiting
Seine Net
Figure 5.2.4.7: Relationships between Seine net fishing log-effort and log-landings of cod, haddock, saithe and whiting in each ICES statistical rectangle in each year over the period 1990 to 1998.
56
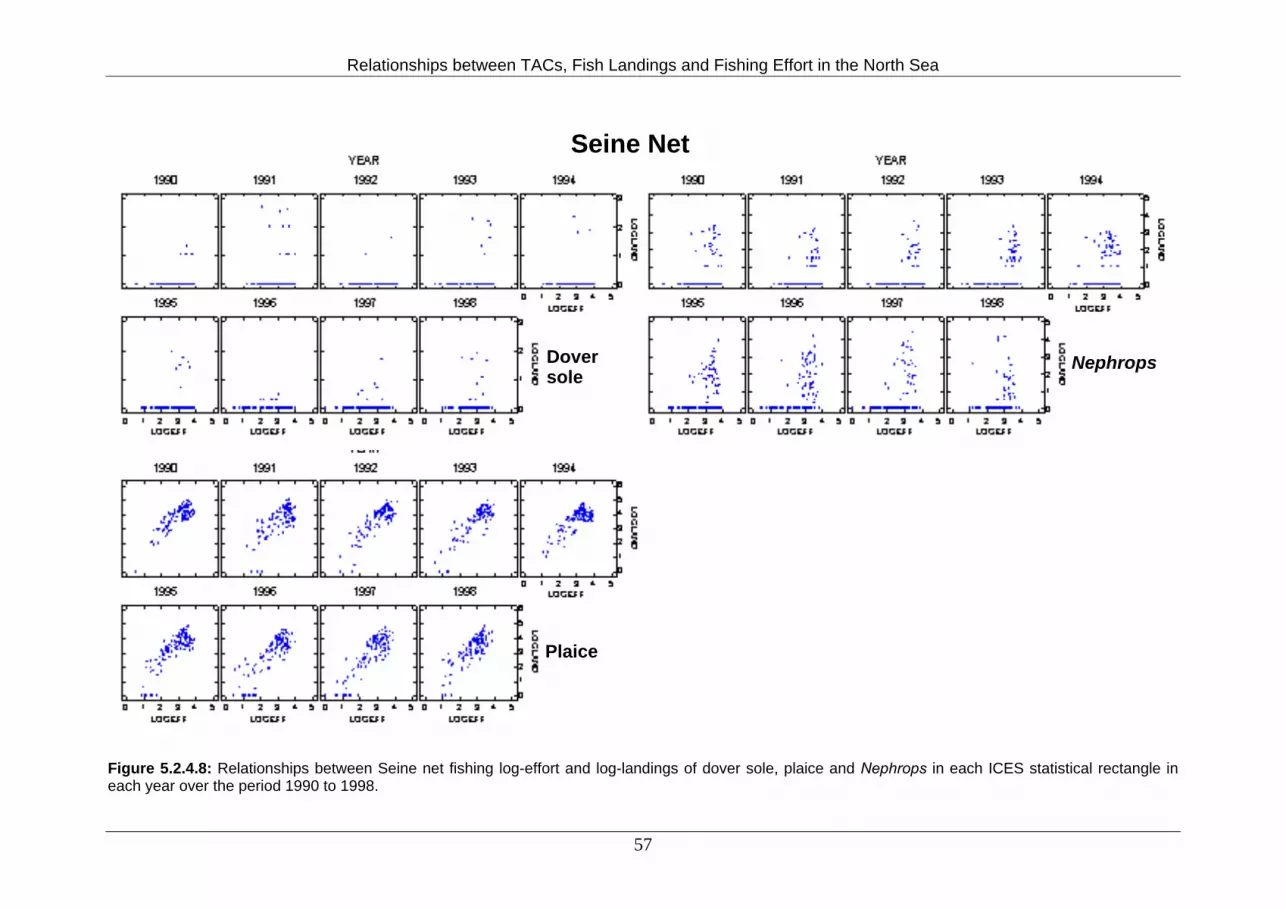
Relationships between TACs, Fish Landings and Fishing Effort in the North Sea
Doversole
Plaice
Nephrops
Seine Net
Figure 5.2.4.8: Relationships between Seine net fishing log-effort and log-landings of dover sole, plaice and Nephrops in each ICES statistical rectangle in each year over the period 1990 to 1998.
57
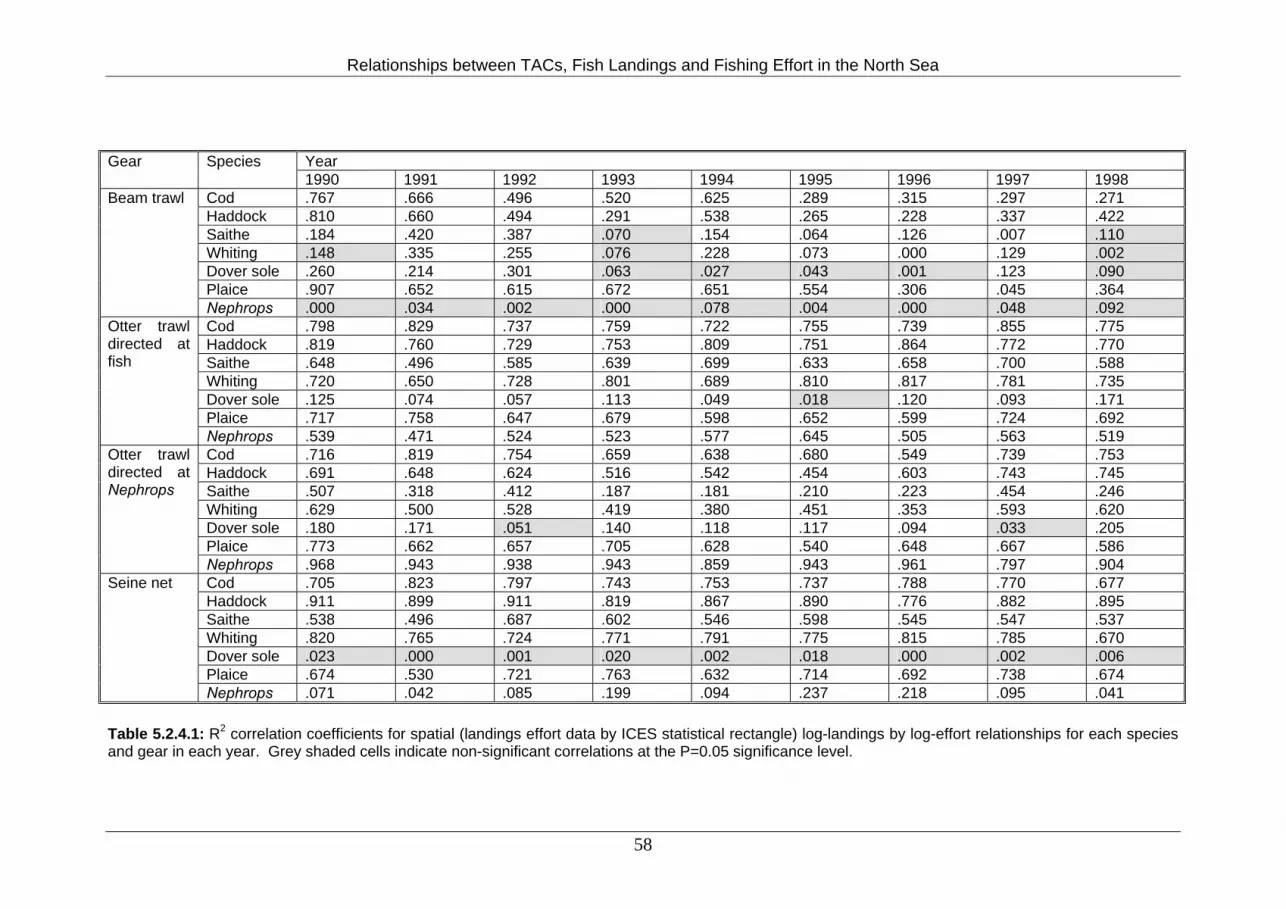
Relationships between TACs, Fish Landings and Fishing Effort in the North Sea
58
Year Gear
Species1990 1991 1992 1993 1994 1995 1996 1997 1998
Cod .767 .666 .496 .520 .625 .289 .315 .297 .271Haddock .810 .660 .494 .291 .538 .265 .228 .337 .422Saithe .184 .420 .387 .070 .154 .064 .126 .007 .110 Whiting .148 .335 .255 .076 .228 .073 .000 .129 .002 Dover sole .260 .214 .301 .063 .027 .043 .001 .123 .090 Plaice .907 .652 .615 .672 .651 .554 .306 .045 .364
Beam trawl
Nephrops .000 .034 .002 .000 .078 .004 .000 .048 .092 Cod .798 .829 .737 .759 .722 .755 .739 .855 .775Haddock .819 .760 .729 .753 .809 .751 .864 .772 .770Saithe .648 .496 .585 .639 .699 .633 .658 .700 .588Whiting .720 .650 .728 .801 .689 .810 .817 .781 .735Dover sole .125 .074 .057 .113 .049 .018 .120 .093 .171Plaice .717 .758 .647 .679 .598 .652 .599 .724 .692
Otter trawl directed at fish
Nephrops .539 .471 .524 .523 .577 .645 .505 .563 .519Cod .716 .819 .754 .659 .638 .680 .549 .739 .753Haddock .691 .648 .624 .516 .542 .454 .603 .743 .745Saithe .507 .318 .412 .187 .181 .210 .223 .454 .246Whiting .629 .500 .528 .419 .380 .451 .353 .593 .620Dover sole .180 .171 .051 .140 .118 .117 .094 .033 .205Plaice .773 .662 .657 .705 .628 .540 .648 .667 .586
Otter trawl directed at Nephrops
Nephrops .968 .943 .938 .943 .859 .943 .961 .797 .904Cod .705 .823 .797 .743 .753 .737 .788 .770 .677Haddock .911 .899 .911 .819 .867 .890 .776 .882 .895Saithe .538 .496 .687 .602 .546 .598 .545 .547 .537Whiting .820 .765 .724 .771 .791 .775 .815 .785 .670Dover sole .023 .000 .001 .020 .002 .018 .000 .002 .006 Plaice .674 .530 .721 .763 .632 .714 .692 .738 .674
Seine net
Nephrops .071 .042 .085 .199 .094 .237 .218 .095 .041 Table 5.2.4.1: R2 correlation coefficients for spatial (landings effort data by ICES statistical rectangle) log-landings by log-effort relationships for each species and gear in each year. Grey shaded cells indicate non-significant correlations at the P=0.05 significance level.
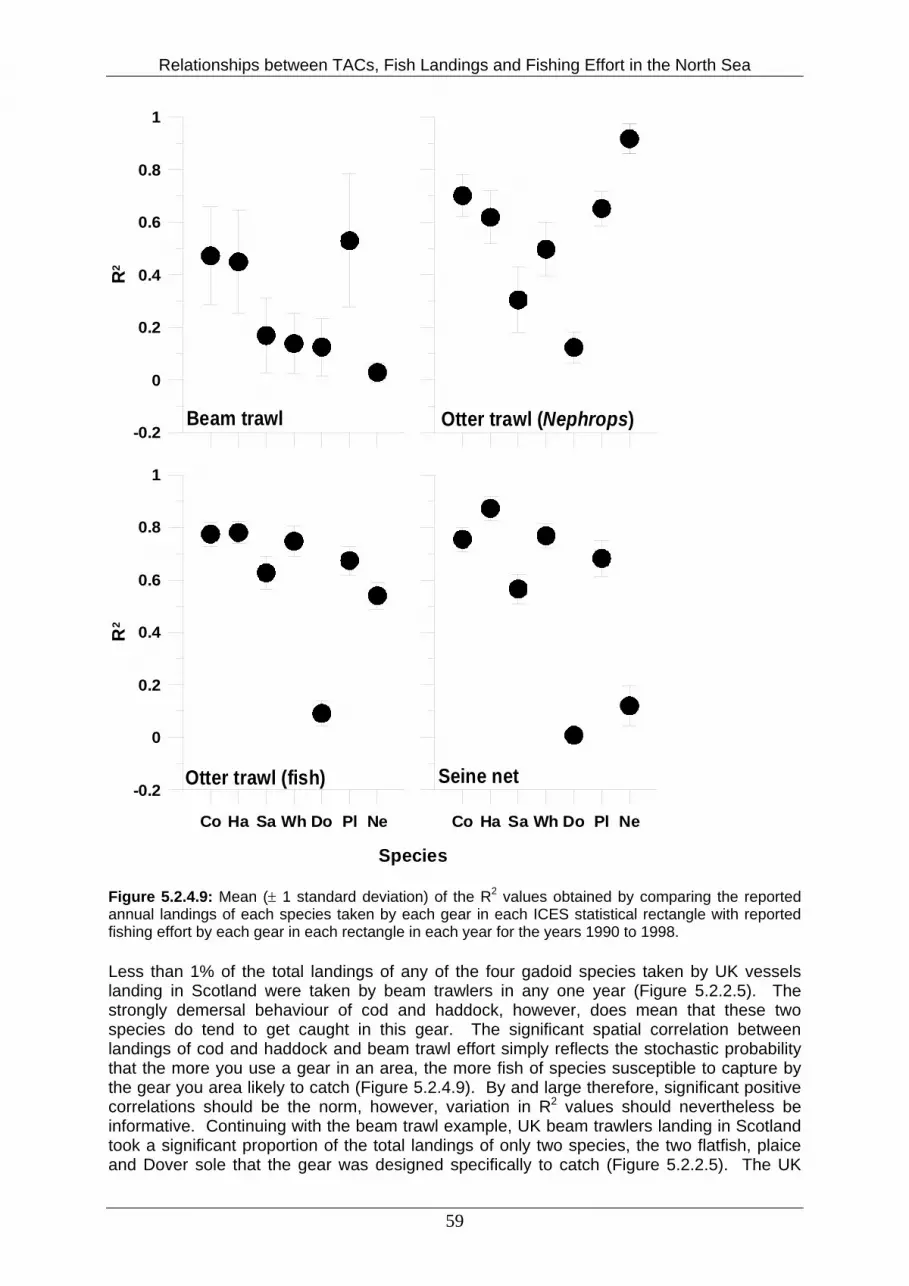
Relationships between TACs, Fish Landings and Fishing Effort in the North Sea
-0.2
0
0.2
0.4
0.6
0.8
1R
2
Co Ha Sa Wh Do Pl Ne
-0.2
0
0.2
0.4
0.6
0.8
1
R2
Co Ha Sa Wh Do Pl Ne
Beam trawl
Otter trawl (fish)
Otter trawl (Nephrops)
Seine net
Species Figure 5.2.4.9: Mean (± 1 standard deviation) of the R2 values obtained by comparing the reported annual landings of each species taken by each gear in each ICES statistical rectangle with reported fishing effort by each gear in each rectangle in each year for the years 1990 to 1998. Less than 1% of the total landings of any of the four gadoid species taken by UK vessels landing in Scotland were taken by beam trawlers in any one year (Figure 5.2.2.5). The strongly demersal behaviour of cod and haddock, however, does mean that these two species do tend to get caught in this gear. The significant spatial correlation between landings of cod and haddock and beam trawl effort simply reflects the stochastic probability that the more you use a gear in an area, the more fish of species susceptible to capture by the gear you area likely to catch (Figure 5.2.4.9). By and large therefore, significant positive correlations should be the norm, however, variation in R2 values should nevertheless be informative. Continuing with the beam trawl example, UK beam trawlers landing in Scotland took a significant proportion of the total landings of only two species, the two flatfish, plaice and Dover sole that the gear was designed specifically to catch (Figure 5.2.2.5). The UK
59
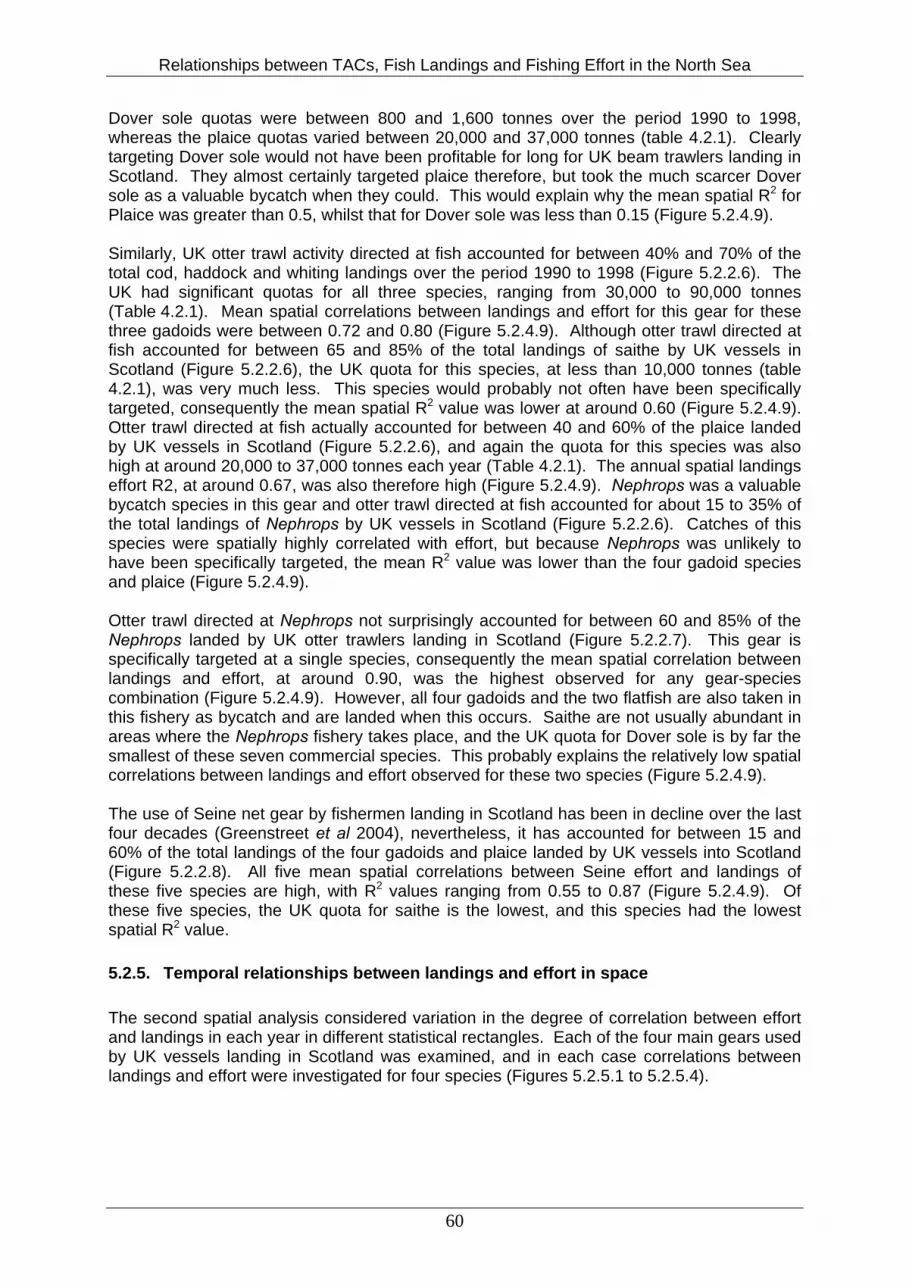
Relationships between TACs, Fish Landings and Fishing Effort in the North Sea
Dover sole quotas were between 800 and 1,600 tonnes over the period 1990 to 1998, whereas the plaice quotas varied between 20,000 and 37,000 tonnes (table 4.2.1). Clearly targeting Dover sole would not have been profitable for long for UK beam trawlers landing in Scotland. They almost certainly targeted plaice therefore, but took the much scarcer Dover sole as a valuable bycatch when they could. This would explain why the mean spatial R2 for Plaice was greater than 0.5, whilst that for Dover sole was less than 0.15 (Figure 5.2.4.9). Similarly, UK otter trawl activity directed at fish accounted for between 40% and 70% of the total cod, haddock and whiting landings over the period 1990 to 1998 (Figure 5.2.2.6). The UK had significant quotas for all three species, ranging from 30,000 to 90,000 tonnes (Table 4.2.1). Mean spatial correlations between landings and effort for this gear for these three gadoids were between 0.72 and 0.80 (Figure 5.2.4.9). Although otter trawl directed at fish accounted for between 65 and 85% of the total landings of saithe by UK vessels in Scotland (Figure 5.2.2.6), the UK quota for this species, at less than 10,000 tonnes (table 4.2.1), was very much less. This species would probably not often have been specifically targeted, consequently the mean spatial R2 value was lower at around 0.60 (Figure 5.2.4.9). Otter trawl directed at fish actually accounted for between 40 and 60% of the plaice landed by UK vessels in Scotland (Figure 5.2.2.6), and again the quota for this species was also high at around 20,000 to 37,000 tonnes each year (Table 4.2.1). The annual spatial landings effort R2, at around 0.67, was also therefore high (Figure 5.2.4.9). Nephrops was a valuable bycatch species in this gear and otter trawl directed at fish accounted for about 15 to 35% of the total landings of Nephrops by UK vessels in Scotland (Figure 5.2.2.6). Catches of this species were spatially highly correlated with effort, but because Nephrops was unlikely to have been specifically targeted, the mean R2 value was lower than the four gadoid species and plaice (Figure 5.2.4.9). Otter trawl directed at Nephrops not surprisingly accounted for between 60 and 85% of the Nephrops landed by UK otter trawlers landing in Scotland (Figure 5.2.2.7). This gear is specifically targeted at a single species, consequently the mean spatial correlation between landings and effort, at around 0.90, was the highest observed for any gear-species combination (Figure 5.2.4.9). However, all four gadoids and the two flatfish are also taken in this fishery as bycatch and are landed when this occurs. Saithe are not usually abundant in areas where the Nephrops fishery takes place, and the UK quota for Dover sole is by far the smallest of these seven commercial species. This probably explains the relatively low spatial correlations between landings and effort observed for these two species (Figure 5.2.4.9). The use of Seine net gear by fishermen landing in Scotland has been in decline over the last four decades (Greenstreet et al 2004), nevertheless, it has accounted for between 15 and 60% of the total landings of the four gadoids and plaice landed by UK vessels into Scotland (Figure 5.2.2.8). All five mean spatial correlations between Seine effort and landings of these five species are high, with R2 values ranging from 0.55 to 0.87 (Figure 5.2.4.9). Of these five species, the UK quota for saithe is the lowest, and this species had the lowest spatial R2 value. 5.2.5. Temporal relationships between landings and effort in space The second spatial analysis considered variation in the degree of correlation between effort and landings in each year in different statistical rectangles. Each of the four main gears used by UK vessels landing in Scotland was examined, and in each case correlations between landings and effort were investigated for four species (Figures 5.2.5.1 to 5.2.5.4).
60
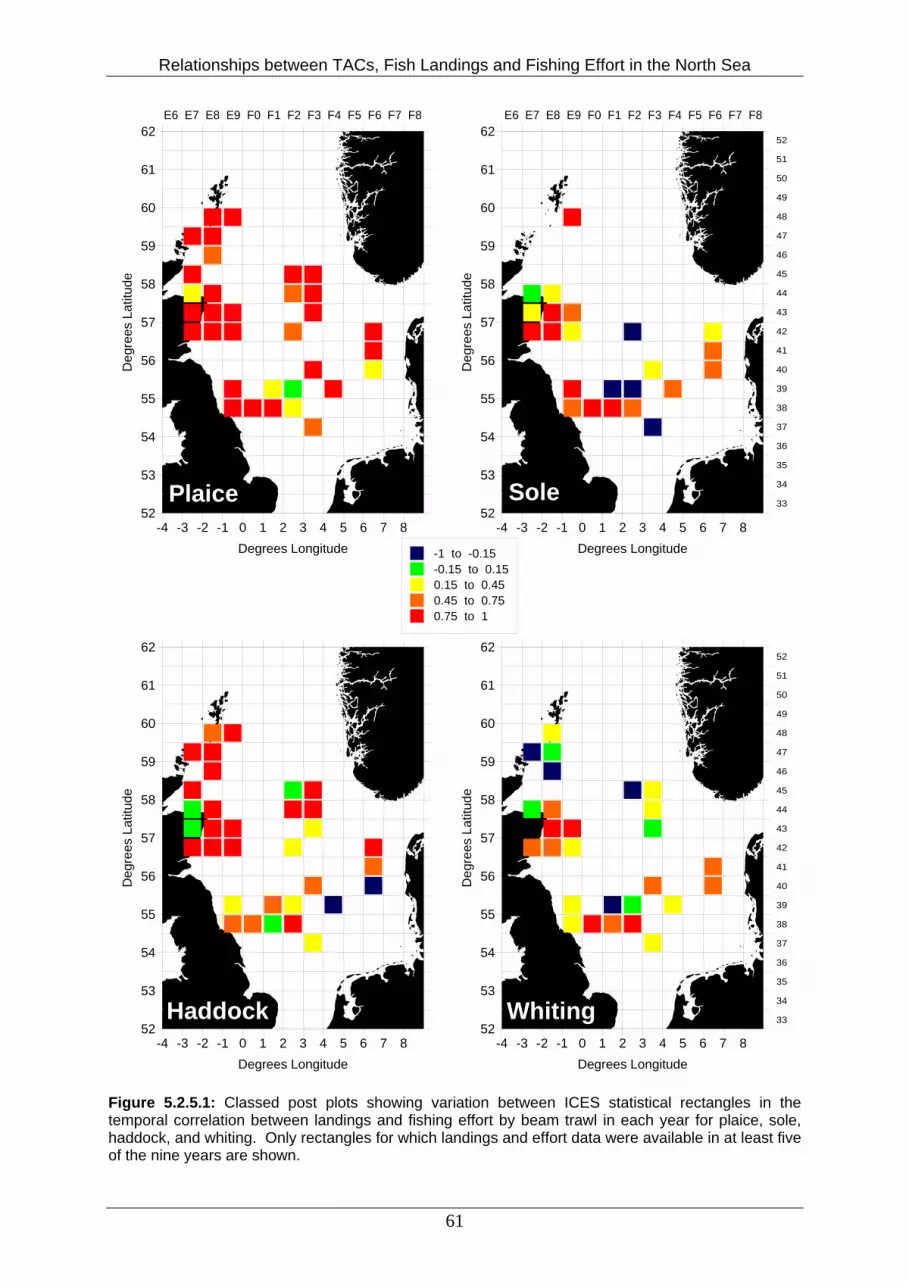
Relationships between TACs, Fish Landings and Fishing Effort in the North Sea
-4 -3 -2 -1 0 1 2 3 4 5 6 7 8Degrees Longitude
52
53
54
55
56
57
58
59
60
61
62D
egre
es L
atitu
deE6 E7 E8 E9 F0 F1 F2 F3 F4 F5 F6 F7 F8
52
51
50
49
48
47
46
45
44
43
42
41
40
39
38
37
36
35
34
33
-4 -3 -2 -1 0 1 2 3 4 5 6 7 8Degrees Longitude
52
53
54
55
56
57
58
59
60
61
62
Deg
rees
Lat
itude
-4 -3 -2 -1 0 1 2 3 4 5 6 7 8Degrees Longitude
52
53
54
55
56
57
58
59
60
61
62
Deg
rees
Lat
itude
-1 to -0.15 -0.15 to 0.15 0.15 to 0.45 0.45 to 0.75 0.75 to 1
-4 -3 -2 -1 0 1 2 3 4 5 6 7 8Degrees Longitude
52
53
54
55
56
57
58
59
60
61
62
Deg
rees
Lat
itude
E6 E7 E8 E9 F0 F1 F2 F3 F4 F5 F6 F7 F8
52
51
50
49
48
47
46
45
44
43
42
41
40
39
38
37
36
35
34
33
Plaice Sole
Haddock Whiting
Figure 5.2.5.1: Classed post plots showing variation between ICES statistical rectangles in the temporal correlation between landings and fishing effort by beam trawl in each year for plaice, sole, haddock, and whiting. Only rectangles for which landings and effort data were available in at least five of the nine years are shown.
61
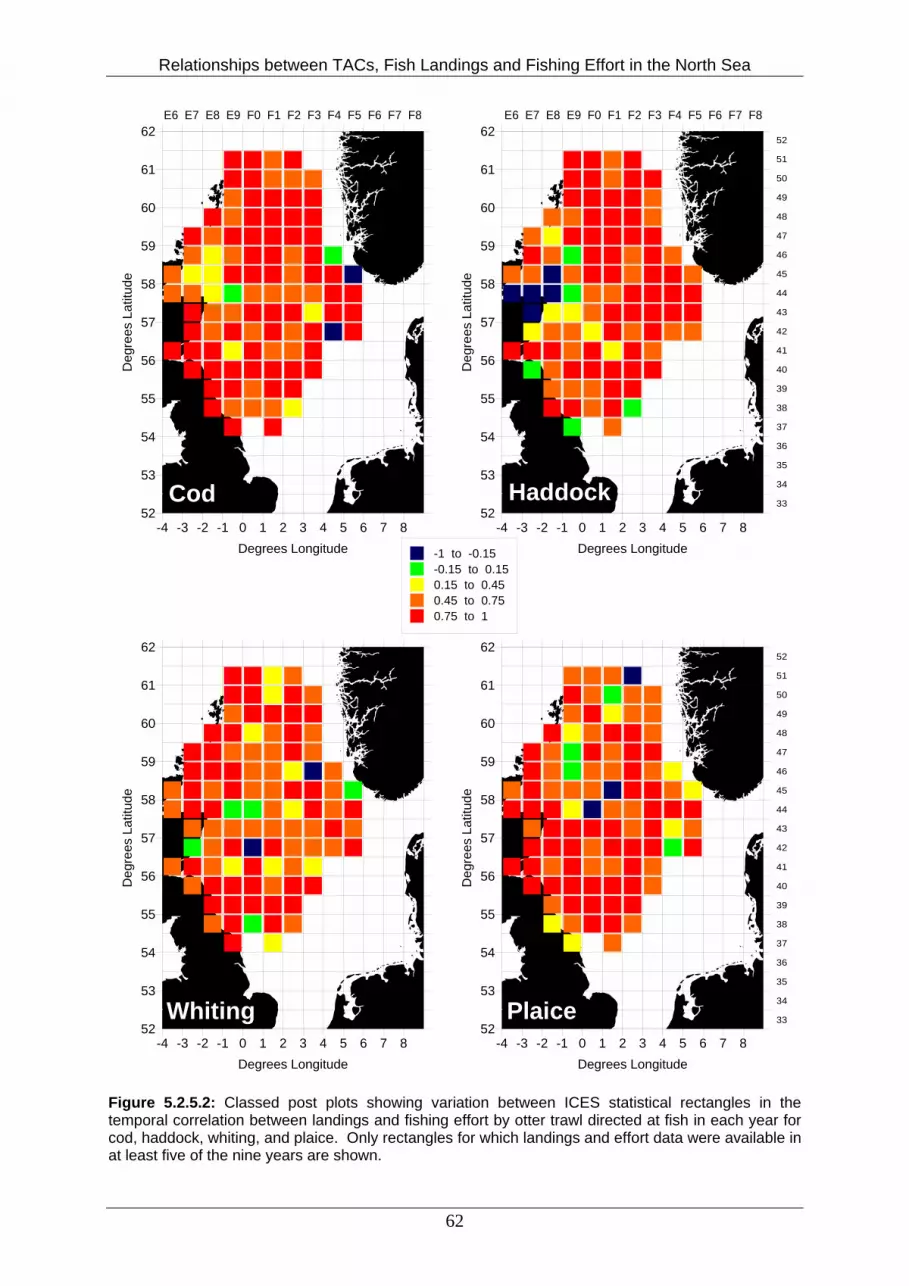
Relationships between TACs, Fish Landings and Fishing Effort in the North Sea
-4 -3 -2 -1 0 1 2 3 4 5 6 7 8Degrees Longitude
52
53
54
55
56
57
58
59
60
61
62D
egre
es L
atitu
deE6 E7 E8 E9 F0 F1 F2 F3 F4 F5 F6 F7 F8
52
51
50
49
48
47
46
45
44
43
42
41
40
39
38
37
36
35
34
33
-4 -3 -2 -1 0 1 2 3 4 5 6 7 8Degrees Longitude
52
53
54
55
56
57
58
59
60
61
62
Deg
rees
Lat
itude
-4 -3 -2 -1 0 1 2 3 4 5 6 7 8Degrees Longitude
52
53
54
55
56
57
58
59
60
61
62
Deg
rees
Lat
itude
-1 to -0.15 -0.15 to 0.15 0.15 to 0.45 0.45 to 0.75 0.75 to 1
-4 -3 -2 -1 0 1 2 3 4 5 6 7 8Degrees Longitude
52
53
54
55
56
57
58
59
60
61
62
Deg
rees
Lat
itude
E6 E7 E8 E9 F0 F1 F2 F3 F4 F5 F6 F7 F8
52
51
50
49
48
47
46
45
44
43
42
41
40
39
38
37
36
35
34
33
Cod Haddock
Whiting Plaice
Figure 5.2.5.2: Classed post plots showing variation between ICES statistical rectangles in the temporal correlation between landings and fishing effort by otter trawl directed at fish in each year for cod, haddock, whiting, and plaice. Only rectangles for which landings and effort data were available in at least five of the nine years are shown.
62
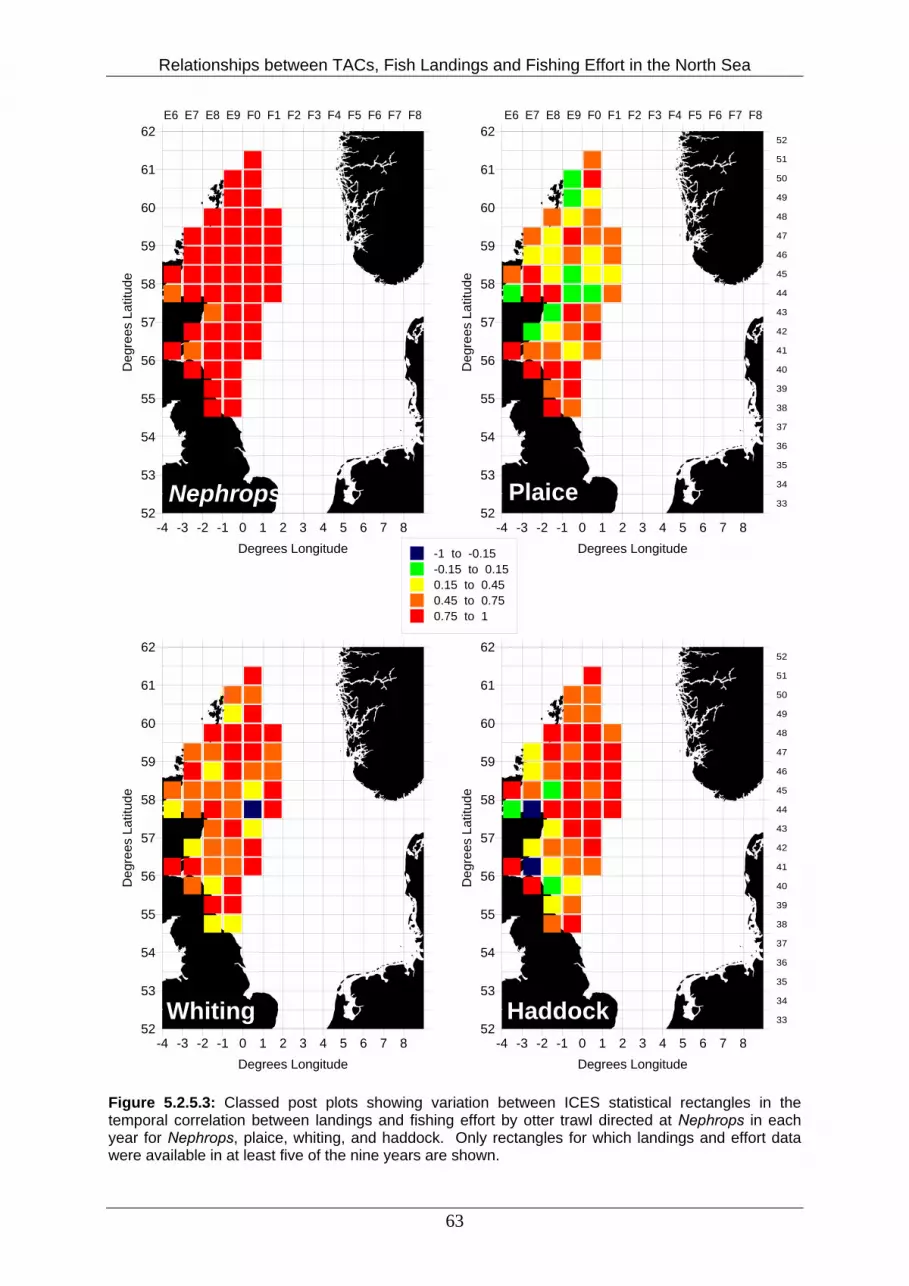
Relationships between TACs, Fish Landings and Fishing Effort in the North Sea
-4 -3 -2 -1 0 1 2 3 4 5 6 7 8Degrees Longitude
52
53
54
55
56
57
58
59
60
61
62D
egre
es L
atitu
deE6 E7 E8 E9 F0 F1 F2 F3 F4 F5 F6 F7 F8
52
51
50
49
48
47
46
45
44
43
42
41
40
39
38
37
36
35
34
33
-4 -3 -2 -1 0 1 2 3 4 5 6 7 8Degrees Longitude
52
53
54
55
56
57
58
59
60
61
62
Deg
rees
Lat
itude
-4 -3 -2 -1 0 1 2 3 4 5 6 7 8Degrees Longitude
52
53
54
55
56
57
58
59
60
61
62
Deg
rees
Lat
itude
-1 to -0.15 -0.15 to 0.15 0.15 to 0.45 0.45 to 0.75 0.75 to 1
-4 -3 -2 -1 0 1 2 3 4 5 6 7 8Degrees Longitude
52
53
54
55
56
57
58
59
60
61
62
Deg
rees
Lat
itude
E6 E7 E8 E9 F0 F1 F2 F3 F4 F5 F6 F7 F8
52
51
50
49
48
47
46
45
44
43
42
41
40
39
38
37
36
35
34
33
Nephrops Plaice
Whiting Haddock
Figure 5.2.5.3: Classed post plots showing variation between ICES statistical rectangles in the temporal correlation between landings and fishing effort by otter trawl directed at Nephrops in each year for Nephrops, plaice, whiting, and haddock. Only rectangles for which landings and effort data were available in at least five of the nine years are shown.
63
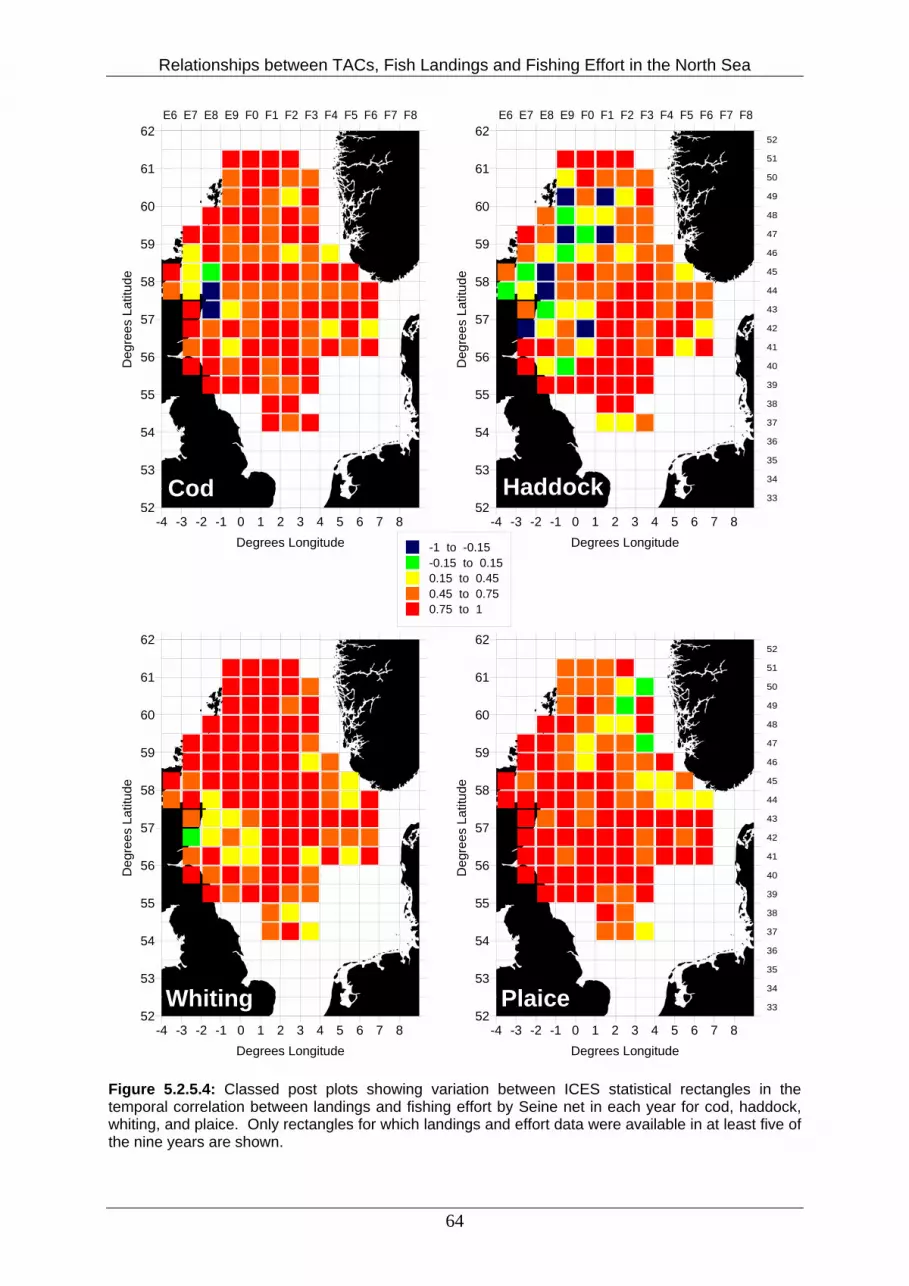
Relationships between TACs, Fish Landings and Fishing Effort in the North Sea
-4 -3 -2 -1 0 1 2 3 4 5 6 7 8Degrees Longitude
52
53
54
55
56
57
58
59
60
61
62D
egre
es L
atitu
deE6 E7 E8 E9 F0 F1 F2 F3 F4 F5 F6 F7 F8
52
51
50
49
48
47
46
45
44
43
42
41
40
39
38
37
36
35
34
33
-4 -3 -2 -1 0 1 2 3 4 5 6 7 8Degrees Longitude
52
53
54
55
56
57
58
59
60
61
62
Deg
rees
Lat
itude
-4 -3 -2 -1 0 1 2 3 4 5 6 7 8Degrees Longitude
52
53
54
55
56
57
58
59
60
61
62
Deg
rees
Lat
itude
-1 to -0.15 -0.15 to 0.15 0.15 to 0.45 0.45 to 0.75 0.75 to 1
-4 -3 -2 -1 0 1 2 3 4 5 6 7 8Degrees Longitude
52
53
54
55
56
57
58
59
60
61
62
Deg
rees
Lat
itude
E6 E7 E8 E9 F0 F1 F2 F3 F4 F5 F6 F7 F8
52
51
50
49
48
47
46
45
44
43
42
41
40
39
38
37
36
35
34
33
Cod Haddock
Whiting Plaice
Figure 5.2.5.4: Classed post plots showing variation between ICES statistical rectangles in the temporal correlation between landings and fishing effort by Seine net in each year for cod, haddock, whiting, and plaice. Only rectangles for which landings and effort data were available in at least five of the nine years are shown.
64

Relationships between TACs, Fish Landings and Fishing Effort in the North Sea
5.3. Case Study 3: The Norwegian Fleet 5.3.1. Relationships between TAC/Quotas and Landings Table 5.3.1.1 shows the annual Norwegian quotas for cod, haddock, saithe and whiting, while Table 5.3.1.2 gives the annual landings of these species by Norwegian vessels. It is clear from Figure 5.3.1.1 that saithe, the main target species, dominates landings from the Norwegian fishery. It is noticeable from comparing Tables 5.3.1.1 and 5.3.1.2 and examining Figure 5.3.1.2, that landings of cod, haddock and whiting from bottom trawling never reach the target quota and in fact are one to two orders of magnitude lower in most cases. However, if landings from pelagic gears and the line fishery are included, this gap is reduced (see: Working Group on the Assessment of Demersal Stocks in the North Sea and Skagerrak http://www.ices.dk/reports/ACFM/2004/WGNSSK/WGNSSK05.pdf). Table 5.3.1.3 shows the results of correlation analyses between Norwegian quotas for each species, and their landings by Norwegian vessels. This reveals a significant correlation for saithe and haddock, while insignificant for cod and whiting. Year Cod Haddock Saithe Whiting 1994 8800 36800 48400 12000 1995 11400 26600 55640 10000 1996 13100 26600 57720 8100 1997 9850 24290 54800 6700 1998 14800 23950 45440 7400 1999 11770 14200 52200 3000 2000 7190 8380 40000 3000 2001 8000 7655 41000 2970 2002 7888 21725 66000 4100 Table 5.3.1.1: Total annual Norwegian quotas (tonnes) for cod, haddock, saithe, and whiting. Year Cod Haddock Saithe Whiting 1994 1381 942 31400 25 1995 965 1151 36308 23 1996 765 995 38505 15 1997 1010 454 30930 37 1998 912 920 33030 28 1999 682 535 27842 34 2000 379 198 17191 0 2001 390 318 25588 5 2002 618 636 39575 10 Table 5.3.1.2: Total annual Norwegian landings (tonnes) of cod, haddock, saithe, and whiting.
65
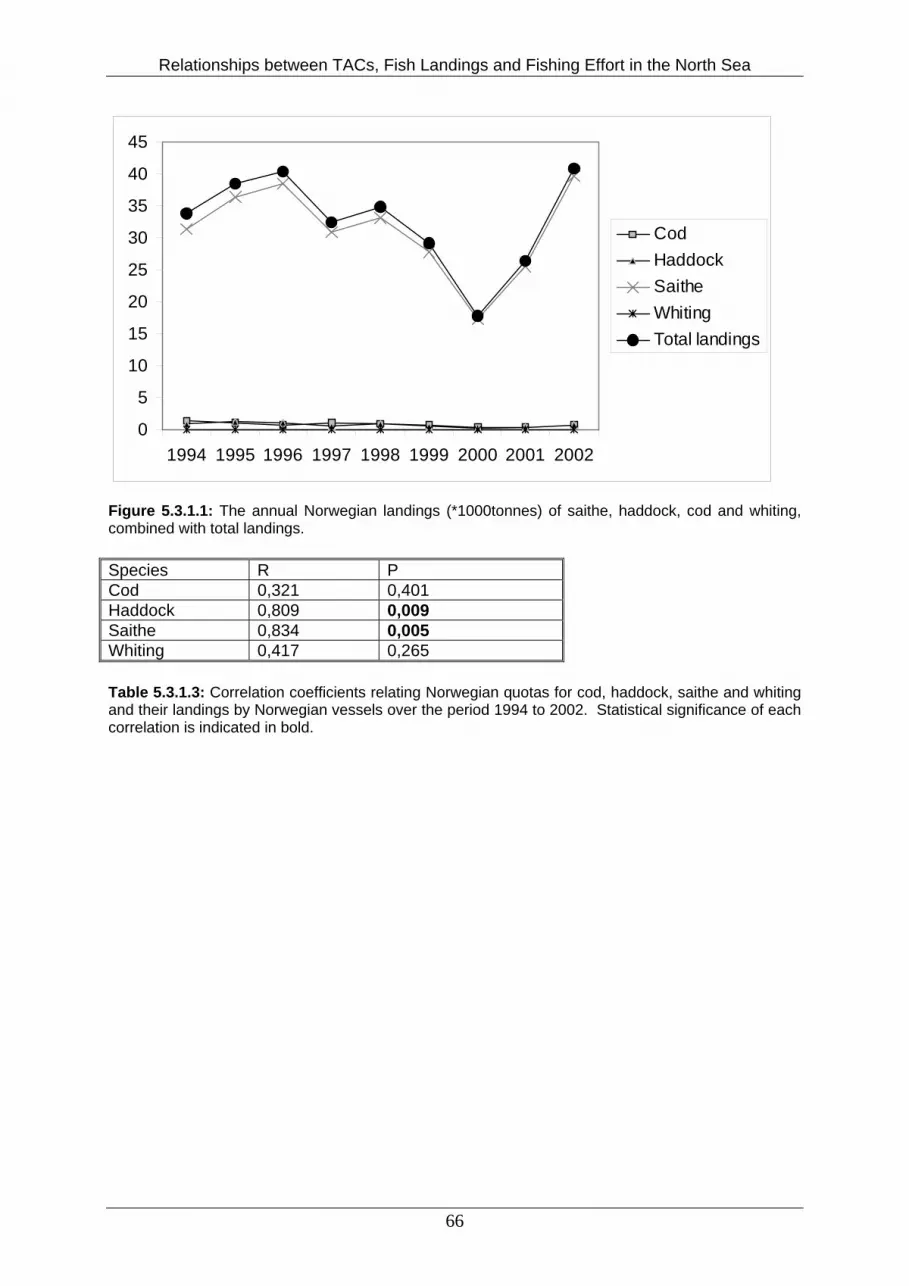
Relationships between TACs, Fish Landings and Fishing Effort in the North Sea
0
5
10
15
20
25
30
35
40
45
1994 1995 1996 1997 1998 1999 2000 2001 2002
CodHaddockSaitheWhitingTotal landings
Figure 5.3.1.1: The annual Norwegian landings (*1000tonnes) of saithe, haddock, cod and whiting, combined with total landings. Species R P Cod 0,321 0,401 Haddock 0,809 0,009 Saithe 0,834 0,005 Whiting 0,417 0,265 Table 5.3.1.3: Correlation coefficients relating Norwegian quotas for cod, haddock, saithe and whiting and their landings by Norwegian vessels over the period 1994 to 2002. Statistical significance of each correlation is indicated in bold.
66
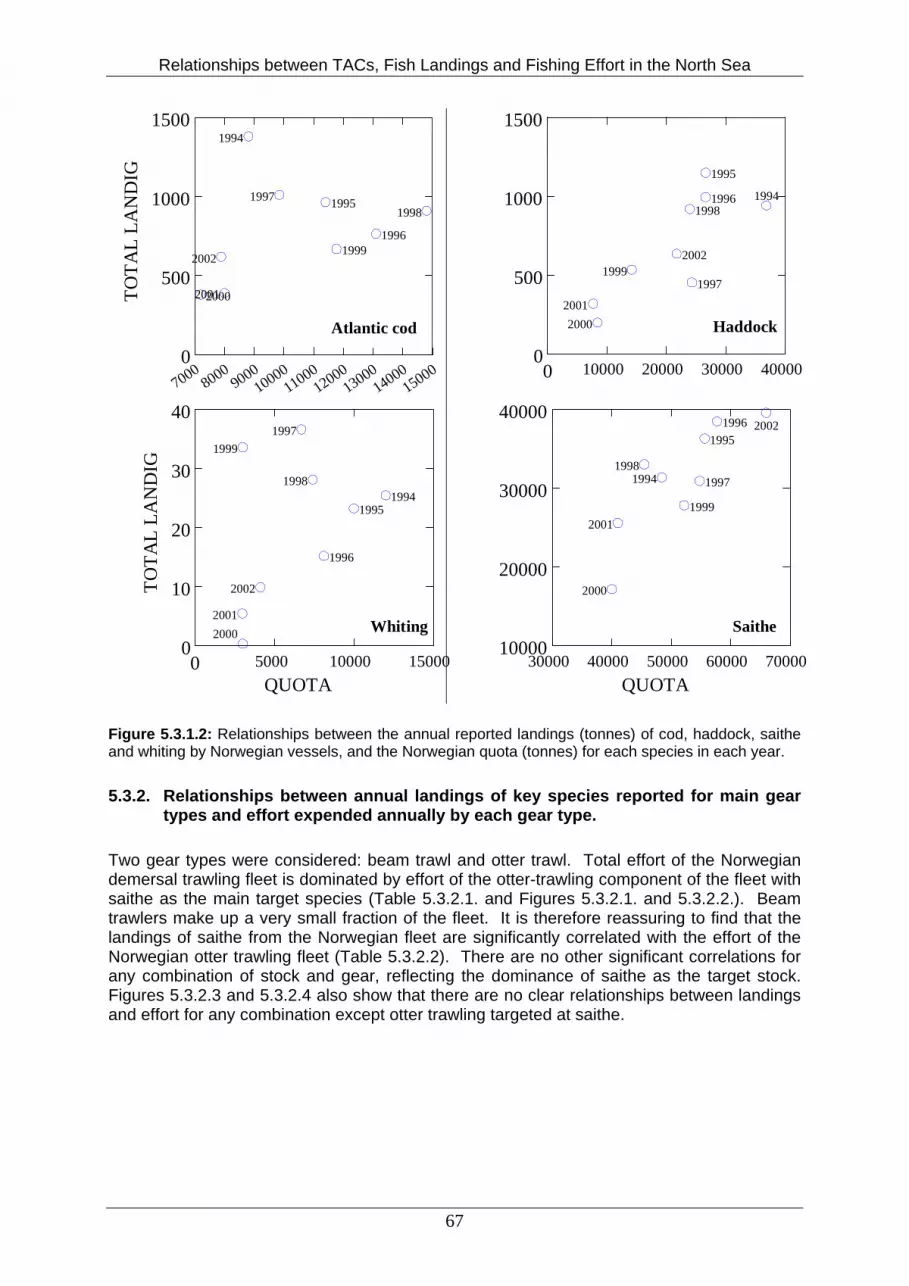
Relationships between TACs, Fish Landings and Fishing Effort in the North Sea
70008000
900010000
1100012000
1300014000
150000
500
1000
1500TO
TAL
LAN
DIG
2000
2002
2001
1994
1998
19961999
19951997
0 10000 20000 30000 400000
500
1000
1500
20012000
19992002
1994
1995
1996
1997
1998
Atlantic cod Haddock
30000 40000 50000 60000 70000QUOTA
10000
20000
30000
40000
2000
2001
19981994
200219961995
1997
1999
0 5000 10000 15000QUOTA
0
10
20
30
40
TOTA
LLA
ND
IG
20012000
1999
2002
19941995
1996
1998
1997
Whiting Saithe
Figure 5.3.1.2: Relationships between the annual reported landings (tonnes) of cod, haddock, saithe and whiting by Norwegian vessels, and the Norwegian quota (tonnes) for each species in each year. 5.3.2. Relationships between annual landings of key species reported for main gear
types and effort expended annually by each gear type. Two gear types were considered: beam trawl and otter trawl. Total effort of the Norwegian demersal trawling fleet is dominated by effort of the otter-trawling component of the fleet with saithe as the main target species (Table 5.3.2.1. and Figures 5.3.2.1. and 5.3.2.2.). Beam trawlers make up a very small fraction of the fleet. It is therefore reassuring to find that the landings of saithe from the Norwegian fleet are significantly correlated with the effort of the Norwegian otter trawling fleet (Table 5.3.2.2). There are no other significant correlations for any combination of stock and gear, reflecting the dominance of saithe as the target stock. Figures 5.3.2.3 and 5.3.2.4 also show that there are no clear relationships between landings and effort for any combination except otter trawling targeted at saithe.
67

Relationships between TACs, Fish Landings and Fishing Effort in the North Sea
Year Effort OTB Effort TBB 1994 32230.8 5783.0 1995 36057.3 4949.7 1996 45282.0 5680.9 1997 43094.0 8236.3 1998 31167.4 5726.4 1999 29499.9 4966.9 2000 22103.6 5989.7 2001 27558.4 6295.9 2002 40936.5 8277.7 Table 5.3.2.1: Total annual effort of the Norwegian fleet of otter trawl (OTB) and beam trawl (TBB).
05000
100001500020000250003000035000400004500050000
1992
1993
1994
1995
1996
1997
1998
1999
2000
2001
2002
Effo
rt (h
ours
of t
raw
ling)
Effort OTBEffort TBB
Figure 5.3.2.1: Annual effort of otter trawling (OTB) and beam trawling (TBB) in the Norwegian fleet fishing in the North Sea area.
05000
1000015000200002500030000350004000045000
1992
1993
1994
1995
1996
1997
1998
1999
2000
2001
2002
Year
Tons
fish
Cod OTBWhiting OTBHaddock OTBSaithe OTBTotal catch
Figure 5.3.2.2: The annual landings (tonnes) of the Norwegian otter trawl fleet with total catch (upper line with boxes), saithe (upper line with crosses), cod, whiting, and haddock.
68

Relationships between TACs, Fish Landings and Fishing Effort in the North Sea
Otter trawls Beam trawls Species R P R P Cod 0.365 0.335 0.136 0.727 Haddock 0.479 0.193 0.088 0.823 Saithe 0.836 0.005 -0.086 0.826 Whiting 0.113 0.773 0.194 0.618 Sole -0.653 0.057 -0.525 0.148 Nephrops -0.718 0.046 0.243 0.579 Table 5.3.2.2: Correlation coefficients for annual landings of cod, haddock, saithe, whiting, Nephrops, plaice and sole reported in each year for each gear type, and the effort expended by these gears in each year. Significant results at a level of P<0.05 in bold.
69

Relationships between TACs, Fish Landings and Fishing Effort in the North Sea
20000 30000 40000 500000
5
10
15
20
25
LAN
DO
TTER
20002001
19991998 1996
19972002
1995
1994
20000 30000 40000 5000010000
20000
30000
40000
2000
20011999
1998
1996
1997
2002
1995
1994
Whiting Saithe
20000 30000 40000 500000
500
1000
1500
2000
2001
1999
19981996
1997
2002
1995
1994
HaddockLA
ND
OTT
ER
50000
Atlantic cod
20000 30000 400000
500
1000
1500
20002001
1999
1998 1996
1997
2002
1995
1994
20000 30000 40000 50000EFFORT OTTER
0
1
2
3
LAN
DO
TTER
2000
2001
1999
1998
19961997200219951994
20000 30000 40000 50000EFFORT OTTER
0
10
20
30
40
50
2000
2001
1999
1998
19961997
20021995
Common sole Norwegian lobster
Figure 5.3.2.3: Relationships between the annual reported landings of cod, haddock, whiting, saithe, sole, and Nephrops caught in otter trawls, and the hours fished by otter trawlers in each year.
70
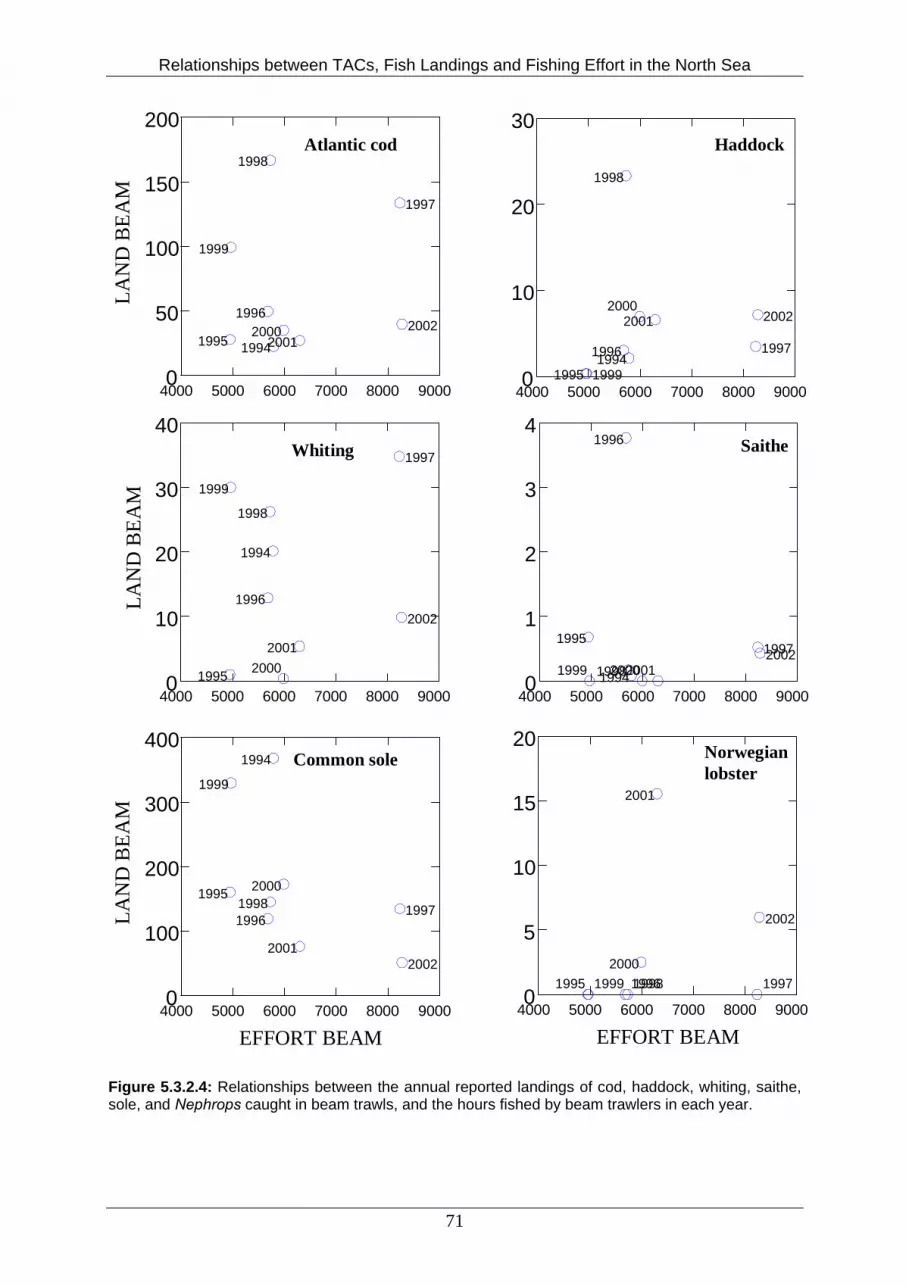
Relationships between TACs, Fish Landings and Fishing Effort in the North Sea
4000 5000 6000 7000 8000 90000
50
100
150
200LA
ND
BEA
M
1995
1999
1996
1998
2002
1997
20012000
1994
4000 5000 6000 7000 8000 90000
10
20
30
1995 1999
1996
1998
2002
1997
20012000
1994
Atlantic cod Haddock
4000 5000 6000 7000 8000 90000
10
20
30
40
LAN
DB
EAM
1995
1999
1996
1998
2002
1997
20012000
1994
4000 5000 6000 7000 8000 90000
1
2
3
4
1995
1999
1996
199820021997
200120001994
Whiting Saithe
4000 5000 6000 7000 8000 9000
EFFORT BEAM
0
100
200
300
400
LAN
DB
EAM
1995
1999
19961998
2002
1997
2001
2000
1994
4000 5000 6000 7000 8000 9000
EFFORT BEAM
0
5
10
15
20
1995 1999 19961998
2002
1997
2001
2000
Common sole Norwegian lobster
Figure 5.3.2.4: Relationships between the annual reported landings of cod, haddock, whiting, saithe, sole, and Nephrops caught in beam trawls, and the hours fished by beam trawlers in each year.
71
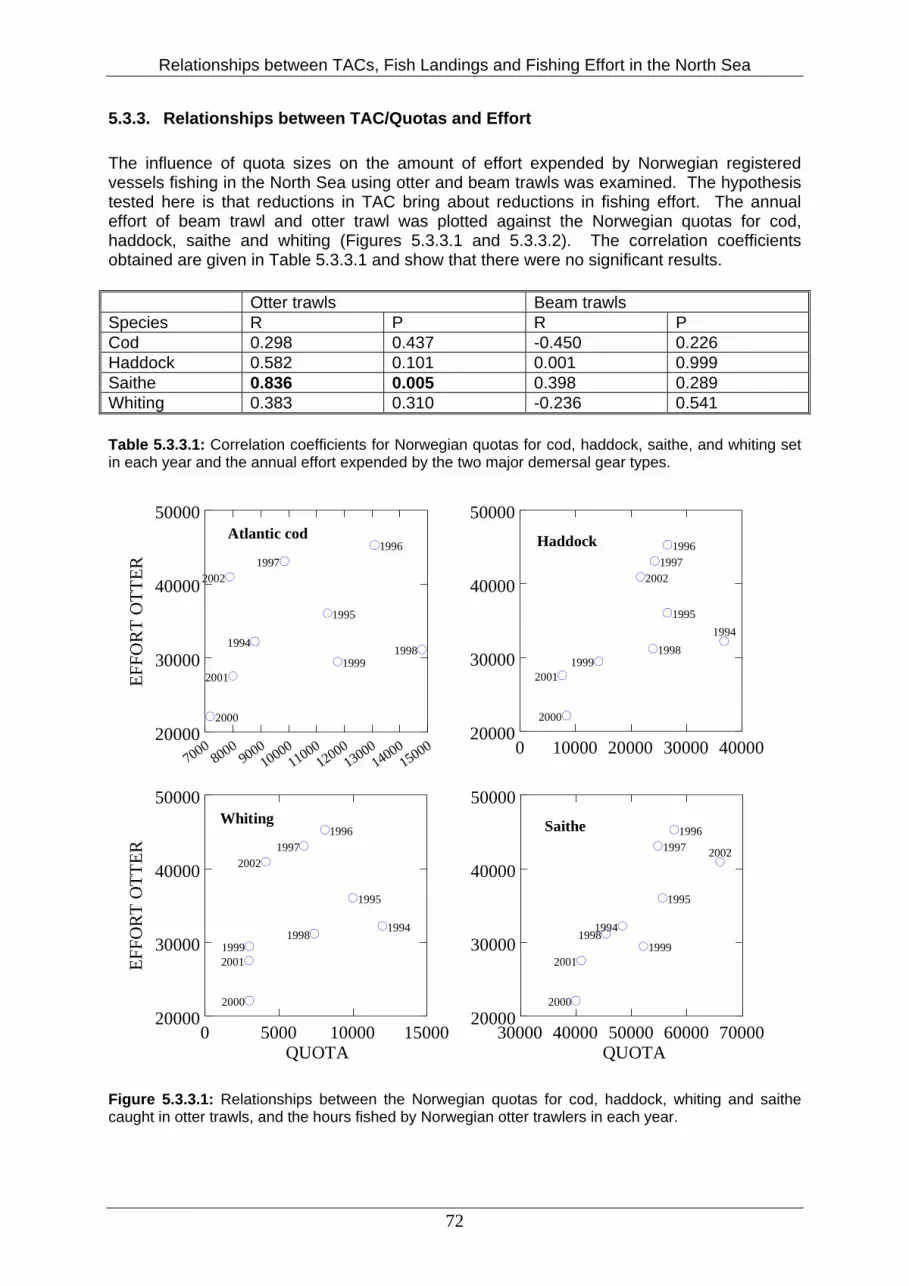
Relationships between TACs, Fish Landings and Fishing Effort in the North Sea
5.3.3. Relationships between TAC/Quotas and Effort The influence of quota sizes on the amount of effort expended by Norwegian registered vessels fishing in the North Sea using otter and beam trawls was examined. The hypothesis tested here is that reductions in TAC bring about reductions in fishing effort. The annual effort of beam trawl and otter trawl was plotted against the Norwegian quotas for cod, haddock, saithe and whiting (Figures 5.3.3.1 and 5.3.3.2). The correlation coefficients obtained are given in Table 5.3.3.1 and show that there were no significant results. Otter trawls Beam trawls Species R P R P Cod 0.298 0.437 -0.450 0.226 Haddock 0.582 0.101 0.001 0.999 Saithe 0.836 0.005 0.398 0.289 Whiting 0.383 0.310 -0.236 0.541 Table 5.3.3.1: Correlation coefficients for Norwegian quotas for cod, haddock, saithe, and whiting set in each year and the annual effort expended by the two major demersal gear types.
70008000
900010000
1100012000
1300014000
1500020000
30000
40000
50000
EFFO
RT
OTT
ER
2000
2002
2001
19941998
1996
1999
1995
1997
0 10000 20000 30000 4000020000
30000
40000
50000
2001
2000
1999
2002
19941995
19961997
1998
0 5000 10000 15000QUOTA
20000
30000
40000
50000
EFFO
RT
OTT
ER
2001
2000
1999
2002
1994
1995
1996
1998
1997
30000 40000 50000 60000 70000QUOTA
20000
30000
40000
50000
2000
2001
19981994
2002
1996
1995
1997
1999
Atlantic cod Haddock
Whiting Saithe
Figure 5.3.3.1: Relationships between the Norwegian quotas for cod, haddock, whiting and saithe caught in otter trawls, and the hours fished by Norwegian otter trawlers in each year.
72

Relationships between TACs, Fish Landings and Fishing Effort in the North Sea
70008000
900010000
1100012000
1300014000
150004000
5000
6000
7000
8000
9000EF
FORT
BEA
M
2000
2002
2001
1994 19981996
19991995
1997
0 10000 20000 30000 400004000
5000
6000
7000
8000
9000
20012000
1999
2002
1994
1995
1996
1997
1998
0 5000 10000 15000QUOTA
4000
5000
6000
7000
8000
9000
EFFO
RTBE
AM
20012000
1999
2002
1994
1995
19961998
1997
30000 40000 50000 60000 70000QUOTA
4000
5000
6000
7000
8000
9000
20002001
19981994
2002
1996
1995
1997
1999
Atlantic cod Haddock
Whiting Saithe
Figure 5.3.3.2: Relationships between the Norwegian quotas for cod, haddock, whitting and saithe caught in beam trawls, and the hours fished by Norwegian otter trawlers in each year. 5.3.4. Spatial relationships between landings and effort in time Figure 5.3.4.1 shows variation in total fishing effort by the entire Norwegian fleet and total landings of all fish for the period 1992 to 2002. Based on the results found for Figure 5.3.1.1, only the relationship between landings of saithe and effort of the Norwegian otter trawling fleet was examined for a spatial relationship. Two spatial analyses were undertaken, performed only on the rectangles from which saithe were landed by the Norwegian fleet (i.e. excluding from the analysis all rectangles where saithe landings were zero). The first involved a spatial analysis within time, whereby for each year, the relationship between effort and landings in each rectangle was examined (Figure 5.3.4.2). The spatial correlations between landings and effort were highly significant in all 11 years (Table 5.3.4.1). Thus landings of saithe from ICES rectangles where annual Otter trawl effort was high also tended to be high, and vice versa.
73

Relationships between TACs, Fish Landings and Fishing Effort in the North Sea
High
Low
E6 E7 E8 E9 F F F F F F F F F
31
32
33
34
35
36
37
38
39
40
41
42
43
44
45
46
47
48
49
50
51
52
Effort
00 F F F F F F F F F
31
32
33
34
35
36
37
38
39
40
41
42
43
44
45
46
47
48
49
50
51
52
Landings
Figure 5.3.4.1: Charts of spatial variation in total fishing effort (A) and total landings of all fish (B) by the Norwegian fleet over the period 1992-2002.
1994
1 2 3 4 5 6 7 8 9 100
5
10
15
20
LOG
_CAT
CH
1995
1 2 3 4 5 6 7 8 9 100
5
10
15
20
1996
1 2 3 4 5 6 7 8 9 100
5
10
15
20
1997
1 2 3 4 5 6 7 8 9 100
5
10
15
20
1998
1 2 3 4 5 6 7 8 9 100
5
10
15
20
LOG
_CAT
CH
1999
1 2 3 4 5 6 7 8 9 100
5
10
15
20
2000
1 2 3 4 5 6 7 8 9 100
5
10
15
20
2001
1 2 3 4 5 6 7 8 9 10LOG_EFFORT
0
5
10
15
20
2002
1 2 3 4 5 6 7 8 9 10LOG_EFFORT
0
5
10
15
20
LOG
_CAT
CH
2003
1 2 3 4 5 6 7 8 9 10LOG_EFFORT
0
5
10
15
20
2004
1 2 3 4 5 6 7 8 9 10LOG_EFFORT
0
5
10
15
20
Figure 5.3.4.2: Relationship between otter trawl fishing log-effort and log-landings of saithe in each ICES statistical rectangle in each year over the period 1994-2004.
74

Relationships between TACs, Fish Landings and Fishing Effort in the North Sea
Year 1994 1995 1996 1997 1998 1999 2000 2001 2002 2003 2004 R2 0,873 0,911 0,790 0,839 0,784 0,639 0,641 0,666 0,832 0,738 0,943 P < 0.01 < 0.01 < 0.01 < 0.01 < 0.01 < 0.01 < 0.01 < 0.01 < 0.01 < 0.01 < 0.01 Table 5.3.4.1: R2 correlation coefficients for spatial (landings effort data by ICES statistical rectangle) landings by effort relationship for saithe, taken with otter trawl in each year (1994-2004). 5.3.5. Temporal relationships between landings and effort in space A second analysis involved a temporal analysis within space, whereby the relationship between effort and landings in each year was examined for each rectangle (Figure 5.3.5.1). It was clearly evident that the temporal correlation between Norwegian otter trawl effort and saithe landings was closer in some rectangles than in others. Reasons for this need to be explored, but may include, on average, higher densities of stock within those rectangles and thus a higher CPUE.
norway-0.325 - 0.099
0.099 - 0.643
0.643 - 0.824
0.824 - 0.92
0.92 - 0.999
saithe
Figure 5.3.5.1: Spatial variation in the temporal correlation coefficients between saithe landings and Norwegian otter trawl effort over the period 1992-2003.
75
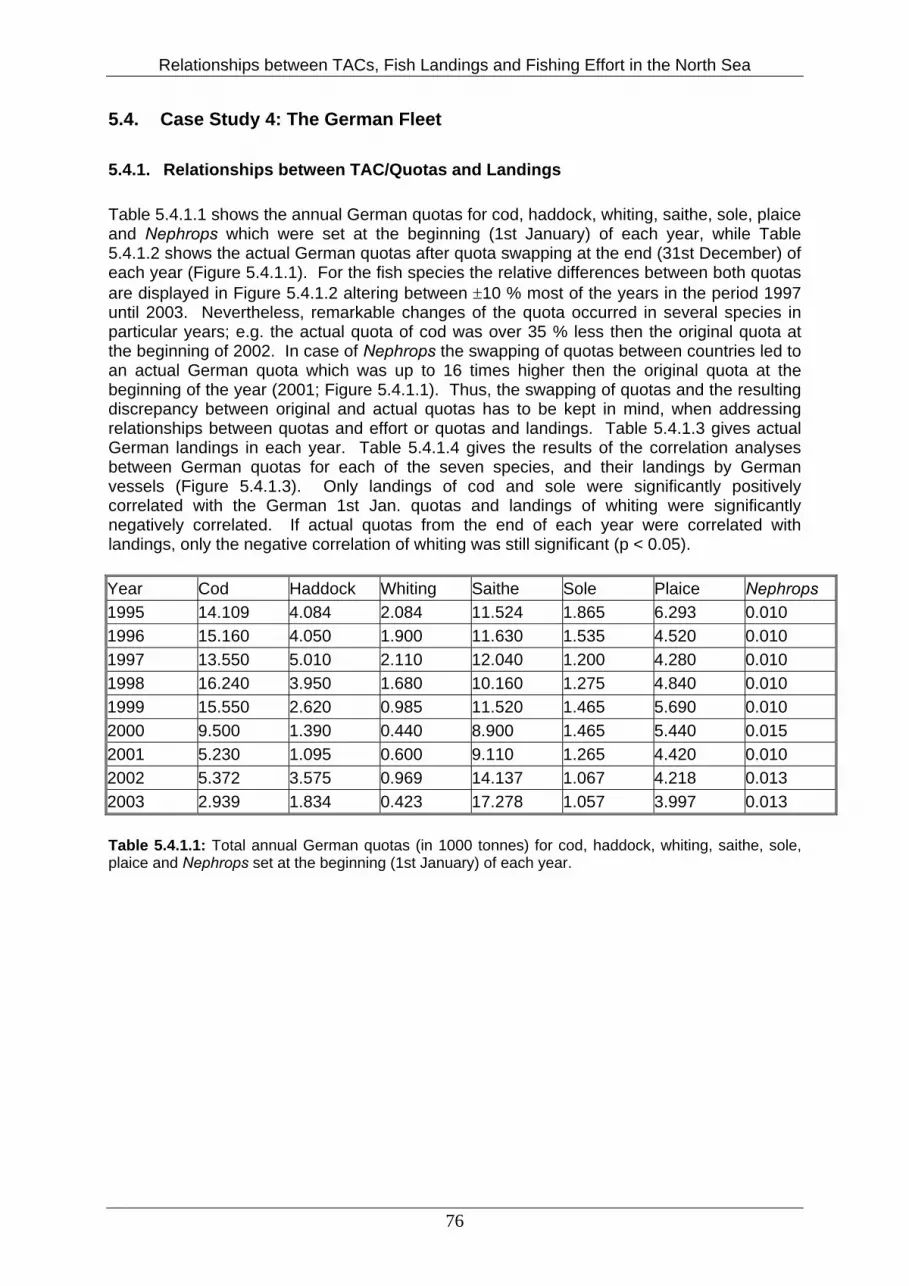
Relationships between TACs, Fish Landings and Fishing Effort in the North Sea
5.4. Case Study 4: The German Fleet 5.4.1. Relationships between TAC/Quotas and Landings Table 5.4.1.1 shows the annual German quotas for cod, haddock, whiting, saithe, sole, plaice and Nephrops which were set at the beginning (1st January) of each year, while Table 5.4.1.2 shows the actual German quotas after quota swapping at the end (31st December) of each year (Figure 5.4.1.1). For the fish species the relative differences between both quotas are displayed in Figure 5.4.1.2 altering between ±10 % most of the years in the period 1997 until 2003. Nevertheless, remarkable changes of the quota occurred in several species in particular years; e.g. the actual quota of cod was over 35 % less then the original quota at the beginning of 2002. In case of Nephrops the swapping of quotas between countries led to an actual German quota which was up to 16 times higher then the original quota at the beginning of the year (2001; Figure 5.4.1.1). Thus, the swapping of quotas and the resulting discrepancy between original and actual quotas has to be kept in mind, when addressing relationships between quotas and effort or quotas and landings. Table 5.4.1.3 gives actual German landings in each year. Table 5.4.1.4 gives the results of the correlation analyses between German quotas for each of the seven species, and their landings by German vessels (Figure 5.4.1.3). Only landings of cod and sole were significantly positively correlated with the German 1st Jan. quotas and landings of whiting were significantly negatively correlated. If actual quotas from the end of each year were correlated with landings, only the negative correlation of whiting was still significant (p < 0.05). Year Cod Haddock Whiting Saithe Sole Plaice Nephrops 1995 14.109 4.084 2.084 11.524 1.865 6.293 0.010 1996 15.160 4.050 1.900 11.630 1.535 4.520 0.010 1997 13.550 5.010 2.110 12.040 1.200 4.280 0.010 1998 16.240 3.950 1.680 10.160 1.275 4.840 0.010 1999 15.550 2.620 0.985 11.520 1.465 5.690 0.010 2000 9.500 1.390 0.440 8.900 1.465 5.440 0.015 2001 5.230 1.095 0.600 9.110 1.265 4.420 0.010 2002 5.372 3.575 0.969 14.137 1.067 4.218 0.013 2003 2.939 1.834 0.423 17.278 1.057 3.997 0.013 Table 5.4.1.1: Total annual German quotas (in 1000 tonnes) for cod, haddock, whiting, saithe, sole, plaice and Nephrops set at the beginning (1st January) of each year.
76

Relationships between TACs, Fish Landings and Fishing Effort in the North Sea
Year Cod Haddock Whiting Saithe Sole Plaice Nephrops
1997 10.66 -2.89 4.34 -0.67 2.11 0 13.40 +1.36 1.20 -0.01 5.63 -0.01 0.02 +0.01 1998 15.07 -1.18 3.95 0 1.68 0 10.26 +0.10 1.40 +0.12 4.84 0.12 0.03 +0.02 1999 14.65 -0.90 2.62 0 1.01 +0.03 12.05 +0.53 1.47 0 5.69 0 0.14 +0.13 2000 8.24 -1.26 1.39 0 0.44 0 9.39 +0.49 1.32 -0.15 5.44 -0.15 0.13 +0.12 2001 2.62 -2.61 0.95 -0.15 0.45 -0.15 9.77 +0.66 1.27 +0.01 4.57 +0.01 0.17 +0.16 2002 2.09 -3.28 3.58 0 0.97 0 14.15 +0.02 1.09 +0.02 4.86 +0.02 0.19 +0.17 2003 2.20 -0.74 1.65 -0.19 0.42 0 16.16 -1.12 0.82 -0.23 4.22 -0.23 0.12 +0.10 Table 5.4.1.2: Total annual German quotas (in 1000 tonnes) for cod, haddock, whiting, saithe, sole, plaice and Nephrops set at the end (31st December) of each year and the difference between beginning and end of each year.
77

Relationships between TACs, Fish Landings and Fishing Effort in the North Sea
Cod
1995 1996 1997 1998 1999 2000 2001 2002 2003
Year
4.0
8.0
12.0
16.0x1
000
tonn
es
LandingsQuota 1st Jan.Quota 31st Dec.
Cod
1995 1996 1997 1998 1999 2000 2001 2002 2003
Year
4.0
8.0
12.0
16.0x1
000
tonn
es
LandingsQuota 1st Jan.Quota 31st Dec.
LandingsQuota 1st Jan.Quota 31st Dec.
Haddock
1995 1996 1997 1998 1999 2000 2001 2002 2003
Year
1.0
2.0
3.0
4.0
5.0
x100
0 to
nnes
Whiting
1995 1996 1997 1998 1999 2000 2001 2002 2003
Year
0.5
1.0
1.5
2.0
x100
0 to
nnes
Saithe
1995 1996 1997 1998 1999 2000 2001 2002 2003
Year
10.0
12.0
14.0
16.0
x100
0 to
nnes
Sole
1995 1996 1997 1998 1999 2000 2001 2002 2003
Year
0.5
1.0
1.5
x100
0 to
nnes
Plaice
1995 1996 1997 1998 1999 2000 2001 2002 2003
Year
3.0
4.0
5.0
6.0
x100
0 to
nnes
Nephrops
1995 1996 1997 1998 1999 2000 2001 2002 2003
Year
0.00
0.05
0.10
0.15
Nep
hrop
s
Figure 5.4.1.1: Annual reported landings for cod, haddock, whiting, saithe, sole, plaice and Nephrops by German vessels landing in Germany and foreign countries, and the German quotas set at 1st January and actual quotas of 31st December of each year for each species.
78

Relationships between TACs, Fish Landings and Fishing Effort in the North Sea
CodHaddockPlaiceSaitheSoleWhiting
Species
1997 1998 1999 2000 2001 2002 2003
Year
-40
-20
0
20
40Q
uota
Diff
eren
ce (%
)
Figure 5.4.1.2: Difference between quotas at the beginning of the year (1st January) and the actual quotas at the end of the year (31st December) for the fish species cod, haddock, whiting, saithe, sole and plaice. Year Cod Haddock Whiting Saithe Sole Plaice Nephrops 1995 9.458 1.284 0.125 12.092 1.567 6.348 0 1996 8.344 1.769 0.186 11.535 0.669 4.779 0 1997 5.178 1.462 0.197 12.580 0.511 4.158 0 1998 8.044 1.314 0.103 10.115 0.782 2.773 0.058 1999 3.386 0.564 0.176 10.481 1.458 3.144 0.104 2000 1.741 0.342 0.425 9.273 1.279 4.309 0.080 2001 1.804 0.681 0.400 9.470 0.939 4.667 0.139 2002 2.018 0.853 0.354 10.954 0.759 3.927 0.126 2003 2.048 1.562 0.334 8.908 0.749 3.800 0.050 Table 5.4.1.3: Total annual German landings (in 1000 tonnes) for cod, haddock, whiting, saithe, sole and plaice.
79

Relationships between TACs, Fish Landings and Fishing Effort in the North Sea
R n Species Quota 1st Jan. Quota 31st Dec. Quota 1st Jan. Quota 31st Dec.
Cod +.765* +.753 9 7 Haddock +.617 +.485 9 7 Whiting -.830** -.797* 9 7 Saithe -.031 +.196 9 7 Sole +.720* +.568 9 7 Plaice +.377 -.105 9 7 Nephrops +.292 +.790 9 6 Table 5.4.1.4: Correlation coefficients relating German quotas for cod, haddock, whiting, saithe, sole and plaice and their landings by German registered vessels over the period 1995 to 2003. Significance levels indicated as P<0.05*, P<0.01** and samples sizes (number of years for which quota data were available).
80

Relationships between TACs, Fish Landings and Fishing Effort in the North Sea
Cod
4.0 8.0 12.0 16.0
German Quota (x1000 t)
2.0
4.0
6.0
8.0
Land
ings
(x10
00 t)
1995
1996
1997
1998
1999
20002001
20022003
Haddock
1.0 2.0 3.0 4.0 5.0
German Quota (x1000 t)
0.5
1.0
1.5
Land
ings
(x10
00 t)
1995
1996
1997
1998
1999
2000
2001
2002
2003
Whiting
0.5 1.0 1.5 2.0
German Quota (x1000 t)
0.1
0.2
0.3
0.4
Land
ings
(x10
00 t)
1995
1996 1997
1998
1999
2000
2001
20022003
Saithe
10.0 12.0 14.0 16.0
German Quota (x1000 t)
9.0
10.0
11.0
12.0
Land
ings
(x10
00 t)
1995
1996
1997
1998
1999
2000
2001
2002
2003
Sole
1.2 1.4 1.6 1.8
German Quota (x1000 t)
0.5
0.8
1.0
1.3
1.5
Land
ings
(x10
00 t)
1995
1996
1997
1998
1999
2000
2001
2002
2003
Plaice
4.0 4.5 5.0 5.5 6.0
German Quota (x1000 t)
3.0
4.0
5.0
6.0
Land
ings
(x10
00 t)
1995
1996
1997
1998
1999
2000
2001
2002
2003
Nephrops
0.00 0.05 0.10 0.15
German Quota (x1000 t)
0.00
0.05
0.10
Land
ings
(x10
00 t)
19951996 1997
1998
1999
2000
2001
2002
2003
Figure 5.4.1.3: Relationships between the annual reported landings of cod, haddock, whiting, saithe, sole, plaice and Nephrops by German vessels landing in Germany and foreign countries, and the German quota for each species in each year. In case of Nephrops the actual quota of 31st December of each year was used.
81

Relationships between TACs, Fish Landings and Fishing Effort in the North Sea
In order to test whether the relationship between landings and quota differ between different areas of the North Sea, the analysis was additionally carried out with data broken down into the three sub regions of the ICES management area 4 (4A, 4B and 4C). Table 5.4.1.5 gives the results of the correlation between German quotas for each of the seven species, and their landings by German vessels in these sub regions. This reveals that the relationship between quota and landings differ between the sub regions. For Haddock a significantly positively correlation was found for sub region 4A (comprising 44 % of the cod landings by the German fleet) but no significant correlation for sub region 4B (56 % of landings). A significantly positively correlation was found for landings and quotas of sole in sub region 4B (83 % of landings) and a negatively correlation in sub region 4C (17 % of landings). Quota 1st Jan. Species 4A 4B 4C Cod +.597 (21 %) +.768* (74 %) +.575 (5 %) Haddock +.686* (44 %) +.264 (56 %) x Whiting +.631 (9 %) -.836** (49 %) -.829** (42 %) Saithe -.195 (93 %) +.624 (7 %) x Sole x +.768* (83 %) -.630 (17 %) Plaice x +.435 (93 %) -.499 (7 %) Nephrops +.192 (1 %) +.290 (99 %) x Quota 31st Dec. Species 4A 4B 4C Cod +.715 +.737 +.688 Haddock +.779* +.304 x Whiting +.334 -.785* -.790* Saithe +.002 +.863* x Sole x +.661 -.717 Plaice x -.126 +.068 Nephrops -.241 +881** x Table 5.4.1.5: Correlation coefficients relating German quotas for cod, haddock, whiting, saithe, sole, plaice and Nephrops and their landings by German registered vessels over the period 1995 to 2003 in the sub regions 4A, 4B and 4C. Percentage of annual landings of each species per sub region is given in brackets. Significance levels indicated as P<0.05*, P<0.01**. Samples sizes (number of years for which quota data were available) are the same as indicated in Table 5.4.1.3 (x - less then 0.5 % of total landings). If using the quotas after swapping (31. December) the relationship between quotas and landings and the resulting correlation coefficients were quite similar for most species. However, in case of Nephrops a highly significant positively correlation was found in sub region 4B if using quotas after swapping in contrast to no significant correlation if using quotas from the beginning of the year. The reasons for the fact of no correlation between quotas and landings are very different; species dependent and in case of cod also area dependent. In the nineties the cod catches from the German Bight dominated the total landings. Due to the migration of cod more into the north by climate effects and low stock size the landings from the German Bight decreased nearly to zero for the fleet was not able to catch the quota. In the recent 3 years the quota at the end of the year was adjusted realistically by quota swapping to the level of the expected landings. The Figures for whiting, haddock and saithe are driven by the market. Whiting is of low market value and the market
82
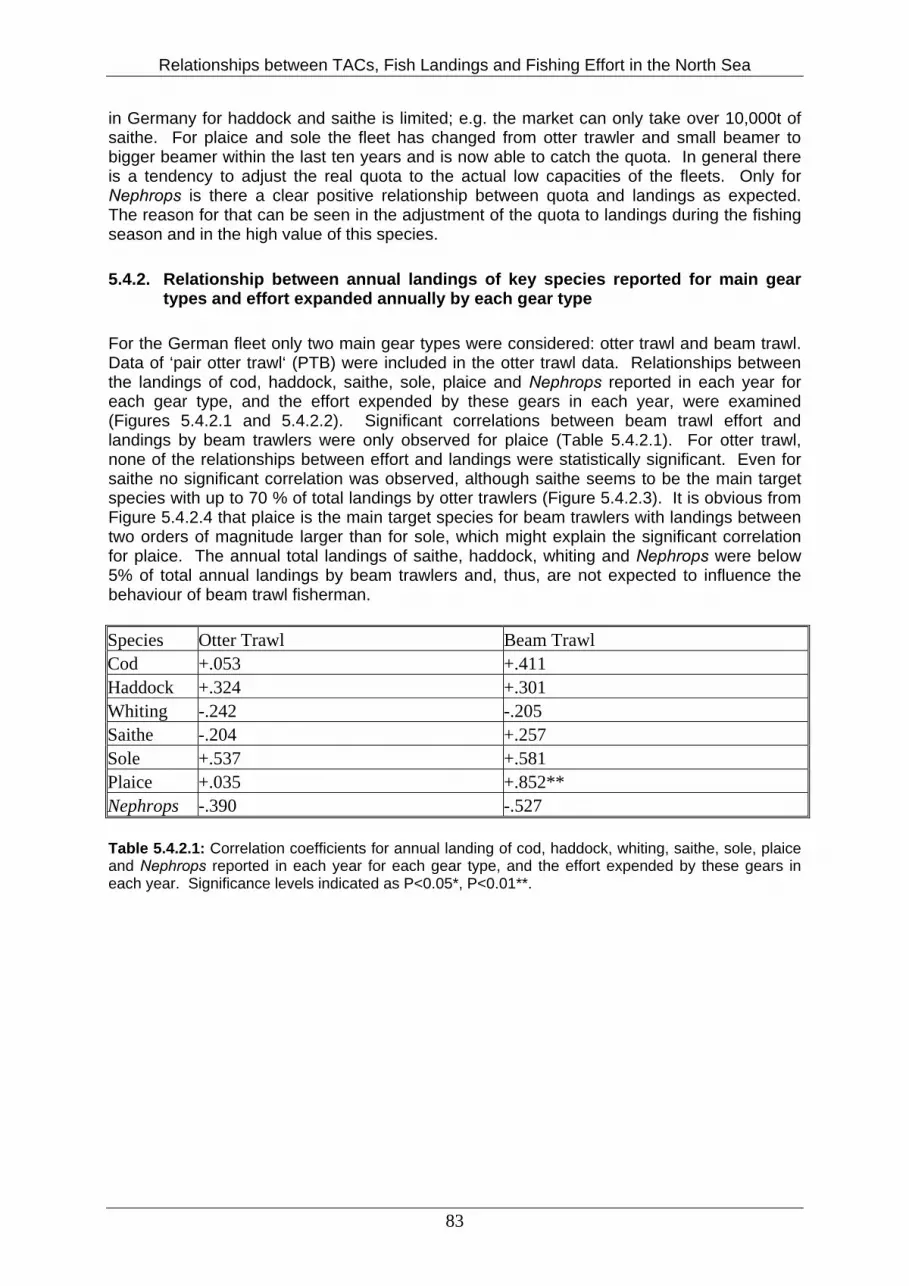
Relationships between TACs, Fish Landings and Fishing Effort in the North Sea
in Germany for haddock and saithe is limited; e.g. the market can only take over 10,000t of saithe. For plaice and sole the fleet has changed from otter trawler and small beamer to bigger beamer within the last ten years and is now able to catch the quota. In general there is a tendency to adjust the real quota to the actual low capacities of the fleets. Only for Nephrops is there a clear positive relationship between quota and landings as expected. The reason for that can be seen in the adjustment of the quota to landings during the fishing season and in the high value of this species. 5.4.2. Relationship between annual landings of key species reported for main gear
types and effort expanded annually by each gear type For the German fleet only two main gear types were considered: otter trawl and beam trawl. Data of ‘pair otter trawl‘ (PTB) were included in the otter trawl data. Relationships between the landings of cod, haddock, saithe, sole, plaice and Nephrops reported in each year for each gear type, and the effort expended by these gears in each year, were examined (Figures 5.4.2.1 and 5.4.2.2). Significant correlations between beam trawl effort and landings by beam trawlers were only observed for plaice (Table 5.4.2.1). For otter trawl, none of the relationships between effort and landings were statistically significant. Even for saithe no significant correlation was observed, although saithe seems to be the main target species with up to 70 % of total landings by otter trawlers (Figure 5.4.2.3). It is obvious from Figure 5.4.2.4 that plaice is the main target species for beam trawlers with landings between two orders of magnitude larger than for sole, which might explain the significant correlation for plaice. The annual total landings of saithe, haddock, whiting and Nephrops were below 5% of total annual landings by beam trawlers and, thus, are not expected to influence the behaviour of beam trawl fisherman. Species Otter Trawl Beam Trawl Cod +.053 +.411 Haddock +.324 +.301 Whiting -.242 -.205 Saithe -.204 +.257 Sole +.537 +.581 Plaice +.035 +.852** Nephrops -.390 -.527 Table 5.4.2.1: Correlation coefficients for annual landing of cod, haddock, whiting, saithe, sole, plaice and Nephrops reported in each year for each gear type, and the effort expended by these gears in each year. Significance levels indicated as P<0.05*, P<0.01**.
83
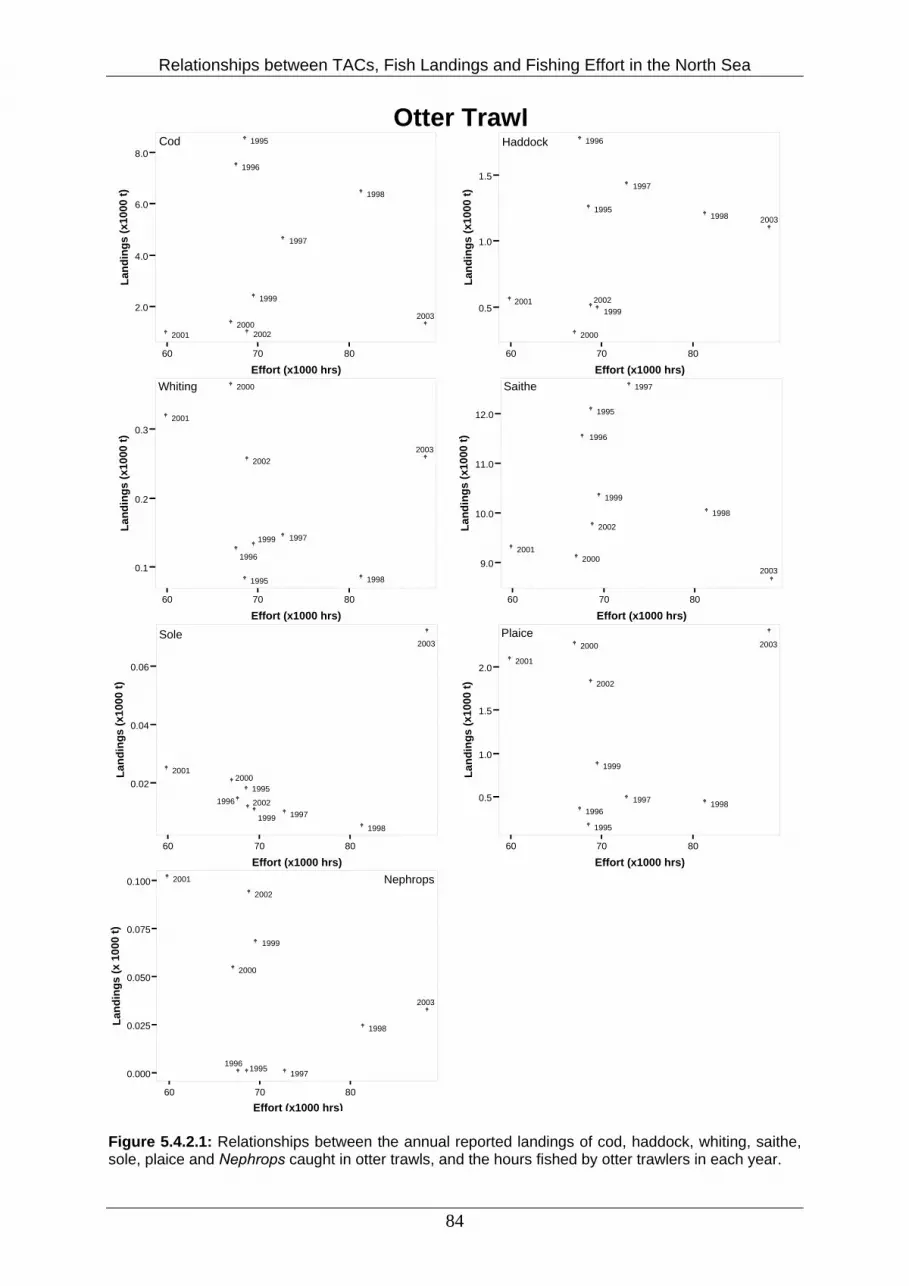
Relationships between TACs, Fish Landings and Fishing Effort in the North Sea
Otter TrawlCod
60 70 80
Effort (x1000 hrs)
2.0
4.0
6.0
8.0
Land
ings
(x10
00 t)
1995
1996
1997
1998
1999
20002001 2002
2003
Haddock
60 70 80
Effort (x1000 hrs)
0.5
1.0
1.5
Land
ings
(x10
00 t)
1995
1996
1997
1998
1999
2000
2001 2002
2003
Whiting
60 70 80
Effort (x1000 hrs)
0.1
0.2
0.3
Land
ings
(x10
00 t)
1995
1996
1997
1998
1999
2000
2001
20022003
Saithe
60 70 80
Effort (x1000 hrs)
9.0
10.0
11.0
12.0
Land
ings
(x10
00 t)
1995
1996
1997
1998
1999
20002001
2002
2003
Sole
60 70 80
Effort (x1000 hrs)
0.02
0.04
0.06
Land
ings
(x10
00 t)
19951996
1997
19981999
20002001
2002
2003Plaice
60 70 80
Effort (x1000 hrs)
0.5
1.0
1.5
2.0
Land
ings
(x10
00 t)
1995
19961997 1998
1999
2000
2001
2002
2003
Nephrops
60 70 80
Effort (x1000 hrs)
0.000
0.025
0.050
0.075
0.100
Land
ings
(x 1
000
t)
199519961997
1998
1999
2000
2001
2002
2003
Figure 5.4.2.1: Relationships between the annual reported landings of cod, haddock, whiting, saithe, sole, plaice and Nephrops caught in otter trawls, and the hours fished by otter trawlers in each year.
84

Relationships between TACs, Fish Landings and Fishing Effort in the North Sea
Beam TrawlCod
60 70 80 90 100 110
Effort (x1000 hrs)
0.1
0.2
0.3
0.4
0.5
Land
ings
(x10
00 t)
1995
19961997
1998
1999
2000
200120022003
Haddock
60 70 80 90 100 110
Effort (x1000 hrs)
0.00
0.01
0.02
Land
ings
(x10
00 t)
1995
1996
1997
1998
1999
2000
2001
2002
2003
Whiting
60 70 80 90 100 110
Effort (x1000 hrs)
0.02
0.03
0.04
0.05
0.06
0.07
Land
ings
(x10
00 t)
1995
1996
1997
1998
1999
2000
2001
2002
2003 Saithe
60 70 80 90 100 110
Effort (x1000 hrs)
0.000
0.001
0.002
Land
ings
(x10
00 t)
19951996
1997
1998
19992000
2001
2002
2003
Sole
60 70 80 90 100 110
Effort (x1000 hrs)
0.6
0.8
1.0
1.2
1.4
Land
ings
(x10
00 t)
1995
1996
1997
1998
1999
2000
2001
2002
2003
Plaice
60 70 80 90 100 110
Effort (x1000 hrs)
2.0
3.0
4.0
5.0
6.0
Land
ings
(x10
00 t)
1995
1996
1997
1998 19992000
2001
2002
2003
Nephrops
60 70 80 90 100 110
Effort (x1000 hrs)
0.00
0.01
0.02
0.03
Land
ings
(x10
00 t)
19951996 1997
19981999
2000
2001
2002
2003
Figure 5.4.2.2: Relationships between the annual reported landings of cod, haddock, whiting, saithe, sole, plaice and Nephrops caught in beam trawls, and the hours fished by beam trawlers in each year.
85

Relationships between TACs, Fish Landings and Fishing Effort in the North Sea
Otter TrawlHaddock
1995 1996 1997 1998 1999 2000 2001 2002 2003
Year
20
40
60
80
% T
otal
Lan
ding
s
Cod
1995 1996 1997 1998 1999 2000 2001 2002 2003
Year
20
40
60
80
% T
otal
Lan
ding
s
Whiting
1995 1996 1997 1998 1999 2000 2001 2002 2003
Year
2
4
6
8
% T
otal
Lan
ding
s
Saithe
1995 1996 1997 1998 1999 2000 2001 2002 2003
Year
20
40
60
80
% T
otal
Lan
ding
s
Sole
1995 1996 1997 1998 1999 2000 2001 2002 2003
Year
0.2
0.4
0.6
0.8
1.0
% T
otal
Lan
ding
s
Plaice
1995 1996 1997 1998 1999 2000 2001 2002 2003
Year
20
40
60
80
% T
otal
Lan
ding
s
Nephrops
1995 1996 1997 1998 1999 2000 2001 2002 2003
Year
0.0
0.2
0.4
0.6
0.8
% T
otal
Lan
ding
s
Figure 5.4.2.3: Annual variation in species catch composition in the total otter trawl landings: proportion of total otter trawl landings that consisted of cod, haddock, whiting, saithe, sole, plaice and Nephrops.
86

Relationships between TACs, Fish Landings and Fishing Effort in the North Sea
Beam TrawlCod
1995 1996 1997 1998 1999 2000 2001 2002 2003
Year
20
40
60
80
% T
otal
Lan
ding
s
Haddock
1995 1996 1997 1998 1999 2000 2001 2002 2003
Year
0.0
0.2
0.4
0.6
0.8
% T
otal
Lan
ding
s
Whiting
1995 1996 1997 1998 1999 2000 2001 2002 2003
Year
2
4
6
8
% T
otal
Lan
ding
s
Saithe
1995 1996 1997 1998 1999 2000 2001 2002 2003
Year
0.0
0.2
0.4
0.6
0.8
% T
otal
Lan
ding
s
Sole
1995 1996 1997 1998 1999 2000 2001 2002 2003
Year
20
40
60
80
%To
tal L
andi
ngs
Plaice
1995 1996 1997 1998 1999 2000 2001 2002 2003
Year
20
40
60
80
% T
otal
Lan
ding
s
1995 1996 1997 1998 1999 2000 2001 2002 2003
Year
0.0
0.2
0.4
0.6
0.8
% T
otal
Lan
ding
s
Nephrops
Figure 5.4.2.4: Annual variation in species catch composition in the total beam trawl landings: proportion of total beam trawl landings that consisted of cod, haddock, whiting, saithe, sole, plaice and Nephrops.
87

Relationships between TACs, Fish Landings and Fishing Effort in the North Sea
Cod
0
20
40
60
80
100
1995 1996 1997 1998 1999 2000 2001 2002 2003
Y e a r
Haddock
0
20
40
60
80
100
1995 1996 1997 1998 1999 2000 2001 2002 2003
Y ea r
Whiting
0
20
40
60
80
100
1995 1996 1997 1998 1999 2000 2001 2002 2003
Y ea r
Saithe
0
20
40
60
80
100
1995 1996 1997 1998 1999 2000 2001 2002 2003
Y ea r
Sole
0
20
40
60
80
100
1994 1995 1996 1997 1998 1999 2000 2001 2002 2003 2004
Y ea r
Plaice
0
20
40
60
80
100
1995 1996 1997 1998 1999 2000 2001 2002 2003
Y ea r
Nephrops
0
20
40
60
80
100
1995 1996 1997 1998 1999 2000 2001 2002 2003
Y ea r
Figure 5.4.2.5: Trends in the proportion of the total annual reported landings of cod, haddock, whiting, saithe, sole, plaice and Nephrops caught in otter trawls by German vessels.
88

Relationships between TACs, Fish Landings and Fishing Effort in the North Sea
Cod
0
20
40
60
80
100
1995 1996 1997 1998 1999 2000 2001 2002 2003
Y ea r
Haddock
0
20
40
60
80
100
1995 1996 1997 1998 1999 2000 2001 2002 2003
Y e a r
Whiting
0
20
40
60
80
100
1995 1996 1997 1998 1999 2000 2001 2002 2003
Y ea r
Saithe
0
20
40
60
80
100
1995 1996 1997 1998 1999 2000 2001 2002 2003
Y ea r
Sole
0
20
40
60
80
100
1994 1995 1996 1997 1998 1999 2000 2001 2002 2003 2004
Y ea r
Plaice
0
20
40
60
80
100
1995 1996 1997 1998 1999 2000 2001 2002 2003
Y ea r
Nephrops
0
20
40
60
80
100
1995 1996 1997 1998 1999 2000 2001 2002 2003
Y ea r
Figure 5.4.2.6: Trends in the proportion of the total annual reported landings of cod, haddock, whiting, saithe, sole, plaice and Nephrops caught in beam trawls by German vessels. Table 5.4.2.2 gives the results of the correlation analyses between annual effort for each gear type for the seven species, and their landings by German vessels broken down into the three sub regions 4A, 4B and 4C of the ICES management area 4. In sub region 4A the landings of cod, haddock and saithe were significantly positively correlated to annual otter
89
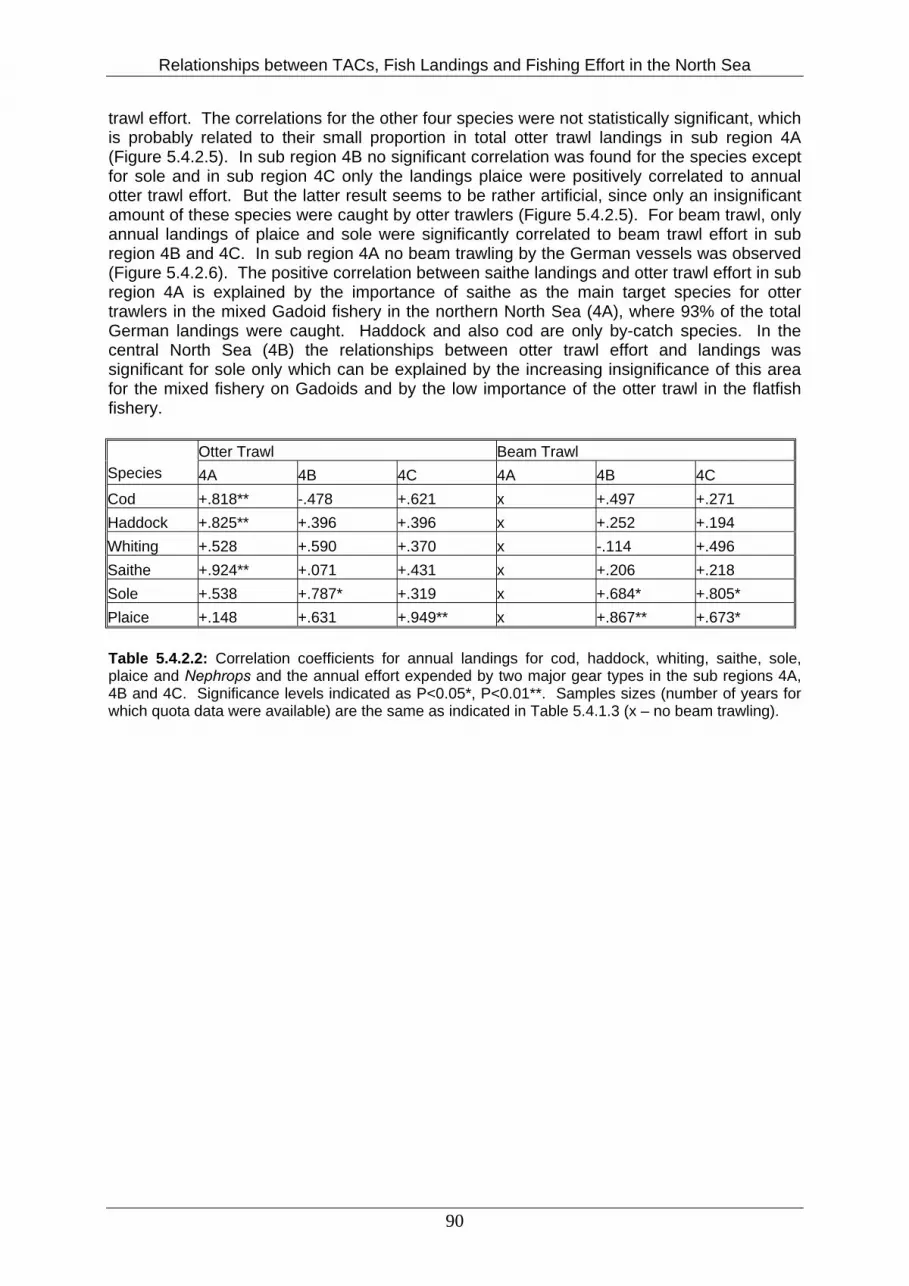
Relationships between TACs, Fish Landings and Fishing Effort in the North Sea
trawl effort. The correlations for the other four species were not statistically significant, which is probably related to their small proportion in total otter trawl landings in sub region 4A (Figure 5.4.2.5). In sub region 4B no significant correlation was found for the species except for sole and in sub region 4C only the landings plaice were positively correlated to annual otter trawl effort. But the latter result seems to be rather artificial, since only an insignificant amount of these species were caught by otter trawlers (Figure 5.4.2.5). For beam trawl, only annual landings of plaice and sole were significantly correlated to beam trawl effort in sub region 4B and 4C. In sub region 4A no beam trawling by the German vessels was observed (Figure 5.4.2.6). The positive correlation between saithe landings and otter trawl effort in sub region 4A is explained by the importance of saithe as the main target species for otter trawlers in the mixed Gadoid fishery in the northern North Sea (4A), where 93% of the total German landings were caught. Haddock and also cod are only by-catch species. In the central North Sea (4B) the relationships between otter trawl effort and landings was significant for sole only which can be explained by the increasing insignificance of this area for the mixed fishery on Gadoids and by the low importance of the otter trawl in the flatfish fishery.
Otter Trawl Beam Trawl Species 4A 4B 4C 4A 4B 4C Cod +.818** -.478 +.621 x +.497 +.271 Haddock +.825** +.396 +.396 x +.252 +.194 Whiting +.528 +.590 +.370 x -.114 +.496 Saithe +.924** +.071 +.431 x +.206 +.218 Sole +.538 +.787* +.319 x +.684* +.805* Plaice +.148 +.631 +.949** x +.867** +.673* Table 5.4.2.2: Correlation coefficients for annual landings for cod, haddock, whiting, saithe, sole, plaice and Nephrops and the annual effort expended by two major gear types in the sub regions 4A, 4B and 4C. Significance levels indicated as P<0.05*, P<0.01**. Samples sizes (number of years for which quota data were available) are the same as indicated in Table 5.4.1.3 (x – no beam trawling).
90
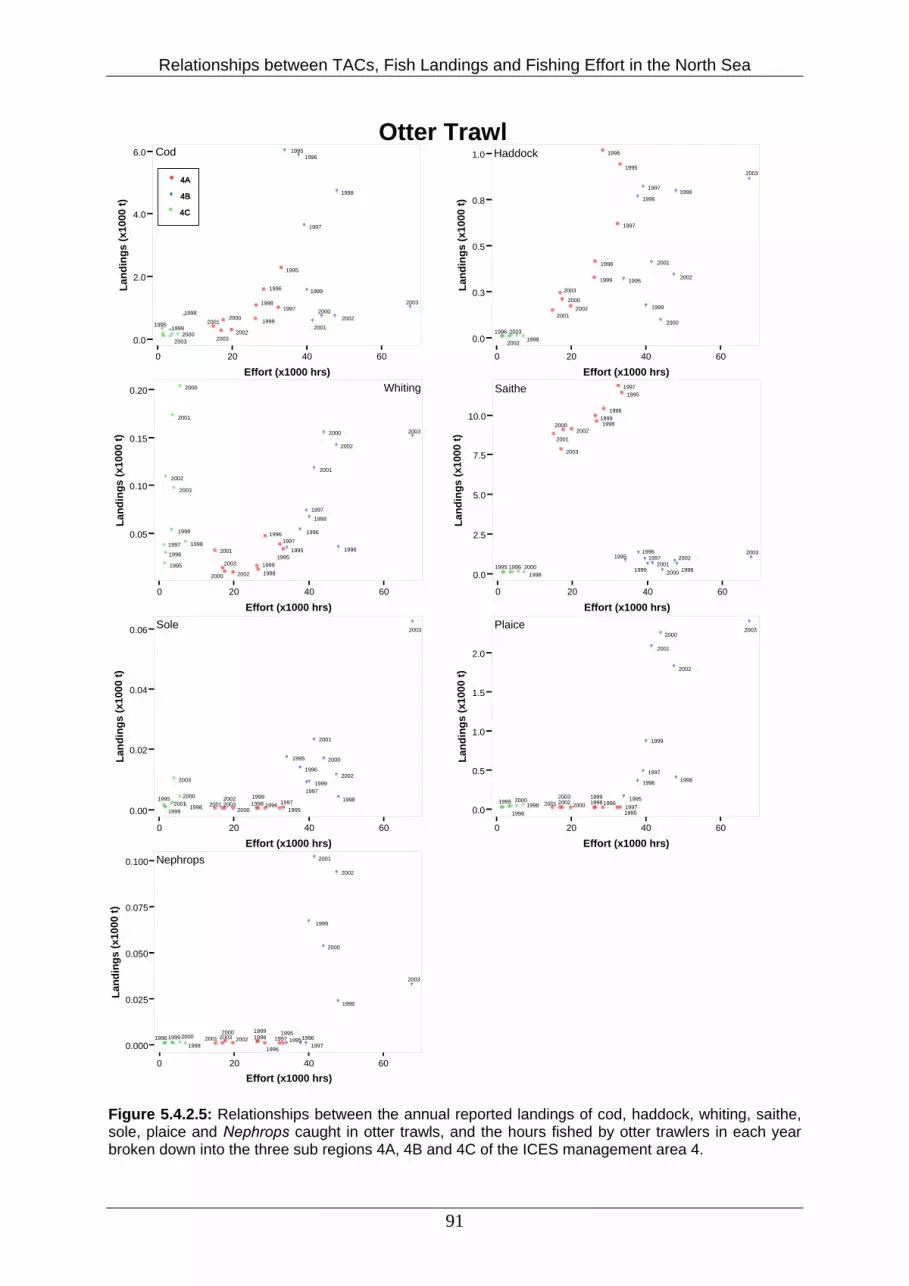
Relationships between TACs, Fish Landings and Fishing Effort in the North Sea
Otter Trawl
0 20 40 60
Effort (x1000 hrs)
0.0
2.0
4.0
6.0
Land
ings
(x10
00 t)
1995
1996
19971998
199920002001
20022003
19951996
1997
1998
1999
2000
20012002
2003
1995
1998
19992000
2003
Cod
4C
4A
4B
4C4C
4A4A
4B4B
Haddock
0 20 40 60
Effort (x1000 hrs)
0.0
0.3
0.5
0.8
1.0
Land
ings
(x10
00 t)
1995
1996
1997
1998
1999
2000
20012002
2003
1995
1996
19971998
1999
2000
2001
2002
2003
199619982002
2003
Whiting
0 20 40 60
Effort (x1000 hrs)
0.05
0.10
0.15
0.20
Land
ings
(x10
00 t)
1995
19961997
19981999
2000
2001
2002
2003
1995
1996
1997
1998
1999
2000
2001
2002
2003
1995
1996
1997 1998
1999
2000
2001
2002
2003
Saithe
0 20 40 60
Effort (x1000 hrs)
0.0
2.5
5.0
7.5
10.0
Land
ings
(x10
00 t)
1995
1996
1997
19981999
2000
20012002
2003
19951996
1997
19981999 20002001
20022003
1995 19961998
2000
Sole
0 20 40 60
Effort (x1000 hrs)
0.00
0.02
0.04
0.06
Land
ings
(x10
00 t)
19951996 19971998
1999
20002001
20022003
1995
1996
19971998
1999
2000
2001
2002
2003
19951998
1999
20002001
2003
Plaice
0 20 40 60
Effort (x1000 hrs)
0.0
0.5
1.0
1.5
2.0
Land
ings
(x10
00 t)
1995
19961997
19981999
20002001 20022003 1995
1996
19971998
1999
2000
2001
2002
2003
1995
19961998
2000
Nephrops
0 20 40 60
Effort (x1000 hrs)
0.000
0.025
0.050
0.075
0.100
Land
ings
(x10
00 t)
1995
1996
1997199819992000
2001 20022003 199519961997
1998
1999
2000
2001
2002
2003
19961998
1999 2000
Figure 5.4.2.5: Relationships between the annual reported landings of cod, haddock, whiting, saithe, sole, plaice and Nephrops caught in otter trawls, and the hours fished by otter trawlers in each year broken down into the three sub regions 4A, 4B and 4C of the ICES management area 4.
91
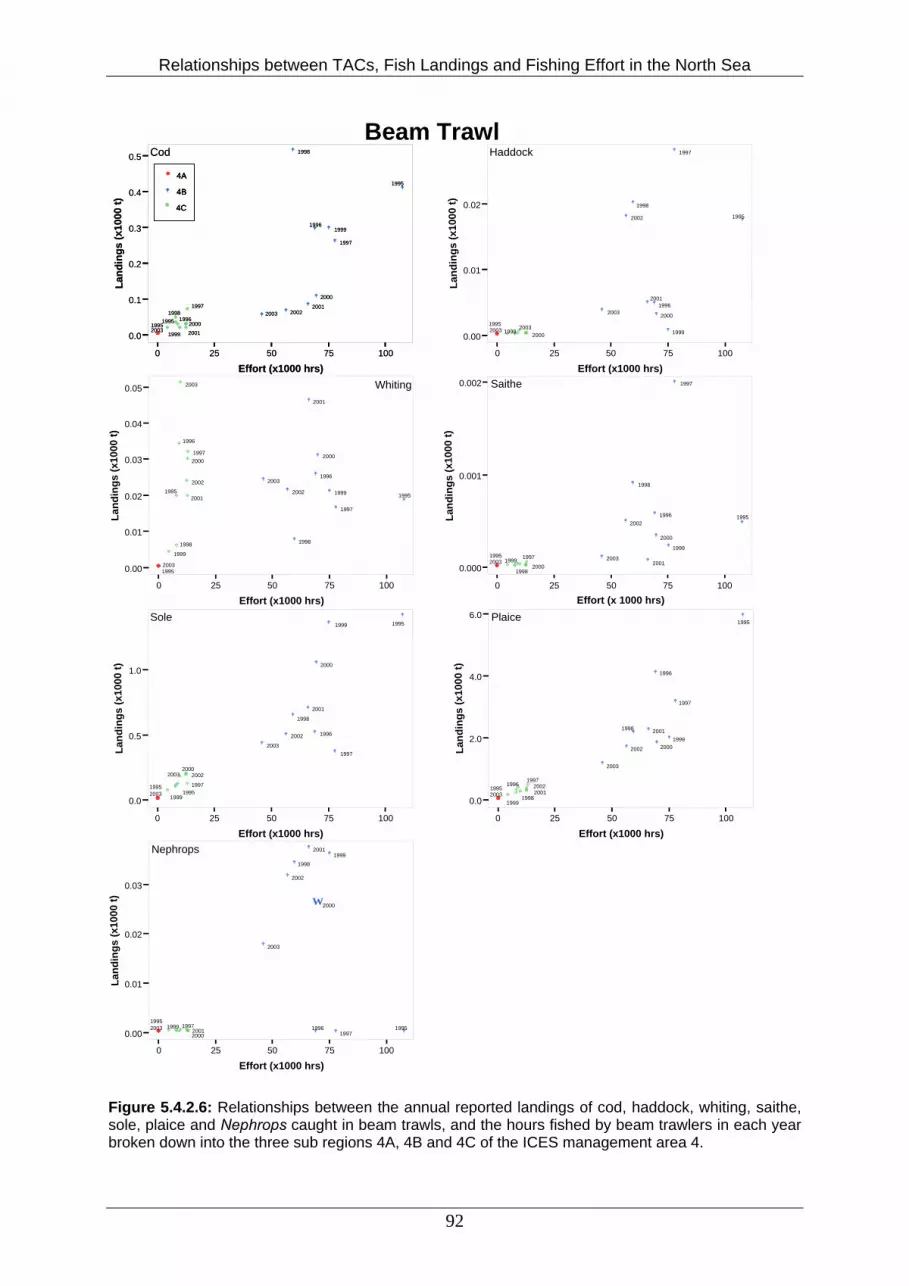
Relationships between TACs, Fish Landings and Fishing Effort in the North Sea
Beam Trawl
0 25 50 75 100
Effort (x1000 hrs)
0.0
0.1
0.2
0.3
0.4
0.5
Land
ings
(x10
00 t)
19952003
1995
1996
1997
1998
1999
2000
200120022003
1995 1996
19971998
1999
20002001
Cod
4C
4A
4B
0 25 50 75 100
Effort (x1000 hrs)
0.0
0.1
0.2
0.3
0.4
0.5
Land
ings
(x10
00 t)
19952003
1995
1996
1997
1998
1999
2000
200120022003
1995 1996
19971998
1999
20002001
Cod
4C
4A
4B
4C4C
4A4A
4B4B
0 25 50 75 100
Effort (x1000 hrs)
0.00
0.01
0.02
Land
ings
(x10
00 t)
19952003
1995
1996
1997
1998
1999
2000
2001
2002
2003
1999 20002003
Haddock
0 25 50 75 100
Effort (x1000 hrs)
0.00
0.01
0.02
0.03
0.04
0.05
Land
ings
(x10
00 t)
19952003
1995
1996
1997
1998
1999
2000
2001
2002
2003
1995
1996
1997
1998
1999
2000
2001
2002
2003 Whiting
0 25 50 75 100
Effort (x 1000 hrs)
0.000
0.001
0.002
Land
ings
(x10
00 t)
19952003
19951996
1997
1998
1999
2000
2001
2002
20031997
1998
19992000
Saithe
0 25 50 75 100
Effort (x1000 hrs)
0.0
0.5
1.0
Land
ings
(x10
00 t)
19952003
1995
1996
1997
1998
1999
2000
2001
2002
2003
19951997
1999
200020022003
Sole
0 25 50 75 100
Effort (x1000 hrs)
0.0
2.0
4.0
6.0
Land
ings
(x10
00 t)
19952003
1995
1996
1997
1998
19992000
2001
2002
2003
19961997
19981999
20012002
Plaice
0 25 50 75 100
Effort (x1000 hrs)
0.00
0.01
0.02
0.03
Land
ings
(x10
00 t)
19952003
W
199519961997
19981999
2000
2001
2002
2003
1997199920002001
Nephrops
Figure 5.4.2.6: Relationships between the annual reported landings of cod, haddock, whiting, saithe, sole, plaice and Nephrops caught in beam trawls, and the hours fished by beam trawlers in each year broken down into the three sub regions 4A, 4B and 4C of the ICES management area 4.
92
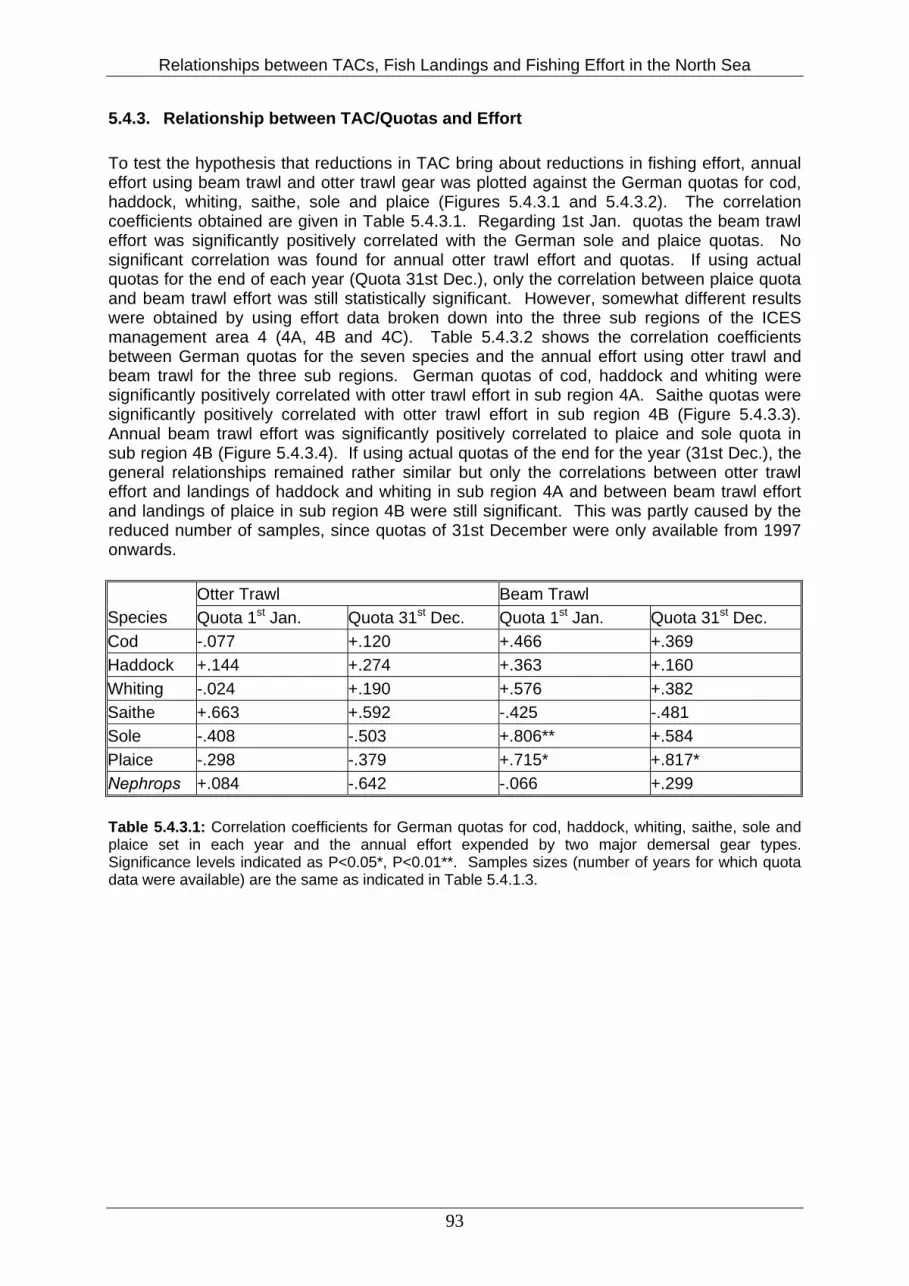
Relationships between TACs, Fish Landings and Fishing Effort in the North Sea
5.4.3. Relationship between TAC/Quotas and Effort To test the hypothesis that reductions in TAC bring about reductions in fishing effort, annual effort using beam trawl and otter trawl gear was plotted against the German quotas for cod, haddock, whiting, saithe, sole and plaice (Figures 5.4.3.1 and 5.4.3.2). The correlation coefficients obtained are given in Table 5.4.3.1. Regarding 1st Jan. quotas the beam trawl effort was significantly positively correlated with the German sole and plaice quotas. No significant correlation was found for annual otter trawl effort and quotas. If using actual quotas for the end of each year (Quota 31st Dec.), only the correlation between plaice quota and beam trawl effort was still statistically significant. However, somewhat different results were obtained by using effort data broken down into the three sub regions of the ICES management area 4 (4A, 4B and 4C). Table 5.4.3.2 shows the correlation coefficients between German quotas for the seven species and the annual effort using otter trawl and beam trawl for the three sub regions. German quotas of cod, haddock and whiting were significantly positively correlated with otter trawl effort in sub region 4A. Saithe quotas were significantly positively correlated with otter trawl effort in sub region 4B (Figure 5.4.3.3). Annual beam trawl effort was significantly positively correlated to plaice and sole quota in sub region 4B (Figure 5.4.3.4). If using actual quotas of the end for the year (31st Dec.), the general relationships remained rather similar but only the correlations between otter trawl effort and landings of haddock and whiting in sub region 4A and between beam trawl effort and landings of plaice in sub region 4B were still significant. This was partly caused by the reduced number of samples, since quotas of 31st December were only available from 1997 onwards.
Otter Trawl Beam Trawl Species Quota 1st Jan. Quota 31st Dec. Quota 1st Jan. Quota 31st Dec. Cod -.077 +.120 +.466 +.369 Haddock +.144 +.274 +.363 +.160 Whiting -.024 +.190 +.576 +.382 Saithe +.663 +.592 -.425 -.481 Sole -.408 -.503 +.806** +.584 Plaice -.298 -.379 +.715* +.817* Nephrops +.084 -.642 -.066 +.299 Table 5.4.3.1: Correlation coefficients for German quotas for cod, haddock, whiting, saithe, sole and plaice set in each year and the annual effort expended by two major demersal gear types. Significance levels indicated as P<0.05*, P<0.01**. Samples sizes (number of years for which quota data were available) are the same as indicated in Table 5.4.1.3.
93
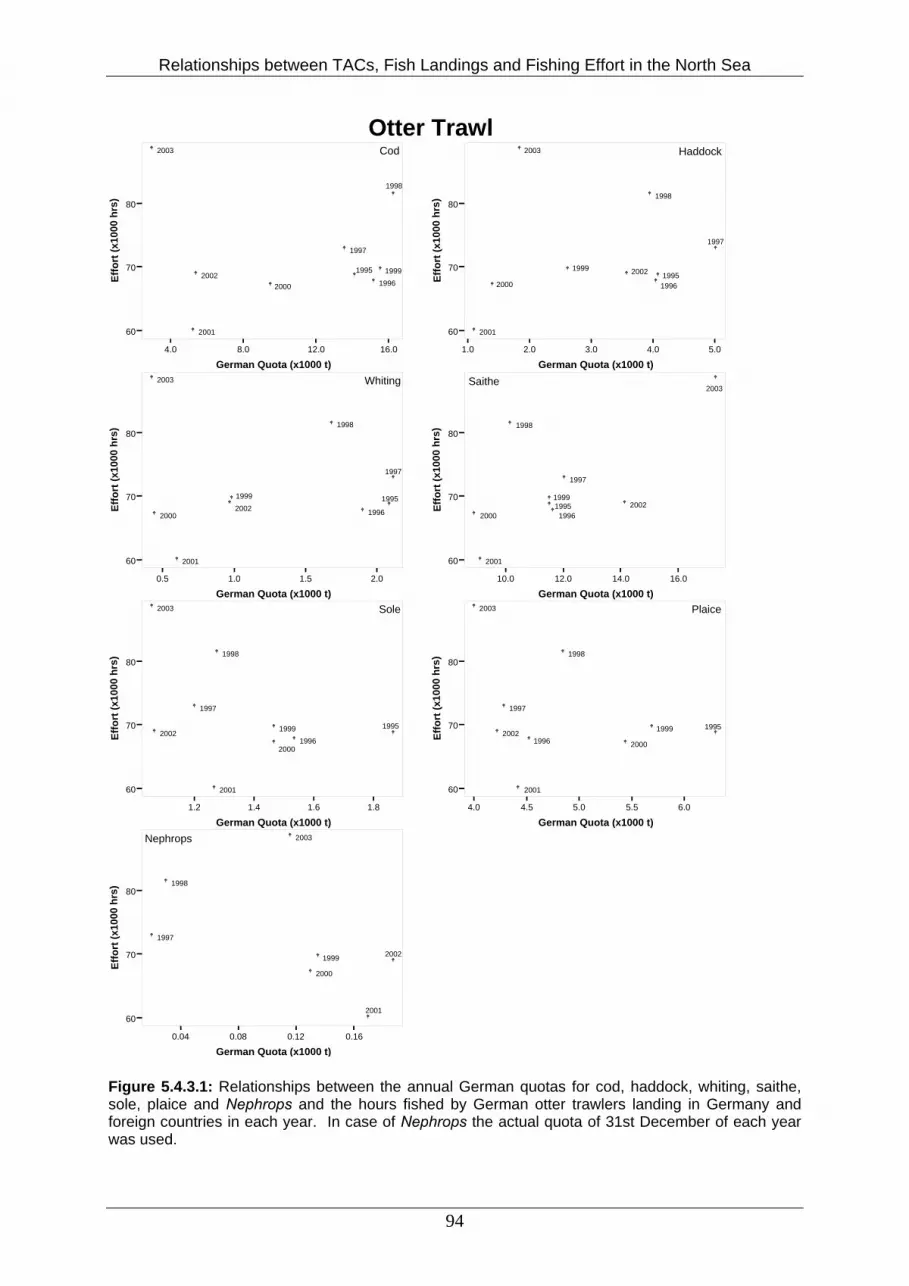
Relationships between TACs, Fish Landings and Fishing Effort in the North Sea
Otter Trawl
4.0 8.0 12.0 16.0
German Quota (x1000 t)
60
70
80
Effo
rt (x
1000
hrs
)
1995
1996
1997
1998
1999
2000
2001
2002
2003 Cod
1.0 2.0 3.0 4.0 5.0
German Quota (x1000 t)
60
70
80
Effo
rt (x
1000
hrs
)
19951996
1997
1998
1999
2000
2001
2002
2003 Haddock
0.5 1.0 1.5 2.0
German Quota (x1000 t)
60
70
80
Effo
rt (x
1000
hrs
)
1995
1996
1997
1998
1999
2000
2001
2002
2003 Whiting
10.0 12.0 14.0 16.0
German Quota (x1000 t)
60
70
80Ef
fort
(x10
00 h
rs)
19951996
1997
1998
1999
2000
2001
2002
2003Saithe
1.2 1.4 1.6 1.8
German Quota (x1000 t)
60
70
80
Effo
rt (x
1000
hrs
)
1995
1996
1997
1998
1999
2000
2001
2002
2003 Sole
4.0 4.5 5.0 5.5 6.0
German Quota (x1000 t)
60
70
80
Effo
rt (x
1000
hrs
)
1995
1996
1997
1998
1999
2000
2001
2002
2003 Plaice
0.04 0.08 0.12 0.16
German Quota (x1000 t)
60
70
80
Effo
rt (x
1000
hrs
)
1997
1998
1999
2000
2001
2002
2003Nephrops
Figure 5.4.3.1: Relationships between the annual German quotas for cod, haddock, whiting, saithe, sole, plaice and Nephrops and the hours fished by German otter trawlers landing in Germany and foreign countries in each year. In case of Nephrops the actual quota of 31st December of each year was used.
94
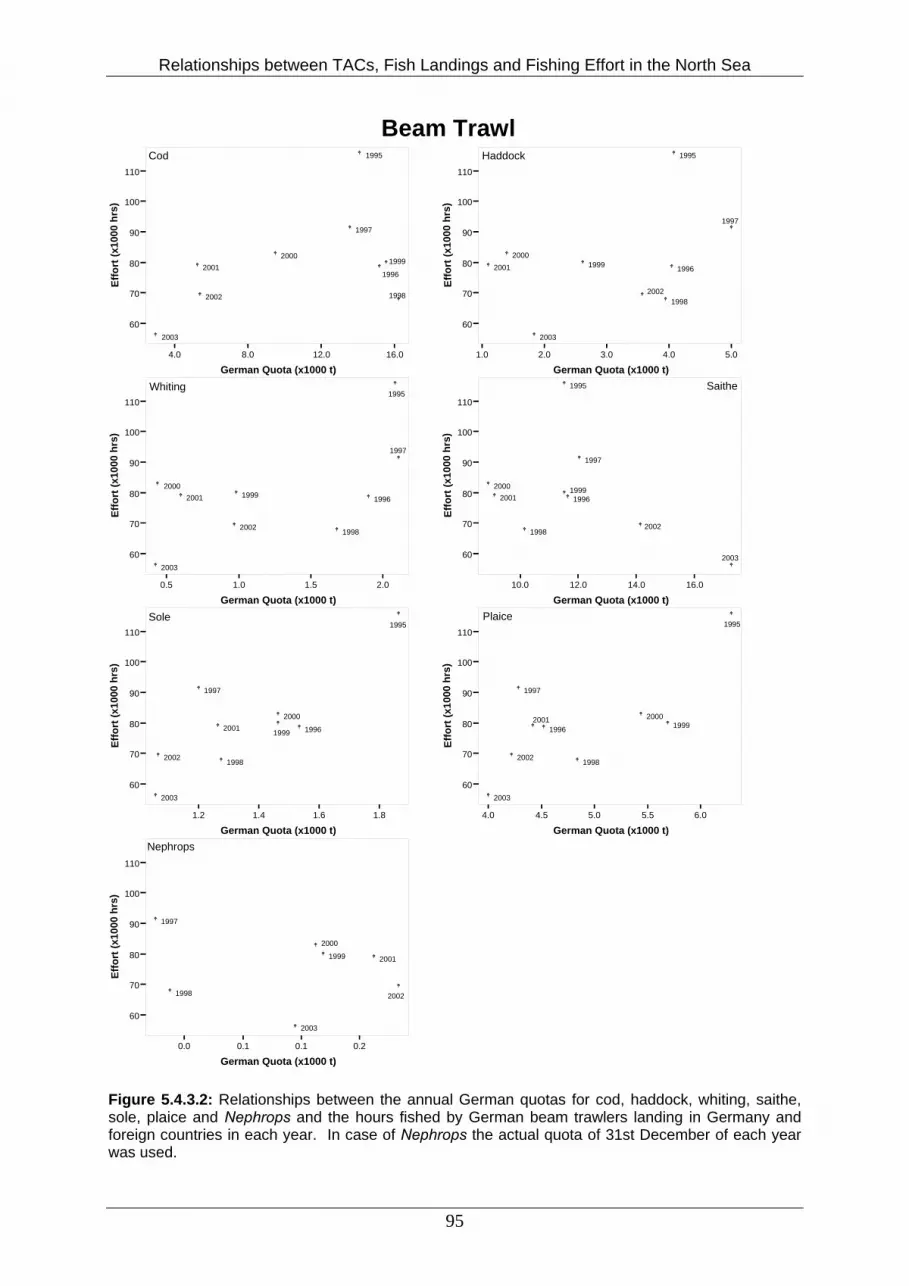
Relationships between TACs, Fish Landings and Fishing Effort in the North Sea
Beam Trawl
4.0 8.0 12.0 16.0
German Quota (x1000 t)
60
70
80
90
100
110
Effo
rt (x
1000
hrs
)
1995
1996
1997
1998
19992000
2001
2002
2003
Cod
1.0 2.0 3.0 4.0 5.0
German Quota (x1000 t)
60
70
80
90
100
110
Effo
rt (x
1000
hrs
)
1995
1996
1997
1998
19992000
2001
2002
2003
Haddock
0.5 1.0 1.5 2.0
German Quota (x1000 t)
60
70
80
90
100
110
Effo
rt (x
1000
hrs
)
1995
1996
1997
1998
19992000
2001
2002
2003
Whiting
10.0 12.0 14.0 16.0
German Quota (x1000 t)
60
70
80
90
100
110
Effo
rt (x
1000
hrs
)
1995
1996
1997
1998
199920002001
2002
2003
Saithe
1.2 1.4 1.6 1.8
German Quota (x1000 t)
60
70
80
90
100
110
Effo
rt (x
1000
hrs
)
1995
1996
1997
1998
1999
20002001
2002
2003
Sole
4.0 4.5 5.0 5.5 6.0
German Quota (x1000 t)
60
70
80
90
100
110
Effo
rt (x
1000
hrs
)
1995
1996
1997
1998
199920002001
2002
2003
Plaice
0.0 0.1 0.1 0.2
German Quota (x1000 t)
60
70
80
90
100
110
Effo
rt (x
1000
hrs
)
1997
1998
1999
2000
2001
2002
2003
Nephrops
Figure 5.4.3.2: Relationships between the annual German quotas for cod, haddock, whiting, saithe, sole, plaice and Nephrops and the hours fished by German beam trawlers landing in Germany and foreign countries in each year. In case of Nephrops the actual quota of 31st December of each year was used.
95

Relationships between TACs, Fish Landings and Fishing Effort in the North Sea
4A4B4C
4.0 8.0 12.0 16.0
GFR Quota (x1000 t)
0.0
20.0
40.0
60.0
Effo
rt (x
1000
hrs
)
199519961997
19981999
2000
2001
20022003
1995 19961997
1998
1999
2000
2001
2002
2003
1995 19961997
1998
19992000
2001
20022003
Cod4A4B4C
1.0 2.0 3.0 4.0 5.0
GFR Quota (x1000 t)
0.0
20.0
40.0
60.0
Effo
rt (x
1000
hrs
)
1995
1996 1997
19981999
2000
20012002
2003
19951996
1997
1998
1999
2000
2001
2002
2003
19951996 1997
1998
19992000
20012002
2003
Haddock
4A4B4C
10.0 12.0 14.0 16.0
GFR Quota (x1000 t)
0.0
20.0
40.0
60.0
Effo
rt (x
1000
hrs
)
1995
1996
1997
19981999
2000
2001
2002 2003
19951996
1997
1998
1999
2000
2001
2002
2003
19951996
1997
19981999
2000
20012002
2003
Saithe
4A4B4C
0.5 1.0 1.5 2.0
GFR Quota (x1000 t)
0.0
20.0
40.0
60.0
Effo
rt (x
1000
hrs
)
1995
19961997
19981999
2000
2001
20022003
19951996
1997
1998
1999
2000
2001
2002
2003
19951996 1997
19981999
20002001
2002
2003
Whiting
4A4B4C
1.2 1.4 1.6 1.8
GFR Quota (x1000 t)
0.0
20.0
40.0
60.0
Effo
rt (x
1000
t)
19951996
1997
1998 1999
2000
2001
2002
2003
19951996
1997
1998
1999
2000
2001
2002
2003
199519961997
19981999
20002001
2002
2003
Sole4A4B4C
4.0 4.5 5.0 5.5 6.0
GFR Quota (x1000 t)
0.0
20.0
40.0
60.0
Effo
rt (x
1000
hrs
)
19951996
1997
1998 1999
2000
2001
2002
2003
199519961997
1998
1999
2000
2001
2002
2003
19951996
1997
1998
19992000
200120022003
Plaice
Otter Trawl
4A4B4C
Nephrops
0.00 0.05 0.10 0.15
GFR Quota (x1000 t)
0.0
20.0
40.0
60.0
Effo
rt (x
1000
hrs
)
1997
1998 1999
2000
2001
2002
2003
1997
1998
1999
2000
2001
2002
2003
1997
1998
19992000
20012002
2003
Figure 5.4.3.3: Relationships between the annual German quotas for cod, haddock, whiting, saithe, sole, plaice and Nephrops and the hours fished by German otter trawlers landing in Germany and foreign countries in each year broken down into the three sub regions 4A, 4B and 4C of the ICES management area 4. In case of Nephrops the actual quota of 31st December of each year was used.
96

Relationships between TACs, Fish Landings and Fishing Effort in the North Sea
BeamTrawl
4.0 8.0 12.0 16.0
German Quota (x1000 t)
0
25
50
75
100
Effo
rt (x
1000
hrs
)
199519961997 1998
199920002001
20022003
1995
1996
1997
1998
1999
20002001
2002
2003
1995 19961997
19981999
20002001
20022003
Cod
1.0 2.0 3.0 4.0 5.0
German Quota (x1000 t)
0
25
50
75
100
Effo
rt (x
1000
hrs
)
19951996
1997199819992000
2001 20022003
1995
1996
1997
1998
1999
20002001
2002
2003
19951996
1997
19981999
20002001 2002
2003
Haddock
0.5 1.0 1.5 2.0
German Quota (x1000 t)
0
25
50
75
100
Effo
rt (x
1000
hrs
)
19951996 1997199819992000 2001 2002
2003
1995
1996
1997
1998
19992000
2001
2002
2003
19951996
1997
19981999
2000 2001 20022003
Whiting
10.0 12.0 14.0 16.0
German Quota (x1000 t)
0
25
50
75
100
Effo
rt (x
1000
hrs
)
1995 199619971998 1999
20002001 2002
2003
1995
1996
1997
1998
19992000
2001
2002
2003
1995 1996
1997
19981999
20002001 2002 2003
Saithe
1.2 1.4 1.6 1.8
German Quota (x1000 t)
0
25
50
75
100
Effo
rt (x
1000
hrs
)
19951996
19971998 1999 2000
20012002
2003
1995
1996
1997
1998
1999
20002001
2002
2003
19951996
1997
19981999
2000200120022003
Sole
4.0 4.5 5.0 5.5 6.0
German Quota (x1000 t)
0
25
50
75
100
Effo
rt (x
1000
hrs
)
19951996
19971998 19992000
200120022003
1995
1996
1997
1998
19992000
2001
2002
2003
19951996
1997
19981999
200020012002
2003
Plaice
0.00 0.05 0.10 0.15
German Quota (x1000 t)
0
25
50
75
100
Effo
rt (x
1000
hrs
)
19951996
19971998 19992000 2001
20022003
1995
1996
1997
1998
1999
20002001
2002
2003
19951996 1997
19981999
2000 20012002
2003
Nephrops
4C
4A
4B
4C4C
4A4A
4B4B
Figure 5.4.3.4: Relationships between the annual German quotas for cod, haddock, whiting, saithe, sole, plaice and Nephrops and the hours fished by German beam trawlers landing in Germany and foreign countries in each year broken down into the three sub regions 4A, 4B and 4C of the ICES management area 4. In case of Nephrops the actual quota of 31st December of each year was used.
97
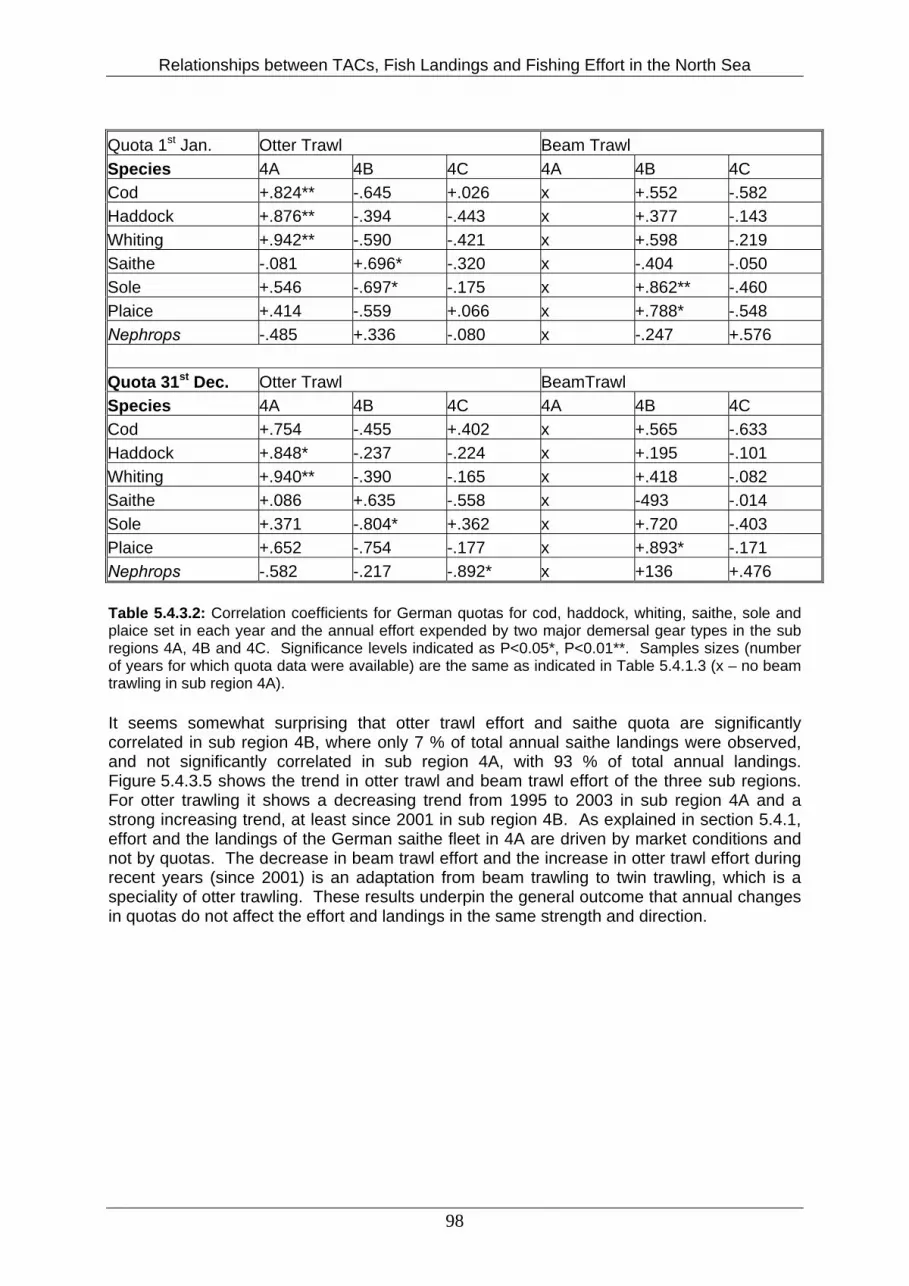
Relationships between TACs, Fish Landings and Fishing Effort in the North Sea
Quota 1st Jan. Otter Trawl Beam Trawl Species 4A 4B 4C 4A 4B 4C Cod +.824** -.645 +.026 x +.552 -.582 Haddock +.876** -.394 -.443 x +.377 -.143 Whiting +.942** -.590 -.421 x +.598 -.219 Saithe -.081 +.696* -.320 x -.404 -.050 Sole +.546 -.697* -.175 x +.862** -.460 Plaice +.414 -.559 +.066 x +.788* -.548 Nephrops -.485 +.336 -.080 x -.247 +.576 Quota 31st Dec. Otter Trawl BeamTrawl Species 4A 4B 4C 4A 4B 4C Cod +.754 -.455 +.402 x +.565 -.633 Haddock +.848* -.237 -.224 x +.195 -.101 Whiting +.940** -.390 -.165 x +.418 -.082 Saithe +.086 +.635 -.558 x -493 -.014 Sole +.371 -.804* +.362 x +.720 -.403 Plaice +.652 -.754 -.177 x +.893* -.171 Nephrops -.582 -.217 -.892* x +136 +.476 Table 5.4.3.2: Correlation coefficients for German quotas for cod, haddock, whiting, saithe, sole and plaice set in each year and the annual effort expended by two major demersal gear types in the sub regions 4A, 4B and 4C. Significance levels indicated as P<0.05*, P<0.01**. Samples sizes (number of years for which quota data were available) are the same as indicated in Table 5.4.1.3 (x – no beam trawling in sub region 4A). It seems somewhat surprising that otter trawl effort and saithe quota are significantly correlated in sub region 4B, where only 7 % of total annual saithe landings were observed, and not significantly correlated in sub region 4A, with 93 % of total annual landings. Figure 5.4.3.5 shows the trend in otter trawl and beam trawl effort of the three sub regions. For otter trawling it shows a decreasing trend from 1995 to 2003 in sub region 4A and a strong increasing trend, at least since 2001 in sub region 4B. As explained in section 5.4.1, effort and the landings of the German saithe fleet in 4A are driven by market conditions and not by quotas. The decrease in beam trawl effort and the increase in otter trawl effort during recent years (since 2001) is an adaptation from beam trawling to twin trawling, which is a speciality of otter trawling. These results underpin the general outcome that annual changes in quotas do not affect the effort and landings in the same strength and direction.
98
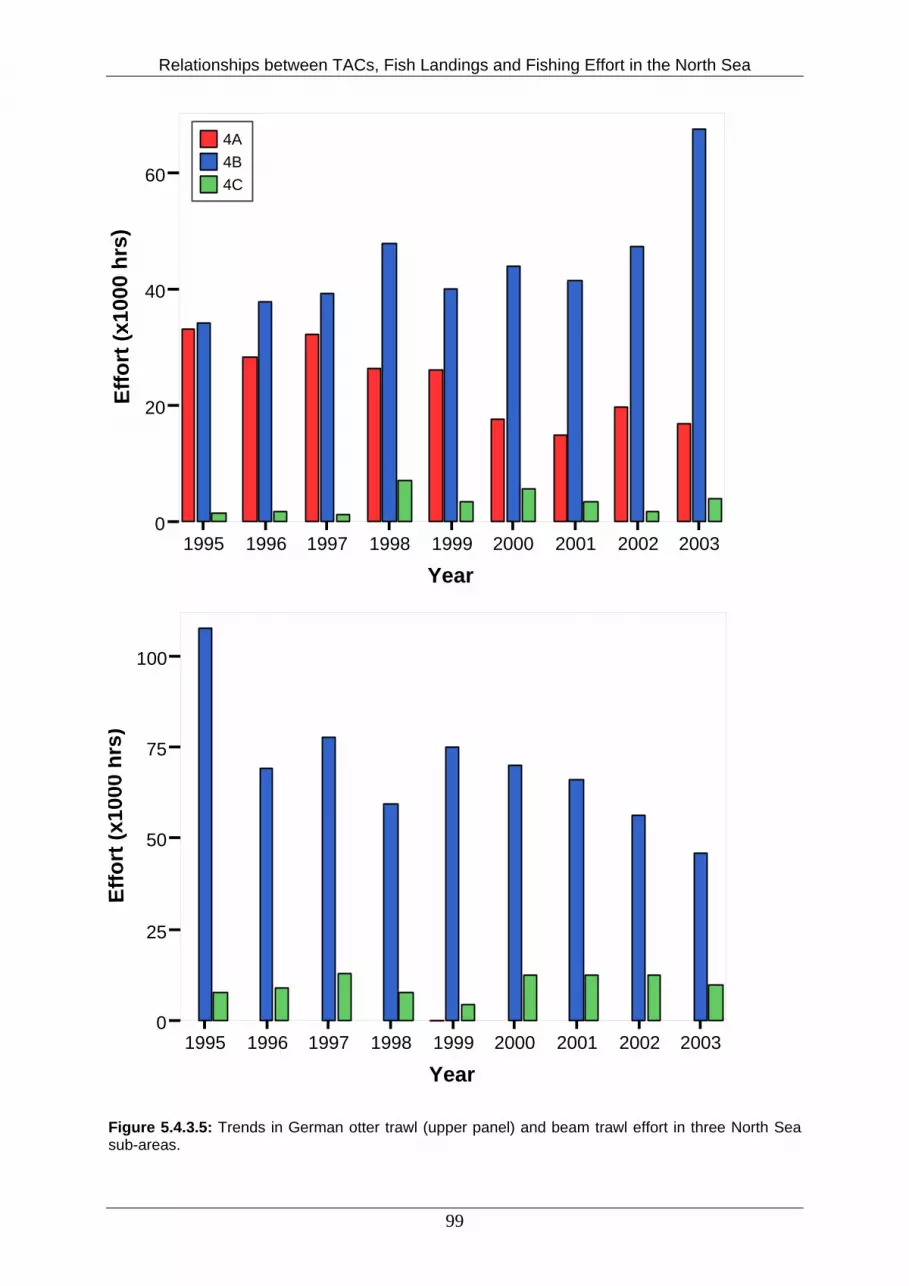
Relationships between TACs, Fish Landings and Fishing Effort in the North Sea
4A4B4C
1995 1996 1997 1998 1999 2000 2001 2002 2003
Year
0
20
40
60
Effo
rt (x
1000
hrs
)
1995 1996 1997 1998 1999 2000 2001 2002 2003
Year
0
25
50
75
100
Effo
rt (x
1000
hrs
)
Figure 5.4.3.5: Trends in German otter trawl (upper panel) and beam trawl effort in three North Sea sub-areas.
99

Relationships between TACs, Fish Landings and Fishing Effort in the North Sea
100
5.4.4. Spatial relationships between landings and effort in time Reported landings of each species caught by the main gear types in each ICES rectangle were correlated with the annual hours fishing by each gear in each rectangle. Both variables were first log-transformed. This was carried out for each year over the period 1995 to 2003. Table 5.4.4.1 gives the results of the correlation analyses. The relationships between otter trawl effort and landings of otter trawlers were significant for cod, haddock and whiting in each year. For saithe this relationship was found to be significant in two out of nine years only. The landings of the main target species of beam trawlers, sole and plaice, as well as the landings of cod were significantly correlated with beam trawl effort in each year. Thus the landings of the target species of otter trawlers cod, haddock and whiting as well as the landings of the target species of beam trawlers plaice and sole were significantly correlated with the effort of the corresponding gear in each year. Only the relationship between landings and effort of saithe as the main target species of otter trawlers shows statistically significant correlation in particular years only. This depends on the fact that the saithe fishery only takes place in certain rectangles in the northern North Sea near the 200m-depth line. An analysis only restricted to these rectangles would also lead to significant relationships. 5.4.5. Temporal relationships between landings and effort in space The relationship between landings and effort in each ICES statistical rectangle was examined for the German fleet for the period 1995-2003. Figures 5.4.5.1 and 5.4.5.2 gives the spatial differences in the correlation for each rectangle. The annul landings data of saithe and cod was correlated with the otter trawl effort and the landings data of plaice and sole with beam trawl effort. For saithe, there is a clear spatial pattern with predominantly high correlations in the northern and low correlations in the southern North Sea. The allocation of otter trawl effort seems to be mainly driven by saithe, which explain the high correlation in the North where 93 % of the German saithe landings were caught (see Section 5.4.3). For cod (as well as for haddock and whiting (not shown), this clear pattern did not hold true. For plaice and sole the correlation was generally rather high but no clear spatial pattern was observed. There was only a slightly higher correlation for sole in the south-western compared to the south-eastern North Sea.

Relationships between TACs, Fish Landings and Fishing Effort in the North Sea
101
Gear Species Year 1995 1996 1997 1998 1999 2000 2001 2002 2003Otter trawl Cod +.827** +.809** +.806** +.870** +.789** +.798** +.683** +.727** +.714** Haddock +.340** +.522** +.497** +.452** +.341** +.375** +.514** +.584** +.254* Whiting +.557** +.531** +.491** +.447** +.377** +.573** +.510** +.538** +.498** Saithe +.212 +.317** +.384** +.066 +.164 +.084 -.082 +.087 -.119 Sole +.269 +.059 +.034 +.245 +.259 +.407* +.358* +.563** +.472** Plaice +.215 +.249 +.421** +.526** +.556** +.476** +.574** +.508** +.474** Nephrops x x x -.068 +.421* +.442* +.466* +575** +.667**
Beam trawl Cod +.896** +.788** +.770** +.923** +.694** +.734** +.563** +.502** +.431** Haddock +.604** +.166 -.265 +.142 -.072 +.378* +.147 -.202 -.255 Whiting +.416** +.470** +.208 +.278 +.511** +.527** +.531** +.551** +.382* Saithe -.031 +.043 -.429* -.202 -.225 -.212 +.663 -.414 -.561 Sole +.862** +.786** +.725** +.749** +.812** +.883** +.785** +.728** +.784** Plaice +.853** +.842** +.930** +.919** +.883** +.772** +.814** +.874** +.742** Nephrops x x x +.317 +.327 +.656** +.126 +.223 +.267 Table 5.4.4.1: Correlation coefficients for spatial (landings effort data by ICES statistical rectangle) log-landings by log-effort relationships for each species and gear in each year. Significance levels indicated as P<0.05*, P<0.01** and grey shaded cells indicate non-significant correlations.
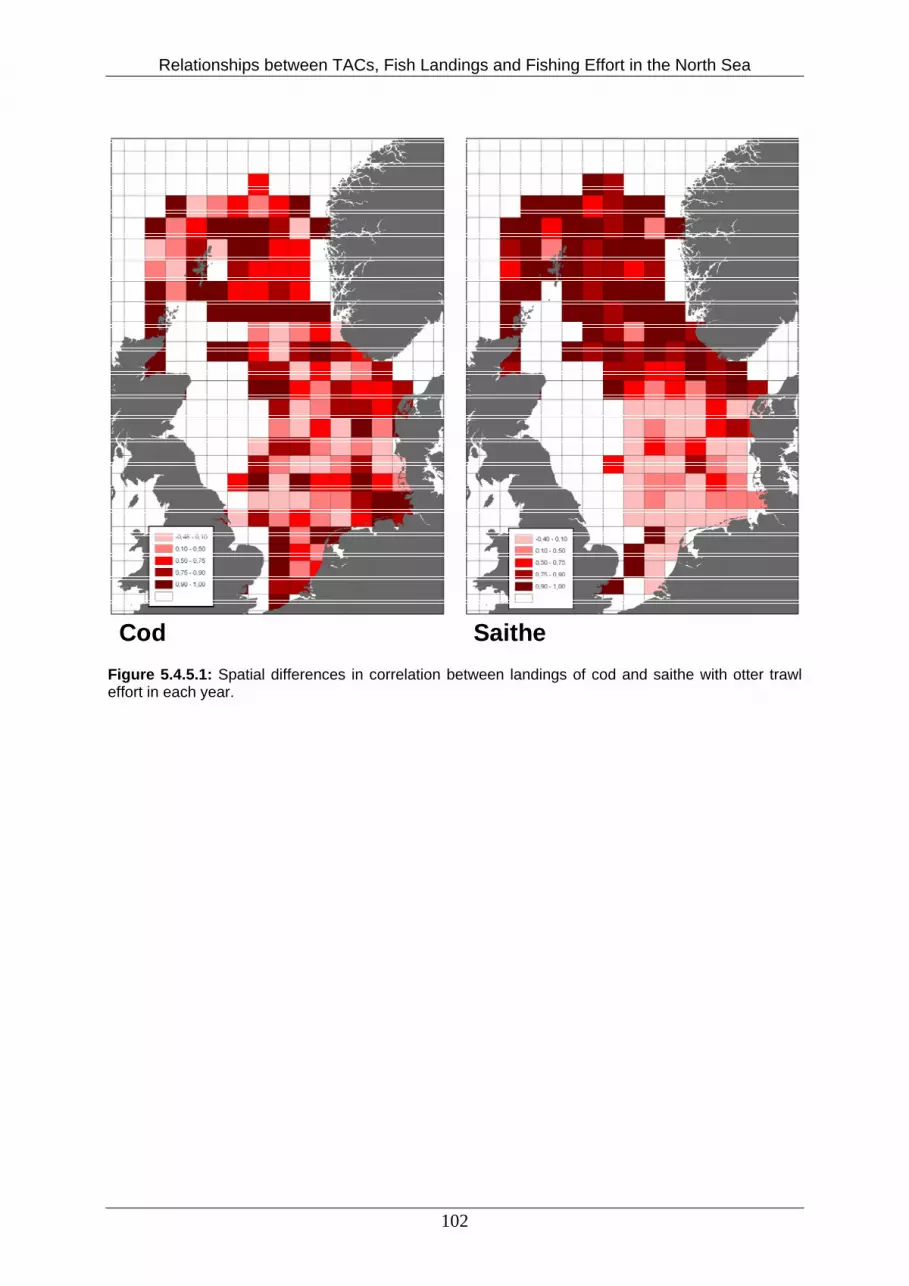
Relationships between TACs, Fish Landings and Fishing Effort in the North Sea
Cod Saithe Figure 5.4.5.1: Spatial differences in correlation between landings of cod and saithe with otter trawl effort in each year.
102

Relationships between TACs, Fish Landings and Fishing Effort in the North Sea
SolePlaice Figure 5.4.5.2: Spatial differences in correlation between landings of plaice and sole with beam trawl effort in each year. 5.5. Case Study 5: The Dutch Fleet 5.5.1. Relationships between Quotas and landings Tables 5.5.1.1. and 5.5.5.2 show the annual quotas of cod, whiting, plaice and sole available to Dutch fishermen and the actual quantities of fish landed in each year respectively. Landings of turbot and brill are not available for 1990-1994. Table 5.5.1.3 shows the results of the correlations analyses between Dutch quotas and the Dutch landings for cod, plaice, sole and whiting. For the main target species of the beam trawl fleet, sole and plaice, landings and quotas are highly correlated. Beam trawl vessels are the largest group within the Dutch fleet as a whole. For cod and whiting, targeted by otter trawlers, the correlation is less high, but significant too.
103

Relationships between TACs, Fish Landings and Fishing Effort in the North Sea
Year Cod Whiting Plaice Sole 1990 11500 4300 88800 18000 1991 10900 5000 85400 19500 1992 11400 6600 79500 20100 1993 12700 5600 75200 23400 1994 11400 5200 70300 23600 1995 12800 4400 50900 22200 1996 13600 4200 35700 16900 1997 12900 4700 36600 13200 1998 15800 3700 35000 15600 1999 14900 2500 40300 16300 2000 8700 2100 38300 16300 2001 4700 2300 33800 14800 2002 5200 3400 30800 13300
Table 5.5.1.1: Annual Netherlands quotas (tonnes) for cod, whiting, plaice and sole. Year Cod Whiting Plaice Sole Turbot Brill 1990 3452 1335 66713 14601 1991 2900 1867 61614 17137 1992 4127 2619 48279 17701 1993 4040 2607 45986 21005 1994 3657 2477 48407 22131 1995 6180 2665 43671 20689 2435 893 1996 5368 2408 34924 15187 1743 698 1997 6988 1854 33722 10155 1823 561 1998 10306 1638 30130 15072 1669 781 1999 7071 1438 37012 16165 1778 782 2000 4583 1472 34848 15231 2279 1024 2001 2844 1936 33618 13468 2277 1128 2002 3905 1991 28708 12026 1908 958
Table 5.5.1.2: Annual landings (tonnes) of cod, whiting, plaice, sole, brill and turbot by Dutch fishermen. Species Correlation Cod 0.684** Plaice 0.943*** Sole 0.965*** Whiting 0.658* Table 5.5.1.3: Pearson correlation coefficients relating Quotas for cod, plaice, sole and whiting and their landings over the period 1990-2002 (area IV). Significance levels indicated as P<0.05*, P<0.01**, P<0.001***. 5.5.2. Relationships between annual landings and effort Two main gear types were considered: beam trawl and otter trawl. Relationships between the landings of cod, plaice, sole, whiting, brill and turbot in each year for each gear type (1990-2002, except for brill and turbot: 1995-2002) and the effort expended by these gears in each year, were examined (Figures 5.5.2.1 to 5.5.2.4). Two sub-fleets were considered based on the hp-limit: hp-class 2 contains trawlers with a hp-limit above 300 hp, hp-class 1 those with a lower hp-limit (260-300 hp). Results of the correlations are shown in Table 5.5.2.1. For the hp-class 1 beam trawls there is a significant positive correlation between
104
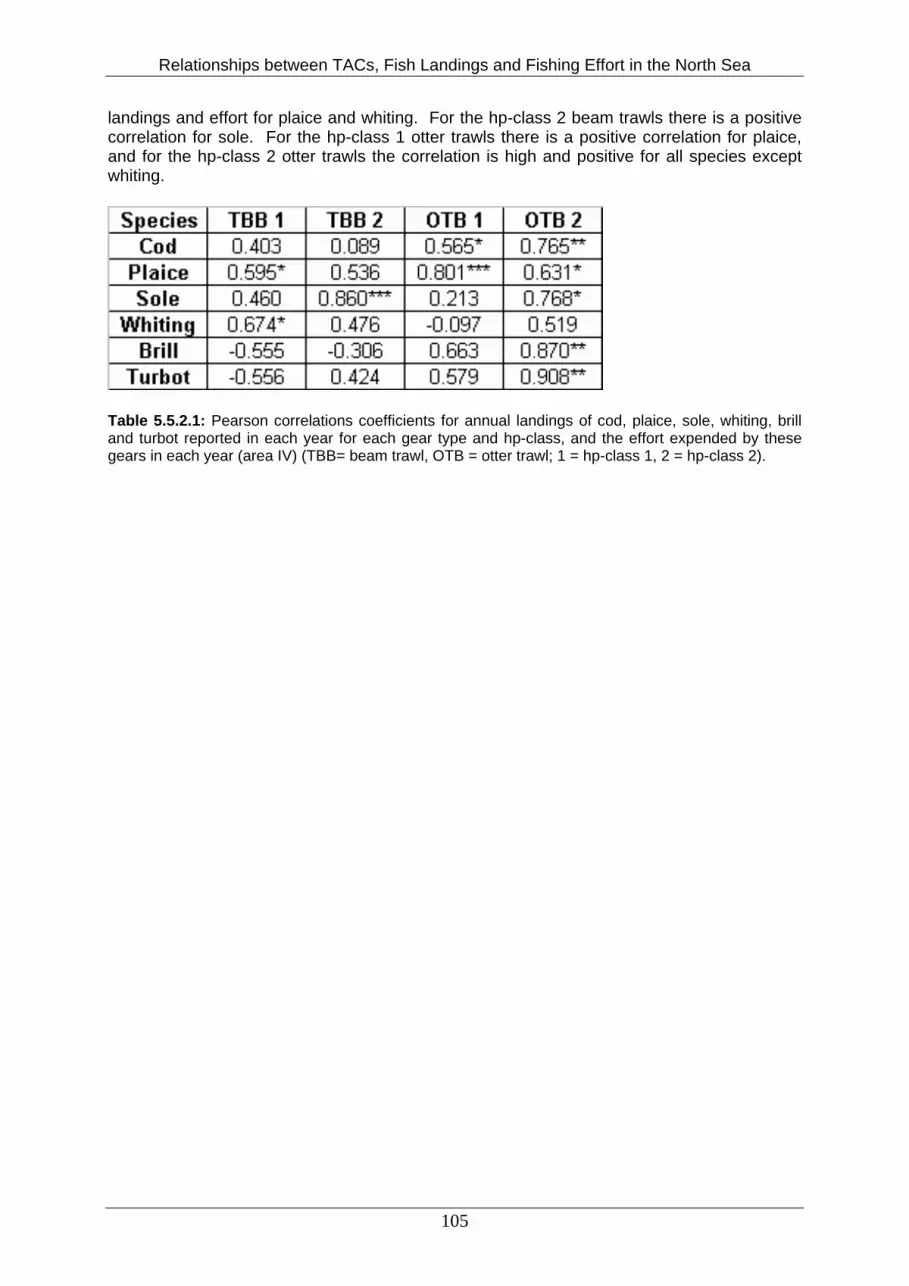
Relationships between TACs, Fish Landings and Fishing Effort in the North Sea
landings and effort for plaice and whiting. For the hp-class 2 beam trawls there is a positive correlation for sole. For the hp-class 1 otter trawls there is a positive correlation for plaice, and for the hp-class 2 otter trawls the correlation is high and positive for all species except whiting.
Table 5.5.2.1: Pearson correlations coefficients for annual landings of cod, plaice, sole, whiting, brill and turbot reported in each year for each gear type and hp-class, and the effort expended by these gears in each year (area IV) (TBB= beam trawl, OTB = otter trawl; 1 = hp-class 1, 2 = hp-class 2).
105
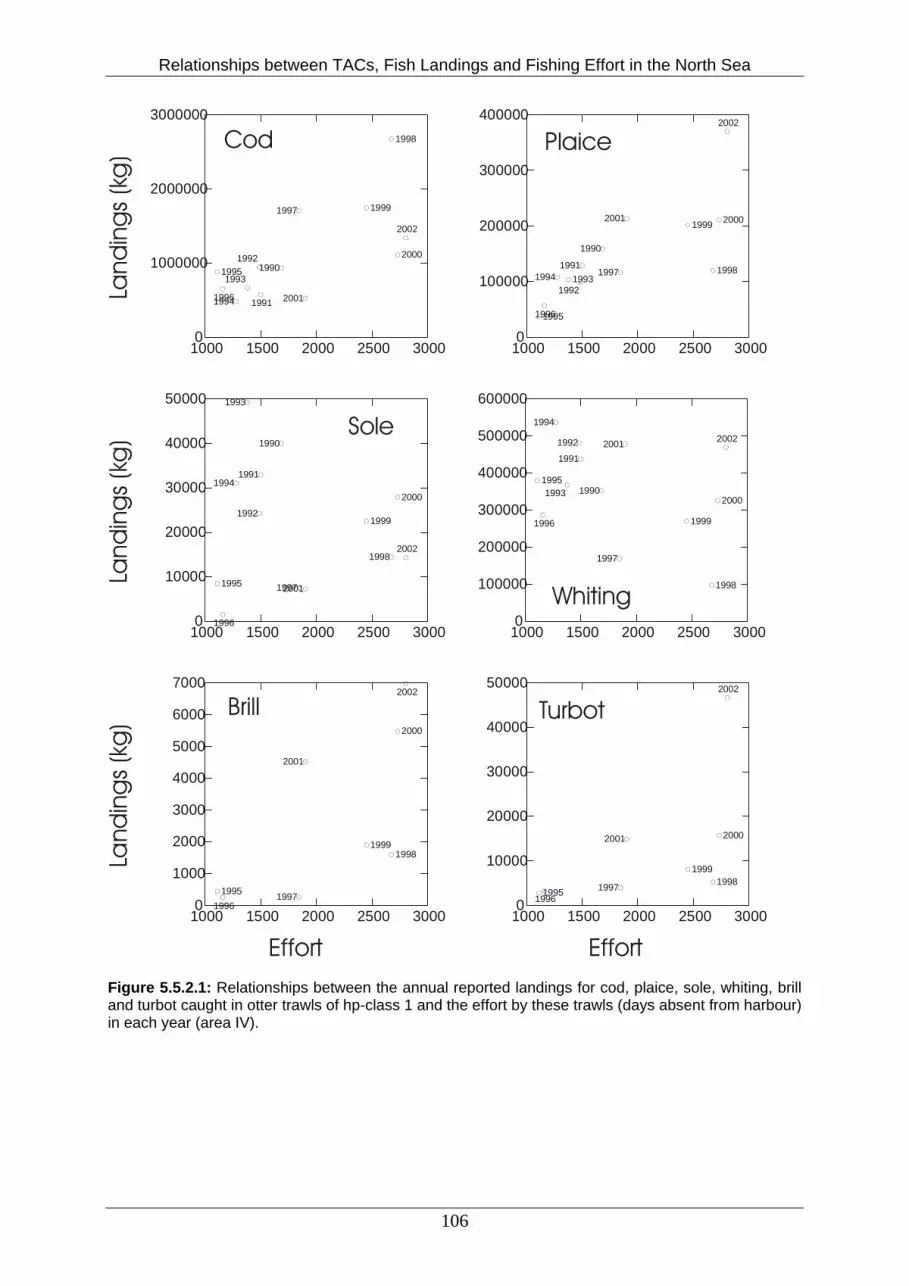
Relationships between TACs, Fish Landings and Fishing Effort in the North Sea
1000 1500 2000 2500 30000
1000000
2000000
3000000
1995
19961994
1993
1992
1991
2002
2000
1998
1999
2001
1997
1990
1000 1500 2000 2500 30000
100000
200000
300000
400000
19951996
1994 19931992
1991
2002
2000
1998
19992001
1997
1990
1000 1500 2000 2500 30000
10000
20000
30000
40000
50000
1995
1996
1994
1993
1992
1991
2002
2000
1998
1999
20011997
1990
1000 1500 2000 2500 30000
100000
200000
300000
400000
500000
600000
1995
1996
1994
1993
1992
1991
2002
2000
1998
1999
2001
1997
1990
1000 1500 2000 2500 30000
1000
2000
3000
4000
5000
6000
7000
19951996
1997
2001
2002
2000
19981999
1000 1500 2000 2500 30000
10000
20000
30000
40000
50000
19951996
1997
2001
2002
2000
19981999La
ndin
gs
(kg
)La
ndin
gs
(kg
)La
ndin
gs
(kg
)
EffortEffort
Cod Plaice
Whiting
Sole
Brill Turbot
Figure 5.5.2.1: Relationships between the annual reported landings for cod, plaice, sole, whiting, brill and turbot caught in otter trawls of hp-class 1 and the effort by these trawls (days absent from harbour) in each year (area IV).
106

Relationships between TACs, Fish Landings and Fishing Effort in the North Sea
0 500 1000 1500 2000100000
200000
300000
400000
500000
600000
700000
800000
900000
19951994
1996
1993
19921997
1990
2001
1999
2000
2002
1991
1998
0 500 1000 1500 20000
100000
200000
300000
400000
500000
600000
700000
19951994
1996
19931992
1997 1990
2001
1999
2000
2002
1991
1998
0 500 1000 1500 20000
5000
10000
15000
1995
1994
1996
199319921997
1990
2001
1999
2000
2002
1991
1998
0 500 1000 1500 20000
100000
200000
300000
400000
500000
1995
1994
1996
19931992
1997
19902001
1999
2000
2002
1991
1998
0 500 1000 1500 20000
500
1000
1500
2000
1995
1996
1997
1998
20011999
2000
2002
0 500 1000 1500 20005000
10000
15000
20000
25000
19951996
1997
1998
2001
1999
2000
2002
Land
ing
s (k
g)
Land
ing
s (k
g)
Land
ing
s (k
g)
EffortEffort
Cod
Plaice
Whiting
Sole
Brill Turbot
Figure 5.5.2.2: Relationships between the annual reported landings for cod, plaice, sole, whiting, brill and turbot caught in otter trawls of hp-class 2 and the effort by these trawls (days absent from harbour) in each year (area IV).
107
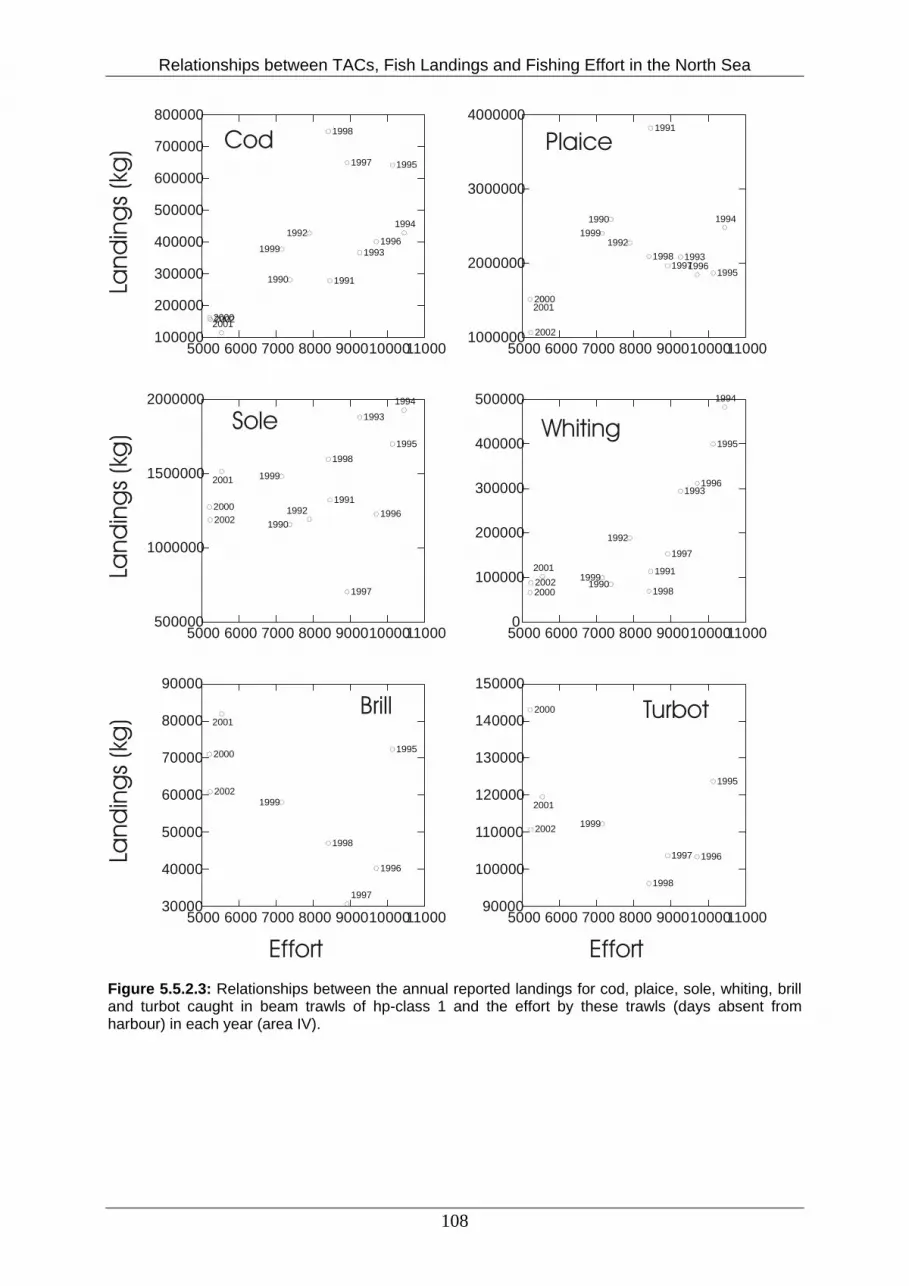
Relationships between TACs, Fish Landings and Fishing Effort in the North Sea
5000 6000 7000 8000 90001000011000100000
200000
300000
400000
500000
600000
700000
800000
200020022001
1999
1990
19921994
1995
19961993
1997
1991
1998
5000 6000 7000 8000 900010000110001000000
2000000
3000000
4000000
2000
2002
2001
19991990
1992
1994
19951996
19931997
1991
1998
5000 6000 7000 8000 90001000011000500000
1000000
1500000
2000000
20002002
2001 1999
19901992
1994
1995
1996
1993
1997
1991
1998
5000 6000 7000 8000 900010000110000
100000
200000
300000
400000
500000
200020022001
19991990
1992
1994
1995
19961993
1997
1991
1998
5000 6000 7000 8000 9000100001100030000
40000
50000
60000
70000
80000
90000
2000
2002
2001
1999
1995
1996
1997
1998
5000 6000 7000 8000 9000100001100090000
100000
110000
120000
130000
140000
1500002000
2002
2001
1999
1995
19961997
1998
Land
ing
s (k
g)
Land
ing
s (k
g)
Land
ing
s (k
g)
EffortEffort
Cod Plaice
WhitingSole
Brill Turbot
Figure 5.5.2.3: Relationships between the annual reported landings for cod, plaice, sole, whiting, brill and turbot caught in beam trawls of hp-class 1 and the effort by these trawls (days absent from harbour) in each year (area IV).
108
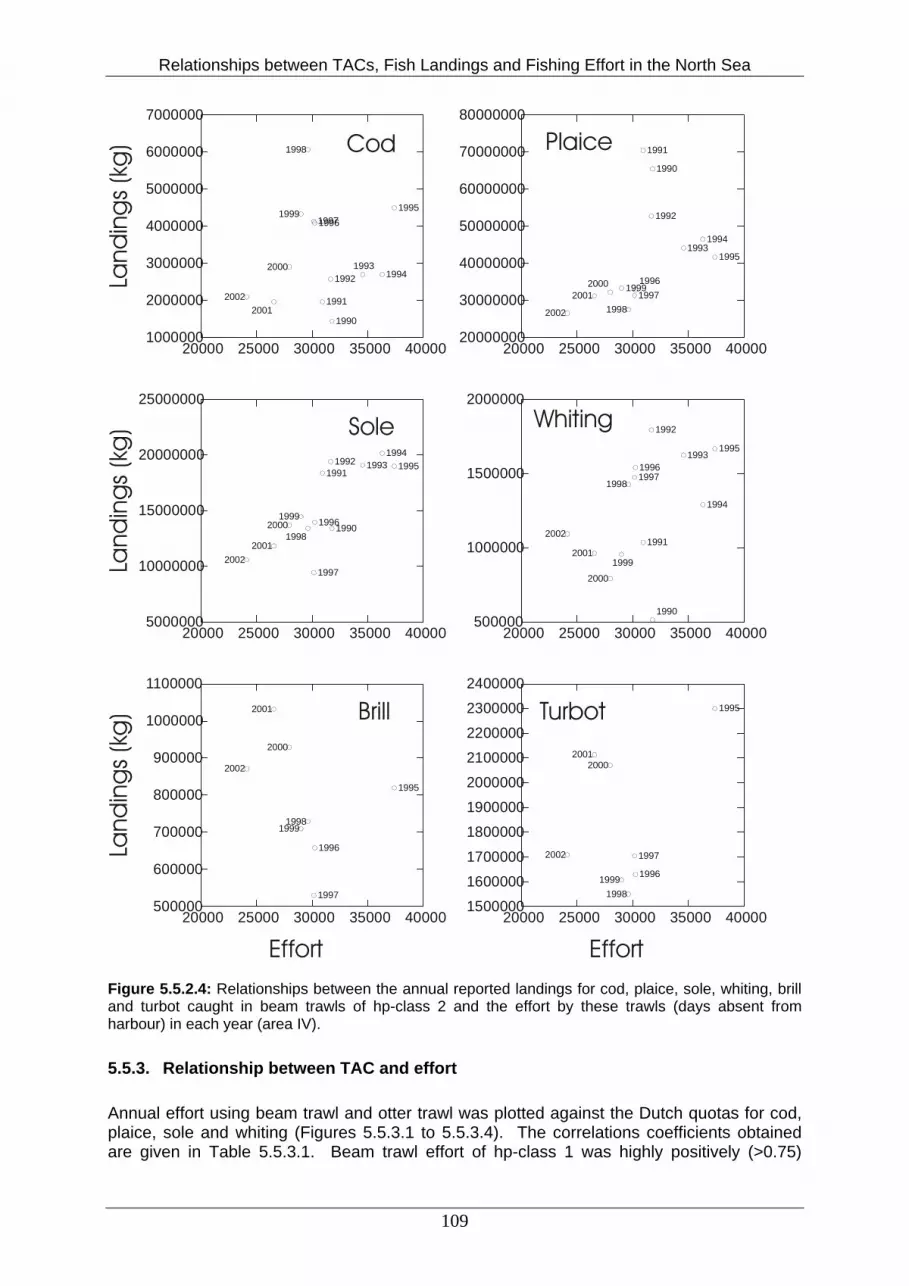
Relationships between TACs, Fish Landings and Fishing Effort in the North Sea
20000 25000 30000 35000 400001000000
2000000
3000000
4000000
5000000
6000000
7000000
20022001
2000
1999
1998
19971995
19941993
1990
1992
1991
1996
20000 25000 30000 35000 4000020000000
30000000
40000000
50000000
60000000
70000000
80000000
2002
20012000 1999
19981997
1995
19941993
1990
1992
1991
1996
20000 25000 30000 35000 400005000000
10000000
15000000
20000000
25000000
20022001
20001999
1998
1997
19951994
1993
1990
19921991
1996
20000 25000 30000 35000 40000500000
1000000
1500000
2000000
2002
2001
2000
1999
19981997
1995
1994
1993
1990
1992
1991
1996
20000 25000 30000 35000 40000500000
600000
700000
800000
900000
1000000
1100000
2002
2001
2000
1999
1995
1996
1997
1998
20000 25000 30000 35000 400001500000
1600000
1700000
1800000
1900000
2000000
2100000
2200000
2300000
2400000
2002
20012000
1999
1995
1996
1997
1998
Land
ing
s (k
g)
Land
ing
s (k
g)
Land
ing
s (k
g)
EffortEffort
Cod Plaice
WhitingSole
Brill Turbot
Figure 5.5.2.4: Relationships between the annual reported landings for cod, plaice, sole, whiting, brill and turbot caught in beam trawls of hp-class 2 and the effort by these trawls (days absent from harbour) in each year (area IV). 5.5.3. Relationship between TAC and effort Annual effort using beam trawl and otter trawl was plotted against the Dutch quotas for cod, plaice, sole and whiting (Figures 5.5.3.1 to 5.5.3.4). The correlations coefficients obtained are given in Table 5.5.3.1. Beam trawl effort of hp-class 1 was highly positively (>0.75)
109
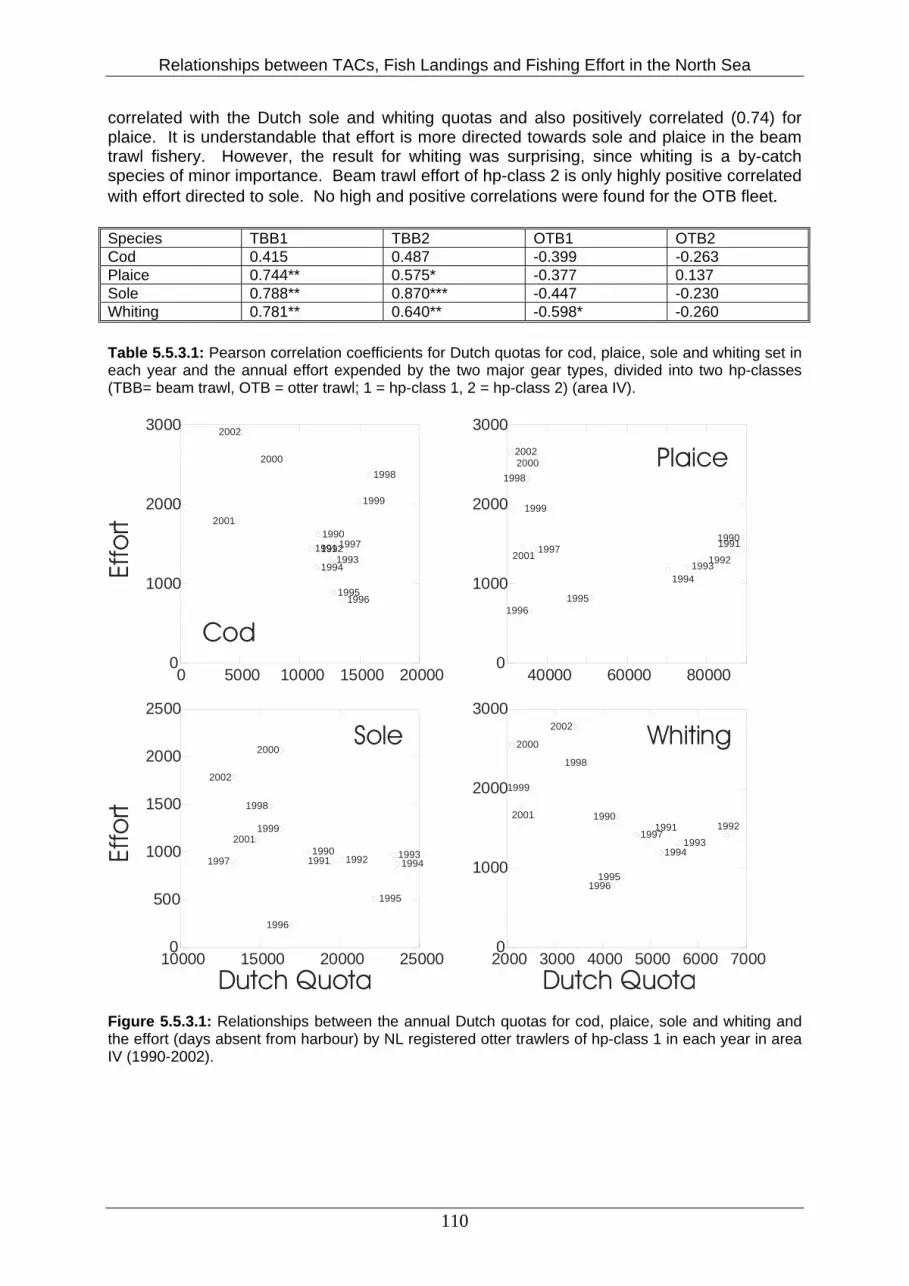
Relationships between TACs, Fish Landings and Fishing Effort in the North Sea
correlated with the Dutch sole and whiting quotas and also positively correlated (0.74) for plaice. It is understandable that effort is more directed towards sole and plaice in the beam trawl fishery. However, the result for whiting was surprising, since whiting is a by-catch species of minor importance. Beam trawl effort of hp-class 2 is only highly positive correlated with effort directed to sole. No high and positive correlations were found for the OTB fleet. Species TBB1 TBB2 OTB1 OTB2 Cod 0.415 0.487 -0.399 -0.263 Plaice 0.744** 0.575* -0.377 0.137 Sole 0.788** 0.870*** -0.447 -0.230 Whiting 0.781** 0.640** -0.598* -0.260 Table 5.5.3.1: Pearson correlation coefficients for Dutch quotas for cod, plaice, sole and whiting set in each year and the annual effort expended by the two major gear types, divided into two hp-classes (TBB= beam trawl, OTB = otter trawl; 1 = hp-class 1, 2 = hp-class 2) (area IV).
Dutch Quota Dutch Quota
Cod
Sole Whiting
Effo
rtEf
fort
Plaice
0 5000 10000 15000 200000
1000
2000
3000
2001
2002
2000
19911992
1994
1998
1999
1996
1997
1995
1993
1990
10000 15000 20000 250000
500
1000
1500
2000
2500
1997
2002
2001
1998
1999
2000
19941993
1995
199219911990
1996
2000 3000 4000 5000 6000 70000
1000
2000
3000
2000
2001
1999
2002
1998
1996
19921993
1994
19911997
1995
1990
40000 60000 800000
1000
2000
30002002
2001
1998
1996
1997
2000
1990199119921993
1994
1995
1999
Figure 5.5.3.1: Relationships between the annual Dutch quotas for cod, plaice, sole and whiting and the effort (days absent from harbour) by NL registered otter trawlers of hp-class 1 in each year in area IV (1990-2002).
110

Relationships between TACs, Fish Landings and Fishing Effort in the North Sea
Cod
Sole
Plaice
Whiting
Effo
rtEf
fort
Effo
rtEf
fort
Effo
rtEf
fort
Effo
rtEf
fort
Dutch Quota Dutch Quota
0 5000 10000 15000 200000
500
1000
1500
2000
2001
20022000 1991
1992
1994
1998
1999
19961997
1995
1993
1990
10000 15000 20000 250000
100
200
300
400
500
600
1997
2002
20011998
1999
2000
1994
1993
19951992
1991
1990
1996
2000 3000 4000 5000 6000 70000
500
1000
1500
2000
200020011999 2002
19981996
1992
19931994
1991
1997
1995
1990
40000 60000 800000
500
1000
1500
2002
2001
1998
1996
1997
2000
1990
1991
199219931994
1995
1999
Figure 5.5.3.2: Relationships between the annual Dutch quotas for cod, plaice, sole and whiting and the effort (days absent from harbour) by NL registered otter trawlers of hp-class 2 in each year in area IV (1990-2002).
111

Relationships between TACs, Fish Landings and Fishing Effort in the North Sea
Cod
Sole
Plaice
Whiting
Effo
rtEf
fort
Dutch Quota Dutch Quota
0 5000 10000 15000 200004000
5000
6000
7000
8000
9000
10000
11000
20012002
2000
19911992
1994
1998
1999
1996
19971995
1993
1990
10000 15000 20000 250004000
5000
6000
7000
8000
9000
10000
11000
1997
2002 2001
1998
19992000
1994
1993
1995
19921991
1990
1996
2000 3000 4000 5000 6000 70004000
5000
6000
7000
8000
9000
10000
200020011999 2002
19981996
1992
1993
1994
1991
1997
1995
1990
40000 60000 800005000
6000
7000
8000
9000
10000
11000
20022001
1998
1996
1997
2000
1990
1991
1992
1993
1994
1995
1999
Figure 5.5.3.3: Relationships between the annual Dutch quotas for cod, plaice, sole and whiting and the effort (days absent from harbour) by NL registered beam trawlers of hp-class 1 in each year in area IV (1990-2002).
112
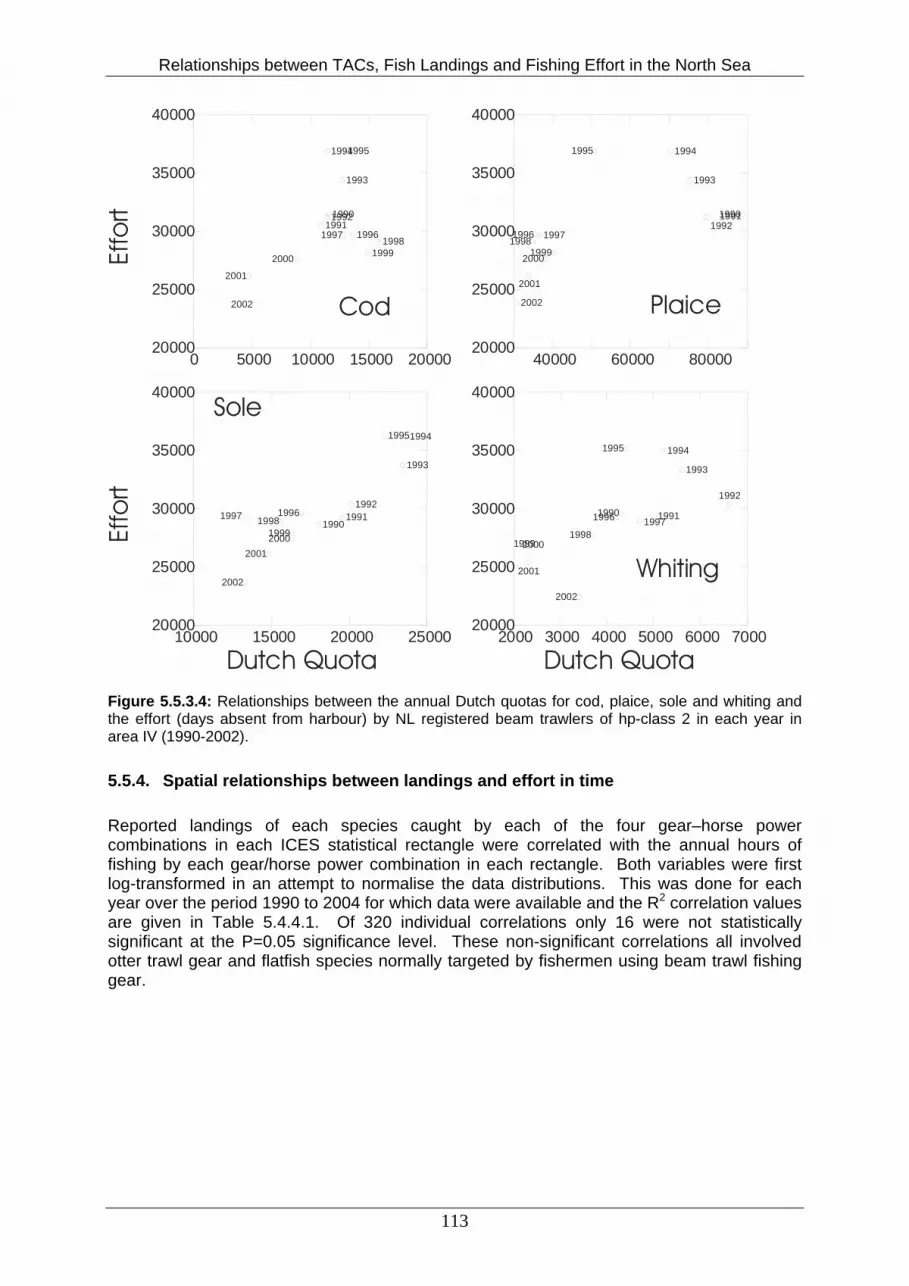
Relationships between TACs, Fish Landings and Fishing Effort in the North Sea
113
40000 60000 8000020000
25000
30000
35000
40000
2002
2001
19981996 1997
2000
199019911992
1993
19941995
1999
Cod
Sole
Plaice
ing
rtEf
fort
a
Whit
Effo
Dutch Quota Dutch Quot
0 5000 10000 15000 2000020000
25000
30000
35000
40000
2001
2002
2000
19911992
1994
19981999
19961997
1995
1993
1990
10000 15000 20000 2500020000
25000
30000
35000
40000
1997
1994
1993
1995
199219911996
2002
2001
199819992000
1990
2000 3000 4000 5000 6000 700020000
25000
30000
35000
40000
2000
2001
1999
2002
199819971996
1992
1993
1994
1991
1995
1990
Figure 5.5.3.4: Relationships between the annual Dutch quotas for cod, plaice, sole and whiting and the effort (days absent from harbour) by NL registered beam trawlers of hp-class 2 in each year in area IV (1990-2002). 5.5.4. Spatial relationships between landings and effort in time Reported landings of each species caught by each of the four gear–horse power combinations in each ICES statistical rectangle were correlated with the annual hours of fishing by each gear/horse power combination in each rectangle. Both variables were first log-transformed in an attempt to normalise the data distributions. This was done for each year over the period 1990 to 2004 for which data were available and the R2 correlation values are given in Table 5.4.4.1. Of 320 individual correlations only 16 were not statistically significant at the P=0.05 significance level. These non-significant correlations all involved otter trawl gear and flatfish species normally targeted by fishermen using beam trawl fishing gear.

Relationships between TACs, Fish Landings and Fishing Effort in the North Sea
114
1990 1991 1992 1993 1994 1995 1996 1997 1998 1999 2000 2001 2002 2003 2004Brill 0.974*** 0.981*** 0.959*** 0.946*** 0.980*** 0.993*** 0.986*** 0.989*** 0.984*** 0.978***Cod 0.965*** 0.952*** 0.965*** 0.923*** 0.949*** 0.932*** 0.958*** 0.932*** 0.956*** 0.885*** 0.947*** 0.911*** 0.935*** 0.967*** 0.933***Plaice 0.825*** 0.909*** 0.890*** 0.883*** 0.845*** 0.901*** 0.925*** 0.933*** 0.963*** 0.913*** 0.976*** 0.972*** 0.980*** 0.961*** 0.965***Sole 0.941*** 0.958*** 0.942*** 0.969*** 0.972*** 0.986*** 0.982*** 0.966*** 0.988*** 0.990*** 0.994*** 0.998*** 0.997*** 0.988*** 0.997***Turbot 0.987*** 0.967*** 0.903*** 0.985*** 0.984*** 0.974*** 0.949*** 0.976*** 0.989*** 0.979***Whiting 0.938*** 0.883*** 0.907*** 0.890*** 0.886*** 0.854*** 0.938*** 0.915*** 0.899*** 0.906*** 0.947*** 0.974*** 0.944*** 0.945*** 0.982***Brill 0.789*** 0.826*** 0.914*** 0.925*** 0.827*** 0.938*** 0.896*** 0.918*** 0.911*** 0.939***Cod 0.928*** 0.901*** 0.840*** 0.859*** 0.819*** 0.789*** 0.826*** 0.751*** 0.774*** 0.795*** 0.772*** 0.697*** 0.650*** 0.781*** 0.738***Plaice 0.930*** 0.936*** 0.943*** 0.947*** 0.950*** 0.961*** 0.974*** 0.969*** 0.965*** 0.963*** 0.952*** 0.944*** 0.955*** 0.924*** 0.947***Sole 0.928*** 0.956*** 0.983*** 0.978*** 0.965*** 0.954*** 0.941*** 0.879*** 0.963*** 0.972*** 0.964*** 0.931*** 0.948*** 0.944*** 0.951***Turbot 0.968*** 0.956*** 0.892*** 0.910*** 0.928*** 0.948*** 0.924*** 0.898*** 0.868*** 0.779***Whiting 0.842*** 0.819*** 0.794*** 0.813*** 0.568*** 0.634*** 0.685*** 0.593*** 0.382*** 0.496*** 0.723*** 0.643*** 0.683*** 0.581*** 0.503***Brill 0.864*** 0.732* 0.697*** 0.499** 0.486** 0.814*** 0.641*** 0.333 ns 0.599*** 0.299 nsCod 0.981*** 0.959*** 0.979*** 0.974*** 0.972*** 0.988*** 0.924*** 0.957*** 0.971*** 0.946*** 0.875*** 0.852*** 0.783*** 0.489*** 0.516***Plaice 0.815*** 0.848*** 0.870*** 0.849*** 0.806*** 0.680*** 0.262 ns 0.203 ns 0.807*** 0.543*** 0.752*** 0.493*** 0.496*** 0.831*** 0.784***Sole 0.919*** 0.806*** 0.928*** 0.893*** 0.816*** 0.893*** 0.712*** 0.706*** 0.846*** 0.835*** 0.857*** 0.722*** 0.807*** 0.417** 0.789***Turbot -0.001 ns 0.193 ns 0.025 ns 0.208 ns 0.311* 0.615*** 0.621*** 0.522*** 0.775*** 0.741***Whiting 0.963*** 0.912*** 0.970*** 0.865*** 0.960*** 0.949*** 0.943*** 0.637*** 0.923*** 0.857*** 0.808*** 0.785*** 0.833*** 0.484*** 0.400**Brill 0.831** -0.057 ns 0.600** 0.493** 0.559** 0.657*** 0.578** 0.406** 0.530** 0.235 nsCod 0.892*** 0.830*** 0.875*** 0.634*** 0.713*** 0.827*** 0.551*** 0.702*** 0.663*** 0.863*** 0.906*** 0.876*** 0.869*** 0.762*** 0.642***Plaice 0.502*** 0.430** 0.661*** 0.695*** 0.757*** 0.921*** 0.860*** 0.860*** 0.772*** 0.809*** 0.580*** 0.737*** 0.529*** 0.576*** 0.579***Sole 0.525** 0.523* 0.312 ns 0.471* 0.656** 0.557* -0.057 ns 0.676*** 0.083 ns 0.398* 0.584*** 0.165 ns 0.402* 0.256 ns 0.179 nsTurbot 0.955*** 0.930*** 0.821*** 0.867*** 0.851*** 0.732*** 0.743*** 0.534*** 0.625*** 0.687***Whiting 0.930*** 0.849*** 0.776*** 0.772*** 0.649*** 0.924*** 0.918*** 0.767*** 0.760*** 0.484*** 0.812*** 0.690*** 0.746*** 0.731*** 0.586***
2
1
2
Beam trawl
Beam trawl
Otter trawl
Otter trawl
YearGear hp-class
1
Species
Table 5.5.4.1: R2 correlation coefficients for spatial (landings effort data by ICES statistical rectangle) log-landings by log-effort relationships for each species and gear in each year. Grey shaded cells indicate non-significant correlations at the P=0.05 significance level.
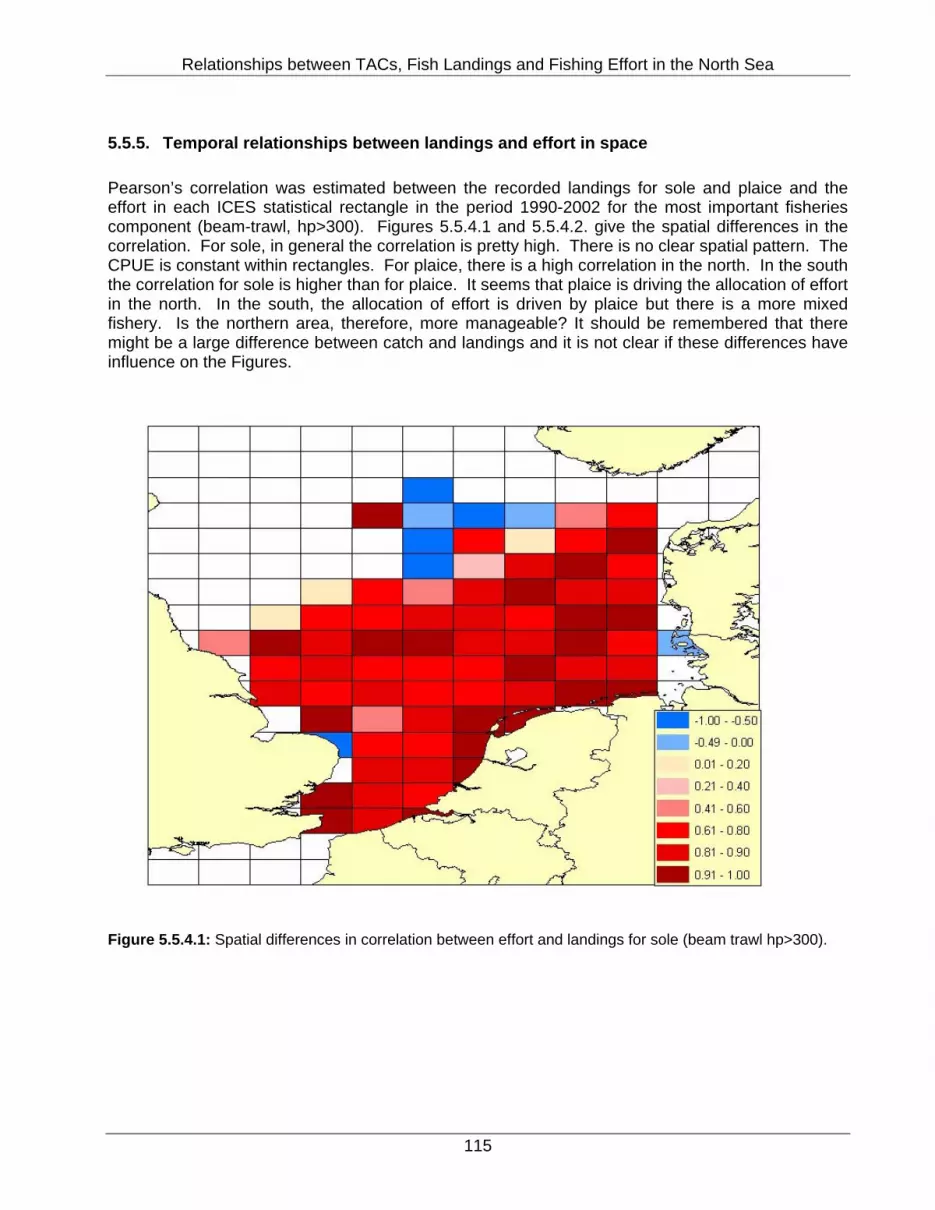
Relationships between TACs, Fish Landings and Fishing Effort in the North Sea
5.5.5. Temporal relationships between landings and effort in space Pearson’s correlation was estimated between the recorded landings for sole and plaice and the effort in each ICES statistical rectangle in the period 1990-2002 for the most important fisheries component (beam-trawl, hp>300). Figures 5.5.4.1 and 5.5.4.2. give the spatial differences in the correlation. For sole, in general the correlation is pretty high. There is no clear spatial pattern. The CPUE is constant within rectangles. For plaice, there is a high correlation in the north. In the south the correlation for sole is higher than for plaice. It seems that plaice is driving the allocation of effort in the north. In the south, the allocation of effort is driven by plaice but there is a more mixed fishery. Is the northern area, therefore, more manageable? It should be remembered that there might be a large difference between catch and landings and it is not clear if these differences have influence on the Figures.
Figure 5.5.4.1: Spatial differences in correlation between effort and landings for sole (beam trawl hp>300).
115
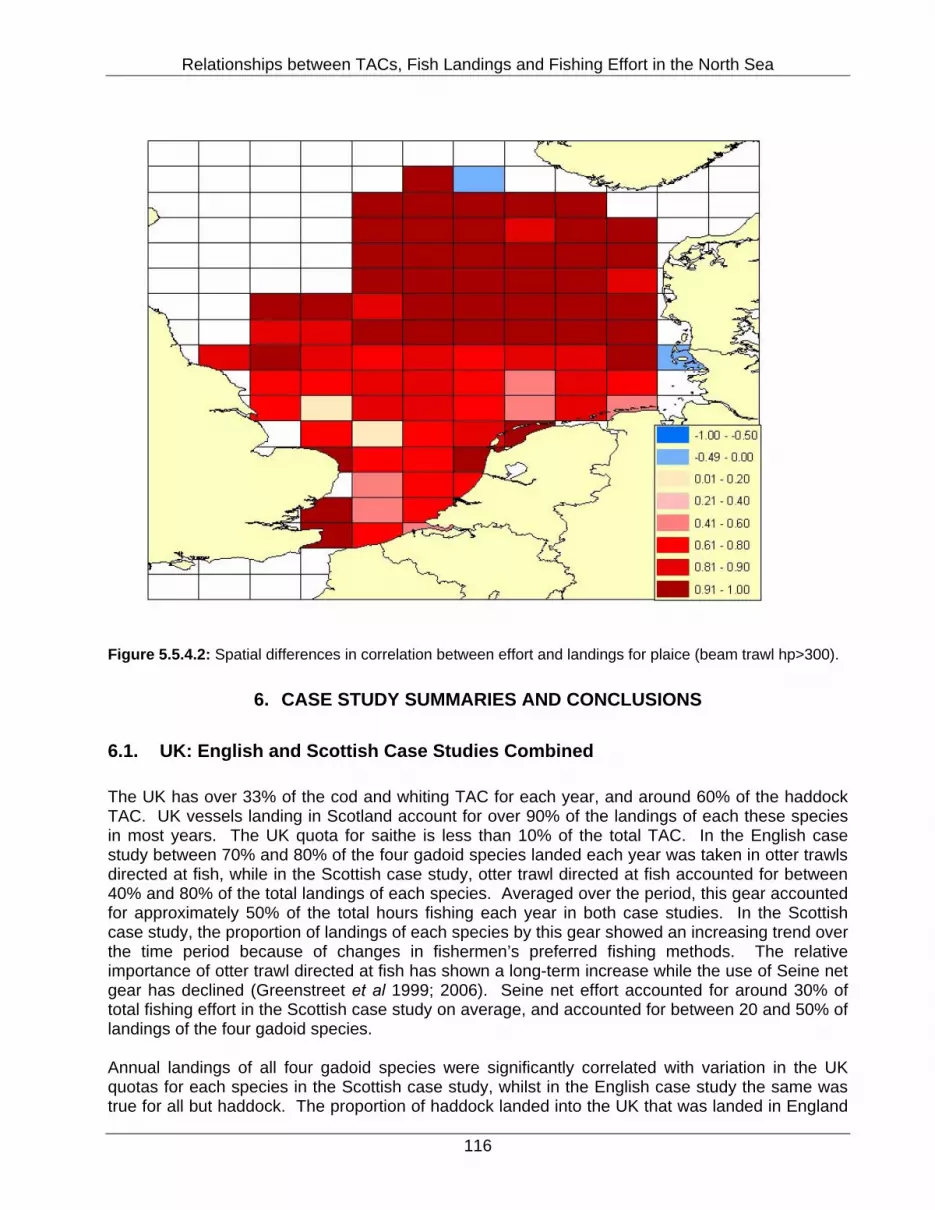
Relationships between TACs, Fish Landings and Fishing Effort in the North Sea
Figure 5.5.4.2: Spatial differences in correlation between effort and landings for plaice (beam trawl hp>300).
6. CASE STUDY SUMMARIES AND CONCLUSIONS 6.1. UK: English and Scottish Case Studies Combined The UK has over 33% of the cod and whiting TAC for each year, and around 60% of the haddock TAC. UK vessels landing in Scotland account for over 90% of the landings of each these species in most years. The UK quota for saithe is less than 10% of the total TAC. In the English case study between 70% and 80% of the four gadoid species landed each year was taken in otter trawls directed at fish, while in the Scottish case study, otter trawl directed at fish accounted for between 40% and 80% of the total landings of each species. Averaged over the period, this gear accounted for approximately 50% of the total hours fishing each year in both case studies. In the Scottish case study, the proportion of landings of each species by this gear showed an increasing trend over the time period because of changes in fishermen’s preferred fishing methods. The relative importance of otter trawl directed at fish has shown a long-term increase while the use of Seine net gear has declined (Greenstreet et al 1999; 2006). Seine net effort accounted for around 30% of total fishing effort in the Scottish case study on average, and accounted for between 20 and 50% of landings of the four gadoid species. Annual landings of all four gadoid species were significantly correlated with variation in the UK quotas for each species in the Scottish case study, whilst in the English case study the same was true for all but haddock. The proportion of haddock landed into the UK that was landed in England
116

Relationships between TACs, Fish Landings and Fishing Effort in the North Sea
was t by any other gear. Variation in both beam trawl and seine net effort was correlated with changes in he smallest of all four species, and it is believed that fishermen landing in England and Wales were actually targeting cod, but landing any haddock taken in the bycatch. In the English case study, variation in the annual landings of cod and whiting was significantly correlated with variation in the amount of effort by otter trawl directed at fish in each year, but this was not the case for either haddock or saithe. It is also unlikely that fishermen landing in England and Wales were targeting a low value low quota species such as saithe. Thus only for cod and whiting was a significant relationship between quota and fishing effort (by otter trawl directed at fish) detected. In the Scottish case study, none of the correlations between landings and effort by otter trawl directed at fish were statistically significant. Consequently, no significant relationships were detected between otter trawl directed at fish effort and the quota for each species in each year. This fishery is generally a mixed species fishery, with haddock, whiting and cod being the main targets of UK vessels landing in Scotland. Therefore the relationships between otter trawl effort directed at fish effort and landings of all four combinations of these three species were examined, but still no significant correlations were detected. Landings of whiting and saithe were significantly correlated with seine net fishing effort in each year, but despite this, no significant positive relationships between UK quotas for any of the four gadoids species and seine net effort were detected. • The UK quotas for cod, haddock and whiting constitute a large fraction of the TAC,
and UK vessels landing in Scotland take by far the greater proportion of the UK quota. These results therefore suggest that it will be difficult to predict annual variation in the amount of otter trawl effort directed at fish or seine net effort (in the Scottish data set) from variation in the UK quotas of cod, haddock, and whiting.
The UK sole quota is less than 5%, and plaice quota is approximately 25%, of their respective TACs. Nearly all the sole and over 70% of the plaice taken by UK vessels are landed in England and Wales. In the English case study approximately 70% of the sole and 85% of the plaice landed were taken in beam trawls. This gear accounted for approximately 30% of total fishing effort each year. In the Scottish case study, beam trawl accounted for approximately 5% of total fishing effort, but 70% of the sole and 20% of the plaice landed by UK vessels in Scotland were taken by this gear. Approximately 40% to 50% of plaice landings, and between 10% and 30% of sole landings, in the Scottish case study were taken by otter trawl directed at fish, and a further 20% to 30% of the plaice were taken by seine net. Sole landings in the English case study were correlated with variation in the UK quota, but plaice landings were not. One explanation for this is that, whilst the quota for sole is considerably smaller than the quota for plaice, sole being by far the more valuable species, UK vessels landing in England and Wales targeted sole and simply landed the plaice they caught in the bycatch. Despite significant correlations between the annual landings of both sole and plaice and the amount of beam trawl effort in each year, for neither species was a significant relationship between UK quota and beam trawl effort detected. The lack of a correlation between landings and UK quota of explains this result with respect to plaice, but failure to observe a significant relationship between quota and beam trawl effort with regard to sole is more surprising, however, the correlation observed was indeed only just not statistically significant. In the Scottish case study, no significant correlations between annual landings and variation in the UK quotas of either flatfish species were detected. In the Scottish case study, landings of neither flatfish species were correlated with variation in their quota. With the exception of the small beam trawl fleet, for vessels landing in Scotland, these species are mainly taken as a bycatch in fisheries targeting other species. The amount of sole landed in Scotland is almost negligible, and sole landings were not correlated with beam trawl effort, or indeed with effort the UK quota for sole, but given the lack of correlations between quota and landings and between landings and effort, little faith can be placed in this latter result. Plaice landings were correlated with annual variation in effort by both beam trawl and seine
117

Relationships between TACs, Fish Landings and Fishing Effort in the North Sea
net, but not with otter trawl directed at fish. However, only in respect of seine net was a significant correlation between the UK plaice quota and seine net effort detected. Given that there was no correlation between plaice quotas and landings, this result is again more than likely to be a spurious correlation. • The UK quotas for sole and plaice are relatively small. The data analysed in both
case studies suggest that variation in effort by beam trawl (in both data sets), otter trawl directed at fish and seine net (in the Scottish data set) cannot be reliably estimated from variation in the UK quotas of plaice or sole.
The UK Nephrops quota accounts for approximately 90% of the TAC, and around 90% of the UK landings of Nephrops are landed in Scottish ports. In both case studies, approximately 70% to 75% of the Nephrops landings were taken by otter trawl directed at Nephrops, and the most of the remainder was taken in otter trawl directed at fish. Otter trawl directed at Nephrops accounted for 10 to 15% of the total fishing effort in the English case study and approximately 25% of total fishing effort in the Scottish case study. In neither case study was annual Nephrops landings correlated with variation in the UK quota for this species. In both studies, however, Nephrops landings were strongly correlated with annual variation in otter trawl effort directed at Nephrops, but they were not positively correlated with effort by any other gear. No doubt due to the failure to find a correlation between quota and landings, in neither case study was a positive correlation between variation in UK Nephrops quota and variation in the level of otter trawl effort directed towards Nephrops detected. • Nephrops is almost entirely exploited by UK fishermen. However, variation in
Nephrops quotas provides no indication of annual variation in Nephrops otter trawl activity.
In any one year spatial variation in fishing effort tended to be positively correlated with landings. This generally, with some exceptions, held true for most gear/species combinations, but the correlations tended to be particularly strong for particular gears and their target species, eg. beam trawl and plaice and sole, otter trawl directed at fish and cod, haddock and whiting, otter trawl directed at Nephrops and Nephrops. • Landings distributions in each year provide a good indication of the distribution of
fishing effort. 6.2. Norway Norway has quota only for the four gadoid species in the North Sea. These are approximately 10% to 15% of the TAC for cod and whiting, 25% of the TAC for haddock and 50% of the TAC for saithe. The Norwegian case study considered data for two gear types, otter trawl and beam trawl, of which the former dominated, accounting for between 80% and 85% of total effort. Landings of cod, haddock and whiting from Norwegian otter and beam trawls rarely reached Norwegian quotas for these species, although this discrepancy was reduced if pelagic trawl and line fishing operations were taken into consideration. Despite this, however, annual haddock landings were correlated with the Norwegian quota. Saithe were the principal target of the otter trawl fleet and annual variation in saithe landings were strongly correlated with the Norwegian quota for this species. Annual landings of cod and whiting were not correlated with variation in their quotas. Annual landings of the main target species, saithe, were significantly correlated with variation in annual otter trawl effort. Significant relationships between landings and effort were not
118
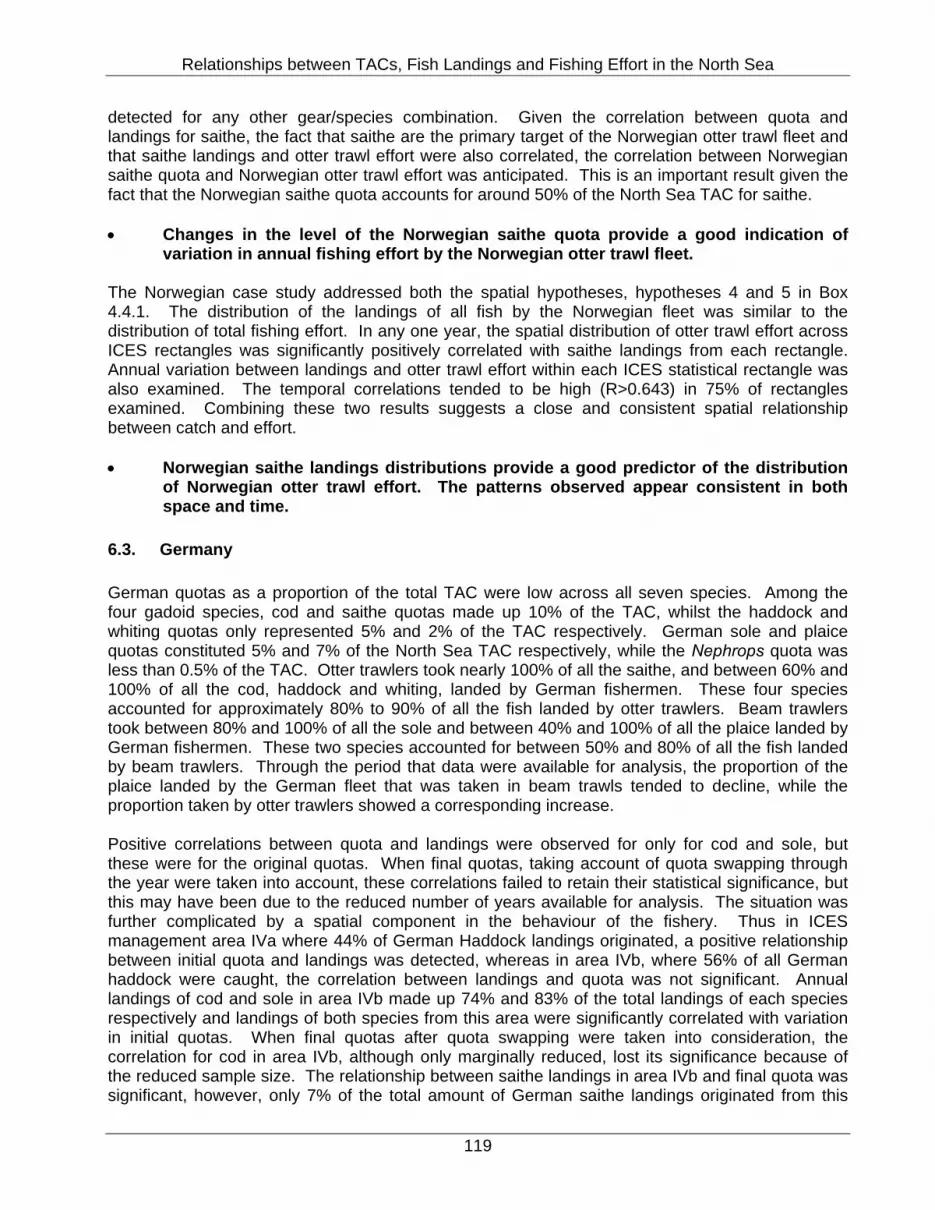
Relationships between TACs, Fish Landings and Fishing Effort in the North Sea
detected for any other gear/species combination. Given the correlation between quota and landings for saithe, the fact that saithe are the primary target of the Norwegian otter trawl fleet and that saithe landings and otter trawl effort were also correlated, the correlation between Norwegian saithe quota and Norwegian otter trawl effort was anticipated. This is an important result given the fact that the Norwegian saithe quota accounts for around 50% of the North Sea TAC for saithe. • Changes in the level of the Norwegian saithe quota provide a good indication of
variation in annual fishing effort by the Norwegian otter trawl fleet. The Norwegian case study addressed both the spatial hypotheses, hypotheses 4 and 5 in Box 4.4.1. The distribution of the landings of all fish by the Norwegian fleet was similar to the distribution of total fishing effort. In any one year, the spatial distribution of otter trawl effort across ICES rectangles was significantly positively correlated with saithe landings from each rectangle. Annual variation between landings and otter trawl effort within each ICES statistical rectangle was also examined. The temporal correlations tended to be high (R>0.643) in 75% of rectangles examined. Combining these two results suggests a close and consistent spatial relationship between catch and effort. • Norwegian saithe landings distributions provide a good predictor of the distribution
of Norwegian otter trawl effort. The patterns observed appear consistent in both space and time.
6.3. Germany German quotas as a proportion of the total TAC were low across all seven species. Among the four gadoid species, cod and saithe quotas made up 10% of the TAC, whilst the haddock and whiting quotas only represented 5% and 2% of the TAC respectively. German sole and plaice quotas constituted 5% and 7% of the North Sea TAC respectively, while the Nephrops quota was less than 0.5% of the TAC. Otter trawlers took nearly 100% of all the saithe, and between 60% and 100% of all the cod, haddock and whiting, landed by German fishermen. These four species accounted for approximately 80% to 90% of all the fish landed by otter trawlers. Beam trawlers took between 80% and 100% of all the sole and between 40% and 100% of all the plaice landed by German fishermen. These two species accounted for between 50% and 80% of all the fish landed by beam trawlers. Through the period that data were available for analysis, the proportion of the plaice landed by the German fleet that was taken in beam trawls tended to decline, while the proportion taken by otter trawlers showed a corresponding increase. Positive correlations between quota and landings were observed for only for cod and sole, but these were for the original quotas. When final quotas, taking account of quota swapping through the year were taken into account, these correlations failed to retain their statistical significance, but this may have been due to the reduced number of years available for analysis. The situation was further complicated by a spatial component in the behaviour of the fishery. Thus in ICES management area IVa where 44% of German Haddock landings originated, a positive relationship between initial quota and landings was detected, whereas in area IVb, where 56% of all German haddock were caught, the correlation between landings and quota was not significant. Annual landings of cod and sole in area IVb made up 74% and 83% of the total landings of each species respectively and landings of both species from this area were significantly correlated with variation in initial quotas. When final quotas after quota swapping were taken into consideration, the correlation for cod in area IVb, although only marginally reduced, lost its significance because of the reduced sample size. The relationship between saithe landings in area IVb and final quota was significant, however, only 7% of the total amount of German saithe landings originated from this
119

Relationships between TACs, Fish Landings and Fishing Effort in the North Sea
area. Changes in the composition of the German fishing fleet and market conditions largely explain variability and general lack of significant correlations between landings and quotas. Overall, German beam trawl effort and plaice landings were correlated. Plaice were the main target of the German beam trawl fleet. For otter trawl, no significant positive relationships between effort and landings were detected for any species, not even for saithe, the main target species of the German otter trawl fleet. However, when these relationships were examined for the different management sub-areas individually, the picture changed. In sub-area IVa, cod, haddock and whiting landings were all correlated with otter trawl effort, but this was the only area in which this was the case. However, only 44% of haddock landings originated from sub-area IVa. Sub-area IVb was more important for haddock, producing 56% of all haddock landings, and more important still for whiting and cod. 74% of all cod landings originated from sub-area IVb for example, yet none of the relationships between otter trawl effort and the four gadoid species were statistically significant in sub-area IVb. Sole landings were positively correlated with otter trawl effort in sub-area IVb, while in area IVc, plaice landings were positively correlated with otter trawl effort. In both instances these species were probably taken as bycatch and landed, hence there is no reason to expect that variation in plaice or sole quotes should affect otter trawl effort in these regions. Total otter trawl effort was least (<10,000h) in sub-area IVc, intermediate in sub-area IVa (15,000-35,000h) and highest in sub-area IVb (35,000-65,000h). Beam trawl effort was positively correlated with both plaice and sole landings in both sub-areas IVb and IVc. Actual levels of German beam trawl effort were considerably lower in sub-area IVc (<20,000h) compared with sub-area IVb (45,000-100,000h). At the North Sea scale, German beam trawl effort was significantly positively correlated with annual variation for sole and plaice, when quota swapping was taken into account. Only the plaice quota prior to swapping was significantly correlated with beam trawl effort. No correlations were detected between German otter trawl effort and the quotas for any species. However, once again when the different management sub-areas were considered, the picture again changed. In sub-area IVa, quotas for cod, haddock and whiting were significantly correlated with otter trawl effort. However, 30%-40% of German otter trawl actually occurred in this sub-area, and less than 50% of the landings of these species were taken from this sub-area. Saithe quotas were correlated with otter trawl effort in sub-area IVb where in fact only 7% of the saithe landed by the German fleet were taken, yet over 50% of total otter trawl effort took place in this region. 93% of the saithe landed by German otter trawls were taken from sub-area IVa, yet in this region, saithe quotas and otter trawl effort were not correlated. When quota swapping was taken into consideration, the relationship between quota and otter trawl effort in sub-area IVa lost its statistical significance. The reduced sample size was probably responsible for this however. Beam trawl effort in sub-area IVb was positively correlated with German plaice and sole quotas before quota swapping was taken into account. After taking quota swapping into consideration, the relationship between sole quota and beam trawl effort failed to retain its significance, The correlation coefficient remained high, however, and the loss of significance was probably as much due to the reduced samples size as to any real change in the relationship. Most German beam trawl effort occurred in sub-area IVb. • Significant positive relationships between gadoids and otter trawl effort were not
apparent at the whole North Sea scale. At the management sub-area scale those relationships that were detected tended to occur in sub-areas where either otter trawl effort was relatively light, or for species where relatively small proportions of the total landings were obtained. Consequently using variation in German gadoid quotas to predict German otter trawl effort is likely to be problematic.
120

Relationships between TACs, Fish Landings and Fishing Effort in the North Sea
• Variation in the German quotas for plaice and sole provides a good predictor of variation in German beam trawl effort, both at the whole North Sea scale and at the management sub-area scale.
The German case study addressed one of the spatial hypotheses, hypothesis 4 in Box 4.4.1. In any one year the spatial distributions between German landings of cod, haddock and whiting were significantly positively correlated with the distribution of German otter trawl effort. This was rarely the case in respect of saithe landings. Spatial variation in plaice and sole landings from particular rectangles also tended to be correlated with variation in otter trawl effort across rectangles in any one year. This was particularly more likely to be the case in the later part of the time series, though the correlation coefficients were generally lower than the equivalent coefficients for cod, haddock and whiting. Strong correlations between the distribution of beam trawl effort and landings of plaice and sole were observed in all years. • Spatial variation in the distribution of German landings of cod, haddock and whiting
should provide a good indication of German otter trawl effort in any one year, while the distribution of beam trawl effort would be well predicted by spatial variation in the landings of plaice and sole.
6.4. The Netherlands The Netherlands fishing fleet fundamentally targets the two flatfish species, plaice and sole. Dutch quotas for haddock and saithe constitute 1% or less of the North Sea TACs for these species, whilst the whiting and cod quotas account for approximately 5% and 10% of the TAC respectively. Similarly, the Dutch Nephrops quota is also less than 3% of the TAC. In comparison, Dutch quotas for sole and plaice are approximately 75% and 36% of the North Sea TACs respectively. Approximately 99% of all the plaice and sole landed are caught in beam trawls. The Dutch fishing fleet is primarily a beam trawl fleet with beam trawl effort accounting for approximately 93% of total fishing effort. Around 75% of the beam trawl fleet consists of the higher power vessels above 300hp. Approximately 67% of all the cod and whiting landed by Dutch fishermen are also caught in Beam trawls, presumably as bycatch. The small Dutch otter trawl fleet, however, presumably targets these latter two species, with cod providing the greater CPUE and therefore constituting the main target species. Otter trawls account for approximately 7% of total Dutch fishing effort, but land about 33% of the cod and whiting taken by the combined fleet. Unlike the beam trawl fleet, lower power vessels, less than 300hp, dominate the otter trawl fleet, accounting for between 60% and 70% of total otter trawl effort. Landings of the main target species, plaice and sole, were strongly correlated with the Dutch quotas for these two species. Cod landings and quotas were also correlated, though the relationship was weaker. Otter trawl effort (by both hp components) was correlated with cod landings. Plaice landings were also correlated with effort by these vessels, but these were probably taken as a bycatch. Effort by the higher hp component of the beam trawl fleet was significantly correlated with sole landings, but not with plaice landings. Beam trawl activity was primarily driven by their tendency to target sole over plaice, the more valuable of the two species. Consequently, variation in beam trawl effort, particularly for the higher hp component of the fleet, was strongly correlated with annual variation in the Netherlands’ sole quota. Strangely, despite the positive correlation between cod landings and cod quotas, and between cod landings and effort by otter trawlers, the relationship between cod quota and otter trawl effort was in fact negative, albeit not statistically significant.
121

Relationships between TACs, Fish Landings and Fishing Effort in the North Sea
• Variation in the sole quota assigned to the Netherlands provides a good indication of variation in the amount of effort by the Dutch beam trawl fleet.
The Dutch case study addressed the second spatial hypothesis, hypothesis 5 in Box 4.4.1. Temporal correlation between beam trawl effort and both sole and plaice landings in each ICES statistical rectangle was determined. For sole the correlations were generally high and no clear spatial pattern was observed. If effort increased in a rectangle, landings tended to increase also. For plaice a clear spatial pattern was evident. In the north of the area covered, temporal correlations between beam trawl effort and plaice landings in each rectangle tended to be high, while in the southern part of the area, they tended to be low. • In the southern part of the area covered, temporal variation in beam trawl effort is
primarily driven by efforts to land sole, while in the northern part of the area, temporal variation in beam trawl effort is influenced mainly by variation in plaice landings.
7. ANALYSES OF INTERNATIONAL DATA
7.1. Relationships Between TAC/Quotas and Landings The relationships between TAC and Landings was examined for the six main commercial species targeted in the North Sea: cod, haddock, saithe, whiting, sole, and plaice. Data were obtained from two recent reports of the ICES Working Group on the Assessment of Demersal Stocks in the North Sea and Skagerrak” for the meetings held in 2001 (ICES CM 2002/ACFM:01), 2003 (ICES CM2004/ACFM:07), and 2004 (ICES CM 2005/ACFM:07). Where data differed for a given year and species between the two reports, the more recent data were used, unless the values in the tables presented did not tally correctly. 7.1.1. Cod Data for the period 1983 to 2004 were available for cod (Figure 7.1.1.1). Annual landings were significantly correlated with the TAC in each year and the slope of the regression relationship, at 0.886, was reasonably close to 1. Two significant outliers are primarily responsible for the deviation from a slope of 1, 1999 and 1985. In both years, the quantity of cod landed fell well below the TAC. It is possible that in 1985, the increase in TAC was such that fishermen were simply unable to catch this quantity of cod with the fleet size, technology and time available to them. In 1999 this explanation is unlikely. TACs had been increasing slightly over the preceding five years, but in 2000 there was a sharp decline in TAC. The most likely explanation for the deviation between TAC and landings in 1999 therefore is that in this year the cod stock had already declined markedly, but this had not been anticipated in the setting of the TAC. In 1999 there was simply insufficient cod in the North Sea for the fishermen to catch their quotas, and this was reflected in the following year by the greatly reduced TAC.
122

Relationships between TACs, Fish Landings and Fishing Effort in the North Sea
1983 1987 1991 1995 1999 2003Year
0
50000
100000
150000
200000
250000
TON
NE
SNorth Sea Landings and TAC
OTHERBELGIUMFRANCEGERMANYNORWAYNETHERLANDSDENMARKENGLANDSCOTLANDUNALLOCATEDTACLANDINGS
0 50000 100000 150000 200000 250000TAC (tonnes)
0
50000
100000
150000
200000
250000
Land
ings
(ton
nes)
19841985
19861987
1988
19891990
1991199219931994
199519961997
1998
19992000
2001200220032004
Cod
r = 0.958, P <0.001
Y = 0.88554 * X + 2300.67
Figure 7.1.1.1: The relationship between North Sea cod TACs and Landings. Left panel shows the landings reported each year by each country fishing in the North Sea as the histogram bars. Line plots show total landings and the TAC in each year. Right panel shows the relationship between TAC and landings. The dashed line shows the slope of 1 predicted by the hypothesis that landings are tightly linked to TAC. Solid line shows the fitted regression line and the observed relationship is indicated. 7.1.2. Haddock Data for the period 1991 to 2004 were available for haddock (Figure 7.1.2.1). The highly significant relationship between annual TACs and reported landings suggests that TACs have operated to modulate reported haddock landings in a predictable manner. However, the slope of the fitted regression, at 0.366, deviates markedly from the predicted slope of 1 and nearly all the data points lie substantially below the predicted line of slope = 1 and intercept = 0. Reported haddock landings for human consumption since 1993 have been considerably less that the TAC reported in the assessment working group literature. The relationship between total annual haddock catches (human consumption landings + discards + industrial bycatch) and annual TACs was examined to check whether the TACs used in the assessment literature in some way also takes into account the haddock that are discarded or landed as part of the bycatch in the industrial fishery (Figure 7.1.2.2). The correlation between total haddock catches and TAC was much weaker, and now most of the data points lay above the predicted line of slope = 1 and intercept = 0.
123
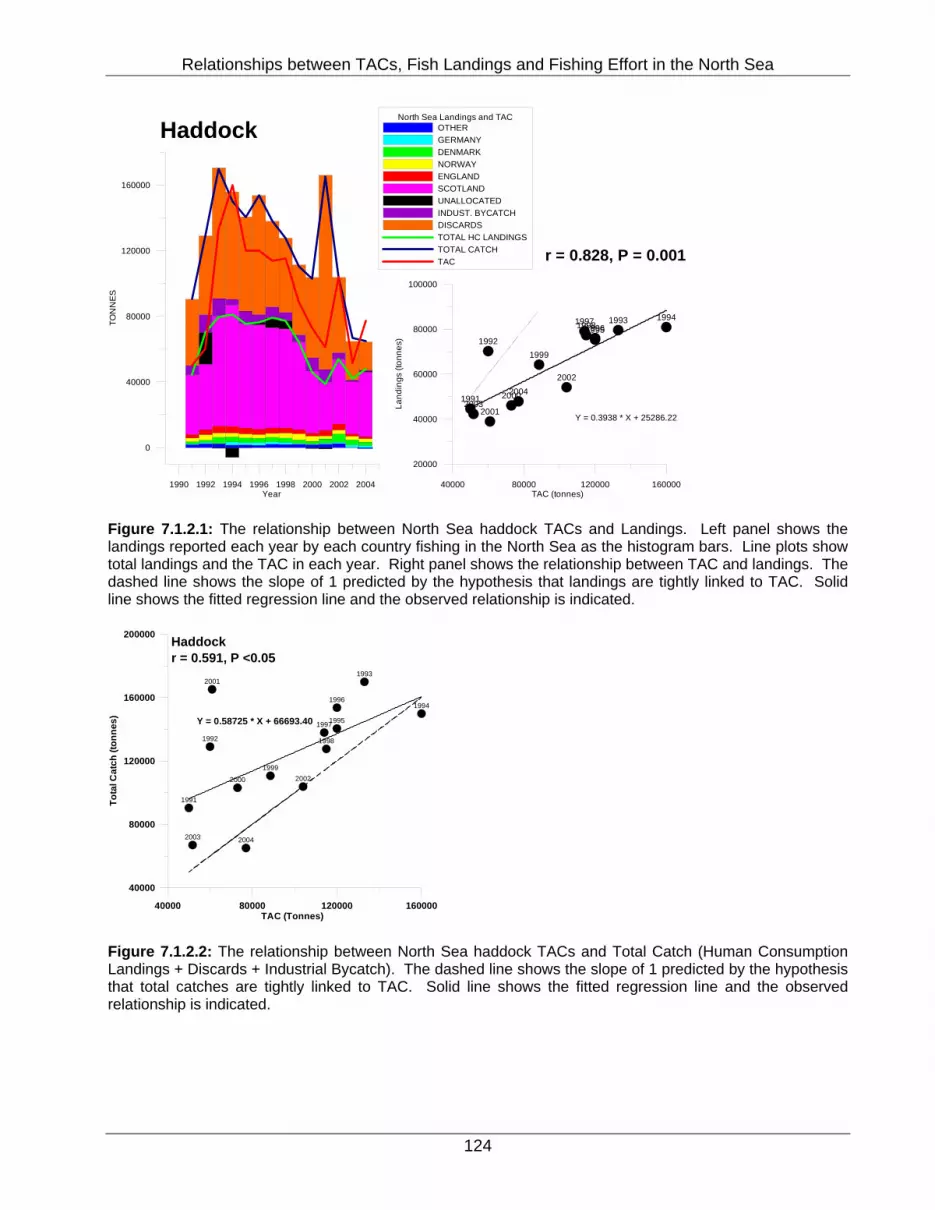
Relationships between TACs, Fish Landings and Fishing Effort in the North Sea
1990 1992 1994 1996 1998 2000 2002 2004Year
0
40000
80000
120000
160000
TON
NES
North Sea Landings and TACOTHERGERMANYDENMARKNORWAYENGLANDSCOTLANDUNALLOCATEDINDUST. BYCATCHDISCARDSTOTAL HC LANDINGSTOTAL CATCHTAC
40000 80000 120000 160000TAC (tonnes)
20000
40000
60000
80000
100000
Land
ings
(ton
nes)
1991
1992
1993 199419951996
19971998
1999
2000
2001
2002
20032004
Haddock
r = 0.828, P = 0.001
Y = 0.3938 * X + 25286.22
Figure 7.1.2.1: The relationship between North Sea haddock TACs and Landings. Left panel shows the landings reported each year by each country fishing in the North Sea as the histogram bars. Line plots show total landings and the TAC in each year. Right panel shows the relationship between TAC and landings. The dashed line shows the slope of 1 predicted by the hypothesis that landings are tightly linked to TAC. Solid line shows the fitted regression line and the observed relationship is indicated.
40000 80000 120000 160000TAC (Tonnes)
40000
80000
120000
160000
200000
Tota
l Cat
ch (t
onne
s)
1991
1992
1993
1994
1995
1996
1997
1998
1999
2000
2001
2002
2003 2004
r = 0.591, P <0.05Haddock
Y = 0.58725 * X + 66693.40
Figure 7.1.2.2: The relationship between North Sea haddock TACs and Total Catch (Human Consumption Landings + Discards + Industrial Bycatch). The dashed line shows the slope of 1 predicted by the hypothesis that total catches are tightly linked to TAC. Solid line shows the fitted regression line and the observed relationship is indicated.
124
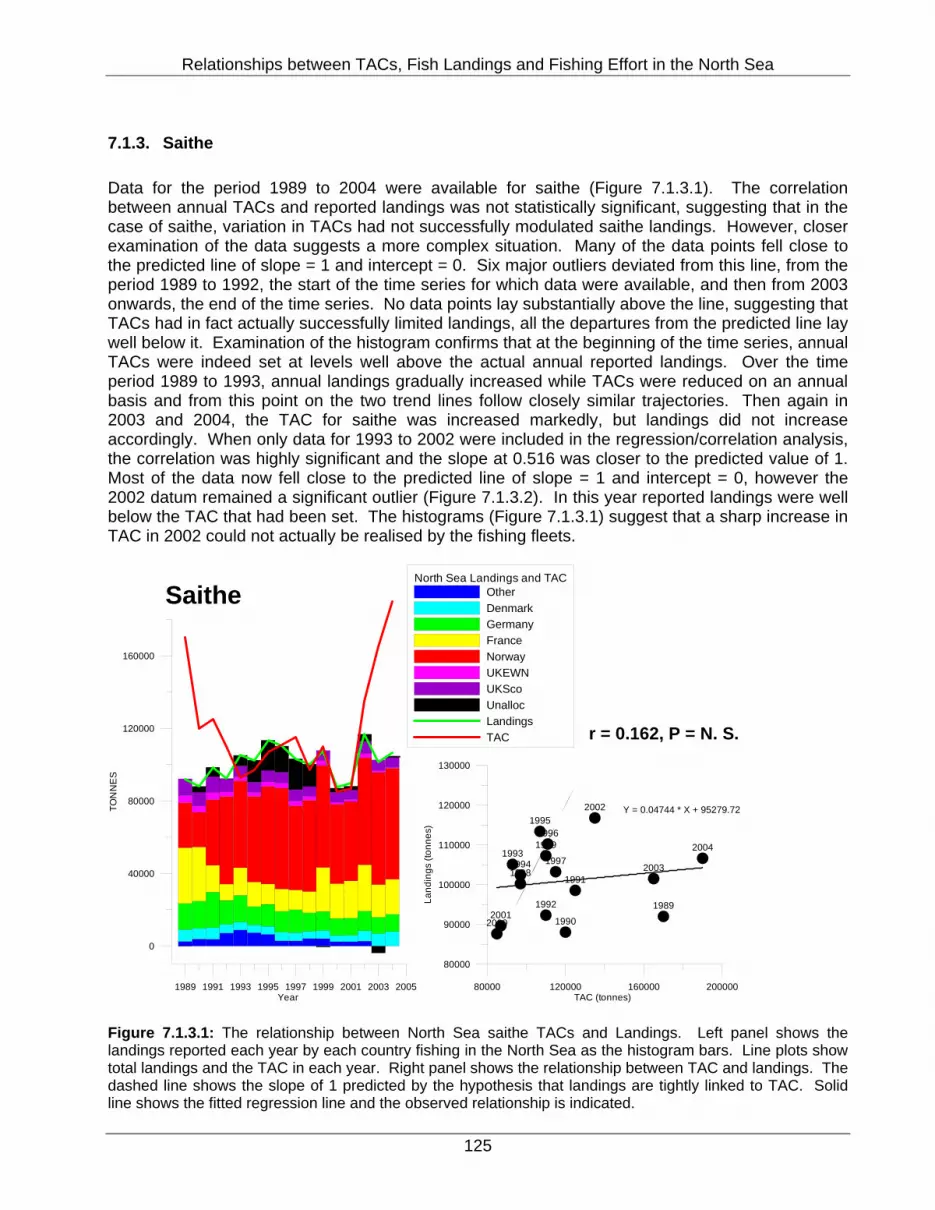
Relationships between TACs, Fish Landings and Fishing Effort in the North Sea
7.1.3. Saithe Data for the period 1989 to 2004 were available for saithe (Figure 7.1.3.1). The correlation between annual TACs and reported landings was not statistically significant, suggesting that in the case of saithe, variation in TACs had not successfully modulated saithe landings. However, closer examination of the data suggests a more complex situation. Many of the data points fell close to the predicted line of slope = 1 and intercept = 0. Six major outliers deviated from this line, from the period 1989 to 1992, the start of the time series for which data were available, and then from 2003 onwards, the end of the time series. No data points lay substantially above the line, suggesting that TACs had in fact actually successfully limited landings, all the departures from the predicted line lay well below it. Examination of the histogram confirms that at the beginning of the time series, annual TACs were indeed set at levels well above the actual annual reported landings. Over the time period 1989 to 1993, annual landings gradually increased while TACs were reduced on an annual basis and from this point on the two trend lines follow closely similar trajectories. Then again in 2003 and 2004, the TAC for saithe was increased markedly, but landings did not increase accordingly. When only data for 1993 to 2002 were included in the regression/correlation analysis, the correlation was highly significant and the slope at 0.516 was closer to the predicted value of 1. Most of the data now fell close to the predicted line of slope = 1 and intercept = 0, however the 2002 datum remained a significant outlier (Figure 7.1.3.2). In this year reported landings were well below the TAC that had been set. The histograms (Figure 7.1.3.1) suggest that a sharp increase in TAC in 2002 could not actually be realised by the fishing fleets.
1989 1991 1993 1995 1997 1999 2001 2003 2005Year
0
40000
80000
120000
160000
TON
NE
S
North Sea Landings and TACOtherDenmarkGermanyFranceNorwayUKEWNUKScoUnallocLandingsTAC
80000 120000 160000 200000TAC (tonnes)
80000
90000
100000
110000
120000
130000
Land
ings
(ton
nes)
1989
1990
1991
1992
19931994
19951996
19971998
1999
20002001
2002
2003
2004
Saithe
r = 0.162, P = N. S.
Y = 0.04744 * X + 95279.72
Figure 7.1.3.1: The relationship between North Sea saithe TACs and Landings. Left panel shows the landings reported each year by each country fishing in the North Sea as the histogram bars. Line plots show total landings and the TAC in each year. Right panel shows the relationship between TAC and landings. The dashed line shows the slope of 1 predicted by the hypothesis that landings are tightly linked to TAC. Solid line shows the fitted regression line and the observed relationship is indicated.
125

Relationships between TACs, Fish Landings and Fishing Effort in the North Sea
80000 90000 100000 110000 120000 130000 140000TAC (Tonnes)
80000
90000
100000
110000
120000
130000
140000
Tota
l Cat
ch (t
onne
s)
19931994
1995
1996
19971998
1999
20002001
2002
r = 0.828, P <0.001Saithe
Y = 0.51636 * X + 50131.7
Figure 7.1.3.2: The relationship between North Sea saithe TACs and reported landings over the period 1993 to 2002. The dashed line shows the slope of 1 predicted by the hypothesis that total catches are tightly linked to TAC. Solid line shows the fitted regression line and the observed relationship is indicated. 7.1.4. Whiting Data for the period 1991 to 2004 were available for whiting (Figure 7.1.4.1). The highly significant relationship between annual TACs and reported landings suggests that TACs have operated to modulate reported whiting landings in a predictable manner. However, the slope of the fitted regression, at 0.269, deviates markedly from the predicted slope of 1 and all the data points lie substantially below the predicted line of slope = 1 and intercept = 0. Examination of the histograms suggests that TACs reported in the Assessment working group reports take account of whiting discarded at sea or landed as bycatch in the industrial fishery. If whiting total annual catches (human consumption landings + discards + industrial bycatch) are plotted against the annual TACs reported in the assessment literature, the slope of the fitted regression at 0.661 is much closer to 1, and the data all lie close to the predicted line (Figure 7.1.4.2).
126

Relationships between TACs, Fish Landings and Fishing Effort in the North Sea
1990 1992 1994 1996 1998 2000 2002 2004Year
0
25000
50000
75000
100000
125000
150000
TON
NE
SNorth Sea Landings and TAC
OtherBelgiumDenmarkGermanyFranceNetherlandsEKEWNUKScoUnallocatedUndust. BycatchDiscardsTotal HC LandingsTotal CatchTAC
0 40000 80000 120000 160000TAC (tonnes)
0
20000
40000
60000
Land
ings
(ton
nes)
199119921993
19941995
1996
1997
19981999
200020012002
20032004
Whiting
r = 0.947, P <0.001
Y = 0.30117 * X + 9779.71
Figure 7.1.4.1: The relationship between North Sea whiting TACs and Landings. Left panel shows the landings reported each year by each country fishing in the North Sea as the histogram bars. Line plots show total landings and the TAC in each year. Right panel shows the relationship between TAC and landings. The dashed line shows the slope of 1 predicted by the hypothesis that landings are tightly linked to TAC. Solid line shows the fitted regression line and the observed relationship is indicated.
0 40000 80000 120000 160000TAC (Tonnes)
0
40000
80000
120000
160000
Tota
l Cat
ch (t
onne
s)
Y = 0.66946 * X + 21739.90
r = 0.926, P <0.001Whiting
Figure 7.1.4.2: The relationship between North Sea whiting TACs and Total Catch (Human Consumption Landings + Discards + Industrial Bycatch). The dashed line shows the slope of 1 predicted by the hypothesis that total catches are tightly linked to TAC. Solid line shows the fitted regression line and the observed relationship is indicated.
127

Relationships between TACs, Fish Landings and Fishing Effort in the North Sea
7.1.5. Sole Data for the period 1982 to 2004 were available for sole (Figure 7.1.5.1). Annual landings were significantly correlated with the TAC in each year and the slope of the regression relationship, at 0.907, was reasonably close to 1. The intercept at 4807, was however much greater than zero, sufficient over the range of TACs set to result in most of the data lying slightly above the predicted line. Landings in most years appear to have slightly overshot the TAC, but the highly significant relationship between TACs and landings, with data lying close to the predicted line, suggests that TACs have limited reported landings over this period.
1981 1985 1989 1993 1997 2001 2005Year
0
5000
10000
15000
20000
25000
30000
35000
TON
NE
S
North Sea Landings and TACOtherBelgiumDenmarkGermanyFranceNetherlandsUKEWNUKScoUnallocatedTotal landingsTAC
12000 16000 20000 24000 28000 32000TAC (tonnes)
10000
20000
30000
40000
Land
ings
(ton
nes)
1982
19831984
1985
19861987
19881989
19901991
199219931994
1995
1996
1997
1998
19992000
2001
20022003
2004
Sole
r = 0.829, P <0.001
Y = 0.92558 * X + 4305.33
Figure 7.1.5.1: The relationship between North Sea sole TACs and Landings. Left panel shows the landings reported each year by each country fishing in the North Sea as the histogram bars. Line plots show total landings and the TAC in each year. Right panel shows the relationship between TAC and landings. The dashed line shows the slope of 1 predicted by the hypothesis that landings are tightly linked to TAC. Solid line shows the fitted regression line and the observed relationship is indicated. 7.1.6. Plaice Data for the period 1993 to 2004 were available for plaice (Figure 7.1.6.1). Annual landings were significantly correlated with the TAC in each year, however, the slope of the regression relationship, at 0.421, deviated sharply from the predicted slope of 1. Although most years lay below the predicted line of slope = 1 and intercept = 0, in fact all but the years 1993 and 1994, fell quite close
128
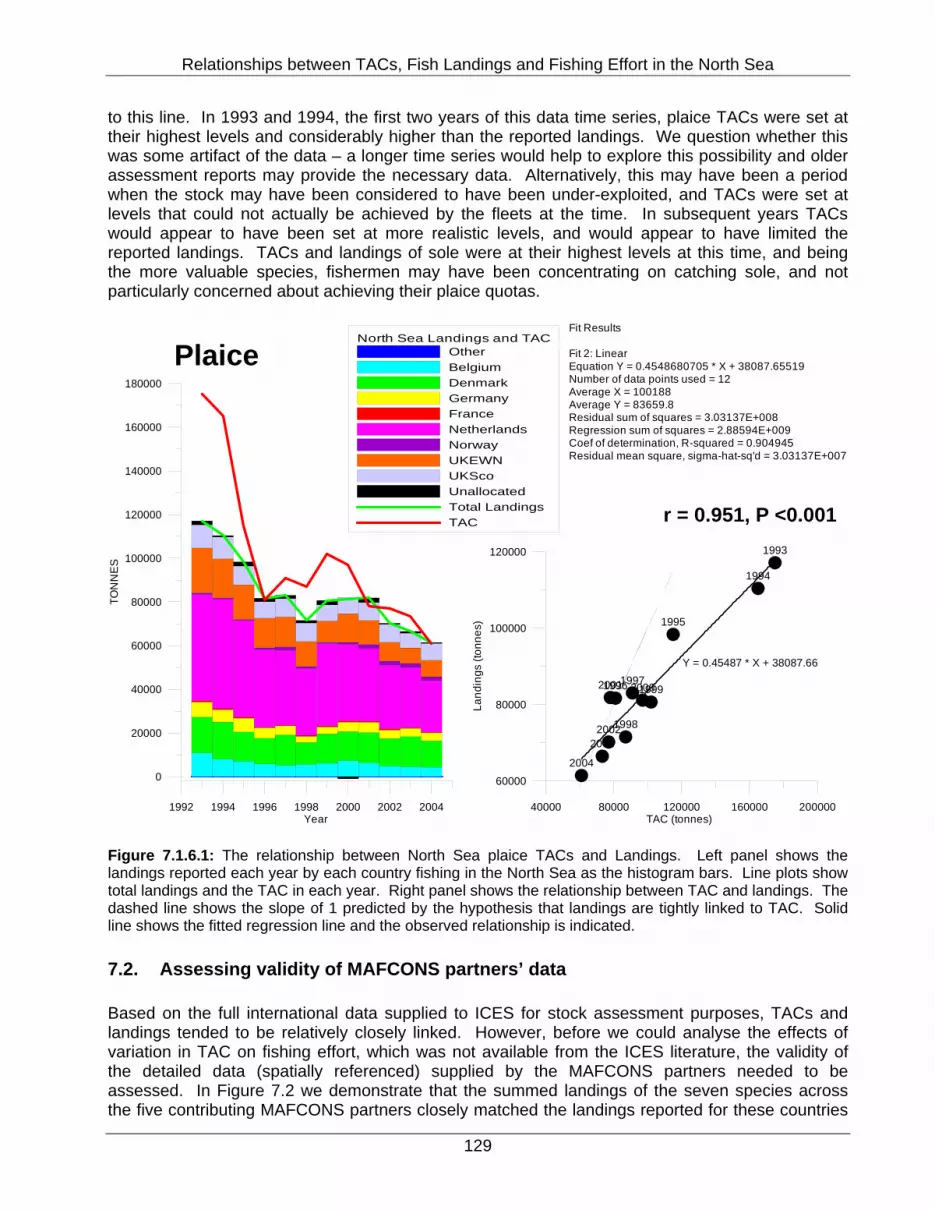
Relationships between TACs, Fish Landings and Fishing Effort in the North Sea
to this line. In 1993 and 1994, the first two years of this data time series, plaice TACs were set at their highest levels and considerably higher than the reported landings. We question whether this was some artifact of the data – a longer time series would help to explore this possibility and older assessment reports may provide the necessary data. Alternatively, this may have been a period when the stock may have been considered to have been under-exploited, and TACs were set at levels that could not actually be achieved by the fleets at the time. In subsequent years TACs would appear to have been set at more realistic levels, and would appear to have limited the reported landings. TACs and landings of sole were at their highest levels at this time, and being the more valuable species, fishermen may have been concentrating on catching sole, and not particularly concerned about achieving their plaice quotas.
1992 1994 1996 1998 2000 2002 2004Year
0
20000
40000
60000
80000
100000
120000
140000
160000
180000
TON
NE
S
North Sea Landings and TACOtherBelgiumDenmarkGermanyFranceNetherlandsNorwayUKEWNUKScoUnallocatedTotal LandingsTAC
40000 80000 120000 160000 200000TAC (tonnes)
60000
80000
100000
120000
Land
ings
(ton
nes)
1993
1994
1995
19961997
1998
199920002001
20022003
2004
Plaice
r = 0.951, P <0.001
Y = 0.45487 * X + 38087.66
Fit Results
Fit 2: LinearEquation Y = 0.4548680705 * X + 38087.65519Number of data points used = 12Average X = 100188Average Y = 83659.8Residual sum of squares = 3.03137E+008Regression sum of squares = 2.88594E+009Coef of determination, R-squared = 0.904945Residual mean square, sigma-hat-sq'd = 3.03137E+007
Figure 7.1.6.1: The relationship between North Sea plaice TACs and Landings. Left panel shows the landings reported each year by each country fishing in the North Sea as the histogram bars. Line plots show total landings and the TAC in each year. Right panel shows the relationship between TAC and landings. The dashed line shows the slope of 1 predicted by the hypothesis that landings are tightly linked to TAC. Solid line shows the fitted regression line and the observed relationship is indicated. 7.2. Assessing validity of MAFCONS partners’ data Based on the full international data supplied to ICES for stock assessment purposes, TACs and landings tended to be relatively closely linked. However, before we could analyse the effects of variation in TAC on fishing effort, which was not available from the ICES literature, the validity of the detailed data (spatially referenced) supplied by the MAFCONS partners needed to be assessed. In Figure 7.2 we demonstrate that the summed landings of the seven species across the five contributing MAFCONS partners closely matched the landings reported for these countries
129

Relationships between TACs, Fish Landings and Fishing Effort in the North Sea
in the ICES assessments. Some systematic variation occurred, but we suspect that this involved quota swapping that we have been unable to take account of. Plaice and saithe were the main species affected in this respect, where it would appear that systematically more plaice and less saithe were landed by the five MAFCONS countries compared to what was reported by ICES.
0 20 40 60 80 100
0
20
40
60
80
100
1997
1998
19992000
2001200220032004
30 40 50 60 70
30
40
50
60
70 19971998
1999
2000
2001
2002
2003
2004
5 10 15 20 25 30
5
10
15
20
25
30 1997
199819992000
20012002
20032004
55 60 65 70 75 80
40
50
60
70
80
19971998 1999
2000
2001
20022003
2004
40 45 50 55 60 65
40
50
60
70
80 1997
19981999
20002001
2002
2003
2004
10 12 14 16 18 20 22
10
12
14
16
18
20
22
1997
1998
1999
2000
2001
200220032004
11 12 13 14 15 16ACFM Landings (1000t)
11
12
13
14
15
16
1997
1998
1999
20002001
20022003
2004
200 240 280 320 360ACFM Landings (1000t)
200
240
280
320
36019971998
1999
2000
20012002
2003
Haddock
Seven speciescombined
Cod
Saithe
SolePlaice
Nephrops
Whiting
MA
FCO
NS
Part
ners
Lan
ding
s (1
000t
)
Figure 7.2.1: Correspondence between the landings data contributed by the MAFCONS project partners and the data reported to ICES for the stock assessments. Plots show total annual landings of each species, and all seven species combined, derived from the ACFM report (ICES 2005) summarising the ICES advice following the 2005 stock assessment process and annual summed landings data derived from the MAFCONS database for the five countries involved in the MAFCONS project. Solid lines indicate relationship expected for perfect agreement and dashed lines show linear fits to the data.
130

Relationships between TACs, Fish Landings and Fishing Effort in the North Sea
7.3. Relationships between international landings and effort (by gear) The four main gears and seven species were considered. Individual plots of landings against effort are shown for the seven species in beam trawl (Figure 7.3.1), otter trawl directed at fish (Figure 7.3.3), otter trawl directed at Nephrops (Figure 7.3.3), and seine net (Figure 7.3.4). Correlation coefficients are shown in Table 7.3.1. Despite the expectation that by pure chance alone, as effort by a gear increased, landings of each species should also increase, many of the correlations were not statistically significant and no relationship between effort and landings was even suggested by the data. Despite sole being the major species targeted by the beam trawl fishery because of its higher value, the relationship between beam trawl effort and landings was not significant. This lack of a relationship may indeed be because landings were limited by quotas. In other words, once the sole quotas were taken, beam trawling continued, but now directed towards plaice, with sole perhaps being discarded, or landed illegally. Landings of cod and whiting taken in beam trawls were also significantly correlated with beam trawl effort, but landings levels were low and the two relationships were almost certainly simply random increases in bycatch as effort levels increased. Otter trawlers directing their activities at fish tend to operate a very mixed fishery, and landings of cod, haddock and whiting, and Nephrops too, were all significantly correlated with otter trawl effort. Only Nephrops landings were significantly correlated with effort by otter trawl directed at Nephrops, possibly because of the very limited spatial range over which this fishing activity occurs. Landings levels of fish by these vessels were low. Landings of all four gadoids, and of plaice, were significantly correlated with seine net effort. Again this is a very mixed fishery. Species Beam Trawl Otter trawl (fish) Otter trawl (Nephrops) Seine net Cod 0.852 0.893 -0.605 0.936 Haddock 0.414 0.811 0.678 0.793 Whiting 0.887 0.946 0.023 0.940 Saithe 0.273 0.016 0.595 0.968 Sole 0.185 -0.606 -0.276 0.495 Plaice 0.913 -0.358 -0.010 0.887 Nephrops -0.040 0.841 0.717 0.607 Table 7.3.1: Correlation coefficients for annual landings of cod, haddock, whiting, saithe, sole, plaice, and Nephrops reported in each year taken by beam trawl, otter trawl directed at fish, otter trawl directed at Nephrops, and seine net and the effort expended by these gears in each year. Data for five MAFCONS contributing countries combined. Significant correlations (p<0.05) are indicated by bold font.
131

Relationships between TACs, Fish Landings and Fishing Effort in the North Sea
0
4
8
12La
ndin
gs (1
000t
)
1997
1998
1999
200020012002
20032004
0.15
0.2
0.25
0.3
0.35
0.41997
1998
19992000
2001
2002
2003
2004
0.4
0.8
1.2
1.6
2
Land
ings
(100
0t) 1997
1998
19992000
20012002
20032004
0.0040.0080.0120.0160.02
0.0240.028 1997
19981999
20002001
2002
2003
2004
10121416182022
Land
ings
(100
0t)
1997
1998
1999
2000
2001
200220032004
600 700 800 900 1000Effort (1000h)
40
50
60
70
801997
1998199920002001
2002
20032004
600 700 800 900 1000Effort (1000h)
0
0.04
0.08
0.12
0.16
Land
ings
(100
0t)
1997
19981999
2000
2001
2002
20032004
Beam trawl
Cod
Haddock
Whiting
Saithe
Plaice
Sole
Nephrops
Figure 7.3.1: Relationships between annual reported hours of fishing by beam trawl and landings of cod, haddock, whiting, saithe, sole, plaice, and Nephrops caught in beam trawls by the five MAFCONS contributing countries over the period 1997 to 2004. Significant (p<0.05) linear relationships are indicated.
132

Relationships between TACs, Fish Landings and Fishing Effort in the North Sea
0
20
40
60
80La
ndin
gs (1
000t
)
1997
1998
19992000
2001200220032004
25
30
35
40
45
5019971998
1999
2000
2001
2002
20032004
4
8
12
16
20
Land
ings
(100
0t) 1997
199819992000
20012002
20032004
40
50
60
70 19971998
1999
2000
2001
20022003
2004
0.160.2
0.240.280.320.36
0.4
Land
ings
(100
0t)
1997
1998
1999
20002001
2002
2003
2004
400 600 800 1000 1200Effort (1000h)
4
5
6
7
8
9
19971998
1999
20002001
2002
2003
2004
400 600 800 1000 1200Effort (1000h)
2
2.5
3
3.5
4
4.5
Land
ings
(100
0t)
1997
1998
1999
20002001
2002
2003
2004
Otter trawl (fish)
CodHaddock
Whiting Saithe
Plaice
Sole
Nephrops
Figure 7.3.2: Relationships between annual reported hours of fishing by otter trawl directed at fish and landings of cod, haddock, whiting, saithe, sole, plaice, and Nephrops caught in otter trawl directed at fish by the five MAFCONS contributing countries over the period 1997 to 2004. Significant (p<0.05) linear relationships are indicated.
133

Relationships between TACs, Fish Landings and Fishing Effort in the North Sea
0.7
0.8
0.9
1
1.1
1.2La
ndin
gs (1
000t
)
19971998 19992000
2001
2002
20032004
0.8
1.2
1.6
2
2.4
2.8
1997
1998
1999
2000
2001
20022003
2004
0.8
1
1.2
1.4
1.6
Land
ings
(100
0t)
19971998
1999
2000 20012002
2003
2004
0
0.1
0.2
0.3
0.4
0.5
19971998
19992000 2001
2002
2003
2004
0.002
0.004
0.006
0.008
0.01
0.012
Land
ings
(100
0t) 1997
1998
1999
2000
20012002
2003
2004
160 180 200 220 240 260 280Effort (1000h)
0.14
0.16
0.18
0.2
0.221997
1998
1999
2000 20012002
20032004
160 180 200 220 240 260 280Effort (1000h)
6
8
10
12
14
Land
ings
(100
0t)
1997
1998
19992000
200120022003
2004
Otter trawl (Nephrops)
Cod
Haddock
Whiting
Saithe
Plaice
Sole
Nephrops
Figure 7.3.3: Relationships between annual reported hours of fishing by otter trawl directed at Nephrops and landings of cod, haddock, whiting, saithe, sole, plaice, and Nephrops caught in otter trawl directed at Nephrops by the five MAFCONS contributing countries over the period 1997 to 2004. Significant (p<0.05) linear relationships are indicated.
134

Relationships between TACs, Fish Landings and Fishing Effort in the North Sea
0
4
8
12La
ndin
gs (1
000t
) 19971998
19992000
2001200220032004
4
8
12
16
20
24 19971998
1999
2000
2001
2002
2003
2004
0
2
4
6
8
Land
ings
(100
0t)
1997
199819992000
20012002
20032004
0
0.4
0.8
1.2
1.6 1997
199819992000
20012002
20032004
0
0.0001
0.0002
0.0003
0.0004
0.0005
Land
ings
(100
0t)
1997
1998
1999
2000
20012002
2003
2004
20 40 60 80 100Effort (1000h)
0.4
0.8
1.2
1.6
21997
19981999
2000
20012002
2003
2004
20 40 60 80 100Effort (1000h)
0
0.02
0.04
0.06
Land
ings
(100
0t)
1997
1998
19992000
2001
20022003
2004
Seine net
CodHaddock
Whiting
Saithe
Plaice
Sole
Nephrops
Figure 7.3.4: Relationships between annual reported hours of fishing by seine net and landings of cod, haddock, whiting, saithe, sole, plaice, and Nephrops caught in seine net by the five MAFCONS contributing countries over the period 1997 to 2004. Significant (p<0.05) linear relationships are indicated.
135

Relationships between TACs, Fish Landings and Fishing Effort in the North Sea
7.4. Relationships Between TACs and Effort In this section we investigate whether variation in North Sea TACs for the seven main species had any influence on levels of international fishing effort for the five contributing MAFCONS countries combined. Of the 28 relationships examined, only 9 significant positive correlations were detected. These were noted between cod, whiting and plaice TACs and effort by beam trawl, otter trawl directed at fish and seine net. Despite the consistent pattern between TACs for these three species and effort by these three gears, these results are difficult to interpret. TACs for all three species declined markedly over the eight year period, during which fishing effort by these three gears was also reduced considerably. However, it is difficult to determine cause and effect, because over the same period, fishing effort was also restricted by regulation. The question then arises, in the absence of this regulatory effort limitation, would effort have declined to the same extent, or indeed at all, if management restrictions on fishing activity had been limited to just the setting of TACs. Seven other relationships between TAC and fishing effort were statistically significant, but the relationships were negative; an increase in TAC associated with a decrease in fishing effort. All these relationships involved either saithe or Nephrops TACs or Otter trawl effort directed at Nephrops. In these case the significant relationships were clearly spurious. TACs for both Nephrops and saithe increased over the study period, at a time when fishing effort by beam trawl, otter trawl directed at fish and seine net was declining. Under these circumstances, negative correlations between TAC and effort were more or less inevitable, but with no causative link between the two variables. Similarly, because of the increased TAC for Nephrops, effort by otter trawl directed at Nephrops increased between 1997 and 2004. Consequently, negative correlations were a likely prospect at a time when TACs for some species, particularly cod and whiting, were declining steeply. Again these were clearly spurious relationships without any causative link. In summary then, of 28 relationships examined, 12 correlations were not statistically significant, seven were statistically significant, but the relationships were negative and clearly spurious with no causative link, and only 9 were statistically significant and suggestive of any effect of TAC on fishing effort. However, a consistent pattern emerged from these nine relationships that perhaps indicated that reduction in the TACs of cod, whiting and haddock may have contributed to the reduction in fishing effort by beam trawl, otter trawl directed at fish, and seine net. TAC Beam trawl Otter trawl (fish) Otter trawl (Nephrops) Seine Cod 0.877 0.909 -0.892 0.936 Haddock 0.644 0.612 -0.613 0.656 Whiting 0.935 0.883 -0.778 0.927 Saithe -0.760 -0.815 0.495 -0.745 Sole 0.488 0.564 -0.398 0.579 Plaice 0.756 0.850 -0.587 0.816 Nephrops -0.760 -0.796 0.544 -0.696 Table 7.4.1: Correlation coefficients for relationships between North Sea TACs for cod, haddock, whiting, saithe, sole, plaice, and Nephrops and fishing effort by beam trawl, otter trawl directed at fish, otter trawl directed at Nephrops, and seine net by the five MAFCONS contributing countries. Significant correlations at p<0.05 are indicated by bold font.
136

Relationships between TACs, Fish Landings and Fishing Effort in the North Sea
0 40 80 120 160
600
700
800
900
1000
Effo
rt (1
000h
)
40 60 80 100 120
600
700
800
900
1000
0 20 40 60 80
600
700
800
900
1000
Effo
rt (1
000h
)
80 120 160 200
600
700
800
900
1000
14 16 18 20 22
600
700
800
900
1000
Effo
rt (1
000h
)
60 70 80 90 100 110TAC (1000t)
600
700
800
900
1000
14 16 18 20 22TAC (1000t)
600
700
800
900
1000
Effo
rt (1
000h
)Beam trawl
Cod Haddock
Whiting Saithe
PlaiceSole
Nephrops
Figure 7.4.1: Relationships between North Sea TACs for cod, haddock, whiting, saithe, sole, plaice, and Nephrops and international beam trawl effort by the five MAFCONS contributing countries. Significant correlations at p<0.05 are indicated.
137
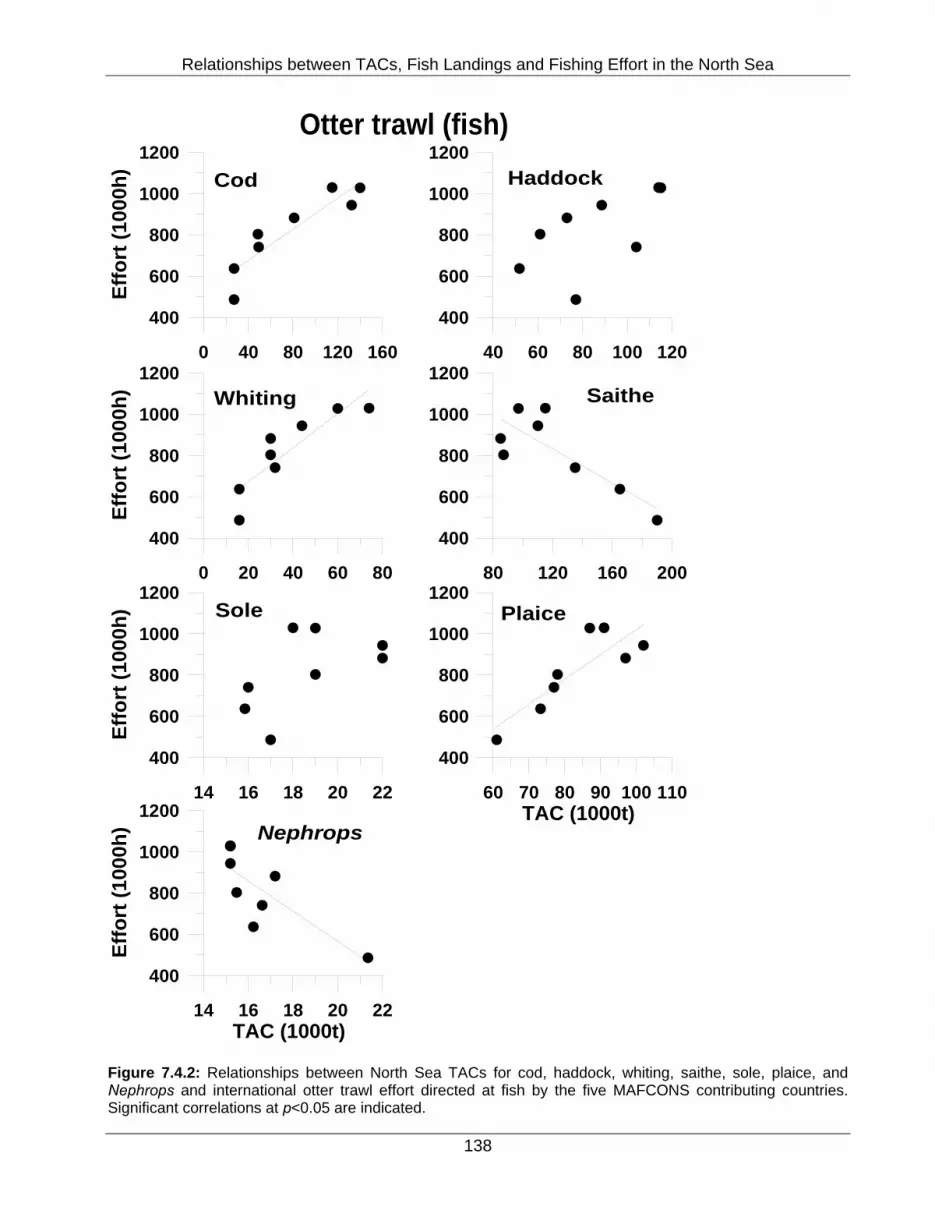
Relationships between TACs, Fish Landings and Fishing Effort in the North Sea
0 40 80 120 160
400
600
800
1000
1200
Effo
rt (1
000h
)
40 60 80 100 120
400
600
800
1000
1200
0 20 40 60 80
400
600
800
1000
1200
Effo
rt (1
000h
)
80 120 160 200
400
600
800
1000
1200
14 16 18 20 22
400
600
800
1000
1200
Effo
rt (1
000h
)
60 70 80 90 100 110TAC (1000t)
400
600
800
1000
1200
14 16 18 20 22TAC (1000t)
400
600
800
1000
1200
Effo
rt (1
000h
)Otter trawl (fish)
Cod Haddock
Whiting Saithe
PlaiceSole
Nephrops
Figure 7.4.2: Relationships between North Sea TACs for cod, haddock, whiting, saithe, sole, plaice, and Nephrops and international otter trawl effort directed at fish by the five MAFCONS contributing countries. Significant correlations at p<0.05 are indicated.
138
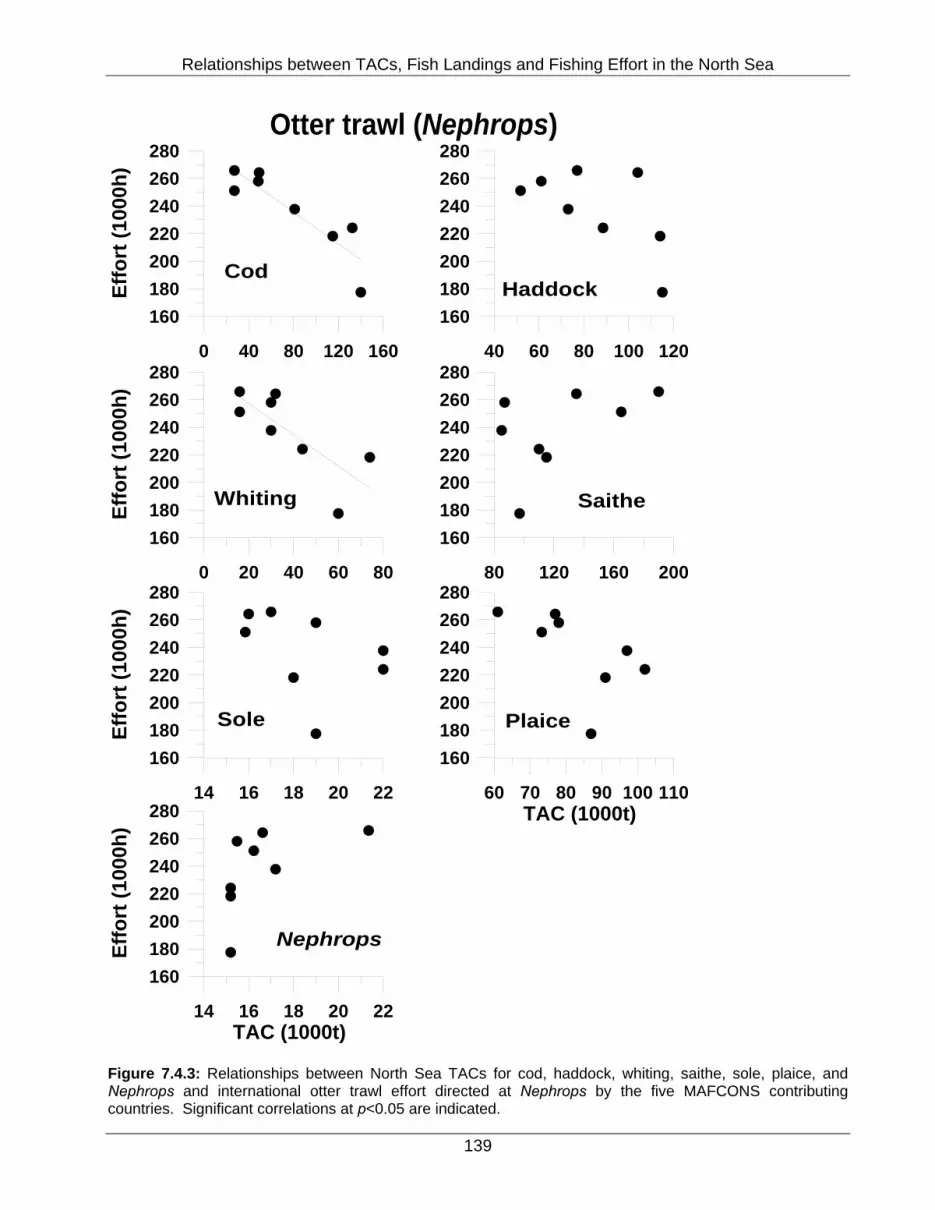
Relationships between TACs, Fish Landings and Fishing Effort in the North Sea
0 40 80 120 160
160180200220240260280
Effo
rt (1
000h
)
40 60 80 100 120
160180200220240260280
0 20 40 60 80
160180200220240260280
Effo
rt (1
000h
)
80 120 160 200
160180200220240260280
14 16 18 20 22
160180200220240260280
Effo
rt (1
000h
)
60 70 80 90 100 110TAC (1000t)
160180200220240260280
14 16 18 20 22TAC (1000t)
160180200220240260280
Effo
rt (1
000h
)Otter trawl (Nephrops)
CodHaddock
Whiting Saithe
PlaiceSole
Nephrops
Figure 7.4.3: Relationships between North Sea TACs for cod, haddock, whiting, saithe, sole, plaice, and Nephrops and international otter trawl effort directed at Nephrops by the five MAFCONS contributing countries. Significant correlations at p<0.05 are indicated.
139

Relationships between TACs, Fish Landings and Fishing Effort in the North Sea
0 40 80 120 160
20
40
60
80
100
Effo
rt (1
000h
)
40 60 80 100 120
20
40
60
80
100
0 20 40 60 80
20
40
60
80
100
Effo
rt (1
000h
)
80 120 160 200
20
40
60
80
100
14 16 18 20 22
20
40
60
80
100
Effo
rt (1
000h
)
60 70 80 90 100 110TAC (1000t)
20
40
60
80
100
14 16 18 20 22TAC (1000t)
20
40
60
80
100
Effo
rt (1
000h
)Seine net
Cod Haddock
Whiting Saithe
PlaiceSole
Nephrops
Figure 7.4.4: Relationships between North Sea TACs for cod, haddock, whiting, saithe, sole, plaice, and Nephrops and international seine net effort by the five MAFCONS contributing countries. Significant correlations at p<0.05 are indicated.
140

Relationships between TACs, Fish Landings and Fishing Effort in the North Sea
7.5. Spatial relationships between landings and effort in time In this section we consider how closely variation in landings and fishing effort is linked in space in each year. We determine the correlation coefficients for landings of each species by each gear versus hours effort by the gear concerned for all ICES rectangles in the North Sea, and we repeat the analysis for all species and all gears for each year between 1997 and 2004. In each case, we sum total landings and effort data over all five contributing MAFCONS countries. In any year, spatial variation in fishing effort by a given gear tended to be correlated with landings of each species in that gear. This was particularly true for the two otter trawl gears for which all correlations were positive and statistically significant (Table 7.5.1). Despite this however, the relationships were closer for some species than for others. For both otter trawls, the correlations between spatial variation in effort and spatial variation in landings were weakest, and only just consistently statistically significant, for sole (Figure 7.5.1). Relationships between spatial variation in beam trawl effort and spatial variation in landings from beam trawl were weakest for saithe with non-significant correlations in seven of the eight years for both species (Table 7.5.1). Single non-significant correlations were also observed for haddock and Nephrops in beam trawl (Table 7.5.1). Figure 7.5.1 clearly indicates that the relationships between spatial variation in effort and landings by beam trawl were consistently weakest for these three species. Relationships between spatial variation in seine net effort and spatial variation in landings from seine net were weakest for sole and Nephrops with non-significant correlations in five of the eight years for both species (Table 7.5.1). Again these consistent weak relationships are clearly evident in Figure 7.5.1. Year Species Beam Otter (Fish) Otter (Nephrops) Seine
Cod 0.913 0.816 0.846 0.753 Haddock 0.379 0.747 0.857 0.764 Nephrops -0.057 0.554 0.902 0.204 Plaice 0.900 0.587 0.727 0.644 Saithe 0.181 0.430 0.520 0.576 Sole 0.818 0.202 0.333 0.087
1997
Whiting 0.651 0.810 0.803 0.697 Cod 0.893 0.779 0.858 0.734 Haddock 0.318 0.688 0.832 0.756 Nephrops 0.274 0.535 0.900 0.070 Plaice 0.886 0.597 0.698 0.645 Saithe 0.081 0.433 0.482 0.533 Sole 0.792 0.249 0.366 0.131
1998
Whiting 0.585 0.782 0.783 0.693 Cod 0.863 0.808 0.821 0.690 Haddock 0.265 0.672 0.785 0.625 Nephrops 0.399 0.539 0.914 0.130 Plaice 0.876 0.483 0.639 0.554 Saithe 0.130 0.381 0.480 0.429 Sole 0.802 0.197 0.306 0.091
1999
Whiting 0.664 0.779 0.786 0.641 Cod 0.827 0.827 0.823 0.740 Haddock 0.250 0.702 0.835 0.793 Nephrops 0.331 0.576 0.926 0.101 Plaice 0.851 0.377 0.689 0.579
2000
Saithe 0.101 0.383 0.463 0.481
141
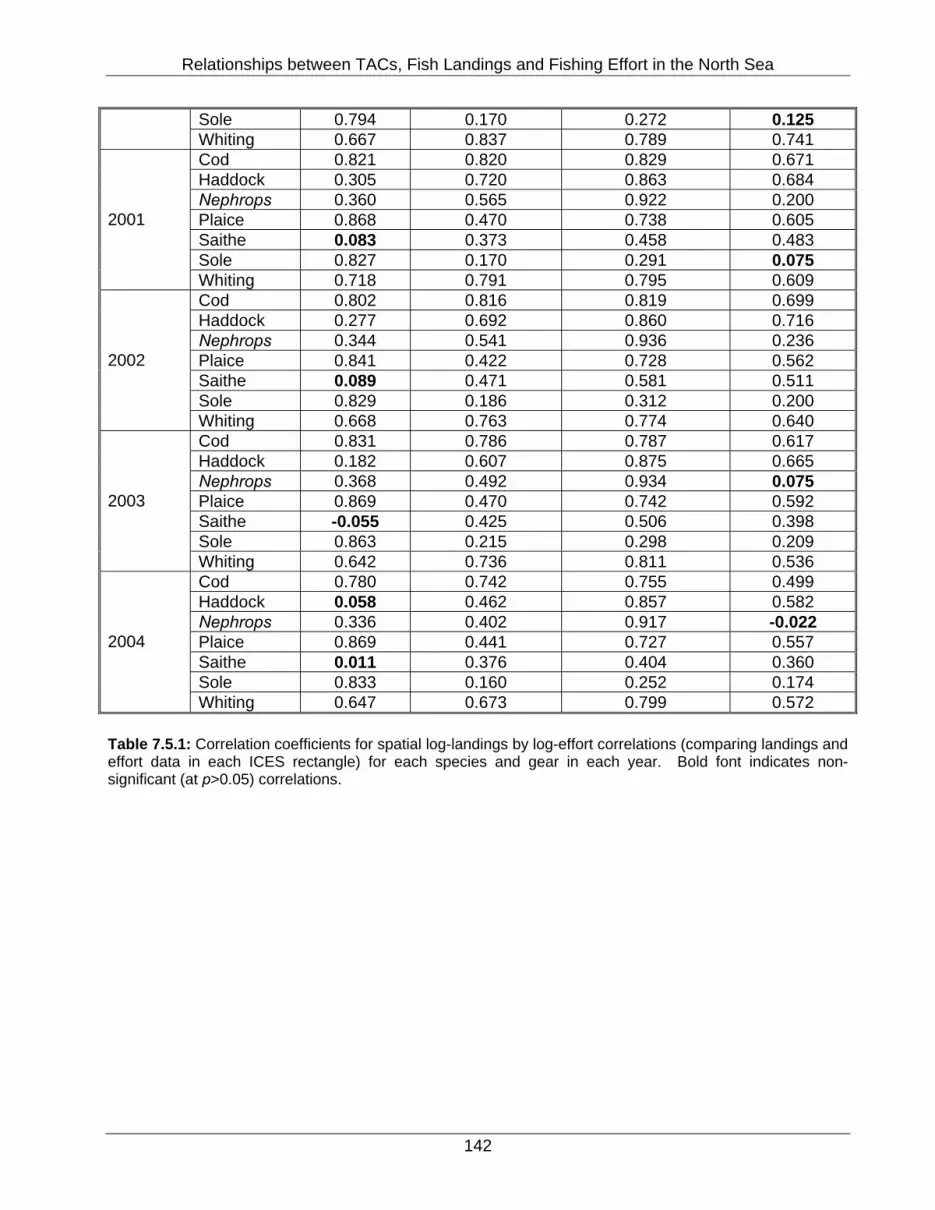
Relationships between TACs, Fish Landings and Fishing Effort in the North Sea
Sole 0.794 0.170 0.272 0.125 Whiting 0.667 0.837 0.789 0.741 Cod 0.821 0.820 0.829 0.671 Haddock 0.305 0.720 0.863 0.684 Nephrops 0.360 0.565 0.922 0.200 Plaice 0.868 0.470 0.738 0.605 Saithe 0.083 0.373 0.458 0.483 Sole 0.827 0.170 0.291 0.075
2001
Whiting 0.718 0.791 0.795 0.609 Cod 0.802 0.816 0.819 0.699 Haddock 0.277 0.692 0.860 0.716 Nephrops 0.344 0.541 0.936 0.236 Plaice 0.841 0.422 0.728 0.562 Saithe 0.089 0.471 0.581 0.511 Sole 0.829 0.186 0.312 0.200
2002
Whiting 0.668 0.763 0.774 0.640 Cod 0.831 0.786 0.787 0.617 Haddock 0.182 0.607 0.875 0.665 Nephrops 0.368 0.492 0.934 0.075 Plaice 0.869 0.470 0.742 0.592 Saithe -0.055 0.425 0.506 0.398 Sole 0.863 0.215 0.298 0.209
2003
Whiting 0.642 0.736 0.811 0.536 Cod 0.780 0.742 0.755 0.499 Haddock 0.058 0.462 0.857 0.582 Nephrops 0.336 0.402 0.917 -0.022 Plaice 0.869 0.441 0.727 0.557 Saithe 0.011 0.376 0.404 0.360 Sole 0.833 0.160 0.252 0.174
2004
Whiting 0.647 0.673 0.799 0.572 Table 7.5.1: Correlation coefficients for spatial log-landings by log-effort correlations (comparing landings and effort data in each ICES rectangle) for each species and gear in each year. Bold font indicates non-significant (at p>0.05) correlations.
142

Relationships between TACs, Fish Landings and Fishing Effort in the North Sea
-0.2
0
0.2
0.4
0.6
0.8
1r 2
CodHadWhi Sai Sol Pla NepSpecies
-0.2
0
0.2
0.4
0.6
0.8
1
r 2
CodHadWhi Sai Sol Pla NepSpecies
Beam trawl Otter trawl (fish)
Seine netOtter trawl (Nephrops)
Figure 7.5.1: Mean (± 1 S.D.) of the correlation coefficients obtained in each year (1997 to 2004) between spatial variation in fishing effort and spatial variation in landings of each species by each gear.
143
Relationships between TACs, Fish Landings and Fishing Effort in the North Sea
7.6. Temporal relationships between landings and effort in space Spatial variation in the level of correlation between annual variation in landings of each species by each gear and annual variation in effort by the gear in each ICES rectangles is examined in Figures 7.6.1. to 7.6.4. Variation in landings and effort over the period 1997 to 2004 was generally correlated in most rectangles, but the correlations were strongest in the main areas of a species range and in the main areas where each gear was used, and were particularly strong for the main species targeted by each gear.
144

Relationships between TACs, Fish Landings and Fishing Effort in the North Sea
50
52
54
56
58
60
62D
egre
es L
atitu
de
50
52
54
56
58
60
62
Deg
rees
Lat
itude
-5 0 5 10
Degrees Longitude-5 0 5 10
Degrees Longitude
-5 0 5 10
Degrees Longitude
50
52
54
56
58
60
62
Deg
rees
Lat
itude
Correlationcoefficient -1 to -0.5 -0.5 to -0.25 -0.25 to -0.1 -0.1 to 0.1 0.1 to 0.25 0.25 to 0.5 0.5 to 0.75 0.75 to 1
Haddock Whiting
Saithe Sole Plaice
Nephrops
Cod
Figure 7.6.1: Spatial variation in temporal correlation coefficients for annual log-landings by log-effort correlations (comparing landings and effort data in each year in each rectangle) for each species. Landings of species taken in beam trawls and effort by beam trawl.
145
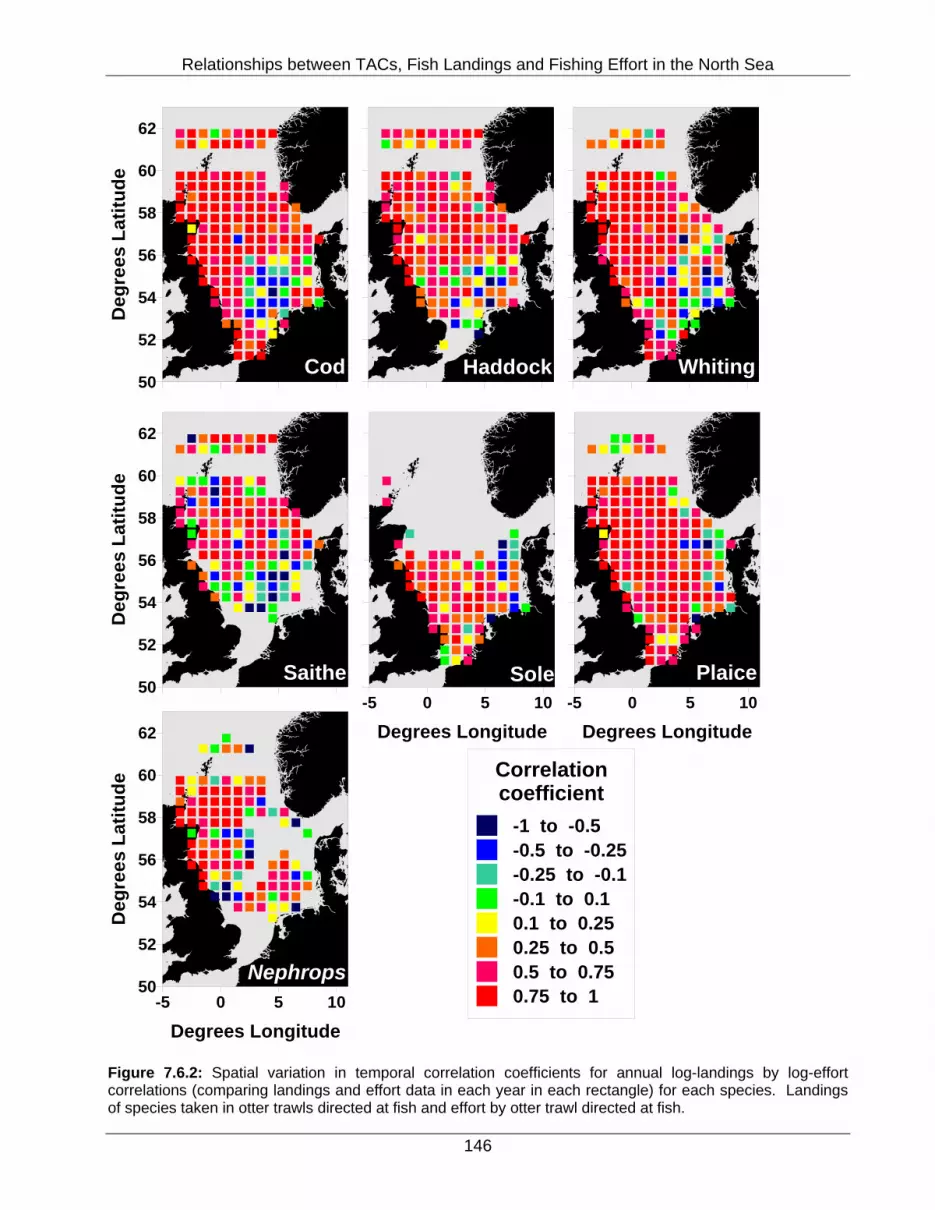
Relationships between TACs, Fish Landings and Fishing Effort in the North Sea
50
52
54
56
58
60
62D
egre
es L
atitu
de
50
52
54
56
58
60
62
Deg
rees
Lat
itude
-5 0 5 10
Degrees Longitude-5 0 5 10
Degrees Longitude
-5 0 5 10
Degrees Longitude
50
52
54
56
58
60
62
Deg
rees
Lat
itude
Correlationcoefficient -1 to -0.5 -0.5 to -0.25 -0.25 to -0.1 -0.1 to 0.1 0.1 to 0.25 0.25 to 0.5 0.5 to 0.75 0.75 to 1
Haddock Whiting
Saithe Sole Plaice
Nephrops
Cod
Figure 7.6.2: Spatial variation in temporal correlation coefficients for annual log-landings by log-effort correlations (comparing landings and effort data in each year in each rectangle) for each species. Landings of species taken in otter trawls directed at fish and effort by otter trawl directed at fish.
146

Relationships between TACs, Fish Landings and Fishing Effort in the North Sea
50
52
54
56
58
60
62D
egre
es L
atitu
de
50
52
54
56
58
60
62
Deg
rees
Lat
itude
-5 0 5 10
Degrees Longitude-5 0 5 10
Degrees Longitude
-5 0 5 10
Degrees Longitude
50
52
54
56
58
60
62
Deg
rees
Lat
itude
Correlationcoefficient -1 to -0.5 -0.5 to -0.25 -0.25 to -0.1 -0.1 to 0.1 0.1 to 0.25 0.25 to 0.5 0.5 to 0.75 0.75 to 1
Haddock Whiting
Saithe Sole Plaice
Nephrops
Cod
Figure 7.6.3: Spatial variation in temporal correlation coefficients for annual log-landings by log-effort correlations (comparing landings and effort data in each year in each rectangle) for each species. Landings of species taken in otter trawls directed at Nephrops and effort by otter trawl directed at Nephrops.
147
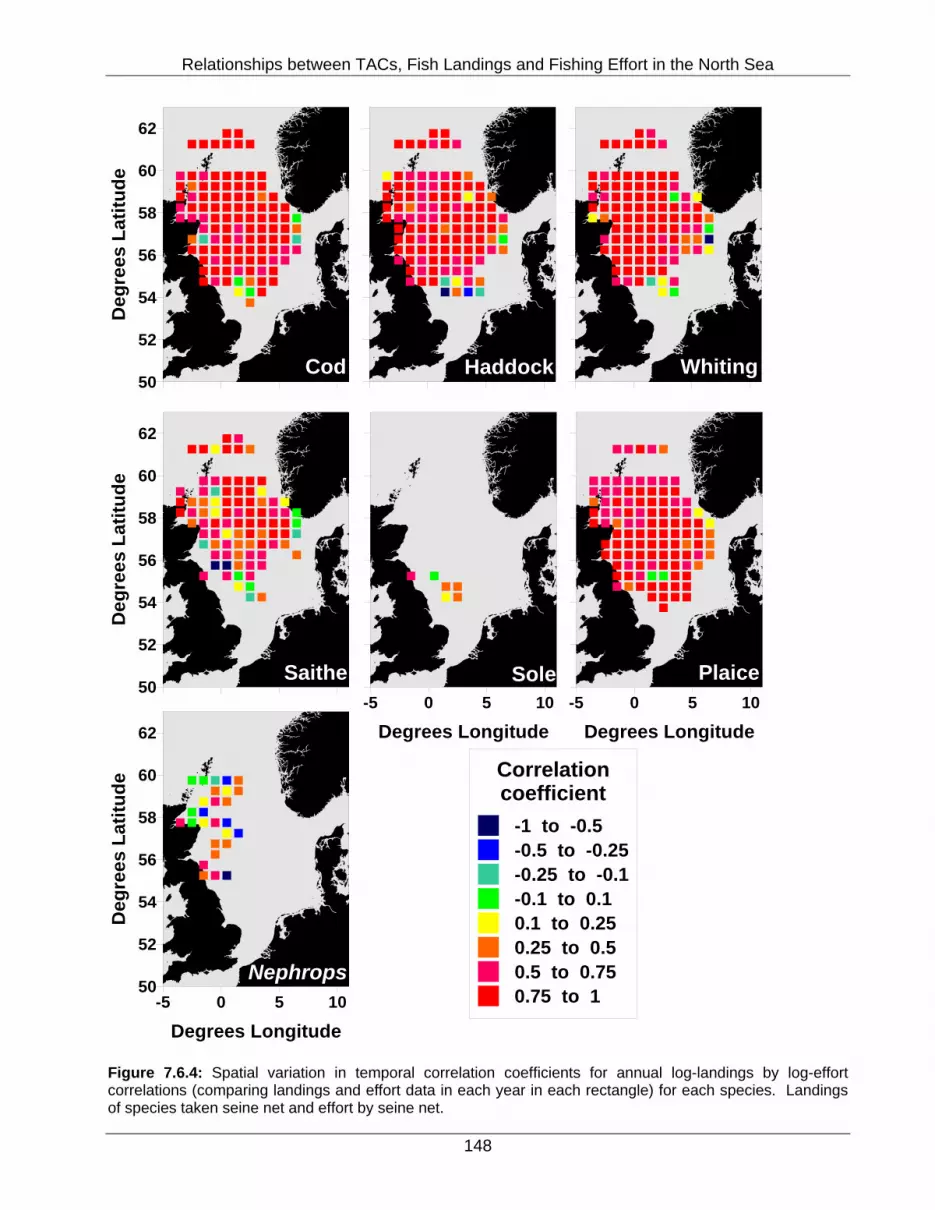
Relationships between TACs, Fish Landings and Fishing Effort in the North Sea
50
52
54
56
58
60
62D
egre
es L
atitu
de
50
52
54
56
58
60
62
Deg
rees
Lat
itude
-5 0 5 10
Degrees Longitude-5 0 5 10
Degrees Longitude
-5 0 5 10
Degrees Longitude
50
52
54
56
58
60
62
Deg
rees
Lat
itude
Correlationcoefficient -1 to -0.5 -0.5 to -0.25 -0.25 to -0.1 -0.1 to 0.1 0.1 to 0.25 0.25 to 0.5 0.5 to 0.75 0.75 to 1
Haddock Whiting
Saithe Sole Plaice
Nephrops
Cod
Figure 7.6.4: Spatial variation in temporal correlation coefficients for annual log-landings by log-effort correlations (comparing landings and effort data in each year in each rectangle) for each species. Landings of species taken seine net and effort by seine net.
148
Relationships between TACs, Fish Landings and Fishing Effort in the North Sea
8. INTERNATIONAL ANALYSES SUMMARY AND CONCLUSIONS
At the international level, there does seem to be a close link generally between TACs and total reported landings. We were unable to examine the effects of variation in total international TACs and landings on total international effort because we did not have access to these data for all countries. However, these analyses were undertaken on the combined data contributed by five of the countries participating in the MAFCONS project. As a general conclusion, landings of the principal species targeted by particular gears tended to be closely correlated with effort by that gear. In addition, landings of what might be considered to be bycatch species in each gear also tended to be correlated with effort by the gear. However, positive relationships between landings and effort might well be expected simply by chance – the more often a net is put in the water, the more of whatever is present is likely to be caught. This raises questions regarding what might constitute the most appropriate null hypotheses in these analyses. What is perhaps more surprising therefore is that significant positive relationships were not more commonly found. In many instances, landings of some species in some gears were not significantly correlated. In the case of otter trawl directed at Nephrops, only Nephrops landings were significantly correlated with effort. Direct examination of the effect of variation in North Sea TACs on international effort by the five contributing MAFCONS countries produced some odd and inconsistent results. For example, variation in Nephrops TAC was not significantly correlated with variation in effort by Nephrops trawlers. TACs of sole, the main stimulus for beam trawler skippers because of its higher value, appeared to have little influence on beam trawl effort. Conversely, variation in plaice TACs, larger in volume but of lower value per kilogram, were significantly correlated with beam trawl effort. The situation for otter trawl directed at fish differed yet again. For this gear, variation in the TAC of haddock, the species (excepting saithe) with the largest TAC, was not significantly correlated with otter trawl effort. Instead it was the two smaller TACs, for cod and whiting, which appeared to have a limiting effect on otter trawl hours fishing. Variation in seine net effort was positively correlated with variation in the TACs for cod, whiting and plaice, but once again, not with the haddock TAC. These data suggest a possible conclusion that variation in TACs of cod, whiting, and plaice may have a regulatory effect on fishing effort by beam trawl, otter trawl directed at fish, and seine net. But the dangers of this correlative approach are well illustrated by the saithe and Nephrops data, and by the effort data by otter trawl directed at Nephrops. Variation in saithe TAC was significantly negatively correlated with effort by beam trawl, otter trawl directed at fish, and seine net, while variation in Nephrops TAC was significantly negatively correlated with the first two of these gears. TACs for both these species increased during the period of study, while over this time, effort generally by these three gears declined (Greenstreet et al 2007c). Thus these negative relationships were clearly spurious, and not in any way linked by cause and effect. Similarly, two negative correlations, with TACs for cod and whiting, were also noted with otter trawl directed at Nephrops. Again the explanation runs along similar lines. TACs for Nephrops increased between 1997 and 2004, perhaps helping to stimulate the observed increase in Nephrops trawl activity (Greenstreet et al 2007c), although the correlation presented here was not statistically significant. Again the increase in otter trawl activity directed at Nephrops coincided with declining TACs for these two gadoid species. No cause and effect linkage can be implied and these two negative correlations must also be considered to be spurious. But this begs the question – if these negative correlations are spurious, might the positive relationship not be spurious too? The two spatial analyses revealed high levels of correlation between effort and landings. Spatial variation in both variables was closely correlated for most species and gears in each year, but this
149
Relationships between TACs, Fish Landings and Fishing Effort in the North Sea
was not consistently the case and clear exceptions to this general rule were apparent. Annual variation between the two variables also tended to be positively correlated for most species and gears. Again there were clear exceptions for particular species and gears. The correlations tended to be strongest for the principal species targeted by any given gear, in the parts of the North Sea where particular gears were most heavily used (see Greenstreet et al 2007c) and with respect to each species, in those parts of the North Sea where their abundance was highest.
9. OVERALL CONCLUSIONS The purpose of this work package was to provide a predictive statistical model that would enable variation in the amount of fishing effort by different major fishing gear categories, and its distribution across the North Sea, to be predicted given a particular suite of single species TACs. Such a model would provide the fishing activity input data for the Disturbance Module of the original management protocol. This in turn would provide the input data for the community diversity module that would allow the species diversity consequences of the management proposals to be assessed. The results of the analyses presented here suggest that this sequence of events fails at the first stage – we do not believe that fishing effort levels and the distribution of fishing effort can be predicted simply on the basis of variation in TACs. Analysis of the five individual case studies showed that the fleets of the different countries had different priorities and that therefore their responses to changes in national quotas varied. The relationships between quotas and landings, between landings and effort, and between quotas and effort that were significant varied markedly between the individual case studies. Understanding the complexities that face the different components of the fleets of different countries would be a critical part of understanding how patterns of international fishing effort might change in response to changing TACs. Furthermore it seems evident from the analyses carried out here and by Greenstreet et al (2007c), that the suites of quotas granted the different fishing nations were not biologically compatible, given the natural species compositions in the different regions of the North Sea fished by each country, and the type of mixed fishery situation in which these fleets were operating. Thus rather than affecting effort levels, one of the most likely outcomes of relative changes in the TAC composition is to drive changes in discarding practices. Analysis of the international data provided by the five contributing MAFCONS countries provided some evidence that TAC restrictions for some species may have had a limiting effect on fishing effort, but the relationships were far from consistent. Marked reductions in the TACs of cod and whiting may have limited otter trawling directed at fish, while a plaice TAC reduction may have restricted beam trawling. However, even these results are indicative of a problem. For beam trawlers the principal target species is sole because the price premium is so much higher, yet sole TAC variation had no effect on beam trawl effort. Similarly, the Scottish otter trawl fleet has a large fraction of the TAC for haddock, cod and whiting, of which the largest TAC is for haddock. The haddock TAC has in relative terms altered rather little, yet haddock TACs and otter trawl effort appear relatively unrelated. Otter trawl effort appears to have declined in line with the reduction in the TACs for cod and whiting. Thus for one fleet (otter trawl) TAC variation in the scarcer species (cod and whiting) appears to have limited fishing effort, whilst for the other fleet (beam trawl) variation in the TAC of the more abundant species (plaice) appears to have influenced levels of fishing effort. Such inconsistencies are hard to reconcile, except for the distinct possibility that variation in TAC has done little to drive the observed changes in fishing effort. During this period fishing effort levels have been restricted directly by introduction of regulations that limit the number of permissible days fishing per month. This has directly resulted in an overall reduction in the amount of fishing effort by the two main gear categories operating in the North Sea;
150
Relationships between TACs, Fish Landings and Fishing Effort in the North Sea
beam trawl and otter trawl directed at fish. This direct reduction of fishing effort has occurred simultaneously with declining TACs for several of the major species, most notably for cod, whiting and plaice. Thus the possibility that the positive correlations between cod, whiting and plaice TACs and otter (fish) and beam trawl effort were in fact spurious is a strong one. It is not at all clear that TAC reductions alone would have brought about the observed changes in fishing effort. In mixed fishery situations, such as are prevalent in the North Sea, reducing TACs may simply alter fishermen’s behaviour, causing changes to discard patterns and affecting levels of illegal landings activity, rather that bringing about any reduction in fishing effort. Greenstreet et al 2007c explored spatial patterns in the distribution of fishing effort by the main gear categories. We showed that these were fairly constant over time during the period of this study, and that the patterns had changed little between this study and a previous study covering the early 1990s. This suggests that the spatial distribution of fishing effort is fairly predictable, at least at the larger North Sea scale. This is not surprising given that different fish species have distinct centers of distribution in the North Sea (Daan et al 1990; Greenstreet et al 2007d), and that otter trawls and beam trawls are specifically designed to target different species in different habitats. The results of the two spatial analyses carried out on each of our case studies and on the data for the five contributing MAFCONS countries combined also tend to confirm the premise that, once overall levels of fishing effort are set, spatial distributions may be relatively predictable, particularly when combined with simultaneous catch limitation management. The problem then remains in predicting overall effort levels. We contend that, if ecological and environmental objectives are to be successfully incorporated into fisheries management, levels of fishing effort will have to be controlled directly. The linkage between TACs and fishing effort has not been conclusively demonstrated in this study, and at best is relatively weak and inconsistent. Reliance on TACs alone is therefore unlikely to provide adequate control of fishing activity in the North Sea. Fishing activity must be controlled directly.
151

Relationships between TACs, Fish Landings and Fishing Effort in the North Sea
10. REFERENCES
Daan, N., Bromley, P. J., Hislop, J. R. G. & Nielsen, N. A. (1990) Ecology of North Sea fish. Netherlands Journal of Sea Research, 26, 343-386. Greenstreet, S. P. R., Spence, F. E. & McMillan, J. A. (1999) Fishing effects in northeast Atlantic shelf seas: patterns in fishing effort, diversity and community structure. V. Changes in structure of the North Sea groundfish assemblage between 1925 and 1996. Fisheries Research, 40, 153-183. Greenstreet, S. P. R., Spence, F. E., Shanks, A. M. & McMillan, J. A. (1999) Fishing effects in northeast Atlantic shelf seas: patterns in fishing effort, diversity and community structure. II. Trends in fishing effort in the North Sea by U.K. registered vessels landing in Scotland. Fisheries Research, 40, 107-124. Greenstreet, S. P. R., Shanks, A. M. & Buckett, B.-E. (2006) Trends in fishing activity in the North Sea by U.K. registered vessels landing in Scotland over the period 1960 to 1998. Fisheries Research Services Collaborative Reports, 02/06, 27pp. ICES (2005) Report of the ICES advisory committee on fishery management, advisory committee on the marine environment and advisory committee on ecosystems. ICES (2003) Report of the study group on multispecies assessments in the North Sea. ICES CM 2003, D:09, 1-95. ICES (2002) Report of the Working Group on the Assessment of Demersal Stocks in the North Sea and Skagerrak. ICES CM 2002, ACFM:01, 554pp. ICES (2004) Report of the Working Group on the Assessment of Demersal Stocks in the North Sea and Skagerrak. ICES CM 2004, ACFM:07, 1-555. ICES (2005) Report on the Assessment of the Demersal Stocks in the North Sea and Skagerrak, 7-16 September 2004, Bergen, Norway. ICES CM 2005, ACFM:07, 783pp.
152