reflections on assessing urban fiscal health
TRANSCRIPT

1
Reflections on Measuring Urban Fiscal Health
Richard M. Bird
Institute for Municipal Finance and Governance
University of Toronto
February 2014
Summary
This paper considers several distinct but related aspects of what we are doing when we attempt to
measure and evaluate the fiscal health of cities: How is the fiscal health of cities defined in the
literature? How is this concept related to fiscal sustainability? How may fiscal health be measured in
practice? And to what extent may fiscal health indicators be interpreted as representing local fiscal
effort or performance?
Key words: fiscal health, fiscal sustainability, local finance, cities
JEL codes: H70, R51
2
Reflections on Measuring Urban Fiscal Health1
Richard M. Bird Institute for Municipal Finance and Governance
University of Toronto Revised; February 2014
In Canada, as in the world more generally, governments, organizations, and researchers have been
increasingly attempting to measure urban fiscal health in a number of ways and for a variety of
purposes. In this paper I consider several distinct but related aspects of what we are doing when we
attempt to measure and evaluate the fiscal health of cities: How is the fiscal health of cities defined in
the literature? How is this concept related to fiscal sustainability? How may fiscal health be measured in
practice? And to what extent may fiscal health indicators be interpreted as representing local effort or
the performance of particular local governments? After reviewing briefly some recent literature on local
fiscal health, I focus on three questions: Why is the fiscal health or fiscal sustainability of cities of
interest? How can urban fiscal health be measured? And, finally, what can we learn from such
exercises?
Defining Fiscal Health
Much of the current interest in measuring urban fiscal health arises from concern with urban fiscal
stress. The recent financial and economic crises in many countries have given rise to urban finance
problems that have become an increasing focus of attention even at the international level. Recently,
for example, the World Bank has issued documents with titles such as “The Great Recession and the
Future of Cities” (Dethier and Merrill 2012) and “Until Debt do Us Part” (Canuto and Liu 2013) and the
OECD has put out a publication on sub-national finances with the evocative sub-title of “Walking on Thin
Ice” (Vermalle and Hulbert 2013). For especially gloomy views of fiscal health and fiscal sustainability –
appraisals of, respectively, the current state of government finance and its long-run prospects2 -- the
‘go-to’ international organization has long been the International Monetary Fund, so it is not surprising
1 This version of the paper has benefited from comments by from Lars-Erik Borge, Howard Chernick, Kyle
Hanniman, and other participants at the Conference on Measuring Urban Fiscal Health (Toronto, May 2013) at which it was first presented. 2 Presumably any useful indicator of fiscal health should be forward-looking in some sense. As discussed briefly
later, fiscal sustainability is sometimes used narrowly as a synonym for ‘debt sustainability’. However, both these terms are used here a bit more loosely.

3
that the IMF has also in recent years been paying increasing attention to such problems at the sub-
national level.3 All in all, the fiscal news for cities has seldom been good in recent years.
As times have become harder, the fiscal performance, solvency and sustainability of cities and other
local governments have been attracting more attention in many countries around the world, developed
and developing alike.4 Interest in this subject in the United States, which pioneered in many respects in
the analysis of local fiscal health, has also been stimulated by recent events, producing both interesting
empirical analyses of such questions as “The Impact of the Great Recession and the Housing Crisis on the
Financing of America’s Largest Cities” 5 and the first book-length treatment of the conceptual and
measurement issues of local fiscal health (Levine, Justice and Scorsone 2013) for decades. Although the
Canadian literature is, as usual, much thinner on the ground than that south of the border, a number of
studies of urban fiscal health viewed from different perspectives have also been produced in Canada in
recent years.6
In particular, concern has recently been expressed about the fiscal health of Toronto and other large
Canadian cities. At first glance, such concern seems a bit puzzling because most of the available
evidence suggests that Canadian municipalities as a whole are fiscally healthy. In Ontario, for example,
no cities have run deficits in their operating budgets, which is not surprising since they are not allowed
to do so. In addition, however, no city has borrowed excessively to pay for capital expenditures, none
has raised property taxes significantly, and none has run up large tax arrears. At the same time, all cities
have become less reliant on provincial grants—though this was not necessarily a result of their choosing.
Perhaps the real cause for concern is that the prudence evident in most municipal fiscal accounts may
have been achieved in part at the expense of the overall health of cities. The fundamental fiscal health
of a city has less to do with balancing its budget than with the quantity and quality of services provided
and the state of municipal infrastructure. In the Greater Toronto Area (GTA), for example, there is
evidence of continuing and perhaps even increased problems in terms of poverty and homelessness as
well as increasing awareness that investment in the infrastructure needed to support continued
3 See, for instance, IMF (2011), Baldacci et al. (2011), Schaechter (2012), Baunsgaard et al. (2012), and Tanner
(2013); see also World Bank (2012). 4 For some examples, see Padovani, Rossi, and Orelli (2010) and Rossi (2011) on Italy, Vigari (2010) on Hungary,
Drezgic, Klimovsky and Pinteric (2011) on Slovakia, Slovenia and Croatia, Bandyopadhyay and Rao (2009) on India, and Schoeman (2011) on South Africa. 5Chernick, Langley and Reschovsky (2011); see also Ebel, Peterson and Va (2013).
6 See, for example, Kitchen (2000), Vander Ploeg (2001), Bird and Slack (2004), Conference Board (2005), Halifax
(2009), Auditor General of Nova Scotia (2010), Wolters (2011), and, from a somewhat different perspective, Dachis and Robson (2011, 2014).

4
economic growth --transit, roads, water, and sewers, for example -- falls short of what seems to be
required.7
For many reasons, much has been said recently in many countries about urban fiscal stress, fiscal health
and fiscal sustainability. In fact, however, there is no uniquely correct concept of the financial condition
of local governments and hence no one way to measure fiscal health. Indeed, as a useful recent survey
notes, “…financial condition is less a state of being than a dynamic and fluid process (Jacob and Hendrick
2013, p. 35).” The point is illustrated in Table 1, which distinguishes four concepts, all of which are
sometimes labeled “solvency” although it seems more useful to think of them as different ways of
characterizing the ability of local governments to achieve (to some extent over different time periods)
balance between what they want to do (or are required to do) and what they are able to do.8
Table 1
Assessing the Financial Condition of Local Governments
Solvency Concept
Definition Objective Determinants
Cash Cash flow solvency Pay the bills Fiscal shocks Fiscal slack (unused capacity)
Budgetary Balance in fiscal year Meet financial Obligations
Extent and nature of risk Extent of fiscal slack
Service level
Balance between near-term obligations, actual spending, and revenues collected
Provide adequate services to meet ‘needs’ (or requirements)
Legal mandates Political constraints Vulnerability to shocks
Long-run
Balance in long run between available revenues and spending needs
Meet all obligations both financial and in terms of service level
Economic conditions Institutional constraints Long-term liabilities, assets Risk, uncertainty
7 See, for example, Metroland (2014) on infrastructure and Poverty Watch (2008) and James (2012) on poverty.
8Table 1 is based largely on Jacob and Hendrick (2013) and Justice and Scorsone (2013). These concepts may be
traced back at least to Groves, Godsey and Shulman (1981).

5
Perhaps the most common single measure used to assess the fiscal health of a government is the size of
its net operating surplus – current revenues less current expenditures. More precisely, the preferred
measure is usually the so-called ‘primary surplus’ – a measure that ignores not only annual capital
expenditures (investment) and capital revenues (borrowing less debt repayment) but also interest
payments (current debt service). The reason is because it is this measure that most clearly indicates
that a government is capable of covering its debt and is thus operating within what economist call its
‘intertemporal budgetary constraint’ (Tanner 2013). Leaving aside issues that may arise from the kind of
incomplete accrual accounting common in most municipal systems, such a measure is certainly
conceptually useful, at least when cities are allowed to run current surpluses or deficits (which in
general is not the case in Canada).9 However, the primary surplus standard is far from perfect, for
example, because it tends to understate capital costs by ignoring the differences between economic
depreciation and debt service and can be manipulated to understate costs further by reducing outlays
for maintenance. Moreover, even if capital costs are perfectly measured, judging the ‘fiscal health’ of
cities against this standard rests on a number of inherently implausible assumptions: for example, the
present urban capital stock as well as the level of services currently provided and the current revenue
system are all optimal. In reality, since neither the primary surplus nor any other single measure of fiscal
health encompasses all the dimensions mentioned in Table 1, perhaps the main conclusion that emerges
to this point is that separate measures are likely needed for each key dimension.
Such measures may be obtained in a number of ways. One way is to analyze trends in various indicators
in order to compare present (or expected future) performance with past experience. (Nollenberger,
Groves and Valente 2003) An alternative approach, more popular with economists, is to make
comparisons within certain groups by establishing the average performance of some relevant
comparator group, for example by regression analysis (Ladd and Yinger 1989) or, less commonly, by a
‘representative’ approach (ACIR 1988), as the relevant norm or standard against which to assess the
performance of any particular government. Or performance may be evaluated through a broader
‘benchmarking’ exercise (Sohl et al. 2009). In practice, benchmarking often combines elements of the
two approaches just mentioned as well as some external reference norm.10 Sometimes, although one
9 Dachis and Robson (2011, 2014) argue strongly for fuller, consistent, and comprehensive municipal accrual
accounting. However, as MFOA (2011, 2014) argues in response, although substantial movement in this direction is certainly desirable (and has already been mandated in Ontario) it is not clear that all municipal financial budgets and accounts can or should meet this demand. 10
An example is the Indian study cited earlier, which employs normative service standards derived from an earlier study as a standard for assessing city performance (Bandyopadhyay and Rao 2009).

6
should be properly skeptical both about how meaningful any linear combination of such indicators is
likely to be (Jacob and Hendrick 2013) and also about the arbitrariness of most such exercises (Slack,
Tassonyi and Grad, this volume), different measures for different dimensions are grouped, scaled, and
aggregated in some way or other to obtain a more comprehensive ‘index’ of financial condition.
A recent survey of the extensive U.S. literature concludes that because local fiscal health is
“multidimensional, often context specific, and its causal factors operate in nonlinear ways” it is better
“to embrace this complexity as opposed to trying to simplify it into a few core components” (Jacob and
Hendrick 2013, p. 36). Nonetheless, a companion paper in the same volume suggests some guidelines
with respect to measuring the “complex, normative …and … to some degree audience specific” concept
of fiscal health, noting that, as already suggested, although no one measure will serve all needs, some
approaches are clearly better than others for certain purposes (Justice and Scorsone 2013, p. 43).
Useful indices may, for example, readily be constructed from available financial data to assess the
simpler concepts of cash and budgetary solvency set out in Table 1. However, the other two concepts in
Table 1 – those related to service levels and the long run – are more difficult to summarize and evaluate
in any simple way “…given the very large array of environmental and organizational uncertainties and
contingencies that can influence governments’ fiscal health and adaptation over time” (Justice and
Scorsone 2013, p. 67). In other words, although financial indicators may provide useful signals with
respect to actual or potential ‘health’ concerns for certain cities, no system of indicators can replace
detailed analysis of specific cases when it comes to longer-term concerns about fiscal sustainability.
A somewhat different approach to measuring financial performance was suggested some years ago in
Canada by the Public Sector Accounting Board (2007), as summarized in Table 2.11 The framework
suggested is broadly complementary to that in Table 1 in attempting to establish measures of a city’s
financial condition that will not only assess how well it is doing but also provide a basis for considering
how its policy and operational decisions might be affected by its financial health, and vice versa. In
11
The Public Sector Accounting Board was a board of the Canadian Institute of Chartered Accountants (CICA), which has recently been replaced by the CPA Canada (http://cpacanada.ca/). The indicators set out in PSAB (2007) are not mandatory for local or other governments but have been used in such official reports as that of the Auditor General of Nova Scotia (2010) and are currently embodied in the CICA Public Sector Accounting Handbook, available at http://www.castore.ca/product/cica-public-sector-accounting-handbook/10 . PSAB (2012), although focusing on federal and provincial governments, presents an interesting recent perspective on how the asset-liability approach adopted by the PSAB compares to the revenue-expense approach preferred by the equivalent U.S. standard-setter for state and local government accounting, the Government Standards Accounting Board (GASB), as well as to a possible new ‘hybrid’ approach set out in PSAB (2012). Many of the complex issues involved in public sector accounting are far from resolved. Moreover, not all governments necessarily follow all the recommendations of such bodies.

7
addition to suggesting some specific indicators related to levels of taxation, indebtedness and transfers
and stressing such concerns as the reliability, robustness and coverage of the accounts the PSAB (2007)
approach summarized in Table 2 is useful because it focuses not so much on ‘solvency’ concepts as such
but rather on three different but interrelated characteristics of the fiscal condition of governments --
sustainability, flexibility and vulnerability.
Table 2
The PSAB Approach
Concept Definition Possible Indicators
Sustainability
Ability to maintain existing programs and services and meet financial obligations without increasing debt or taxes.
Ratio of outstanding debt to annual revenue Ratio of financial assets to liabilities.
Flexibility Ability to increase debt or taxes Ratio of debt service cost to revenues Ratio of debt to assessment Ratio of own-source revenues to assessment Effective tax rate
Vulnerability Risks (transfers, external shocks) Ratio of transfers to total revenues Proportion of population on general welfare
Sustainability focuses on the degree to which a government is able to maintain its existing programs and
services and to meet its current financial obligations without increasing its debt or raising taxes. This
concept in a sense falls between the ‘budgetary’ and ‘service-level’ concepts in Table 1, depending on
the extent to which existing service levels are considered adequate. Continual operating deficits -- or, in
the more refined approach mentioned earlier, primary deficits may, like an upswing in the share of debt
charges in current revenues, suggest an unsustainable fiscal condition. For local governments in Canada,
which must balance their operating accounts and for which measures equivalent to GDP are not
available, perhaps the best available measure along these lines may be the ratio of outstanding debt to
annual revenue, which provides an indication of the extent to which future revenue is encumbered by
the need to finance past spending. On the other hand, a low debt ratio may perhaps signal not so much
good municipal behaviour in the sense of not borrowing excessively as the simple fact that, perhaps for
very good reasons, no one is willing to lend to this municipality. A related measure, if data are available
and comparable, might be the ratio of financial assets to liabilities which, if less than one, indicates the
extent to which future revenues are going to have to pay for past events.

8
In contrast, flexibility (which is sometimes characterized as simply revenue capacity) measures the
degree to which a government can increase its debt or taxes in response to changing conditions. This
concept in a sense combines the long-run and service-level concepts in Table 1. From another
perspective, it focuses on one aspect of what Jacob and Hendrick (2013) call ‘fiscal slack,’ a more general
term that also takes into account not only the extent to which revenues may be increased but also the
extent to which spending commitments (e.g. wages, pensions, infrastructure costs) may be reduced. As
Hanniman (this volume) discusses, credit rating agencies similarly focus on ‘modifiable’ budgetary items:
for example, investment spending is easier to postpone than wages. Given the difficulty of obtaining
easily quantifiable measures of the extent of ‘give’ on the expenditure side, however, the indicators
listed in Table 2 relate solely to the revenue side.
The choice of whether to borrow or to increase local taxation depends on such institutional constraints
as borrowing or tax rate limits as well as the inherent constraint of local economic circumstances that
determine the capacity of the tax base. The ratio of debt service cost to revenues shows the extent to
which past borrowing decisions may constrain a government’s ability to meet its current commitments.
For local governments in Canada with relatively limited access to own source revenue, the relative
impact of financing a given type of expenditure may perhaps be better measured relative to own-source
revenues rather than current expenditures in order to exclude the impact of transfer payments.
Flexibility in this sense is captured by the debt to assessment ratio: a rise in this ratio implies impairment
of municipal fiscal capacity either because the tax base has decreased or the demand for expenditure to
service debt has increased. Given the overwhelming predominance of property taxation as the local
source of revenue in Canada, perhaps the most frequently used measure of revenue capacity is the ratio
of own source revenues to taxable assessment. If taxes are used as a measure of own source revenue,
this measure reduces to the effective tax rate.12 Neither wealth nor household income data are readily
available at the local level so taxable assessment may be viewed as a rough proxy measure of wealth
and therefore ability to pay, but this argument is less important than the fact that assessment is the
principal (often the only) local tax base.
Another indicator suggested by PSAB (2007) is the net book value of tangible capital assets to the cost of
such assets. While this information is often not available, even a crude measure along these lines would
be useful as an indicator of the extent to which maintenance costs and asset replacement have been
12
Given the divergence between the treatment of residential and non-residential property tax in Ontario (Bird, Slack and Tassonyi 2012), both of the indicators just mentioned should probably be weighted appropriately to reflect the composition of the local tax base.

9
deferred.13 Since one frequently-cited recent report put the municipal “infrastructure gap” in Ontario at
over $100 billion this is not a minor matter.14
Finally, a city’s vulnerability may be a function of either transfer dependency or the risks created by
exogenous shocks that impact on its tax base. This concept is thus roughly equivalent to the risks or
shocks mentioned in Table 1. Dependency is usually measured by the ratio of transfers to total
revenues.15 Sometimes, in the absence of good data on all transfers some other measure such as the
proportion of the population receiving general welfare assistance may be used either as a proxy of
transfer dependence or as an indicator of an area’s potential vulnerability to shocks.
Summing up, the approaches to assessing the fiscal health of local governments depicted in Tables 1 and
2 attempt to capture aspects of the extent to which cities may face ‘fiscal stress’ in terms of the balance
(or imbalance) between the risks and uncertainties that they face and their institutional, economic, and
political ability or resiliency to cope with such shocks over different time perspectives. All the measures
mentioned in Table 2 are usually interpreted as being positively associated with ‘ill health’ so that the
higher the figure, the worse off the city. Specific indicators that may provide a quantitative indication of
the scope of potential problems are suggested.16 Different measures may be relevant in different
contexts and for different purposes. Inevitably, however, the manner in which changes in such
measures are interpreted will depend on the agenda of whoever is doing the interpretation as well as on
the specific context (and time frame) within which it is being done.
As Anderson (2012, p. 1008) recently noted with respect to state tax rankings in the U.S.: “every index
has an implicit policy agenda and the wise policy maker will understand that agenda when attempting to
rely on the state ranking generated by that index.” Equally, the wise analyst will also understand that
every policy maker will read whatever numbers are generated from any analysis in light of his or her
own policy agenda. For example, the relation between the level of services and taxation is perhaps the
most important political choice facing a municipality. One city may choose high service levels and high
13
Data on the net book value of tangible capital assets are now available in Ontario for the last few years, however (Slack, Tassonyi and Grad, this volume). 14
This important issue is not further discussed here: for a recent review of an important segment of municipal infrastructure, see Canadian Infrastructure Report (2012); the figure cited in the text comes from http://www.metroland.com/page/Infrastructure. 15
However, as Hanniman (this volume) suggests, questions may be raised about the common assumption that greater transfer dependency is a symptom of greater vulnerability. 16
As Table 3 below shows, many other variables may also serve as possible measures (or proxies) for the potential revenue capacity of property taxes in different local jurisdictions.

10
taxes and another may choose low taxes and low service levels, but both may be equally fiscally healthy
from their own perspective. On the other hand, a higher level of government, viewing measures of
urban fiscal health with its own objective in mind -- whether that objective is to maximize social welfare
or, more likely, to meet some less formal goal such as reducing local demands for provincial funds or,
alternatively, lowering local taxes on voters – may reach a different conclusion. Cities may measure
their fiscal health to see how they are doing in terms of their objectives; but others may be interested in
such measures mainly to reinforce the case for more disciplined and credible local policies that will
achieve their own objectives.
The local fiscal system in the United States – like that in Canada (Tassonyi 2011) -- was largely created in
the 1930s in response to the Great Depression. In a recent review, Ebel, Peterson and Ha (2013) suggest
that the question now facing American local governments is whether the Great Recession that began in
2007 will similarly result in the establishment of an urban fiscal structure with the capacity to respond
adequately to the risks it seems likely to face in the future. As a result of the recession cities in the
United States have faced increasing fiscal problems as result of declining growth rates and even sharper
declines in both their own revenues and often also in transfers, although the latter effect was – as in
Canada -- offset to some extent by federal stimulus funding. These risks were largely beyond the control
of cities, and even the extent and manner in which different cities responded to these problems was
also to some extent beyond their control given institutional constraints on their ability to alter revenues
and expenditures as well as to borrow. How and how well cities responded also reflected their
institutional and organizational capacity to mobilize support from other governments and especially
from their residents to enable them to do what has to be done. The common response of cutting capital
expenditures relatively heavily, for example, may be both politically easier and more acceptable to
lenders than restructuring current services. But this response is also likely to increase infrastructure
maintenance and replacement costs and hence exacerbate future fiscal pressures.
The fiscal stress placed on Canadian cities by the recent crisis has been considerably less than in the
United States.17 Still, it is clear that cities in both countries not only need to build up their capacity to
deal with fiscal shocks but also to establish a stronger fiscal and institutional base to cope with the
longer-term problems demographic and economic problems that seem likely in the years to come.
Improving understanding of the current fiscal health of cities and, more importantly, of how and to what
17
As this volume shows, however, different cities even in the same province have been affected, and have responded, in different ways.

11
extent their present fiscal structure is likely to prove sustainable in the face of future pressures and
shocks is an essential step in this direction. Ebel, Petersen and Ha (2013) in the U.S., like Dollery (2009)
in a wide-ranging review of studies of local government finance around the world, suggest that one key
missing ingredient needed to sustain urban fiscal health in most contexts is that few higher-level
governments have decentralized revenue-raising powers sufficiently to permit – even force – cities to do
the best they can to solve their own problems.18
Fiscal Health and Fiscal Sustainability
Fiscal health and fiscal sustainability sound like good things, and policymakers or analysts often suggest
policies intended to achieve them. The search for fiscal indicators to provide a shorthand, and
preferably quantitative, picture of the size, direction, and nature of the health or sustainability problem
as well as guidance in designing policy to improve outcomes seems never-ending. One reason is because
fiscal health and fiscal sustainability are terms more of art than science, with the meanings attached to
them depending largely on the interests and objectives of those doing the defining. However these
concepts are defined, how they are measured also depends largely on the information available. Both
concepts are usually assessed in terms of financial performance criteria like those mentioned in Table 2.
But they may also be assessed in terms of such structural factors as laws and institutions. Or both
structural and performance factors may be considered. Some factors taken into account may be
quantifiable, others may be descriptive, and still others may reflect subjective judgment. No matter how
‘scientifically’ any or all of these concepts are measured and assessed, however, in the end how the
information is used in policy analysis inevitably depends largely on political judgments at both the local
and higher levels of government.
Cities are often said to be in crisis because their fiscal ‘needs,’ which are usually assumed to
be driven largely by demographic factors, exceed their revenue ‘prospects’ – a concept that in the
Canadian context essentially reduces to the potential yield of the real property tax (Vander Ploeg 2001).
An obvious, if narrow, interpretation of fiscal sustainability at the local level is similar: a city might be
considered to be fiscally sustainable over time if it covers its expenditures out of its own revenues --
18
Bird and Slack (2007) reach a similar conclusion with respect to financing metropolitan areas around the world as do Bird and Slack (2006) with respect to Canadian cities. There are also, of course, well known theoretical arguments for increasing local fiscal accountability by increasing local fiscal authority (e.g. Weingast 2006) as well as some empirical evidence tending to support this proposition (e.g. Borge, Brueckner and Rattso 2013).

12
reducing, for example, its dependence on transfers. An even narrower approach might focus simply on
the extent to which current spending is covered out of current revenue, leaving any capital funding
needed for infrastructure investment to higher levels of government. More broadly, as Kitchen (2000)
notes, fiscal sustainability at the local level is affected by a variety of factors:
The cyclical sensitivity of municipal funding responsibilities: do expenditure programs vary with
changing economic growth rates? How sensitive are local expenditures to changes in the
relative numbers of seniors and children or to changes in the level of poverty or homelessness?
The capacity of the local revenue base to keep pace with expenditures: are revenues sufficiently
elastic to rise and fall with expenditure requirements?
The ability of municipalities to control their own destiny: do municipalities have sufficient
control over their expenditure responsibilities and revenue sources to meet changing
circumstances? Can they make more use of user fees? Are they allowed to raise tax rates? To
borrow?
In Canada, municipal freedom to change either revenues or expenditures is generally severely
constrained by provincial regulations, many of which date back to the 1930s when some municipalities
went bankrupt and had to be bailed out by the provinces (Tassonyi 2011).
Sustainability has three distinct quantifiable aspects: the level of revenues, the level of expenditures,
and the difference between the two (the deficit or surplus), with the main relevant indicator of
performance usually considered to be the last of these, which reflects the behavior of the two primary
determinants. A more explicitly forward-looking approach is to compare expected future current
revenues to the anticipated costs of meeting existing financial obligations and sustaining services at
existing levels.19 The extensive credit rating literature, which has its own definitions and history
(Petersen and Ciccarone 2012), focuses more narrowly on assessing the likelihood that local
governments will be able to meet their financial obligations, using both trend analysis and, in recent
years, computer-based empirical models.
One way in which the fiscal sustainability of municipalities is often assessed is by reference to some set
of fiscal indicators. Bond-rating agencies use such indicators as the level and trend of expenditures and
revenues, the extent of borrowing, dependence on provincial grants, and tax arrears as part of the
19
For instance, Bird and Slack (2004) employ a variant of this approach when they use the ‘business-as-usual’ base case as a standard of comparison in exploring various fiscal possibilities for the GTA.

13
process by which they attempt to assess the fiscal health of a municipality for the purpose of assigning
them a bond rating.20 Credit ratings do not attempt to assess urban fiscal health but rather the
likelihood that local debts will be paid on time and in full. Creditworthiness in this sense may be an
important factor in fiscal health especially when municipal investment is financed through credit
markets, and the simple quantitative indicators noted above are in any case helpful in providing some
indication of the current and historical financial situation of municipalities. However, they do not
necessarily give a reliable indication of fiscal sustainability in the future, and they say even less about the
overall health of a city. Even if one focuses only on the question of whether current revenues are likely
to exceed current revenues sufficiently to be able to service loans obtained from financial markets, the
key concern of most financial analysis of local finance is the likelihood of a bailout in case of difficulties.
The prospect of a bailout, however, rests less on the value of particular ratios than on the structure and
nature of intergovernmental fiscal relations and the political and other factors underlying those
relations.
Defining fiscal sustainability is complex partly because neither side of the expenditure-revenue relation
has a clear fixed meaning: at what level, over what period, and how comprehensively is the comparison
being made? Big cities are not identical to small rural municipalities and there may be considerable
variation in their degree of transfer-dependence. Moreover, municipalities of all sizes (and all levels of
transfer dependence) may behave well or badly, depending on such hard-to-assess factors as how
strongly their residents value such features as the equal provision of local services and fiscal probity. In
the end what happens often is determined by what may be called ‘budgetary culture.’ Fiscal puritans
may consider austerity and discipline in response to fiscal difficulties to be not only an obvious way back
to balance but also good for the soul. However, few residents in afflicted areas are likely to agree. As a
European politician once remarked "we all know what to do, but we don’t know how to get re-elected
once we have done it."21
Measuring Urban Fiscal Health
20
For further discussion of municipal credit rating and fiscal health, see Merk and Hulbert (this volume) and Hanniman (this volume). 21
Jean-Claude Juncker, Prime Minister of Luxembourg, as quoted in The Economist (March 15, 2007) and cited in Buti et al. (2008, p. 2).

14
National fiscal problems are often first felt at the subnational level when local roads deteriorate, fees for
local services rise, and ‘frills’ such as art and athletics are squeezed from school calendars. City mayors
and councils are not the only ones who worry about city budgets. In many countries the recent
economic crisis has led to new concern about the ability of the present financial structure of urban areas
to sustain the costs of maintaining their present levels of infrastructure and public service provision let
alone the greater expenditure burdens that many – perhaps especially the larger metropolitan regions –
seem likely to face in the near future. As mentioned earlier, both national governments and
international organizations like the OECD have become increasingly concerned with the level and
sustainability of city “fiscal health” as cities have increasingly come to be seen as central driving forces
behind national competitiveness and growth.
The increased attention to urban fiscal indicators is part of a more general trend toward formally
benchmarking how well public sector institutions do by measuring how key performance indicators
change. Benchmarking, a concept which emerged from management literature, is essentially a
systematic process for identifying and measuring ‘performance gaps’ between the efficiency and
effectiveness with which an entity such as a city employs inputs to deliver outputs and affect outcomes,
as compared either to other cities or to some hypothetical ‘ideal’ performance. One argument for this
approach is that by measuring performance and identifying such gaps one can begin to understand why
gaps exist and perhaps also how they may be reduced. Even incomplete and partial benchmarking may
often be useful in achieving such important (though usually implicit) objectives as encouraging cities
(and those concerned with their fiscal performance such as higher-level governments) to collect and
analyze data that they need in order to know what they are doing and how well they are doing it.
Current performance may be benchmarked against past performance or a standard based on the
performance of a comparable group, or a purely normative reference standard. Such measures may
provide a useful starting point both for assessing the relative efficiency and effectiveness of local
government operations and in considering the desirability and effects of possible changes in
expenditure assignments, revenue-raising powers and intergovernmental transfers. They may also, of
course, be used as a means of actually allocating such transfers.22
As already suggested, however, even with the simplest approach to benchmarking, two distinct
dimensions need to be considered: the static dimension -- the relation of levels -- and the dynamic
22
For two examples in Ontario, see Ontario (2008) and Ontario (2013), as discussed further in Slack, Tassonyi and Grad (this volume).

15
dimension -- the relation of growth rates.23 Suppose, for example, that the elasticity of public
expenditures is unity, so that a one percent increase in GDP is accompanied by a one percent increase in
expenditures. If the budget were initially in deficit, fiscal sustainability would then require an elasticity
of revenues that is greater than unity. But if revenues depend upon a tax like the property tax, whose
elasticity is unlikely to exceed unity over any prolonged period of time, the only way to remove the
initial deficit and achieve sustainability in even the narrowest sense may seem to be by reducing the size
of the local public sector or by expanding the revenues available to local governments, whether by
raising existing taxes and fees or by securing increased revenue-raising powers or, more likely, increased
transfers from other levels of government.
Another way to approach the measurement issue is by focusing on the extent to which a particular
performance criterion, such as a given deficit target, is achieved. Some of the factors taken into account
in such an analysis may be quantifiable, others may be descriptive, and still others may inevitably reflect
subjective judgment to an appreciable extent. A variant common in the literature on public debt is to
compare the actual deficit with the estimated sustainable deficit that would maintain a constant debt-
to-gross domestic product ratio (within a range of potential rates of growth, real interest, and inflation).
How such quantitative results are interpreted, however, depends to a significant extent on assumptions
and judgments that are inherently arguable. Indeed, it is difficult to read much of the literature on
assessing creditworthiness (sustainability) without concluding that (more or less) informed judgment
often appears to outweigh simple numerical measures when it comes to assessing the borrowing
potential of cities.
Perhaps, however, this is the right way to do it. Focusing on simple, quantifiable budgetary measures is
an appealing approach to assessing fiscal health and sustainability, but it is unlikely to prove fully
satisfactory, for several reasons. First, the numbers available are unlikely to be either the right ones or
the best ones: they may not be comprehensive or they may not be comparable, over time or across
jurisdictions. Such problems are serious with respect to national data despite many efforts over the last
50 years to resolve them.24 They are even more serious with respect to local finance data, which are
23
This is a very simplified example: for a formal analysis of assessing debt sustainability, see Tanner (2013). 24
See, for example, the illuminating discussion of the basic accounting problems involved in assembling comparable national public finance data in Irwin (2012).

16
often not easily comparable within countries, let alone between them.25 Moreover, numbers can never
tell the whole story – and sometimes do not tell the correct story – because they may reflect largely
fortuitous external events and because similar changes in outcome measures may mean very different
things for cities in different circumstances in countries with different institutions.
For example, differences in levels of income and wealth are obviously relevant in assessing fiscal
performance. It takes more effort for a poor city to increase revenues by a given percentage than it does
for a rich one. On the other hand, increasing the rate of revenue growth rate may be easier for a city
with below average growth performance than for one with above average performance. Another
illustration relates to investor perceptions. With respect to investment, as in politics, perception is often
reality. If investors see investment in a city as risky – for instance, because of increased crime or cuts in
fiscal transfers -- the city will receive less investment than it otherwise would and will pay more for what
it gets, and its measured fiscal performance will reflect these realities.
The policy choices cities make and the effects of those choices thus depend to a considerable extent
upon where they start -- their initial conditions. A growing city with a broad tax base and few unfunded
mandates is in a very different position that one that has little access to revenue bases and is hampered
by extensive directive interference from above. In principle, a broad range of such contextual or
environmental factors should be taken into account in assessing the efforts made and the success
achieved by local governments. Both "effort" and "success" are inherently relative concepts in the sense
that both must be assessed in light of the scope and scale of the problems facing the government in
question. As an illustration, Table 3 lists some of the factors taken into account in a recent attempt to
assess the revenue performance of the municipalities in the Greater Toronto Area (GTA). Different sets
of indicators at different levels of detail may be appropriate for different localities depending upon such
factors as their size, their governmental structure, the scope for independent action that they possess,
and their level of institutional development.
25
See, for example, the recent attempts to assemble comparable data for large metropolitan cities in a number of federal countries reported in Slack and Chattopadhyay (2013) as well as the approach taken by Cherniak and Reschovsky (2011a) in comparing large U.S. cities.
17
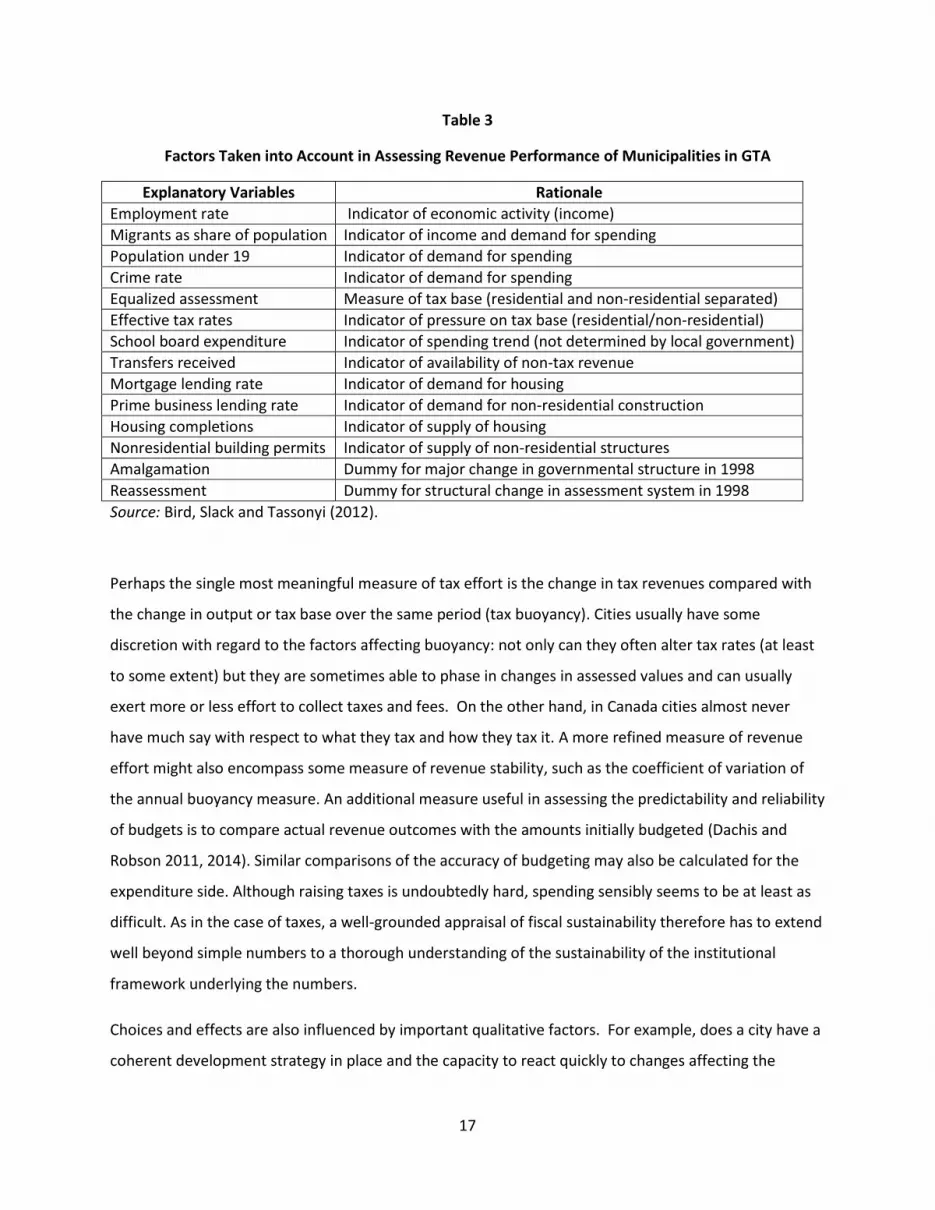
Table 3
Factors Taken into Account in Assessing Revenue Performance of Municipalities in GTA
Explanatory Variables Rationale
Employment rate Indicator of economic activity (income)
Migrants as share of population Indicator of income and demand for spending
Population under 19 Indicator of demand for spending
Crime rate Indicator of demand for spending
Equalized assessment Measure of tax base (residential and non-residential separated)
Effective tax rates Indicator of pressure on tax base (residential/non-residential)
School board expenditure Indicator of spending trend (not determined by local government)
Transfers received Indicator of availability of non-tax revenue
Mortgage lending rate Indicator of demand for housing
Prime business lending rate Indicator of demand for non-residential construction
Housing completions Indicator of supply of housing
Nonresidential building permits Indicator of supply of non-residential structures
Amalgamation Dummy for major change in governmental structure in 1998
Reassessment Dummy for structural change in assessment system in 1998
Source: Bird, Slack and Tassonyi (2012).
Perhaps the single most meaningful measure of tax effort is the change in tax revenues compared with
the change in output or tax base over the same period (tax buoyancy). Cities usually have some
discretion with regard to the factors affecting buoyancy: not only can they often alter tax rates (at least
to some extent) but they are sometimes able to phase in changes in assessed values and can usually
exert more or less effort to collect taxes and fees. On the other hand, in Canada cities almost never
have much say with respect to what they tax and how they tax it. A more refined measure of revenue
effort might also encompass some measure of revenue stability, such as the coefficient of variation of
the annual buoyancy measure. An additional measure useful in assessing the predictability and reliability
of budgets is to compare actual revenue outcomes with the amounts initially budgeted (Dachis and
Robson 2011, 2014). Similar comparisons of the accuracy of budgeting may also be calculated for the
expenditure side. Although raising taxes is undoubtedly hard, spending sensibly seems to be at least as
difficult. As in the case of taxes, a well-grounded appraisal of fiscal sustainability therefore has to extend
well beyond simple numbers to a thorough understanding of the sustainability of the institutional
framework underlying the numbers.
Choices and effects are also influenced by important qualitative factors. For example, does a city have a
coherent development strategy in place and the capacity to react quickly to changes affecting the

18
implementation of that strategy? Different strategies may make sense for different cities. However,
without a clear plan and adequate adaptive capacity attempts to alter policies to cope with changing
conditions are unlikely to prove either coherent or successful. Although how well a city is ‘structured’ in
this sense can often be assessed only after the fact in terms of what is done -- or not done – one piece of
important evidence (especially, of course, in larger cities) may be the existence (or creation) of an
identifiable segment of governmental structure concerned with such problems. For example, does the
city have in place good public financial management policies and the capacity to implement them?
Table 4 illustrates a recent approach to assessing municipal financial performance that focuses on such
questions.
Table 4
Assessing Municipal Fiscal Management: An Example
Feature Rationale
Budget and financial reports on same basis Accrual accounting is better. Financial reports are now on accrual basis but most budgets are still on cash basis26
Combined operating and capital budget Better because separate budgets neglect interactions between capital and operating
Same level of aggregation in budget and reports If not, difficult to reconcile
Multi-year operating budgets Enables intertemporal comparisons
Comprehensiveness and consistency of budgets Includes all municipal expenditures on same base and not some on net (of dedicated revenues) basis and others on gross basis
Departmental gross expenses reported clearly Related to previous point
Budget bias Sign of average annual deviance between actual and forecast results
Budget accuracy Size of average deviation Note: Institutional practices (first 6 items) scored from A (meets all 6 criteria) to F (meets none of them). Source: Dachin and Robson (2011)
Like Table 3, Table 4 is not intended to imply that the items listed are necessarily the best or most
important factors that should be taken into account. Indeed, in the case of the study on which Table 4 is
based, some of those thus rated took exception to the “arbitrary and narrow criteria” employed, to
26
Unfortunately, although accrual accounting has been required for municipal financial accounting (but not budgeting) purposes since 2009, there is still not sufficiently solid information to evaluate the adequacy of municipal infrastructure with much confidence. Moreover, although the existence of a provincial pension plan (OMERS) for municipal employees considerably alleviates one of the risks facing many U.S. cities (Inman 1995), it is by no means clear that all liabilities are as yet accounted for in an economically meaningful way
19
some of the data used for particular municipalities, and more importantly, to the notion that matters
such as those covered in this study have much to do with the question of long-term financial
substainabiity (MFOA 2011).27 Nonetheless, these two tables illustrate the sorts of qualitative and
quantitative indicators that have been used recently in Canada to assess municipal fiscal health and
performance.
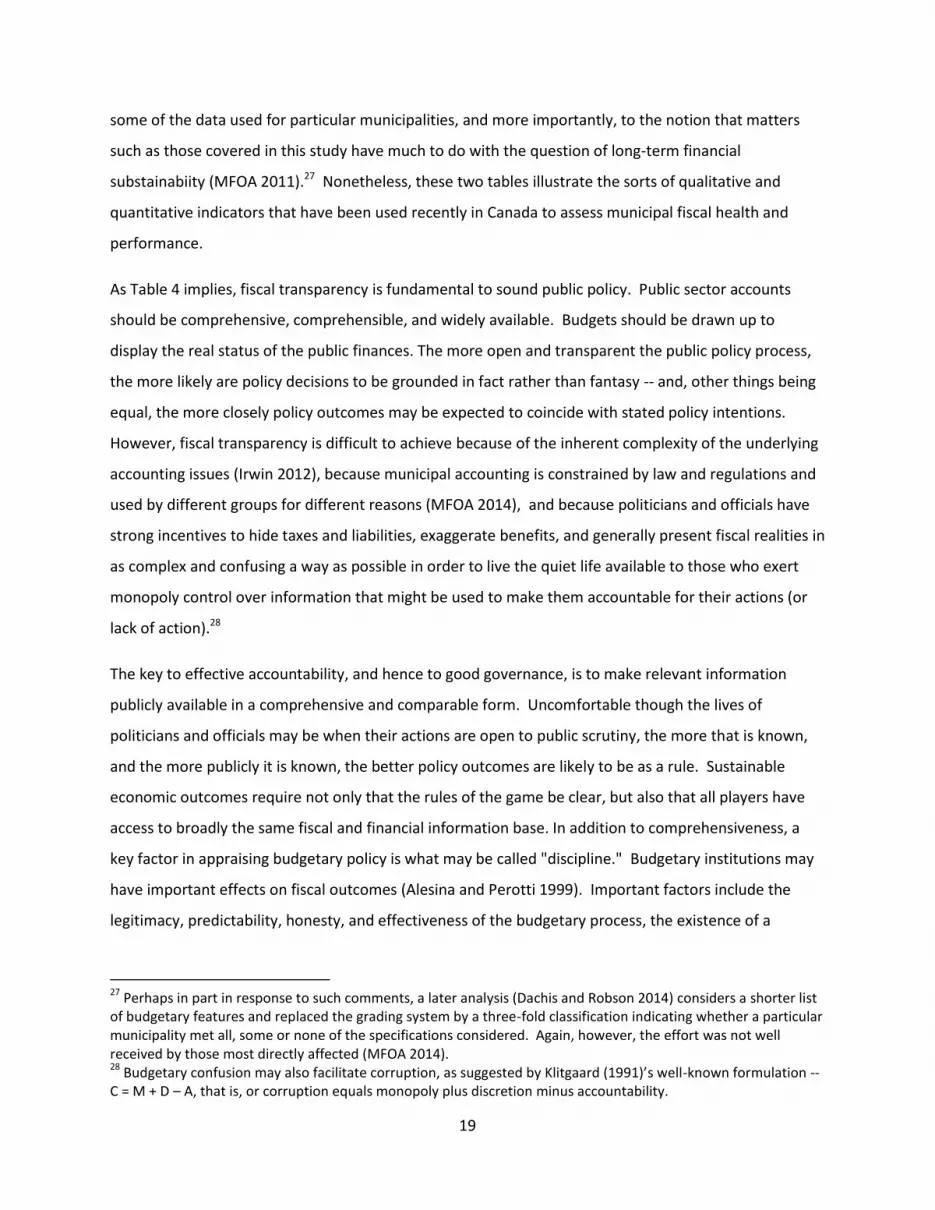
As Table 4 implies, fiscal transparency is fundamental to sound public policy. Public sector accounts
should be comprehensive, comprehensible, and widely available. Budgets should be drawn up to
display the real status of the public finances. The more open and transparent the public policy process,
the more likely are policy decisions to be grounded in fact rather than fantasy -- and, other things being
equal, the more closely policy outcomes may be expected to coincide with stated policy intentions.
However, fiscal transparency is difficult to achieve because of the inherent complexity of the underlying
accounting issues (Irwin 2012), because municipal accounting is constrained by law and regulations and
used by different groups for different reasons (MFOA 2014), and because politicians and officials have
strong incentives to hide taxes and liabilities, exaggerate benefits, and generally present fiscal realities in
as complex and confusing a way as possible in order to live the quiet life available to those who exert
monopoly control over information that might be used to make them accountable for their actions (or
lack of action).28
The key to effective accountability, and hence to good governance, is to make relevant information
publicly available in a comprehensive and comparable form. Uncomfortable though the lives of
politicians and officials may be when their actions are open to public scrutiny, the more that is known,
and the more publicly it is known, the better policy outcomes are likely to be as a rule. Sustainable
economic outcomes require not only that the rules of the game be clear, but also that all players have
access to broadly the same fiscal and financial information base. In addition to comprehensiveness, a
key factor in appraising budgetary policy is what may be called "discipline." Budgetary institutions may
have important effects on fiscal outcomes (Alesina and Perotti 1999). Important factors include the
legitimacy, predictability, honesty, and effectiveness of the budgetary process, the existence of a
27
Perhaps in part in response to such comments, a later analysis (Dachis and Robson 2014) considers a shorter list of budgetary features and replaced the grading system by a three-fold classification indicating whether a particular municipality met all, some or none of the specifications considered. Again, however, the effort was not well received by those most directly affected (MFOA 2014). 28
Budgetary confusion may also facilitate corruption, as suggested by Klitgaard (1991)’s well-known formulation -- C = M + D – A, that is, or corruption equals monopoly plus discretion minus accountability.
20
coherent strategy (as evidenced, for example, by a coherent medium-term expenditure plan) and the
capacity of budgetary institutions to analyze and implement policy.
To take differences in both processes and structures satisfactorily into account in assessing fiscal health
requires establishing meaningful links between structures and processes—for example, the existence of
a city manager, a strong mayor system, a unified city or regional budget, etc. -- and the relevant
outcomes in order to be able to estimate the extent to which fiscal outcomes are not simply reflections
of exogenous influences. This is far from easy. There is, for instance, a considerable literature (e.g.
Rodden, Eskelund and Litvack 2003) that suggests that local governments subject to a hard budget
constraint are more likely to tax and spend sensibly than those that are not: but how can the existence,
strength (over the time period considered), and shape of such a constraint be measured?29
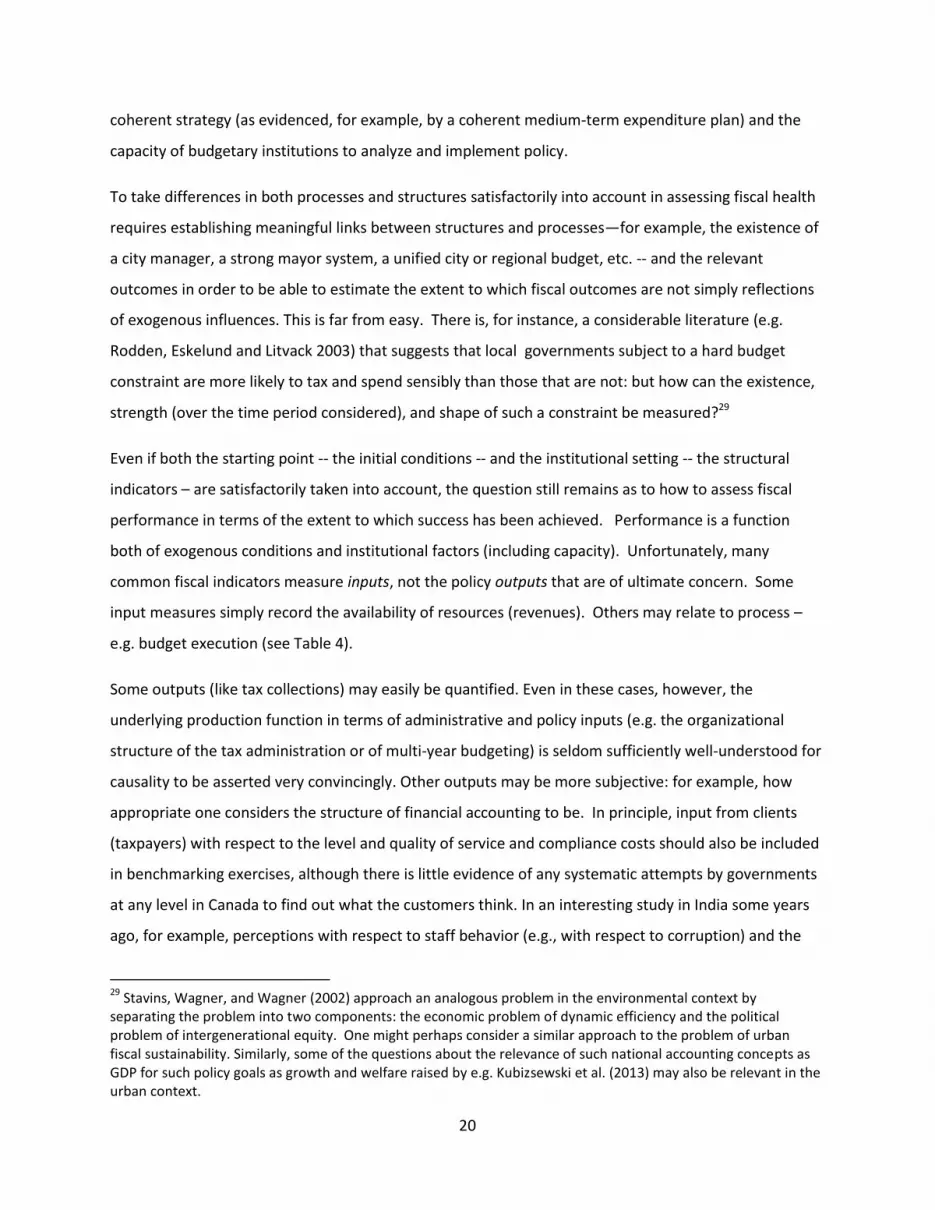
Even if both the starting point -- the initial conditions -- and the institutional setting -- the structural
indicators – are satisfactorily taken into account, the question still remains as to how to assess fiscal
performance in terms of the extent to which success has been achieved. Performance is a function
both of exogenous conditions and institutional factors (including capacity). Unfortunately, many
common fiscal indicators measure inputs, not the policy outputs that are of ultimate concern. Some
input measures simply record the availability of resources (revenues). Others may relate to process –
e.g. budget execution (see Table 4).
Some outputs (like tax collections) may easily be quantified. Even in these cases, however, the
underlying production function in terms of administrative and policy inputs (e.g. the organizational
structure of the tax administration or of multi-year budgeting) is seldom sufficiently well-understood for
causality to be asserted very convincingly. Other outputs may be more subjective: for example, how
appropriate one considers the structure of financial accounting to be. In principle, input from clients
(taxpayers) with respect to the level and quality of service and compliance costs should also be included
in benchmarking exercises, although there is little evidence of any systematic attempts by governments
at any level in Canada to find out what the customers think. In an interesting study in India some years
ago, for example, perceptions with respect to staff behavior (e.g., with respect to corruption) and the
29
Stavins, Wagner, and Wagner (2002) approach an analogous problem in the environmental context by separating the problem into two components: the economic problem of dynamic efficiency and the political problem of intergenerational equity. One might perhaps consider a similar approach to the problem of urban fiscal sustainability. Similarly, some of the questions about the relevance of such national accounting concepts as GDP for such policy goals as growth and welfare raised by e.g. Kubizsewski et al. (2013) may also be relevant in the urban context.

21
amount and reliability of the information provided to the public were found to overlap strongly with
perceptions of the quality of the service provided (Paul 1996).30 It would be interesting to see, for
example, if the recent contracting scandals in Montreal or the recent uproar about the mayor in Toronto
has had any such impact on perceptions of the probity of local officials, the quality of local public
services or the acceptability of local taxes.
In the end, the ‘best’ set of fiscal indicators to assess fiscal health is likely to be a mixed bag. Indicators
may, for example, be quantitative or qualitative. Qualitative measures, in turn, may be scalable or
ranked, or they may simply record whether some feature or characteristic (e.g., a city manager) exists.
Indicators may be available periodically (monthly, quarterly, annually) or only at irregular intervals (if
based on special studies or surveys). They may be available only for some cities, or for some parts of a
metropolitan area, and hence difficult to compare across regions.31 Indicators may be purely descriptive
or subjective (whether based on expert judgment or, rarely, on public opinion surveys). The standards or
norms against which a particular country is to be assessed may be explicit (best practice, perceived
potential, group average, etc.) or implicit and purely subjective, reflecting such factors as one's
conception of an ideal or attainable level.32 Whether qualitative or quantitative, indicators may be
purely descriptive -- how is the budget organized? how much revenue is collected from the property
tax? -- or they may incorporate (often implicit) judgmental elements: is there a single metropolitan
government? what is the level of wages, salaries and benefits relative to those paid to similarly-qualified
persons in the private sector?.
It is difficult and indeed may sometimes not really be possible to aggregate or average such
heterogeneous indicators meaningfully, even with respect to any one area. The basic approach taken in
many discussions of fiscal health is what might perhaps be called the pre-analytic step of collecting
clusters of indicators under a number of broad headings which are thought to provide a profile of some
relevant dimension of the issue. These indicators may then be assessed in terms of static short-run
measures such as the ratio of taxes to some measure of local economic activity or longer-term measures
such as the present value of future obligations (such as those for employee pensions). The results are
30
For a recent update and review of the methods and effects of what he calls ‘demand-side governance’, see Paul (2014). 31
As emphasized by Chernick, Langley, and Reschovsky (2011a), to make valid comparisons even within particular countries or provinces it may often be necessary to ‘construct’ comparable urban areas. 32
Such technical aspects of this issue as the use of stochastic production functions instead of regression analysis has been much discussed in the recent literature on estimating national tax ‘effort’: for a useful recent assessment, see Cyan, Martinez-Vazquez and Vulovic (2013).

22
often categorized, scaled or graded in what usually seems to be a relatively arbitrary fashion and then
aggregated (usually with equally arbitrary weights) into a composite index or ranking. It is far from clear
how seriously to take many such exercises, which, like the bond ratings mentioned earlier, usually
reflect as much the judgment of those who compile them as they do the underlying data.
Understanding Urban Fiscal Health
Initial conditions, processes and institutional structures all need to be taken into account when
interpreting fiscal indicators. To do so satisfactorily requires both careful assessment of the various
factors thought to affect the capacity (and perhaps willingness) of a city to respond to particular types of
shocks and the establishment of meaningful links between structures and processes. Consider for
example, how each of the following might affect the interpretation of a particular set of quantified ‘fiscal
indicators’ purporting to measure urban fiscal health:
The existence of one sort of transfer rather than another -- unconditional or conditional, general
or earmarked, fixed or gap-filling, mandated and unfunded or cost-reimbursement;33
The existence of a particular governmental structure -- one-tier or two-tier, regional or
fragmented, strong or weak mayor, direct or indirect elections to council, ward-based or city-
wide elections, parties vs. non-partisan, city manager or council metropolitan government;34
The existence of a particular system of public financial management -- a single treasury ledger
system or a set of fund accounts, or cash, modified accrual or accrual accounting.35
Some of these factors can be dealt with to some extent empirically by a variety of techniques. But it
requires a considerable leap of faith to conclude that observed differences in ‘outcomes’ as measured
by the chosen fiscal indicators are solely the result of local ‘effort’ (or its absence) rather than of factors
not really within the control of local decision-makers. Even the best set of fiscal indicators is not, and
cannot be, a substitute for careful case analysis.
As the constant reference to comparative rankings by both business school deans and national and local
politicians tells us, numbers are powerful even when, as with most city rankings and many so-called
33
Some aspects of these questions are discussed in Bird and Smart (2002) and Kim, Lotz and Mau (2010). 34
The first of these questions is discussed in Bird and Slack (2007). 35
The last of these points is discussed in Irwin (2012).

23
‘governance indicators’, they are often suspect in various ways. Good numbers, properly used, may
illuminate reality and may not only enable meaningful assessment of performance but also suggest new
and promising lines of inquiry. Measurement and quantification have long been essential ingredients in
the development and application of scientific thought. On the other hand, even good numbers may be
misunderstood and misinterpreted, and bad numbers may all too easily pass for good among those who
do not take the time to understand what the numbers can and do measure, and, equally importantly,
what they do not and cannot show. The fact that the unwary may cut themselves with sharp tools,
however, is no reason we should not sharpen our analytical tools as best as possible. It is only through
careful study and appreciation of what can be measured, and with what degree of reliability, that
knowledge of the world and how it works is obtained and improved. Despite the inherent limitations
and risks, it therefore seems worthwhile to attempt to develop meaningful and comparable indicators of
urban fiscal health. But we should use even the best such indicators properly, and with care.
Two analogies may perhaps make the point a bit clearer. First, the results of even the best-designed and
best-executed analysis of fiscal health at best provide raw material that requires further interpretative
analysis. In this sense, indicators of urban fiscal health may be compared to the information that
consumer magazines assemble with respect to automobiles. Some indicators reported describe various
mechanical and other features of the different vehicles. Others report the results of specified
performance tests. Still others may report the more subjective judgment of experts (or perhaps even a
statistically meaningful set of owners) with respect to the quality and general appeal of the car. What
the editors deem to be the "Best Buy" in terms of the particular way they choose to weight these
various factors in reaching an overall assessment may also be indicated. In the end, however, it is left up
to the reader to draw his or her own conclusions from all the information presented in terms of his or
her own interests and concerns.
Secondly, continuing with the automobile example, consider it now from the perspective of someone
who is managing a city rather than buying one, think now about driving a car.36 The instruments on the
dashboard provide us with some basic data such as how fast we are going, how much fuel is left, and
how hot the engine is. They also give us some warnings about possible problems through a series of
indicator lights -- including in some cars one particularly worrying and annoying light labeled ‘check
engine’ which may signal anything from a loose gas cap to a possibly calamitous impending engine
36
This is a variation of an example used to illustrate a similar point in a quite different context by Heal (2011).

24
failure. We may even have a GPS system that tells us where we are and assuming we know where we
going, how to get there. All this information is useful to varying degrees in different circumstances.
But none of it helps much if we are bad drivers, who drive too fast in black ice conditions (cities that
borrow more than they can repay) or unlucky drivers, who get hit by falling rocks or by someone running
a light at an intersection (cities that suffer unforeseeable economic shocks or are blindsided by abrupt
changes in intergovernmental transfers). Perhaps the most useful indicator for all drivers is the most
basic -- the fuel gauge, which tells us how much longer we can carry on doing what we are doing before
we sputter to a halt. A good indicator may either be like a fuel gauge telling us how much gas we have
in the tank (our current state of fiscal health) or some combination of a GPS system showing us where
we are and how to get to where we want to go together with sufficient funds to get us there and an
assessment of how well we are fitted to handle the next phase of the journey (our fiscal sustainability).
A fiscal crisis for a local government occurs when it runs out of gas – that is, when its potential to raise
revenues is insufficient to cover the expenditures that it is legally mandated to carry out. If maximum
tax revenues are less than required expenditures (net of transfers and other revenues) someone who is
legally entitled to a claim on the local government loses and crisis ensues. In principle, to determine if a
city faces a crisis in this sense, all one has to do is (a) calculate the maximum tax revenues, T*, that a city
can collect with its designated revenue structure; (b) calculate the cost of the expenditures, E, that it is
legally required to carry out; (c) estimate the transfers likely to be received from other levels of
government, TR; and (d) calculate how much the jurisdiction can expect to get from such other revenues
as fees, OR. If T* is less than E + TR + OR, then there is a crisis (Inman 1995).
Or is there? Obviously the credence one puts in such calculations depends on two things. The first is the
reliability of the estimates; what is maximum tax revenue, for example? Bird, Slack and Tassonyi (2012),
without suggesting that it would be a good idea to do so, recently estimated that four out of the five
regions in the GTA, if they really had to do so, could probably squeeze more property tax revenue out of
their residential tax base, with the City of Toronto having by far the most ‘tax room’ in this sense.37 One
region (Durham) seemed more likely to lose than to gain revenue by increasing taxes on housing.
However, all regions appeared to have room to raise revenue by taxing non-residential property a bit
37
Bird, Slack and Tassonyi (2012), following Haughwort et al. (2004) estimate what is called the revenue-maximizing tax rate (RMTR) --the top of the ‘revenue hill’ (Laffer curve), as it were. However, this rate is inevitably greater than the ‘optimal’ rate in terms of allocative efficiency (Bird and Wallace 2005).

25
more, although the City of Toronto had the least such room. Apart from the extreme case of Toronto,
which ranked at the top in terms of taxing business and the bottom in terms of taxing housing, the other
four regions ranked in the same order – from top to bottom, Halton, York, Peel, and Dufferin – in terms
of the room they apparently have to increase taxes. To put the point most simply, this study indicates
that what one assumes to be the “maximum” tax revenue in most cities is determined more by political
than by economic factors.
Much the same is true about the implicit but critical assumption in much discussion of urban finance
that no changes in required expenditures are feasible –that is, it is simply not possible to pay city
workers less, to reduce pension obligations, to negotiate better prices for materials the city buys, to
provide services more efficiently, or to reduce service levels. None of these things is likely to be either
easy or popular, but is anything really untouchable? If necessary, cities can do all sorts of things to put
their financial houses in order: cut back on or eliminate programs, reduce salaries and wages or fire
people, refuse to pay pensions or debts, raise taxes and charges, sell assets, etc. Indeed, they must do
such things unless cushioned by bailout and bankruptcy – although this aspect of the problem is not
discussed further here. Only if one assumes that all the terms in the equation set out above are properly
estimated and that the underlying assumption about the rigidity of the revenue and expenditure
possibilities is correct, can one take the outcome of such an equation as an indicator of crisis – though it
may certainly reflect some degree of fiscal (and political) stress.
Although measuring urban fiscal health has inherent limitations and risks, it is definitely worth
developing as meaningful and comparable fiscal indicators as possible. Even the best such indicators
will never provide a certain or clear guideline telling any city what to do, but they may, if done well, be
helpful in understanding how a city is doing relative to others in roughly similar circumstances. Providing
a base case against which to assess performance is no mean contribution to the complex and ongoing
task of assessing how well particular governments are doing.
Some years ago, for example, the director of railways in India, a country in which railways traditionally
constitute the core of the transport system, was asked “Why do you bother to have a timetable when
the trains are always late?” His reply was both simple, and accurate: “How would you know they were
late if we did not have a timetable?”38 Benchmarking is equivalent to establishing a timetable in the
sense that at its best it establishes clear and ideally measurable objectives against which to measure
38
This example is from Das-Gupta (2002) and much of what follows is based on Vazquez-Caro and Bird (2011).

26
performance. These objectives may be an idealized vision of what should be. They may be a more or
less well-based estimate of what should happen if the system worked well. Or they may be based on
past experience or on the average outcomes suggested by experience elsewhere. However such
benchmarks are established, once they exist not only has a standard against which to judge reality been
set, but, more importantly, we know what information needs to be collected -- how late are the trains?--
in order to determine the extent to which the goals established are actually met. Although there are
always elements of judgment in making such measurements, the basic framework for analysis is
nonetheless established by the timetable (the benchmark, or standard).
Even when there is not only a timetable but also information on the extent to which it is not met,
however, we are only at the beginning of analysis. We may know how many trains are late and by how
much. But the real questions are: why are they late, and what can be done to improve matters? Trains
may be late for many reasons: system design failures (inappropriate signal configurations),
environmental factors (landslides, floods), operating problems (breakdowns), human errors (crew asleep
or poorly trained). At best, all that benchmarking can do is to tell us that there is something that should
probably be looked at more closely. It cannot and does not tell us exactly what happened, why it
happened, or how it can be fixed.
Most benchmarking exercises understandably emphasize quantitative measures of success. However,
what can be measured and what matters are not always the same. An additional problem is that
benchmarking is often carried out by outsiders who may use the results in ways that those being
benchmarked may not like. If those who generate most of the critical data used for benchmarking know
that they will be judged by it and they see no direct benefits for themselves from accurate reporting,
accurate reporting seems unlikely.39
Benchmarking may be useful to identify areas of weakness – symptoms -- but it seldom provides either
clear explanations of the underlying problems or many insights helpful in resolving those problems,
apart perhaps by exposing cities to how others have deal with similar problems. Nonetheless, even
incomplete and partial benchmarking may improve matters by encouraging city governments to collect
39
It is not clear that this caution is always taken as seriously it should be by those who design grant systems in
which the amounts allocated are distributed largely in accordance with numbers that are to some extent under the control of potential beneficiaries. As was said in a different context, “any observed statistical regularity will tend to collapse once pressure is placed upon it for control purposes” (Goodhart 1975).
27
and analyze data that they should have if they want to know what they are doing. To be most effective
in influencing behaviour, the objectives benchmarked should be congruent with the real strategic
objectives of the organisation. Whether or not this is the case, however, the basic logic of benchmarking
is sound and should in principle be both attractive and useful even to those who are being
benchmarked: if other cities deliver similar services better than you do, why not learn from them?
Modifying and adapting the successful practices of others has always been an important way in which
individuals and organizations improve their performance.
Another motivation for benchmarking is to spot opportunities for change and improvement. Such
opportunities are often ‘soft’ (qualitative) in nature and difficult to identify. Concentrating only on
gathering data on ‘hard’ (quantifiable) systems, as economists in particular seem programmed to do,
may produce severely incomplete information and even lead to changes (such as the introduction of
new technology or the adoption of large-scale infrastructure projects or development plans) that in the
end prove unsustainable.40 It is thus important to gather information also on such critical soft elements
of organizational culture as management philosophy, behaviors and style, the degree of participative
management, communication and recognition, empowerment, and ownership.
Most people who are overweight want to believe that there is a simple magic bullet that can resolve the
problem. They want a pill, a potion, or a machine that will make the problem go away. They do not
want to hear that what they really need to do is to change their diet and exercise regime for life.
Similarly, local politicians and officials understandably want to avoid such difficult, time consuming, and
often conflict laden tasks as rethinking what they are really doing and re-engineering their whole
organizational structure and processes to do it better. It always seems much easier to buy a new
technological package off the shelf or to hire additional or better qualified (and paid) staff than to
change how one does business. It seems easier; but it is also on the whole seems much less likely to
produce ‘good’ or ‘better’ results, let alone the ‘best’ results that are presumably the desired end goal.
Three broad approaches to benchmarking may be found in practice and in the literature. The first, and
by far the most popular, is benchmarking by numbers – the quantitative approach. The second, also
40
Further illustrating the point made in the preceding note, Flyvbjerg (2009) documents the shocking extent to which the numbers used to assess a very large number of important infrastructure projects have consistently underestimated costs and overestimated benefits, thus resulting all too often in what he calls the ‘survival of the unfittest’ – that is, those projects whose proponents present the most biased numbers. Much the same could perhaps be said of most projects put forth by private developers, not least those seeking public subsidies. Beware of proponents bearing the ‘gift’ of favorable numbers, as the Greeks might have put it.
28
popular, is benchmarking by (presumed) good institutional practice – the qualitative approach. In
practice, as already discussed, mixes of these two approaches are common in measuring fiscal health. It
is easy to mix them in part because both approaches share an important common characteristic in
considering each component or aspect of the urban fiscal scene separately. A third approach is distinct,
however, in considering how all aspects of the urban fiscal system function as a whole in the context of
the environment, particularly the intergovernmental environment, within which that system is
embedded. In this approach, the most important function of good benchmarking is less to define a
particular set of benchmark indicators than to identify the management practices -- good, better, and
best -- that underlie and explain a set of good indicators. However, not much seems as yet to have been
attempted along these lines with respect to assessing city performance.41 Although it may as yet not be
possible to reduce the inevitably highly case-specific detail required to apply such a systemic approach
to a model that could be applied more generally, perhaps as we learn more about how different
features and indicators are connected with particular outcomes we may at least be able to develop a
more useful taxonomy of municipalities combining different features in ways associated with different
outcomes to serve as benchmarks for evaluating individual performance.
The key conclusion here, however, is simply that benchmarking and diagnosis are very different. Even
the best benchmarks can never replace the educated eye of an expert in providing a diagnosis of a given
situation although they may help by directing that eye to problematic areas. Just as medical doctors
must interpret test results (which are also usually benchmarked against presumably relevant and
reliable information), those who wish to improve urban fiscal systems must understand in depth not
only exactly what is meant by specific benchmarks but also (and equally in depth) the context within
they are interpreted in order to provide sound recommendations. Better diagnostic tools may improve
diagnosis, but even the best tool cannot replace a good doctor who is familiar with the patient and his
or her environment. Similarly, even the best designed urban fiscal system for any particular context is
unlikely to function well unless it has both adequate political support (including resources) from the top
and a good management team in place. Assessing how well the system is doing requires both a
systematic analytical approach and detailed local knowledge. There are few short-cuts to success in the
never-ending task of improving public policy.
41
For an example of applying this approach to benchmarking the performance of national tax administrations, see Vazquez-Caro and Bird (2011).
29
References
ACIR (Advisory Commission on Intergovermental Relations) (1988) State Fiscal Capacity and Effort Washington.
Alesina, A. and R. Perotti (1999) “Budget Deficits and Fiscal Performance,” in J. Poterba and J. von Hagen,eds., Fiscal Institutions and Fiscal Performance (Chicago: University of Chicago Press), pp. 13-36.
Anderson, J. (2012) “State Tax Rankings: What Do They and Don’t They Tell Us?” National Tax Journal, 65(4): 985-1010.
Auditor General of Nova Scotia (2010) Annual Report. Halifax.
Baldacci, E. et al. (2011) Assessing Fiscal Stress, IMF Working Paper WP/11/100, International Monetary Fund, Washington.
Bandyopadhyay, S and Rao M.G (2009) Fiscal Health of Selected Indian Cities, Policy Research Working Paper 4863, World Bank, Washington, March.
Baunsgaard, T. et al. (2012) Fiscal Frameworks for Resource Rich Developing Countries, IMF Staff Discussion Paper SDN/12/04, May.
Bird, R. and E. Slack (2004)The Fiscal Sustainability of the Greater Toronto Area, ITP Paper 0405, International Tax Program, Rotman School of Management, University of Toronto, February.
Bird, R. and E. Slack (2006) Cities in Canadian Federalism, ITP Paper 0603, International Tax Program, Rotman School of Management, University of Toronto, May.
Bird, R. and E. Slack (2007) “An Approach to Metropolitan Governance and Finance,” Environment and Policy C: Government and Policy, 25 (5): 729-55.
Bird, R., E. Slack and A. Tassonyi (2012) A Tale of Two Taxes: Reforming the Property Tax in Ontario. Cambridge, MA: Lincoln Institute of Land Policy.
Bird, R. and M. Smart (2002) “Intergovernmental Fiscal Transfers: Lessons from International Experience,” World Development, 30 (6, 2002): 899-912.
Bird, R. and S. Wallace (2005) “Revenue-Maximizing Tax Rates,” in J. Cordes, R. Ebel and J. Gravelle, eds., The Encyclopedia of Taxation and Tax Policy (2nd ed.; Washington: The Urban Institute Press, 2005), pp. 347-349.
Borge, L., J. Brueckner, and J. Rattso (2013) Partial Fiscal Decentralization and Public-Sector Heterogeneity: Theory and Evidence from Norway, available at http://www.ieb.ub.edu/files/PapersWSFF2013/Borge.pdf.
Buti, M. et al. (2008) “Defying the ‘Juncker Curse’: Can Reformist Governments be Re-elected?” Economic Papers 324, European Commission Economic and Financial Affairs, May, available at http://ec.europa.eu/economy_finance/publications/publication12586_en.pdf
Canadian Infrastructure Report (2012) vol. 1. 2012. Municipal Roads and Water Systems, available at http://www.canadainfrastructure.ca/en/
30
Canuto, O. and L. Liu, eds. (2013) Until Debt Do Us Part: Subnational Debt, Insolvency, and Markets. Washingon: World Bank.
Chernick, H., A. Langley, and A. Reschovsky (2011) “The Impact of the Great Recession and the Housing Crisis on the Financing of America’s Largest Cities,” Regional Science and Urban Economics, 41(4): 372-381.
Chernick, H., A. Langley, and A. Reschovsky (2011a) Revenue Diversification in Large U.S. Cities, IMFG Papers on Municipal Finance and Governance, No. 5 (Toronto: Institute on Municipal Finance and Governance, Munk School of Global Affairs, University of Toronto).
Conference Board of Canada (2005) Measuring Toronto’s Fiscal Capacity, Toronto, May.
Cyan, M., J. Martinez-Vazquez and V. Violeta (2013) Measuring Tax Effort: Does the Estimation Approach Matter and Should Effort be Linked to Expenditure Goals? International Center for Public Policy Working Paper 1308, International Center for Public Policy, Andrew Young School of Policy Studies, Georgia State University.
Dachis, B. and W. Robson (2011) Holding Canada’s Cities to Account: An Assessment of Municipal Fiscal Management, Backgrounder No. 145, C.D. Howe Institute, Toronto
Dachis, B. and W. Robson (2014) Baffling Budgets: Canada’s Cities Need Better Financial Reporting, Commentary No. 397, C.D. Howe Institute, Toronto.
Das-Gupta, A. (2002) “Central Tax and Administration Reform in the 1990s: An Assessment”, in M. G. Rao, ed. Development, Poverty, and Fiscal Policy (New Delhi: Oxford University Press), pp. 139-73.
Dethier, J-J. and C. Merrill (2012) The Great Recession and the Future of Cities, Policy Research Working Paper 5256, World Bank, Washington.
Dollery, B. (2009) “Review Note: Local Government Reform and Local Government Finance,” Commonwealth Journal of Local Governance, 4: 153-163.
Drezgic, S. D. Klimovsky, and U. Pinteric (2011) “Fiscal Rules and Fiscal Sustainability at Sub-National Government Levels: Experiences of Slovakia, Slovenia and Croatia,” in L. Matel, D. Vasicek, and M.K. Mrak, eds., European Administrative Space: Balkan Realities (Bucharest: Editura Economica), 279-303, available at http://aei.pitt.edu/32251/1/ASsee_No.3_2011.pdf
Ebel, R., J. Peterson, and H. Vu (2013) “The Great Recession: Impacts and Outlook for US State and Local Finance,” Municipal Finance Journal, 34 (1): 33-78.
Flyvbjerg, B. (2009) “Survival of the Un-fittest: Why the Worst Infrastructure Gets Built – and What We Can Do About It,” Oxford Review of Economic Policy, 25(3): 344-367.
Goodhart, C. (1975) Monetary Relationships: A View from Threadneedle Street, Papers in Monetary Economics, Reserve Bank of Australia, Sydney.
Groves, S., W. Godsey, and M. Shulman (1981) “Financial Indicators for Local Government,” Public Budgeting & Finance, 1(2): 5-19.
Halifax Regional Municipality (2009) Fiscal Health, available at https://www.halifax.ca/council/agendasc/documents/090602ca1116.pdf

31
Hanniman, K. “Can (Do) Credit Markets Promote Municipal Fiscal Health?” this volume.
Haughtwart, A. et al. (2004) “Local Revenue Hills: Evidence from Four U.S. Cities,” Review of Economics and Statistics, 86 (20): 570-85.
Heal, G. (2011) Sustainability and Its Measurement, Working Paper 17008, National Bureau of Economic Research, Cambridge, MA, May.
Inman, R. (1995) “How to Have a Fiscal Crisis: Lessons from Philadelphia.” American Economic Review, Papers and Proceedings 85(2): 378–83.
International Monetary Fund (2011) Modernizing the Framework for Fiscal Policy and Public Debt Sustainability Analysis, Policy Paper, August, available at http://www.imf.org/external/np/pp/eng/2011/080511.pdf
Irwin, T. (2012) Some Algebra of Fiscal Transparency: How Accounting Devices Work and How to Reveal Them, WP/12/228, International Monetary Fund, Washington, September.
Jacob, B. and R. Hendrick (2013) “Assessing the Financial Condition of Local Governments,” in Levine, Justice, and Scorsone, Handbook of Local Government Fiscal Health (Burlington, MA: Jones and Bartlett Learning), pp. 11-41.
James, R. (2012) Nearly a Quarter of Toronto residents live in poverty, Toronto Star, June 11.
Justice, J. and E. Scorsone (2013) “Measuring and Predicting Local Government Fiscal Stress,” in Levine, Justice, and Scorsone, Handbook of Local Government Fiscal Health (Burlington, MA: Jones and Bartlett Learning), pp. 43-74.
Kim, J., J. Lotz, and N. Mau, eds. (2010) General Grants versus Earmarked Grants. Theory and Practice. The Copenhagen Workshop 2009. Albertslund, Denmark: Published by The Korea Institute of Public Finance and the Danish Ministry of Interior and Health.
Kitchen, H. (2000) “Canadian Municipalities: Fiscal Trends and Sustainability,” Canadian Tax Journal, 50 (1): 156-180.
Klitgaard, R. (1991) Controlling Corruption (Berkeley, CA: University of California Press).
Kubiszewski, I. et al. (2013) “Beyond GDP: Measuring and Achieving Global Genuine Progress,” Ecological Economics, 93: 57-68.
Ladd, H. and J. Yinger (1989) America’s Ailing Cities: Fiscal Health and the Design of Urban Policy (Baltimore: Johns Hopkins University).
Levine, H., J. Justice, and E. Scorsone, eds. (2013) Handbook of Local Government Fiscal Health (Burlington, MA: Jones and Bartlett Learning).
Merk, O. and C. Hulbert (2014) “Fiscal Health of Cities: An International Comparative View as seen by a Credit Rating Agency,” this volume.
Metroland (2014) Concrete Problems – How to Fix Our Crumbling Infrastructure, available at http://www.metroland.com/page/Infrastructure

32
MFOA (Municipal Finance Officers Association) (2011) MFOA’s Response to Holding Canadian Cities to Account: An Assessment of Municipal Fiscal Management, available at www.mfoa.on.ca
MFOA (2014) MFOA Responds to C.D. Howe Institute’s Budget Commentary, available at http://www.mfoa.on.ca/sites/default/files/Final%20MFOA%20response%20to%20CD%20Howe%20Budgets%20report%202014_0.pdf
Nollenberger, M. , S. Groves, and M. Valente (2003) Evaluating Financial Condition: A Handbook for Local Government (4th ed.; Washington: International City/County Management Association).
Ontario (2008) Provincial-Municipal Fiscal and Service Delivery Review, available at http://www.mah.gov.on.ca/AssetFactory.aspx?did=6050
Ontario (2013) Ontario Municipal Partnership Fund Transition-Year Stable Funding, 2012 Technical Guide (Toronto: Ministry of Finance).
Padovani, E., F. M. Rossi, and R.L. Orelli (2010) The Use of Financial Indicators to Determine Financial Health of Italian Municipalities, September, available at http://ssrn.com/abstract=1679128
Paul, S. (1995) Paul, Samuel, A Report Card on Three Indian Cities, Public Affairs Centre, Bangalore.
Paul, S. (2014) “Generating Demand for Good Governance,” in I. Ahluwalia, R. Kanbur, and P. Mohanty, eds., Urbanisation in India: Challenges, Opportunities and the Way Forward (New Delhi: Sage Publications), pp. 233-259.
Peterson, J. and R. Ciccarone (2012) “Financial Markets and State and Local Governments, in R. Ebel and J. Peterson, eds., The Oxford Handbook of State and Local Government Finance (Oxford: Oxford University Press), pp. 682-726.
Poverty Watch Ontario (2008) Greater Trouble in Greater Toronto: Child Poverty in the GTA, available at http://www.torontocas.ca/wp-content/uploads/2008/12/castchildpovertyreportdec2008.pdf
Public Sector Accounting Board (2007) Statement of Principles: Indicators of Government Financial Condition (no longer available on webpage).
Public Sector Accounting Board (2012) Measuring Financial Performance in Public Sector Financial Statements, Consultation Paper No. 2, October, available at http://www.frascanada.ca/standards-for-public-sector-entities/documents-for-comment/item68525.pdf
Rodden, J., G. Eskeland and J. Litvack, eds., Fiscal Decentralization and the Challenge of Hard Budget Constraints (Cambridge, MA: MIT Press).
Rossi, F.M. (2011) Analysis of Solvency in Italian Local Governments: The Impact of Basel II, May, available at http://ssrn.comn/abstract=1830520
Schaechter, A. et al (2012) A Toolkit to Assessing Fiscal Vulnerabilities and Risks in Advanced Economies, IMF Working Paper WP/12/11, International Monetary Fund, Washington.
Schoeman, Nick (2011) Fiscal Performance and Sustainability of Local Government in South Africa – An Empirical Analysis, University of Pretoria Working Paper 201, January

33
Slack, E. and R. Chattopadhyay, eds. (2013) Governance and Finance of Metropolitan Areas in Federal Systems (Oxford University Press)
Slack, E., A. Tassonyi and D. Grad “Fiscal Health of Ontario Large Cities: Is There Something to Worry About?” this volume.
Sohl, S. et al. (2009) “Measuring the Financial Position of Municipalities: Numbers Do Not Speak for Themselves,” Public Budgeting and Finance, 29(3): 74-96.
Stavins, R., A. Wagner, and G. Wagner (2002) Interpreting Sustainability in Economic Terms: Dynamic Efficiency Plus Intergenerational Equity, Harvard University, John F. Kennedy School of Government Faculty Research Working Paper No. RWP 02-018.
Tanner, E. (2013) Fiscal Sustainability: A 21st Century Guide for the Perplexed, IMF Working Paper WP/13/89
Tassonyi, Almos T. (2011) “Essays on Municipal Finance in Ontario from an Historical Perspective Considered,” Ph.D. Thesis, University of Calgary.
Vander Ploeg, C. (2001) Dollars and Sense: Big City Finances in the West, 1990-2000, Canada West Foundation, Calgary.
Vazquez-Caro, J. and R. Bird (2011) “Benchmarking Tax Administrations in Developing Countries: A Systemic Approach,” eJournal of Tax Research, 9 (1): 5-37.
Vermalle, C. and C. Hulbert (2013) Sub-National Finances and Fiscal Consolidation: Walking on Thin Ice, OECD Regional Development Working Papers 2013/02, OECD, Paris.
Vigari, A. (2010) “Is the Conflict Container Full? Problems of Fiscal Sustainability at the Local Government Level in Hungary,” Acta Oeconomica, 60 (11): 49-77.
Weingast, B. (2006) Second-generation fiscal federalism: Implications for decentralized democratic governance and economic development. Hoover Institution Working Paper, June.
Wolters, T. (2011) “Financially Sustainable Municipalities: The Next Generation,” In the Black: MFOA (Municipal Finance Officers Association of Ontario) Member Magazine, Spring, pp. 6-13.
World Bank (2012) Guide to the Subnational Debt Management Performance Tool, available at http://siteresources.worldbank.org/INTDEBTDEPT/Resources/468980-1226602826665/SubnationalDeMPAGuide.pdf