refinery configuration 2 2015
TRANSCRIPT

BY ENGR. I.N.OLUMATI, MNSChE, MAICHE
FUNDAMENTALS OF HYDROPROCESSING & INTEGRATED REFINING
OPERATIONS

PRESENTATION OUTLINE INTRODUCTION REFINERY CONFIGURATION REFINERY MARGINS FUNDAMENTALS OF HYDROPROCESSING

REFINERY OBJECTIVE THE PURPOSE OF AN OIL REFINERY
IS TO TRANSFORM RELATIVELY LOW VALUE CRUDE OIL INTO HIGH VALUE PRODUCTS AS EFFICIENTLY, PROFITABLY AND ENVIRONMENTALLY SOUND AS POSSIBLE

INTRODUCTION Each refinery has a unique set of characteristics (configuration, scale,
efficiency, nature of crude processed, location) that allow the refinery to produce a particular slate of products at a particular cost.
Crude oil type and refinery characteristics are important because variations in either would change product yield patterns central to the calculation of net refinery operating margin. The most important information in this calculation is the refinery yield which is defined as the mix of petroleum products obtained from a barrel of crude oil processed.
The profitability of a refinery also depends on its yield. The higher the yield on light petroleum products, the better the operating margin
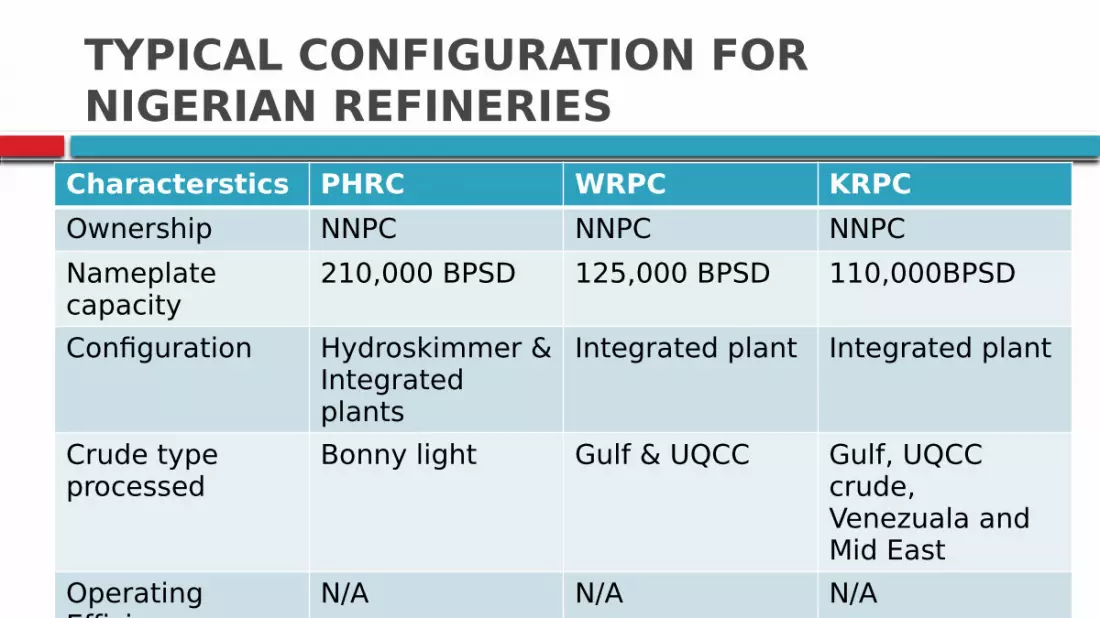
TYPICAL CONFIGURATION FOR NIGERIAN REFINERIES
Characterstics PHRC WRPC KRPCOwnership NNPC NNPC NNPCNameplate capacity
210,000 BPSD 125,000 BPSD 110,000BPSD
Configuration Hydroskimmer & Integrated plants
Integrated plant Integrated plant
Crude type processed
Bonny light Gulf & UQCC Gulf, UQCC crude, Venezuala and Mid East
Operating Efficiency
N/A N/A N/A
Direct employees

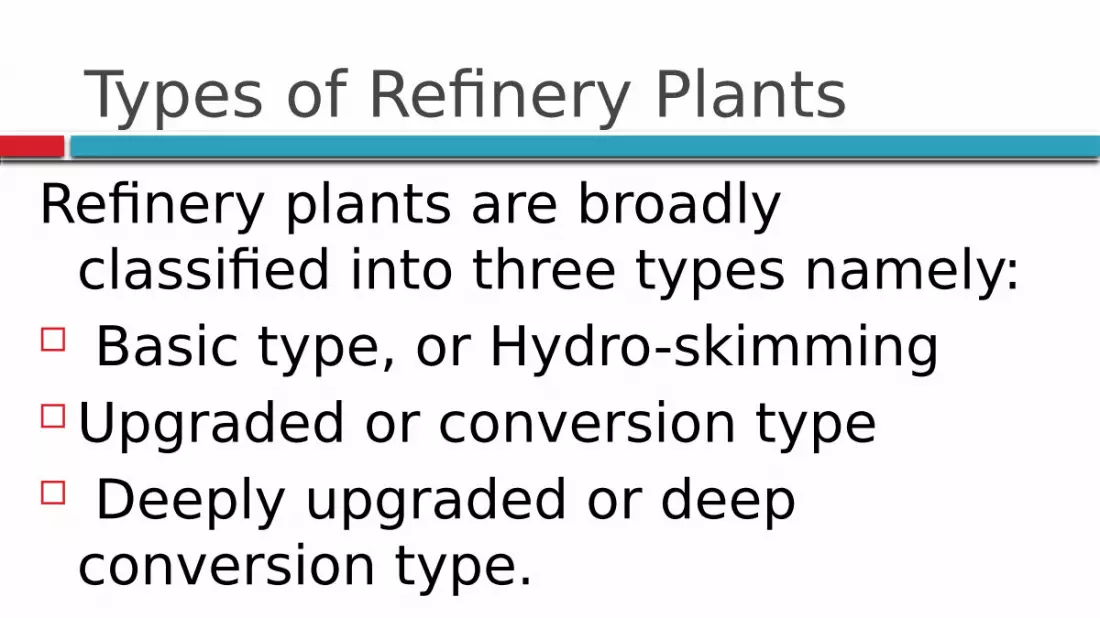
Types of Refinery PlantsRefinery plants are broadly
classified into three types namely: Basic type, or Hydro-skimming Upgraded or conversion type Deeply upgraded or deep
conversion type.

REFINERY TECHNOLOGY & CONFIGURATION

TECHNOLOGY & COMPLEXITIES

Does technology vary among refineries? Different refineries have many of the
same process units to convert crude oil to products. The technologies employed in the process units make each of the refineries unique.
These differences include capacity, capability, and effectiveness, which define the profitability of the refinery.

Does technology vary among refineries? Technology creates enormous differences among
refineries:- • Scale • Capability • Profitability Regional refineries show wide variations among
locations as compared to individual refineries.

Major Categories of Refining Processes There are three (3) Main Categories of
Refining based on:-• Separation---Physical process• Conversion (Yield change)--- Chemical
process• Treating (Quality Improvement)---
Chemical process

Major categories of Refining processes Separation • Crude oil Distillation • Vacuum Distillation Conversion (Yield Change) • Visbreaking (viscosity reduction or
non catalytic conversion of residues to gas, naphtha etc)

Major Categories of Refining Processes • Thermal cracking • Catalytic Cracking • Hydrocracking • Coking • Alkylation Treating ( Quality Improvement) • Reforming • Isomerization • Hydrtreating

Limited Technology Development Overall separation technology has not changed
significantly in decades Slight improvements have been made in tray
designs over time Control systems have gotten more sophisticated Some expensive processes like lube separation
are becoming out modeled by newer processes such as lube hydrocraking.

Conversion Units Conversion units take heavier streams
and crack them into lighter products like gasoline, jet fuel, and diesel fuel.
Conversion processes provide the balance between what kinds of products the market wants and what types naturally occur in the crude oil.

Conversion units Examples of conversion units are:- • Catalytic Cracking (Fluid Catalytic Cracking) • Hydrocracking • Visbreaking • Thermal Cracking • Coking • Resid Catalytic Cracking

Conversion Definition Conversion is defined as the percentage of heavy
feedstock converted to lighter products. Visbreaking is the mildest conversion process • Viscosity reduction or non catalytic conversion of
residues to gas, naphtha, etc. • Around 10 – 15% of feedstock is converted to
lighter products • Other benefits are related to fuel oil blending.

Conversion Definition Thermal Cracking converts 40-50% of
feedstock Fluid Catalytic Cracking converts 75-
80% of feedstock Hydrocracking can convert 90% of
feedstock to lighter products

How Do Refiners Select Conversion Units? Refiners must consider several factors in
deciding the best conversion technology The two most important considerations
are the Feedstock quality and the desired product disposition.

How Do Refiners Select Conversion Units? Factors to Consider : Feedstock quality • Low quality feedstocks require
upgrading prior to processing and are more amenable by thermal processing such as coking.
Degree of conversion desired

How Do Refiners Select Conversion Units? Quality of products desired • Hyrocracking is mainly employed when
kerosene or diesel is the conversion target • Hydrocracking makes cleaner fuels but lower
octane gasoline Capital cost • Budgets for projects vary wide with the
technologies chosen

Quality Specifications Many of the streams after processing do
not meet quality specifications Excessive levels of contaminants like sulfur
may be present Performance characteristics like octane
may be too low for gasoline blending.

Quality Specifications Example:-
Product Naturally Occurring
Market Requirement
Gasoline 75 Octane 87 Octane
Diesel 1% Sulfur 0.05% Sulfur

Refinery Configurations Refineries can be classified into four
groups depending on the complexity of the refinery
The classifications are listed in order of increasing complexity enabling a higher level of conversion capability.
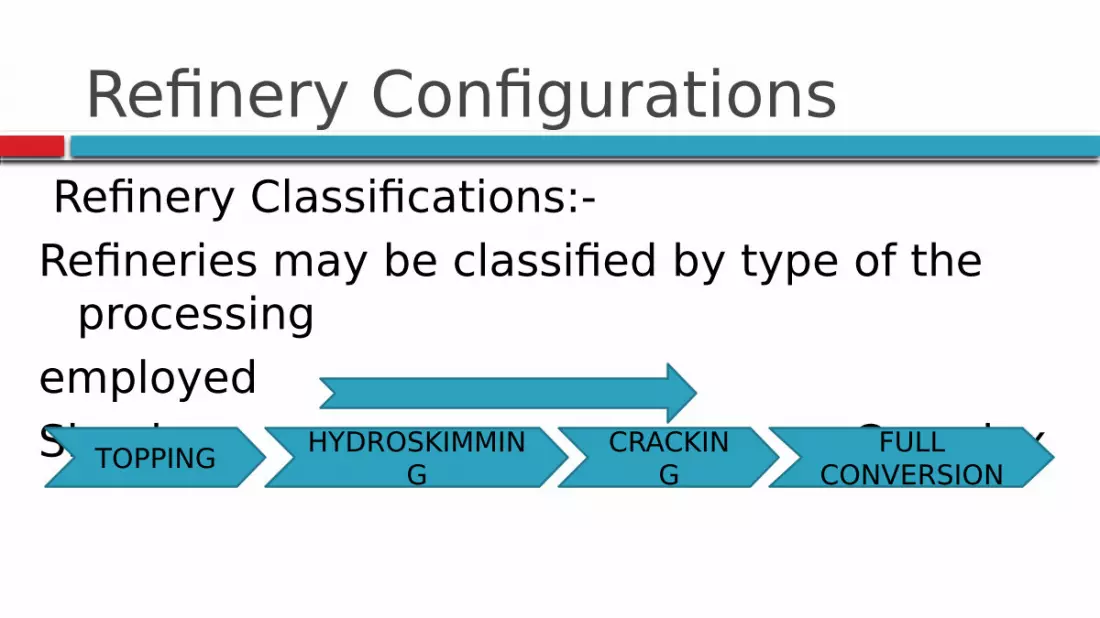
Refinery Configurations Refinery Classifications:-Refineries may be classified by type of the
processingemployed Simple ComplexTOPPING HYDROSKIMMIN
GCRACKIN
GFULL
CONVERSION

Refinery Configurations Topping Refinery Hydroskimming Refinery Cracking Refinery Full conversion Refinery Multiple Configurations

Topping Refinery Refinery
Fuel NaphthaCrude Middle
Distillate
Fuel oil
Distillatio
n

Topping Refinery The simplest refinery configuration is called the
Topping refinery It consist solely of a crude unit with no futher
processing. Most streams produced from this configuration
are not able to meet final product specifications and therefore sold as intermediates to other facilities. Topping typically make fuel oils.

Hydroskimming Refinery Refinery Fuel LPG GasolineCrude Hydrogen Low Sulfur Distil.
Fuel oil
Distill
ation
ReformerHydrotreat
er

Hydroskimming Refinery Hydroskimming refinery consists of topping unit plus
a reformer and hydrotreater. The addition of the reformer allows the
hydroskimming configuration to produce finished gasoline.
Another benefit is the production of hydrogen, which is used in the hydrotreating process. The hydrotreater allows for the sale of finished low sulfur distillate products.

Cracking Refinery (Upgraded)
Refinery Fuel LPG GasolineCrude Hydrogen Low Sulfur
Dist. Fuel oil
Distill
ation
ReformerHydrotreat
erFCC) Alky uni
Vac
Gas Plant

Cracking Refinery Cracking refinery consists of the hydrskimming
refinery plus vacuum tower and conversion unit Part of the heavy oil are recovered through the
vacuum tower and converted to light products. There are two main types of conversion units
depending on the desired product slate namely FCC unit or a hydrocracker. The FCC tends to make more gasoline by converting vacuum gas oil (VGO), but lower distillate quality.

Cracking Refinery The coupling of an alkylation with FCC unit
increases the production of high quality gasoline components by converting the olefins to high quality gasoline components.
The hydrocracker tends to use large amounts of hydrogen to make more high quality distillate products and less average quality gasoline products.

Ref. Fuel
LPG Gasoline Crude Low sulfur Distillate Coke
Distill
ation
Reformer
Hydrotreater
FCC) Alky uniVac
Gas Plant
Coking unit
Full Conversion Refinery(Deep Upgraded)

Full Conversion Refinery Full conversion refinery consists of the
cracking refinery plus heavy conversion unit to crack the remaining heavy oil to light products
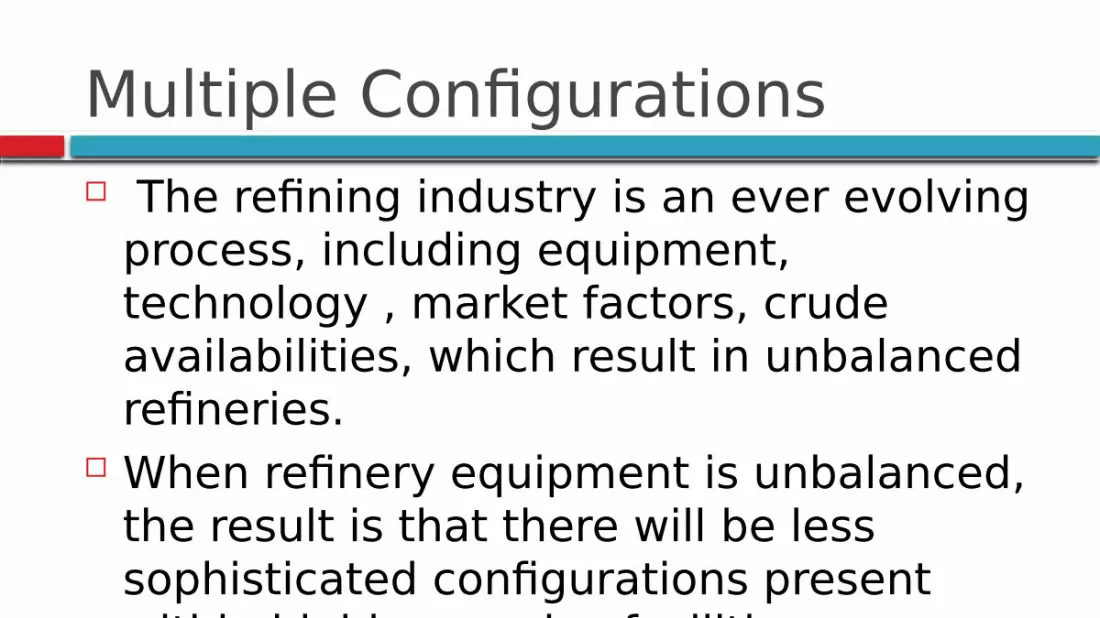
Multiple Configurations The refining industry is an ever evolving
process, including equipment, technology , market factors, crude availabilities, which result in unbalanced refineries.
When refinery equipment is unbalanced, the result is that there will be less sophisticated configurations present within highly complex facilities
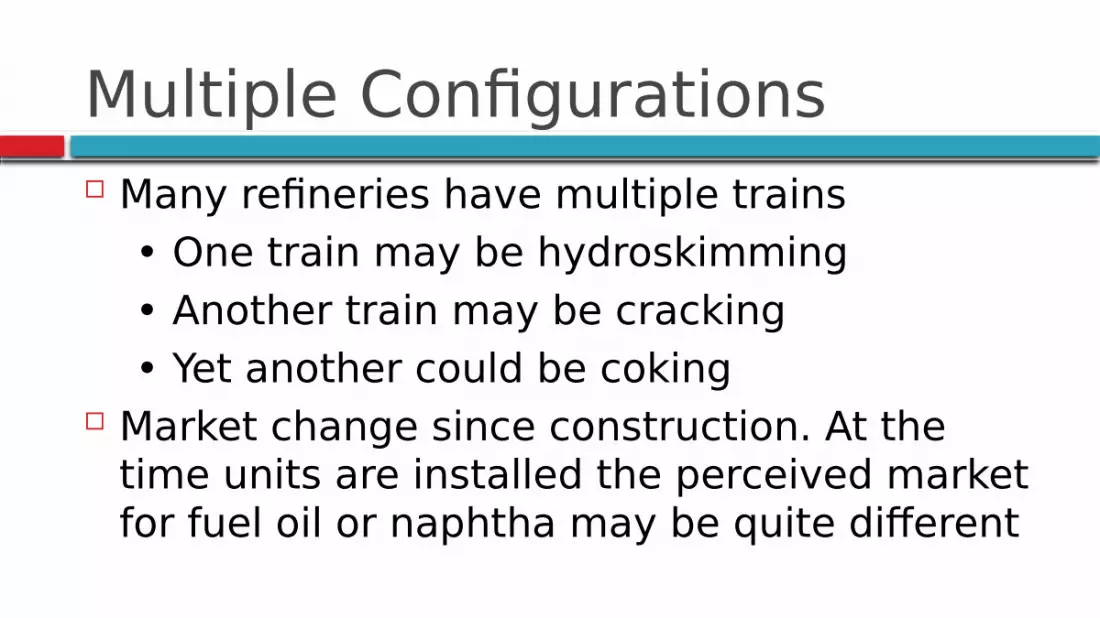
Multiple Configurations Many refineries have multiple trains • One train may be hydroskimming • Another train may be cracking • Yet another could be coking Market change since construction. At the
time units are installed the perceived market for fuel oil or naphtha may be quite different

Multiple Configurations Target crude slate changes--Units may be originally
designed for one crude with later modifications fitted to something else with different properties.
Prevailing product market-- Best fit of the refinery design to product market may call for less than maximum conversion
Refinery evolution –Most refineries are built over time with later additions that may not exactly fit all previous capacity.

Optimum Refinery Throughput Depending on product pricing, it may not be
profitable to process the least sophisticated configuration on an incremental basis
If product prices are high relative to crude, refiners will tend to use all their crude capacity
If prices of fuel oil fall, refiners will tend to run less crude so that all crude is subjected to intensive processing.

What is Complexity? Complexity is a term that many people
use, but what does it really mean? Qualitatively, complexity implies
/encompasses • Ability to process heavy sour crude oil • Upgrading in secondary equipment • Profitability
What is Complexity? Complexity was once used to compare
capital costs of refineries Complexity was coined by W.L. Nelson, a
famous authur– hence Nelson Complexity.

REFINING MARGIN The refinery operating margin
calculations depict the profit from a barrel of crude oil in terms of the value of its refined products such as gasoline, diesel, kerosene ,fuel oil etc

REFINING COSTS ($/MT)Basic Refinery or Hydroskimming5MMT/yr
Upgraded Refinery, 8MMT/yr
Deeply upgrade Refinery, 8MMT/yr
Catalysts + chemicals
2.0 2.5 3.0
Financial costs (short term)
1.0 1.0 1.0
Fuel consumption
4.0 6.0 10.0
Total Variable Costs
7.0 9.5 14.0
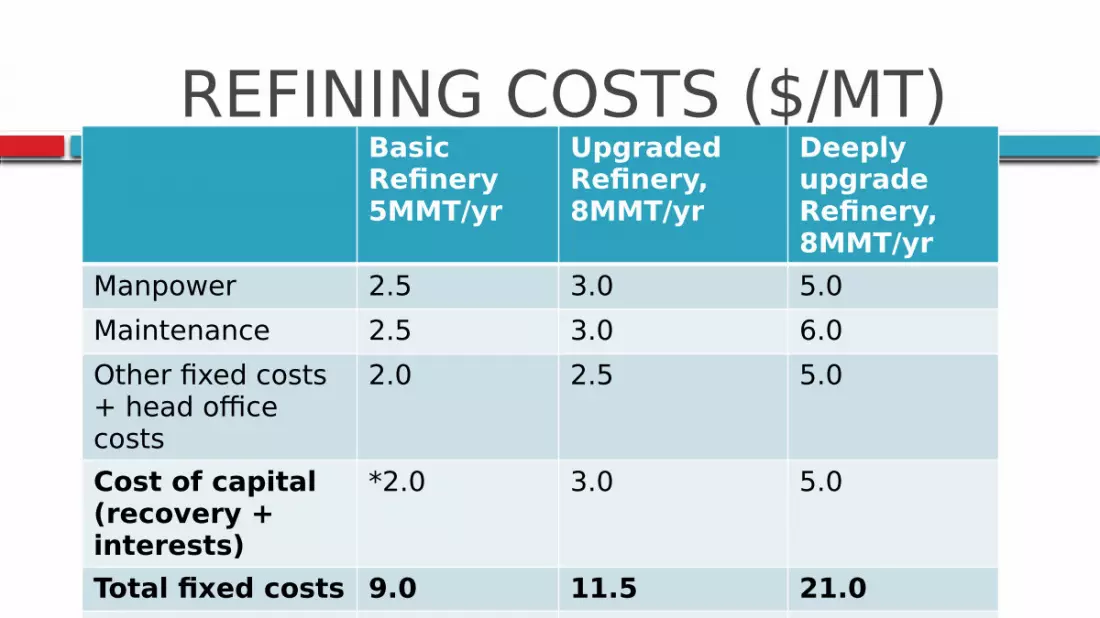
REFINING COSTS ($/MT)Basic Refinery5MMT/yr
Upgraded Refinery, 8MMT/yr
Deeply upgrade Refinery, 8MMT/yr
Manpower 2.5 3.0 5.0Maintenance 2.5 3.0 6.0Other fixed costs + head office costs
2.0 2.5 5.0
Cost of capital (recovery + interests)
*2.0 3.0 5.0
Total fixed costs 9.0 11.5 21.0Total Refining Costs *10% for a new refinery
16.0 21 35

CONTROL OF REFINING COSTS
Usually, the gross margins are dictated by the market. Costs can be controlled by the refinery through the following: Optimization of supply and products manufacturing (linear
programming) Scheduling Reduction of fuel consumption Reduction of losses Effective maintenance management Training of personnel Prudent financial management.

TYPICAL YIELD PATTERNS OF A REFINERY ON ARABIAN LIGHT
PRODUCT
YIELD % HYDROSKIMMING 5M MT/YR
YIELD% UPGRADED REFINERY (8MMT/YR)
YIELD % DEEPLY UPGRADED REFINERY (8M MT/YR)
PHRC (8MM/YR) UPGRADED REFINERY
LPG 3.25 2.50 2.0 4.0
PMS 18.75 35.31 41.0 32.0
KEROSENE
12.00 13.94 13.94 14.5
DIESEL
25.00 32.14 38.05 26
FUEL OIL
37.00 12.0 - 18

REFINERY PERFORMANCE INDICATORS, EII & UEDC Energy Intensity Index (EII) and Utilized
Equivalent Distillation Capacity (UEDC) are indices developed by Solomon Associates. Solomon has developed these indices over the years, and they have become a good means of comparing operation of different refineries with varying complexities.

ENERGY INTENSITY INDEX (EII)
The Solomon standard used in the EII calculation is the sum of the expected energy consumption for each operating process unit, taking into account how close each unit is to listed capacity, and combined with some overall plant factors covering utility supply and crude/product handling.
The EII itself is a comparison of the refinery’s actual energy consumption to this standard, expressed on a percentage basis.
The lower the EII number the better as less energy is being consumed.

UTILIZED EQUIVALENT DISTILLATION CAPACITY (UEDC)
UEDC is a measure of the refinery’s throughput capability actually being used. Like EII, measurement starts with the process units, where an individual Equivalent Distillation Capacity (EDC) is developed.
The unit EDC consists of the unit capacity multiplied by several factors designed to allow unit comparisons, and when the unit EDCs are added together and combined with a facility offsite EDC, a refinery EDC is the result.
Whereas the refinery EDC represents the full capacity of the facility, the UEDC is a measure of the percent of that capacity actually being utilized

Utilized Equivalent Distillation Capacity (UEDC)
In a refinery, Capacity Utilization relates only to the Crude Distillation unit, whereas, Utilized Equivalent Distillation Capacity relates to how well all the major complex units performed and is a better measure of refinery performance.

Refinery complexity factor The “complexity factor” of a refinery, as defined
by Nelson, is more complete but more difficult to calculate.
Each process unit is assigned a complexity factor which is the ratio between the capital expenditure per metric ton of feedstock to the unit and the capital expenditure per metric ton of feedstock for an Atmospheric distillation unit.

Refinery Complexity factor The partial complexity factor of the unit
is the product of its complexity factor multiplied by the ratio between its capacity and that of atmospheric distillation.
The overall complexity factor of the refinery is found by summing the partial complexity factors.

AN EXAMPLE OF CAPACITY UTILISATION CALCULATION SUMMARYUNIT DESIGN
CAPACITY (BPSD)
ACTUAL PLANT PERFORMANCE
CAPACITY UTILISATION (ACTUAL/DESIGN)
CDU 150,000 90,390 60.26%VDU 53,560 32,580.55 60.83%NHU 33,000 27,000.6 81.82%CRU 33,000 19,800 60.00%KHU 14,500 10,200 70,34%FCCU 40,000 28,072 70.18%

AN EXAMPLE OF UEDC CALCULATION SUMMARYUNIT DESIGN
CAPACITY (BPSD)
COMPLEXITY
PROCESS EDC
ACTUAL PLANT PERFORMANCE(BPSD)
CAPACITY UTILISATION (%)
UTILISED PROCESS EDC (UEDC)
CDU 150,000 1 150,000 90,390 60.26 90,390VDU 53,560 2 107,120 32,580.55 60.83 65,161.1NHU 33,000 2 66,000 27,000.6 81.82 54,001.2CRU 33,000 5 165,000 19,800 60.00 99,000KHU 14,500 2 29,000 10,200 70,34 20,398.6FCCU 40,000 6 240,000 28,072 70.18 168,432HFA 7,200 10 72,000 0.00 0.00 0.00DIMERSOL
4,850 10 48,500 0.00 0.00 0.00
TOTAL
877,620 497,384.9
UEDC
56.67%

An assignment Determine the UEDC using the example
shown: 1) if the CRU & NHU are the only units
not working. 2) if only the FCC unit is down.
END OF TOPIC
THANK YOU FOR LISTENING

QUESTION AND ANSWERS