real-time manned simulation of advanced terminal area
TRANSCRIPT
NASA TECHNICAL NOTE
REAL-TIME MANNED SIMULATION OF ADVANCED TERMINAL AREA GUIDANCE CONCEPTS FOR SHORT-HAUL OPERATIONS
Leonard Tobias and P a d J. O'Brien
Ames Research Center Moffett Field, Culif: 94035
TECH LIBRARY KAFB, NU
UL.34237 - 3. Recipient's Catalog No.
NASA TN D-8499 4. Title and Subtitle 5. Report Date
REAL-TIME MANNED SIMULATION O F ADVANCED TERMINAL AREA GUIDANCE CONCEPTS FOR SHORT-HAUL OPERATIONS
August 1977 6. Performing Organization Code '
7. Author(s1 I 8. Performing Organization Report No.
Leonard Tobias and Paul J. O'Brien A-6841 10. Work Unit No.
9. Performing Organization Name and Address NASA Ames Research Center, Moffett Field, Calif. 94035
National Aviation Facilities Experimental Center, Federal Aviation Administration Atlantic City, N.J. 08405
513-53-06 -~ . and 11. Contract or Grant No.
13. Type of Report and Period Covered 12. Sponsoring Agency Name and Address
National Aeronautics and Space Administration Washington, D. C. 20546
L Technical Note
I 14. Sponsoring Agency Code
- 17.
A real-time simulation was conducted of three-dimensional area navigation (3D RNAV) and four-dimensional area navigation (4D RNAV) equipped STOL aircraft operating in a high-density terminal area traffic environment in a joint FAA-NASA program. The primary objectives were to examine the effects of 3D RNAV and 4D RNAV equipped aircraft on the terminal area traffic efficiency, and to examine the performance of an air traffic control system concept and associated controller display proposed for use with advanced RNAV systems. Three types of STOL aircraft were simulated, each with different performance capabilities. FAA controllers and airline pilots participated in the investigation. System performance was measured in both the 4D mode and in a 3D mode. The 3D mode, used as a baseline, was simply the 4D mode less any time specification. The results show that communications workload in the 4D mode was reduced by about 35 percent compared to the 3D, while 35 percent more traffic was handled with the 4D. Aircraft holding time in the 4D mode was only 30 percent of that required in the 3D mode. In addition, the orderliness of traffic was improved significantly in the 4D mode. Therefore, there is a strong potential for 4D RNAV to both increase capacity and decrease fuel consumption.
Key Words (Suggested by Author(s1) Air traffic control (ATC) Real-time simulation Area navigation Time control
1 8 Distribution Statement Unlimited
STOL Strateeic control STAR Category - 03
19. Security Qanif. (of this report) 22. Rice' 21. NO. of pages 20. Security Clanif. (of this pagel
Unclassified Unclassified I 31 1 $3.75
'For sale by the National Technical information Service, Springfield, Virginia 22161

NOTICE
This document is disseminated under the joint sponsorship of the Depart- ment of Transportation and the National Aeronautics and Space Admin- istration in the interest of information exchange. The United States Government assumes no liability for its contents or use thereof.
REAL-TIME MANNED SIMULATION OF ADVANCED TERMINAL AREA
GUIDANCE CONCEPTS FOR SHORT-HAUL OPERATIONS
Leonard Tobias and Paul J. O'Brien
Ames Research Center and
Federal Aviation Administration
SUMMARY
A real-time simulation was conducted of three-dimensional area navigation (3D RNAV) and four-dimensional area navigation (4D RNAV) equipped STOL aircraft operating in a high-density terminal area traffic environment in a joint FAA-NASA program. The primary objectives were to examine the effects of 3D RNAV and 4D RNAV equipped aircraft on the terminal area traffic efficiency, and to examine the performance of an air traffic control system concept and associated controller display proposed for use with advanced RNAV systems. Three types of STOL aircraft were simulated, each with different performance capabilities. FAA controllers and airline pilots participated in the investigation. System performance was measured in both the 4D mode and in a 3D mode. The 3D mode, used as a baseline, was simply the 4D mode less any time specification. The results show that communications workload in the 4D mode was reduced by about 35 percent compared to the 3D, while 35 percent more traffic was handled with the 4D. Aircraft holding time in the 4D mode was only 30 percent of that required in the 3D mode. In addition, the orderliness of traffic was improved significantly in the 4D mode. Therefore, there is a strong potential for 4D RNAV to both increase capacity and decrease fuel consumption.
INTRODUCTION
Advanced area navigation (RNAV) concepts in high-density terminal areas are under considera- tion in an effort to increase the efficiency of terminal area operation of current and future short-haul systems. Two-dimensional (2D) RNAV systems have already proven their value outside the terminal area by allowing the pilot to fly nonstandard routes. However, simulator studies have shown that, within terminal areas with limited airspace, use of 2D RNAV can increase the controller and pilot workloads and cause delays (refs. 1 and 2). Thus, 3D RNAV (2D plus altitude) and 4D RNAV (3D plus time) are being considered to improve terminal area air traffic operations without penalties on pilot-air traffic control (ATC) communications and workload.
A joint FAA-NASA Ames program was formulated to conduct real-time simulation studies to investigate the use of 3D and 4D RNAV in terminal area operations. Both airborne and ground systems are considered. The objectives of these simulations are:
0 Examine airborne and ground interactions
0 Determine ground and airborne computer requirements
0 Obtain evaluations of system operation both from airline pilots and FAA controllers
Examine the effect of emergency and unusual stress situations on system operations
The series of studies include:
The effectiveness of 3D and 4D RNAV
0 The effect of a mix of 3D and 4D RNAV equipped aircraft as well as the effect of severe wind conditions on 3D and 4D RNAV operations
0 Fuel conservative procedures such as delayed flap approaches and profile descents
The FAA participation in this study was sponsored by Mr. Joseph P. O’Brien, Chief, FAA/SRDS ATC Terminal Branch, Washington, D.C. The NAFEC Project Work was coordinated by Mi. Felix Hierbaum under Program Area Agreement Number 14-232, and accomplished by Mr. Paul J. O’Brien under Project Number 013-1 50-050.
SIMULATION FACILITY
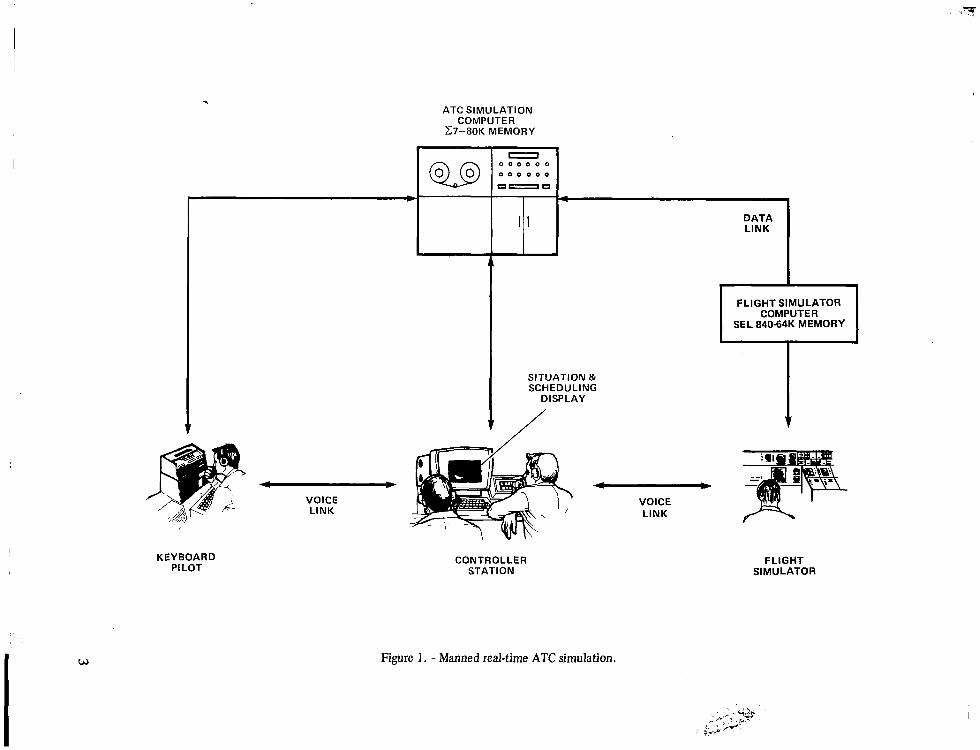
A simulation facility was developed at Ames with both pilot and traffic controller positions. Figure 1 is a block diagram of the simulation facility. The controller station has a situation and scheduling display (updated every 2 sec during real-time operation) for a single control sector and is staffed by a controller and data assistant. The flight simulator station is a fixed-based cab with pilot and copilot positions, although only the pilot position was used in this experiment. Situated remotely from the controller station, the flight simulator station is driven by its own digital computer. Controller clearances to the crew in the piloted flight simulator are transmitted via voice link, and the aircraft position is transmitted via data link to the ATC simulation computer. The piloted simulator provides the opportunity to study details of the air-ground interface in an RNAV environment. However, additional traffic is required to provide a realistic workload for the controller. The additional traffic in the experiment consists of computer-generated aircraft con- trolled from a keyboard pilot position. These aircraft are equipped to respond to the same-set of RNAV and vectoring clearances as the piloted aircraft.
The XDS Sigma 7 computer with an 80K memory was used for the main program; it was also the ground computer and onboard computer for each computer-generated aircraft. An SEL 840 computer with a 64K memory drove the piloted simulation.
SYSTEM OPERATION
The advanced terminal area RNAV system used in this study operates as follows: In the 4D mode, based on knowledge of previously scheduled aircraft and on limited knowledge of those
2
ATC SIMULATION COMPUTER
C7-80K MEMORY
I
I w
I I
.o.l 0 0 0 0 0 0
0 0 0 0 0 0
I I FLIGHT SIMULATOR COMPUTER
SEL 840-64K MEMORY
SITUATION & SCHEDULING
DISPLAY
4 b 4 b VOICE LINK
VOICE LINK
KEYBOARD PI LOT
CONTROLLER STATION
Figure 1 .- Manned real-time ATC simulation.
FLIGHT SIMULATOR
I
aircraft awaiting scheduling clearance, the controller issues a route and time clearance to a given aircraft. The pilot then enters these data into his onboard computer, which generates a time sequence of commands to descend and change heading or speed, thereby holding the aircraft on a specified route and for delivery at the specified time. The 3D mode used was the 4D mode less any time specification. In 3D, a route assignment is required when the aircraft enters the controller sector and a speed clearance can be given. These clearances can be altered as the aircraft progresses along the route.
Ground System and Procedures
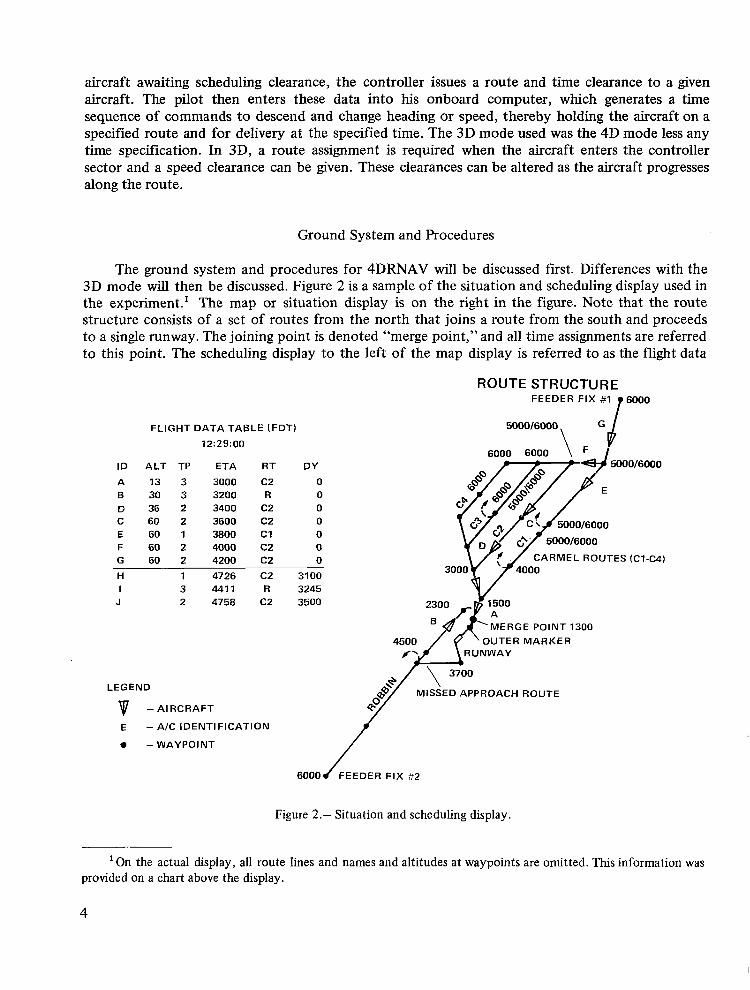
The ground system and procedures for 4DRNAV will be discussed first. Differences with the 3D mode will then be discussed. Figure 2 is a sample of the situation and scheduling display used in the experiment.’ The map or situation display is on the right in the figure. Note that the route structure consists of a set of routes from the north that joins a route from the south and proceeds to a single runway. The joining point is denoted “merge point,” and all time assignments are referred to this point. The scheduling display to the left of the map display is referred to as the flight data
FLIGHT DATA TABLE (FDT)
12:29:00
I D A L T TP ETA R T D Y
A 13 3 B 30 3 D 36 2 C 60 2 E 60 1 F 60 2 G 60 2
H 1 I 3
J 2
3000 3200 3400 3600 3800 4000 4200
4726 441 1 4758
C2 0 R 0
C2 0 C2 0 c 1 0 c2 0
~
0
C2 3100 R 3245
C2 3500
LEGEND
v - A I R C R A F T
E - AIC IDENTIFICATION
0 - WAYPOINT
ROUTE STRUCTURE
3000
MERGE POINT 1300
OUTER MARKER
MISSED APPROACH ROUTE
Figure 2.- Situation and scheduling display.
On the actual display, all route lines and names and altitudes at waypoints are omitted. This information was provided on a chart above the display.
4
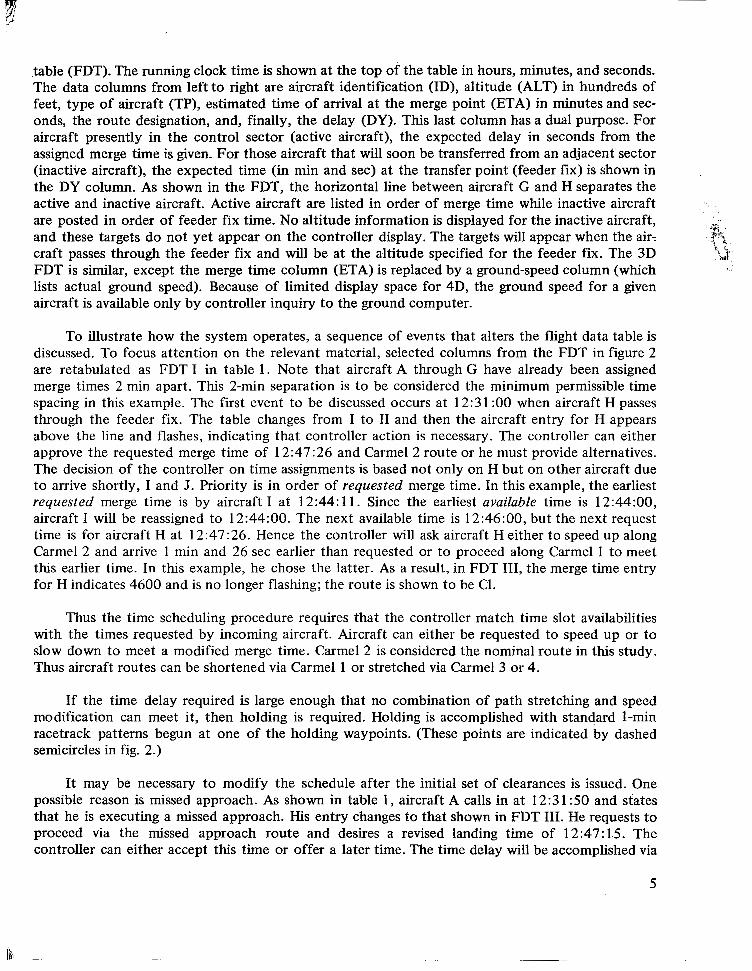
table (FDT). The running clock time is shown at the top of the table in hours, minutes, and seconds. The data columns from left to right are aircraft identification (ID), altitude (ALT) in hundreds of feet, type of aircraft (TP), estimated time of arrival at the merge point (ETA) in minutes and sec- onds, the route designation, and, finally, the delay (DY). This last column has a dual purpose. For aircraft presently in the control sector (active aircraft), the expected delay in seconds from the assigned merge time is given. For those aircraft that will soon be transferred from an adjacent sector (inactive aircraft), the expected time (in min and sec) at the transfer point (feeder fix) is shown in the DY column. As shown in the FDT, the horizontal line between aircraft G and H separates the active and inactive aircraft. Active aircraft are listed in order of merge time while inactive aircraft * .
are posted in order of feeder fix time. No altitude information is displayed for the inactive aircraft, and these targets do not yet appear on the controller display. The targets will appear when the air: h, craft passes through the feeder fix and will be at the altitude specified for the feeder fix. The 3D id: FDT is similar, except the merge time column (ETA) is replaced by a groundspeed column (which lists actual ground speed). Because of limited display space for 4D, the ground speed for a given aircraft is available only by controller inquiry to the ground computer.
,;p
3f, 1
To illustrate how the system operates, a sequence of events that alters the flight data table is discussed. To focus attention on the relevant material, selected columns from the FDT in figure 2 are retabulated as FDT I in table 1. Note that aircraft A through G have already been assigned merge times 2 min apart. This 2-min separation is to be considered the minimum permissible time spacing in this example. The first event to be discussed occurs at 12:31 :00 when aircraft H passes through the feeder fix. The table changes from I to I1 and then the aircraft entry for H appears above the line and flashes, indicating that controller action is necessary. The controller can either approve the requested merge time of 12:47:26 and Carmel 2 route or he must provide alternatives. The decision of the controller on time assignments is based not only on H but on other aircraft due to arrive shortly, I and J . Priority is in order of requested merge time. In this example, the earliest requested merge time is by aircraft I at 12:44: 11. Since the earliest available time is 12:44:00, aircraft I will be reassigned to 12:44:00. The next available time is 12:46:00, but the next request time is for aircraft H at 12:47:26. Hence the controller will ask aircraft H either to speed up along Carmel 2 and arrive 1 min and 26 sec earlier than requested or to proceed along Carmel 1 to meet this earlier time. In this example, he chose the latter. As a result, in FDT 111, the merge time entry for H indicates 4600 and is no longer flashing; the route is shown to be C1.
Thus the time scheduling procedure requires that the controller match time slot availabilities with the times requested by incoming aircraft. Aircraft can either be requested to speed up or to slow down to meet a modified merge time. Carmel 2 is considered the nominal route in this study. Thus aircraft routes can be shortened via Carmel 1 or stretched via Carmel 3 or 4.
If the time delay required is large enough that no combination of path stretching and speed modification can meet it, then holding is required. Holding is accomplished with standard 1-min racetrack patterns begun at one of the holding waypoints. (These points are indicated by dashed semicircles in fig. 2.)
It may be necessary to modify the schedule after the initial set of clearances is issued. One possible reason is missed approach. As shown in table 1, aircraft A calls in at 12:3 1 :50 and states that he is executing a missed approach. His entry changes to that shown in FDT 111. He requests to proceed via the missed approach route and desires a revised landing time of 12:47:1.5. The contrdler can either accept this time or offer a later time. The time delay will be accomplished via
5
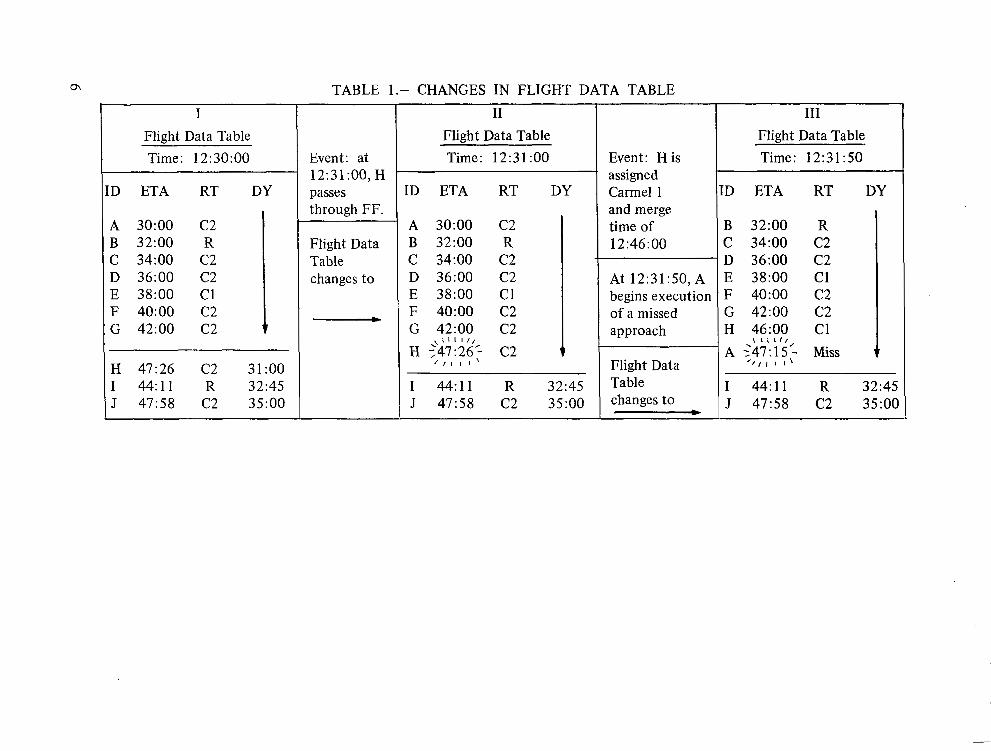
TABLE 1.- CHANGES IN FLIGHT DATA TABLE
I Flight Data Table Time: 12:30:00
D ETA RT DY
A 30:OO C2 B 32:OO R C 34:OO C2 D 36:OO C2 E 38:OO C1 F 40:OO C2 G 42:OO C2
H 47:26 C2 31:OO I 44:11 R 32:45 J 47:58 C2 35:OO
Event: at 12:31:00, H passes through FF.
~
Flight Data Table changes to
-
I1 Flight Data Table Time: 12:31:00
ID ETA RT DY
A 30:OO C2 B 32:OO R C 34:OO C2 D 36:OO C2 E 38:OO C1 F 40:OO C2 G 42:OO C2 H ;47:26' C2 v
I 44 : l l R 32:45 J 47:58 C2 35:OO
\, I I I I I ,
/ I 1 I I '
Event: H is assigned Carmel 1 and merge time of 12:46:00
At 12:31:50, A begins execution of a missed approach
Flight Data Table changes to -
111 Flight Data Table Time: 12:31:50
ID ETA RT DY
B 32:OO C 34:OO D 36:OO E 38:OO F 40:OO G 42:OO H 46:OO
\ L I 1 I , ,
A <47:15- ' / , I 1 I '
R c 2 c 2 c1 c 2 c 2 c 1 Miss
I 4 4 : l l R 32:45 J 47:58 C2 35:OO
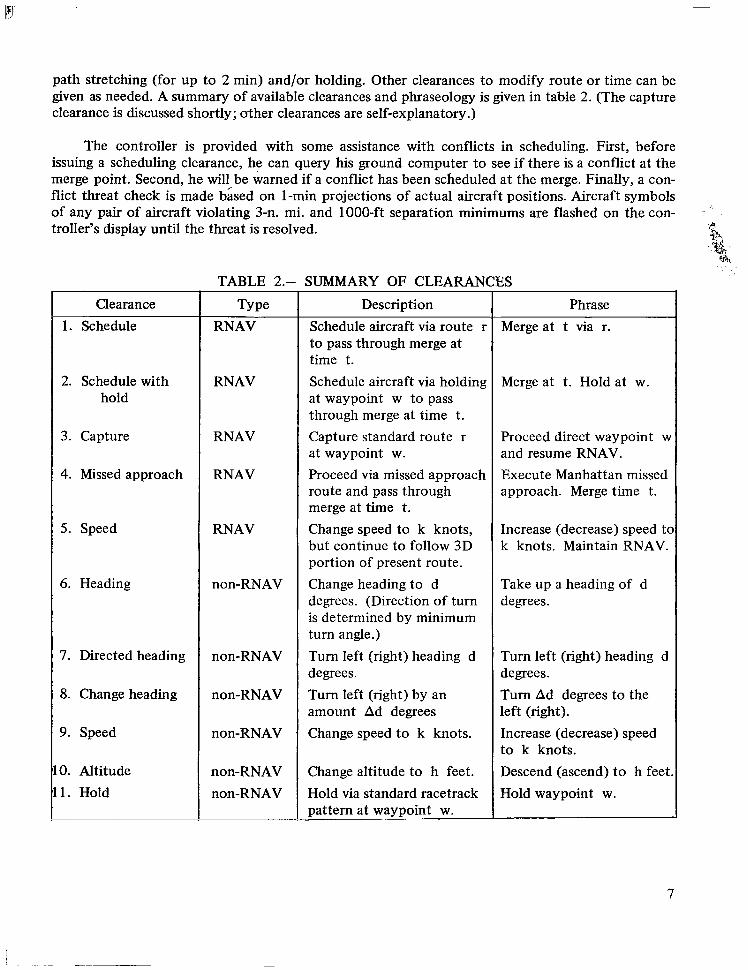
path stretching (for up to 2 min) and/or holding. Other clearances to modify route or time can be given as needed. A summary of available clearances and phraseology is given in table 2. (The capture clearance is discussed shortly; other clearances are self-explanatory.)
The controller is provided with some assistance with conflicts in scheduling. First, before issuing a scheduling clearance, he can query his ground computer to see if there is a conflict at the merge point. Second, he will be warned if a conflict has been scheduled at the merge. Finally, a con- flict threat check is made bked on 1-min projections of actual aircraft positions. Aircraft symbols of any pair of aircraft violating 3-n. mi. and 1000-ft separation minimums are flashed on the con- :
troller's display until the threat is resolved.
TABLE 2.- SUMMARY OF CLEARANCES
I Clearance 1. Schedule
2. Schedule with hold
3. Capture
4. Missed approach
5 . Speed
6. Heading
7. Directed heading
8. Change heading
9. Speed
10. Altitude 11. Hold "
RNAV
RNAV
RNAV
RNAV
RNAV
non-RNAV
non-RNAV
non-RNAV
non-RNAV
non-RNAV non-RNAV
Description Schedule aircraft via route r to pass through merge at time t. Schedule aircraft via holding at waypoint w to pass through merge at time t. Capture standard route r at waypoint w. Proceed via missed approach route and pass through merge at time t .
Change speed to k knots, but continue to follow 3D portion of present route. Change heading to d degrees. (Direction of turn is determined by minimum turn angle.) Turn left (right) heading d degrees. Turn left (right) by an amount Ad degrees Change speed to k knots.
Change altitude to h feet. Hold via standard racetrack pattern at waypoint w.
Phrase Merge at t via r.
Merge at t. Hold at w.
Proceed direct waypoint u and resume RNAV. Execute Manhattan missed approach. Merge time t.
Increase (decrease) speed tc k knots. Maintain RNAV.
Take up a heading of d degrees.
Turn left (right) heading d degrees. Turn Ad degrees to the left (right). Increase (decrease) speed to k knots. Descend (ascend) to h feet Hold waypoint w.
7
l I l l l l l I l l l I l I l l l II I I I I I I I I I I I II 111
The display format for the 3D mode differed only in that a ground-speed column was substituted for the ETA column. However, the resultant procedures for controlling traffic were quite different. No ground-computer generated assists were available in the 3D mode used. Con- trollers were instructed to maximize the flow through the merge, but to maintain the 3-n. mi. and 1000-ft separation minimum. Thus, in the 3D mode, controllers adopted strategies of control similar to those used in a radar vector environment. Aircraft were cleared along standard routes as they passed the feeders, but paths and speeds were altered as it became clear to the controller what slot the aircraft would occupy at the merge point.
Airborne System and Procedures
In the 4D mode, the simulator pilot or keyboard pilot enters the controller specified route and/or merge time into an onboard computer that consecutively generates the required horizontal trajectory, altitude profile, and speed profile. The horizontal trajectory consists of straight lines and circular arcs and requires for its construction the waypoint coordinates and radii of circular segments used to transition between straight segments. The choice of altitude and speed profiles is consistent with accepted pilot practice for the type of aircraft simulated. The length of the horizontal path together with the altitude difference between adjacent waypoints is used to determine a constant flight-path angle between the waypoints. Then, maximum and minimum times to traverse the flight path are computed based on the terminal area airspeed envelope of each type of aircraft. Any controller-specified time to merge that lies within these limits can be used as input to the system and is used by the algorithm to generate the required speed profile consisting of constant speed and constant acceleration segments.
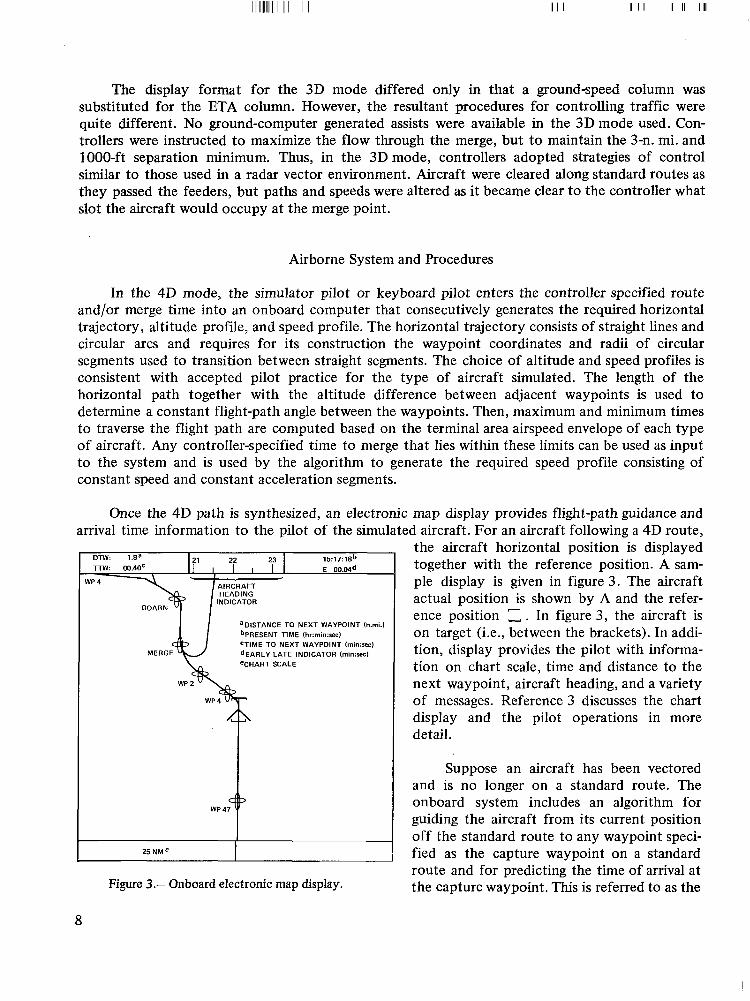
Once the 4D path is synthesized, an electronic map display provides flight-path guidance and arrival time information to the pilot of the simulated aircraft. For an aircraft following a 4D route,
DTW: l .Ea
HEADING
aDISTANCE TO NEXT WAYPOINT (n.mi.1 bPRESENT TIME Ihr:min:rec) =TIME TO NEXT WAYPOINT hin:rec ) ~ E A R L Y - L A T E INDICATOR (min:rec) eCHART SCALE
wp2\
I 25 NMe I Figure 3.- Onboard electronic map display.
8
the aircraft horizontal position is displayed together with the reference position. A sam- ple display is given in figure 3. The aircraft actual position is shown by A and the refer- ence position - . In figure 3, the aircraft is on target (i.e., between the brackets). In addi- tion, display provides the pilot with informa- tion on chart scale, time and distance to the next waypoint, aircraft heading, and a variety of messages. Reference 3 discusses the chart display and the pilot operations in more detail.
-
Suppose an aircraft has been vectored and is no longer on a standard route. The onboard system includes an algorithm for guiding the aircraft from its current position off the standard route to any waypoint speci- fied as the capture waypoint on a standard route and for predicting the time of arrival at the capture waypoint. This is referred to as the
“capture maneuver.”. In the capture mode, every 2 sec the aircraft onboard system generates a capture trajectory and predicted capture times from its current location, heading, and speed. If, on occasion, larger delays are needed than are available with airspeed profile shaping along a specified 3D path, the capture mode permits the pilot t o fly arbitrary delay maneuvers (including a holding pattern) away from the reference path until the predicted arrival time equals the desired one. Note that there are stringent requirements on computing a feasible capture maneuver. At the capture waypoint, the aircraft must achieve the altitude and heading and must be within the airspeed range specified at that waypoint. If, at any time, operational constraints do not permit a capture from the current state, the pilot receives a message on his electronic display chart explaining why capture is not possible. At any time when a capture is feasible, the pilot can elect to track the capture route drawn on his display, which returns him to the 4D RNAV mode. Additional details on the above synthesis procedures are given in references 4 and 5. Flight-test results of this 4D system are discussed in reference 6.
I . .’ . .
, ..
DESCRIPTION OF EXPERIMENT
Scenario
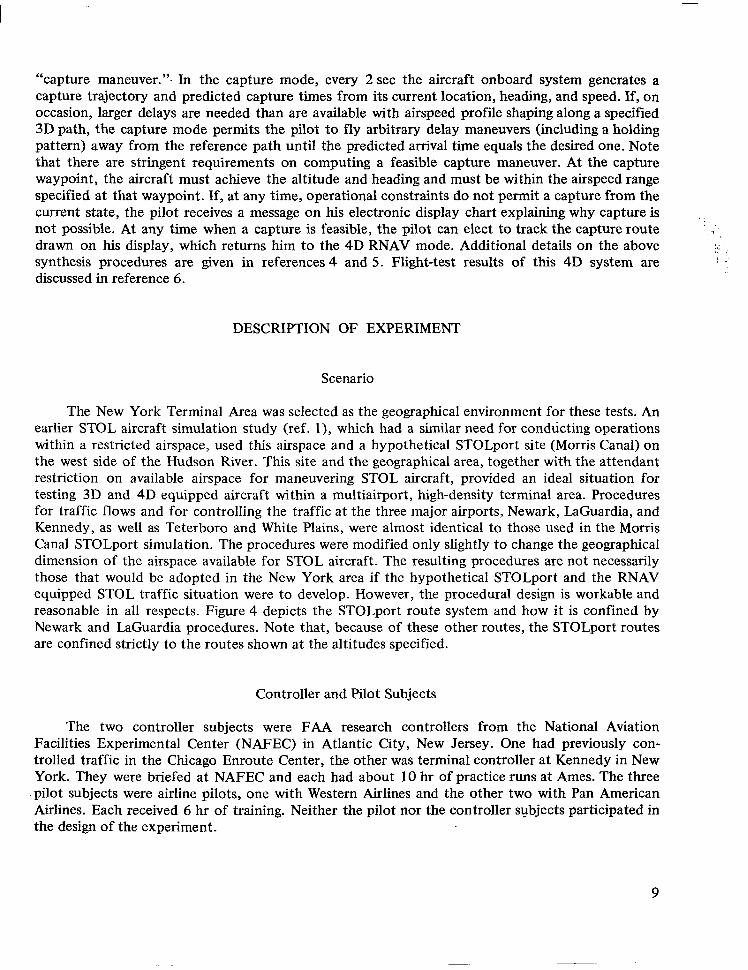
The New York Terminal Area was selected as the geographical environment for these tests. An earlier STOL aircraft simulation study (ref. I ) , which had a similar need for conducting operations within a restricted airspace, used this airspace and a hypothetical STOLport site (Morris Canal) on the west side of the Hudson River. This site and the geographical area, together with the attendant restriction on available airspace for maneuvering STOL aircraft, provided an ideal situation for testing 3D and 4D equipped aircraft within a multiairport, high-density terminal area. Procedures for traffic flows and for controlling the traffic at the three major airports, Newark, LaGuardia, and Kennedy, as well as Teterboro and White Plains, were almost identical to those used in the Morris Canal STOLport simulation. The procedures were modified only slightly to change the geographical dimension of the airspace available for STOL aircraft. The resulting procedures are not necessarily those that would be adopted in the New York area if the hypothetical STOLport and the RNAV equipped STOL traffic situation were to develop. However, the procedural design is workable and reasonable in all respects. Figure 4 depicts the STOLport route system and how it is confined by Newark and LaGuardia procedures. Note that, because of these other routes, the STOLport routes are confined strictly to the routes shown at the altitudes specified.
Controller and Pilot Subjects
The two controller subjects were FAA research controllers from the National Aviation Facilities Experimental Center (NAFEC) in Atlantic City, New Jersey. One had previously con- trolled traffic in the Chicago Enroute Center, the other was terminal controller at Kennedy in New York. They were briefed at NAFEC and each had about 10 hr of practice runs at Ames. The three pilot subjects were airline pilots, one with Western Airlines and the other two with Pan American Airlines. Each received 6 hr of training. Neither the pilot nor the controller subjects participated in the design of the experiment.
9
Figure 4.- STOLport routes with selected Newark, LaGuardia, and Kennedy routes.
10
Route Structure
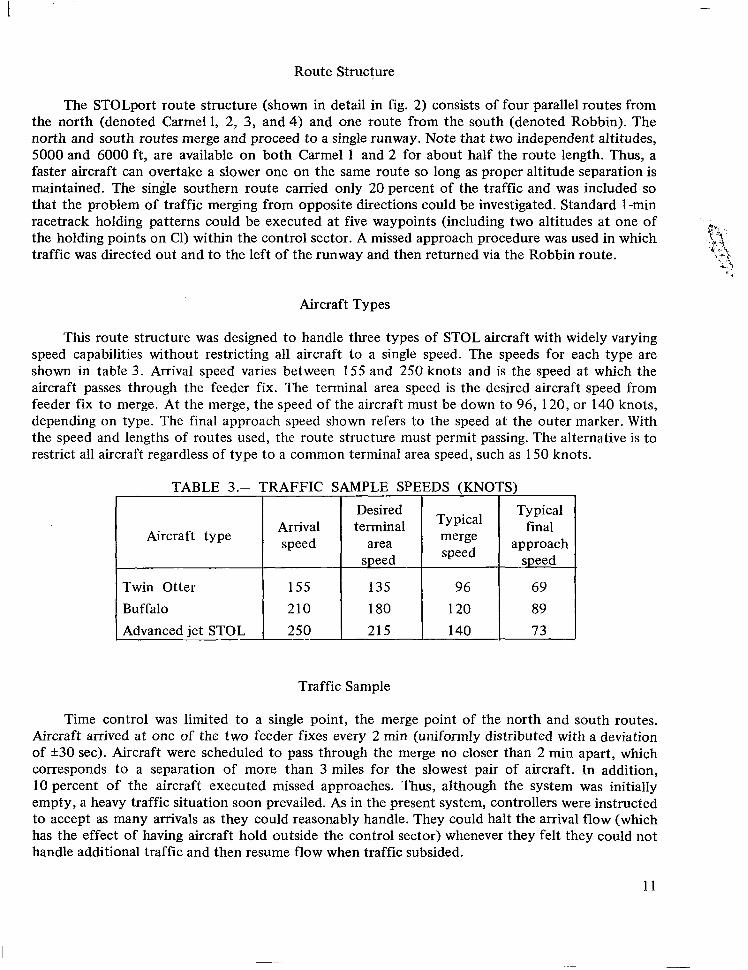
The STOLport route structure (shown in detail in fig. 2) consists of four parallel routes from the north (denoted Carmel 1, 2, 3, and 4) and one route from the south (denoted Robbin). The north and south routes merge and proceed to a single runway. Note that two independent altitudes, 5000 and 6000 ft, are available on both Carmel 1 and 2 for about half the route length. Thus, a faster aircraft can overtake a slower one on the same route so long as proper altitude separation is maintained. The sinde southern route carried only 20 percent of the traffic and was included so that the problem of traffic merging from opposite directions could be investigated. Standard 1-min racetrack holding patterns could be executed at five waypoints (including two altitudes at one of the holding points on C1) within the control sector. A missed approach procedure was used in which traffic was directed out and to the left of the runway and then returned via the Robbin route.
Aircraft Types
This route structure was designed to handle three types of STOL aircraft with widely varying speed capabilities without restricting all aircraft to a single speed. The speeds for each type are shown in table 3. Arrival speed varies between 155 and 250 knots and is the speed at which the aircraft passes through the feeder fix. The terminal area speed is the desired aircraft speed from feeder fix to merge. At the merge, the speed of the aircraft must be down to 96, 120, or 140 knots, depending on type. The final approach speed shown refers to the speed at the outer marker. With the speed and lengths of routes used, the route structure must permit passing. The alternative is to restrict all aircraft regardless of type to a common terminal area speed, such as 150 knots.
Desired Typical merge speed
Aircraft type speed
TABLE 3.- TRAFFIC SAMPLE SPEEDS (KNOTS)
"----I I Twin Otter 155 1 ::i I 96 Buffalo 210 120 Advanced jet STOL 250 215 140
- I
Typical final
approach speed
69 89 73
Traffic Sample
Time control was limited to a single point, the merge point of the north and south routes. Aircraft arrived at one of the two feeder fixes every 2 min (uniformly distributed with a deviation of *30 sec). Aircraft were scheduled to pass through the merge no closer than 2 min apart, which corresponds to a separation of more than 3 miles for the slowest pair of aircraft. In addition, 10 percent of the aircraft executed missed approaches. Thus, although the system was initially empty, a heavy traffic situation soon prevailed. As in the present system, controllers were instructed to accept as many arrivals as they could reasonably handle. They could halt the arrival flow (which has the effect of having aircraft hold outside the control sector) whenever they felt they could not handle additional traffic and then resume flow when traffic subsided.
11
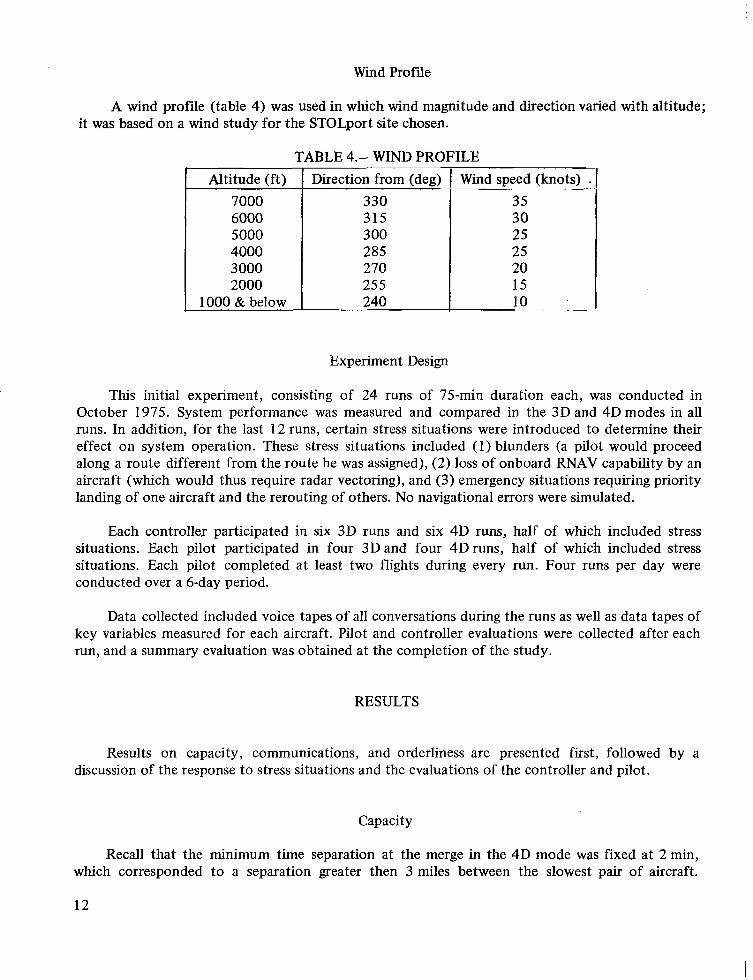
Wind Profile
A wind profile (table 4) was used in which wind magnitude and direction varied with altitude; it was based on a wind study for the STOLport site chosen.
TABLE 4.- WIND PROFILE
Altitude (ft) Direction from (deg) 7000
285 4000 300 5000 315 6000 330
255 2000 270 3000
1000 & below 240
.~ .~ . . Wind speed (knots) .
35 30 25 25 20 15 10 __
Experiment Design
This initial experiment, consisting of 24 runs of 75-min duration each, was conducted in October 1975. System performance was measured and compared in the 3D and 4D modes in all runs. In addition, for the last 12 runs, certain stress situations were introduced to determine their effect on system operation. These stress situations included (1) blunders (a pilot would proceed along a route different from the route he was assigned), (2) loss of onboard RNAV capability by an aircraft (which would thus require radar vectoring), and (3) emergency situations requiring priority landing of one aircraft and the rerouting of others. No navigational errors were simulated.
Each controller participated in six 3D runs and six 4D runs, half of which included stress situations. Each pilot participated in four 3D and four 4D runs, half of which included stress situations. Each pilot completed at least two flights during every run. Four runs per day were conducted over a 6-day period.
Data collected included voice tapes of all conversations during the runs as well as data tapes of key variables measured for each aircraft. Pilot and controller evaluations were collected after each run, and a summary evaluation was obtained at the completion of the study.
RESULTS
Results on capacity, communications, and orderliness are presented first, followed by a discussion of the response to stress situations and the evaluations of the controller and pilot.
Capacity
Recall that the minimum time separation at the merge in the 4D mode was fixed at 2 min, which corresponded to a separation greater then 3 miles between the slowest pair of aircraft.
12
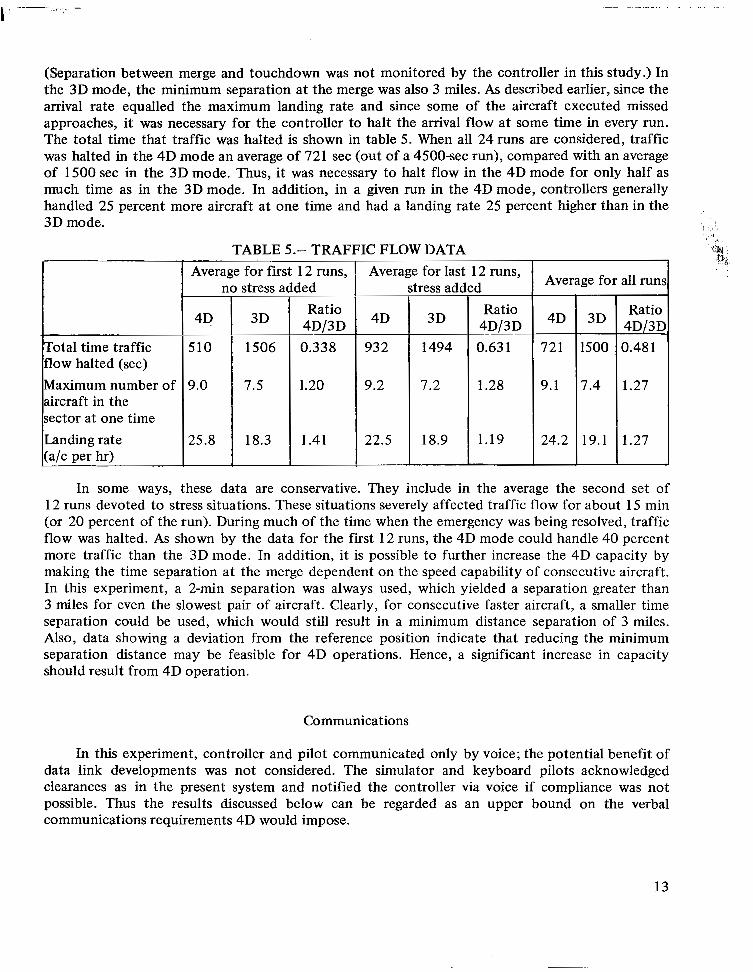
(Separation between merge and touchdown was not monitored by the controller in this study.) In the 3D mode, the minimum separation at the merge was also 3 miles. As described earlier, since the arrival rate equalled the maximum landing rate and since some of the aircraft executed missed approaches, it was necessary for the controller to halt the amval flow at some time in every run. The total time that traffic was halted is shown in table 5. When all 24 runs are considered, traffic was halted in the 4D mode an average of 721 sec (out of a 4500-sec run), compared with an average of 1500 sec in the 3D mode. Thus, it was necessary to halt flow in the 4D mode for only half as much time as in the 3D mode. In addition, in a given run in the 4D mode, controllers generally handled 25 percent more aircraft at one time and had a landing rate 25 percent higher than in the 3D mode.
TABLE 5.- TRAFFIC FLOW DATA
T Total time traffic flow halted (sec) Maximum number of aircraft in the sector at one time Landing rate - (a/c per hr)
-
Average for first 12 runs, no stress added r
Ratio 4D/3D 0.338 "~
1.20
1.41
Average for last 12 runs, stress added
4D
93 2
9.2
22.5
+F Ratio
7.2 1.28
18.9 1.19
, x I : .
1 ' , 11
Average for all runs I 4D
721
9.1
24.2
-
3D
I500
7.4
19.1
Ratio
0.48 1
1.27
In some ways, these data are conservative. They include in the average the second set of 12 runs devoted to stress situations. These situations severely affected traffic flow for about 15 min (or 20 percent of the run). During much of the time when the emergency was being resolved, traffic flow was halted. As shown by the data for the first 12 runs, the 4D mode could handle 40 percent more traffic than the 3D mode. In addition, it is possible to further increase the 4D capacity by making the time separation at the merge dependent on the speed capability of consecutive aircraft. In this experiment, a 2-min separation was always used, which yielded a separation greater than 3 miles for even the slowest pair of aircraft. Clearly, for consecutive faster aircraft, a smaller time separation could be used, which would still result in a minimum distance separation of 3 miles. Also, data showing a deviation from the reference position indicate that reducing the minimum separation distance may be feasible for 4D operations. Hence, a significant increase in capacity should result from 4D operation.
Communications
In this experiment, controller and pilot communicated only by voice; the potential benefit of data link developments was not considered. The simulator and keyboard pilots acknowledged clearances as in the present system and notified the controller via voice if compliance was not possible. Thus the results discussed below can be regarded as an upper bound on the verbal communications requirements 4D would impose.
13
I
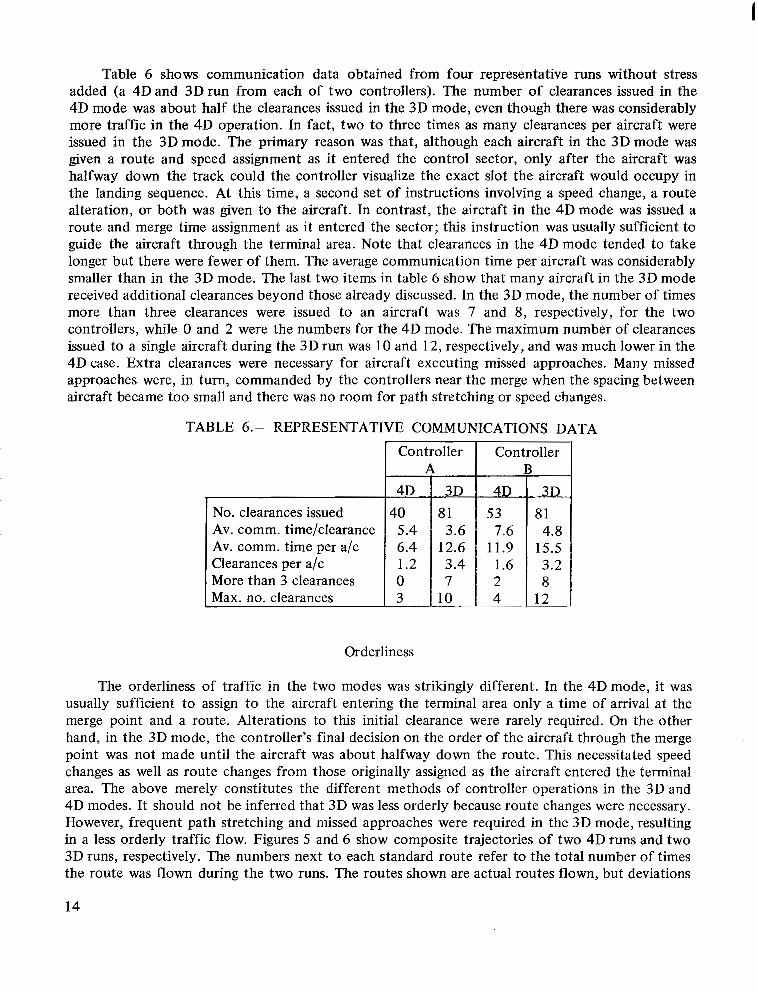
Table 6 shows communication data obtained from four representative runs without stress added (a 4D and 3D run from each of two controllers). The number of clearances issued in the 4D mode was about half the clearances issued in the 3D mode, even though there was considerably more traffic in the 4D operation. In fact, two to three times as many clearances per aircraft were issued in the 3D mode. The primary reason was that, although each aircraft in the 3D mode was given a route and speed assignment as it entered the control sector, only after the aircraft was halfway down the track could the controller visualize the exact slot the aircraft would occupy in the landing sequence. At this time, a second set of instructions involving a speed change, a route alteration, or both was given to the aircraft. In contrast, the aircraft in the 4D mode was issued a route and merge time assignment as it entered the sector; this instruction was usually sufficient to guide the aircraft through the terminal area. Note that clearances in the 4 D mode tended to take longer but there were fewer of them. The average communication time per aircraft was considerably smaller than in the 3D mode. The last two items in table 6 show that many aircraft in the 3D mode received additional clearances beyond those already discussed. In the 3D mode, the number of times more than three clearances were issued to an aircraft was 7 and 8, respectively, for the two controllers, while 0 and 2 were the numbers for the 4D mode. The maximum number of clearances issued to a single aircraft during the 3D run was 10 and 12, respectively, and was much lower in the 4D case. Extra clearances were necessary for aircraft executing missed approaches. Many missed approaches were, in turn, commanded by the controllers near the merge when the spacing between aircraft became too small and there was no room for path stretching or speed changes.
TABLE 6.- REPRESENTATIVE COMMUNICATIONS DATA
Controller A
4D 3D No. clearances issued
3 Max. no. clearances 7 0 More than 3 clearances 3.4 1.2 Clearances per a/c
12.6 6.4 Av. comm. time per a/c 3.6 5.4 ~ Av. comm. time/clearance
81 40
10"
Orderliness
Controller
3.2
12 "" ~
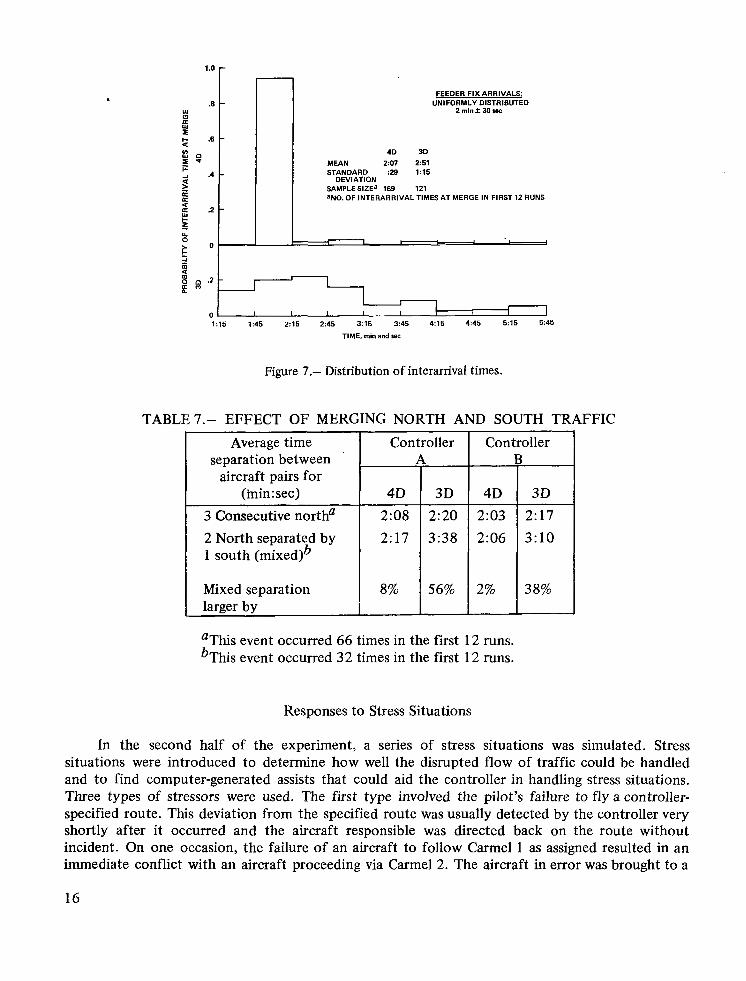
The orderliness of traffic in the two modes was strikingly different. In the 4D mode, it was usually sufficient to assign to the aircraft entering the terminal area only a time of arrival at the merge point and a route. Alterations to this initial clearance were rarely required. On the other hand, in the 3D mode, the controller's final decision on the order of the aircraft through the merge point was not made until the aircraft was about halfway down the route. This necessitated speed changes as well as route changes from those originally assigned as the aircraft entered the terminal area. The above merely constitutes the different methods of controller operations in the 3D and 4D modes. It should not be inferred that 3D was less orderly because route changes were necessary. However, frequent path stretching and missed approaches were required in the 3D mode, resulting in a less orderly traffic flow. Figures 5 and 6 show composite trajectories of two 4D runs and two 3D runs, respectively. The numbers next to each standard route refer to the total number of times the route was flown during the two runs. The routes shown are actual routes flown, but deviations
14
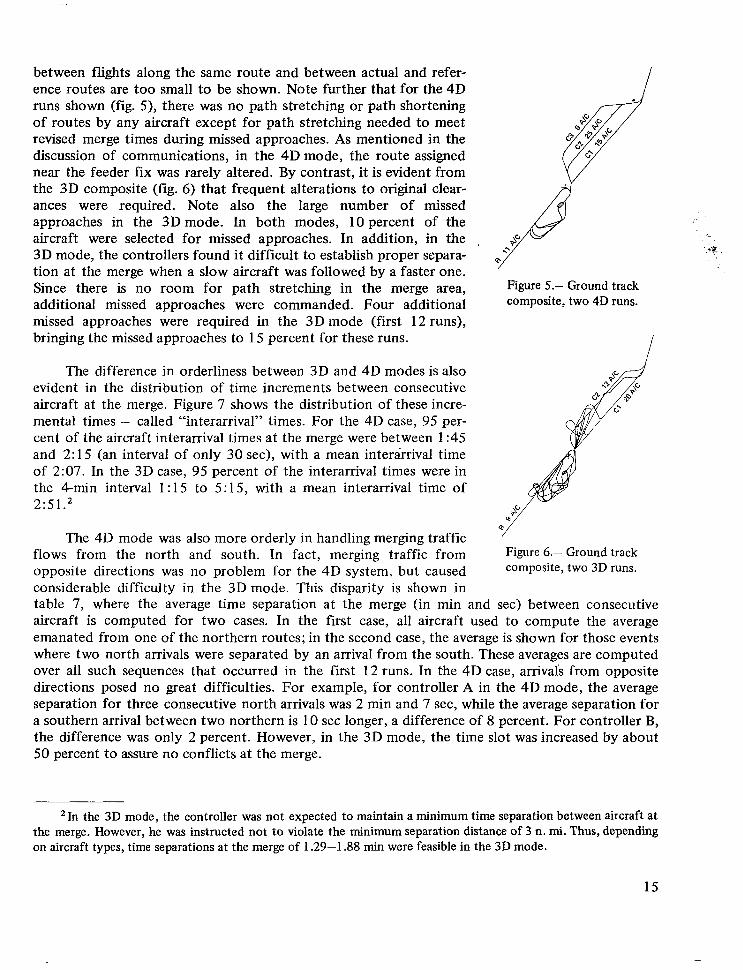
between flights along the same route and between actual and refer- ence routes are too small to be shown. Note further that for the 4D runs shown (fig. 5), there was no path stretching or path shortening of routes by any aircraft except for path stretching needed to meet revised merge times during missed approaches. As mentioned in the discussion of communications, in the 4D mode, the route assigned near the feeder fix was rarely altered. By contrast, it is evident from the 3D composite (fig. 6 ) that frequent alterations to original clear- ances were required. Note also the large number of missed approaches in the 3D mode. In both modes, 10 percent of the aircraft were selected for missed approaches. In addition, in the 3D mode, the controllers found it difficult to establish proper separa- tion at the merge when a slow aircraft was followed by a faster one. Since there is no room for path stretching in the merge area, additional missed approaches were commanded. Four additional missed approaches were required in the 3D mode (first 12 runs), bringing the missed approaches to 15 percent for these runs.
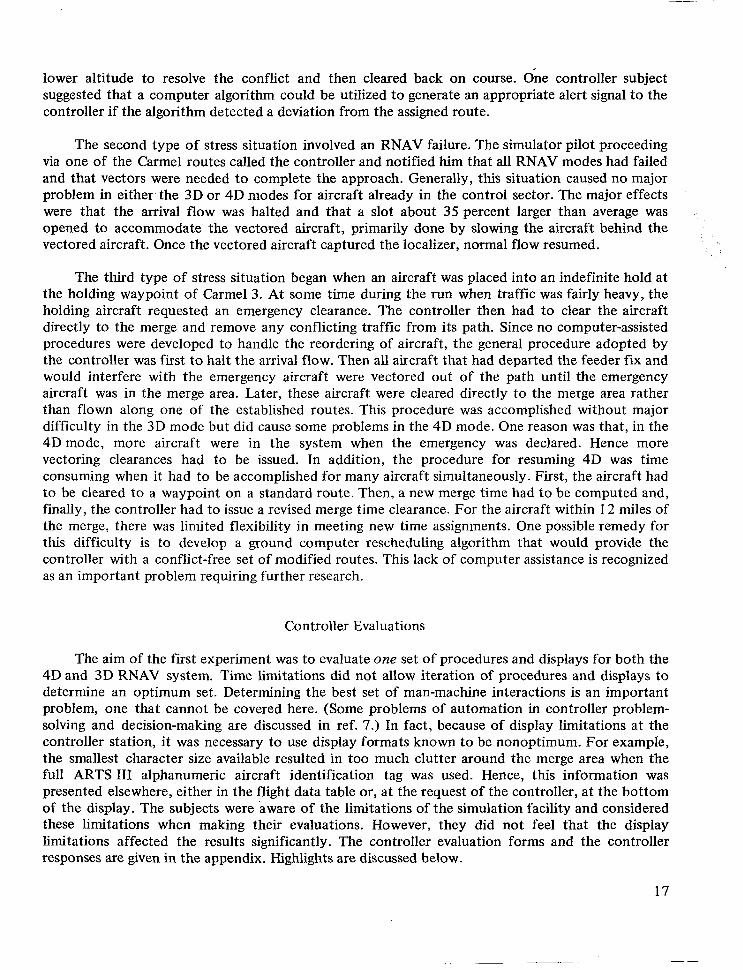
The difference in orderliness between 3D and 4D modes is also evident in the distribution of time increments between consecutive aircraft at the merge. Figure 7 shows the distribution of these incre- mental times - called “interarrival” times. For the 4D case, 95 per- cent of the aircraft interarrival times at the merge were between 1 :45 and 2: 15 (an interval of only 30 sec), with a mean interarrival time of 2:07. In the 3D case, 95 percent of the interarrival times were in the 4-min interval 1 : 15 to 5: 15, with a mean interarrival time of 2:51.’
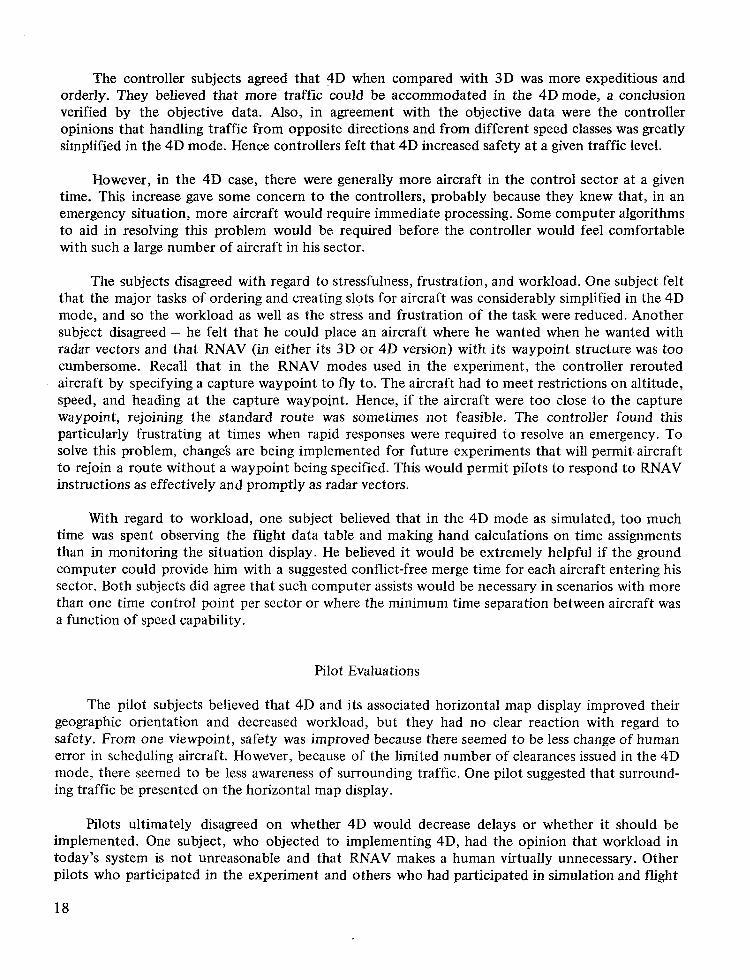
The 4D mode was also more orderly in handling merging traffic flows from the north and south. In fact, merging traffic from opposite directions was no problem for the 4D system, but caused considerable difficulty in the 3D mode. This disparity is shown in
Figure 5.- Ground track composite, two 4D runs.
Figure 6.- Ground track composite, two 3D runs.
table 7, where the average time separation at the merge (in min and sec) between consecutive aircraft is computed for two cases. In the first case, all aircraft used to compute the average emanated from one of the northern routes; in the second case, the average is shown for those events where two north arrivals were separated by an arrival from the south. These averages are computed over all such sequences that occurred in the first 12 runs. In the 4D case, arrivals from opposite directions posed no great difficulties. For example, for controller A in the 4D mode, the average separation for three consecutive north arrivals was 2 min and 7 sec, while the average separation for a southern arrival between two northern is 10 sec longer, a difference of 8 percent. For controller B, the difference was only 2 percent. However, in the 3D mode, the time slot was increased by about 50 percent to assure no conflicts at the merge.
‘In the 3D mode, the controller was not expected to maintain a minimum time separation between aircraft at the merge. However, he was instructed not to violate the minimum separation distance of 3 n. mi. Thus, depending on aircraft types, time separations at the merge of 1.29-1.88 min were feasible in the 3D mode.
15
UNIFORMLY DISTRIBUTED FEEDER FIX ARRIVALS
2rninf30wc
4 0 3 0
MEAN 2 0 7 2 5 1 STANDARD :29 1:15
SAMPLESIZE' 169 121 "NO. OF INTERARRIVAL TIMES AT MERGE IN FIRST 12 RUNS
DEVIATION
0 0 1:15 1:45 2 1 5 2:45 3:lS 3 4 5 4 1 5 4:45 5 1 5 5:45
TIME, min and sec
Figure 7.- Distribution of interarrival times.
TABLE 7.- EFFECT OF MERGING NORTH AND SOUTH TRAFFIC
Controller separation between
aircraft pairs for
3 Consecutive north'
I south (mixed)b 3:38 2:17 2 North separated by 2:20 2:08
Mixed separation 8% 56% larger by
f Controller
2:03 2:17 2:06 3:lO
'This event occurred 66 times in the first 12 runs. bThis event occurred 32 times in the first 12 runs.
Responses to Stress Situations
In the second half of the experiment, a series of stress situations was simulated. Stress situations were introduced to determine how well the disrupted flow of traffic could be handled and to find computer-generated assists that could aid the controller in handling stress situations. Three types of stressors were used. The first type involved the pilot's failure to fly a controller- specified route. This deviation from the specified route was usually detected by the controller very shortly after it occurred and the aircraft responsible was directed back on the route without incident. On one occasion, the failure of an aircraft to follow Carmel 1 as assigned resulted in an immediate conflict with an aircraft proceeding via Carmel2. The aircraft in error was brought to a
16
lower altitude to resolve the conflict and then cleared back on course. One controller subject suggested that a computer algorithm could be utilized to generate an appropriate alert signal to the controller if the algorithm detected a deviation from the assigned route.
The second type of stress situation involved an RNAV failure. The simulator pilot proceeding via one of the Carmel routes called the controller and notified him that all RNAV modes had failed and that vectors were needed to complete the approach. Generally, this situation caused no major problem in either the 3D or 4D modes for aircraft already in the control sector. The major effects were that the arrival flow was halted and that a slot about 35 percent larger than average was opened to accommodate the vectored aircraft, primarily done by slowing the aircraft behind the vectored aircraft. Once the vectored aircraft captured the localizer, normal flow resumed.
, . ,
The third type of stress situation began when an aircraft was placed into an indefinite hold at the holding waypoint of Carmel3. At some time during the run when traffic was fairly heavy, the holding aircraft requested an emergency clearance. The controller then had to clear the aircraft directly to the merge and remove any conflicting traffic from its path. Since no computer-assisted procedures were developed to handle the reordering of aircraft, the general procedure adopted by the controller was first to halt the arrival flow. Then all aircraft that had departed the feeder fix and would interfere with the emergency aircraft were vectored out of the path until the emergency aircraft was in the merge area. Later, these aircraft were cleared directly to the merge area rather than flown along one of the established routes. This procedure was accomplished without major difficulty in the 3D mode but did cause some problems in the 4D mode. One reason was that, in the 4D mode, more aircraft were in the system when the emergency was declared. Hence more vectoring clearances had to be issued. In addition, the procedure for resuming 4D was time consuming when it had to be accomplished for many aircraft simultaneously. First, the aircraft had to be cleared to a waypoint on a standard route. Then, a new merge time had to be computed and, finally, the controller had to issue a revised merge time clearance. For the aircraft within 12 miles of the merge, there was limited flexibility in meeting new time assignments. One possible remedy for this difficulty is to develop a ground computer rescheduling algorithm that would provide the controller with a conflict-free set of modified routes. ;This lack of computer assistance is recognized as an important problem requiring further research.
Controller Evaluations
The aim of the first experiment was to evaluate one set of procedures and displays for both the 4D and 3D RNAV system. Time limitations did not allow iteration of procedures and displays to determine an optimum set. Determining the best set of man-machine interactions is an important problem, one that cannot be covered here. (Some problems of automation in controller problem- solving and decision-making are discussed in ref. 7.) In fact, because of display limitations at the controller station, it was necessary to use display formats known to be nonoptimum. For exampfe, the smallest character size available resulted in too much clutter around the merge area when the full ARTS I11 alphanumeric aircraft identification tag was used. Hence, this information was presented elsewhere, either in the flight data table or, at the request of the controller, at the bottom of the display. The subjects were aware of the limitations of the simulation facility and considered these limitations when making their evaluations. However, they did not feel that the display limitations affected the results significantly. The controller evaluation forms and the controller responses are given in the appendix. Highlights are discussed below.
17
"
The controller subjects agreed that 4D when compared with 3D was more expeditious and orderly. They believed that more traffic could be accommodated in the 4D mode, a conclusion verified by the objective data. Also, in agreement with the objective data were the controller opinions that handling traffic from opposite directions and from different speed classes was greatly simplified in the 4D mode. Hence controllers felt that 4D increased safety at a given traffic level.
However, in the 4D case, there were generally more aircraft in the control sector at a given time. This increase gave some concern to the controllers, probably because they knew that, in an emergency situation, more aircraft would require immediate processing. Some computer algorithms to aid in resolving this problem would be required before the controller would feel comfortable with such a large number of aircraft in his sector.
The subjects disagreed with regard to stressfulness, frustration, and workload. One subject felt that the major tasks of ordering and creating slots for aircraft was considerably simplified in the 4D mode, and so the workload as well as the stress and frustration of the task were reduced. Another subject disagreed - he felt that he could place an aircraft where he wanted when he wanted with radar vectors and that RNAV (in either its 3D or 4D version) with its waypoint structure was too cumbersome. Recall that in the RNAV modes used in the experiment, the controller rerouted aircraft by specifying a capture waypoint to fly to. The aircraft had to meet restrictions on altitude, speed, and heading at the capture waypoint. Hence, if the aircraft were too close to the capture waypoint, rejoining the standard route was sometimes not feasible. The controller found this particularly frustrating at times when rapid responses were required to resolve an emergency. To solve this problem, change’s are being implemented for future experiments that will permit. aircraft to rejoin a route without a waypoint being specified. This would permit pilots to respond to RNAV instructions as effectively and promptly as radar vectors.
With regard to workload, one subject believed that in the 4D mode as simulated, too much time was spent observing the flight data table and making hand calculations on time assignments than in monitoring the situation display. He believed i t would be extremely helpful if the ground computer could provide him with a suggested conflict-free merge time for each aircraft entering his sector. Both subjects did agree that such computer assists would be necessary in scenarios with more than one time control point per sector or where the minimum time separation between aircraft was a function of speed capability.
Pilot Evaluations
The pilot subjects believed that 4D and its associated horizontal map display improved their geographic orientation and decreased workload, but they had no clear reaction with regard to safety. From one viewpoint, safety was improved because there seemed to be less change of human error in scheduling aircraft. However, because of the limited number of clearances issued in the 4D mode, there seemed to be less awareness of surrounding traffic. One pilot suggested that surround- ing traffic be presented on the horizontal map display.
Pilots ultimately disagreed on whether 4D would decrease delays or whether it should be implemented. One subject, who objected to implementing 4D, had the opinion that workload in today’s system is not unreasonable and that RNAV makes a human virtually unnecessary. Other pilots who participated in the experiment and others who had participated in simulation and flight
18
tests of the onboard system felt that the workload should be decreased, and that this was desirable. (A detailed report of the onboard RNAV system together with pilot opinion is planned as a separate report.)
CONCLUSIONS
A real-time manned RNAV terminal area simulation experiment was discussed involving both FAA traffic controllers and airline pilots. For terminal area operations and under the conditions .,
simulated here, 4D RNAV resulted in these significant advantages compared to 3D: (1) communica- tions workload in the 4 D mode was reduced about 35 percent, (2) 35 percent more traffic was ..
handled in the 4 D case, ind (3) holding time in the 4 D mode was only 30 percent that required in the 3D mode.
Since traffic in the 4 D mode was more orderly, considerably more traffic could be handled. Few revisions of initial clearances were needed in this mode. Whereas establishing proper separation at the merge point for aircraft approaching at different speeds and from different directions often disrupted traffic flow in the 3D mode, no such difficulty was experienced under similar conditions in the 4D mode.
The controller and pilot evaluations generally concurred with quantitative findings. Where criticisms of RNAV systems occurred, they could be overcome by relatively straightforward additions to existing computer algorithms. These changes will be included in future experiments.
Thus, introducing advanced RNAV concepts into terminal area operations can significantly increase the effectiveness of such operations and permit substantial increases in capacity in congested terminal areas.
Ames ResearchCenter National Aeronautics and Space Administration
Moffett Field, Calif. 94035, April 11, 1977
19
APPENDIX
QUESTIONNAIRES AND CONTROLLER RESPONSES
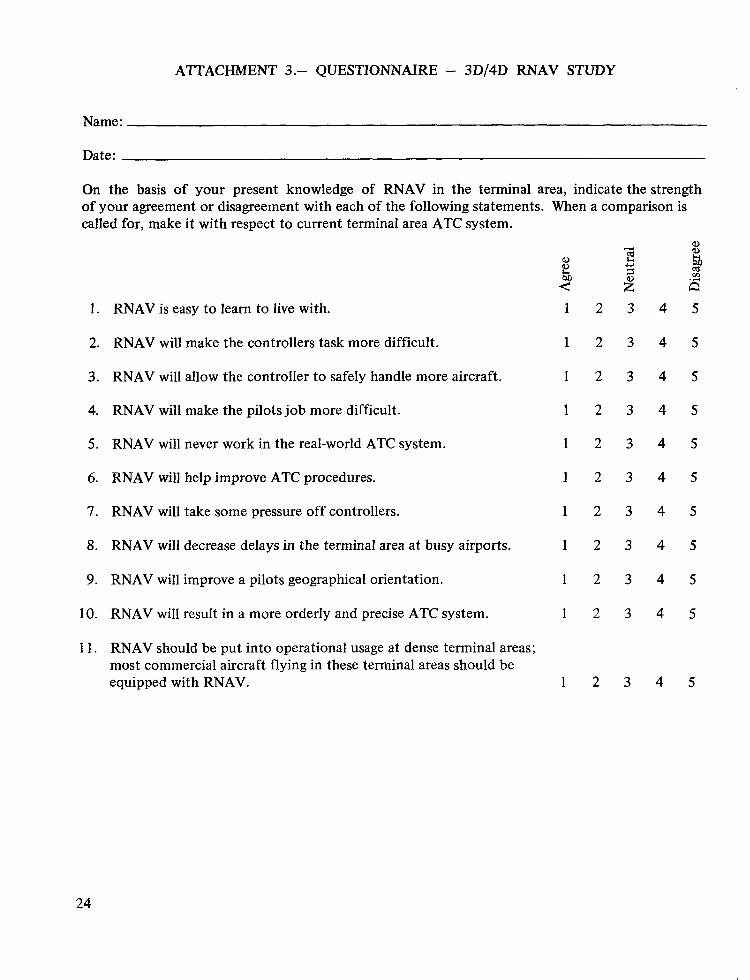
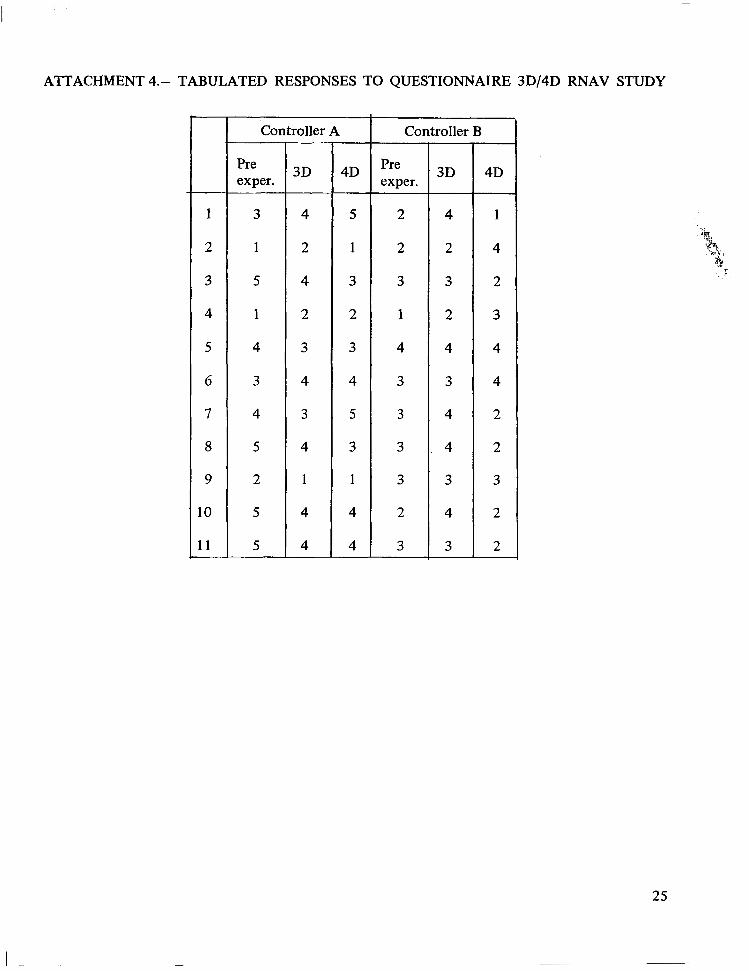
This appendix contains questionnaire forms and tabulated responses of the controllers. Each controller participated in six 3D runs and six 4D runs, half of which included stress situations. Two runs per controller per day were conducted during the six days of the test. The Run Evaluation Sheet (attachment 1) was completed by the controller at the end of each of the 24 runs. See attachment 2 for the tabulated responses. The Questionnaire - 3D/4D RNAV Study (attachment 3) was completed three times by each controller. The first time, before any simulation training, controllers were asked to compare what they knew about RNAV wi'th respect to the present system. Then, after all 24 runs were completed, the 3D RNAV was compared with the present system and, finally, 4D RNAV was compared with the present system. See attachment 4 for the tabulated responses. The Detailed Post-Experiment Controller Questionnaire (attachment 5) was completed by each controller after all 24 runs were completed. The controller response is summar- ized under each question.
' 20
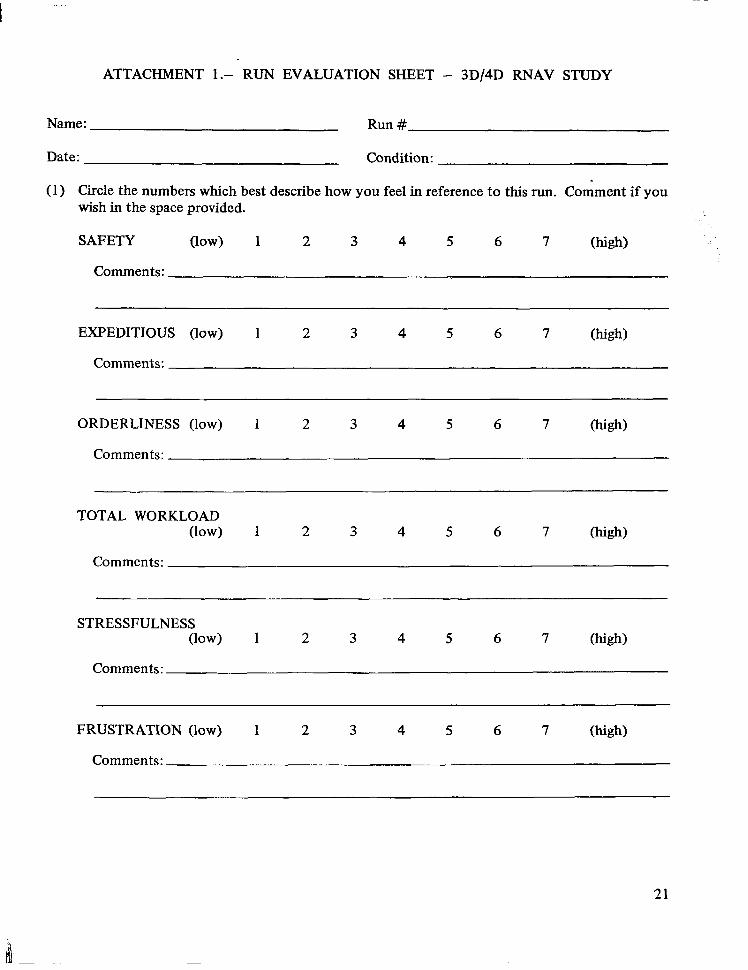
ATTACHMENT 1.- RUN EVALUATION SHEET - 3D/4D RNAV STUDY
Name : Run #
Date: Condition:
(1 ) Circle the numbers which best describe how you feel in reference to this run. Comment if you wish in the space provided.
SAFETY (low) 1 2 3 4 5 6 7 (high) . ,
Comments:
EXPEDITIOUS (low) 1 2 3 4 5 6 7 (high)
Comments:
ORDERLINESS (low) 1 2 3 4 5 6 7 ( w . 0
Comments:
TOTAL WORKLOAD (low) 1 2 3 4 5 6 7 (high)
Comments:
STRESSFULNESS (low) 1 2 3 4 5 6 7 (hkh)
Comments:
~~
FRUSTRATION (low) 1 2 3 4 5 6 7 (high)
Comments: .~ "
21
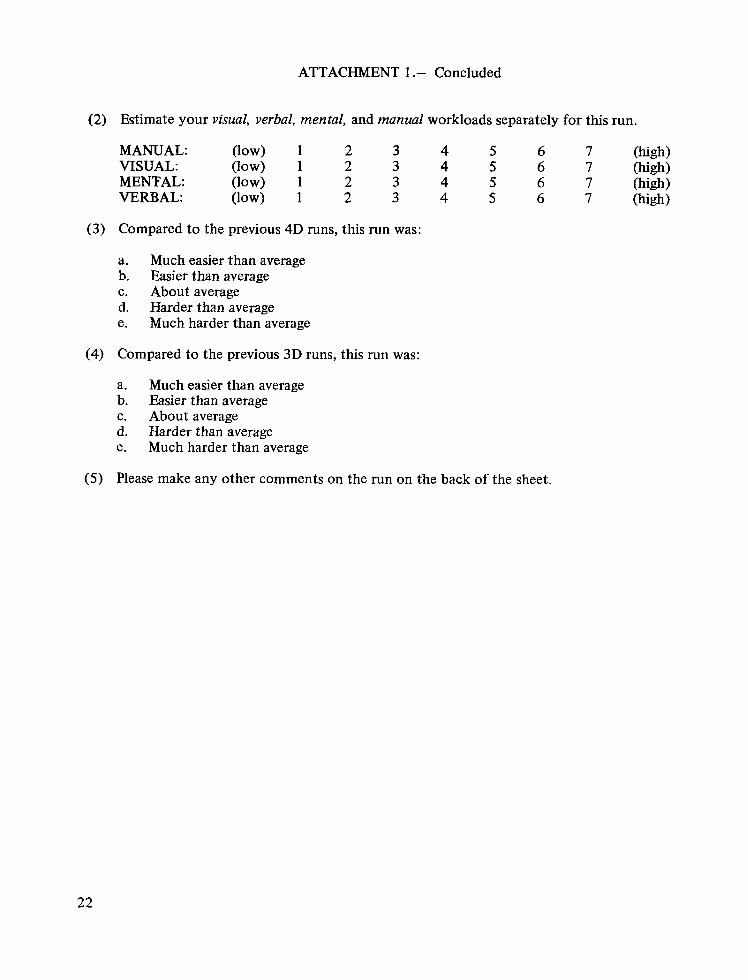
ATTACHMENT 1 .- Concluded
(2) Estimate your visual, verbal, mental, and manual workloads separately for this run.
MANUAL: (low) 1 2 3 4 5 6 7 (high) VISUAL: (low) 1 2 3 4 5 6 7 (high) MENTAL: (low) 1 2 3 4 5 6 7 (high) VERBAL: (low) 1 2 3 4 5 6 7 (high)
(3) Compared to the previous 4D runs, this run was:
a. Much easier than average b. Easier than average c. About average d. Harder than average e. Much harder than average
(4) Compared to the previous 3D runs, this run was:
a. Much easier than average b. Easier than average c. About average d. Harder than average e. Much harder than average
(5) Please make any other comments on the run on the back of the sheet.
22
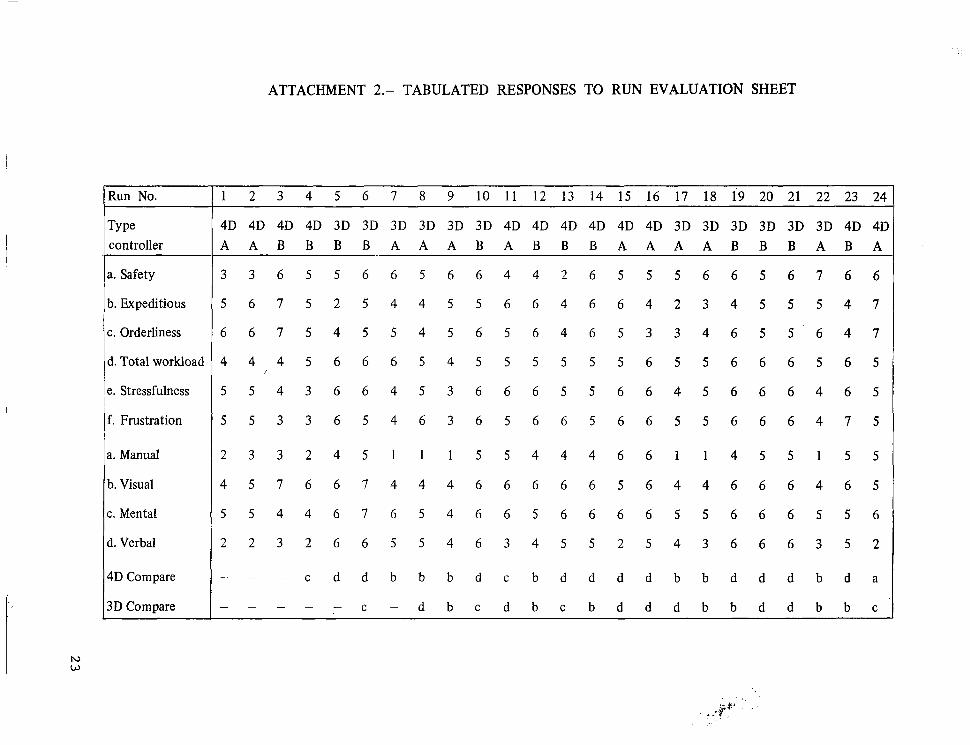
ATTACHMENT 2.- TABULATED RESPONSES TO RUN EVALUATION SHEET
/Run No. 1 1 2 3 4 5 6 7 8 9 10 11 12 13 14 15 16 17 18 19 20 21 22 23 241
4D 4D 4D 4D 3D 3D 3D 3D 3D 3D 4D 4D 4D 4D 4D 4D 3D 3D 3D 3D 3D 3D 4D 4D A A B B B B A A A B A B B B A A A A B B B A B A
a. Safety
5 5 3 3 6 5 4 6 3 6 5 6 6 5 6 6 5 5 6 6 6 4 7 f. Frustration
5 5 4 3 6 6 4 5 3 6 6 6 5 5 6 6 4 5 6 6 6 4 6 5 e.Stressfulness
4 4 4 5 6 6 6 5 4 5 5 5 5 5 5 6 5 5 6 6 6 5 6 d.Totalworkload
6 6 7 5 4 5 5 4 5 6 5 6 4 6 5 3 3 4 6 5 5 6 4 7 c. Orderliness
5 6 7 5 2 5 4 4 5 5 6 6 4 6 6 4 2 3 4 5 5 5 4 7 b.Expeditious
3 3 6 5 5 6 6 5 6 6 4 4 2 6 5 5 5 6 6 5 6 7 6 6
I 5 1 I
a. Manual
b. Visual
c. Mental
d. Verbal
4D Compare
3D Compare
2 3 3 2 4 5 1 1 1 5 5 4 4 4 6 6 1 1 4 5 5 1 5 5
4 5 7 6 6 7 4 4 4 6 6 6 6 6 5 6 4 4 6 6 6 4 6 5
5 5 4 4 6 7 6 5 4 6 6 5 6 6 6 6 5 5 6 6 6 5 5 6
2 2 3 2 6 6 5 5 4 6 3 4 5 5 2 5 4 3 6 6 6 3 5 2
_ " c d d b b b d c b d d d d b b d d d b d a
" " _ C - d b c d b c b d d d b b d d b b c
I
AITACHMENT 3.- QUESTIONNAIRE - 3D/4D RNAV STUDY
Name :
Date:
On the basis of your present knowledge of RNAV in the terminal area, indicate the strength of your agreement or disagreement with each of the following statements. When a comparison is called for, make it with respect to current terminal area ATC system.
1. RNAV is easy to learn to live with. 1 2 3 4 5
2. RNAV will make the controllers task more difficult. 1 2 3 4 5
3. RNAV will allow the controller to safely handle more aircraft. 1 2 3 4 5
4. RNAV will make the pilots job more difficult. 1 2 3 4 5
5 . RNAV will never work in the real-world ATC system. 1 2 3 4 5
6. RNAV will help improve ATC procedures. 1 2 3 4 5
7. RNAV will take some pressure off controllers. 1 2 3 4 5
8. RNAV will decrease delays in the terminal area at busy airports. 1 2 3 4 5
9. RNAV will improve a pilots geographical orientation. 1 2 3 4 5
10. RNAV will result in a more orderly and precise ATC system. 1 2 3 4 5
1 1. RNAV should be put into operational usage at dense terminal areas; most commercial aircraft flying in these terminal areas should be equipped with RNAV. 1 2 3 4 5
24
ATTACHMENT 4.- TABULATED RESPONSES TO QUESTIONNAIRE 3D/4D RNAV STUDY
3D
4
2
4
2
3
4
3
4
1
4
4
4D Pre exper.
5 2
1 2
3 3
2 1
3 4
4 3
5 3
3 3
1 3
4 2
4 3
3D
4
2
3
2
4
3
4
4
3
4
3
4D
1
4
2
3
4
4
2
2
3
2
2
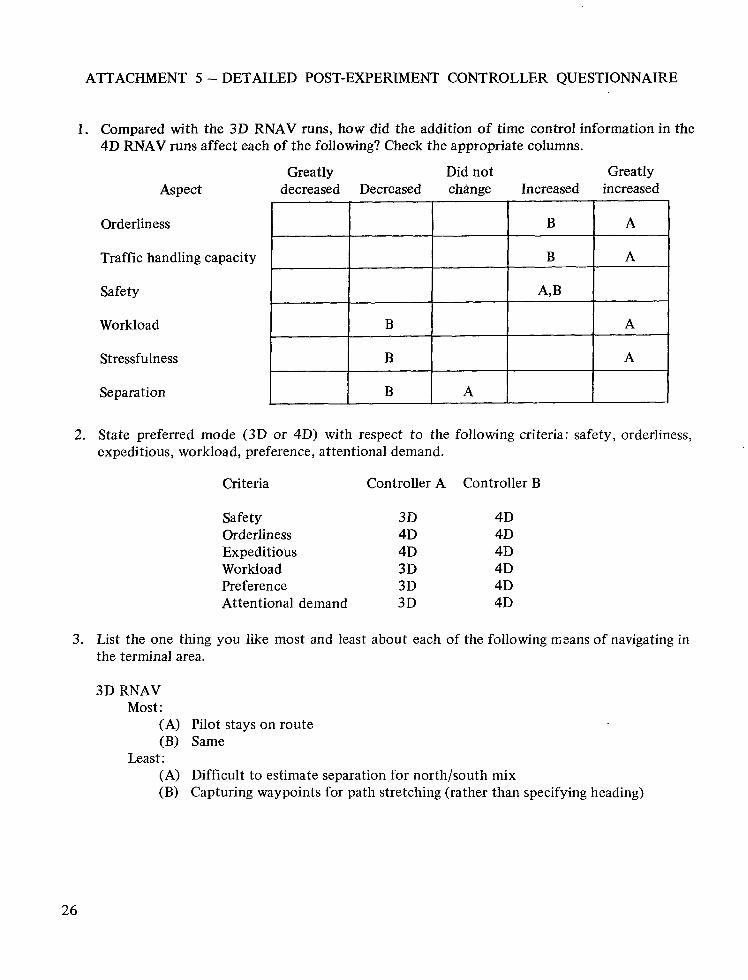
ATTACHMENT 5 - DETAILED POST-EXPERIMENT CONTROLLER QUESTIONNAIRE
1. Compared with the 3D RNAV runs, how did the addition of time control information in the 4D RNAV runs affect each of the following? Check the appropriate columns.
Greatly Did not Greatly Aspect decreased Decreased change Increased increased
Orderliness
Traffic handling capacity
Safety
Workload
Stressfulness
Separation
2. State preferred mode (3D or 4D) with respect to the following criteria: safety, orderliness, expeditious, workload, preference, attentional demand.
Criteria Controller A Controller B
Safety 3D 4D Orderliness 4D 4B Expeditious 4D 4D Workload 3D 4D Preference 3B 4D Attentional demand 3D 4D
3. List the one thing you like most and least about each of the following mzans of navigating in the terminal area.
3D RNAV Most:
(A) Pilot stays on route (B) Same
(A) Difficult to estimate separation for north/south mix (B) Capturing waypoints for path stretching (rather than specifying heading)
Least:
26
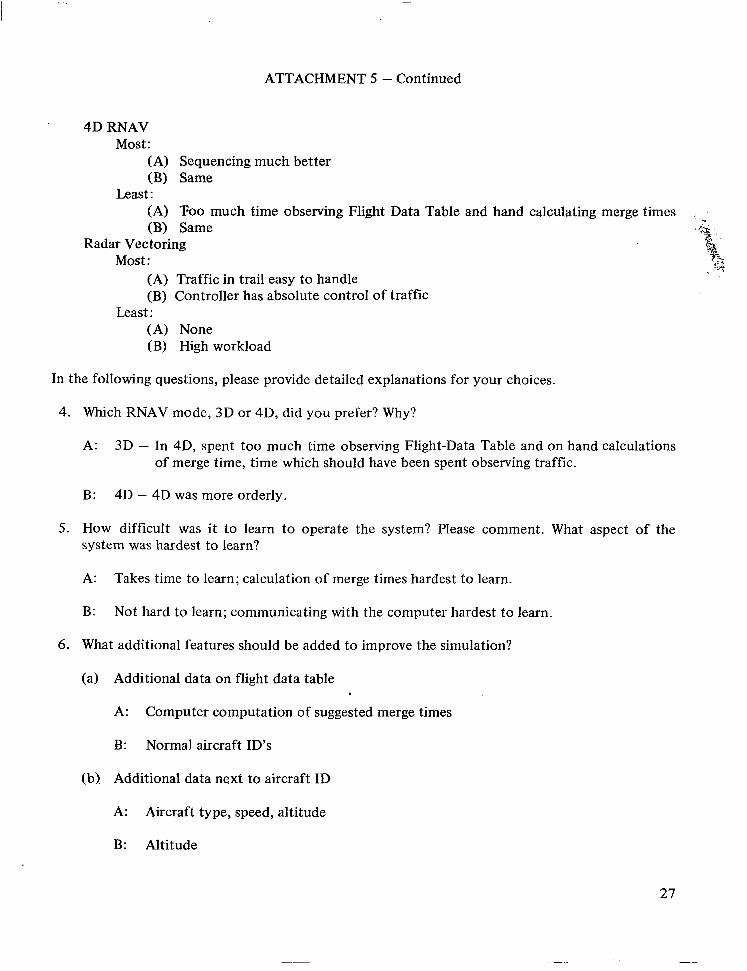
ATTACHMENT 5 - Continued
Sequencing much better Same
Too much time observing Flight Data Table and hand calculating merge times ,
Same Radar Vectoring
Most: (A) Traffic in trail easy to handle (B) Controller has absolute control of traffic
(A) None (B) High workload
Least:
In the following questions, please provide detailed explanations for your choices.
4. Which RNAV mode, 3D or 4D, did you prefer? Why?
A: 3D - In 4D, spent too much time observing Flight-Data Table and on hand calculations of merge time, time which should have been spent observing traffic.
B: 4D - 4D was more orderly.
5. How difficult was it to learn to operate the system? Please comment. What aspect of the system was hardest to learn?
A: Takes time to learn; calculation of merge times hardest to learn.
B: Not hard to learn; communicating with the computer hardest to learn.
6. What additional features should be added to improve the simulation?
(a) Additional data on flight data table
A: Computer computation of suggested merge times
B: Normal aircraft ID’S
(b). Additional data next to aircraft ID
A: Aircraft type, speed, altitude
B: Altitude
27
ATTACHMENT 5 - Continued
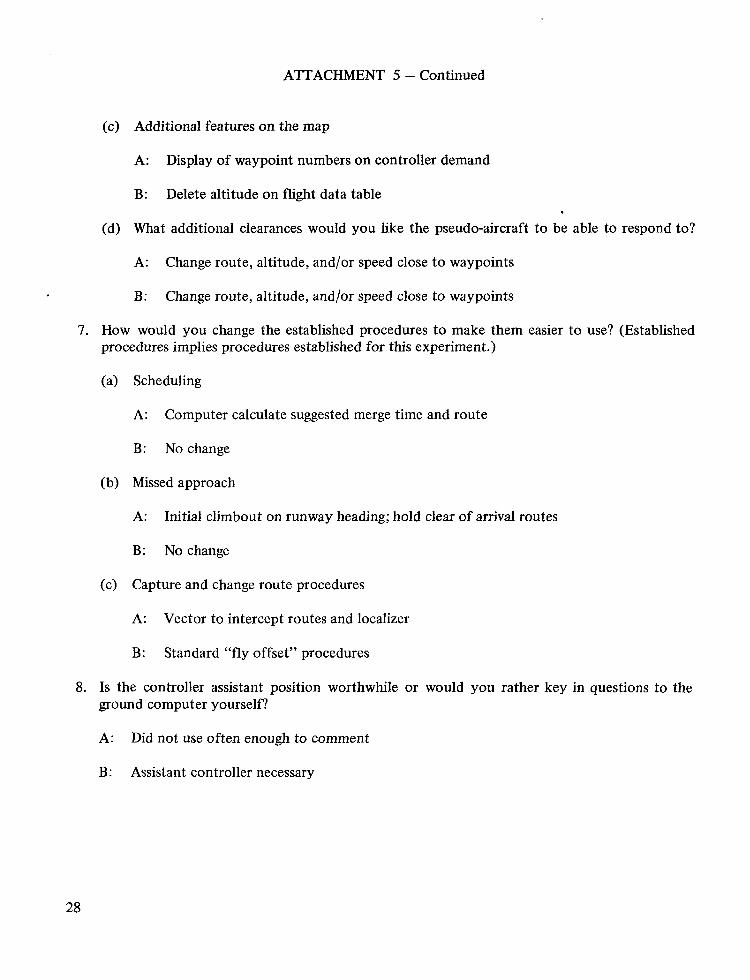
(c) Additional features on the map
A: Display of waypoint numbers on controller demand
B: Delete altitude on flight data table
(d) What additional clearances would you like the pseudo-aircraft to be able to respond to?
A: Change route, altitude, and/or speed close to waypoints
B: Change route, altitude, and/or speed close to waypoints
7. How would you change the established procedures to make them easier to use? (Established procedures implies procedures established for this experiment.)
(a) Scheduling
A: Computer calculate suggested merge time and route
B: No change
(b) Missed approach
A: Initial climbout on runway heading; hold clear of arrival routes
B: No change
(c) Capture and change route procedures
A: Vector to intercept routes and localizer
B: Standard “fly offset” procedures
8. Is the controller assistant position worthwhile or would you rather key in questions to the ground computer yourself?
A: Did not use often enough to comment
B: Assistant controller necessary
28
ATTACHMENT 5- Concluded
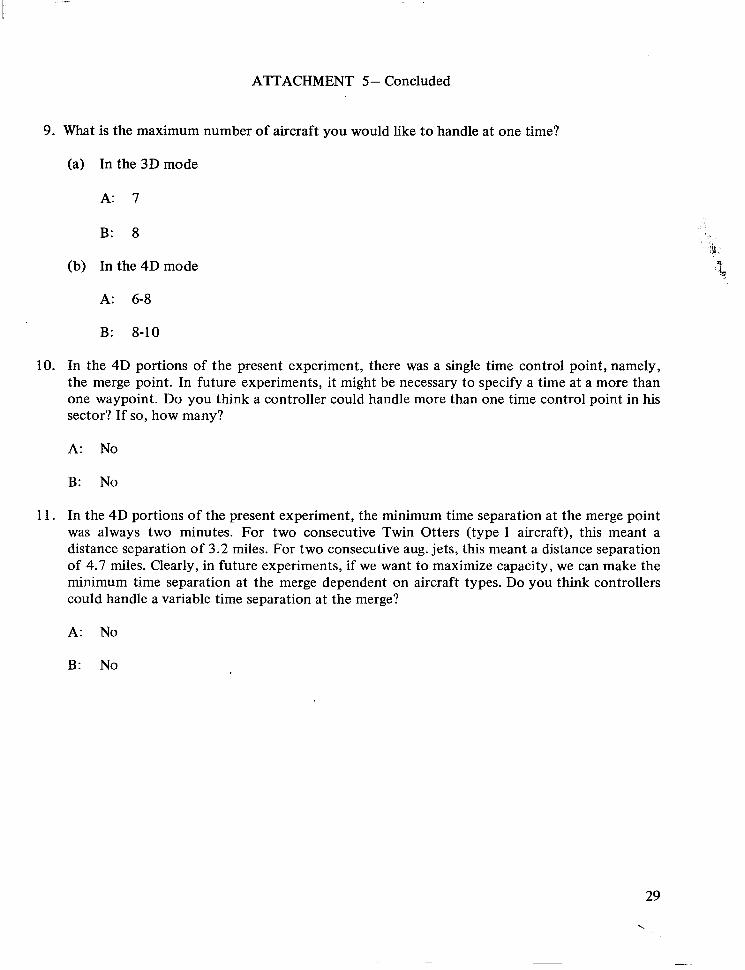
9. What is the maximum number of aircraft you would like to handle at one time?
(a) In the 3D mode
A: 7
B: 8
(b) In the 4D mode
A: 6-8
B: 8-10
10. In the 4D portions of the present experiment, there was a single time control point, namely, the merge point. In future experiments, it might be necessary to specify a time at a more than one waypoint. Do you think a controller could handle more than one time control point in his sector? If so, how many?
A: No
B: No
11. In the 4D portions of the present experiment, the minimum time separation at the merge point was always two minutes. For two consecutive Twin Otters (type 1 aircraft), this meant a distance separation of 3.2 miles. For two consecutive aug. jets, this meant a distance separation of 4.7 miles. Clearly, in future experiments, if we want to maximize capacity, we can make the minimum time separation at the merge dependent on aircraft types. Do you think controllers could handle a variable time separation at the merge?
A: No
B: No
29
-.
REFERENCES
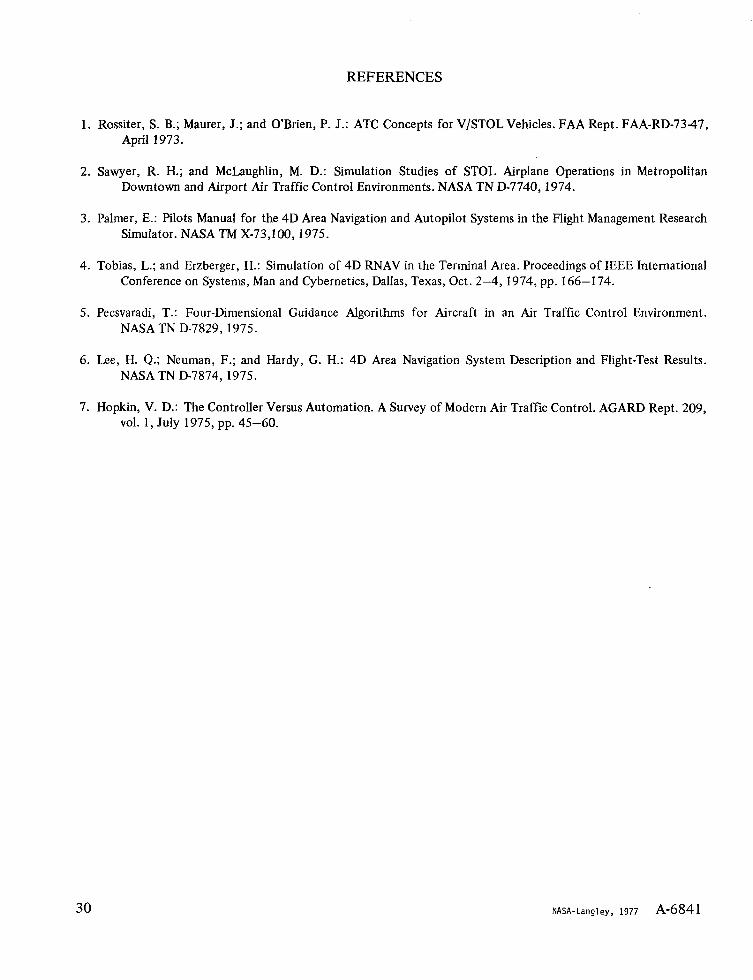
1. Rossiter, S. B.; Maurer, J.; and O'Brien, P. J.: ATC Concepts for V/STOLVehicles. FAA Rept. FAA-RD-7347, April 1973.
2. Sawyer, R. H.; and McLaughlin, M. D.: Simulation Studies of STOL Airplane Operations in Metropolitan Downtown and Airport A i r Traffic Control Environments. NASA TN D-7740,1974.
3. Palmer, E.: Pilots Manual for the 4D Area Navigation and Autopilot Systems in the Flight Management Research Simulator. NASA TM X-73,100, 1975.
4. Tobias, L.; and Erzberger, H.: Simulation of 4D RNAV in the Terminal Area. Proceedings of IEEE International Conference on Systems, Man and Cybernetics, Dallas, Texas, Oct. 2-4, 1974, pp. 166-174.
5. Pecsvaradi, T.: Four-Dimensional Guidance Algorithms for Aircraft in an Air Traffic Control Environment. NASA TN D-7829,1975.
6. Lee, H. Q.; Neuman, F.; and Hardy, G. H.: 4D Area Navigation System Description and Flight-Test Results. NASA TN D-7874,1975.
7. Hopkin, V. D.: The Controller Versus Automation. A Survey of Modern Air Traffic Control. AGARD Rept. 209, V O ~ . 1, July 1975, pp. 45-60.
30 NASA-Langley. 1977 A-6841