ray prioritization using stylization and visual saliency
TRANSCRIPT

Computers & Graphics 36 (2012) 673–684
Contents lists available at SciVerse ScienceDirect
Computers & Graphics
0097-84
http://d
n Corr
E-m
kainz@i
khlebni
schmals
journal homepage: www.elsevier.com/locate/cag
Special Section on CANS
Ray prioritization using stylization and visual saliency
Markus Steinberger n, Bernhard Kainz n, Stefan Hauswiesner, Rostislav Khlebnikov,Denis Kalkofen, Dieter Schmalstieg
Institute for Computer Graphics and Vision, Graz University of Technology, Austria
a r t i c l e i n f o
Article history:
Received 10 October 2011
Received in revised form
20 February 2012
Accepted 20 March 2012Available online 30 March 2012
Keywords:
Ray-tracing
Ray-casting
Volume rendering
Photorealistic rendering
Visual saliency
93/$ - see front matter & 2012 Elsevier Ltd. A
x.doi.org/10.1016/j.cag.2012.03.037
esponding authors.
ail addresses: [email protected] (M. St
cg.tugraz.at (B. Kainz), [email protected]
[email protected] (R. Khlebnikov), kalkofen@i
[email protected] (D. Schmalstieg).
a b s t r a c t
This paper presents a new method to control scene sampling in complex ray-based rendering
environments. It proposes to constrain image sampling density with a combination of object features,
which are known to be well perceived by the human visual system, and image space saliency, which
captures effects that are not based on the object’s geometry. The presented method uses Non-
Photorealistic Rendering techniques for the object space feature evaluation and combines the image
space saliency calculations with image warping to infer quality hints from previously generated frames.
In order to map different feature types to sampling densities, we also present an evaluation of the
object space and image space features’ impact on the resulting image quality. In addition, we present an
efficient, adaptively aligned fractal pattern that is used to reconstruct the image from sparse sampling
data. Furthermore, this paper presents an algorithm which uses our method in order to guarantee a
desired minimal frame rate. Our scheduling algorithm maximizes the utilization of each given time
slice by rendering features in the order of visual importance values until a time constraint is reached.
We demonstrate how our method can be used to boost or stabilize the rendering time in complex ray-
based image generation consisting of geometric as well as volumetric data.
& 2012 Elsevier Ltd. All rights reserved.
1. Introduction
A common challenge of high-quality ray-based image genera-tion is maintaining the scene interactivity of the applications. Thisinteractivity is normally achieved by sacrificing some of theimage quality during the interaction and by progressively refiningthe result as soon as the interaction stops. The simplest method inthis context is regular subsampling: rendering the scene in asmall viewport during interaction and stretching the resultingimage to the target image size using linear interpolation. Thismethod indiscriminately discards features and results in a blurredimage or block artifacts.
Adaptive sampling approaches try to assign the computationalcosts to regions with high image fidelity and to approximate theremaining image parts. Typically, these techniques use featuresthat have been detected in the image plane only. Theseapproaches obviously require the final result as an input for theoptimal result, which is impossible. Hence, image regions frompreviously rendered frames [1] or sparsely sampled regions [2]are used.
ll rights reserved.
einberger),
az.at (S. Hauswiesner),
cg.tugraz.at (D. Kalkofen),
We investigate the key element of adaptive approaches, whichis the determination of which elements of an object can becoarsened and which must be preserved. Fig. 1 outlines the coreidea of this work.
Much perceptually based research has been performed in thisarea by researchers from different communities (e.g., the Non-Photorealistic Rendering, NPR, community). However, theseresults have mostly been used for scene stylization and sceneenhancement so far. We present a new sampling strategy for ray-based image synthesis, which uses information about the scene,which is known to support the comprehension of three-dimen-sional shapes [3] and visually attractive images areas in gen-eral [4]. In this paper, these techniques are used to control thereduction of ray samples and thus to achieve a higher imagequality while maintaining the same level of interactivity.
Our implementation produces a feature buffer for every framethat is efficient enough to be used during the ray generation as alookup table for the required ray density. We derive a featurepriority map from the feature buffer that consists of object spacefeatures like silhouettes, suggestive contours, ridges and valleys,combined with image space features like the visual bottom-upsaliency information from previously rendered frames. All ofthem affect the ray density differently. Because different featuresgenerate different ray densities, our method is able to support animportance-driven rendering to guarantee the minimum desiredframe rate. Even though our main focus is the efficient

Fig. 1. This figure illustrates the basic idea of our method. Rays do not have to be
equally distributed over the scene in ray-based rendering environments to get a
visually pleasing result. It is sufficient to trace rays only in areas that have been
proven to convey the shape of an object (left) for a good approximation of the
result (right).
M. Steinberger et al. / Computers & Graphics 36 (2012) 673–684674
visualization of volumetric datasets, we also demonstrated a wayto apply our method to geometric objects with highly complexmaterials in ray-traced scenes.
This is an extended version of [5], which newly introduces theuse of an image-based visual saliency analysis to capture theimpact of lightning effects which go beyond pure geometricfeatures and presents a thoroughly evaluation of our techniqueusing the HDR-VDP-2 [6] visual metric for visibility and qualitypredictions. The main contributions of our method can besummarized as follows:
�
A method that allows the optimization of the ratio betweenthe sampling rate of the scene and its resulting perceptualquality (Section 4). � A method to calculate the visual saliency information effi-ciently enough from previous frames, so that this sceneinformation gets applicable for a perceptually guided ray setup(Section 4.1).
� A progressively refineable sampling pattern, which is used toreconstruct sparsely sampled regions of the image (Section4.4).
� An algorithm that uses our method to guarantee frame rateswhile maximizing the visual quality within the available timeframe (Section 5).
� An evaluation of different object space line features to cate-gorize them based on their abilities to enhance the imagequality and a comparison to image space saliency informationfrom previous frames (Section 6).
2. Previous work
Previous researchers have been concerned with the real-timeperformance of ray-based image generation algorithms. Recentwork has introduced the exploitation of modern GPUs for solvingthe brute-force full-resolution ray traversal interactively, whilecoarse adaptive and progressive sampling approaches have beendiscussed since ray-tracing algorithms first became available. Wegive a brief overview of recent GPU methods and adaptiveprogressive rendering methods in Section 2.1 and discuss possiblescene feature computation strategies in Section 2.2. A furtheroverview of the reconstruction techniques for sparsely sampled
data is given in Section 2.3, and previous attempts at guarantee-ing minimal frame rate are outlined in Section 2.4.
2.1. Interactive ray-based rendering
In this section, we briefly summarize the most commonapproaches to speed-up ray-based rendering algorithms. Theseapproaches can roughly be divided into algorithmic improve-ments and the exploitation of successively available graphicshardware features.
Adaptive progressive rendering. Adaptive approaches, such asthe one presented in this paper, aim for the best possible trade-offbetween interactive frame rates and the loss of image quality,instead of finding the maximum achievable frame rate for a fullquality image. Finding this trade-off is still an ill-defined problem,because the perception of quality differs between human beingsand between applications. However, several algorithms exist toaccelerate rendering speeds through ray reduction. The simplestmethod is a regular subsampling with a nearest neighbor inter-polation. As discussed by [7] and still used in many interactiveray-based rendering systems [8,9], this method is prone tostrongly perceivable aliasing artifacts during the interaction. Todeal with this problem, most related work has investigated theimpact of different sampling pattern strategies in image space[10,2,11]. The sampling pattern is usually visually noticeablyrefined over time until a desired quality level is reached.
Levoy reformulated the front-to-back image order volumerendering algorithm to use an adaptive termination of ray-tracing[12]. The subdivision and refinement process is based on an Ethreshold and does not consider human feature perception andtemporal coherence. Later work altered the ray terminationcriteria [13] depending on the required rendering time or usedtexture-based level of detail [14], topology guided downsampling[15] or multiple resolutions of the same dataset [16,17].
Exploiting the GPU. Numerous rendering engines have beendeveloped to deal with one of the most computationally expen-sive problems of computer graphics: ray-tracing. Besides CPU-based libraries [18,19], most recent GPU approaches reachremarkable frame rates for low- to medium-complexity scenesfor rendering in full quality [20,21]. However, screen filling scenesor scenes with very high complexity are still too slow in order tomeet hard real-time constraints. Furthermore, rendering algo-rithms that aim at achieving real-time performance for the full-quality ray-casting of volume data use empty-space skipping [22],iso-surface ray-casting [23,24], ray pre-integration [25], homo-geneous region encoding [26] and many kinds of direct GPUimplementations [27, Chapter 39].
2.2. Important image areas
The choice of a suitable sampling pattern is crucial for adaptiverendering. For non-trivial systems, the pattern refinement strat-egy is usually chosen depending on prominent features. In thefollowing paragraphs, we discuss our selected methods to findthose regions.
Image space methods. Most methods refine the image samplingpattern based on image intensity variances. Early algorithmsassume that image areas with high frequencies require a densersampling than large uniform areas do [28,2], to gain a visuallyacceptable result. Later systems adapt this assumption towardsthe limitations of the human visual system. Ramasubramanianand colleagues [29] have been one of the first who have success-fully introduced an image-based perceptual threshold map whichsteers the sampling density of a global illumination path tracingalgorithm. The Ramasubramanian system shows that it is possibleto generate images with only 5–10% of the rays which have been

M. Steinberger et al. / Computers & Graphics 36 (2012) 673–684 675
used for a reference solution. Their results have visually only littleto no difference to a fully computed ground truth.
Another popular method to extract visually attracting imageareas is the calculation of the visual bottom-up saliency [4]. Thesaliency of an image is usually defined as a measure of how mucha particular location contrasts with its surroundings, usingdimensions such as color, orientation, motion, and depth. Hence,this method is especially suitable for analyzing cluttered sceneswhich are more dominated by texture rather than sharp edges[30,31].
Non-Photorealistic Rendering of line features. NPR deals withsalient object features, often directly in object space. Relatedrendering techniques are mainly used for illustrative renderingand in cognitive science. Cole and colleagues [3], for example,show that object contours including the object silhouette are alsoused by artists to outline scenes. Several visualization algorithmsand perceptually motivated work demonstrate that these featurescan be used to simplify complex scenes for a better understandingof the essential parts [32–34].
The features of an object or of a scene can be extracted invarious ways: meshes can be analyzed in object space or, afterrendering, their projection can be analyzed in image space.Similar methods apply to volumetric datasets, where the objectspace contains a voxel grid instead of a set of geometric primi-tives. Finding features in a rendered image has the advantage ofincluding textures and other effects, while in object space, moreaccuracy is usually available because the data have not beendiscretized into pixels. Moreover, the features in object space may beview-independent, which allows their reuse without recomputation.
Fig. 2 gives a visual impression of some sparse object featuresand the visual saliency information of a rendered object that weevaluate for ray decimation in this work. Our definitions of objectfeatures are similar to those from [34] and the definition of visualsaliency is similar to that from [4].
2.3. Sparse data reconstruction
Computing only rays for important areas means that the finalimage has to be reconstructed from those sparse samples.Numerous approaches exist besides the simplest, conventionalapproach of regular subsampling. This attempt requires a nearestneighbor computation or a linear interpolation and leads toperceivable block artifacts. A good general overview of non-homogeneously sampled data reconstruction is given in [35].
Point-based rendering. Specialized approaches for computergraphics can be found for point-based rendering. The widely usedpull–push algorithm [36] utilizes a pyramid algorithm for surfacereconstruction. It has been adapted for the image space
Fig. 2. The happy Buddha object (a) rendered with different object space sparse line fe
contours (c), suggestive highlights (d), ridges (e), valleys (f) and bottom-up visual salien
areas correspond to highly salient regions, while white areas stand for zero saliency.
reconstruction of under-sampled point-based surfaces [37]. Pfis-ter and colleagues [38] extended this approach to fill the holesbetween splats. Unfortunately, these approaches are not suitedfor direct GPU implementations, as stated by Marroquim andcolleagues [39]. The approach of Marroquim et al. [39], whoproposed a GPU implementation for large point-based modelswith elliptic box-filters and deferred shading, is also applicable tothe reconstruction problem in this work. However, its computa-tional overhead is still higher for large viewports than that of themethod presented in Section 4.4.
Image warping. Image warping [40] is a form of image-basedrendering that allows to extrapolate new views from existingimages with per-pixel depth information. Such methods can beuseful if the changes between frames are small (i.e., duringinteraction with high frame-to-frame coherence), so that a newview can be reconstructed from previous frames. Artifacts occur-ring because of occlusions and disocclusions can be solved by arecalculation of those areas [41,42].
2.4. Guaranteed frame rates
To the best of our knowledge, our method is the first thatsuccessfully implements an algorithm to guarantee a certainminimal frame rate and still maintains an acceptable imagequality for ray-based image generation. Pomi and colleagues[43] proposed that a guaranteed frame generation time wouldbe essential for mixed reality TV studio ray tracing applications,but they did not implement such an approach. For non-ray-basedrendering approaches, a few systems that guarantee a certainframe rate exist. For example, [44] replaces complex objectsoptimally by impostors. These examples show that several appli-cations require guaranteed frame rates but also that this problemis not well researched yet.
3. Overview over the method
Our approach consists of two passes. First, an importancebuffer is created from object space features and image spacefeatures with the goal of encoding the visual importance of everyimage region for the perceivable image quality. The object spacefeatures are deduced from a set of line features which areextracted from the dataset’s corresponding meshes, projected toscreen space, and classified according to our evaluation (seeSection 6). The image space features are deduced by performinga saliency analysis of the previously rendered frame, warping thesaliency to the current frame, and analyzing the result fordisocclusions. The combined feature buffer is evaluated during
atures (b)–(f) and an image space feature detector (g). Silhouettes (b), suggestive
cy (g) are evaluated for ray decimation in this work. In the saliency image (g) dark

Fig. 3. Overview of our prioritized rendering algorithm. Every ray’s priority is
computed according to Section 4.2 and is used to sort the pixels in a one-
dimensional priority queue. Additionally, the visual saliency information can be
image warped from the last frames as described in Section 4.1. The selection of
features depends on the kind of scene and can therefore be modified by the user.
The features are sorted in a priority queue and if a certain time limit is reached,
the rendering process stops. The resulting sparse data frame can be reconstructed
with the method from Section 4.4.
M. Steinberger et al. / Computers & Graphics 36 (2012) 673–684676
the ray setup and traversal, which forms the second pass. Giventhat we can assign a priority value to every ray, it is possible toconstruct a rendering system that aims at producing the bestimage quality within a given time frame, as outlined in Fig. 3.
We adaptively adjust the image space sampling frequencyaccording to the feature buffer. More rays are sent into the scenein feature-rich areas and their vicinity, while the samplingfrequency for feature-poor areas is strongly decreased. The samestrategy can be used for per-ray quality parameters (such as raybounces, object space sampling frequency or stopping threshold).Finally, we reconstruct the image by filling in color values forpixels to which we have not previously assigned a ray. In Section4.4, we present a suitable method for a full image reconstructionusing a fractal reconstruction pattern and an adaptive linearinterpolation.
Our method is applicable to a ray-based rendering of geo-metric surface meshes and to volumetric datasets. The onlydifference is given by the object space feature extraction step.For surface meshes, the feature-forming geometry is defined bythe mesh itself. Using volumes requires the extraction of multipleiso-surfaces based on an evaluation of the given transfer functionbefore the line features are rendered.
4. Importance-driven sampling and reconstruction
To control the frequency of the sampling pattern, we render animportance buffer in each frame (Section 4.1). This importancebuffer is filled by a projection of object space line features toscreen space combined with the result of an image space saliencyanalysis from the previously rendered frame. To yield the priorityof every ray (Section 4.2), the entries from the importance bufferare combined with priority values from a fractal sampling pattern(Section 4.3).
4.1. Importance buffer
The aim of the importance buffer is to estimate the importanceof an image region for the overall perceivable image quality. Ahigh importance value (close to 1.0) means that this area is
important for the viewer to be able to understand the renderedobjects. At the same time these areas will also strongly contributeto image quality. A low importance value (close to 0.0) means thatthis image area does not hold visually interesting features andthat this region is rather homogeneous in color and intensity. Wefurthermore encode information about which areas correspond topure background in the importance map to omit these areas fromray-tracing. To generate the importance buffer, we rely on objectspace features, which are exact and efficient to compute, as wellas image space features, which can cover additional effects due tolighting or object textures. As there is a partial overlap betweenthe two methods, we combine the feature-sets applying a per-pixel max operator if both kinds of features are used at the sametime. To benefit from our method, the importance buffer must beproduced in a time frame that is shorter than the savings from themain rendering pass. Note that it is in general sufficient tocompute the importance buffer at a lower resolution.
Object space features. To provide a sufficiently high frame ratein the first render pass, we have extended the approach fromDeCarlo and colleagues [34] with selective GPU accelerationtechniques, which are described in Section 7. In practice, we canrender this step at several hundred frames per second because thefeatures are rendered as simple OpenGL lines. These lines are alsoreused from frame to frame. To simulate smooth features and togradually decrease the priority in the vicinity of features, we canreplace these lines by textured triangle strips, compute a distancetransform on the feature buffer, or use a fractal pattern asdescribed in Section 4.3. The last option provides the highestflexibility. To remove any hidden features, we also render theunderlying base mesh as fully opaque, homogeneous surface.
Image space features. Because pure object space features do notincorporate high frequencies in textures or lighting effects likeshadows, reflections, or refractions, we also evaluate image spacefeatures. To detect these features in image space, we rely onbottom-up visual saliency in terms of color and intensity opposi-tions [4]. As we require an image to calculate the saliency, we facea chicken–egg problem. To determine the importance of an imageregion, we require the image. To efficiently create the image, weneed to know where important areas are. Targeting interactivesystems, we can make use of the previously generated view. Wecalculate a saliency buffer for the previous frame building animage pyramid using GLSL shaders. Afterwards, the saliencybuffer is image warped according to the transformations thathave been applied to the scene since the last frame was gener-ated. Finally, small holes in the map are closed and big holes,probably due to disocclusions, are filled with a medium impor-tance value. Warping the saliency buffer is less error prone thanwarping the image itself, because we only use it as basis for thedecisions of which rays to cast into the scene and only warp fromone frame to the other.
4.2. Adaptive subsampling
When the importance buffer is available, the actual raytraversal starts. Every pixel of the output frame defines a possibleray starting point which is equal to one thread in terms of GPUstream processing. If the importance buffer contains a negativevalue at the thread’s position, this ray’s thread will immediatelyreturn and fill its corresponding position in the output buffer withthe background color. Otherwise, we consult an adjustable raypriority table, which defines an image space sampling pattern(see Section 4.3). Combining the importance buffer entry pimp
with the pattern priority ppatt, which is read from the samplingpriority table, we can determine a per-ray priority pray. The waythe two independent priorities pimp and ppatt are combinedessentially captures the contribution to the image quality that
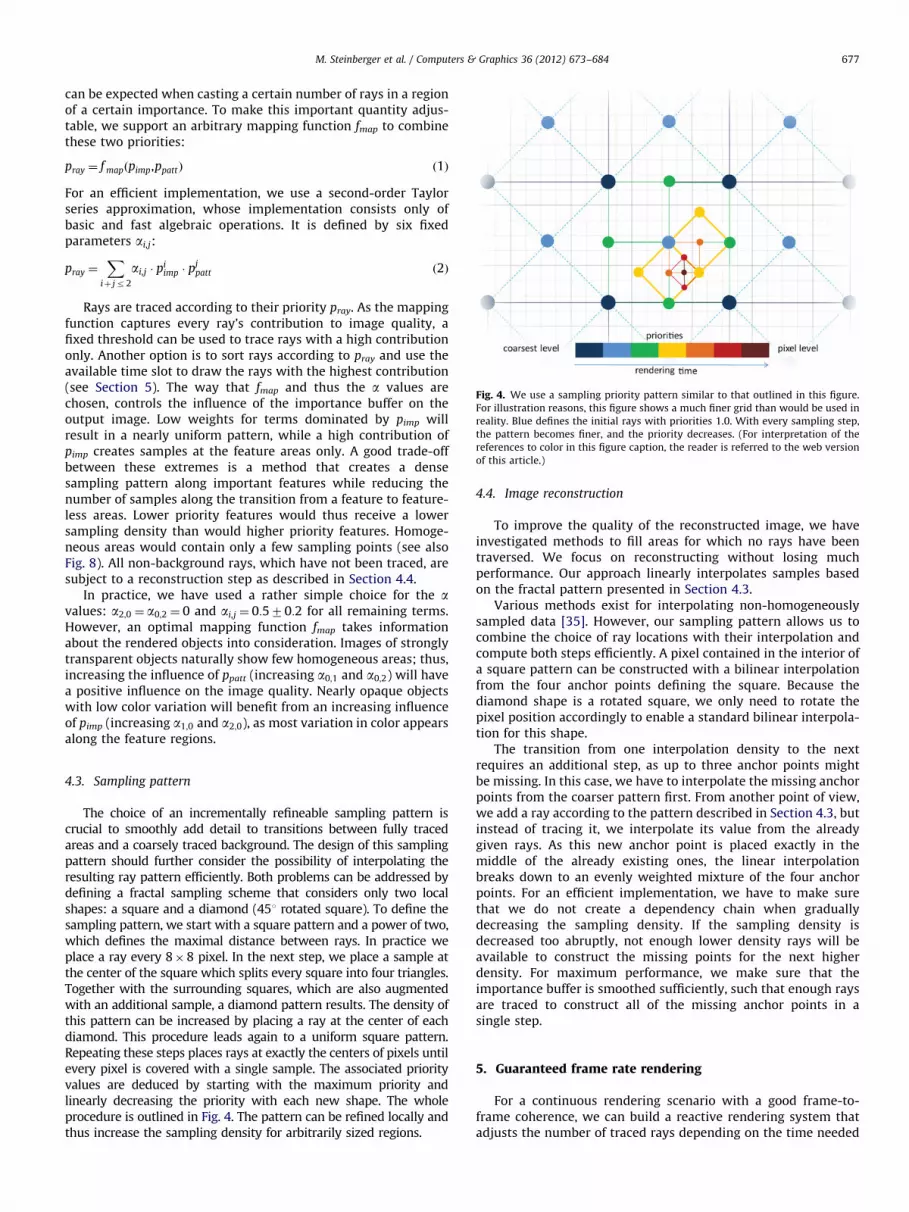
Fig. 4. We use a sampling priority pattern similar to that outlined in this figure.
For illustration reasons, this figure shows a much finer grid than would be used in
reality. Blue defines the initial rays with priorities 1.0. With every sampling step,
the pattern becomes finer, and the priority decreases. (For interpretation of the
references to color in this figure caption, the reader is referred to the web version
of this article.)
M. Steinberger et al. / Computers & Graphics 36 (2012) 673–684 677
can be expected when casting a certain number of rays in a regionof a certain importance. To make this important quantity adjus-table, we support an arbitrary mapping function fmap to combinethese two priorities:
pray ¼ f mapðpimp,ppattÞ ð1Þ
For an efficient implementation, we use a second-order Taylorseries approximation, whose implementation consists only ofbasic and fast algebraic operations. It is defined by six fixedparameters ai,j:
pray ¼X
iþ jr2
ai,j � piimp � p
jpatt ð2Þ
Rays are traced according to their priority pray. As the mappingfunction captures every ray’s contribution to image quality, afixed threshold can be used to trace rays with a high contributiononly. Another option is to sort rays according to pray and use theavailable time slot to draw the rays with the highest contribution(see Section 5). The way that fmap and thus the a values arechosen, controls the influence of the importance buffer on theoutput image. Low weights for terms dominated by pimp willresult in a nearly uniform pattern, while a high contribution ofpimp creates samples at the feature areas only. A good trade-offbetween these extremes is a method that creates a densesampling pattern along important features while reducing thenumber of samples along the transition from a feature to feature-less areas. Lower priority features would thus receive a lowersampling density than would higher priority features. Homoge-neous areas would contain only a few sampling points (see alsoFig. 8). All non-background rays, which have not been traced, aresubject to a reconstruction step as described in Section 4.4.
In practice, we have used a rather simple choice for the avalues: a2;0 ¼ a0;2 ¼ 0 and ai,j ¼ 0:570:2 for all remaining terms.However, an optimal mapping function fmap takes informationabout the rendered objects into consideration. Images of stronglytransparent objects naturally show few homogeneous areas; thus,increasing the influence of ppatt (increasing a0;1 and a0;2) will havea positive influence on the image quality. Nearly opaque objectswith low color variation will benefit from an increasing influenceof pimp (increasing a1;0 and a2;0), as most variation in color appearsalong the feature regions.
4.3. Sampling pattern
The choice of an incrementally refineable sampling pattern iscrucial to smoothly add detail to transitions between fully tracedareas and a coarsely traced background. The design of this samplingpattern should further consider the possibility of interpolating theresulting ray pattern efficiently. Both problems can be addressed bydefining a fractal sampling scheme that considers only two localshapes: a square and a diamond (451 rotated square). To define thesampling pattern, we start with a square pattern and a power of two,which defines the maximal distance between rays. In practice weplace a ray every 8�8 pixel. In the next step, we place a sample atthe center of the square which splits every square into four triangles.Together with the surrounding squares, which are also augmentedwith an additional sample, a diamond pattern results. The density ofthis pattern can be increased by placing a ray at the center of eachdiamond. This procedure leads again to a uniform square pattern.Repeating these steps places rays at exactly the centers of pixels untilevery pixel is covered with a single sample. The associated priorityvalues are deduced by starting with the maximum priority andlinearly decreasing the priority with each new shape. The wholeprocedure is outlined in Fig. 4. The pattern can be refined locally andthus increase the sampling density for arbitrarily sized regions.
4.4. Image reconstruction
To improve the quality of the reconstructed image, we haveinvestigated methods to fill areas for which no rays have beentraversed. We focus on reconstructing without losing muchperformance. Our approach linearly interpolates samples basedon the fractal pattern presented in Section 4.3.
Various methods exist for interpolating non-homogeneouslysampled data [35]. However, our sampling pattern allows us tocombine the choice of ray locations with their interpolation andcompute both steps efficiently. A pixel contained in the interior ofa square pattern can be constructed with a bilinear interpolationfrom the four anchor points defining the square. Because thediamond shape is a rotated square, we only need to rotate thepixel position accordingly to enable a standard bilinear interpola-tion for this shape.
The transition from one interpolation density to the nextrequires an additional step, as up to three anchor points mightbe missing. In this case, we have to interpolate the missing anchorpoints from the coarser pattern first. From another point of view,we add a ray according to the pattern described in Section 4.3, butinstead of tracing it, we interpolate its value from the alreadygiven rays. As this new anchor point is placed exactly in themiddle of the already existing ones, the linear interpolationbreaks down to an evenly weighted mixture of the four anchorpoints. For an efficient implementation, we have to make surethat we do not create a dependency chain when graduallydecreasing the sampling density. If the sampling density isdecreased too abruptly, not enough lower density rays will beavailable to construct the missing points for the next higherdensity. For maximum performance, we make sure that theimportance buffer is smoothed sufficiently, such that enough raysare traced to construct all of the missing anchor points in asingle step.
5. Guaranteed frame rate rendering
For a continuous rendering scenario with a good frame-to-frame coherence, we can build a reactive rendering system thatadjusts the number of traced rays depending on the time needed

0% 5% 20% 50% 100%0
0.1
0.2
0.3
0.4
0.5
Number of Rays
Geometric Objects: Pmap
0% 5% 20% 50% 100%0
20
40
60
80
100
Number of Rays
Geometric Objects: QMOS
0% 5% 20% 50% 100%0
0.2
0.4
0.6
0.8
Number of Rays
Volumetric Objects: Pmap
0% 5% 20% 50% 100%20
40
60
80
100
Number of Rays
Volumetric Objects: QMOS
M. Steinberger et al. / Computers & Graphics 36 (2012) 673–684678
for previous frames. This step is possible by dynamically adjustingthe threshold that defines which rays shall be rendered, i.e., bydecreasing a0;0 by a fixed value if the frame rates are too low. Ifthe scene is static and the camera is still, the rays traced in theprevious frame are reused, and we progressively add new rays byincreasing a0;0. Thus, the image converges to the highest quality.
There are scenarios in which the aforementioned approachwill fail. An unexpected load on the GPU, complex objectspopping up in the scene, or highly different viewing positionsprohibit us from deducing enough information for the next frame.However, in these cases, we can still rely on the ray priorities toguarantee the given update rates. We require an additionalsorting step before the actual ray tracing is conducted. Everyray’s priority is computed according to Section 4.2 and insertedinto a one-dimensional priority queue. In this scenario, theparameter a0;0 is irrelevant, because it has no influence on thesorting order. During the following rendering step, each block ofthreads fetches a set of rays from the front of the queue andprocesses them. This step is repeated until the available timeframe is nearly over. The use of this priority queue guaranteesthat the available time is spent on rays that have been classifiedas being the most important. For the sorting itself, we use a fixednumber of buckets instead of completely sorting the queue toincrease performance. As we cannot guarantee that all elementswithin a bucket will be processed, we randomize the order inevery bucket. Otherwise, the render order for similar ray prioritieswould match the insertion order, and the sampling density mightthus only increase locally.
Our experiments have shown that the reconstruction step’sexecution time is very short and has little variation. We can thusmeasure an upper bound for this step in the initialization phaseand reduce the time frame during the rendering accordingly tohave enough time for the reconstruction step. This setup enablesus to output a frame within the desired latency. The timemeasurement is performed on the graphics card itself, whichallows each block of threads to work autonomously withoutsynchronization via the host. For static scenes, we can again useour system for a progressive rendering. As low priority rays arestill present in the queue after the time frame is over, we cansimply re-launch the rendering kernel right after presenting thecurrent quality level. In this way, the next set of rays are tracedwithin the next time frame, and we are able to progressivelyupdate the scene with the next lowest ray importance level.
0% 5% 20% 50% 100%0
0.2
0.4
0.6
0.8
1
Number of Rays
Textured Objects: Pmap
0% 5% 20% 50% 100%0
20
40
60
80
100
Number of Rays
Textured Objects: QMOS
regular subsampling silhouettes
contour suggestive contoursand highlights
ridges and valleys
warped saliency
Fig. 5. These graphs compare the render quality in terms of the visibility (Pmap)
and mean-opinion-score quality (QMOS) reached by tracing a certain number of
rays according to different feature classifiers. The left column shows the result for
the difference predictor Pmap and the right columns shows the results obtained for
the mean-opinion-score predictor QMOS. Each row represent a different use case
scenario, whereas the numerical results were obtained from averaging multiple
datasets of varied complexity. For visual examples of the different classifiers see
Fig. 2.
6. Feature classification
To evaluate how features improve the visual quality of theresult, we have tested selected volume-rendered objects withdifferent transfer functions and ray-traced objects with andwithout textures and different physical properties (i.e., differentreflection and refraction coefficients). Rendering at a lowerresolution with bilinear interpolation served as a base-line con-dition. The upper visual quality bound is given by the groundtruth (ray tracing at full resolution). We evaluate subsequentlyhow the image quality improves when the number of rays castinto the scene is increased. Rays are subsequently added accord-ing to their importance defined by tested feature evaluationstrategy.
To quantify the visual improvements of different features, weuse the currently most advanced image comparison metrics, therecently published HDR-VDP-2 [6] method. Image comparisonmeans for our application to compare an image, which has beenproduced by our method, to the fully sampled ground truthimage. HDR-VDP-2 is a very useful tool for predicting the visual
quality as it is perceived by a human observer. The methodprovides two different comparison metrics.
The first metric is the visibility metric Pmap, which gives animage in which each pixel represents the probability of detectinga difference between the two input images. To derive a singlequantitative difference measure from this map, we compute itsaverage value. This value can be seen as the average probability ofdetecting a difference between the fully traced ground truthimage and the coarsely traced image. The second metric estimatesa quasi-subjective mean-opinion-score quality predictor QMOS,which would normally require an extensive user-study. There-fore, the authors of HDR-VDP-2 have tested over 20 differentvariations of value pooling strategies and compared their predic-tions to two different image quality databases. HDR-VDP-2revealed to be the best visibility and quality predictor [6] at thetime of this work.
Fig. 5 shows that all feature classifiers improve the imagequality during interaction, compared with the conventional reg-ular subsampling rendering. We believe the region between 5%and 100% of cast rays is the most interesting for our approach. It

Volume
MeshExtraction
Geometry
MeshPreparation
NPRLine Feature Rendering
PreviousColor Buffer
Visual Saliency Analysis
PreviousDepth Buffer
FeaturePriorities
Image Warping
Hole Closing + Disocclusions
Object Space Feature Buffer
Image Space Feature Buffer
Feature Buffer Combination
Importance Buffer
Ray Priority Evaluation + Ray Sorting
SamplingPriorities
Prep
roce
ssin
g
Priority Queue
Ray Tracing
Sparse Data Frame
Fractal Interpolation
Color Frame
Fig. 6. The rendering pipeline used for our perceptually guided ray tracing. Red
boxes denote data objects, green boxes represent CUDA kernels, orange boxes
indicate shader based OpenGL rendering, and blue boxes represent Optix Kernel
calls. (For interpretation of the references to color in this figure caption, the reader
is referred to the web version of this article.)
M. Steinberger et al. / Computers & Graphics 36 (2012) 673–684 679
yields acceptable image qualities according to the mean-opinion-score quality measure QMOS. In this region, the average probabilityof detecting a difference between the full quality image and theimage rendered with a reduced number of rays Pmap is approxi-mately twice as high for the conventional regular subsamplingapproach than for any of the proposed feature detection methods.We observed that the image-based feature detector based onvisual saliency performs very well for low ray counts, while itsperformance is approximately equal to the object space detectorsfor medium to high ray counts. In terms of object space featuredetectors, using a combination of exterior silhouettes and con-tours works best. Using the exterior silhouette leads to the bestresult for objects with a low interior feature count (e.g., glassobjects). For volumetric objects, the exterior silhouette initiallydoes not necessary improve the image quality, because it mightcover the whole dataset and exclude the (probably more impor-tant) internal features. Ridges and valleys as well as suggestivecontours and highlights overall contribute less to image qualitythan contours or silhouettes. If strongly textured objects arerendered, object space line features cannot predict the visualoutcome, which results in a performance comparable to conven-tional regular subsampling. However, applying our image spacevisual saliency measure significantly increases the image quality.
Based on our observations from automatic tests, we firstroughly classify the object space line features into strong visual
features and medium visual features. We do not introduce the classweak visual features here because we have already consideredregions on/in an object with no response to any feature extractionalgorithm as regions with a low image signal frequency. Ourexperiments show that contours in particular lead to a muchbetter relative perception during the scene interaction for ourtested scenes. Exterior silhouettes also yielded a good result in allof the tested scenes. Therefore, we categorize contours as strong
features (along with the external silhouettes as a subset of contours)and the remaining ones as medium features. In Section 5, wedirectly use the results from Fig. 5 to define static feature prioritylookup tables for each separate feature in a numerical way. Usingthe values measured in this section, we can provide good defaultvalues for the priority lookup tables. However, a user is still ableto alter these priorities in our system.
It is desirable to evaluate the importance of different featuresfor every frame independently. For a fully automatic evaluation ofthe image quality improvement of different features per frame,obtaining the ground truth is necessary, which is of course notfeasible during runtime. Therefore, users can alter the proposedfeature ranking in our system during runtime. Preliminary experi-ments with this option have shown that users tend to fullydisable object space features such as suggestive contours, sugges-tive highlights, ridges and valleys to gain higher frame rates.These features have also shown a low visual improvement duringour offline evaluation as previously outlined. Most users preferredto disable the image space feature generation based on visualsaliency for untextured objects and volumetric datasets. Fortextured objects, most users exclusively used the image spacevisual saliency warping for the importance buffer generation.
7. Implementation
In this section, we describe the implementation details of ourrendering pipeline as shown in Fig. 6. The preprocessing andfeature generation stages use a combination of OpenGL andCUDA. We have implemented the main part of our method aspart of the OptiX SDK [21], which we have enhanced with volumerendering abilities. OptiX provides a Cþþ/CUDA-based program-ming interface, which is specialized for ray-tracing applications.
Because several materials, like the glass effect, which has beenused in this work, are already implemented in the SDK, we onlyhad to extend the framework to include a volume material andspecialized ray generation programs (cameras) to support ourmethod.
In OptiX, a simple ray-tracing program normally consists of acombination of a hit function, a trace function, a miss function, anda camera for the ray setup. The main functions are executed per-ray. The hit function is used to intersect rays with object surfacesin the scene. The trace function evaluates the color contribution ofa ray between two intersections, and the miss function fills raysthat hit no geometry with a defined background color. Thesefunctions are implemented in separate CUDA files, which arepreprocessed by the OptiX SDK.
7.1. Mesh extraction
The object space feature evaluation requires a smooth surfacemesh. At that stage, we distinguished between a pure geometricinput for ray-tracing applications and volumetric datasets for adirect volume ray-casting. In the first case, an input mesh isdirectly available for the mesh preparation step. The second caserequires an intermediate step depending on the used volumetransfer function and the volume histogram. In our case, a transferfunction is defined by several color gradients, mapping a certainintensity range to a defined color and opacity. One can also definehigh-dimensional transfer functions for a better visual result (e.g.,using the gradient magnitude as a second dimension, as proposedby [45]). However, for an iso-surface extraction, the peak value ofthe direct (one-dimensional) mapping gradients or the projectionof the color gradient’s opacity peak to the intensity axis for high-dimensional transfer functions together with the peak of thevolume histogram is sufficient. Consequently, we define the

M. Steinberger et al. / Computers & Graphics 36 (2012) 673–684680
necessary iso-values for a multi-iso-surface extraction as thehighest peaks of the volume’s histogram, if the transfer functionis not zero at that position. We use a fast GPU-acceleratedmarching cubes implementation (CUDA version of the marchingcubes [46] algorithm) to extract the iso-surfaces whenever thetransfer function is changed. Because the resulting meshes areover-tessellated, we simplify this mesh with a GPU-based sim-plification method as described in the following paragraphs.
0 10 20 30 40 500
0.2
0.4
0.6
0.8
Frames per Second
Guaranteed Framerates: Pmap
0 10 20 30 40 500
20
40
60
80
100
Frames per Second
Guaranteed Framerates: QMOS
high feature count, untextured geom. ray-tracing
low feature count, untextured geom. ray-tracing
high feature count, textured geom. ray-tracing
high feature count, volumetric ray-casting
Fig. 7. These plots show the increase of the visibility metric Pmap and the decrease
7.2. Mesh preparation
The quality and size of surface meshes, used as inputs for ouralgorithm, vary dramatically. Ray-tracing applications are oftenapplied to high-quality meshes with hundreds of thousands oftriangles. The iso-surface meshes extracted from volumes areknown to be noisy and often contain lots of small triangles, whichcan be merged without a loss in quality. We thus use a combina-tion of mesh smoothing [47] and mesh simplification [48] togenerate meshes that fulfill our demands: (a) the mesh containslittle noise, (b) the number of faces is low enough to generate thefeature buffer quickly, and (c) main features from the originalmesh are conserved at the according position.
Our algorithm successively applies Taubin smoothing, meshsimplification and another instance of Taubin smoothing. The firstsmoothing step is especially important for iso-surfaces extractedfrom a volume. Taubin smoothing preserves the volume of themesh and thus also conserves the location of remaining features.Our implementation of the mesh simplification method is runonce per mesh as a preprocessing step and does not include anyview-dependent simplifications. A static simplification based on afixed error metric turned out to be sufficient for our demands.Both algorithms allow a highly parallel GPU-based implementa-tion, which enables low latency on input data changes. Theoverall process takes up to a second, depending on the meshcomplexity and the number of peaks in the transfer function.
of the mean-opinion-score quality predictor QMOS for increasing guaranteed frame
rates averaged over different datasets. The viewport for this test was 1024�768.
Note that, after a certain guaranteed frame rate, the time frame becomes too short
to render the important features. This issue becomes apparent in the plots by the
bend between 25 and 40 fps.
Table 1An overview over the average rendering times for each step and different objects
using our approach on our test system (variance o1%). For geometry, we tested
the Stanford Dragon, Buddah, and Bunny datasets, our Piggy dataset and some
simpler drinking glass meshes. For volume, we tested the 5123 datasets, MANIX
and FEET, with different transfer functions. The measured times refer to a
computation within a 1440�900 viewport. The object space feature frame and
the saliency warping was performed in full resolution, which is in general not
necessary. Note that not all rays on feature lines have to be computed. To obtain
high guaranteed frame rates that maintain a visual appealing result, low priority
features might be omitted by our algorithm from Section 5.
Rendering step Geometry(ms)
Volume(ms)
Av. ray count(#rays)
Object space features 2 3 –
Saliency warping 6 6 –
Rays on contours 10 11 31.461
Rays on ridges 8 9 23.356
Rays on silhouette 5 7 9.251
Rays on sug. highlights 8 9 17.122
Rays on sug. contours 5 7 15.549
Rays on valleys 5 6 9.646
Rays on saliency 12 13 35.678
Reconstruction 15 15 1,153,937
Sum 76 86 1,296,000
Ground truth 208 251 1,296,000
7.3. NPR line feature rendering
The object space feature frame is rendered by using anextended version of the publicly available framework providedby [34], which is based on the Princeton Trimesh2 library. Toprovide high frame rates for very complex objects, we extendedthis library with GPU-accelerated calculations. Therefore, wemoved all per-frame calculations (e.g. normal vector � viewingvector per geometry vertex) to CUDA kernel functions andattached the line-output to an OpenGL Vertex-Buffer object. Thisvertex buffer is subsequently rendered into an OpenGL Framebuf-
fer object, which is concurrently mapped as a texture in the OptiXcontext.
For volume rendering, we have also attempted a direct featureline extraction as proposed by Burns et al. [33]. Experiments withthe Burns system have shown that the frame rates are not as highas those obtained with iso-surfaces, which we use with theDeCarlo system, especially for very large volumes and multipletransfer function peaks. This fact can be explained by thedifference in the order of complexity when processing a surface(Oðn2Þ) compared to processing a volume dataset (Oðn3Þ). Becauseiso-surfaces for the feature frame generation only have to berecalculated when the transfer function changes, we have decidedto use the feature extraction approach from De Carlo et al.However, it would also be possible to use the approach of Burnset al. because it also shows frame rates that are high enough tomeet our two-pass rendering criteria for certain cases.
7.4. Visual saliency analysis
To generate the image space feature frame, we require apreviously rendered frame. In order to match the current view asclosely as possible, we use the last rendered frame and compute itsbottom-up visual saliency [4]. We use GLSL shaders to convert theimage into the CIELab space and to build the image pyramid requiredfor the saliency computation. To efficiently build the image pyramid,we apply separable Gaussian filtering with multiple render targets,each representing a different scale. In a final pass, the saliency ofeach pixel is computed from the image pyramid.
7.5. Image warping and hole closing
The saliency buffer is mapped as a texture in the OptiXcontext. In a first launch, we use the depth information

M. Steinberger et al. / Computers & Graphics 36 (2012) 673–684 681
from the previously generated frame to warp the saliencybuffer to match the current view. Because the previouslygenerated frame was also constructed using our adaptivemethod, its depth information may be available as a sparselypopulated buffer only. Hence, holes may arise during the warpingprocess. In a second pass, we close these holes using a nearestneighbor search with a search frame size chosen according to the
Our Sampling Pattern Our Recon
full
sam
plin
g15
fps
30 f
ps40
fps
60 f
ps
Fig. 8. This figure illustrates the decreasing ray count with increasing requested guaran
column shows the actual pixels that have been traced, and the middle column shows the
of the left column are the edge images of the traced pixels to emphasize their position
regular subsampling pattern with a linear interpolation for comparison.
sampling pattern of the last frame. If no warped information isfound in the vicinity of the target position, the hole mostlikely stems from a disocclusion. We fill these holes with amedium importance value of 0.5. This empirically determinedvalue proved to be a good compromise between ignoringunknown previously hidden areas and rendering them in fullquality.
struction Regular Sampling
teed frame rates for the Happy Buddha dataset in a 1024�768 viewport. The left
result with our fractal pattern interpolation scheme. The 40 fps and 60 fps images
s in the printed versions of this paper. The right column shows the results using a

M. Steinberger et al. / Computers & Graphics 36 (2012) 673–684682
7.6. Importance buffer and ray setup
The importance buffer is formed from the feature buffers usinga max operator. The ray priority is determined from the impor-tance buffer and a fixed sampling priority as described in Section4.2. After the rays have been sorted according to their priority theray tracing is carried out. To reduce the number of ray fetchesfrom the priority queue, rays are fetched in groups of 32. For theray tracing itself we use a pinhole camera model.
7.7. Volume rendering
We have implemented a standard ray-casting approach as amaterial trace function. In contrast to tight-fitting boundinggeometry volume rendering systems, the volume bounding geo-metry can be a simple cube or a sphere instead of a tight fittingone. This detail reduces the necessary intersection calculationsand maximizes the thread coherence, which was stated by [21] tobe one of the most important factors for an efficient execution.Because every ray can store a certain amount of payload, we savethe entrance point and the exit point of the hit function in everyray’s payload structure. After transforming these two points tothe volume object space, we let every ray accumulate all thevalues in between, depending on the given transfer function. Inaddition, the values are shaded according to the Phong illumina-tion model depending on the approximated volume gradient.
7.8. Fractal interpolation
The reconstruction based on the fractal interpolation schemeas described in Section 4.3 requires two passes. In the first pass,we reconstruct those anchor points, which have four availablesurrounding anchor points. This pass guarantees smooth transi-tions from one fractal level to the next. In the second pass, we useinformation from the importance buffer and the priority queue filllevel to estimate the trace level in the vicinity of the pixel. Based
Fig. 9. This figure illustrates the decreasing quality with increasing requested guaran
complex lighting model combining procedural texturing, reflections, and refractions. T
detectors, thus we also apply an image space saliency detector. The second row shows
previously rendered frame and warped according to the current view. The gray area nex
from the previous frame is available due to viewpoint motion. Note that the saliency res
image space saliency evaluation is that by decreasing the number of traced rays the
interpretation of the references to color in this figure caption, the reader is referred to
on this initial guess, we search for available anchor points andinterpolate the pixel’s color from the found anchor points.
8. Results
In Section 6, we present our results on how much a certain featurecan improve the visual quality. In this section, we evaluate theperformance of the overall system. Our test system is equipped withan Intel i7 Processor, 6 GB System memory and an Nvidia Quadro6000 graphics card. Fig. 7 shows the increase of the visibility metricPmap and the decrease of the mean-opinion-score quality predictorQMOS for increasing guaranteed frame rates. With our feature adaptivesampling strategy, non-important rays are omitted first, whichincreases framerates dramatically while the image quality is influ-enced little.
The feature importance buffer can be generated with up to 1000frames per second on a modern graphics workstation in a moderateviewport and it does not need to be of the same size as the renderframe. For quality estimation, we use the fractal pattern interpolationimage reconstruction method, as described in Section 4.4. Table 1gives an overview of the computation times of our method comparedwith the unaltered ground truth. Figs. 8–10 show the decrease ofquality with an increasing frame rate demand for different objecttypes. The image quality remains subjectively stable, as long as theframe rate is reasonably adjusted. Fig. 8 also shows the pixels that arerequired to calculate a full ray traversal and compares our imagereconstruction method to a regular subsampling with linear inter-polation. Fig. 9 shows the quality decrease for a textured object andthe associated image space feature frames. Fig. 10 shows the qualitydecrease for a volumetric object.
9. Conclusions and future work
This paper presents a novel method for integrating perceptualfeatures into a rendering environment as a quality hint for the
teed frame rates for the Piggy dataset in a 1024�768 viewport rendered with a
he textural effects cannot be detected by the geometry-based object space feature
the response of this saliency detector applied to a four-fold-smaller version of the
t to the pig’s mouth (red arrow) indicates a disocclusion, for which no information
ponse is especially high at the borders of the reflective patches. One problem of the
image gets more blurry and thus the saliency response is also less accurate. (For
the web version of this article.)

Fig. 10. This figure illustrates the decreasing quality with increasing requested guaranteed frame rates for a 5123 volumetric dataset in a 1024�768 viewport. In image
(b) the low priority features at the side are discarded to reach the requested frame rate. The important parts of the foot are still very well presented. To meet 40 fps (c), the
number of contour forming rays is reduced, which causes coarser borders of the bones.
M. Steinberger et al. / Computers & Graphics 36 (2012) 673–684 683
required granularity during a ray-based rendering. To analyze thescene for geometric features, we utilize Non-Photorealistic Ren-dering techniques, which can be evaluated efficiently. To analyzetextured objects, we utilize image space saliency combined withimage warping to infer information from previously renderedframes. We show that higher frame rates are achievable duringthe scene interaction without a severe loss of image quality. Ourmethod outperforms the state-of-the-art implementation ofadaptive rendering, for example, delivered with the OptiX SDK,in terms of speed and quality.
We have performed a quantitative evaluation of the perceptualfeatures to determine their impact on the visual quality and toshow which features are best suited for adaptive ray-based imagegeneration. Our algorithm can therefore also be used to achieveguaranteed frame rates by sorting the image pixels according tothe feature priorities. Our algorithm is mainly intended for highlycomplex ray-based calculations, such as volume rendering, andfor systems that require that object rendering does not occupy thewhole computation unit (e.g., concurrently performed GPU-basedsimulation and segmentation).
We plan to perform a larger user study with different ray-tracing materials and ray-casted volumetric objects. From such awork, we expect a qualitatively founded classification of salientobject features to answer the question of which feature worksbest for a particular type of object by means of human perception.In this work, we show evidence that contours are the mostvaluable feature of an object in terms of mathematically esti-mated image error and quality. However, to better qualify theremaining, less distinctive features, a deeper analysis will have tobe performed with a sufficient number of human subjects, eventhough the HDR-VDP-2 metric approximates the outcome of aprospective user-study about the visual quality of images alreadyquite well, as shown by Mantiuk et al. [6].
Acknowledgments
We would like to thank Morgan McGuire (Williams College)and Marc Streit (Graz University of Technology) for their valuablecomments and Doug DeCarlo and Michael Burns (PrincetonUniversity) for providing their source code. This work was fundedby the European Union in FP7 VPH initiative under Contract no.223877 (IMPPACT) and the Austrian Science Fund (FWF) underContract P23329-N23.
References
[1] Dayal A, Woolley C, Watson B, Luebke D. Adaptive frameless rendering. In:ACM SIGGRAPH 2005 courses, SIGGRAPH’05; 2005. p. 24.
[2] Painter J, Sloan K. Antialiased ray tracing by adaptive progressive refinement.In: ACM SIGGRAPH computer graphics, SIGGRAPH’89 proceedings of the 16th
annual conference on computer graphics and interactive techniques, vol. 23,no. 3; 1989. p. 281–8.
[3] Cole F, Golovinskiy A, Limpaecher A, Barros HS, Finkelstein A, Funkhouser T,et al. Where do people draw lines? ACM Transactions on Graphics(TOG)—proceedings of ACM SIGGRAPH 2008 2008;27(3):88:1–88:11.
[4] Itti L, Koch C, Niebur E. A model of saliency-based visual attention for rapidscene analysis. IEEE Trans Pattern Anal Mach Intell 1998;20(11):1254–9.
[5] Kainz B, Steinberger M, Hauswiesner S, Khlebnikov R, Schmalstieg D.Stylization-based ray prioritization for guaranteed frame rates. In: Proceed-ings of the ACM SIGGRAPH/eurographics symposium on non-photorealisticanimation and rendering, NPAR’11. ACM; 2011. p. 43–54.
[6] Mantiuk R, Kim KJ, Rempel AG, Heidrich W. HDR-VDP-2: a calibrated visualmetric for visibility and quality predictions in all luminance conditions. ACMTransactions on Graphics (TOG)—proceedings of ACM SIGGRAPH 20112011;30(11):40:1–14.
[7] Mitchell DP. Generating antialiased images at low sampling densities. ACMSIGGRAPH computer graphics, SIGGRAPH’87 proceedings of the 14th annualconference on computer graphics and interactive techniques, vol. 21, no. 4;1987. p. 65–72.
[8] Schroeder W, Martin KM, Lorensen WE. The visualization toolkit: an object-oriented approach to 3D graphics. second ed.Prentice-Hall, Inc; 1998.
[9] Wald I, Benthin C, Slusallek P. OpenRT—a flexible and scalable renderingengine for interactive 3D graphics. Technical report, CG Group, SaarlandUniversity; 2002.
[10] Dippe MAZ, Wold EH. Antialiasing through stochastic sampling. ACMSIGGRAPH computer graphics, SIGGRAPH’85 proceedings of the 12th annualconference on computer graphics and interactive techniques, vol. 19 no. 3;1985. p. 69–78.
[11] Notkin I, Gotsman C. Parallel progressive ray-tracing. Comput GraphicsForum 1997;16(1):43–55.
[12] Levoy M. Volume rendering by adaptive refinement. Visual Comput1990;6(1):2–7.
[13] Danskin J, Hanrahan P. Fast algorithms for volume ray tracing. In: Proceed-ings of the 1992 workshop on volume visualization, VVS’92; 1992. p. 91–8.
[14] Weiler M, Westermann R, Hansen C, Zimmerman K, Ertl T. Level-of-detailvolume rendering via 3d textures. In: Proceedings of the 2000 IEEE sympo-sium on volume visualization, VVS’00; 2000. p. 7–13.
[15] Kraus M, Ertl T. Topology-guided downsampling. In: Proceedings of thevolume graphics 2011, VG’11. Springer computer science. Wien, New York:Springer Verlag; 2001. p. 223–34.
[16] La Mar EC, Hamann B, Joy KI. Multiresolution techniques for interactivetexture-based volume visualization. In: Proceedings of the 10th IEEE visua-lization 1999, VIS’99. IEEE Computer Society; 1999. p. 355–61.
[17] Boada I, Navazo I, Scopigno R. Multiresolution volume visualization with atexture-based octree. Visual Comput 2001;17(3):185–97.
[18] Parker S, Martin W, Sloan P, Shirley P, Smits B, Hansen C. Interactive ray tracing.In: Proceedings of the interactive 3D graphics, I3D’99; 1999. p. 119–26.
[19] Wald I, Mark WR, Gunther J, Boulos S, Ize T, Hunt W, et al. State of the artin ray tracing animated scenes. In: STAR proceedings of EG 2007; 2007.p. 89–116.
[20] Seiler L, Carmean D, Sprangle E, Forsyth T, Abrash M, Dubey P, et al. Larrabee:a many-core x86 architecture for visual computing. ACM transactions ongraphics (TOG)—proceedings of ACM SIGGRAPH 2008 2008;27(3):18:1–15.
[21] Parker SG, Bigler J, Dietrich A, Friedrich H, Hoberock J, et al. Optix: a generalpurpose ray tracing engine. ACM Transactions on Graphics (TOG)—proceed-ings of ACM SIGGRAPH 2010 2010;29(4):66:1–13.
[22] Li W, Mueller K, Kaufman A. Empty space skipping and occlusion clipping fortexture-based volume rendering. In: Proceedings of the 14th IEEE visualiza-tion 2003, VIS’03; 2003. p. 42.
[23] Wald I, Friedrich H, Marmitt G, Slusallek P, Seidel H-P. Faster isosurface raytracing using implicit KD-trees. IEEE Trans Visualization Comput Graphics2005;11(5):562–72.
[24] Wang Q, JaJa J. Interactive high-resolution isosurface ray casting on multicoreprocessors. IEEE Trans Visualization Comput Graphics 2008;14(3):603–14.
[25] Engel K, Kraus M, Ertl T. High-quality pre-integrated volume rendering usinghardware-accelerated pixel shading. In: Proceedings of the ACM SIGGRAPH/EUROGRAPHICS workshop on graphics hardware, HWWS’01; 2001. p. 9–16.
M. Steinberger et al. / Computers & Graphics 36 (2012) 673–684684
[26] Freund J, Sloan K. Accelerated volume rendering using homogeneous regionencoding. In: Proceedings of the 8th conference on visualization, VIS’97;1997. p. 191–196.
[27] Fernando R. GPU gems: programming techniques, tips and tricks for real-time graphics. Pearson Higher Education; 2004.
[28] Lee ME, Redner RA, Uselton SP. Statistically optimized sampling for dis-tributed ray tracing. In: Proceedings of the 12th annual conference oncomputer graphics and interactive techniques, vol. 19, no. 3; 1985. p. 61–8.
[29] Ramasubramanian M, Pattanaik SN, Greenberg DP. A perceptually basedphysical error metric for realistic image synthesis. In: Proceedings of the 26thannual conference on computer graphics and interactive techniques, SIG-GRAPH’99. ACM; 1999. p. 73–82.
[30] Gao D, Vasconcelos N. Discriminant saliency for visual recognition fromcluttered scenes. In: Saul LK, Weiss Y, Bottou l, editors. Advances in neuralinformation processing systems, vol. 17. MIT Press; 2005. p. 481–8.
[31] Gao D, Mahadevan V, Vasconcelos N. On the plausibility of the discriminantcenter-surround hypothesis for visual saliency. J. Vision 2008;8(7) 13:1–18.
[32] Bruckner S. Interactive illustrative volume visualization. PhD thesis, Instituteof Computer Graphics and Algorithms, Vienna University of Technology,Favoritenstrasse 9-11/186, A-1040 Vienna, Austria; March 2008.
[33] Burns M, Klawe J, Rusinkiewicz S, Finkelstein A, DeCarlo D. Line drawingsfrom volume data. ACM Transactions on Graphics (TOG)—proceedings ofACM SIGGRAPH 2005 2005;24(3):512–8.
[34] DeCarlo D, Rusinkiewicz S. Highlight lines for conveying shape. In: Interna-tional symposium on non-photorealistic animation and rendering (NPAR),NPAR’07; 2007. p. 63–70.
[35] Amidror I. Scattered data interpolation methods for electronic imagingsystems: a survey. J Electron Imaging 2002;11(2):157–76.
[36] Gortler SJ, Grzeszczuk R, Szeliski R, Cohen MF. The lumigraph. In: Proceedingsof the 23rd annual conference on computer graphics and interactivetechniques, SIGGRAPH’96; 1996. p. 43–54.
[37] Grossman JP, Dally WJ. Point sample rendering. In: Rendering techniques.Berlin, Heidelberg: Springer; 1998. p. 181–92.
[38] Pfister H, Zwicker M, van Baar J, Gross M. Surfels: surface elements asrendering primitives. In: Proceedings of the computer graphics and inter-active techniques, SIGGRAPH’00; 2000. p. 335–42.
[39] Marroquim R, Kraus M, Cavalcanti PR. Special section: point-based graphics:efficient image reconstruction for point-based and line-based rendering.Comput Graphics 2008;32(2):189–203.
[40] McMillan L, Bishop G. Plenoptic modeling: an image-based rendering system.In: Proceedings of the 22nd annual conference on computer graphics andinteractive techniques, SIGGRAPH’95. ACM; 1995. p. 39–46.
[41] Mark WR, McMillan L, Bishop G. Post-rendering 3d warping. In: Proceedingsof the 1997 symposium on interactive 3D graphics, I3D’97. ACM; 1997.p. 7–16.
[42] Hauswiesner S, Kalkofen D, Schmalstieg D. Multi-frame rate volume render-ing. In: Eurographics symposium on parallel graphics and visualization,EGPGV’10. Eurographics Association; 2010. p. 19–26.
[43] Pomi A, Slusallek P. Interactive ray tracing for virtual TV studio applications.J Virtual Reality Broadcast 2005;2(1):1–10.
[44] Jeschke S, Wimmer M, Schumann H, Purgathofer W. Automatic impostorplacement for guaranteed frame rates and low memory requirements. In:Proceedings of the 2005 symposium on interactive 3D graphics and games,I3D’05. ACM; 2005. p. 103–10.
[45] Kniss J, Kindlmann G, Hansen C. Interactive volume rendering using multi-dimensional transfer functions and direct manipulation widgets. In: Proceed-ings of the conference on visualization, VIS’01; 2001. p. 255–62.
[46] Lorensen WE, Cline HE. Marching cubes: a high resolution 3d surfaceconstruction algorithm. ACM SIGGRAPH computer graphics, SIGGRAPH’87proceedings of the 14th annual conference on computer graphics andinteractive techniques, vol. 21, no. 4; 1987. p. 163–9.
[47] Taubin G. A signal processing approach to fair surface design. In: Proceedingsof the 22nd annual conference on computer graphics and interactivetechniques, SIGGRAPH’95; 1995. p. 351–8.
[48] Luebke D, Erikson C. View-dependent simplification of arbitrary polygonalenvironments. In: Proceedings of the 24th annual conference on computergraphics and interactive techniques, SIGGRAPH’97; 1997. p. 199–208.