rare earth phosphate powders repo4·nh2o (re=la, ce or y)—part i. synthesis and characterization
TRANSCRIPT

Journal of Solid State Chemistry 177 (2004) 1302–1311
ARTICLE IN PRESS
�Correspond
E-mail addr
0022-4596/$ - se
doi:10.1016/j.js
Rare earth phosphate powders RePO4 � nH2O(Re=La, Ce or Y)—Part I. Synthesis and characterization
S. Lucas,a E. Champion,a,� D. Bregiroux,a,b D. Bernache-Assollant,a and F. Audubertb
aScience des Procedes Ceramiques et de Traitements de Surface, Universite de Limoges, UMR CNRS 6638, 123,
Avenue Albert Thomas, 87060 Limoges Cedex, FrancebCEA Cadarache, DEN/DED/SEP/LCC, 13108 Saint Paul lez Durance, France
Received 22 July 2003; received in revised form 30 October 2003; accepted 6 November 2003
Abstract
Rare earth phosphate powders (Re=La, Ce or Y) were synthesized from an aqueous precipitation method. The effect of
temperature, pH, ripening time and Re/P mole ratio of the initial reagents was investigated. Elementary analysis, surface area and
bulk density measurements, FT-infrared spectroscopy, X-ray diffraction and SEM observations were performed to characterize the
precipitates. All the powders of hydrated form (La, Ce or Y)PO4 � nH2O were single phase. They exhibited a Re/P mole ratio smaller
than 1 due to residual H3PO4 adsorbed at their surface. A unit formula could be written as RePO4 � nH2O � (H3PO4)x with nE0:5 (forRe=La or Ce) or n ¼ 2 (for Re=Y) and xo0:1: High-temperature thermogravimetry was necessary to detect these residuals andinsure the purity of the powders. The precipitation of lanthanum or cerium phosphates was slow, resulting in powders with a high
specific surface. The precipitation of yttrium phosphate was faster and significant crystal growth occurred during the ripening, which
resulted in a whisker-like morphology and a very low specific surface.
r 2003 Elsevier Inc. All rights reserved.
Keywords: Rare earth phosphate; Powder synthesis; Rhabdophane; Churchite; Precipitation; Polytrioxophosphate
1. Introduction
Rare earth phosphates (RePO4) have a wide range ofpotential applications either in the form of powders,coatings or dense sintered parts. They have become ofgrowing interest during the past few years and numerousresearches have been devoted to these compounds in thefield of ceramic materials for the development of eitherlaminate composites, fiber–matrix interfaces in ceramicmatrix composites or thermal protection coatings [1–7].They were also investigated as potential matrices for thespecific conditioning of separated long-lived radionu-clides such as trivalent actinides [8,9] or as solid-stateprotonic conductors [10].Several authors reported the synthesis of rare earth
phosphate compounds via different methods such as wetchemical precipitation, sol–gel, hydrothermal or high-temperature solid-state reactions [11–26]. The physico-chemical properties of the powders, which depend on
ing author. Fax: +33-555457586.
ess: [email protected] (E. Champion).
e front matter r 2003 Elsevier Inc. All rights reserved.
sc.2003.11.003
the synthesis route, i.e., the chemical composition,the crystalline structure, the grain size and the morpho-logy, influence the thermal behavior and the sinteringof ceramic materials and therefore their finalphysico-chemical properties. So, they are of primeimportance in the manufacturing processes. But, nostudy concerned rare earth phosphates through theinfluence of the synthesis parameters on both thecharacteristics of the resulting powders and furtherceramic processing.This paper is the first part of a study devoted to the
synthesis, characterization and thermal behavior ofthree rare earth phosphate powders (Re=La, Ce orY). It is the component of a systematic approachdedicated to the elaboration of RePO4 ceramics that willalso concern the sintering behavior and the properties ofphosphate-based materials. The present work deals withthe synthesis of powders using a wet chemical methodand with their characterization. The influence of thesynthesis parameters, i.e., the temperature, pH, concen-tration of the initial reagents and ripening time, on theprecipitate characteristics is reported.

ARTICLE IN PRESSS. Lucas et al. / Journal of Solid State Chemistry 177 (2004) 1302–1311 1303
2. Materials and methods
2.1. Powder synthesis
The powders were prepared by an aqueous precipita-tion method from the addition of a rare earth chloridesolution (LaCl3 � 7H2O; CeCl3 � 7H2O, YCl3 � 6H2O—Analytical grade, Aldrich, France) into a reactorcontaining a phosphate solution. Depending on thepH of the synthesis, the phosphating reagent was eitherphosphoric acid (H3PO4, Analytical grade, Aldrich) ordiammonium hydrogenphosphate ((NH4)2HPO4, Ana-lytical grade, Aldrich). The concentration of thesolutions was 0.4mol L�1 for a Re/P mole ratio of theinitial reagents equal to 1. They were fixed at 0.4 and0.2mol L�1 for a Re/P ratio of 2:1 and at 0.2 and0.6mol L�1 for a Re/P of 1:3. The synthesis device was afully automated apparatus. The rare earth-containingsolution was added, at a rate of 30mLmin�1, using aperistaltic pump. The pH was maintained at a constantvalue by the addition of an ammonium hydroxidesolution (NH4OH, analytical grade, Aldrich) using a pHstat (Hanna Instruments, USA). The temperature wascontrolled and regulated (IKA Labortechnik, Ger-many). The suspension was continuously stirred andrefluxed. After the complete addition of the rare earthsolution, the suspension was ripened for various times,then centrifugated. The resulting precipitate was washedwith distilled water, centrifugated three times, andfinally dried at 80�C. The conditions of synthesis usedand the associated precipitate references are summarizedin Table 1.
Table 1
Synthesis parameters for various conditions
Reference pH Phosphate
reagent
Initial Re/P
(mole ratio)
Temperature
(�C)Ripening
time (h)
LaP Tamb o1 H3PO4 1 Ambient 0
LaP T30h00 o1 H3PO4 1 30 0
LaP T30h20 o1 H3PO4 1 30 20
LaP T50h00 o1 H3PO4 1 50 0
LaP T50h20 o1 H3PO4 1 50 20
LaP T70h20 o1 H3PO4 1 70 20
LaP T80h00 o1 H3PO4 1 80 0
LaP T90hxx o1 H3PO4 1 90 0–336
LaP 2:1 o1 H3PO4 2/1 Ambient 0
LaP 1:3 o1 H3PO4 1/3 Ambient 0
LaP pH3 3 (NH4)2HPO4 1 30 0
LaP pH9 9 (NH4)2HPO4 1 30 0
CeP T50h20 o1 H3PO4 1 50 20
PY T30h00 o1 H3PO4 1 30 0
YP T30h01 o1 H3PO4 1 30 1
YP T50h00 o1 H3PO4 1 50 0
YP T50h01 o1 H3PO4 1 50 1
YP T50h02 o1 H3PO4 1 50 2
YP T50h05 o1 H3PO4 1 50 5
YP T70h00 o1 H3PO4 1 70 0
YP T70h01 o1 H3PO4 1 70 1
2.2. Powder characterization
X-ray powder diffraction (XRD) patterns wererecorded from 10� to 60� with a yX2y diffractometer(CuKa radiation, Siemens, Model D5000, Germany).The crystalline phases were determined from thecomparison of registered patterns with the InternationalCenter for Diffraction Data (ICDD)—Powder Diffrac-tion Files (PDF). Elementary analyses were realized byan inductively coupled plasma method (ICP-MS) inorder to determine the Re/P mole ratio of theprecipitates with a deviation of 70.04. Infrared spectraof powders (FTIR) were recorded in the range 400–4000 cm�1 on a Fourier-transform spectrometer (PerkinElmer, Spectrum 1, USA) with a resolution of 4 cm�1.The powder samples were mixed with KBr, then pressedin a 13mm cylindrical die. Thermogravimetric analyses(TGA), which will be discussed in detail in Part II, wereperformed up to 1500�C under nitrogen gas flow (TAinstruments, model SDT 2960, USA) in order to precisesome of the powder properties.The specific surface area of powders (SA) was
measured by the BET method (analyzer MicromeriticsASAP 2010, USA) after degassing the solid undervacuum at 100�C for 24 h. The bulk density of thepowders was measured using helium pycnometry(Micromeritics Accupyc 1330 V2.01, USA). The values,given with a deviation of 70.02, were an average of 10measurements. Scanning electron microscopy (SEM)was used for morphological observations (Philips XL30, The Netherlands).
3. Results and discussion
3.1. Lanthanum and cerium phosphates
3.1.1. General characteristics of the precipitates
The synthesis of lanthanum and cerium phosphatesled to powdered samples with similar physico-chemicalproperties. Typical XRD patterns of the precipitates aregiven in Fig. 1. Whatever the synthesis parametersconsidered, only one crystalline phase was detected.Both La and Ce phosphate powders exhibited ahexagonal structure of the rhabdopphane-type com-pounds LaPO4 � 0.5H2O (ICDD-PDF 46-1439) orCePO4�H2O (PDF 35-0614). The width of the diffrac-tion lines indicated a low crystallinity of this phase. Thewater content of these hydrated compounds wasdetermined from thermogravimetric analyses. The n
values are summarized in Table 2. The hydration wasalmost constant with nE0:6 mol. The elementaryanalyses led to a Re/P mole ratio between 0.90 and0.96, i.e., lower than the stoichiometric value of 1, whichmeans that the precipitates always contained anexcess of phosphorus (or were Re-deficient). All the
ARTICLE IN PRESSS. Lucas et al. / Journal of Solid State Chemistry 177 (2004) 1302–13111304
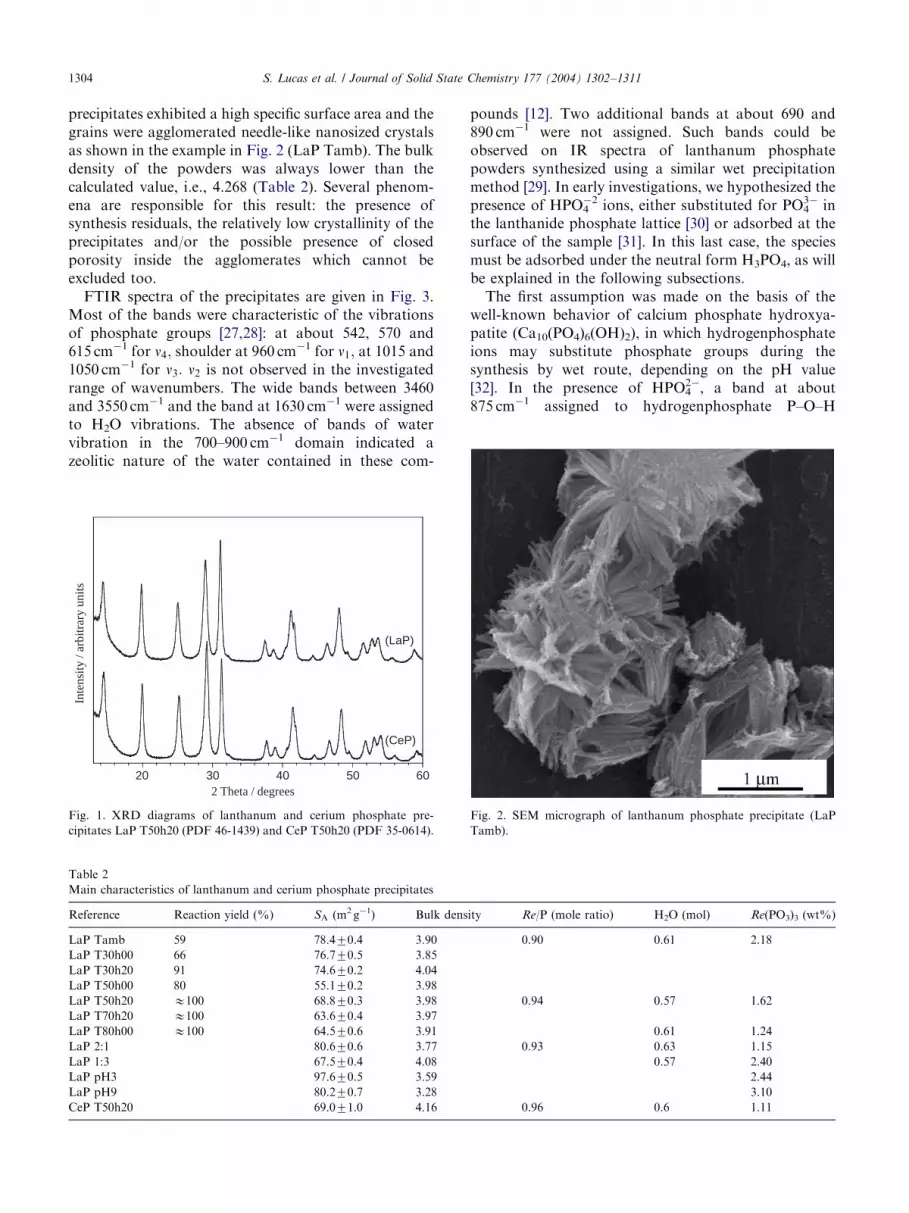
precipitates exhibited a high specific surface area and thegrains were agglomerated needle-like nanosized crystalsas shown in the example in Fig. 2 (LaP Tamb). The bulkdensity of the powders was always lower than thecalculated value, i.e., 4.268 (Table 2). Several phenom-ena are responsible for this result: the presence ofsynthesis residuals, the relatively low crystallinity of theprecipitates and/or the possible presence of closedporosity inside the agglomerates which cannot beexcluded too.FTIR spectra of the precipitates are given in Fig. 3.
Most of the bands were characteristic of the vibrationsof phosphate groups [27,28]: at about 542, 570 and615 cm�1 for n4; shoulder at 960 cm
�1 for n1; at 1015 and1050 cm�1 for n3: n2 is not observed in the investigatedrange of wavenumbers. The wide bands between 3460and 3550 cm�1 and the band at 1630 cm�1 were assignedto H2O vibrations. The absence of bands of watervibration in the 700–900 cm�1 domain indicated azeolitic nature of the water contained in these com-
Table 2
Main characteristics of lanthanum and cerium phosphate precipitates
Reference Reaction yield (%) SA (m2 g�1) Bulk dens
LaP Tamb 59 78.470.4 3.90
LaP T30h00 66 76.770.5 3.85
LaP T30h20 91 74.670.2 4.04
LaP T50h00 80 55.170.2 3.98
LaP T50h20 E100 68.870.3 3.98
LaP T70h20 E100 63.670.4 3.97
LaP T80h00 E100 64.570.6 3.91
LaP 2:1 80.670.6 3.77
LaP 1:3 67.570.4 4.08
LaP pH3 97.670.5 3.59
LaP pH9 80.270.7 3.28
CeP T50h20 69.071.0 4.16
20 30 40 50 60
Inte
nsity
/ ar
bitr
ary
units
2 Theta / degrees
(CeP)
(LaP)
Fig. 1. XRD diagrams of lanthanum and cerium phosphate pre-
cipitates LaP T50h20 (PDF 46-1439) and CeP T50h20 (PDF 35-0614).
pounds [12]. Two additional bands at about 690 and890 cm�1 were not assigned. Such bands could beobserved on IR spectra of lanthanum phosphatepowders synthesized using a similar wet precipitationmethod [29]. In early investigations, we hypothesized thepresence of HPO4
�2 ions, either substituted for PO43� in
the lanthanide phosphate lattice [30] or adsorbed at thesurface of the sample [31]. In this last case, the speciesmust be adsorbed under the neutral form H3PO4, as willbe explained in the following subsections.The first assumption was made on the basis of the
well-known behavior of calcium phosphate hydroxya-patite (Ca10(PO4)6(OH)2), in which hydrogenphosphateions may substitute phosphate groups during thesynthesis by wet route, depending on the pH value[32]. In the presence of HPO4
2�, a band at about875 cm�1 assigned to hydrogenphosphate P–O–H
ity Re/P (mole ratio) H2O (mol) Re(PO3)3 (wt%)
0.90 0.61 2.18
0.94 0.57 1.62
0.61 1.24
0.93 0.63 1.15
0.57 2.40
2.44
3.10
0.96 0.6 1.11
Fig. 2. SEM micrograph of lanthanum phosphate precipitate (LaP
Tamb).

ARTICLE IN PRESS
5001000150020002500300035004000
* *
H2O
H2O
**
Wavenumber / cm-1
O-H O-H(YP T50h01)
(YP T50h00)
(LaP)
(CeP)
1
4
3
Fig. 3. FTIR spectra of lanthanum (LaP T30h00), cerium (CeP
T50h20) and yttrium (YP T50h00 and YP T50h01) phosphate
precipitates.
-8
-7
-6
-5
-4
-3
-2
-1
0
0 200 400 600 800 1000 1200 1400
1 h
24 h
48 h
144 h
336 h
Temperature / ˚C
Wei
ght c
hang
e ∆m
/m (
%)
Fig. 4. TGA of lanthanum phosphate precipitates synthesized at 90�Cfor various ripening times.
S. Lucas et al. / Journal of Solid State Chemistry 177 (2004) 1302–1311 1305
stretching mode appears on the IR spectrum of thesubstituted hydroxyapatite [33]. As for hydroxyapatite,a hydrogenphosphate substitution in the rare earthphosphate lattice should lead to non-stoichiometric Re-deficient compounds in order to preserve the electro-neutrality. A chemical composition could be written asfollows:
Re1�0:33yðPO4Þ1�yðHPO4Þy � xH2O
Recently, Kijkowska [34] stated the same hypothesis andargued that, as it is the case of hydroxyapatite,hydrogenphosphate would condensate into diphosphateP2O7
4� above 500�C. Nevertheless, at the sight of thethermal behavior of the powders (detailed in Part II ofthis study), diphosphates were never detected in thepowder whatever the temperature considered. Finally, itappeared that the most convincing hypothesis was theadsorption of hydrogenphosphate species at the surfaceof the rare earth phosphate powders inducing an excessof phosphorus and a Re/P mole ratio smaller than 1 asdetermined from elementary analyses. Several attemptsto remove these residuals by successive water washingsteps were unsuccessful.The presence of such absorbed residuals was also
confirmed and quantified using high-temperature ther-mogravimetric analysis. The phenomena exposed here-after summarize the necessary results for a goodunderstanding; much more details can be found in PartII of this study devoted to the thermal behavior. Themethod used for the quantification is based on the
thermal formation of a lanthanum polytrioxophosphateRe(PO3)3 at about 950
�C as secondary phase resultingfrom the adsorbed H3PO4 followed by its decompositionbetween 1050�C and 1350�C with P4O10 gas releaseaccording to the following reaction:
2ReðPO3Þ3ðsolidÞ-2RePO4ðsolidÞ þ P4O10ðgasÞm ð1Þ
The amount of Re(PO3)3 was determined from theweight loss recorded between 1050�C and 1350�C thataccompanied its decomposition, as shown in Fig. 4. Thisamount was determined versus the specific surface areaof lanthanum phosphate powders synthesized at 90�Cduring various ripening times (Fig. 5). Indeed, it wasdirectly proportional to the specific surface area of thepowder. This confirms that the hydrogenphosphatespecies are located at the surface of the precipitates. Inorder to precise their chemical nature, a pH titrationusing NaOH solution was performed on a solutioncontaining 2 g of a washed precipitate (LaP T30h00)stirred in 40mL of deionized water. The titration plotwas typically that of a phosphoric acid dilute solutionwith an initial pH of 2.5570.05 (Fig. 6) and it can beconcluded that H3PO4 is the adsorbed species. The pHof the first neutralization point, which corresponds tothe first maximum of the derivative plot, was 4.5(against 4.65 considering pKa1=2.1 and pKa2=7.2 forthe phosphoric acid) and the pH of the second one was8.9 (theoretically 9.75 using pKa3=12.3). The apparentdiscrepancy between the experimental data and calcu-lated values comes from two different phenomena. First,the NaOH solution was not degassed and the titrationwas performed under air. The presence of residualhydrogencarbonate (pKa1=6.3) naturally dissolved inwater modifies the titration curve lightly. A second andmore convenient explanation comes from the fact thatthis experiment is not a classical titration of acidicspecies in solution. Indeed, the adsorbed species must be

ARTICLE IN PRESS
0.3
0.4
0.5
0.6
0.7
0.8
0.9
30 35 40 45 50 55
La(
PO3) 3 (
wt%
)
Specific surface area / m2g-1
Fig. 5. Amount of lanthanum polytrioxophosphate high-temperature
secondary phase La(PO3)3 versus the specific surface area of
lanthanum phosphate precipitates (synthesized at 90�C and pHo1).
2
4
6
8
10
12
14
0 5 10 15 20 25 30
pH
Volume of NaOH solution / mL
Powder calcined at 1400˚CWashed precipitate
Fig. 6. NaOH titration plots of LaP T30h00 washed precipitate
(NaOH=0.05M), and its derivative curve (dashed line), and of La
T30h00 powder calcinated at 1400�C for 1 h (NaOH=0.01M).
S. Lucas et al. / Journal of Solid State Chemistry 177 (2004) 1302–13111306
released from the surface of the solid. Considering thatthe powder (LaP T30h00) contains 0.1mol of adsorbedH3PO4 (which corresponds to Re/P=0.91), 2 g of thispowder contains about 8 10�4mol of H3PO4. Conse-quently, on the hypothesis of a total release the 40mL ofsolution used in the experiment should have a H3PO4concentration of 0.02mol L�1. The values calculatedfrom the titration data give a H3PO4 concentrationof 4 10�3mol L�1 for the initial pH (2.55),8 10�3mol L�1 at the first endpoint (withVNaOH ¼ 6:5mL) and 1.7 10�2mol L�1 at the secondendpoint (with V 0
NaOH ¼ 2026:5mL). These resultswould indicate a progressive release of adsorbedH3PO4 with the addition of hydroxide ions in thesolution containing the powder. Finally, it could be
assessed that desorption in solution should be associatedto an equilibrium, which is displaced during thetitration.After the calcination of the powder at 1400�C for 1 h
that allowed the removal of the adsorbed H3PO4, thetitration plot did not exhibit any acidic species in thesolution. The lightly acidic initial pH of 5.3 is mainlydue to the presence of the residual hydrogencarbonate.Thus, it can be hypothesized that the adsorbed specieswere either in the form of residual H3PO4 or NH4H2PO4in the dried precipitates, depending on the synthesisconditions, i.e., on the nature of the initial phosphate-containing reagent (Table 1). During heating, theywould lead to the formation of Re(PO3)3 according tothe following reactions:
2H3PO4ðadsorbedÞ þ RePO4ðsolidÞ
-ReðPO3Þ3ðsolidÞ þ 3H2OðgasÞm ð2Þ
2NH4H2PO4ðadÞ þ RePO4ðsolidÞ
-ReðPO3Þ3ðsÞ þ 3H2OðgasÞmþ 2NH3ðgasÞm ð3Þ
The detection threshold of polytrioxophosphatesecondary phase was investigated through differentmethods. The results obtained from FTIR spectroscopyand Raman spectroscopy were similar with a detectionthreshold of the hydrogenphosphate vibrations corre-sponding to about 1wt% of the associated Re(PO3)3phase (see also comment of Fig. 3 in Section 3.2). ForXRD, the detection threshold was about 2wt% using agood resolution pattern. This result is illustrated in thediagrams in Fig. 7 where the main diffraction peak at2yE24:1� of the secondary phase La(PO3)3 present in alanthanum phosphate powder heat treated at 1000�Cwas rarely detected when the amount was below thislimit of 2wt%. Finally, neither IR nor Raman spectro-scopy nor XRD is able to insure the purity of a rareearth phosphate powder. High-temperature thermogra-vimetry was thus required since it allows the detectionof very small weight changes (with usual precision of0.1wt%). This is all the more important in the field ofceramic materials processing since secondary phasesmay have major consequences either on the elaborationor on the properties of the final material. For example,it can act as a sintering aid, and enhance or preventgrain growth. In this field, the role of rare earthpolytrioxophosphates as a minor secondary phasewill be discussed in a forthcoming paper.
3.1.2. Influence of synthesis parameters
The influence of the synthesis parameters wasinvestigated on the lanthanum phosphate precipitates.The main results are summarized in Table 2. The yieldof the precipitation reaction was determined versus thetemperature and ripening time without any pH regula-tion of the solution. The precipitation reaction was

ARTICLE IN PRESS
24 24.5 25 25.5 26 26.5 27 27.5 28
* * *
Inte
nsity
/ ar
bitr
ary
units
2 Theta / degrees
*La(PO3)3 (PDF 33-717)
3.10 %
2.40 %
1.62 %
1.15 %
Fig. 7. XRD diagrams (step size: 0.03�, counting time: 30 s) oflanthanum phosphate powders calcinated at 1000�C for 2 h and
containing various amounts of residual lanthanum polytrioxopho-
sphate (determined from TGA).
30
35
40
45
50
55
0 50 100 150 200 250 300 350Ripening time / hours
Spec
ific
sur
face
are
a / m
2 g-1
Fig. 8. Specific surface area of lanthanum phosphates precipitated at
90�C and pHo1 versus the ripening time.
0 50 100 150 200 250 300 3504.05
4.1
4.15
4.2
4.25
4.3
4.35
Ripening time / hours
Bul
k de
nsity
Fig. 9. Bulk density of LaPO4 � nH2O precipitated at 90�C and pHo1versus the ripening time.
S. Lucas et al. / Journal of Solid State Chemistry 177 (2004) 1302–1311 1307
thermally activated and it was complete after 20 hripening at 50�C. A decrease of the ripening timerequired temperatures of at least 80�C to obtainquantitative the precipitation. For syntheses at pHo1,the specific surface area of the powders decreasedslightly with the temperature. But, in any case itremained high (with values higher than 60m2 g�1). Theeffect of the ripening on the reduction of the specificsurface area became significant only at high tempera-tures and for a very long time (as shown in Fig. 8 forsyntheses performed at 90�C). Nevertheless, the surfaceremained high. The values were above 30m2 g�1, evenafter 2 weeks (336 h) of ripening at 90�C. The bulkdensity, although remaining always below the calculatedvalue of 4.268 for the rhabdophane-type hexagonalstructure, increased slowly with the ripening time toreach values close to 4.20 from about 150 h at 90�C(Fig. 9). The value of 4.3170.02, i.e., superior to thetheoretical value of 4.268, determined for the precipitateripened for 336 h can be explained by the presence ofmonoclinic anhydrous monazite-type LaPO4 (PDF 32-0943) in this precipitate, as detected on its XRD pattern(Fig. 10), whose calculated bulk density is 5.067. Thesedata were not included in the linear regression (Fig. 9).The formation of anhydrous monazite in long-durationsyntheses was already reported by Hikichi [14]. Thepresence of monazite or rhabdophane was also reportedby Terra et al. [26]. During the ripening, a variation ofthe hydration ratio of the hydrated rhabdophane-type
phosphate was also registered on the TGA curves(Fig. 4). Fig. 11 shows that it decreased slightly fromabout n ¼ 0:65 without ripening down to n ¼ 0:5 molafter a 336 h ripening. This last value corresponded tothe theoretical one given for the La-rhabdophanestructure (n ¼ 0:5). Nevertheless, it must be noted thatfor this very long ripening time the presence ofanhydrous LaPO4 as a second phase also contributesto the decrease of the hydration ratio. These data werenot included in the linear regression. Finally, thecrystallinity of the hydrated precipitates appeared toincrease slowly with ripening at high temperatures.A change of the reagents stoichiometry from La/P=
1/3 up to 2 did not affect its nature, LaPO4 � nH2O isalways the less soluble compound that precipitates. Oneof the main effects of the synthesis parameters on theproperties of the precipitate is due to the pH of thesynthesis. Increasing pH value induced a drastic

ARTICLE IN PRESS
10 20 30 40 50 60
1h
48h
216h
336h
* * *
**
˚˚ ˚***
*
**
**
***˚
˚ ˚ *
*
˚ LaPO4
LaPO ,nH4 2
O
2 Theta / degrees
Inte
nsity
/ ar
bitr
ary
units
Fig. 10. XRD diagrams of lanthanum phosphate precipitates synthe-
sized at 90�C, pHo1 for various ripening times.
0.45
0.5
0.55
0.6
0.65
0.7
0 50 100 150 200 250 300 350Ripening time / hours
Hyd
ratio
n w
ater
n /
mol
Fig. 11. Hydration water in the LaPO4 � nH2O precipitates synthesizedat 90�C and pHo1 versus the ripening time.
20 30 40 50 60
LaP T30h00, pH < 1
LaP pH3
LaP pH9
2 Theta / degrees
Inte
nsity
/ ar
bitr
ary
units
Fig. 12. XRD diagrams of lanthanum phosphate precipitates synthe-
sized at 30�C and different pH values, without ripening.
S. Lucas et al. / Journal of Solid State Chemistry 177 (2004) 1302–13111308
decrease of the precipitate crystallinity as illustrated bythe broadening of the diffraction peaks observed atpH=9 (Fig. 12). It must be noted that this phenomenonshould not result from a decrease of the particle size,which is also known to lead to a broadening of thediffraction lines, since the specific surface area and thepowder morphology remained similar in comparisonwith the powders synthesized in an acidic medium. Thisdecrease of the crystallinity is logically accompanied bylower bulk densities of the powders (Table 2). To a lessextent, a small sharpening of the diffraction peaksappeared at low synthesis temperatures, also indicating
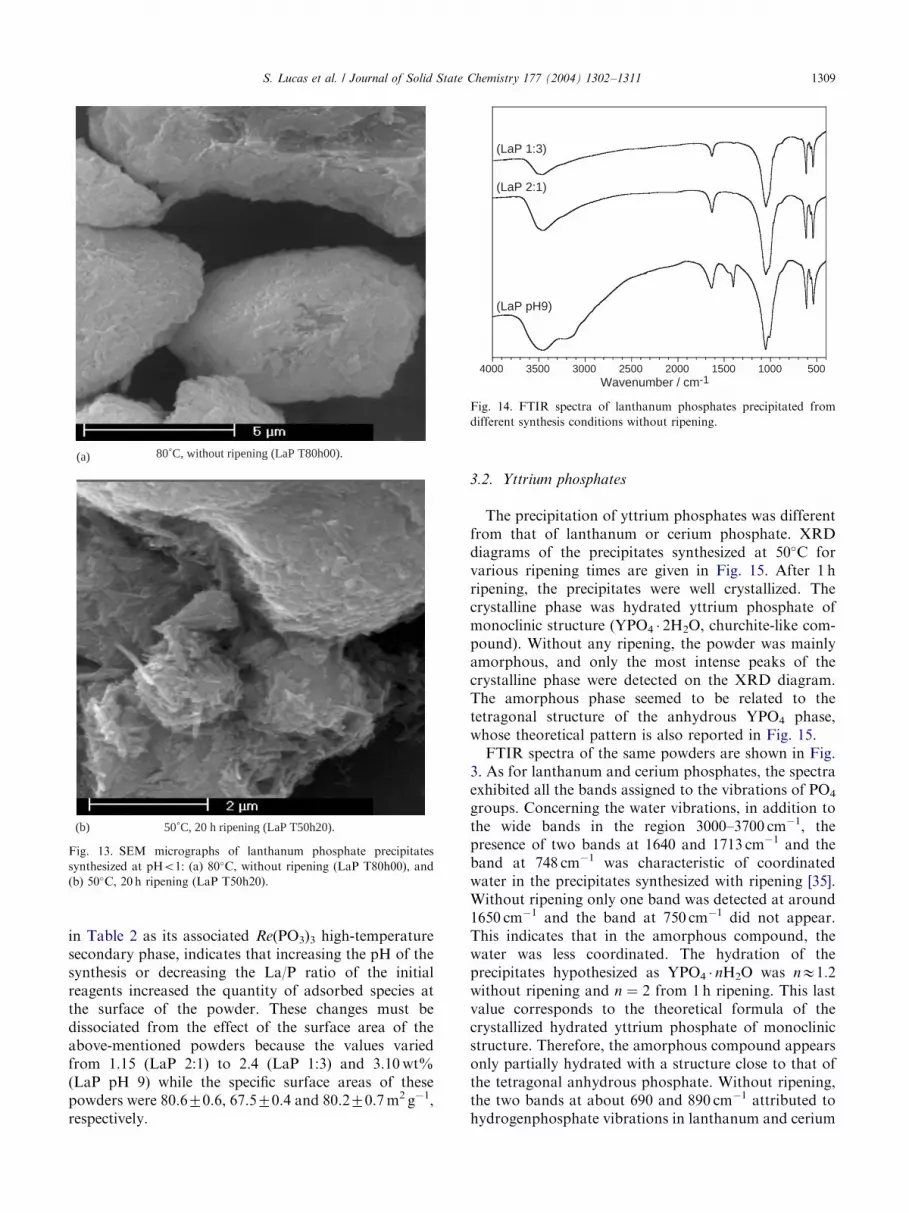
a lower crystallinity of the powders. This was moreparticularly visible with the three peaks in the 2y range50–55�. Another phenomenon was associated to thepeak located at 2y ¼ 41:8� (003). At low temperaturesand without ripening, the relative intensity of this peakwas greater than that expected. For a comparison, therelative intensities should be 39% and 26% for the peak(211) at 2y ¼ 41:3� and for the peak (003) at 2y ¼ 41:8�;respectively. This may indicate an anisotropic behaviorof the crystal formation during the first stages of theprecipitation process. This may be linked to the needle-like morphology of crystals precipitated at low tem-peratures without ripening (Fig. 2). Then, at hightemperatures or after 20 h ripening, the grain wouldhave grown more isotropically on account of theevolution of the relative intensities of these diffractionpeaks, which again become normal. This may beconfirmed by the morphology of the powders synthe-sized at high temperatures without ripening (Fig. 13a) orafter 20 h ripening (Fig. 13b). The needle-like morphol-ogy of the crystals was less observable than for synthesesat low temperatures and agglomerates appeared coarserand denser compared to the morphology of the low-temperature precipitates.FTIR spectra of the powders precipitated in the
different synthesis conditions and the characteristics ofhydrated lanthanum phosphate compounds were similar(Fig. 14). There were only some additional bandsregistered in the range 1400–1460 cm�1 and at3120 cm�1 on the spectrum of the powder synthesizedat pH=9 that were assigned to N–H vibrations resultingfrom the presence of ammonium synthesis residues inthe precipitates.The modification of the synthesis parameters also
influenced the amount of H3PO4 (or NH4H2PO4)adsorbed at the particles surface. This amount, reported
ARTICLE IN PRESS
80˚C, without ripening (LaP T80h00). (a)
50˚C, 20 h ripening (LaP T50h20). (b)
Fig. 13. SEM micrographs of lanthanum phosphate precipitates
synthesized at pHo1: (a) 80�C, without ripening (LaP T80h00), and(b) 50�C, 20 h ripening (LaP T50h20).
5001000150020002500300035004000Wavenumber / cm-1
(LaP 1:3)
(LaP 2:1)
(LaP pH9)
Fig. 14. FTIR spectra of lanthanum phosphates precipitated from
different synthesis conditions without ripening.
S. Lucas et al. / Journal of Solid State Chemistry 177 (2004) 1302–1311 1309
in Table 2 as its associated Re(PO3)3 high-temperaturesecondary phase, indicates that increasing the pH of thesynthesis or decreasing the La/P ratio of the initialreagents increased the quantity of adsorbed species atthe surface of the powder. These changes must bedissociated from the effect of the surface area of theabove-mentioned powders because the values variedfrom 1.15 (LaP 2:1) to 2.4 (LaP 1:3) and 3.10wt%(LaP pH 9) while the specific surface areas of thesepowders were 80.670.6, 67.570.4 and 80.270.7m2 g�1,respectively.
3.2. Yttrium phosphates
The precipitation of yttrium phosphates was differentfrom that of lanthanum or cerium phosphate. XRDdiagrams of the precipitates synthesized at 50�C forvarious ripening times are given in Fig. 15. After 1 hripening, the precipitates were well crystallized. Thecrystalline phase was hydrated yttrium phosphate ofmonoclinic structure (YPO4 � 2H2O, churchite-like com-pound). Without any ripening, the powder was mainlyamorphous, and only the most intense peaks of thecrystalline phase were detected on the XRD diagram.The amorphous phase seemed to be related to thetetragonal structure of the anhydrous YPO4 phase,whose theoretical pattern is also reported in Fig. 15.FTIR spectra of the same powders are shown in Fig.
3. As for lanthanum and cerium phosphates, the spectraexhibited all the bands assigned to the vibrations of PO4groups. Concerning the water vibrations, in addition tothe wide bands in the region 3000–3700 cm�1, thepresence of two bands at 1640 and 1713 cm�1 and theband at 748 cm�1 was characteristic of coordinatedwater in the precipitates synthesized with ripening [35].Without ripening only one band was detected at around1650 cm�1 and the band at 750 cm�1 did not appear.This indicates that in the amorphous compound, thewater was less coordinated. The hydration of theprecipitates hypothesized as YPO4 � nH2O was nE1:2without ripening and n ¼ 2 from 1 h ripening. This lastvalue corresponds to the theoretical formula of thecrystallized hydrated yttrium phosphate of monoclinicstructure. Therefore, the amorphous compound appearsonly partially hydrated with a structure close to that ofthe tetragonal anhydrous phosphate. Without ripening,the two bands at about 690 and 890 cm�1 attributed tohydrogenphosphate vibrations in lanthanum and cerium

ARTICLE IN PRESS
10 20 30 40 50 60 70
Inte
nsity
/ ar
bitr
ary
units
YPO4 ,2H2O (PDF 85-1842)
YPO4 (PDF 84-0335)
*
Y P T50h01
Y P T50h00
****
*
*
*
*
****
*
* *
*
*
*
*
*
**
*
****
*
*
*
**
*
2 Theta / degrees
Fig. 15. XRD diagrams of yttrium phosphate precipitates synthesized
at 50�C without ripening (YP T50h00) and after 1 h ripening (YP
T50h01).
Without ripening (YP T50h00)
After 1 h ripening (YP T50h01)
(a)
(b)
Fig. 16. SEM micrographs of yttrium phosphate precipitates synthe-
sized at 50�C and pHo1: (a) without ripening (YP T50h00), and (b)after 1 h ripening (YP T50h01).
S. Lucas et al. / Journal of Solid State Chemistry 177 (2004) 1302–13111310
phosphates were also detected in the precipitate whereasthey were no longer present after 1 h ripening. For thesesyntheses at 50�C, the surface area of the powder was10571m2 g�1 without ripening and dropped down to1.9570.03m2 g�1 after 1 h ripening. On the hypothesisthat H3PO4 would be adsorbed at the particle surface,the disappearance of vibration bands could be explainedby this great change of specific surface area. Thedecrease of the amount of adsorbed species wasconfirmed by the increase of the Y/P mole ratio from0.93 to 0.95 and the decrease of the amount of yttriumpolytrioxophosphate secondary phase Y(PO3)3 asso-ciated with them from 1.4wt% down to 0.80wt% forthese same powders, respectively. The important mod-ifications of the powder characteristics during theripening were also accompanied by a morphologicalmodification of the precipitated particles. SEM observa-tions of the precipitates (Fig. 16) showed a rapid growthof these particles. They were spherical-like of sizeinferior to 50 nm at 50�C without ripening (Fig. 16a)and needle-like of more than 5 mm length after only 1 hripening (Fig. 16b). The bulk density of the amorphousprecipitates was about 2.95. It increased up to3.1870.02 for the ripened and crystallized precipitates,a value that corresponds to the calculated one forhydrated yttrium phosphate of monoclinic structure(3.185).From these results it can be stated that the synthesis
of well-crystallized yttrium phosphate precipitates ofmonoclinic structure is kinetically rapid. This was notthe case for lanthanum or cerium phosphates.
4. Conclusion
The wet synthesis of rare earth phosphates by theprecipitation method always leads to the formationof RePO4 � nH2O compounds (Re=La, Ce or Y). Thestoichiometry of the initial reagents does not influencethe chemical composition of the precipitate.For Re=La or Ce, the precipitation reaction exhibits
low kinetic and requires a high temperature of 80�C orripening during at least 20 h to reach a quantitative yield

ARTICLE IN PRESSS. Lucas et al. / Journal of Solid State Chemistry 177 (2004) 1302–1311 1311
of precipitation. About 1 week ripening at 90�C wasrequired to prepare well-crystallized compounds (i.e.,with values of the bulk density and a hydration ratioclose to the calculated values). The pH of the synthesisinfluences mainly the crystallinity of the precipitate andthe amount of synthesis residuals. The precipitatescrystallized in the hexagonal structure of rhabdophaneRePO4 � 0.5H2O. The ratio of hydration water can varyslightly and this water is of zeolitic nature. The particlesare always nanometric with a high specific surface area.For Re=Y, the precipitate is YPO4 � 2H2O with a
monoclinic structure (churchite-type). The hydrationwater is coordinated and the behavior during thesynthesis differs slightly from that of lanthanum orcerium phosphate. The kinetic of precipitation isaccompanied by a rapid crystal growth resulting in thepreparation of needle-like crystals of low specific surfacearea from 1h ripening even at a low temperature (30�C).Whatever the conditions of synthesis, H3PO4 ad-
sorbed at the surface of the particles is always present inthe precipitates. The amount of this residual, althoughremaining low, is proportional to the specific surfacearea of the precipitate and is increased by an increase ofthe synthesis pH or a decrease of the Re/P mole ratio ofthe initial reagents.Finally, from these results a unit chemical formula
can be proposed as follows:
RePO4 � nH2O � ðH3PO4Þx
with nE0:5 (Re=La or Ce), n ¼ 2 (Re=Y) and0oxo0:1 (Re/P40.9).Further elaboration of ceramic materials from such
powders could be greatly influenced by the residualspecies, although their detection can be very difficultwhen present in a very low amount. To this end, the useof high-temperature thermogravimetry is required andtheir removal is only possible using a high-temperaturecalcination treatment at 1400�C in order to get theirdecomposition.
References
[1] J.B. Davis, D.B. Marshall, P.E.D. Morgan, J. Eur. Ceram. Soc.
20 (2000) 583–587.
[2] P.E.D. Morgan, D.B. Marshall, Mater. Sci. Eng. A 162 (1993)
15–25.
[3] D.H. Kuo, W.H. Kriven, J. Am. Ceram. Soc. 78 (1995)
3121–3124.
[4] E. Boakye, M.D. Petry, R.S. Hay, Ceram. Eng. Sci. Proc. 17
(1996) 53–60.
[5] D.H. Kuo, W.H. Kriven, J. Am. Ceram. Soc. 80 (1997)
2987–2996.
[6] J.B. Davis, D.B. Marshall, K.S. Oka, R.M. Housley, P.E.D.
Morgan, Composites: Part a 30 (1999) 483–488.
[7] M.H. Lewis, A. Tye, E.G. Butler, P.A. Doleman, J. Eur. Ceram.
Soc. 20 (2000) 639–644.
[8] G.J. McCarthy, W.B. White, D.E. Pfoertsch, Mater. Res. Bull. 13
(1978) 1239–1245.
[9] C. Guy, F. Audubert, J.E. Lartigue, C. Latrille, T. Advocat, C.
Fillet, C. R. Acad. Sci. Paris Phys. 3 (2002) 827–837.
[10] T. Norby, N. Christiansen, Solid State Ionics 77 (1995) 240–243.
[11] R.S. Feigelson, J. Am. Ceram. Soc. 47 (1964) 257–258.
[12] J.D. Donaldson, A. Hezel, S.D. Ross, J. Inorg. Nucl. Chem. 29
(1967).
[13] N.N. Chudinova, L.P. Shklover, G.M. Balagina, Inorg. Mater.
11 (1975) 590–593.
[14] Y. Hikichi, K. Hukuo, J. Shiokawa, Bull. Chem. Soc. Japan 51
(1978) 3645–3646.
[15] M.M. Abraham, L.A. Boatner, D.K. Thomas, M. Rappaz,
Radioactive Waste Management 1 (1980) 181–191.
[16] Y. Hikichi, Mineral. J. 15 (1991) 268–275.
[17] N. Arul-Dhas, K.C. Patil, J. Alloys Compounds 202 (1993)
137–141.
[18] Y. Guo, P. Woznicki, A. Barkatt, E. Saad, I.G. Talmy, J. Mater.
Res. 11 (1996) 639–649.
[19] Y. Fujishiro, H. Ito, T. Sato, A. Okuwaki, J. Alloys Compounds
252 (1997) 103–109.
[20] P. Chen, T.I. Mah, J. Mater. Sci. 32 (1997) 3863–3867.
[21] I.W. Lenggoro, B. Xia, H. Mizushima, K. Okuyama, N. Kijima,
Mater. Lett. 50 (2001) 92–96.
[22] L. Bo, S. Liya, L. Xiaozhen, Z. Shuihe, Z. Yumei, W. Tianmin,
Y. Sasaki, K. Ishii, Y. Kashiwaya, H. Takahashi, T. Shibayama,
J. Mater. Sci. Lett. 20 (2001) 1071–1075.
[23] H. Onoda, H. Nariai, H. Maki, I. Motooka, Mater. Chem. Phys.
78 (2002) 400–404.
[24] R. Kijkowska, J. Mater. Sci. 38 (2003) 229–233.
[25] A.S. Celebi, J.W. Kolis, J. Am. Ceram. Soc. 85 (2002) 253–254.
[26] O. Terra, N. Clavier, N. Dacheux, R. Podor, New J. Chem. 27
(2003) 957–967.
[27] H. Assaaoudi, A. Ennaciri, A. Rulmont, M. Harcharras, Phase
Transitions 72 (2000) 1–13.
[28] A. Hezel, S.D. Ross, Spectrochim. Acta 22 (1966) 1949–1961.
[29] H. Assaaoudi, A. Ennaciri, A. Rulmont, Vibrational Spectros.
25 (2001) 81–90.
[30] C. Penot, E. Champion, P. Goursat, Phosphorus Res. Bull. 10
(1999) 308–312.
[31] S. Lucas, E. Champion, C. Penot, G. Leroy, D. Bernache-
Assollant, Key Eng. Mater. 206–213 (2002) 47–50.
[32] S. Raynaud, E. Champion, D. Bernache-Assolllant, P. Thomas,
Biomaterials 23 (2002) 1065–1072.
[33] J.C. Heughebaert, Thesis, Institut National Polytechnique,
Toulouse, 1977.
[34] R. Kijkowska, E. Cholewka, B. Duszak, J. Mater. Sci. 38 (2003)
223–228.
[35] J. Fujita, K. Nakamoto, M. Kobayashi, J. Am. Chem. Soc. 78
(1956) 3963–3965.